Effect of Dispersion Solvents in Catalyst Inks on the Performance and Durability of Catalyst Layers in Proton Exchange Membrane Fuel Cells


Department of Green Chemical Engineering, College of Engineering, Sangmyung University, C-411 Main Building, 31 Sangmyungdae-gil, Dongnam-gu, Cheonan 31066, Korea
*
Author to whom correspondence should be addressed.
Energies 2019, 12(3), 549; https://doi.org/10.3390/en12030549
Submission received: 24 January 2019
/
Revised: 2 February 2019
/
Accepted: 8 February 2019
/
Published: 11 February 2019
(This article belongs to the Special Issue Hydrogen-Based Energy Conversion: Polymer Electrolyte Fuel Cells and Electrolysis)
Abstract
:Five different ionomer dispersions using water–isopropanol (IPA) and N-methylpyrrolidone (NMP) were investigated as ionomer binders for catalyst layers in proton exchange membrane fuel cells. The distribution of ionomer plays an important role in the design of high-performance porous electrode catalyst layers since the transport of species, such as oxygen and protons, is controlled by the thickness of the ionomer on the catalyst surface and the continuity of the ionomer and gas networks in the catalyst layer, with the transport of electrons being related to the continuity of the carbon particle network. In this study, the effect of solvents in ionomer dispersions on the performance and durability of catalyst layers (CLs) is investigated. Five different types of catalyst inks were used: (i) ionomer dispersed in NMP; (ii) ionomer dispersed in water–IPA; (iii) ionomer dispersed in NMP, followed by adding water–IPA; (iv) ionomer dispersed in water–IPA, followed by adding NMP; and (v) a mixture of ionomer dispersed in NMP and ionomer dispersed in water–IPA. Dynamic light scattering of the five dispersions showed different average particles sizes: ~0.40 μm for NMP, 0.91–1.75 μm for the mixture, and ~2.02 μm for water–IPA. The membrane-electrode assembly prepared from an ionomer dispersion with a larger particle size (i.e., water–IPA) showed better performance, while that prepared from a dispersion with a smaller particle size (i.e., NMP) showed better durability.
1. Introduction
Enhancement of the performance and durability of proton exchange membrane fuel cells (PEMFCs), finally resulting in cost reduction in fuel cells, is essential for their commercialization [1,2,3]. The performance and durability of PEMFCs are typically determined by the polymer electrolyte membrane (also called an ionomer membrane), which are mostly made of perfluorinated sulfonic acid (PFSA) and porous electrodes comprising electrocatalysts and an ionomer binder in membrane-electrode assemblies (MEAs) [3,4,5,6]. Optimization of porous electrodes has been achieved by controlling relative amounts of the ionomer and/or electrocatalyst if the polymer electrolyte membranes are fixed [7,8,9,10]. It has been reported that the distribution of ionomer within the carbon supported electrocatalyst (e.g., Pt/C) plays an important role in the design of high-performance porous electrode catalyst layers (CLs), as the transport of species such as oxygen and protons is controlled by the thickness of the ionomer on the catalyst surface and the continuity of the ionomer and gas networks in the CL, with the transport of electrons being related to the continuity of the carbon particle network [11,12,13,14,15,16]. The structural change of CLs significantly influences Pt utilization by the attachment of ionomers onto the carbon support of the Pt electrocatalyst [17]. The use of new ionomer materials to enhance the transport phenomena occurring in CLs could be another way to increase performance and/or durability. Some ionomer materials represent a high oxygen permeability to lower the mass transfer resistance for an oxygen reduction reaction by changing chemical structure of ionomers [18,19], or represent high proton conductivity by lowering equivalent weight of ionomers [20]. The microstructure of a CL is formed by evaporating solvents included in the catalyst ink coated onto polymer electrolyte membranes or gas diffusion layers. The catalyst ink is a well-stirred mixture of an ionomer binder dispersion, carbon-supported electrocatalysts, and/or additional solvents. In the ionomer binder, Nafion is dispersed as particles with three types of morphology: (i) a well-defined cylindrical dispersion in glycerol and in ethylene glycol with different degrees of solvent penetration; (ii) a less-defined, highly-solvated large particle in water–isopropanol (water–IPA) mixtures; and (iii) a random-coil conformation (true solution behavior) in N-methylpyrrolidone (NMP) [21]. The various shapes of Nafion dispersed in these three types of solvent could influence the performance and durability of the PEMFCs. Johnston and co-workers reported that cathodes cast from inks based on ionomer dispersions in water–propanol–isopropanol initially performed better than those cast from glycerol-based dispersions, but were far less durable because of a higher degree of phase separation, which resulted in faster Pt particle growth [22]. The types of solvents used affected the surface morphology of the CLs. Inks containing high-boiling-point solvents (186–212 °C), such as glycerin, ethylene glycol, and propylene glycols, resulted in CLs with fewer cracks than those made with inks containing low-boiling-point solvents (65–100 °C), such as water or methanol [23]. In spite of the superior durability of the CLs based on a high-boiling-point solvent, glycerol-processed cathode CLs showed substantially inferior performance than NMP-processed cathode CLs, which are similar to water–IPA-processed ones [24].
Herein, the effect of solvents in ionomer dispersions on the performance and durability of CLs is investigated. Five different types of catalyst inks were used: (i) ionomer dispersed in NMP (coded as “2.5 wt.% NMP”); (ii) ionomer dispersed in water–IPA (coded as “2.5 wt.% water–IPA”); (iii) ionomer dispersed in NMP, followed by adding water–IPA (coded as “5 wt.% NMP+adding water–IPA”); (iv) ionomer dispersed in water–IPA, followed by adding NMP (coded as “2.5 wt.% water–IPA+adding NMP”); and (v) a mixture of ionomer dispersed in NMP and ionomer dispersed in water–IPA (coded as “2.5 wt.% water–IPA+2.5 wt.% NMP”). The size distributions of ionomers dispersed in the five different solvent systems were measured by dynamic light scattering (DLS). For the characterization of the CLs, five different membrane-electrode assemblies were fabricated and characterized by physical methods, such as scanning electron microscopy (SEM), and electrochemical methods, such as cyclic voltammetry and current-voltage polarization.
2. Materials and Methods
Five different ionomer dispersions with a concentration of 2.5 wt.% were prepared by dispersing tiny pieces of Nafion NR-212 membrane (Dupont) in the corresponding solvents, such as a 50:50 (wt.%) water–IPA mixture, NMP, and mixtures of water–IPA and NMP. The ionomer dispersions based on NMP and water–IPA were heated stepwise to 70, 80, and 90 °C under vigorous magnetic stirring, in glass vials sealed with gas impermeable covers to prevent solvent evaporation. The solutions were held at each temperature for 3 h, and the final temperature was maintained until the dispersion became transparent. The addition of the secondary solvent for the ionomer dispersions based on NMP followed by adding water–IPA, and the dispersions based on water–IPA followed by adding NMP, was carried out at room temperature (20 ± 1 °C), and the mixtures were kept stirring for 1 day. Dynamic light scattering (ELSZ–1000, Photal Otsuka Electronics Co., Ltd., Osaka, Japan) was performed to measure the ionomer size distributions in the dispersions. Membranes with 50 μm in thickness were cast from the ionomer dispersions for the measurement of proton conductivity. The ionomer dispersions were poured into glass petri dishes and dried at 80 °C under vacuum for 2 days to allow complete evaporation of solvents. The in-plane proton conductivity of the membranes was determined by measuring the impedance in a plate cell with four Pt wire electrodes. The impedance for ion conductivity of fully wet membrane samples equilibrated in 0.1 M H2SO4 for 1 day was measured using a potentiostat (SP-150, Bio-Logic Science Instruments, Seyssinet-Pariset, France) with alternating current (AC) in the scan range of 1 MHz to 1 Hz, with a signal amplitude of 10 mV for 1 min at 20 ± 1 °C. The impedance was obtained at zero phase angle. For catalyst ink preparation, 40 wt.% Pt was deposited on Vulcan XC-72 carbon black (Hispec 4000, Johnson-Matthey, Pennsylvania, PA, USA) and one of the lab-made dispersions was prepared by magnetic stirring and sonication for 30 min. Magnetic stirring and sonication were repeated 4 times. The catalyst inks were cast on polyimide transfer films by a Meyer bar installed in a Meyer bar coater (KP-3000, KIPAE E&T Co., Inc., Suwon, Korea), and the catalyst-coated films were dried at 80 °C for 48 h to allow complete evaporation of solvents. The coated catalyst layers with an area of 9 cm2 (3 × 3 cm2) were transferred onto the surface of Nafion 211 membranes under 30 MPa for 3 min. The final Pt loading amount was 0.4 mg/cm. Surface images of the catalyst-coated membranes (CCMs) were obtained by scanning electron microscopy (MIRA LMH, TESCAN, Brno, Czech Republic). The CCMs were sandwiched by a pair of gas diffusion layers (10BC, SIGRACET®, SGL Group–The Carbon Company, Wiesbaden, Germany). The MEAs were placed in the unit cell with a pair of bipolar plates with a single serpentine channel and were then assembled at 50 kgf/cm2. The MEAs were evaluated using a fuel cell station (CNL Energy Co., Inc., Seoul, Korea) connected to a potentiostat (SP-150, Bio Logic Science Instruments, Seyssinet-Pariset, France) in terms of current-voltage polarization and cyclic voltammetry. The cell temperature was kept at 70 °C, and hydrogen and air humidified to 100% relative humidity (RH) were supplied to the anode and cathode, respectively, at ambient pressure. After the preset temperatures were achieved, hydrogen and oxygen were supplied to the cell at a rate of 200 ccm (cc/min). The MEAs were conditioned only 10 times by repeatedly running a voltage cycle from an open circuit voltage (OCV) to the voltage corresponding to the maximum current density to investigate the effect of the solvent system used in the ionomer dispersions on unsteady-state phenomena (e.g., reorientation of ionomer in CLs) of CLs based on various ionomer dispersions. After the conditioning, the current-voltage data were logged. The electrochemically active surface area (ECSA) was obtained from the cyclic voltammograms of MEAs as explained elsewhere [3]. To test the durability, the electrodes were subjected to 5, 10, 15, 20, 25, and 30k potential cycles (k means ×1000) at 50 mV/s from 0.60 to 1.0 V, based on the U.S. Department of Energy (DOE) protocol for testing electrocatalysts [25].
3. Results and Discussion
Recent studies, reporting that the solvent type significantly affected the shape of the ionomer dispersed in the solvents, pointed out that polar protic solvents, such as water, n-propanol, isopropanol, ethanol, or methanol, result in highly-solvated large particles, while polar aprotic solvents, such as NMP, dimethylformamide, or dimethyl sulfoxide, result in a random-coil conformation (true solution behavior) [21,22,23,24]. Table 1 summarizes the size distributions of the five different ionomer dispersions measured by DLS. The average ionomer size for the water–IPA dispersion was the highest among the five dispersions, and the smallest size was observed for the NMP dispersion, which is in good agreement with the previous study [21]. Interestingly, the dispersions prepared by the solvent mixture including water–IPA and NMP had intermediate average ionomer sizes, as compared to the one prepared using either water–IPA or NMP only. It means that ionomers solvated by water–IPA and NMP are mixed homogeneously. For dispersions in which the additional solvents were added, the additional solvents substantially determined the ionomer particle structure. The addition of NMP in 5 wt.% water–IPA and water–IPA in 5 wt.% NMP (final concentration is 2.5 wt.%) resulted in the dispersion similar to the 2.5 wt.% NMP dispersion and the dispersion similar to the 2.5 wt.% water–IPA based dispersion, respectively.
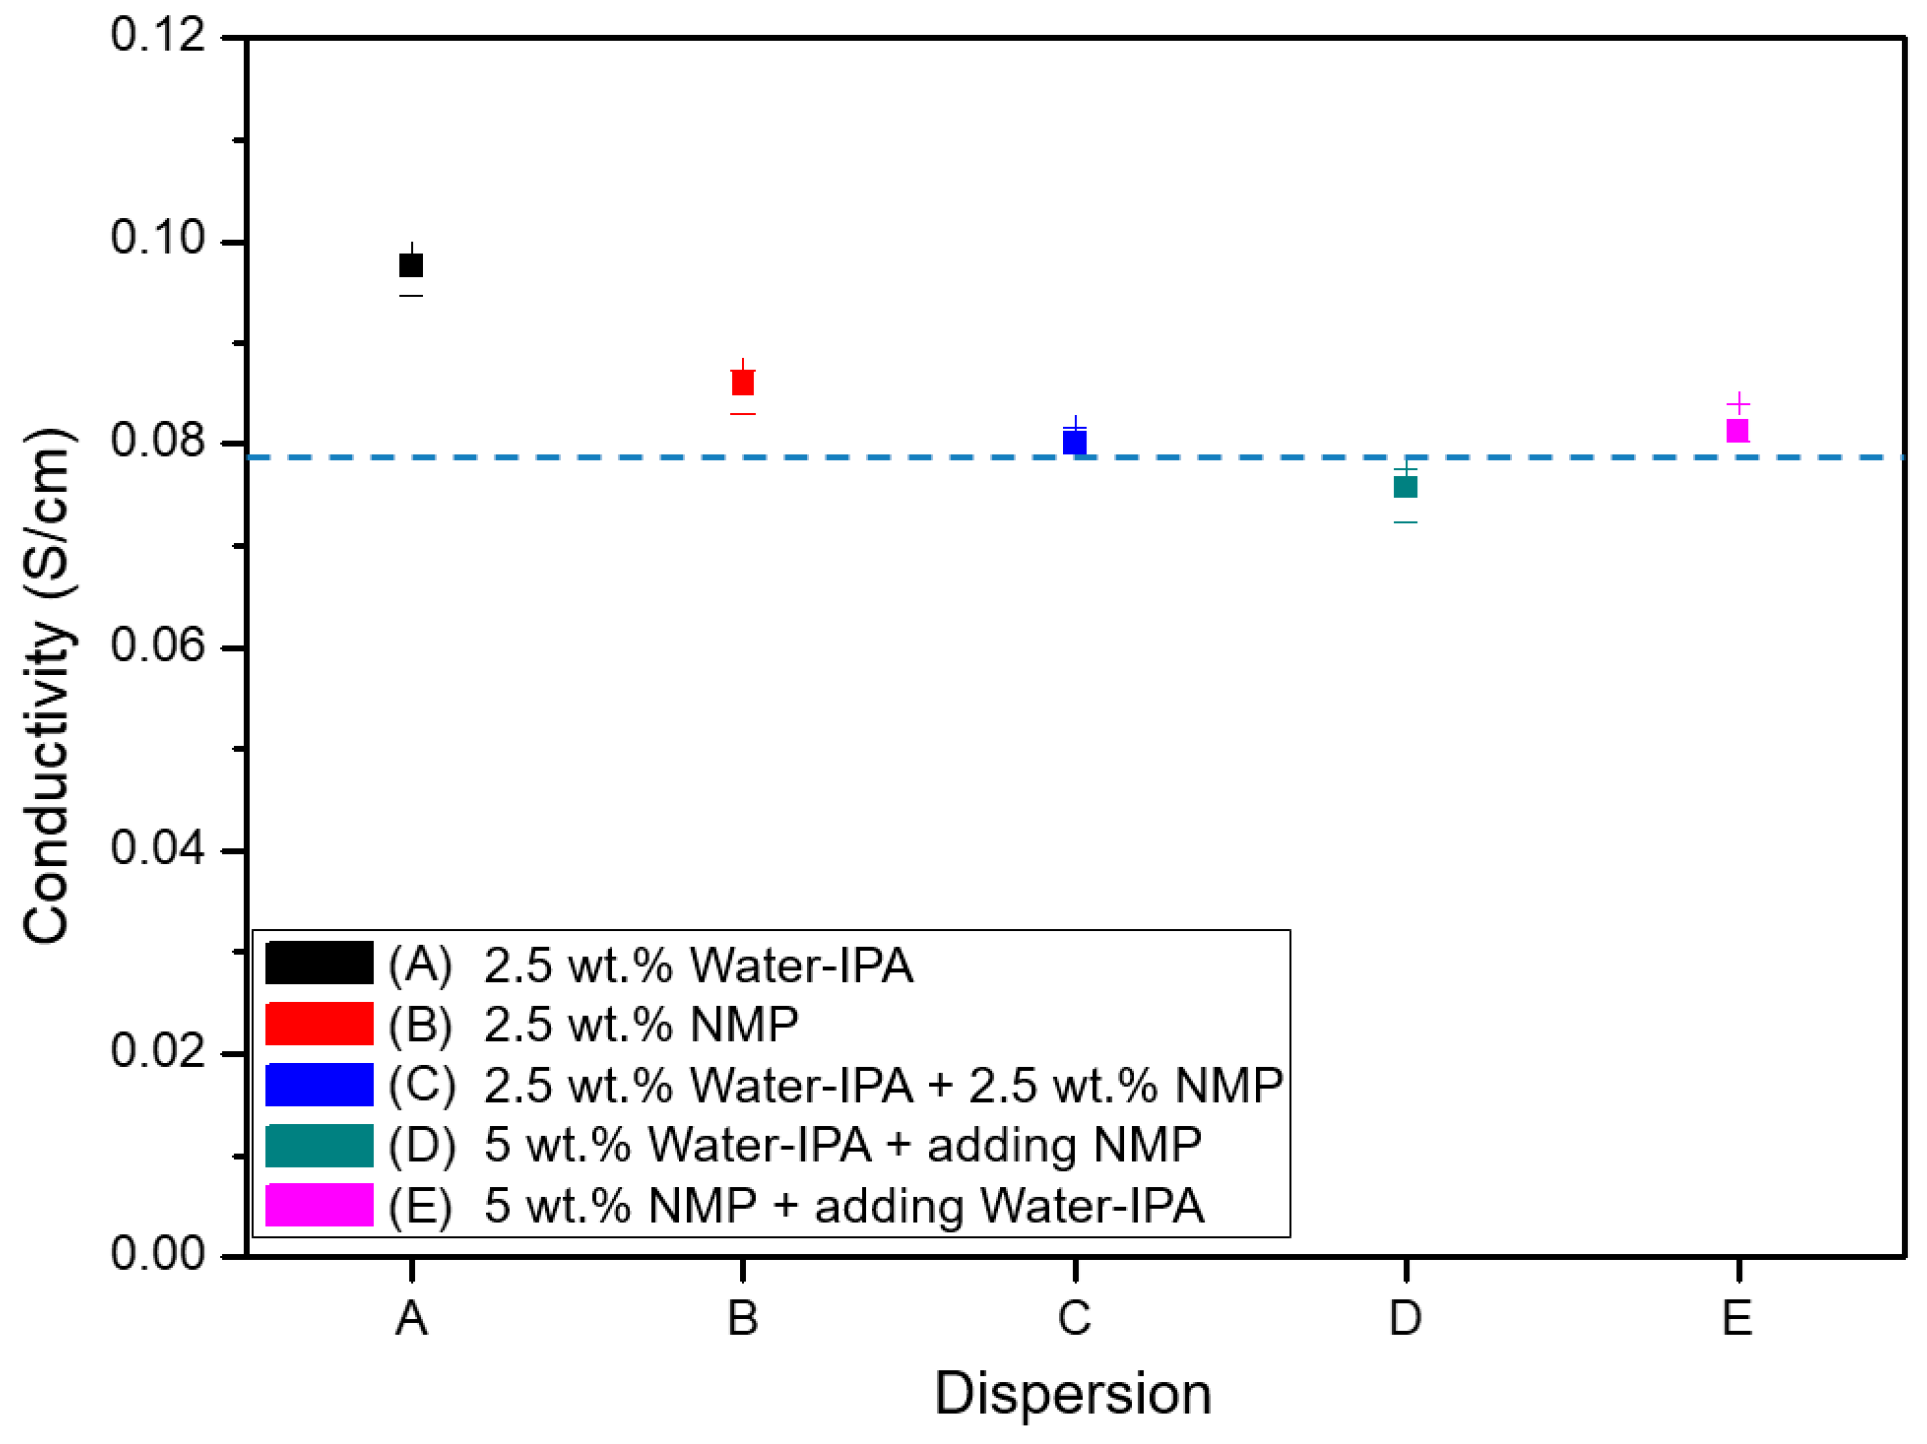
Figure 1 shows proton conductivity of the five different cast membranes and Nafion NR-212 membranes as a reference. Since Nafion NR-212 is also formed in a dispersion casting process, most of the five different cast membranes show similar or a little higher proton conductivity as compared to that of Nafion NR-212. It represents a change in the ionomer properties in different solvent systems due to the different degree of phase separation of the PFSA ionomers. It does not, of course, mean that the proton conductivity of the various ionomers proportionally represents MEA performance, as the properties of the films as membrane electrolytes prepared by ionomers in various solvent systems and the ultra-thin film as ionomer binder (normally wrapping electrocatalyst particles) are not the same as those reported in literature [26]. It is noted that the change of solvent systems for ionomer dispersions could significantly affect ionomer properties. The structural changes of ionomers in solvents could cause hydrophobic and hydrophilic phase separation by the backbone and side chains of perfluorinated sulfonic acid (PFSA). To confirm the change in phase separation behavior, membranes were cast from the five different dispersions and their proton conductivities were measured in-plane (Figure 1). The proton conductivities of the membranes should be the same since the same ionomer material was used for the five different ionomer dispersions. However, proton conductivities in the range 0.75–0.83 S/cm (77%–86% of the proton conductivity for the water–IPA ionomer dispersion) were obtained for the membranes cast from ionomer dispersions including NMP.
To investigate the effect of the solvent system used for ionomer dispersion on the performance of CLs in MEAs, the electrochemical surface area via cyclic voltammetry and current-voltage polarization was measured. Figure 2 shows the variation of ECSA with respect to the number of potential cycles. All the MEAs based on the five different ionomer dispersions showed a tendency to decrease ECSA, which is the area of electrochemically reactive surface sites per amount of Pt (called three-phase boundary, TPB) and is obtained by recording the total charge required for the adsorption–desorption of a monolayer of hydrogen onto the Pt/ionomer interface as the number of potential cycles is increased. The ECSA of the MEA based on NMP ionomer dispersion; however, increased a little bit at the beginning of the potential cycling (0–10k) and then decreased gradually. It could; therefore, be inferred that during potential cycling, the ionomer, formed by the dispersion based on NMP, in the CLs of the MEA experiences reorientation resulting in structural change of TPB. It could suggest that MEAs with the CLs based on NMP ionomer dispersions require full conditioning to achieve steady-state performance.
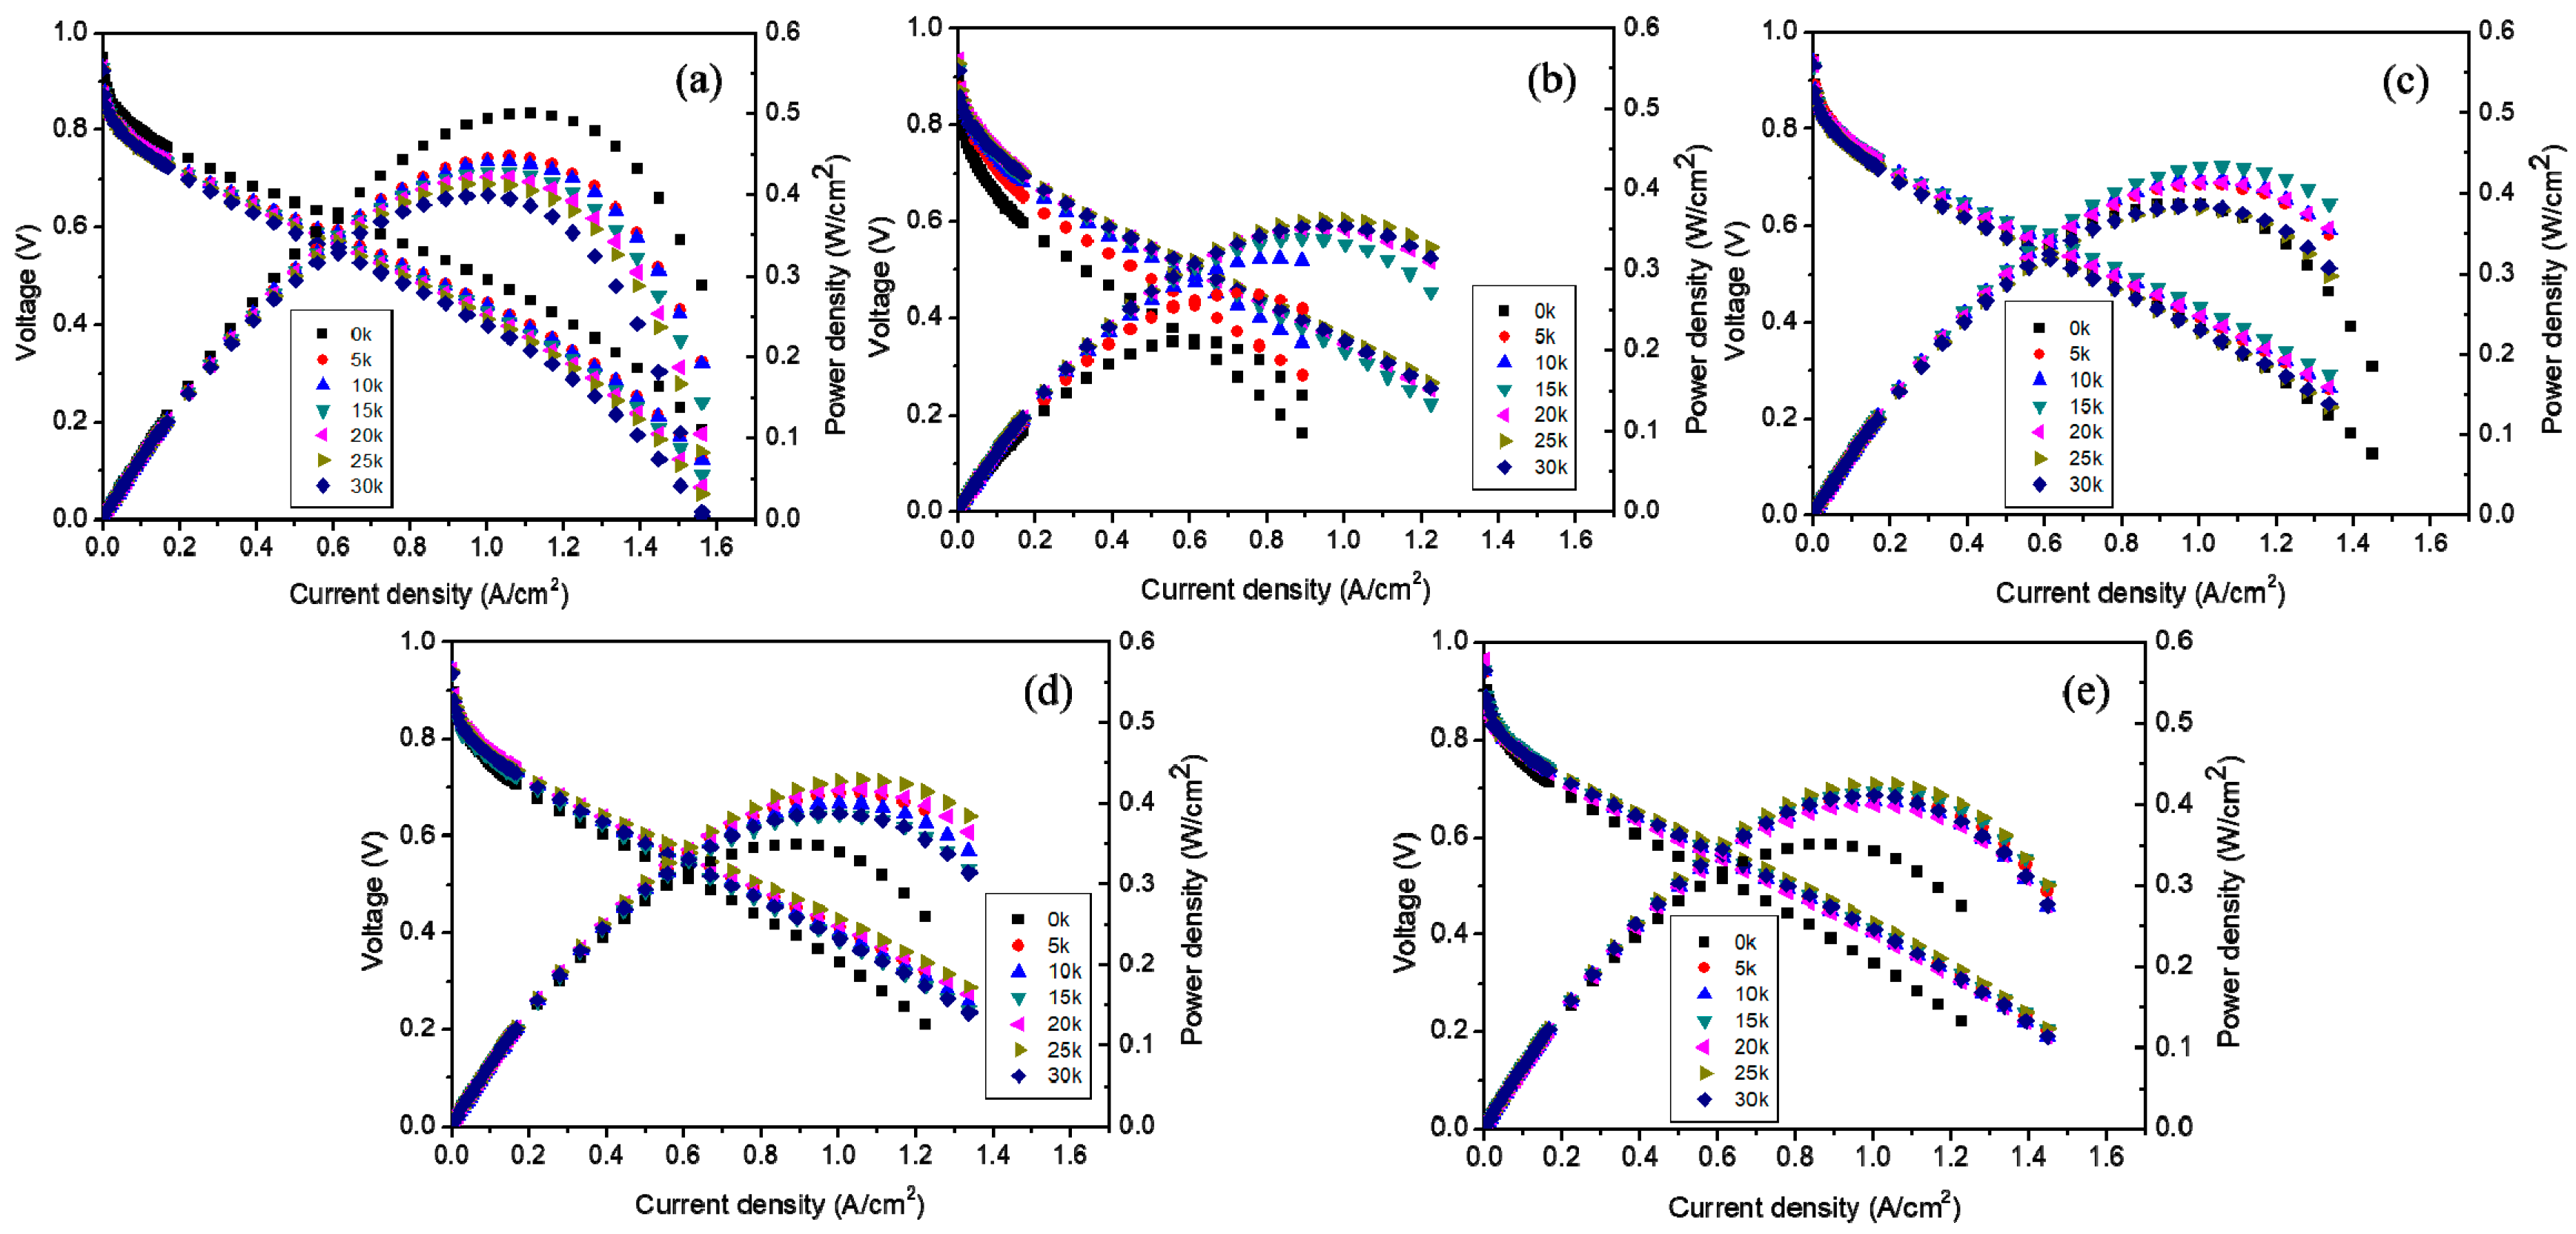
In Figure 3, the MEA based on NMP shows the lowest performance, but obtained the highest performance increment of 226% compared to the initial performance. In addition, the MEAs based on the ionomer dispersion in the mixed solvent system including NMP showed a modest increase in performance and then decreased slightly up to performance variations of −3.76%, 14.3%, and 26.4% at 30k potential cycles, compared to their initial performance for the MEAs based on 2.5 wt.% water–IPA+2.5 wt.% NMP; 5 wt.% water–IPA+adding NMP; and 5 wt.% NMP+adding water–IPA, respectively (positive and negative indicate increment and decrement, respectively). The numerical values of relative performance variation showed some fluctuation, but the performances remained mostly constant throughout the potential cycling. It could; therefore, be concluded that ionomers in the CLs based on ionomer dispersions in solvent systems including NMP need to experience reorientation finally resulting in the structural change of TPB. In addition, longer conditioning of these MEAs is needed to obtain steady-state operation. This could be because NMP results in a random-coil conformation (true solution behavior) in contrast to the other solvents (i.e., a well-defined cylindrical dispersion in glycerol and in ethylene glycol and a less-defined, highly solvated large particle morphology in water–IPA mixtures). This random coil formation results in unsteady-state hydrophilic-hydrophobic segregation of ionomers and makes the CLs require more time to achieve a steady-state TPB with the electrocatalyst and ionomer, due to the lower degree of phase-separation of the ionomer formed by the 2.5 wt.% NMP ionomer dispersion. The lower degree of phase-separation in the electrode retards a decrease in ECSA (in other words, an increase in Pt particle growth) in the CLs as shown in Figure 2, and finally results in a more durable TPB, in good agreement with previous results [23]. It means that the structure of TPB could be significantly determined by the shape of ionomers dispersed in solvents, not a specific property of solvents. It was reported that the shape of ionomers affects platinum particle growth due to the different mobility of side or main chains to the solvents [21]. In addition, penetration of the bulky ionomer dispersed in water–IPA to micropores containing catalyst in CLs appears implausible. For mesopores of CLs formed by mesoporous carbon support structures, as much as 50% of the Pt catalyst were not in direct contact with ionomer [11,27]. Thus, it could be expected that tiny ionomer from NMP-based dispersions wrap up electrocatalyst particles well to form a more compact TPB structure. It also influences platinum growth to determine the performance and/or durability rather than TPB structures formed by water–IPA dispersions. In summary, three I–V curves of the MEAs, with CLs prepared by the mixture of water–IPA and NMP (see Figure 3c–e), shows similar behavior in the region of activation, Ohmic and mass transport polarization. Significant difference in the region of activation and mass transport polarization was; however, shown in Figure 3a,b. The lower degree of phase-separation in the CL by the NMP dispersion caused higher activation polarization than the CL by the water–IPA dispersion. Since the relative dense CL by the NMP dispersion had smaller size pores where flooding occurred, at RH 100%, the mass transport polarization was less sensitive than the relative sparse CL by the water–IPA dispersion. Figure 4 summarizes the current density at 0.6 V obtained from all the current-voltage polarization curves of the five different MEAs, as a function of the number of potential cycles. Degradation of MEAs based on ionomer dispersions, using water–IPA with repeated fuel cell runs, resulted in a performance variation of −28.1% after 30 k potential cycles, compared to the initial performance due to a decrease in ECSA by Oswald ripening of Pt particles, oxidation of carbon supports, and/or cleavage of carbon-sulfur bonds in PFSA ionomers [28]. As discussed in Figure 2, the reorientation of ionomers in the CLs, formed by the ionomer dispersion based on NMP, changed the structure of the TPB of the electrodes and then resulted in an increase in ECSA. In addition, as reported in elsewhere [24], the surface of the initial CL, based on ionomer dispersions including NMP, showed no cracks, as shown in Figure 5b–e, but numerous cracks were observed for the CL based on 2.5 wt.% water–IPA (1:1), shown in Figure 5a. In other words, the dispersions containing a high-boiling-point solvents, such as NMP (see Figure 5b–e), showed less cracks than the dispersion containing low-boiling-point solvents, such as water and IPA (see Figure 5a). The solvents with low boiling points (less than ~100 °C) evaporated much faster than that with high boiling points (greater than ~150 °C). In addition, the clustering of highly-solvated large particles by water–IPA was suddenly vanished by fast evaporation. Thus, big voids could be formed in CLs. Consequently, voids inside CLs caused numerous cracks on the surface of CLs, as shown in Figure 5a. It is also the main reason for the better durability of the MEAs with CLs based on ionomer dispersions, including NMP. Nevertheless, the better performance of the MEA based on water–IPA is slightly attributed to the surface cracks since the recent study reported that cracked CLs by mechanical stretching of catalyst-coated Nafion membranes led to a decrease in membrane resistance and an improvement in mass transport, which resulted in enhanced device performance [29].
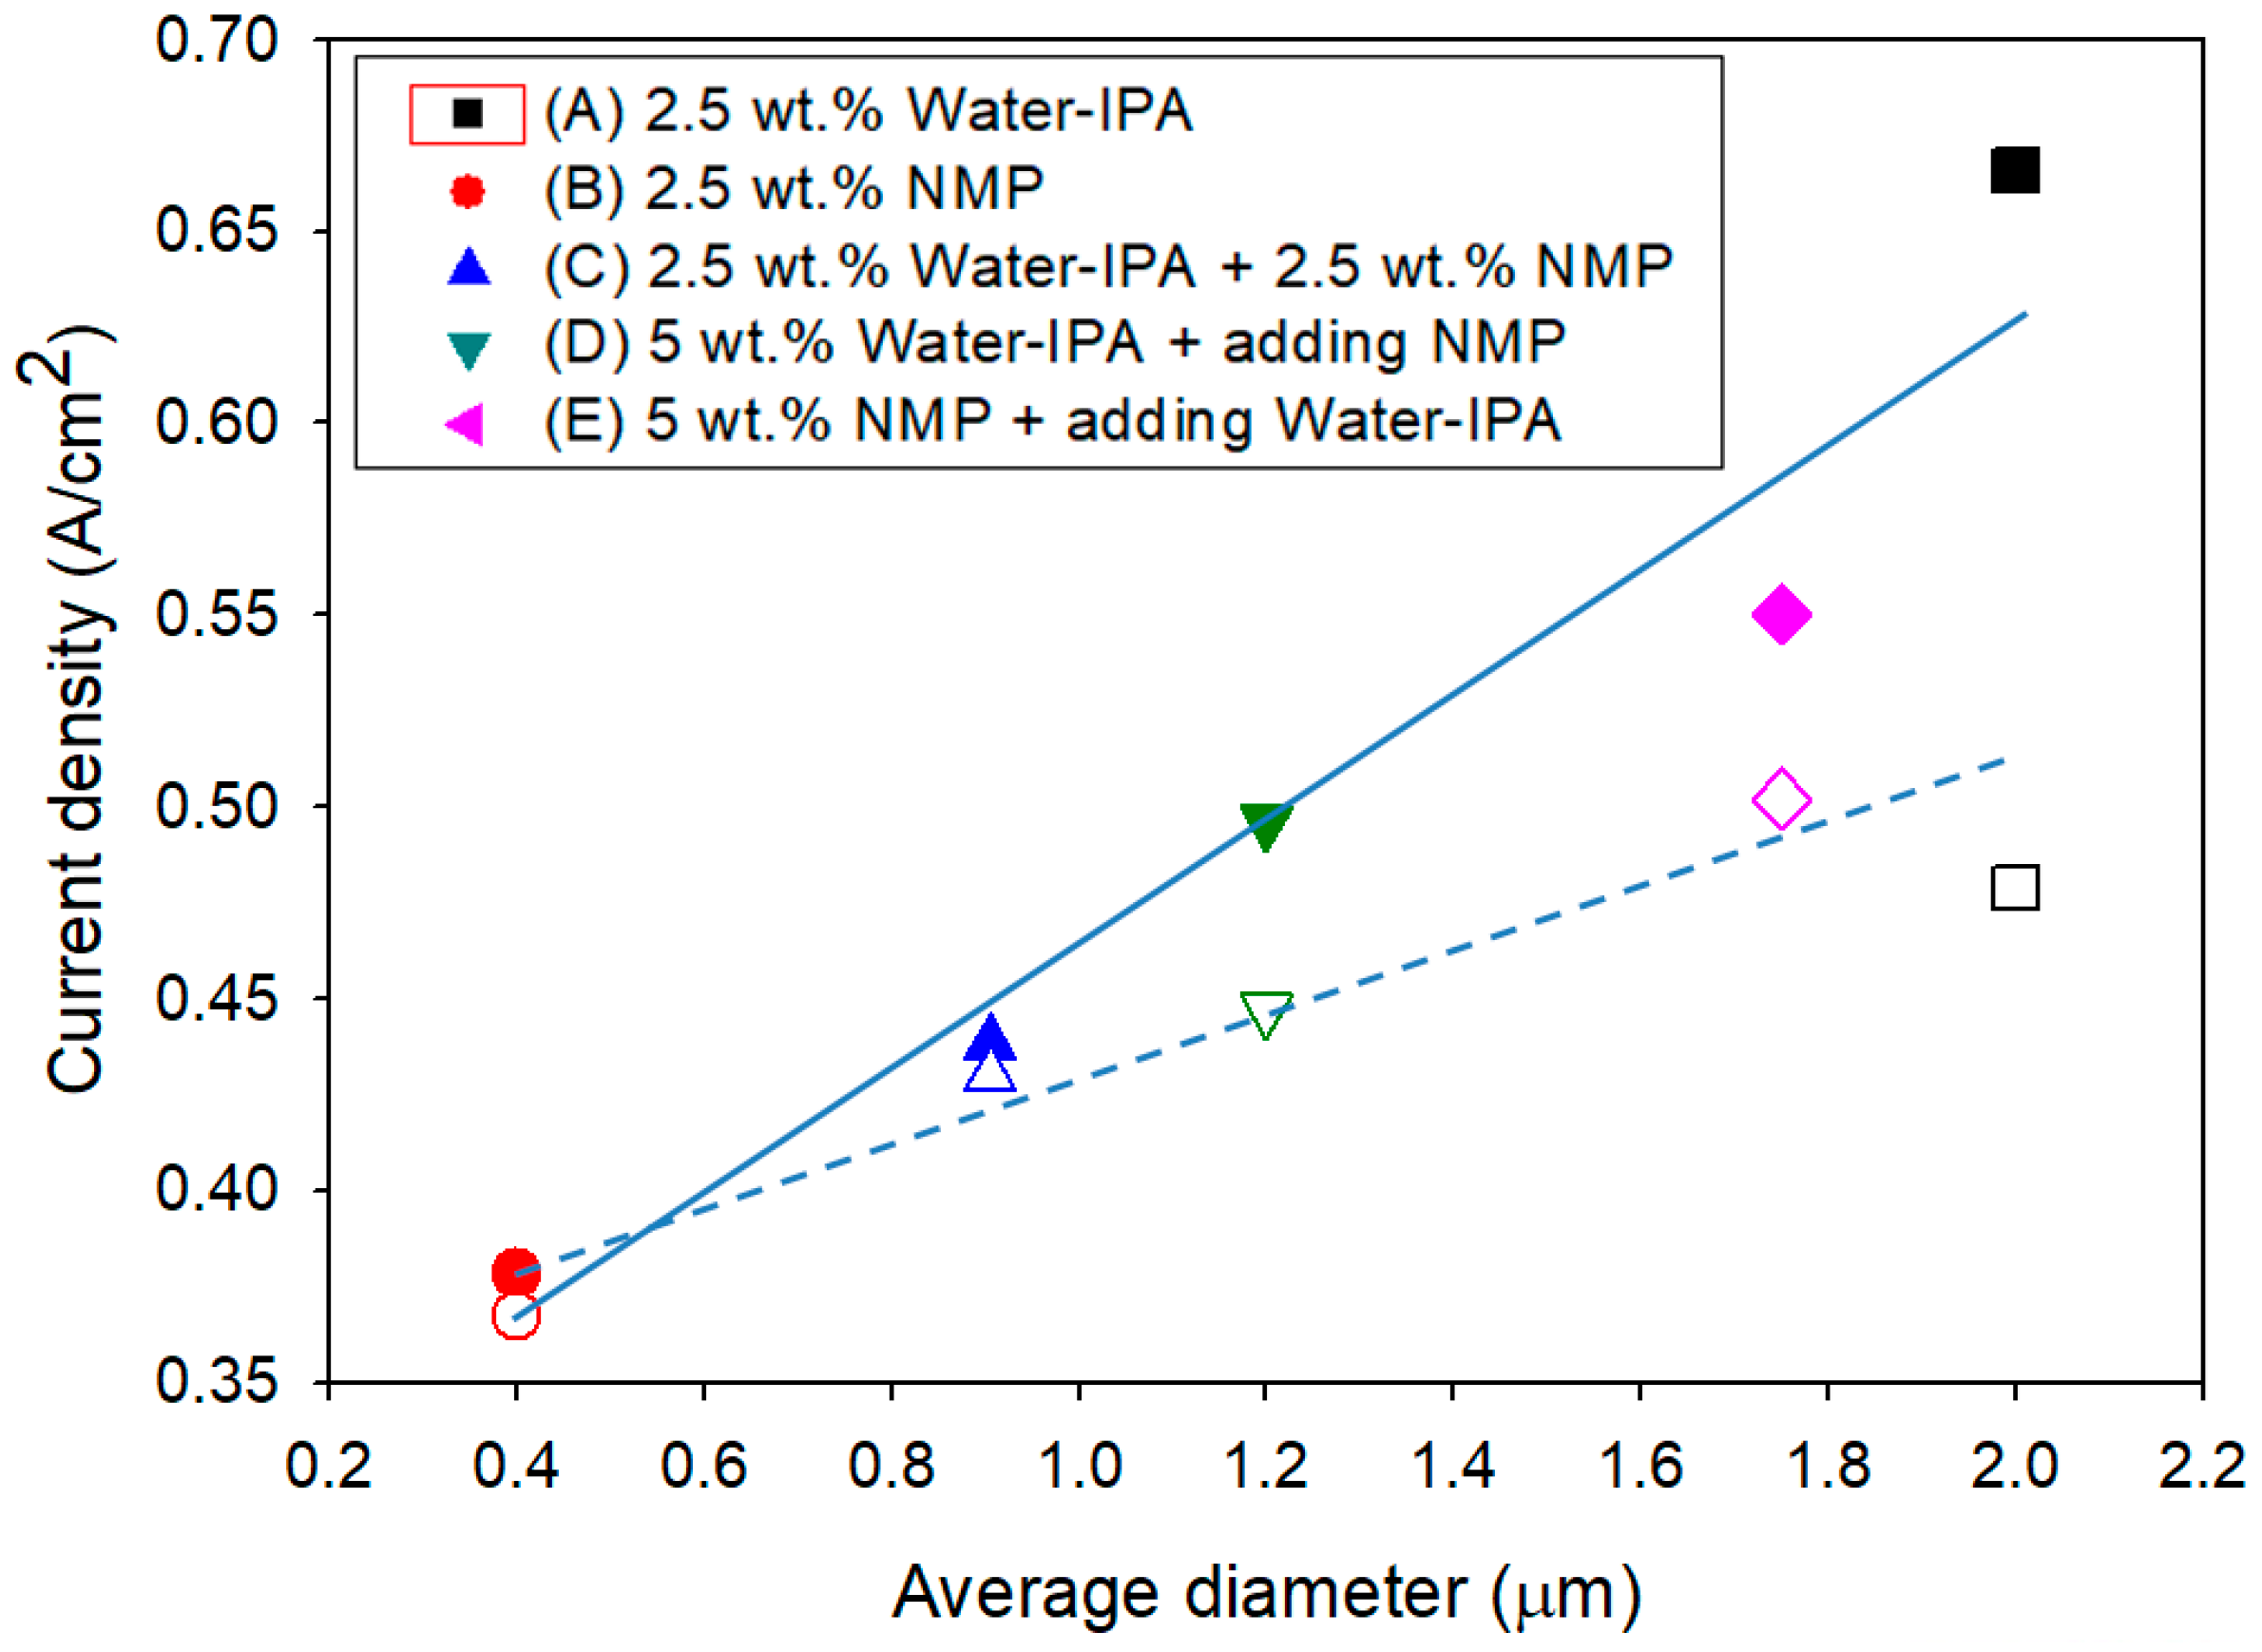
Figure 6 summarizes the performance (i.e., maximum current density during potential cycles and current density at 0.6 V and the 30kth potential cycle) and durability (i.e., two regressed lines showing that the discrepancy between two lines enlarges as the size of ionomers increases) of the MEAs with CLs based on the five different ionomer dispersions as a function of average particle size of the ionomer dispersions. Water–IPA results in highly-solvated large particles, with approximate diameters of >2 μm, and NMP results in a random coil-conformation, with approximate diameter of ~0.4 μm. The water–IPA based MEA showed the highest performance, and the NMP based MEA showed the lowest performance during the whole potential cycling test. However, the durability showed the totally opposite behavior. The final performances at the 30kth potential cycle were compared to maximum performances during potential cycles. It is observed that the discrepancy between two regressed lines decreases as the size of ionomer particles in dispersions decreases. Small discrepancy means small degradation of CLs during potential cycles. Hence, the ionomer dispersions based on mixtures of water–IPA and NMP show intermediate performance and durability. On the basis of these results, a relationship between performance-durability and average particle size in ionomer dispersions was found, as shown in Figure 6. That is, better performance could be obtained for MEAs with CLs based on ionomer dispersions with high average particle size, and better durability with lower average particle size. Once NMP participates in the solvent system of ionomer dispersions, the average ionomer particle size in the ionomer dispersions decreased below that of a water–IPA based ionomer dispersion. In other words, MEAs with CLs based on ionomer dispersions including NMP could exhibit lower performance and higher durability than those based on a water–IPA ionomer dispersion. The average particle size of ionomer dispersions could be an important indicator to predict the performance and durability of MEAs in PEMFCs.
4. Conclusions
CLs using the dispersions prepared by five different solvents were investigated to understand the substantial effect of solvents on the morphology of ionomers dispersed in the various solvent systems, on the structure of the electrode surface, and on TPB in CLs. In addition, the effect of solvents, used in ionomer dispersions, on the performance and durability of MEAs was investigated. The ionomer dispersions based on five different solvent systems using water–IPA and/or NMP was used for investigation. Polar protic solvents, such as water and alcohols, resulted in good performance but inferior durability, due to the lower degree of phase-separation and numerous cracks on the surface of CLs, while polar aprotic solvents, such as NMP, showed more durable performance. Thus, ionomer dispersions in the solvent mixture of water–IPA and NMP were mainly investigated and found to result in improved MEA durability while maintaining similar MEA performance, compared to that observed with water–IPA or NMP only. In addition, a relationship between the performance-durability and average ionomer particle size was found. Larger and smaller particle sizes of ionomers in dispersions caused better performance and durability, respectively. Hence, the average particle size of ionomers in a dispersion is a good indicator to predict the performance and durability of MEAs in PEMFCs.
Author Contributions
Conceptualization, J.-S.P.; methodology, J.-S.P.; experimentation, C.-H.S.; validation, J.-S.P. and C.-H.S.; investigation, J.-S.P. and C.-H.S.; resources, C.-H.S.; writing—original draft preparation, J.-S.P.; writing—review and editing, J.-S.P.; supervision, J.-S.P.
Funding
This research was funded by a 2016 Research Grant from Sangmyung University.
Acknowledgments
This work was supported by a 2016 Research Grant from Sangmyung University.
Conflicts of Interest
The authors declare no conflicts of interest.
References
- Park, J.-S.; Shin, M.-S.; Kim, C.-S. Proton exchange membranes for fuel cell operation at low relative humidity and intermediate temperature: An updated review. Curr. Opin. Electrochem. 2017, 5, 43–55. [Google Scholar] [CrossRef]
- Park, J.-S.; Choi, Y.-W. High durable anion-conducting ionomer binder formed by on-site crosslinking. Chem. Lett. 2013, 42, 998–1000. [Google Scholar] [CrossRef]
- Song, C.-H.; Park, J.-S. Membrane-electrode assemblies with patterned electrodes for proton exchange membrane fuel cells. Chem. Lett. 2018, 47, 196–199. [Google Scholar] [CrossRef]
- Radev, I.; Koutzarov, K.; Pfrang, A.; Tsotridis, G. The influence of the membrane thickness on the performance and durability of PEFC during dynamic aging. Int. J. Hydrogen Energy 2012, 37, 11862–11870. [Google Scholar] [CrossRef]
- Kim, K.-H.; Lee, K.-Y.; Kim, H.-J.; Cho, E.; Lee, S.-Y.; Lim, T.-H.; Yoon, S.P.; Hwang, I.C.; Jang, J.H. The effects of Nafion® ionomer content in PEMFC MEAs prepared by a catalyst-coated membrane (CCM) spraying method. Int. J. Hydrogen Energy 2010, 35, 2119–2126. [Google Scholar] [CrossRef]
- Jeon, S.; Lee, J.; Rios, G.M.; Kim, H.-J.; Lee, S.-Y.; Cho, E.; Lim, T.-H.; Jang, J.H. Effect of ionomer content and relative humidity on polymer electrolyte membrane fuel cell (PEMFC) performance of membrane-electrode assemblies (MEAs) prepared by decal transfer method. Int. J. Hydrogen Energy 2010, 35, 9678–9686. [Google Scholar] [CrossRef]
- Suzuki, A.; Sen, U.; Hattori, T.; Nagumo, R.; Tsuboi, H.; Hatakeyama, N.; Takaba, H.; Williams, M.C.; Miyamoto, A. Ionomer content in the catalyst layer of polymer electrolyte membrane fuel cell (PEMFC): Effects on diffusion and performance. Int. J. Hydrogen Energy 2011, 36, 2221–2229. [Google Scholar] [CrossRef]
- Uchida, M.; Aoyama, Y.; Eda, N.; Ohta, A. Investigation of the microstructure in the catalyst layer and effects of both perfluorosulfonate ionomer and PTFE-loaded carbon on the catalyst layer of polymer electrolyte fuel cells. J. Electrochem. Soc. 1995, 142, 4143–4149. [Google Scholar] [CrossRef]
- Paganin, V.A.; Ticianelli, E.A.; Gonzalez, E.R. Development and electrochemical studies of gas diffusion electrodes for polymer electrolyte fuel cells. J. Appl. Electrochem. 1996, 26, 297–304. [Google Scholar] [CrossRef]
- Antolini, E.; Giorgi, L.; Pozio, A.; Passalacqua, E. Influence of Nafion loading in the catalyst layer of gas-diffusion electrodes for PEFC. J. Power Sources 1999, 77, 136–142. [Google Scholar] [CrossRef]
- Park, Y.-C.; Tokiwa, H.; Kakinuma, K.; Watanabe, M.; Uchida, M. Effects of carbon supports on Pt distribution, ionomer coverage and cathode performance for polymer electrolyte fuel cells. J. Power Sources 2016, 315, 179–191. [Google Scholar] [CrossRef] [Green Version]
- Lopez-Haro, M.; Guétaz, L.; Printemps, T.; Morin, A.; Escribano, S.; Jouneau, P.-H.; Bayle-Guillemaud, P.; Chandezon, F.; Gebel, G. Three-dimensional analysis of Nafion layers in fuel cell electrodes. Nat. Commun. 2014, 5, 5529. [Google Scholar] [CrossRef] [PubMed]
- Lee, M.; Uchida, M.; Yano, H.; Tryk, D.A.; Uchida, H.; Watanabe, M. New evaluation method for the effectiveness of platinum/carbon electrocatalysts under operating conditions. Electrochim. Acta 2010, 55, 8504–8512. [Google Scholar] [CrossRef]
- Kim, T.-H.; Yi, J.-Y.; Jung, C.-Y.; Jeong, E.; Yi, S.-C. Solvent effect on the Nafion agglomerate morphology in the catalyst layer of the proton exchange membrane fuel cells. Int. J. Hydrogen Energy 2017, 42, 478–485. [Google Scholar] [CrossRef]
- Orfanidi, A.; Rheinländer, P.J.; Schulte, N.; Gasteiger, H.A. Ink solvent dependence of the ionomer distribution in the catalyst layer of a PEMFC. J. Electrochem. Soc. 2018, 165, F1254–F1263. [Google Scholar] [CrossRef]
- Jung, C.-Y.; Yi, S.-C. Improved polarization of mesoporous electrodes of a proton exchange membrane fuel cell using N-methyl-2-pyrrolidinone. Electrochim. Acta 2013, 113, 37–41. [Google Scholar] [CrossRef]
- Zhu, S.; Wang, S.; Jiang, L.; Xia, Z.; Sun, H.; Sun, G. High Pt utilization catalyst prepared by ion exchange method for direct methanol fuel cells. Int. J. Hydrogen Energy 2012, 37, 14543–14548. [Google Scholar] [CrossRef] [Green Version]
- Omata, T.; Tanaka, M.; Miyatake, K.; Uchida, M.; Uchida, H.; Watanabe, M. Preparation and fuel cell performance of catalyst layers using sulfonated polyimide ionomers. Appl. Mater. Interfaces 2012, 4, 730–737. [Google Scholar] [CrossRef]
- Rolfi, A.; Oldani, C.; Merlo, L.; Facchi, D.; Ruffo, R. New perfluorinated ionomer with improved oxygen permeability for application in cathode polymeric electrolyte membrane fuel cell. J. Power Sources 2018, 396, 95–101. [Google Scholar] [CrossRef]
- Stassi, A.; Gatto, I.; Passalacqua, E.; Antonucci, V.; Aricò, A.S.; Merlo, L.; Oldani, C.; Pagano, E. Performance comparison of long and short-side chain perfluorosulfonic membranes for high temperature polymer electrolyte membrane fuel cell opersion. J. Power Sources 2011, 196, 8925–8930. [Google Scholar] [CrossRef]
- Welch, C.; Labouriau, A.; Hjelm, R.; Orler, B.; Johnston, C.; Kim, Y.S. Nafion in dilute solvent systems: Dispersion or solution? ACS Macro Lett. 2012, 1, 1403–1407. [Google Scholar] [CrossRef]
- Johnston, C.M.; Lee, K.-S.; Rockward, T.; Labouriau, A.; Mack, N.; Kim, Y.S. Impact of solvent on ionomer structure and fuel cell durability. ECS Trans. 2009, 25, 1617–1622. [Google Scholar]
- Huang, D.-C.; Yu, P.-J.; Liu, F.-J.; Huang, S.-L.; Hsueh, K.-L.; Chen, Y.-C.; Wu, C.-H.; Chang, W.-C.; Tsau, F.-H. Effect of dispersion solvent in catalyst ink on proton exchange membrane fuel cell performance. Int. J. Electrochem. Sci. 2011, 6, 2551–2565. [Google Scholar]
- Choi, B.; Langlois, D.A.; Mack, N.; Johnston, C.M.; Kim, Y.S. The effect of cathode structures on Nafion membrane durability. J. Electrochem. Soc. 2014, 161, F1154–F1162. [Google Scholar] [CrossRef]
- Fuel Cell Tech Team Accelerated Stress Test and Polarization Curve Protocols for PEM Fuel Cells. Available online: https://www.energy.gov/sites/prod/files/2015/08/f25/fcto_dwg_usdrive_fctt_accelerated_stress_tests_jan2013.pdf (accessed on 28 November 2018).
- Paul, D.K.; Karan, K.; Docoslis, A.; Giorgi, J.B.; Pearce, J. Characteristics of self-assembled ultrathin Nafion films. Macromolecules 2013, 46, 3461–3475. [Google Scholar] [CrossRef]
- Karan, K. PEFC catalyst layer: Recent advances in materials, microstructural characterization, and modeling. Curr. Opin. Electrochem. 2017, 5, 27–35. [Google Scholar] [CrossRef]
- Liu, M.; Wang, C.; Zhang, J.; Wang, J.; Hou, Z.; Mao, Z. Diagnosis of membrane electrode assembly degradation with drive cycle test technique. Int. J. Hydrogen Energy 2014, 39, 14370–14375. [Google Scholar] [CrossRef]
- Kim, S.M.; Ahn, C.-Y.; Cho, Y.-H.; Kim, S.; Hwang, W.; Jang, S.; Shin, S.; Lee, G.; Sung, Y.-E.; Choi, M. High-performance fuel cell with stretched catalyst-coated membrane: One-step formation of cracked electrode. Sci. Rep. 2016, 6, 26503–26509. [Google Scholar] [CrossRef]
Figure 1.
In-plane proton conductivity of the membranes cast from the five different ionomer dispersions prepared in this study (the dotted line represents the in-plane proton conductivity of Nafion 212).
Figure 1.
In-plane proton conductivity of the membranes cast from the five different ionomer dispersions prepared in this study (the dotted line represents the in-plane proton conductivity of Nafion 212).

Figure 2.
ECSA of MEAs prepared from the five dispersions at 0.6 V as a function of the number of potential cycles.
Figure 2.
ECSA of MEAs prepared from the five dispersions at 0.6 V as a function of the number of potential cycles.
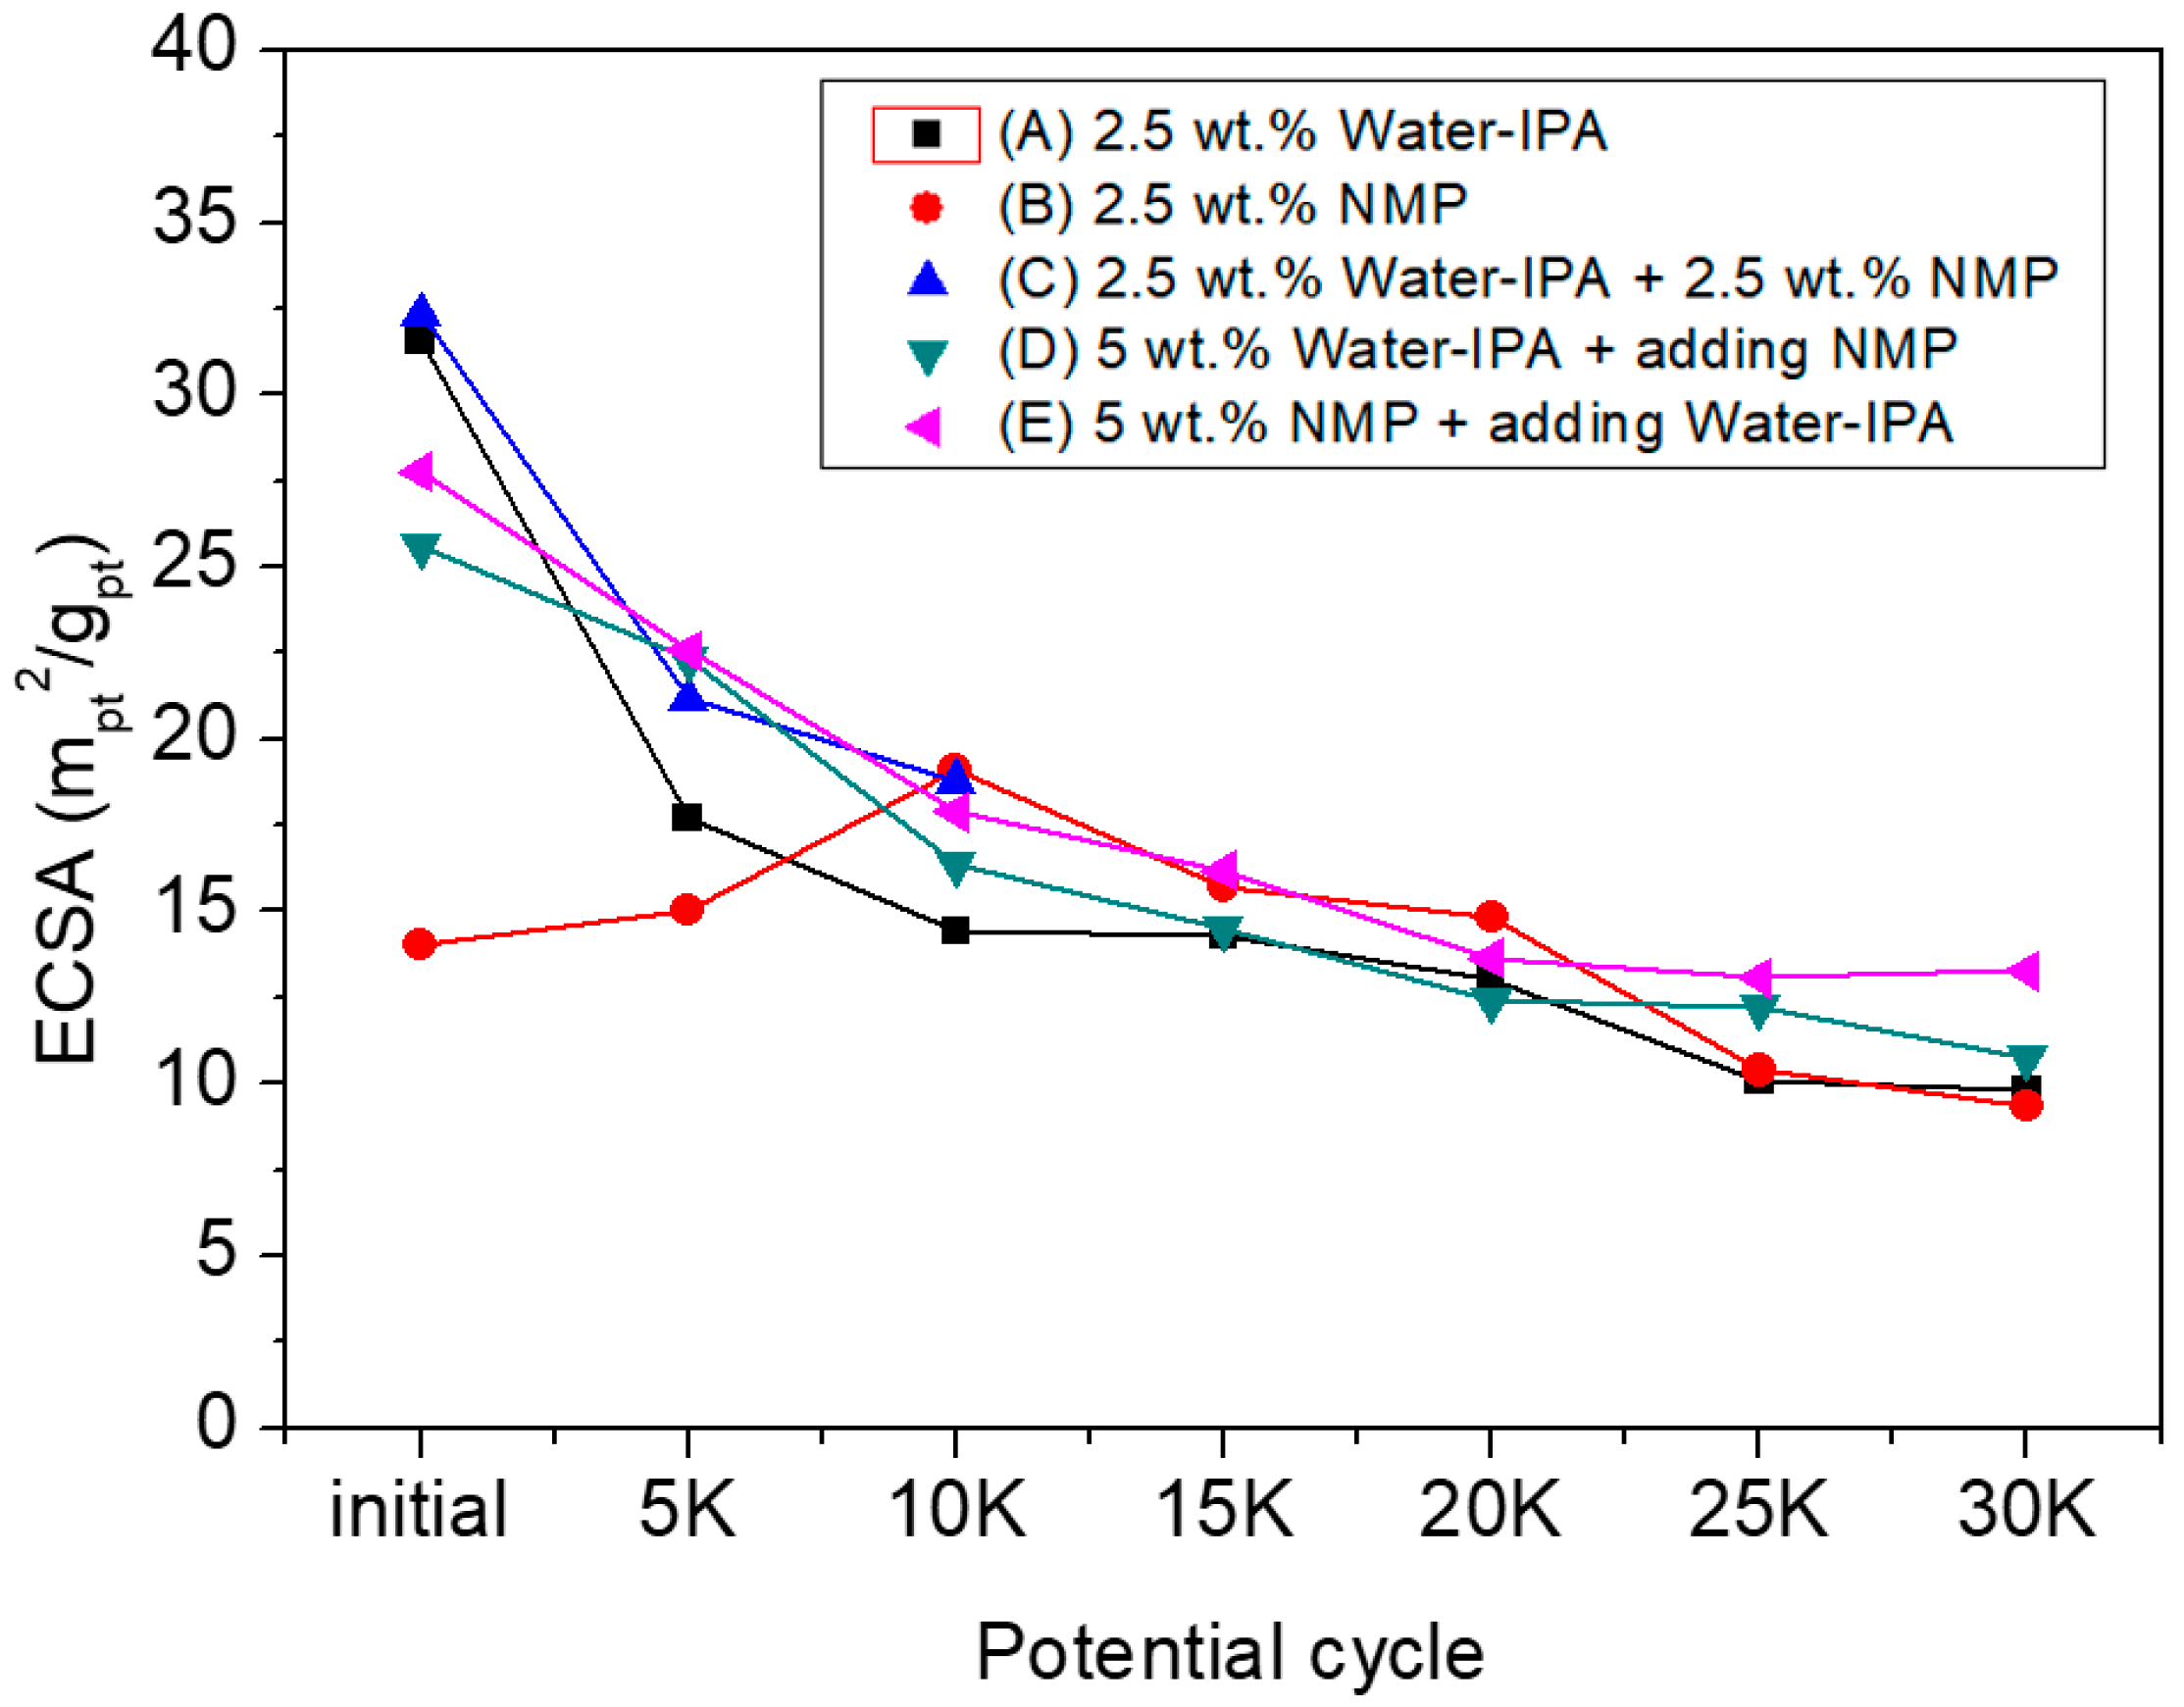
Figure 3.
Fuel cell polarization plots after 5, 10, 15, 20, 25, and 30k potential cycles: (a) 2.5 wt.% water–IPA; (b) 2.5 wt.% NMP; (c) 2.5 wt.% water–IPA+2.5 wt.% NMP; (d) 5 wt.% water–IPA+adding NMP; and (e) 5 wt.% NMP+adding water–IPA.
Figure 3.
Fuel cell polarization plots after 5, 10, 15, 20, 25, and 30k potential cycles: (a) 2.5 wt.% water–IPA; (b) 2.5 wt.% NMP; (c) 2.5 wt.% water–IPA+2.5 wt.% NMP; (d) 5 wt.% water–IPA+adding NMP; and (e) 5 wt.% NMP+adding water–IPA.

Figure 4.
Current density of MEAs prepared from the five dispersions at 0.6 V as function of the number of potential cycles.
Figure 4.
Current density of MEAs prepared from the five dispersions at 0.6 V as function of the number of potential cycles.

Figure 5.
Scanning electron microscope (SEM) images of the surface of CCMs prepared from: (a) 2.5 wt.% water–IPA; (b) 2.5 wt.% NMP; (c) 2.5 wt.% water–IPA+2.5 wt.% NMP; (d) 5 wt.% water–IPA+adding NMP; and (e) 5 wt.% NMP+adding water–IPA dispersions, both initially and after 30k potential cycles at 500× magnification.
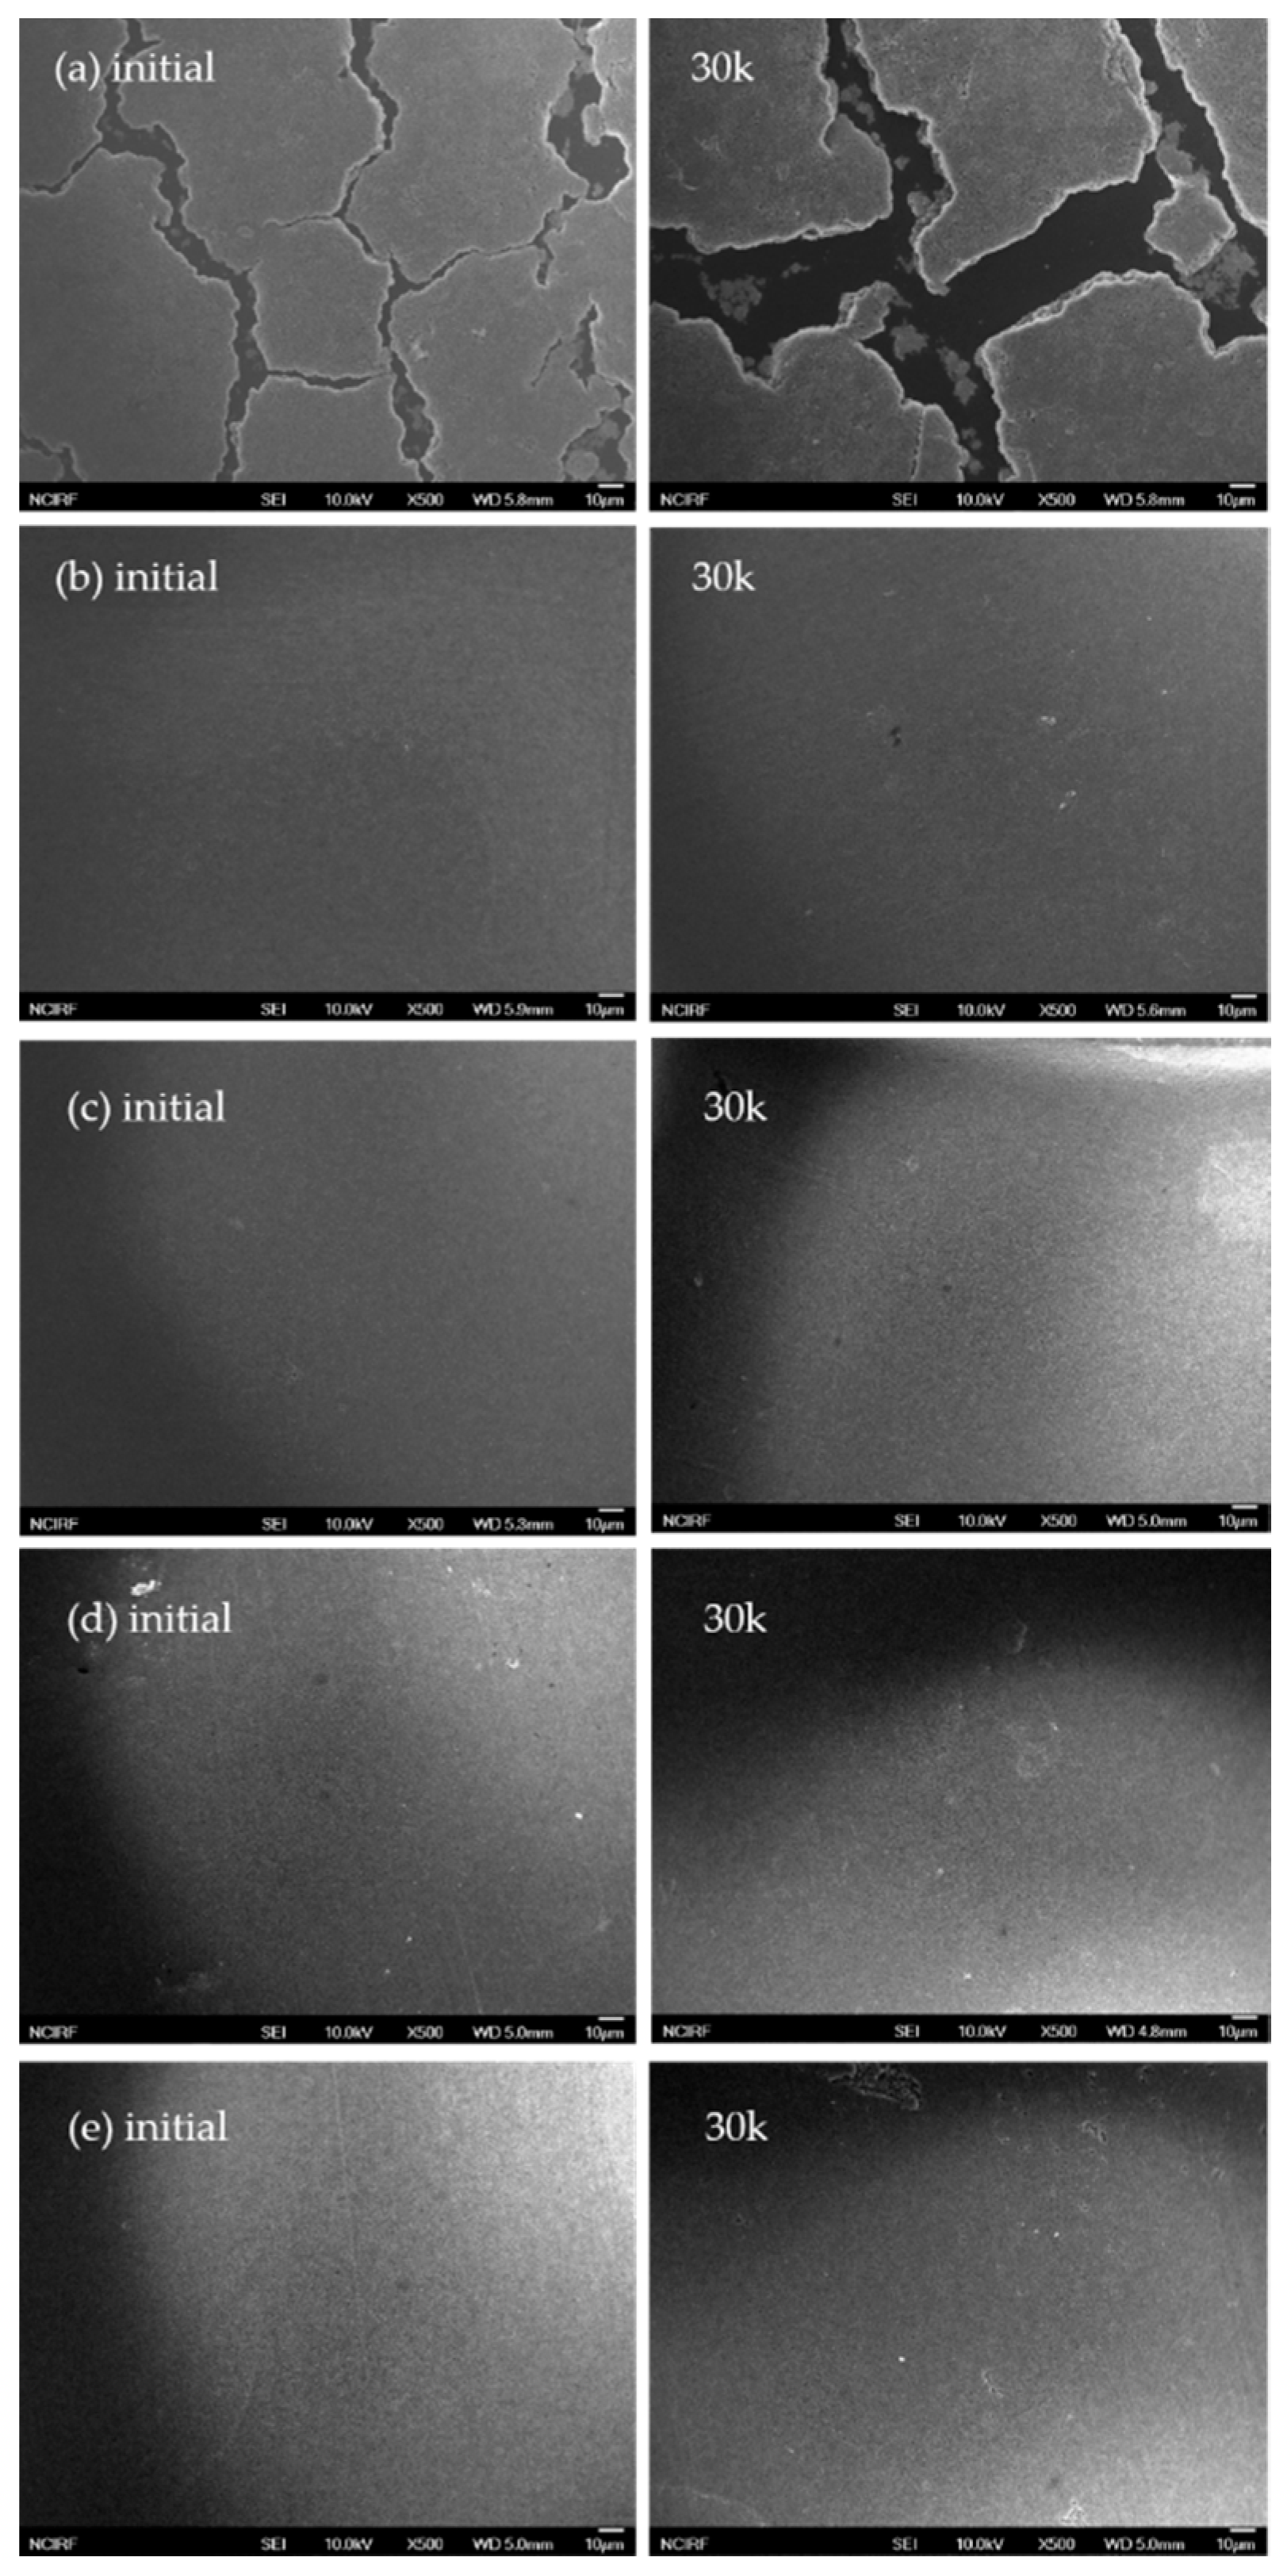
Figure 6.
Current density of the MEAs at 0.6 V as function of the average size of ionomers in five different dispersions (the solid and blank symbols represent the maximum current densities during potential cycles and the current densities at the 30kth potential cycle, respectively; and the R2 and p-value of the regressed solid line and the regressed dotted line are 0.97 and 0.007 and 0.80 and 0.04, respectively).

Table 1.
Summary of preparation methods of five different ionomer dispersions and their dynamic light scattering (DLS).
Table 1.
Summary of preparation methods of five different ionomer dispersions and their dynamic light scattering (DLS).
| 2.5 wt.% Dispersions | Average Diameter (μm) | D10 1 | D50 1 | D90 1 | Span 2 | |
|---|---|---|---|---|---|---|
| Main Dispersion | Additional Solvent | |||||
| 2.5 wt.% water–IPA (1:1) | - | 2.00 ± 0.03 | 0.440 ± 0.106 | 34.7 ± 7.7 | 62.4 ± 3.5 | 1.78 |
| 2.5 wt.% NMP | - | 0.400 ± 0.023 | 0.028 ± 0.023 | 0.297 ± 0.072 | 0.849 ± 0.167 | 2.76 |
| 2.5 wt.% water–IPA (1:1)+2.5 wt.% NMP | - | 0.905 ± 0.017 | 0.094 ± 0.075 | 1.32 ± 0.073 | 6.60 ± 0.77 | 4.95 |
| 5 wt.% water–IPA (1:1) | NMP | 1.20 ± 0.04 | 0.046 ± 0.017 | 2.11 ± 0.62 | 7.32 ± 1.80 | 3.45 |
| 5 wt.% NMP | Water–IPA (1:1) | 1.75 ± 0.07 | 0.20 ± 0.04 | 3.61 ± 0.21 | 12.8 ± 2.81 | 3.50 |
1 Dxx means that xx% of the ionomer particles have a size of the corresponding figure or smaller. 2 Span (=(D90–D10)/D50) indicates how far apart the 10% and 90% points are.
© 2019 by the authors. Licensee MDPI, Basel, Switzerland. This article is an open access article distributed under the terms and conditions of the Creative Commons Attribution (CC BY) license (http://creativecommons.org/licenses/by/4.0/).
Share and Cite
MDPI and ACS Style
Song, C.-H.; Park, J.-S. Effect of Dispersion Solvents in Catalyst Inks on the Performance and Durability of Catalyst Layers in Proton Exchange Membrane Fuel Cells. Energies 2019, 12, 549. https://doi.org/10.3390/en12030549
AMA Style
Song C-H, Park J-S. Effect of Dispersion Solvents in Catalyst Inks on the Performance and Durability of Catalyst Layers in Proton Exchange Membrane Fuel Cells. Energies. 2019; 12(3):549. https://doi.org/10.3390/en12030549
Chicago/Turabian StyleSong, Chan-Ho, and Jin-Soo Park. 2019. "Effect of Dispersion Solvents in Catalyst Inks on the Performance and Durability of Catalyst Layers in Proton Exchange Membrane Fuel Cells" Energies 12, no. 3: 549. https://doi.org/10.3390/en12030549
Note that from the first issue of 2016, this journal uses article numbers instead of page numbers. See further details here.