1. Introduction
In recent years, the difficulty of conducting manual inspections on transmission lines has been increasing with the enlargement of transmission lines. In order to reduce the workload of inspection work and improve inspection efficiency, unmanned aerial vehicles (UAVs) are used for transmission line inspections [
1,
2,
3]. During UAV inspections, a number of images are collected to detect the defects in transmission lines. The use of image detection technology greatly improves the efficiency and has become a research hotspot in current smart grids [
4,
5,
6,
7]. Insulators, of which the main roles are electrical insulation and line support, are very important components of transmission lines. Since glass insulators have the characteristics of zero value self-shattering, when an insulator is subjected to changes in terms of cold and heat, its compression stresses the surface and opposing tensile internal stresses become greater, which can cause breakdown easily. As a result, the insulation value at both ends of the insulator string becomes zero and the insulation function is lost. Therefore, zero value detection of insulators is required. When the insulation value is zero, a glass insulator will shatter, and it is easy to be found with visual detection. Additionally, because they are widely used in 500 kV high voltage transmission lines, detection of self-shattering defects in insulators has become a significant issue.
Therefore, many methods are suggested to detect self-shattering defects in glass insulators. They are as follows:
- (1)
Detection method based on contour information. Some researchers [
8,
9,
10,
11] firstly identified the contours of insulators, and then determined whether there were self-shattering defects according to the relative distances between adjacent insulators. Nevertheless, the insulators will sometimes be obscured because of unsuitable shooting angles of cameras. In addition, the backgrounds of the aerial images are complex and changeable. Therefore, the contour extraction of insulators will be influenced and the accuracy of the above detection method is affected.
- (2)
Detection method based on texture features. Zhang [
12] and Wang [
13] calculated the texture values of insulator images by block, and then analyzed whether the insulator was missing by comparing texture values. However, the calculation amounts of this method are very large. Zhang [
14] obtained the directions of insulator strings by detecting parallel line segments. Then, the insulator string was divided into blocks according to the direction and the distance between the slices. After that the existence of self-shattering defects were judged by the similarity of texture features between the blocks. However, when the insulator pieces were obstructed or the shooting distance was large, the line features of the insulator pieces were very vague, which easily led to false detection.
- (3)
Detection method based on histogram matching features. Lin [
15] diagnosed glass insulator faults based on a histogram matching criterion and determined faultless insulators within a certain range. However, the method could not indicate the specific locations of the fault insulators. Shi [
16] used a sliding window method to match the gray histogram of the insulators and the templates, and inferred and located insulator defects according to histogram distances. However, it was easily influenced by the detection environment and the selection of templates.
- (4)
Detection method based on region features. Wang [
17] segmented insulators in a lab color space and calculated the proportion of insulator pixels in each insulator region to determine the drop-off fault. Jiang [
18] divided the insulator area into individual pieces, and judged the fault by sensing the distances between the gravity centers of adjacent insulator pieces. Nevertheless, when the insulator string was obstructed and the two insulator strings could not be separated completely, the detection accuracies of the two methods were influenced. Zhai [
19] segmented insulator images in the RGB color space, and performed an adaptive morphology process on the images according to the area ratio of the insulator region. After that, the fault point was located. However, when the missing pieces were at the ends of the insulator string, they may have gone undetected.
The above-mentioned methods are mainly aimed at self-shattering defect detection of unobstructed glass insulators and have achieved good detection results within a certain range. However, in the process of transmission line inspections, insulators in the aerial images are often obstructed and also connected to each other because of the influence of the shooting distance and angle. Thus, most of the above methods show difficulty in obtaining the expected results.
Aiming at the above deficiencies and inspired by the literature [
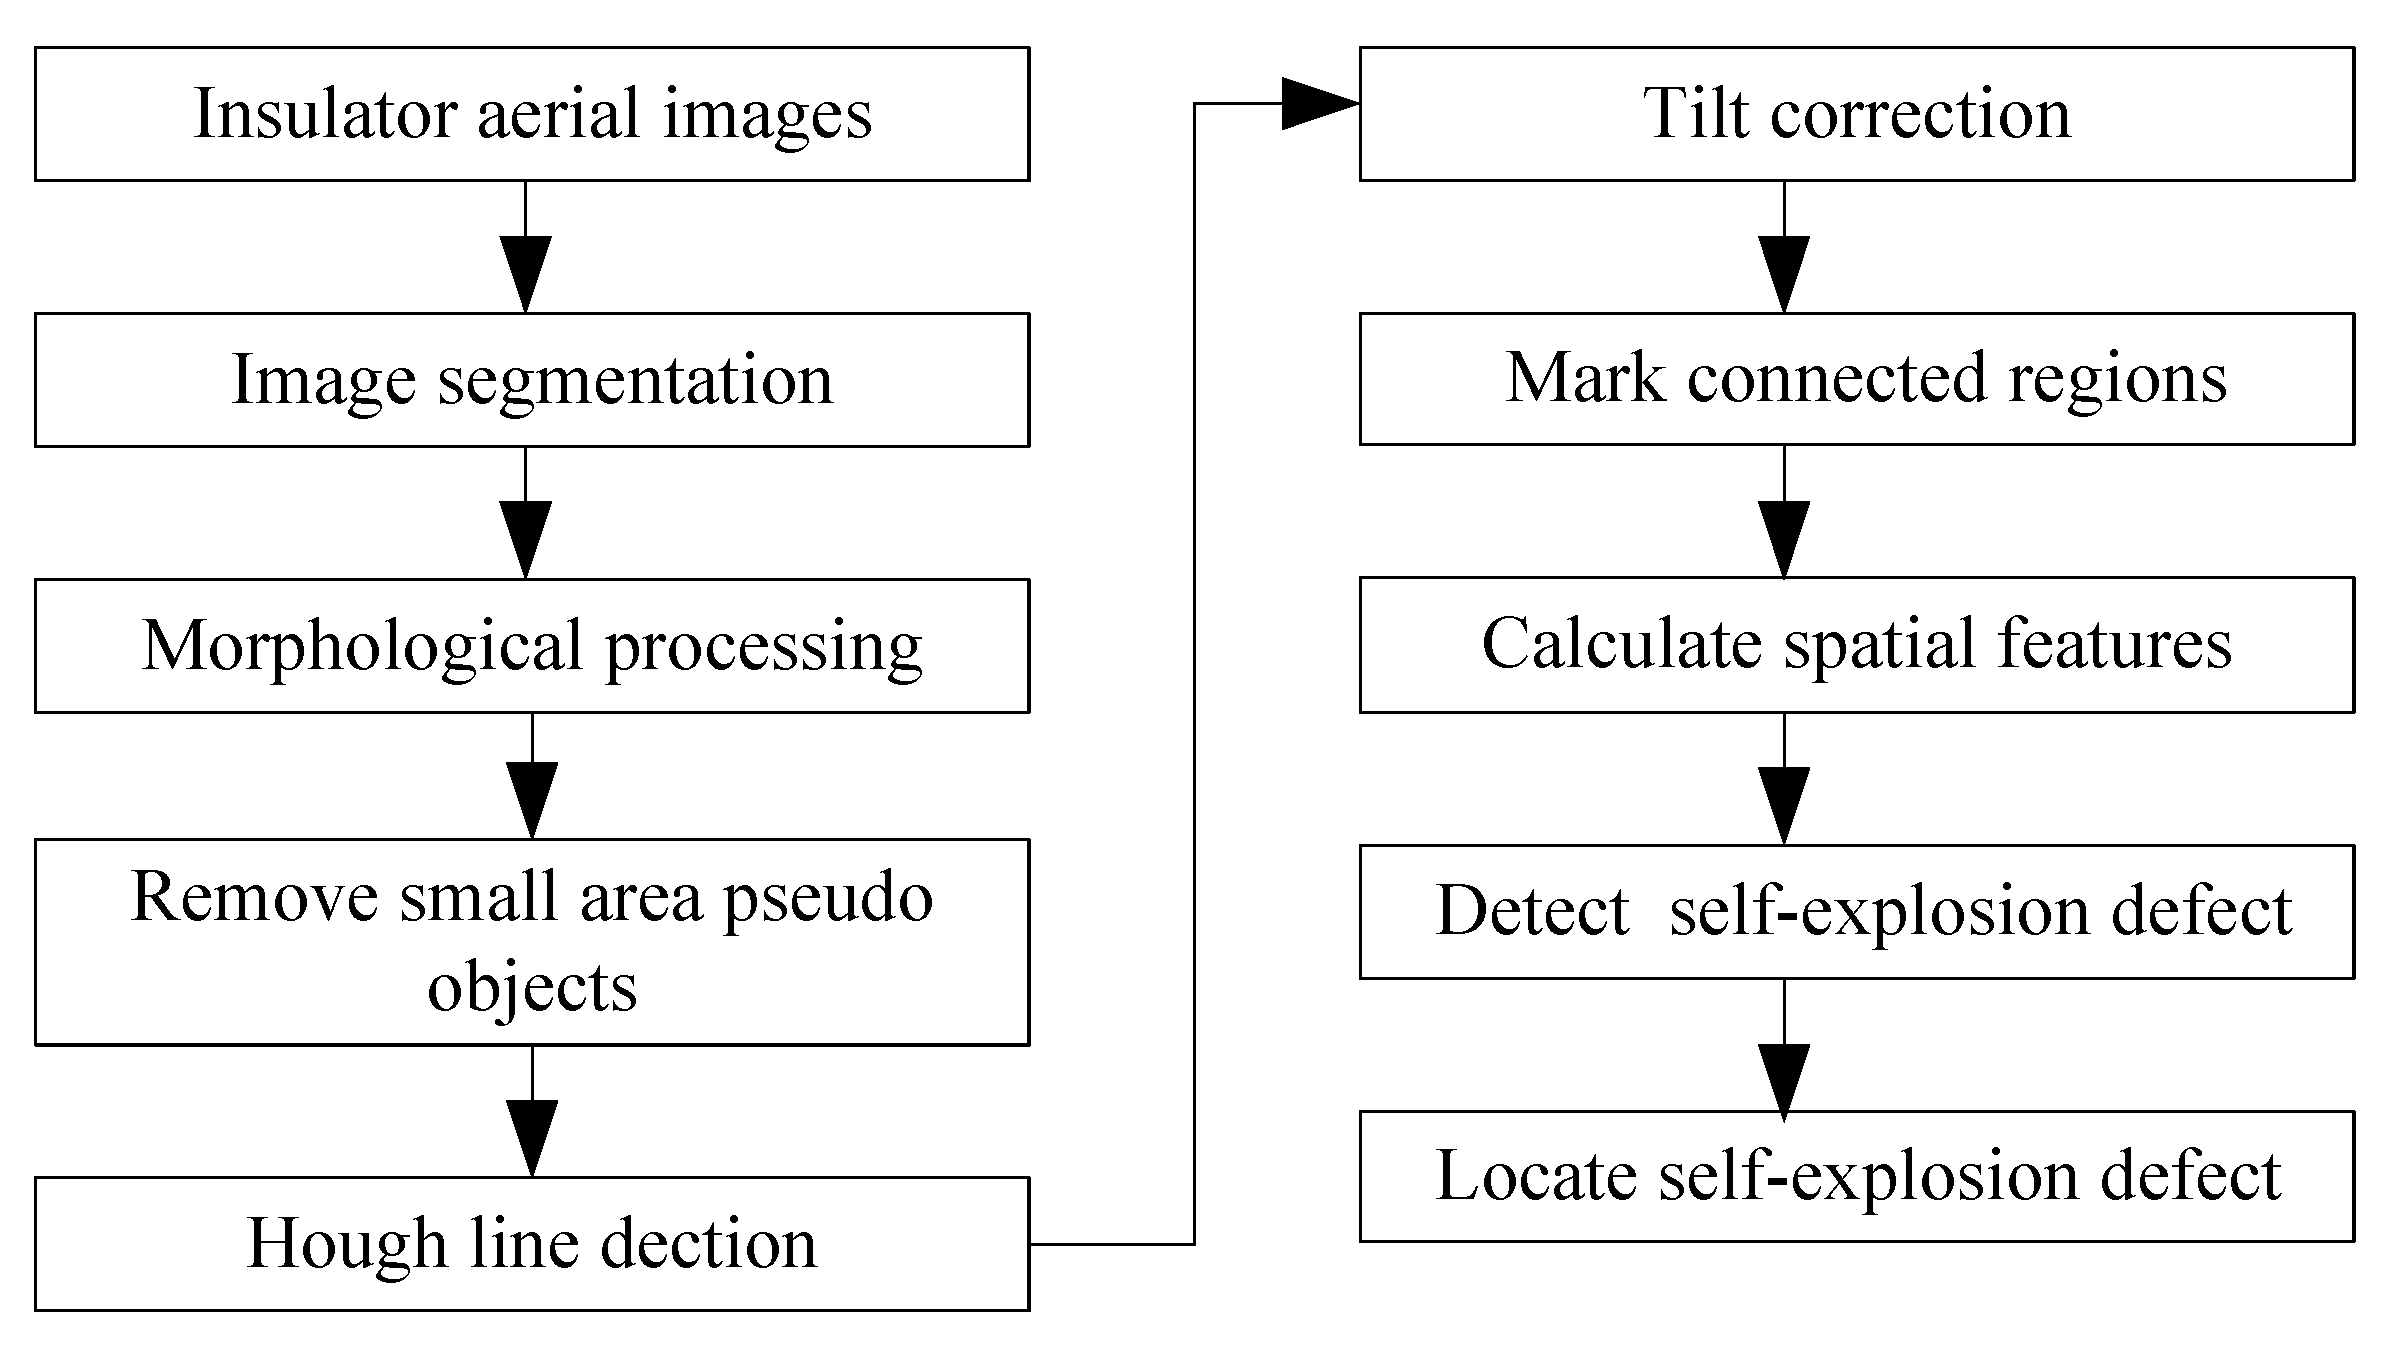
20], in this paper, we propose a self-shattering defect detection method for obstructed or unobstructed twin insulator string images based on the obvious spatial features of the insulator regions. The overall framework of this method is shown in
Figure 1. The main technical contributions made in this work include: (1) For images of twin glass insulator strings, the self-shattering defect can be detected and the defect position can be located accurately, regardless of whether the insulators are obstructed or not; and (2) robustness and real-time performance is evaluated, and they may meet the requirements of strong robustness and high real-time performance demands of power line inspection. The remainder of this paper is organized as follows: In
Section 2, the glass insulator image compound binarization processing are introduced. Then, in
Section 3, the new detection and localization method of insulator self-shattering defects is described in detail. After that, in
Section 4, experiments to verify the performance of the proposed method are explained. Finally, the conclusions are drawn in
Section 5.
2. Insulator Images Compound Binarization
The process of compound binarization mainly includes image segmentation, removal of pseudo targets and tilt correction.
2.1. Insulator Images Segmentation
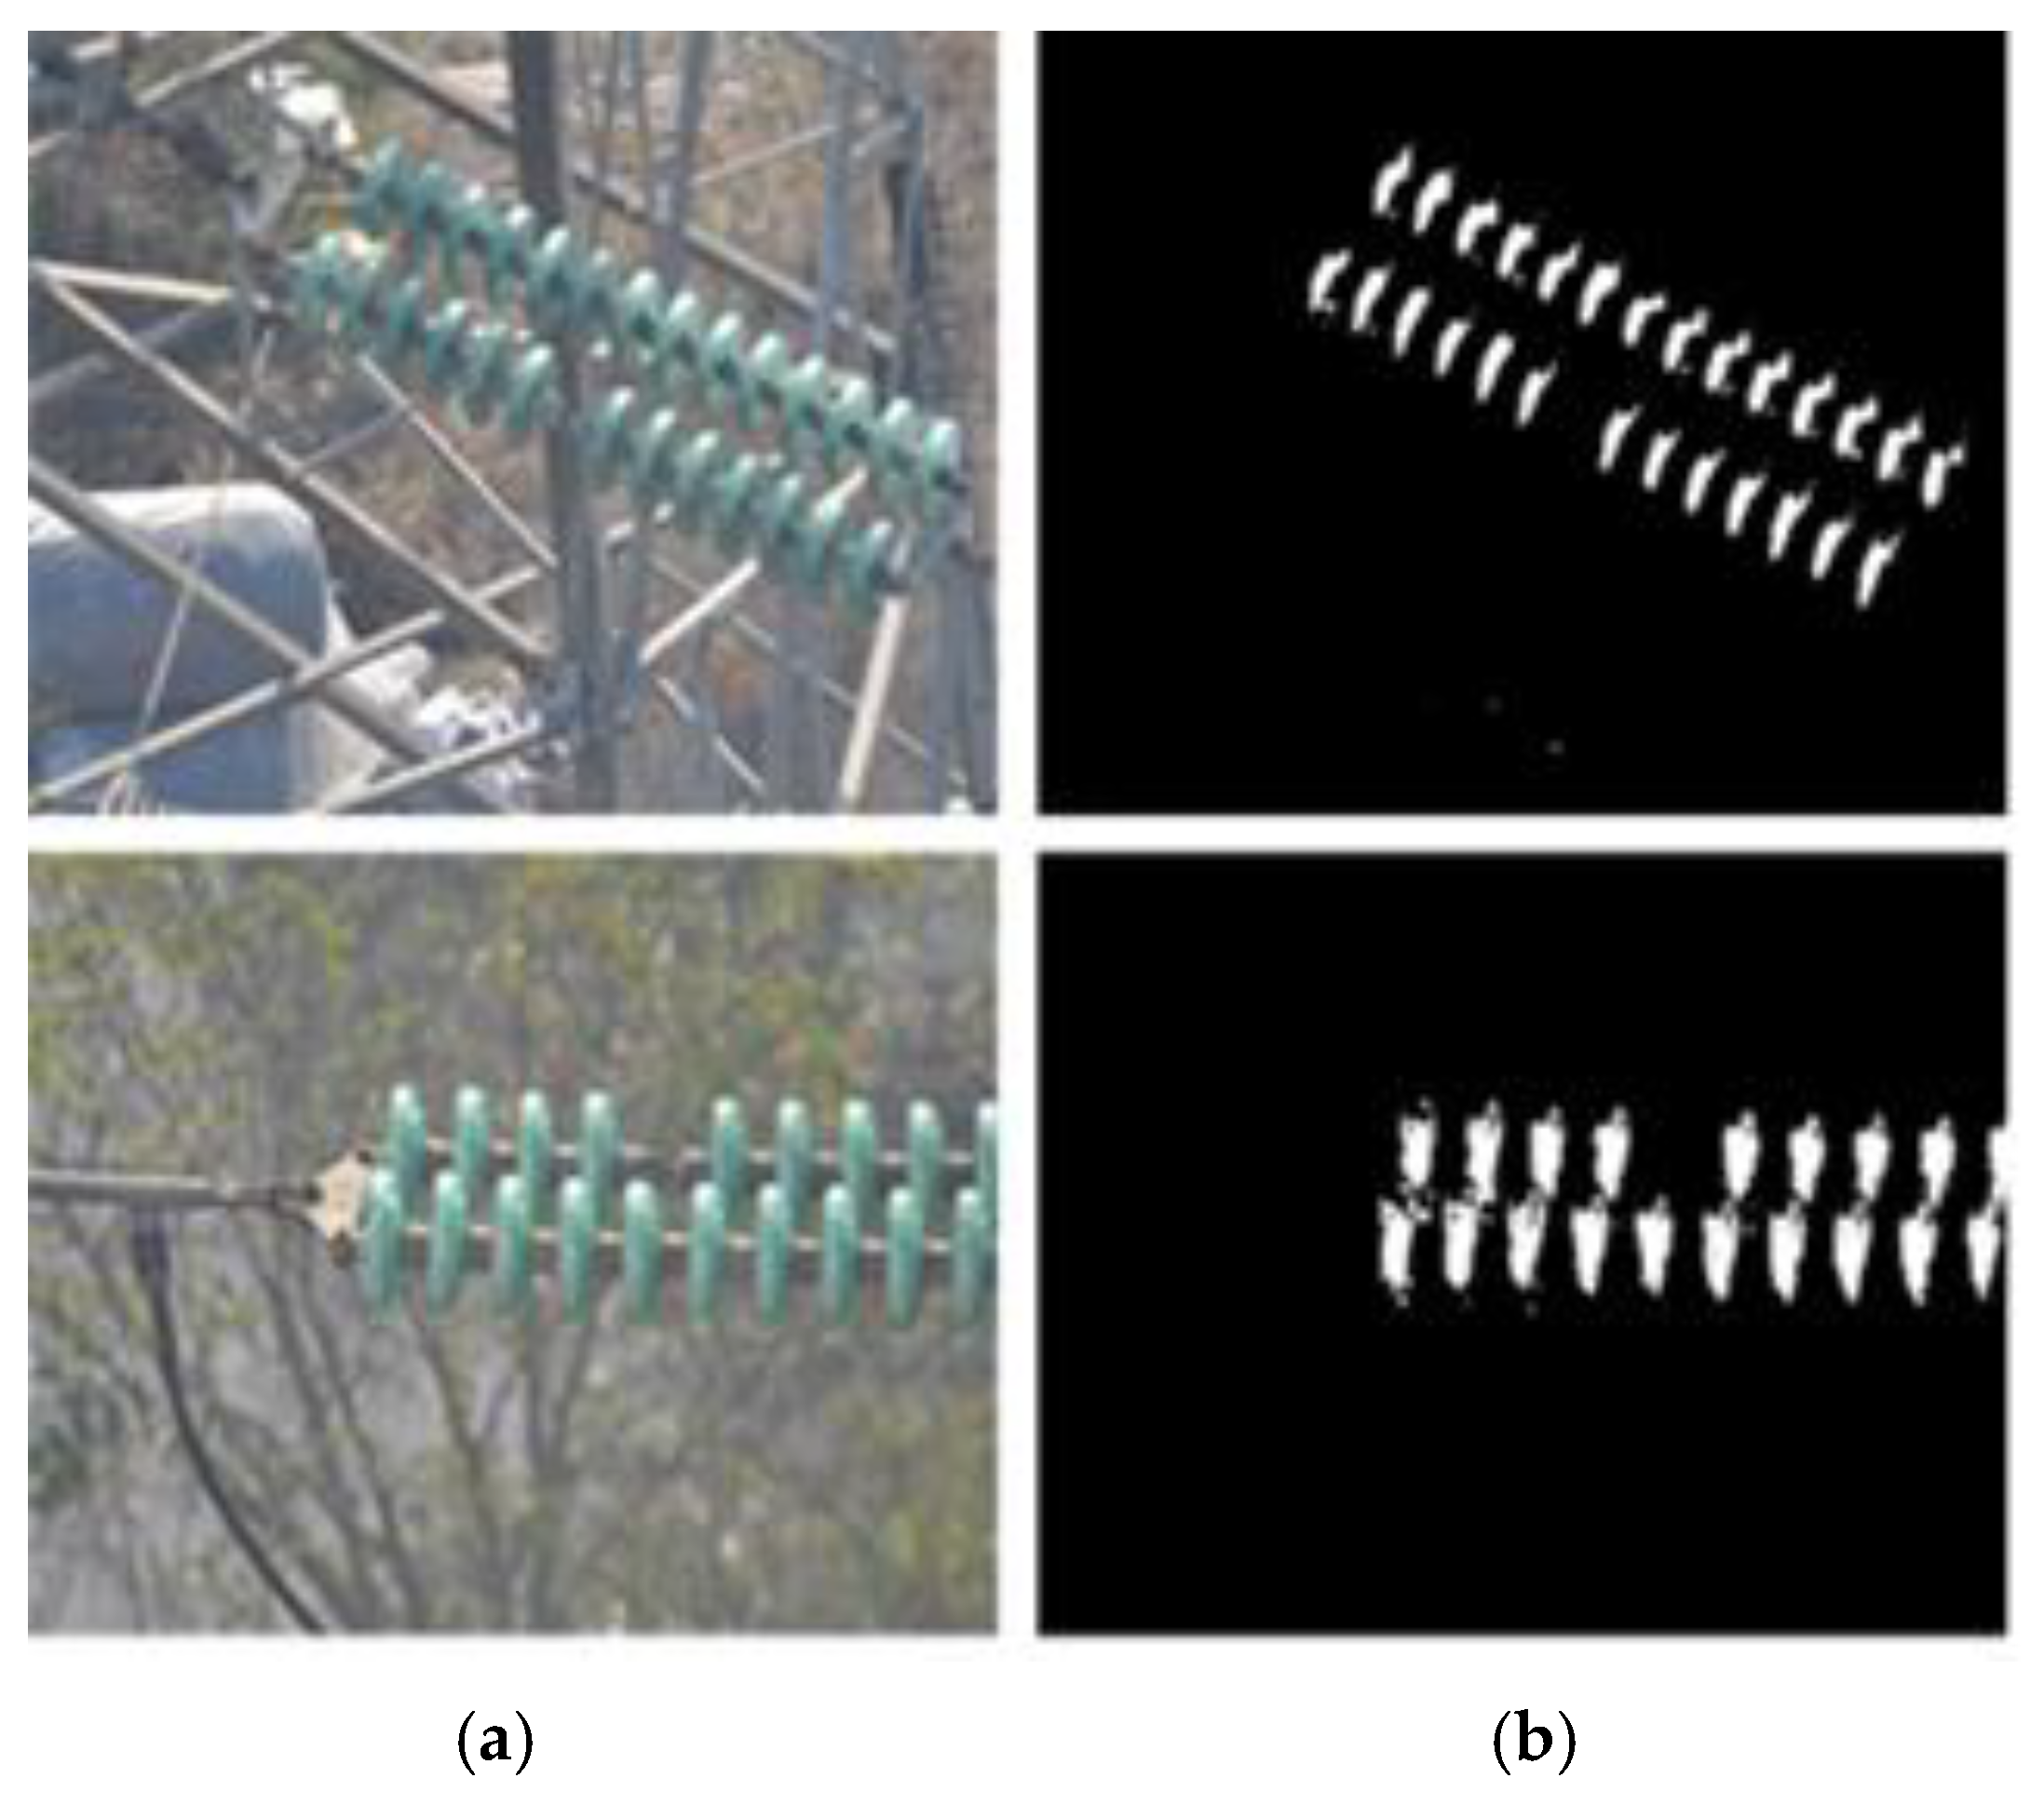
Color is an intuitive feature of objects. Glass insulators without RTV spraying have a special color. It is generally green and very different to most background colors. Therefore, insulator images can be segmented according to their color features.
The authors of References [
17,
21] segmented insulator images using single thresholds in Lab space and HSI space, respectively. Because of the complex background in insulator images, it is difficult to achieve a good segmentation effect with a single threshold.
Inspection images collected by UAVs are usually RGB space images. In this paper, the R, G and B components of 150 glass insulator images were sampled, respectively, and their spatial distribution features were statistically analyzed. The color distribution rules of the glass insulators were as follows:
where
R,
G and
B are the component values of red, green and blue, respectively.
The threshold values of the
R,
G and
B components are set by Equation (1). Thus, the glass insulators can be easily separated from the complex background.
Figure 2 shows the segmentation results of aerial insulator images according to Equation (1). Although the backgrounds of the two images were both very complex, good segmentation results were obtained regardless of whether the insulators were obstructed or not.
2.2. Pseudo Objects Removal and Tilt Correction
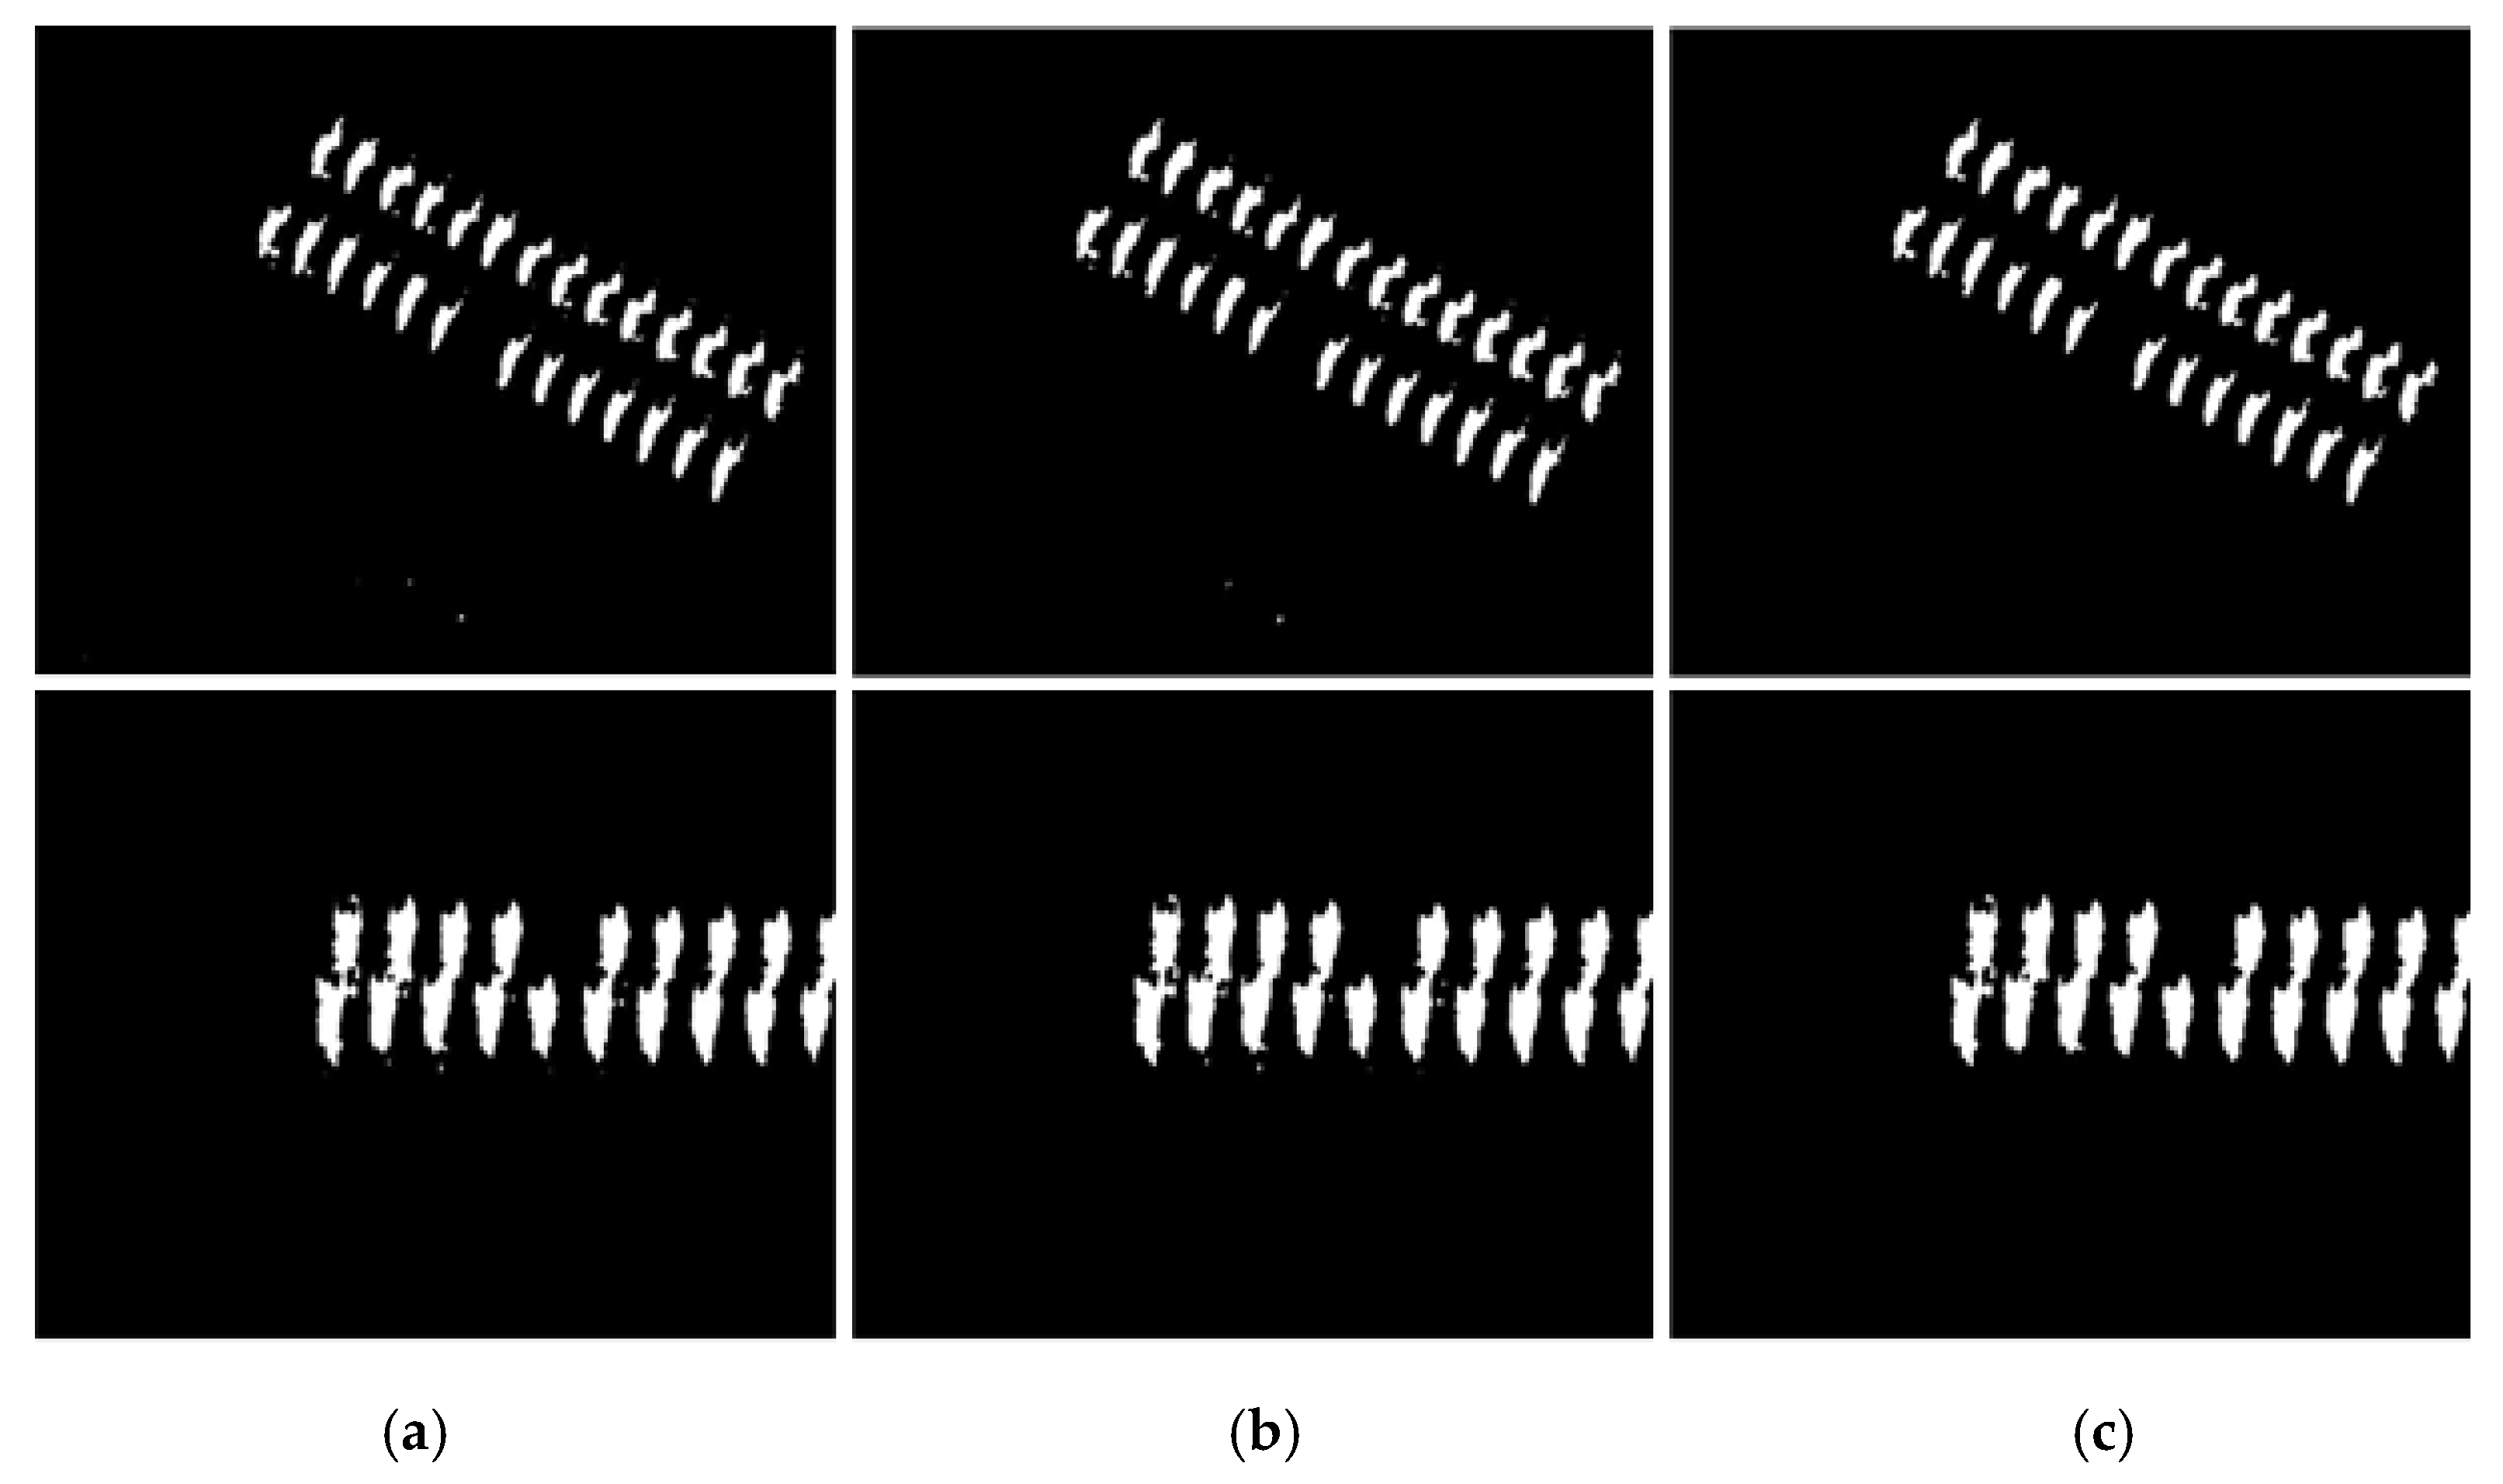
After segmentation, the insulators images were separated from the background. However, there still existed some narrow breaks and small burrs in the images. Thus, the morphological closed operation and median filter were used to process the images [
22]. After that, the small area pseudo objects were removed.
Figure 3 shows the processing results of removal of the pseudo objects.
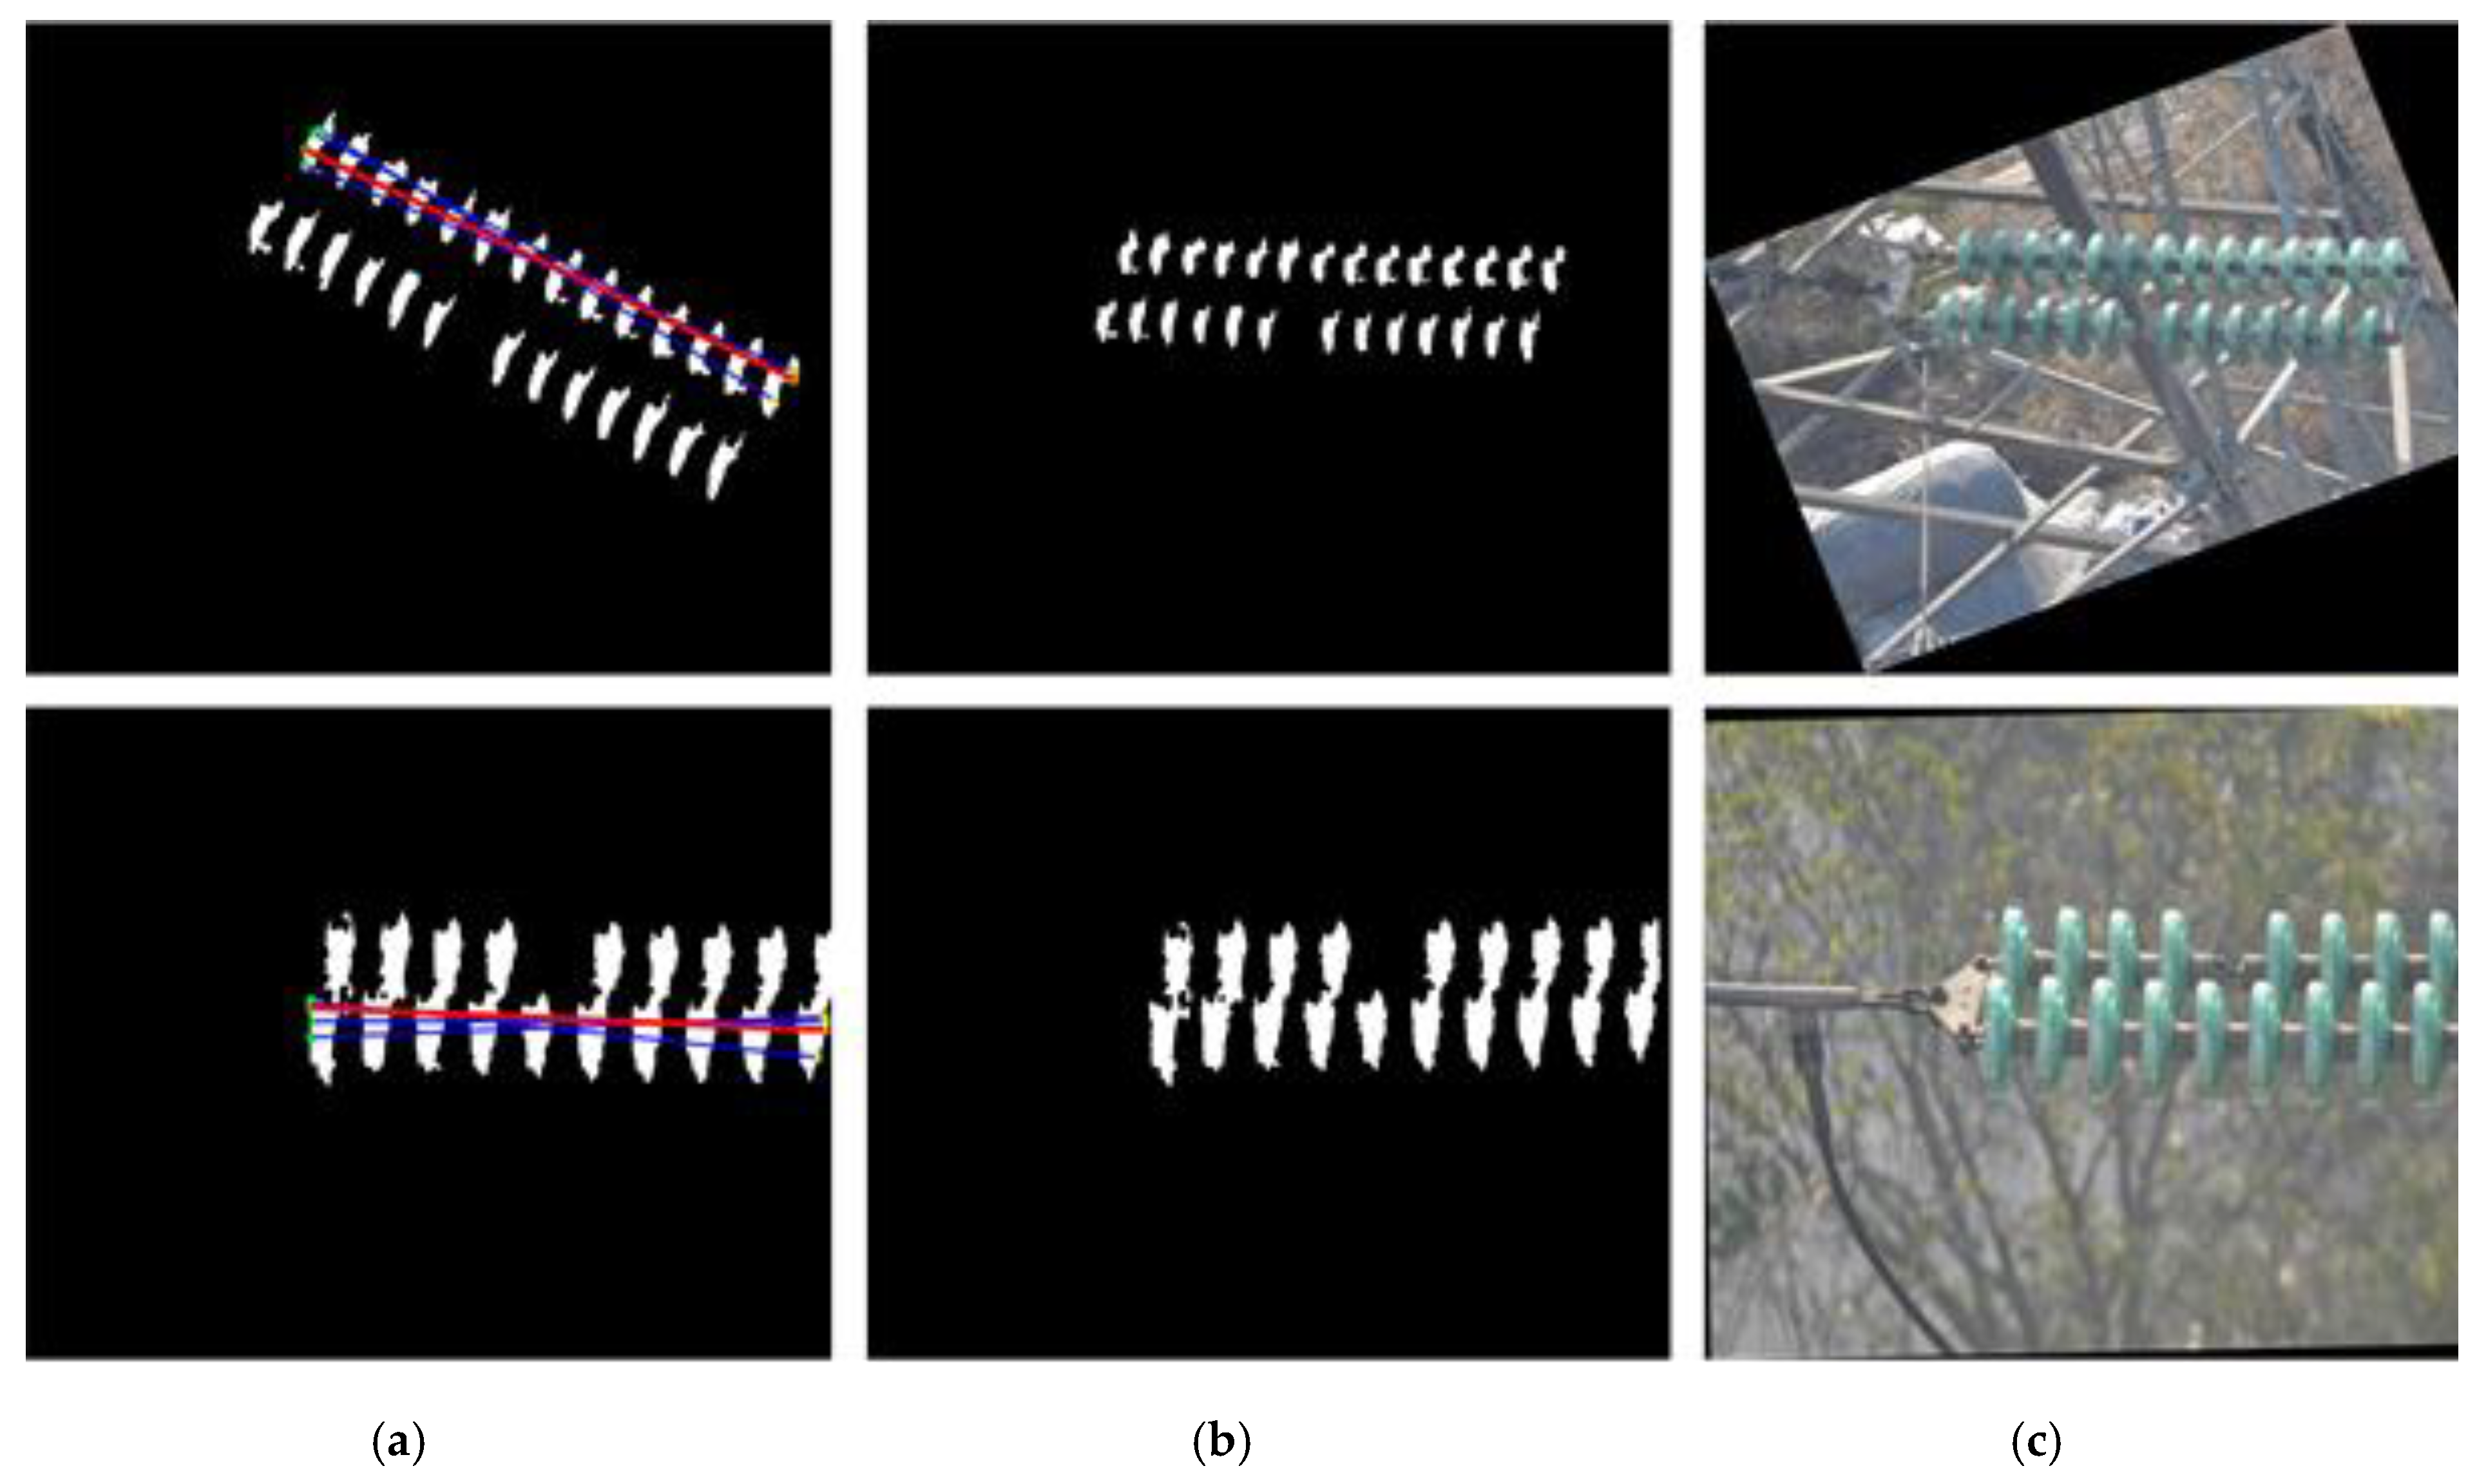
Due to the influence of the shooting angle, insulators present different angles in the image. Thus, the image needs to be corrected to locate the main axis of the insulator string in the horizontal direction. Thus, it can make preparation for the spatial feature descriptions of the insulator regions. The direction of the longest line segment is the direction of the main axis of the insulator string in the image. Thus, the inclination angle of the main axis can be obtained using the Hough transform. According to the angle, the insulator string axis can be rotated in the horizontal direction.
Figure 4 shows the processing results of tilt correction.
It can be seen from
Figure 3 and
Figure 4 that effective binarization images were obtained after image compound binarization. The contours of the insulators may be incomplete, but the spatial distribution of the insulator regions can be expressed regardless of if the insulators are obstructed or not.
3. Self-Shattering Defect Detection of Insulators
3.1. Spatial Features Description of Insulators
An insulator string is composed of a main shaft and a certain number of insulators. The insulators are perpendicular to the main shaft. The insulators on the same string have the same shape, size and color, and the distances between the adjacent umbrella skirts of the insulators are equal. All these characteristics indicate that insulators have consistent spatial features.
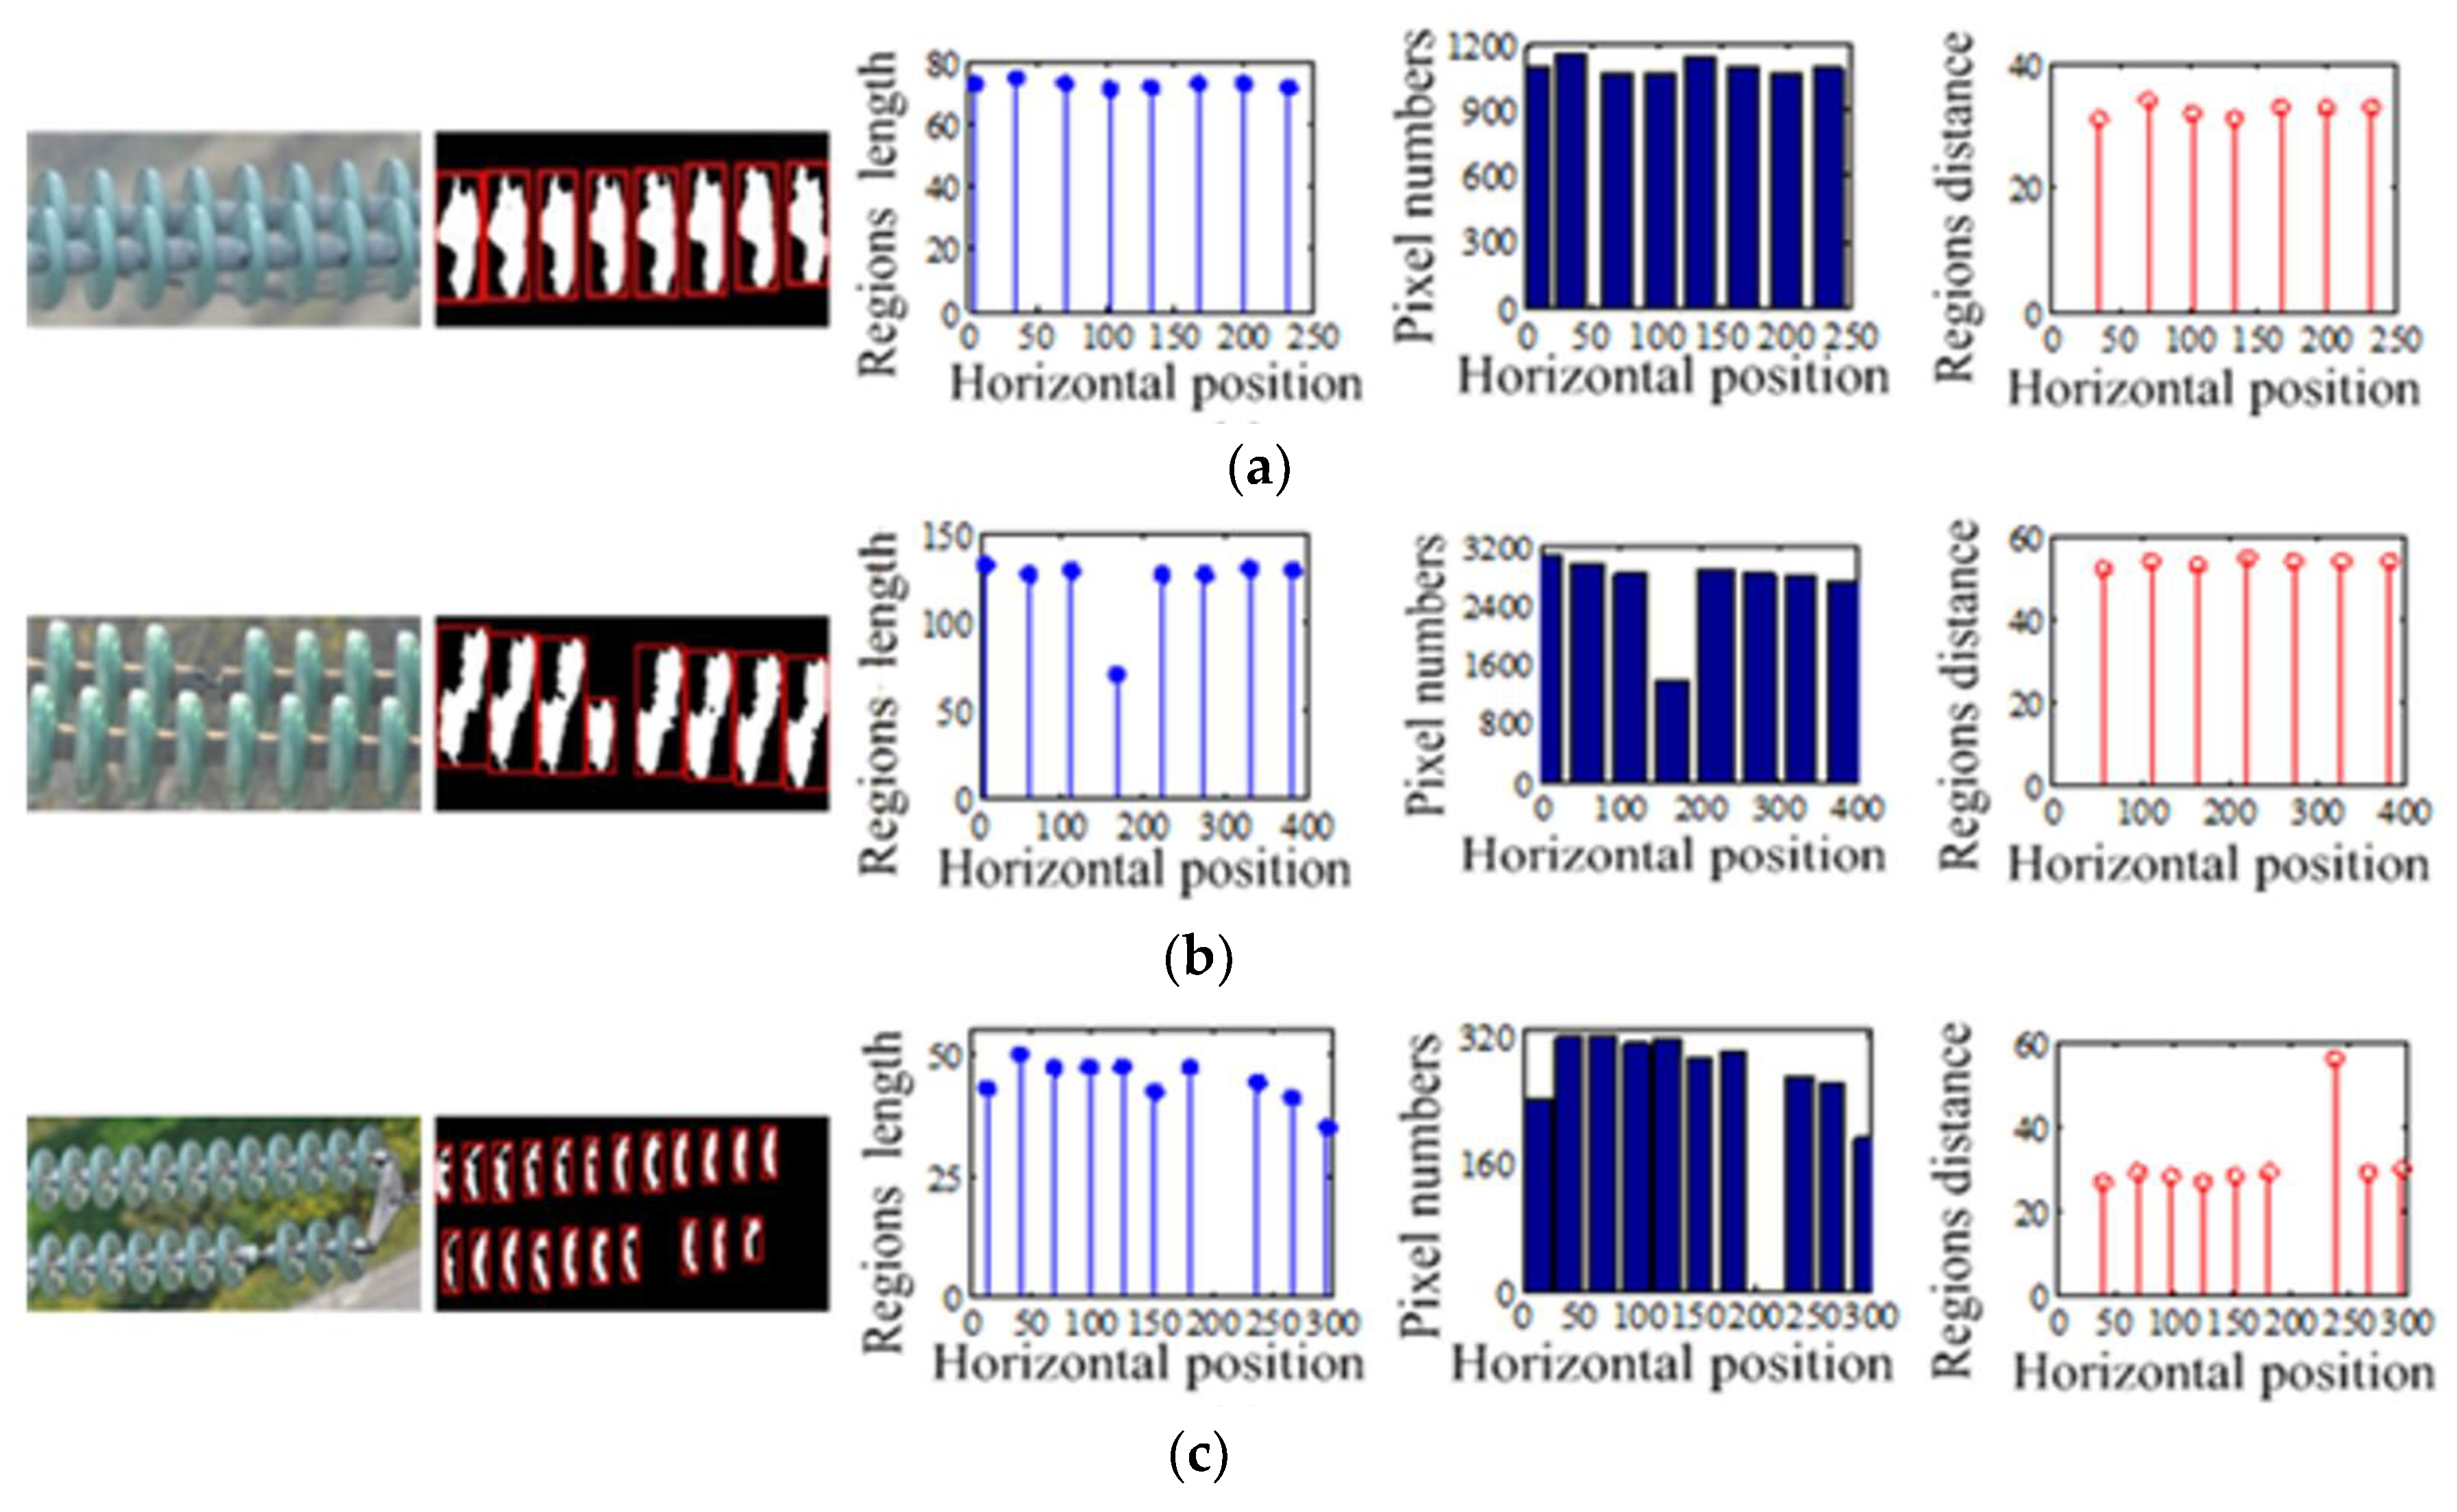
In order to represent the spatial features, the connected regions of the binary images are marked. The connected regions of normal insulators have three obvious features: (1) the vertical lengths of each connected region are close; (2) the number of insulator pixels in the region varies little; and (3) the horizontal distances between adjacent connected regions are very similar. In addition, the numerical distributions of the above three values are relatively uniform, as shown in
Figure 5a. In
Figure 5, the first row contains inspection images, corresponding connected regions of insulators are given in the second row, and the vertical length, the number of insulator pixels and the horizontal distance are in the third to the fifth rows, respectively.
When a self-shattering defect occurs, the spatial consistency of the insulator regions is destroyed, and spatial features change significantly. There are generally two cases of spatial locations of the twin insulator strings in the images. One is that the front string obstructs the back one, and the twin strings cannot be divided into individual strings in the image. Another situation is that the two insulator strings are not obstructed by each other, thus they can be separated into two strings. In the first situation, when the self-shattering defect occurs, the vertical lengths and the numbers of insulator pixels of the connected region are obviously smaller than those in the normal regions. Additionally, the numerical values are abruptly changed, as shown in
Figure 5b. In the second situation, two insulator strings can be treated separately. When the self-shattering defect occurs, the horizontal distance between the connected regions on both sides of the defective insulator is obviously greater than those of other adjacent regions, and there is a clear jump, as shown in
Figure 5c (
Figure 5c presents the spatial features of the insulator string on which self-shattering occurs).
As can be seen from
Figure 5, the spatial features of the self-shattering insulators are very different from the normal insulators. Therefore, the self-shattering defect can be discriminated according to the vertical lengths of the connected region, the number of insulator pixels in the region, and the horizontal distances between the adjacent regions.
3.2. Self-Shattering Defect Detection
3.2.1. Spatial Features Determination of Insulator Connected Regions
Following the above image processing, the main axis of the insulator string has been tilted in the horizontal direction. Then, the connected regions of the insulators are located using the 8-adjacency connected region method. For convenience of description, the connected region of each insulator is described by a four-dimensional vector . Where and correspond to the start point coordinates of the connected region on the x-axis and y-axis with the origin at the upper left corner, and , represent the horizontal width and vertical length of the region, respectively.
Based on analysis of the insulator spatial features, three spatial features, which characterize the connected regions of the insulators, are constructed as follows:
- (1)
Vertical length : The vertical length of the connected region of the insulator.
- (2)
Number of insulator pixels : The area of the connected region of the insulator.
- (3)
Horizontal distance between two adjacent connected regions
:
where
is the number of connected regions,
is the horizontal coordinate of the starting point of the
connected region.
3.2.2. Self-Shattering Defect Discriminant Definition
After determining the three spatial features of the insulators connected regions, self-shattering defect discrimination can be performed. Corresponding to the former two insulator string location situations, through statistical analysis, the
and
are summarized respectively in Equations (3) and (4):
where
and
are the average of
and
, respectively.
where
is the average of
.
When discriminant1 or discriminant2 is satisfied, it can be concluded that insulator self-shattering has occurred.
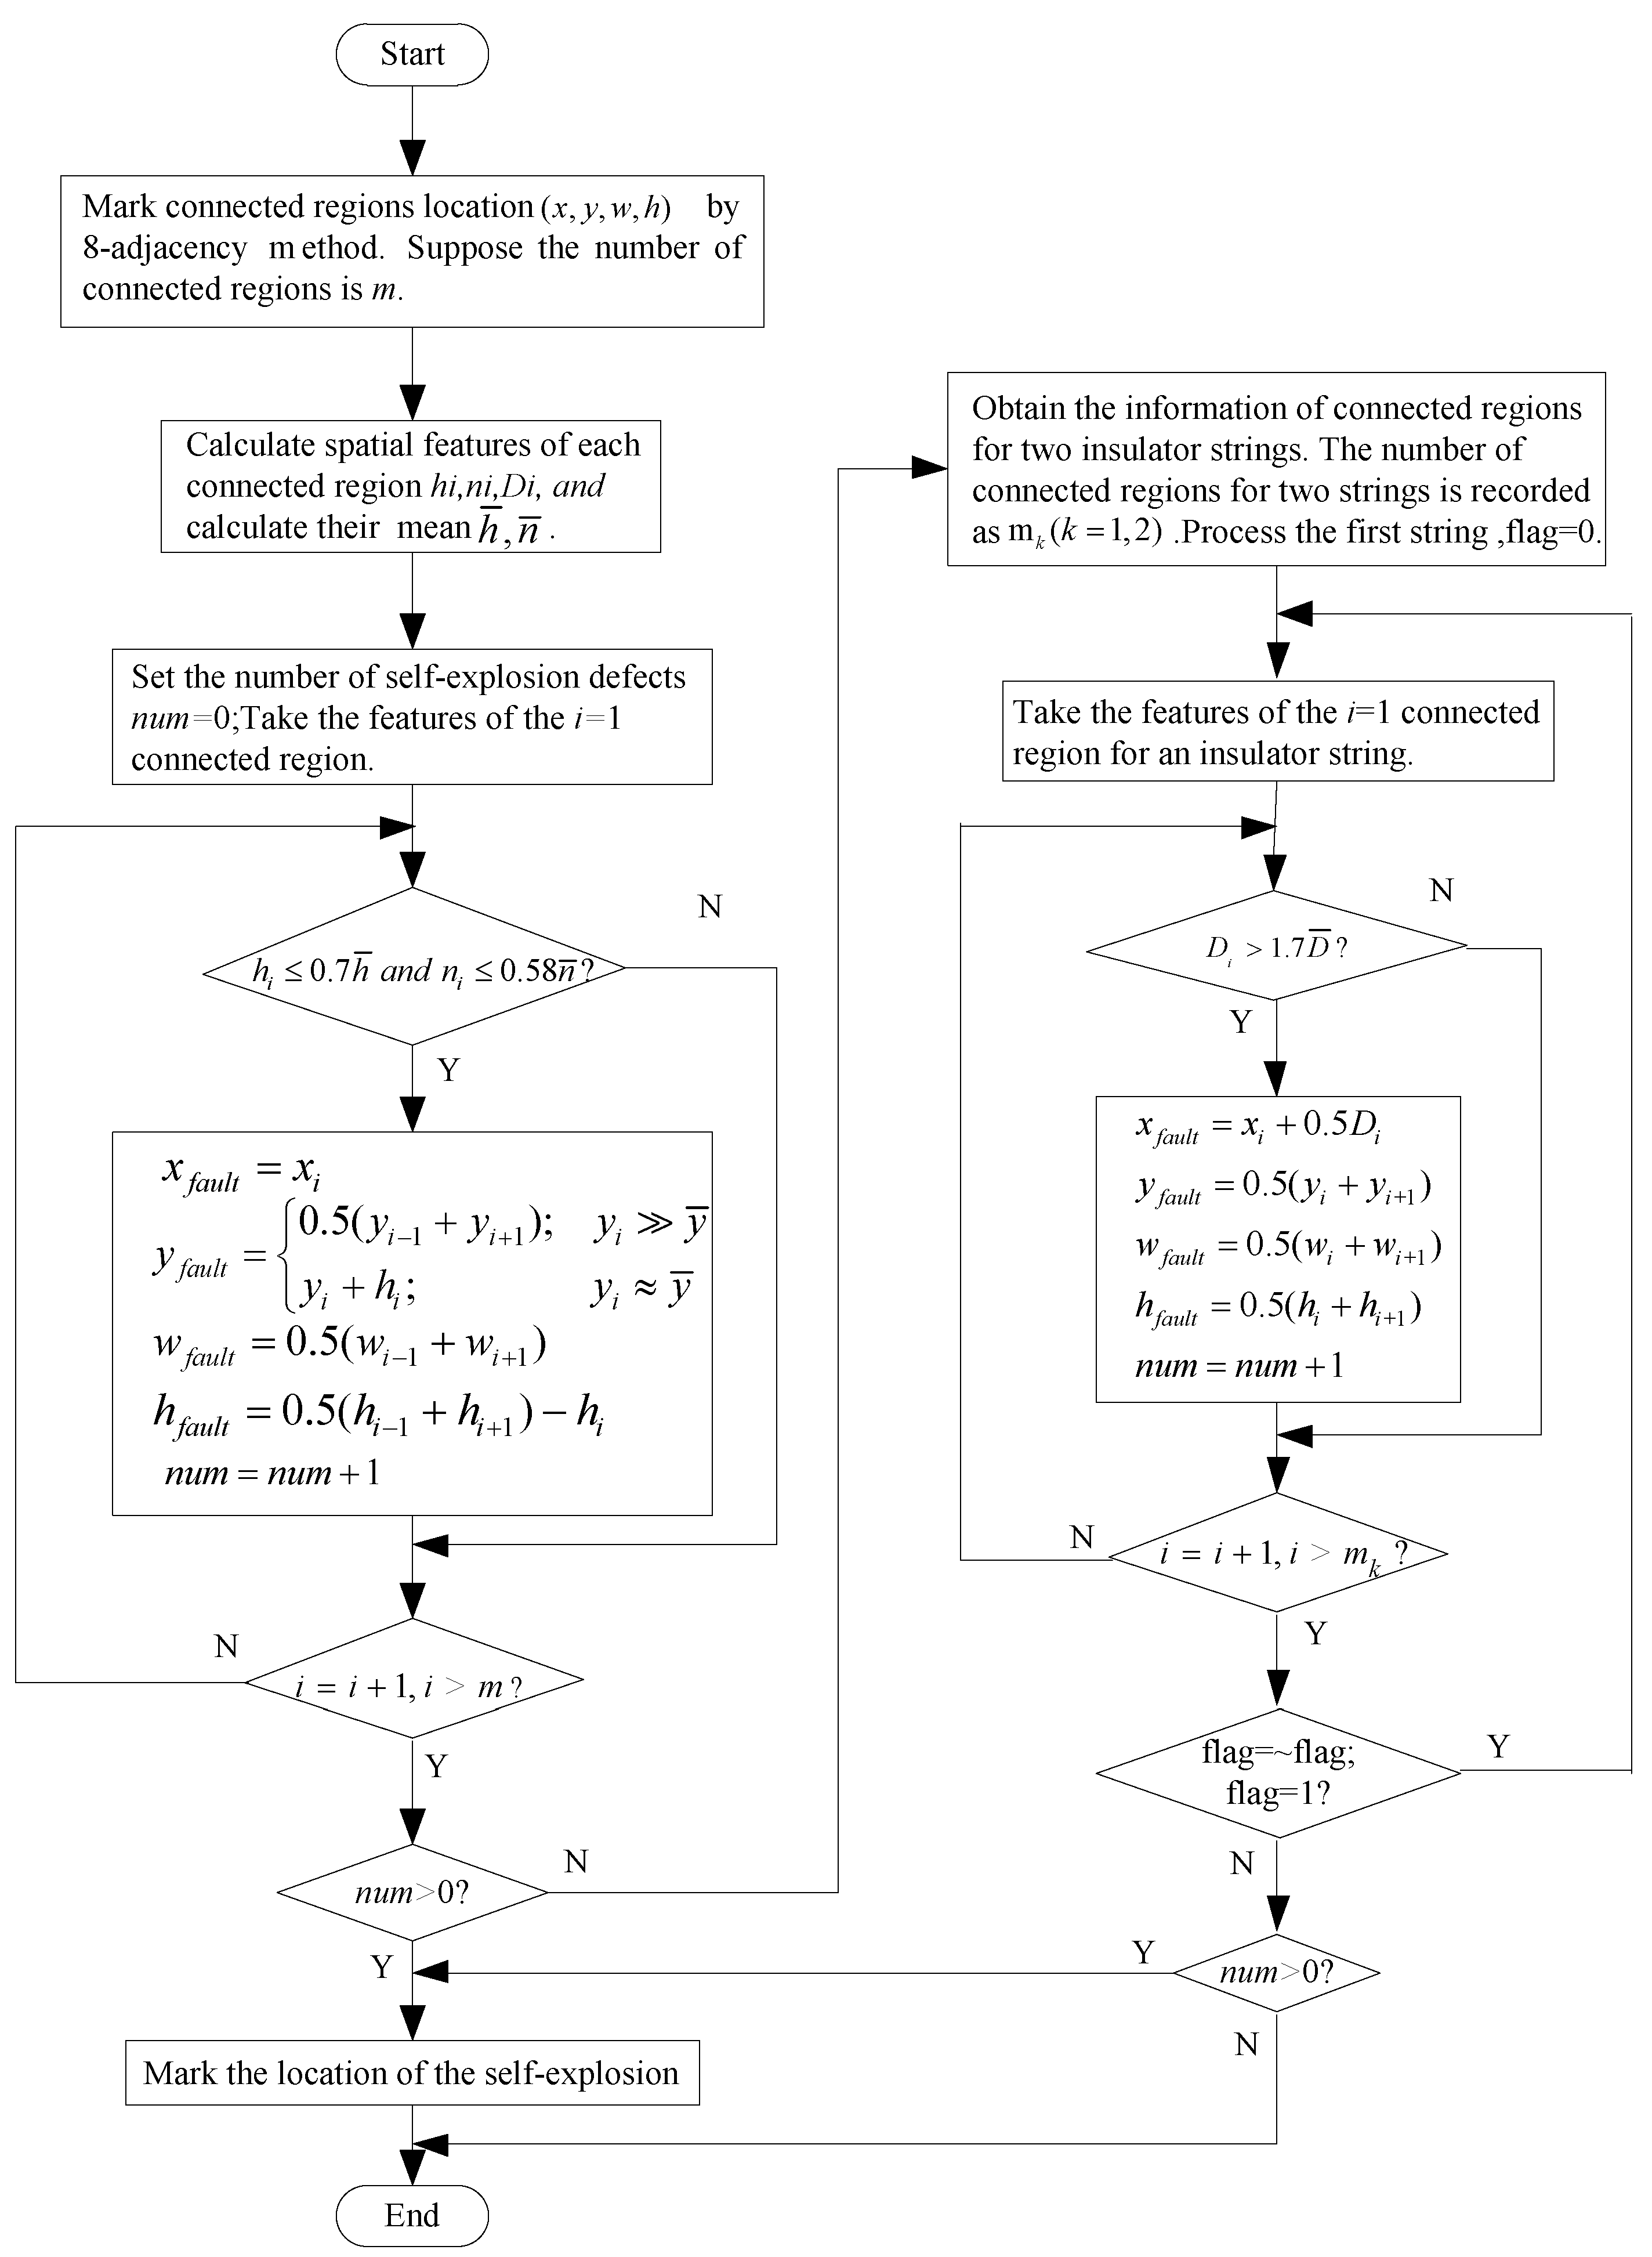
3.2.3. Self-Shattering Defect Localization
When the spatial features of the twin insulator strings satisfy
, the latter insulator string is obstructed, and self-shattering may occur in either string. Thus, the defect location can be obtained by Equations (5)–(8).
where
is the average of
. For special cases, when self-shattering occurs at both ends of an insulator string, Equation (9) is used:
When the spatial features of the twin insulator strings satisfy
, the insulators are not obstructed by each other. Thus, Equations (10)–(13) are adopted to calculate the defect location coordinates:
When there is no overlap between the twin insulator strings, they will be processed separately. In this case, if self-shattering occurs at both ends of one insulator string, the self-shattering defect can be judged based on the difference between the connected region numbers of the two insulator strings.
Figure 6 shows a flow chart of the self-shattering defect detection process after image compound binarization.
When the back insulators are obstructed, the main pseudo code of the self-shattering detection is as follows (Algorithm 1):
| Algorithm 1. Self-shattering detection process with obstructed. |
| Input: binarization image bwsrc |
| Output: Self-shattering location |
| 1: | |
| 2: | |
| 3: | |
| 4: | |
| 5: | |
| 6: | |
| 7: | |
| 8: | |
| 9: | |
| 10: | |
| 11: | |
| 12: | fordo |
| 13: | if |
| 14: | |
| 15: | |
| 16: | |
| 17: | |
| 18: | if |
| 19: | |
| 20: | else |
| 21: | end if |
| 22: | end if |
| 23: | end for |
| 24: | fordo |
| 25: | |
| 26: | end for |
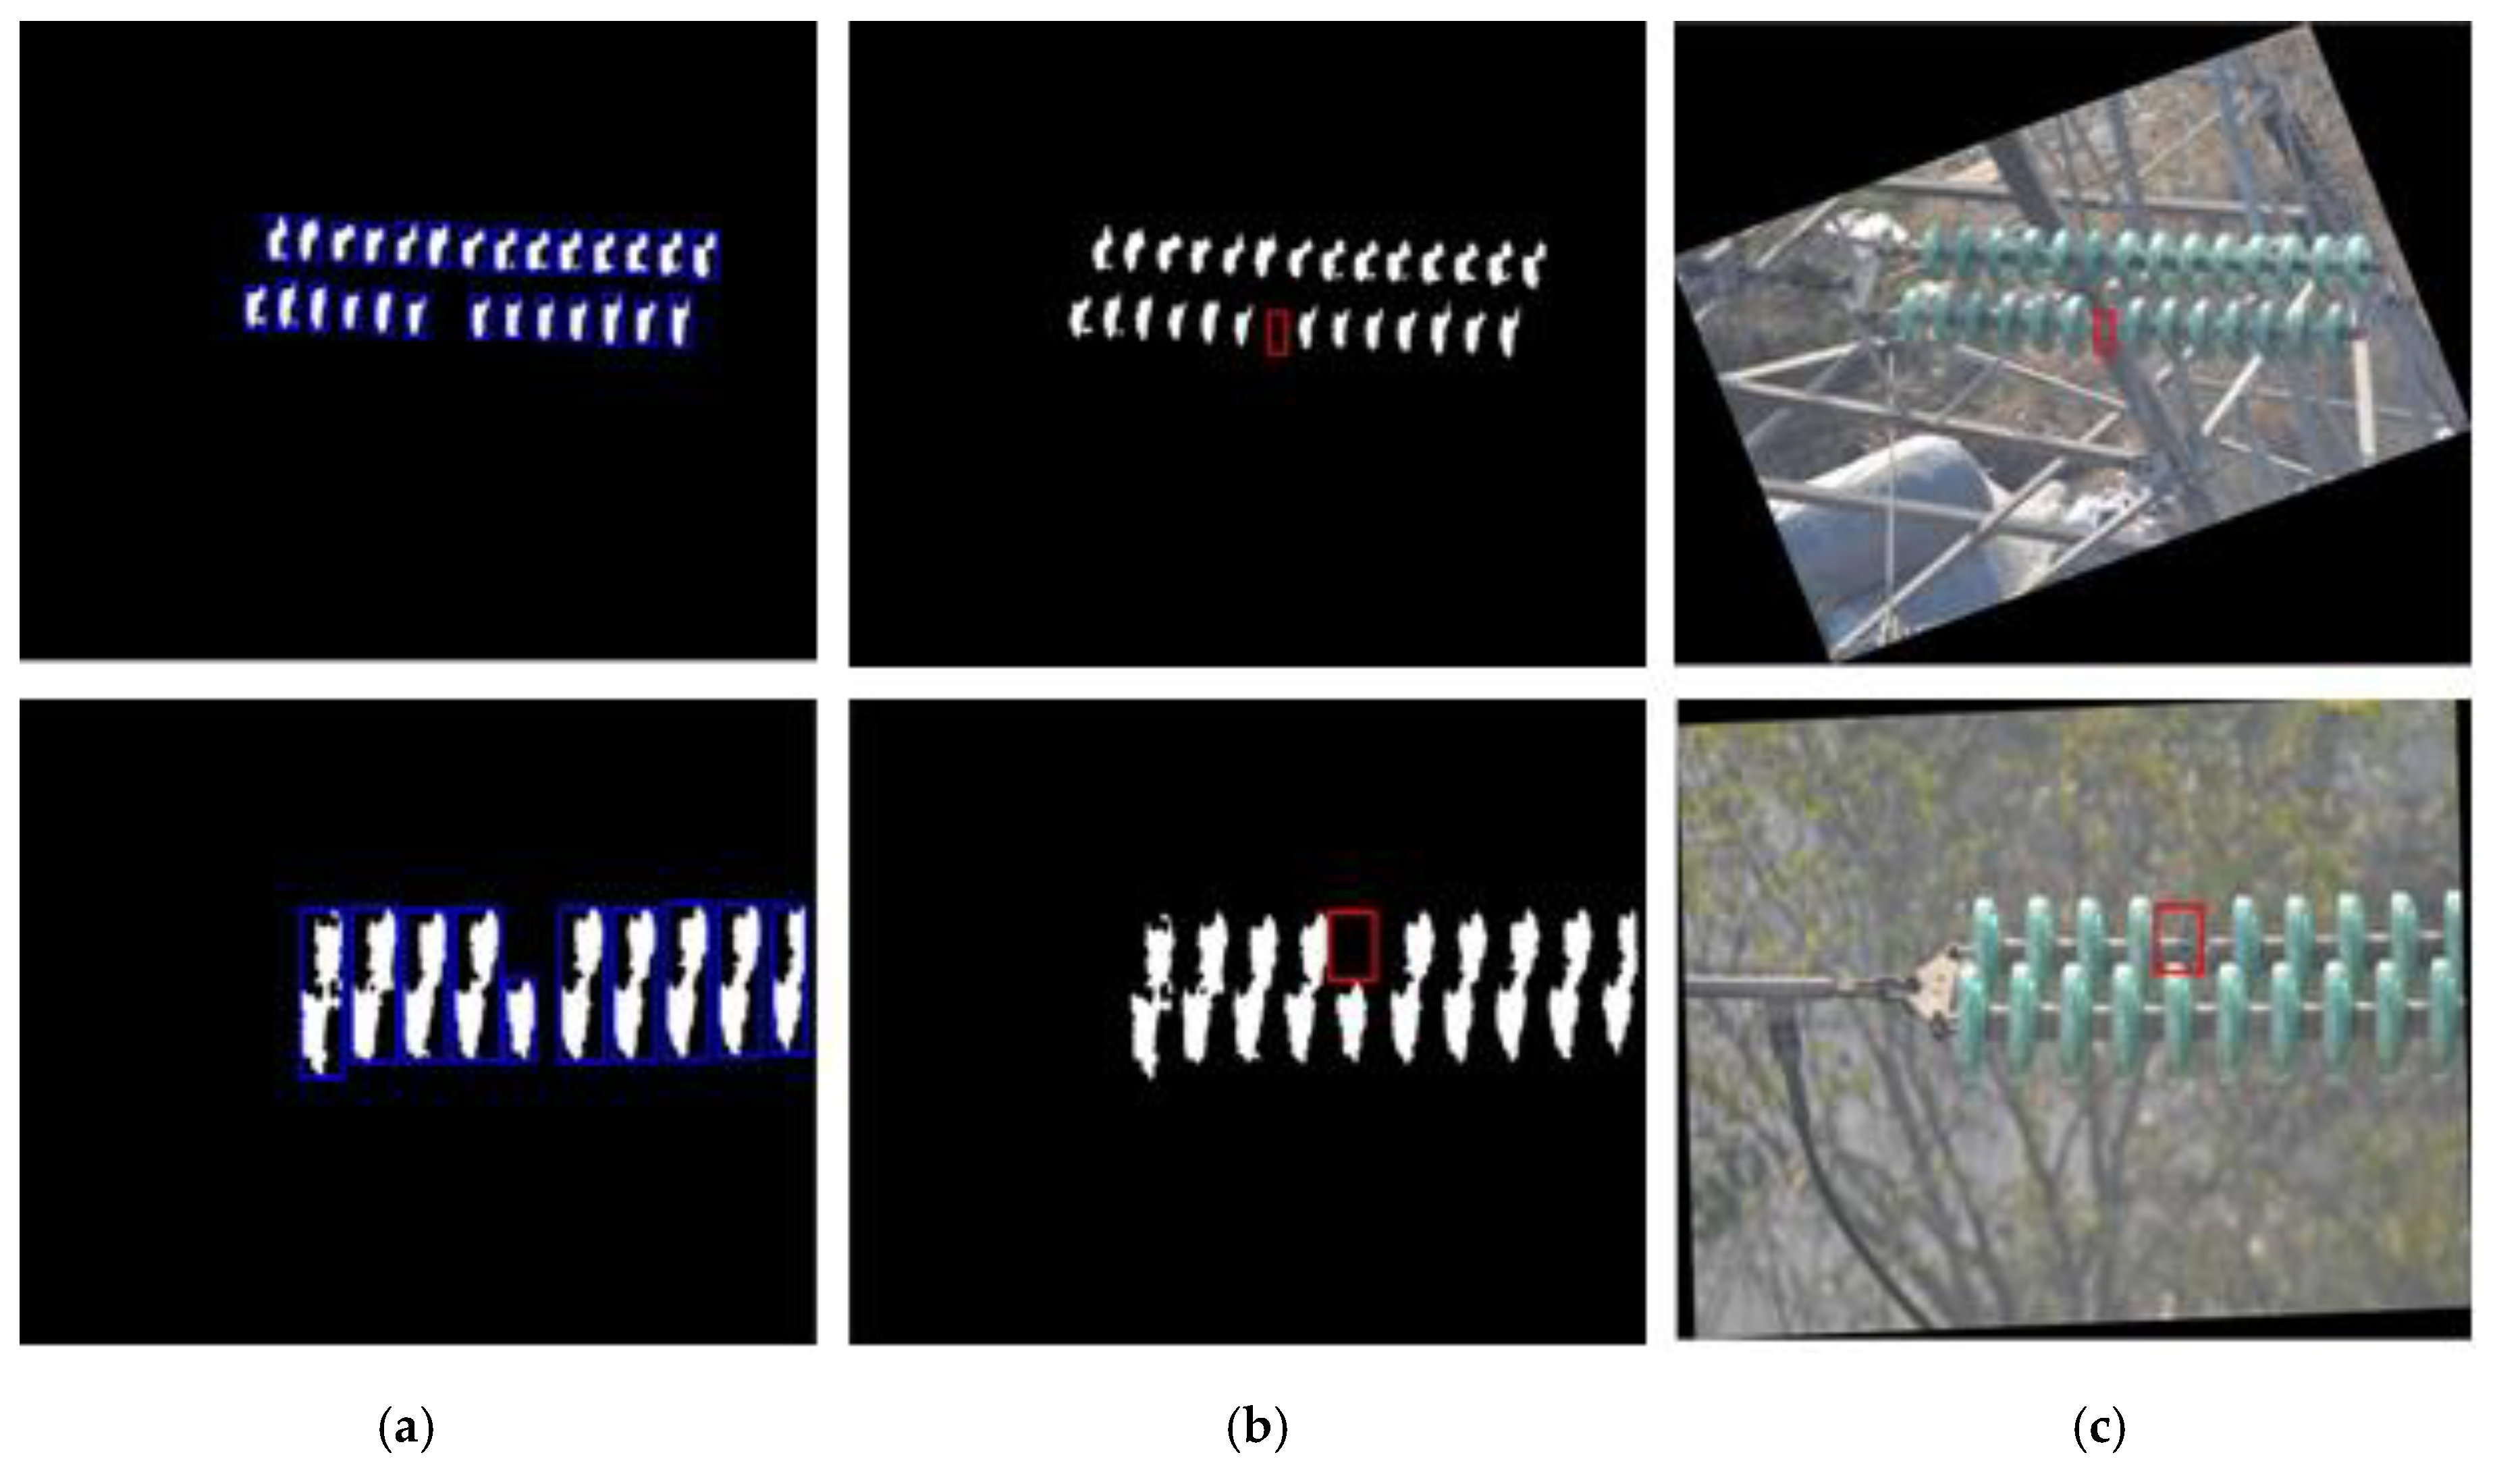
The self-shattering location detected by the proposed method is illustrated in
Figure 7.
4. Experimental Results and Analysis
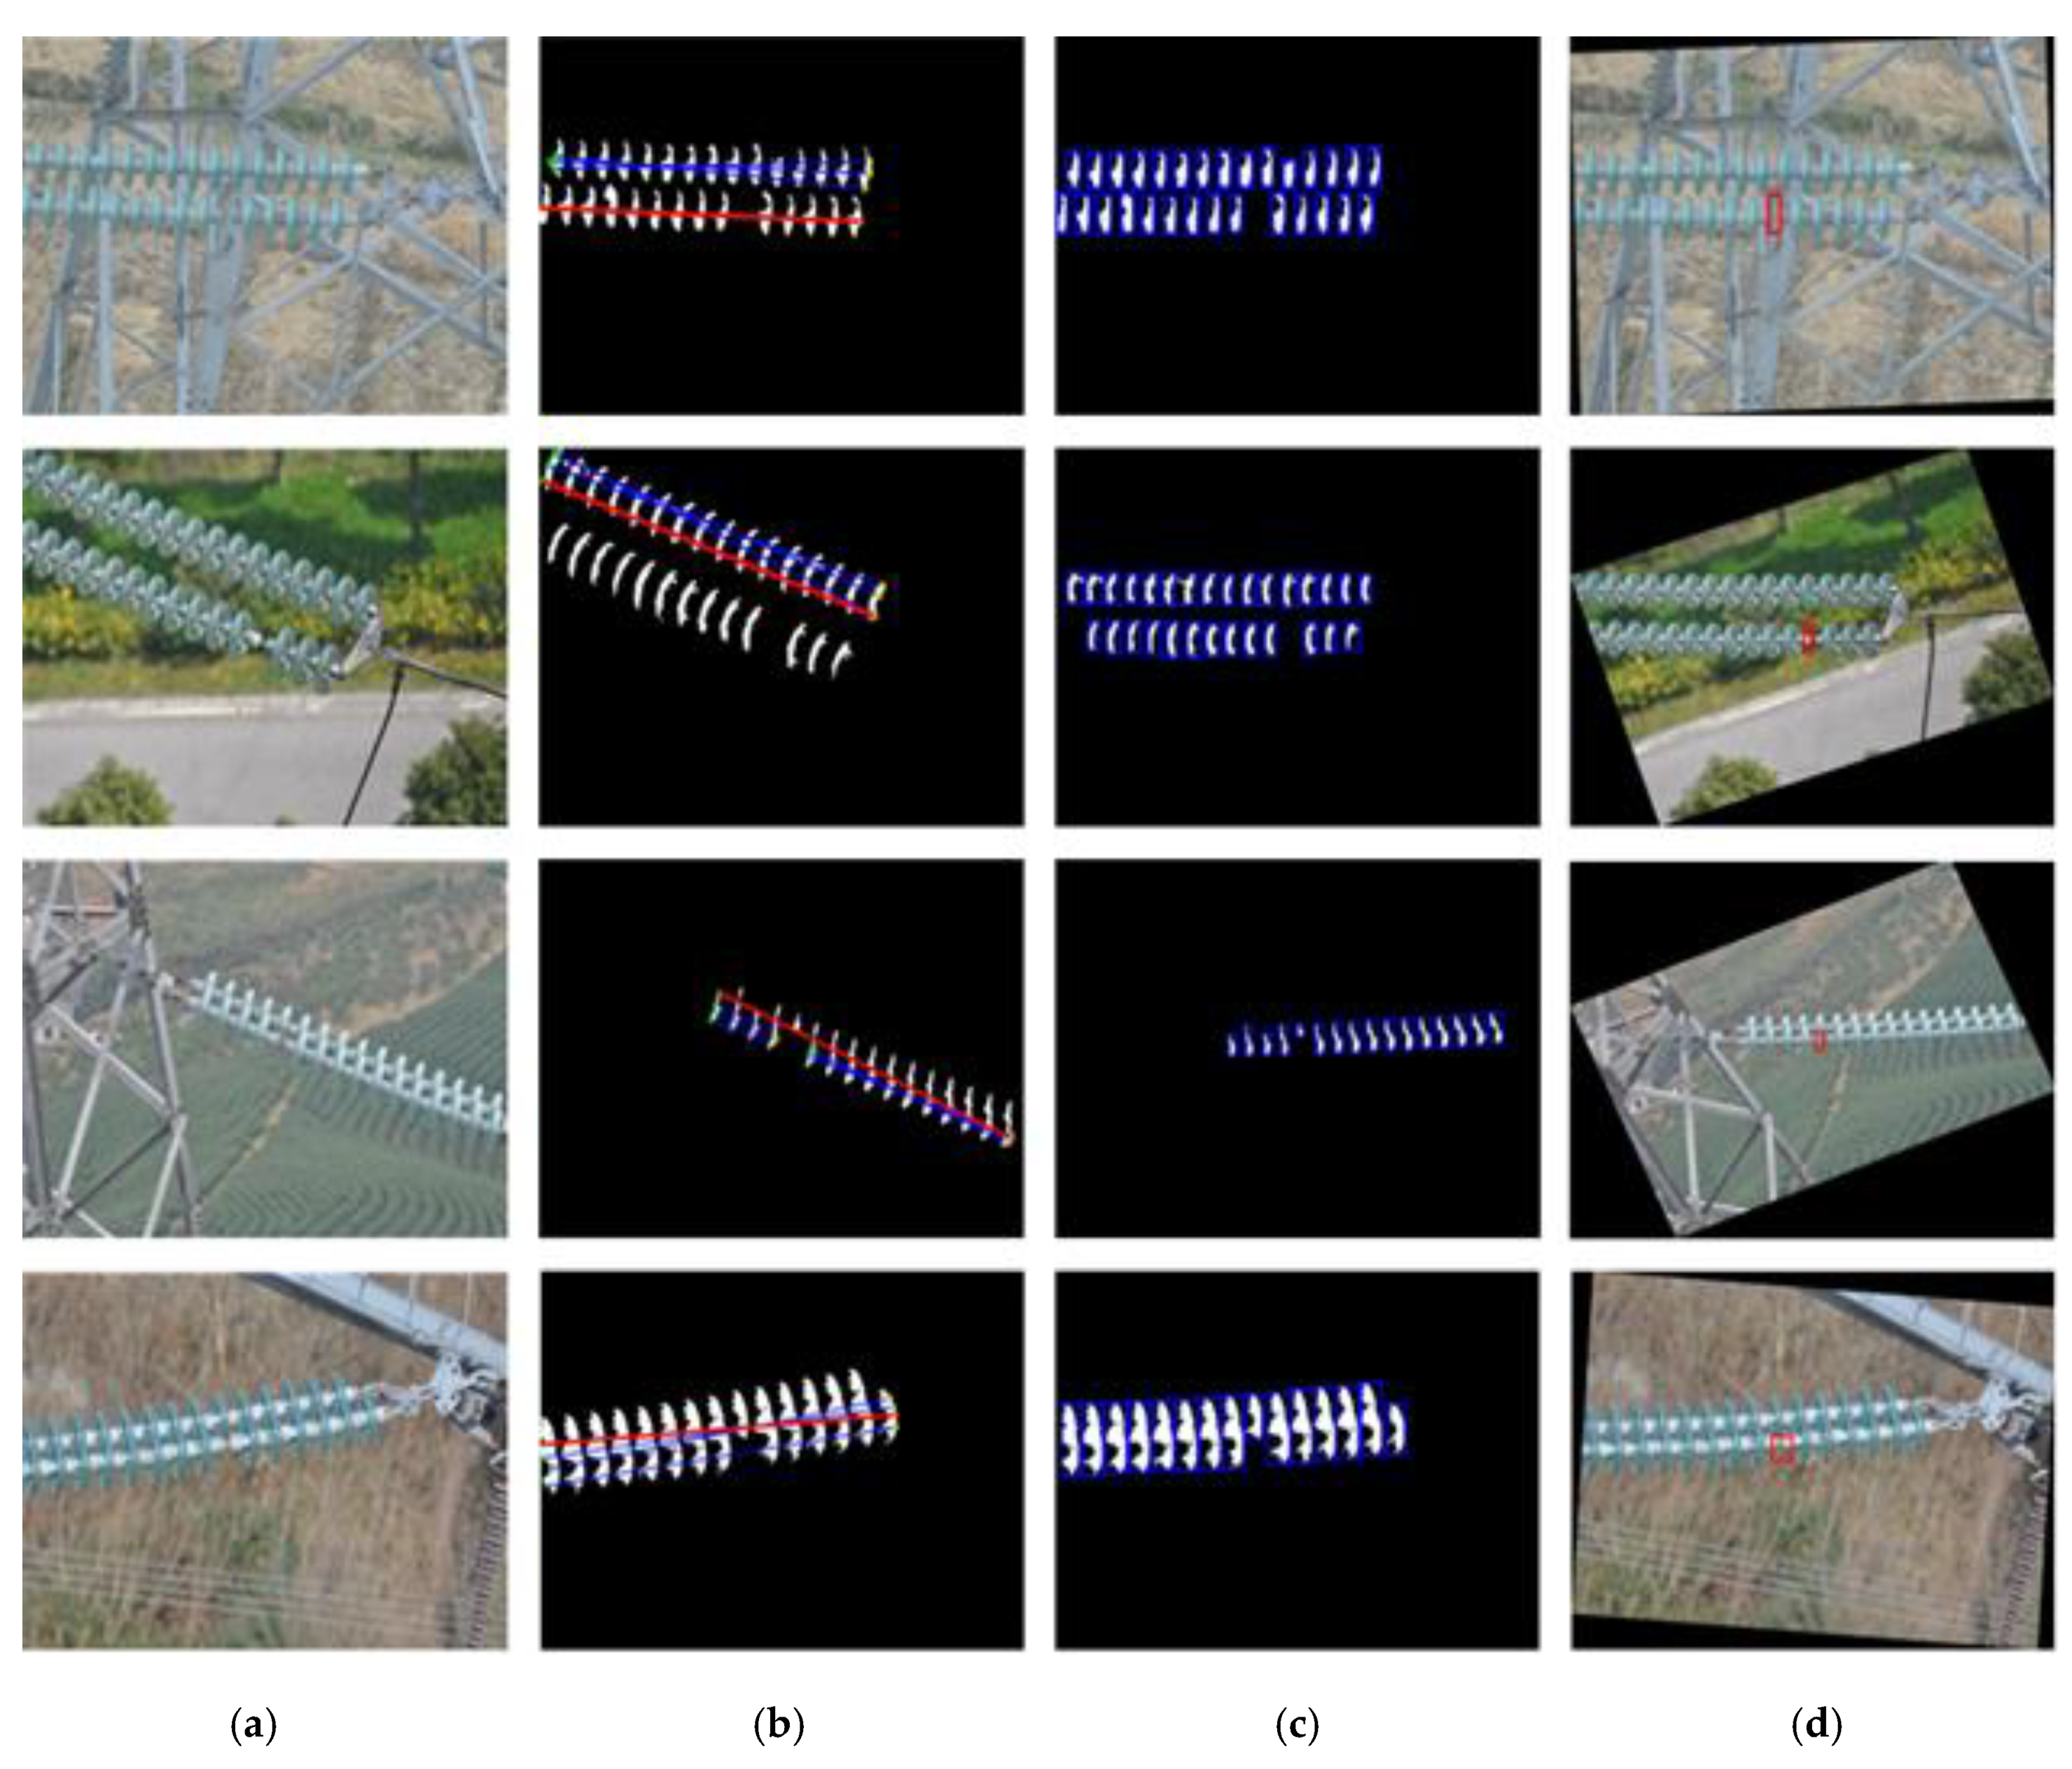
4.1. Self-Shattering Detection and Localization Results Analysis
Experiments were conducted to evaluate the proposed method with real inspection images collected by UAVs. The experiment environments included the Windows 7 operating system with a CPU main frequency of 3.40 GHz, 4.00 GB RAM, and MATLAB 2015b.
Figure 8 presents a part of the experimental results. The results show that the proposed method efficiently detected and located the insulator self-shattering defects.
4.2. Robustness Analysis
In this section, the robustness of the proposed method is analyzed through comparison with existing insulator self-shattering defect detection methods.
4.2.1. Detection Effect under Different Obstructed Conditions
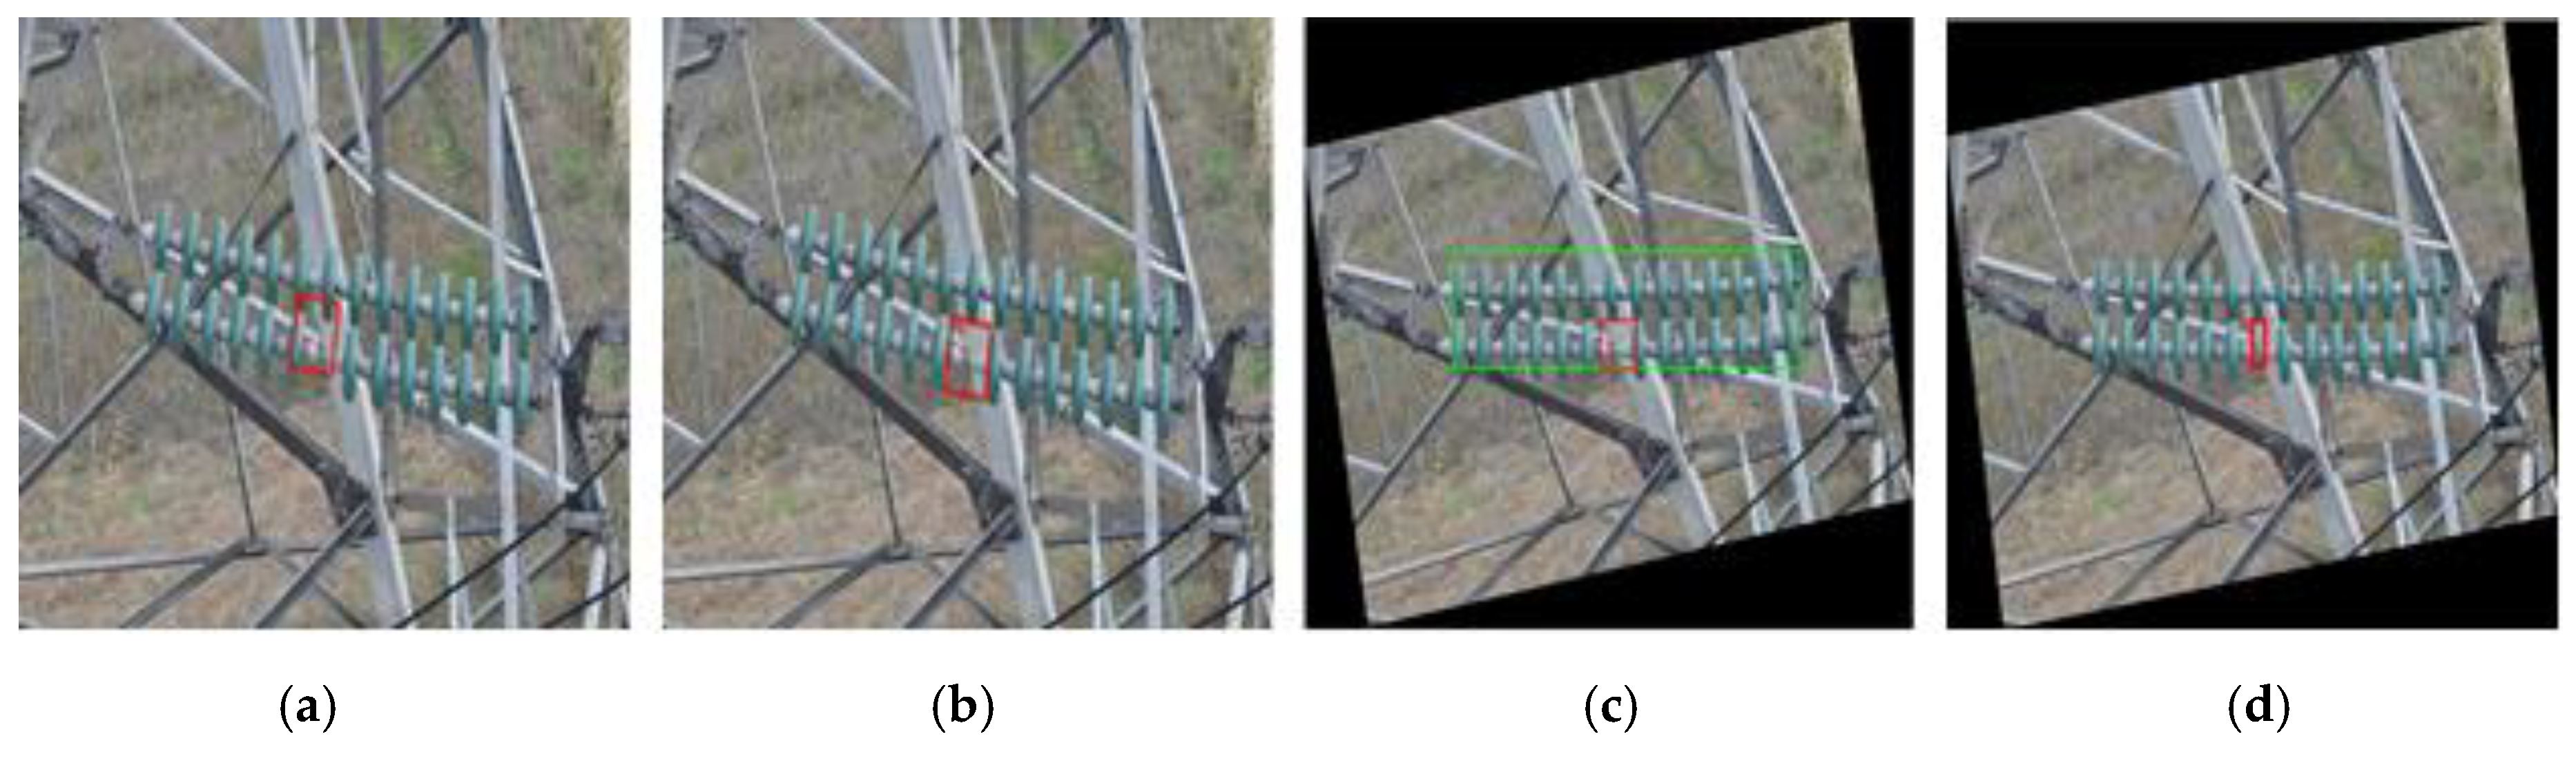
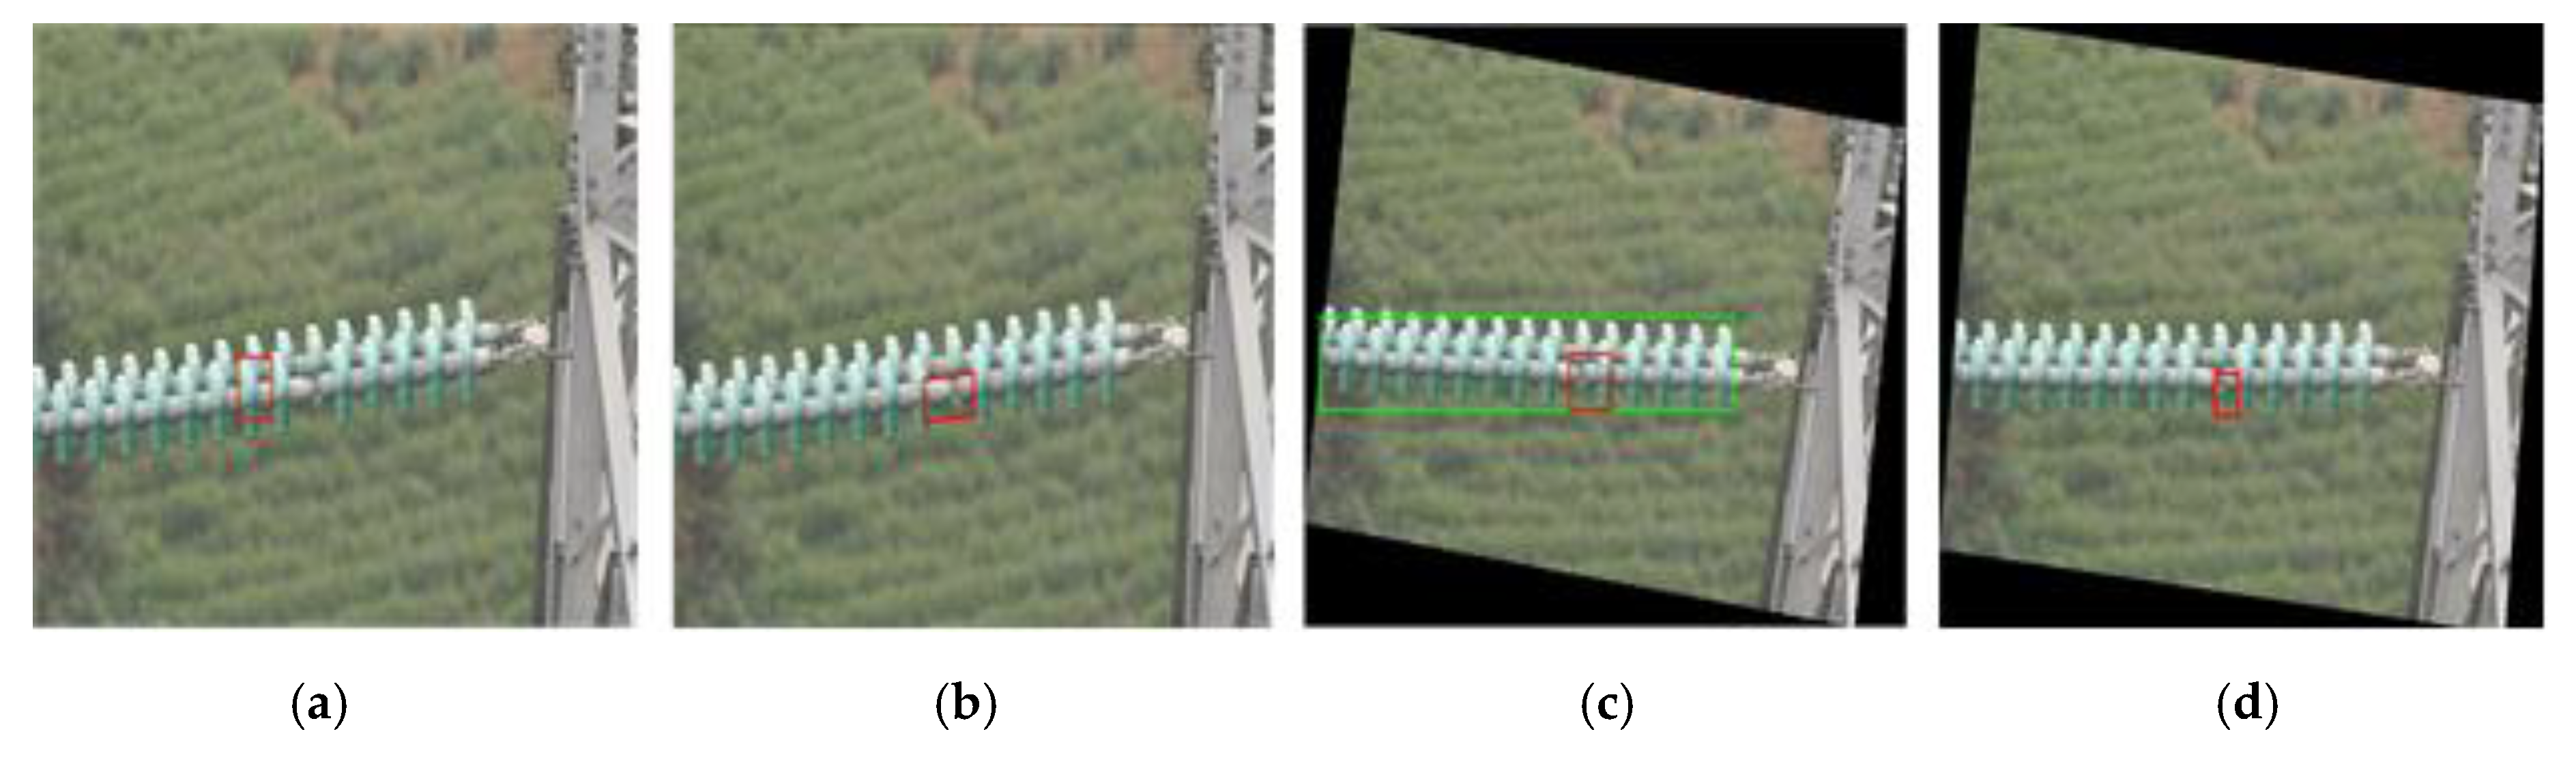
The detection effect of the proposed method was compared with the methods in the literature [
17,
19,
23] for inspection images with different obstruction conditions. The results are shown in
Figure 9 and
Figure 10. It can be seen that the proposed method accurately located the self-shattering defects of the insulators in both conditions, and had strong robustness.
4.2.2. Detection Effects of Images with Different Background Complexities
The difficulty of self-shattering defect detection was different with different background complexities. The inspection images with different background complexities were used to further evaluate the performance of the proposed method. Experimental results are shown in
Figure 11. It is demonstrated that the proposed method accurately located the self-shattering defects in inspection images with simple backgrounds and complex backgrounds.
4.2.3. Self-Shattering Occurs at Both Ends of the Insulator String
The methods proposed in Reference [
17,
19] were not applicable for the situation where self-shattering occurs at both ends of one insulator string. However, the experimental results of the proposed method and the method used in Reference [
23] are illustrated in
Figure 12. It can be observed that literature [
23] method got false self-shattering location, and the proposed method detected the self-shattering defect at one end of the insulator string, whereas it misjudged the visual vacancy on the other end, which led to error detection. From an operation and maintenance point of view, missed detection may lead to missing a fault, which can cause safety risks, while false detection may increase the workload of the secondary judgment. When the missed detection and the false detection cannot be completely avoided, in contrast, the choice is false detection rather than missed detection to improve safety. Therefore, the proposed method is more suitable for practical needs.
According to the above analysis, we conclude that the proposed method accurately detected and located the self-shattering defect of insulators in inspection images with different obstructed conditions, different self-shattering positions and different background complexities, which means that the proposed method had strong robustness.
4.3. Real-Time Performance and Precision
In order to analyze the real-time performance and detection precision of the proposed method, 67 inspection images of insulators with self-shattering defects were detected. The average time consumption, precision and missing rate were used as evaluation indexes. They are defined in Equations (14) and (15):
where
represents the number of correctly located self-shattering insulators,
is the total number of located self-shattering insulators,
represents the number of undetected self-shattering insulators, and
is the total number of self-shattering insulators.
The performances of the proposed method were compared with the methods in References [
17,
19,
23], as shown in
Table 1.
It was observed that the proposed method in this paper was superior to the method in References [
17,
23], which reduced the average time consumption and the missing rate of detection, and improved detection precision. Furthermore, compared with the method proposed in Reference [
19], although our method took a slightly longer time, it had a higher precision and lower missing rate, which is more in line with actual needs.
5. Conclusions
In this paper, a detection and localization method for self-shattering defects in twin glass insulators, based on spatial features of connected regions, was proposed. In our method, firstly, the insulators in the inspection images were segmented from complex backgrounds based on color features, then insulator connected regions were marked, and finally insulators with defects could be detected and located based on spatial features. The performance of the proposed method was evaluated using inspection images under different conditions. Experimental results confirm that this method is simple, effective, and has a wide application range as well as good real-time performance.
In addition, when insulator regions are severely obstructed, an independent connected region based on the insulator umbrella skirt cannot be obtained, which results in poor performance of the method. Thus, further research based on spatial features is needed for the localization and detection of multiple and simultaneous bunch-drop faults in insulators.
Author Contributions
H.C., Y.Z., and Z.D. designed the system modeling and algorithm; H.C. and R.C. performed the experiments; H.C. and D.W. analyzed the experimental results; H.C., Y.Z., R.C. and Y.W. wrote this paper.
Funding
This study is supported by National Natural Science of Foundation of China (61773160, 61871182), and National Natural Science Foundation of Hebei Province (F2017502016).
Conflicts of Interest
The authors declare no conflicts of interest.
References
- Peng, X.; Qian, J.; Wang, K. Multi-sensor full-automatic inspection system for large unmanned helicopter and its application in 500 kv lines. Guangdong Electr. Power 2016, 29, 8–15. [Google Scholar]
- Wang, M.; Du, Y.; Zhang, Z. Research on UAV aided inspection and image recognition of insulator defects. J. Electron. Meas. Instrum. 2015, 29, 1862–1869. [Google Scholar]
- Guan, Z.; Wang, X.; Bian, X.; Wang, L.; Jia, Z. Analysis of causes of outdoor insulators damages on HV and UHV transmission lines in China. In Proceedings of the IEEE Electrical Insulation Conference, Philadelphia, PA, USA, 8–11 June 2014; pp. 227–230. [Google Scholar] [CrossRef]
- Liao, S.; An, J. A robust insulator detection algorithm based on local features and spatial orders for aerial images. IEEE Geosci. Remote Sens. Lett. 2015, 12, 963–967. [Google Scholar] [CrossRef]
- Cui, J.; Cao, Y.; Wang, W. Application of an improved algorithm based on watershed combined with krawtchouk invariant moment in inspection image processing of substations. Proc. CSEE 2015, 35, 1329–1335. [Google Scholar] [CrossRef]
- Zhao, Z.; Xu, G.; Qi, Y.; Liu, N.; Zhang, T. Multi-patch deep features for power line insulator status classification from aerial images. In Proceedings of the International Joint Conference on Neural Network (IJCNN), Vancouver, BC, Canada, 24–29 July 2016; pp. 3187–3194. [Google Scholar] [CrossRef]
- Yang, L.; Jiang, X.; Hao, Y.; Li, L.; Li, H.; Li, R.; Luo, B. Recognition of natural ice types on in-service glass insulators based on texture feature descriptor. IEEE Trans. Dielectr. Electr. Insulation 2017, 24, 535–541. [Google Scholar] [CrossRef]
- Jiang, H.; Jin, L.; Yan, S. Recognition and fault diagnosis of insulator string in aerial images. J. Mech. Electron. Eng. 2015, 32, 274–278. [Google Scholar]
- Zhang, S.; Yang, Z.; Huang, X.; Wu, H.Q.; Gu, Y.Z. Defects detection and positioning for glass insulator from aerial images. J. Terahertz Sci. Electron. Inf. Technol. 2013, 11, 609–613. [Google Scholar]
- Shang, J.; Li, C.; Chen, L. Location and detection for self-explode insulator based on vision. J. Electron. Meas. Instrum. 2017, 31, 844–849. [Google Scholar]
- Oberweger, M.; Wendel, A.; Bischof, H. Visual recognition and fault detection for power line insulators. In Proceedings of the 19th Computer Vision Winter Workshop, Krtiny, Czech Republic, 3–5 February 2014; pp. 1–8. [Google Scholar]
- Zhang, X.; An, J.; Chen, F. A method of insulator fault detection from airborne images. In Proceedings of the 2nd WRI Global Congress on Intelligent Systems, Wuhan, China, 16–17 December 2010; pp. 200–203. [Google Scholar] [CrossRef]
- Wang, W.; Wang, Y.; Han, J. Recognition and drop-off detection of insulator based on aerial image. In Proceedings of the 9th International Symposium on Computational Intelligence and Design, Hangzhou, China, 10–11 December 2016; pp. 162–167. [Google Scholar] [CrossRef]
- Zhang, J.; Han, J.; Zhao, Y. Insulator recognition and defects detection based on shape perceptual. J. Image Graphi. 2014, 19, 1194–1201. [Google Scholar]
- Lin, J.; Han, J.; Chen, F.; Xu, X.; Wang, Y. Defects detection of glass insulator based on color image. Power Syst. Technol. 2011, 35, 127–133. [Google Scholar]
- Shi, L. The Method of Image Detection on Defect Insulator in Transmission Line. Master’s Thesis, Department of Control Engineering, North China Electric Power University, Beijing, China, March 2013. [Google Scholar]
- Wang, Y.; Yan, B. Vision based detection and location for cracked insulator. Comput. Eng. Design 2014, 35, 583–587. [Google Scholar]
- Jiang, Y.; Han, J.; Ding, J. The identification and diagnosis of self-blast defects of glass insulators based on multi-feature fusion. Electr. Power 2017, 50, 52–58. [Google Scholar]
- Zhai, Y.; Wang, D.; Zhang, M.; Wang, J.; Guo, F. Fault detection of insulator based on saliency and adaptive morphology. Multimed. Tools Appl. 2017, 76, 12051–12064. [Google Scholar] [CrossRef]
- Zhai, Y.; Wang, D.; Zhao, Z.; Cheng, H. Insulator string location method based on spatial configuration consistency feature. Proc. CSEE 2017, 37, 1568–1577. [Google Scholar] [CrossRef]
- Yao, C.; Jin, L.; Yan, S. Recognition of insulator string in power grid patrol images. J. Syst. Simul. 2012, 24, 1818–1822. [Google Scholar]
- Jia, L.; Song, S.; Yao, L.; Li, H.; Zhang, Q.; Bai, Y.; Gui, Z. Image denoising via sparse representation over grouped dictionaries with adaptive atom size. IEEE Access 2017, 5, 22514–22529. [Google Scholar] [CrossRef]
- Zhai, Y.; Chen, R.; Yang, Q.; Li, X.; Zhao, Z. Insulator fault detection based on spatial morphological features of aerial images. IEEE Access 2018, 6, 35316–35326. [Google Scholar] [CrossRef]
© 2019 by the authors. Licensee MDPI, Basel, Switzerland. This article is an open access article distributed under the terms and conditions of the Creative Commons Attribution (CC BY) license (http://creativecommons.org/licenses/by/4.0/).


