Preliminary Design for Wave Run-Up in Offshore Wind Farms: Comparison between Theoretical Models and Physical Model Tests

 ,
,
Abstract
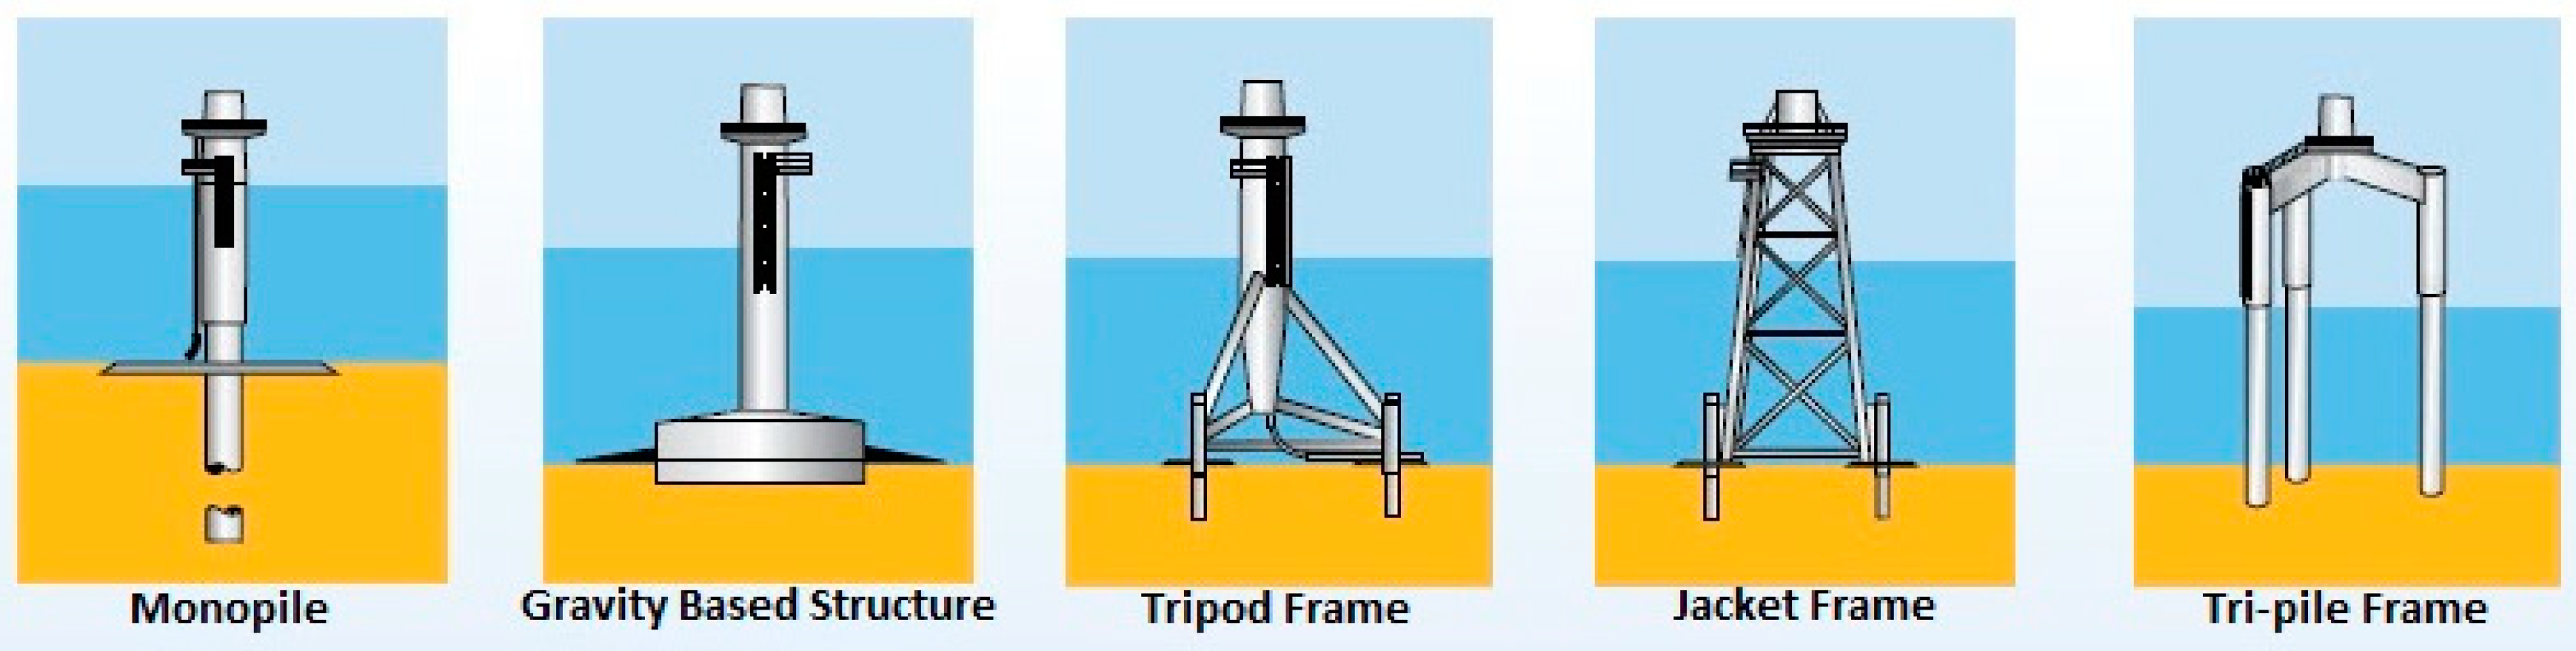
:1. Introduction
2. Methodology
- Climate and hydrodynamic characterization at the location that will hold the platform.
- Identification of the theoretical and empirical formulations describing wave run-up in cylinders. For instance, Hallermeier (for regular waves), Niedzwecki and Huston (for regular and random waves), Mase et al.; and the experimental results for monopile and cone foundations, described by De Vos et al. [23].
- Review and description of the physical model tests concerning wave-structure interaction under regular and irregular waves and for different wave directions.
- Analysis of the results obtained by the physical model tests.
- Comparison and discussion of the results provided by the theoretical formulations versus the water levels measured on the different 3-D tests of the Ring Pontoon Platform; and finally, the conclusions of the comparison are showed.
3. Theoretical and Physical Model Tests
3.1. Wave Climate and Hydrodynamic Characterization
3.2. Theoretical Models
3.2.1. Theoretical Models for Cylinders
3.2.2. Theoretical models for gravity structures
3.3. Physical Model Tests Description
- Wave directions considered are 0° and 45°, since the structure has a square shape, so as to simplify the model. For the Goda theoretical model, only 0° wave attack angle is considered (in further steps, more wave attack angles should be also considered)
- The structure has been attacked by both regular and irregular waves.
- 4 different types of tests have been performed regarding regular wave attack, using 10 different values for wave height (which makes 40 variants in total).
- 10 different types of tests have been performed regarding irregular wave attack, with a number of waves of 1000 in each.
3.4. Physical Model Tests Results and Comparison with Theoretical Models
4. Discussion
5. Conclusions
- Run-up effects have demonstrated in the past few years that the values traditionally predicted are clearly under the ones actually happening. Decks and platforms at offshore locations are suffering from flooding and wave attack due to such unpredicted phenomena.
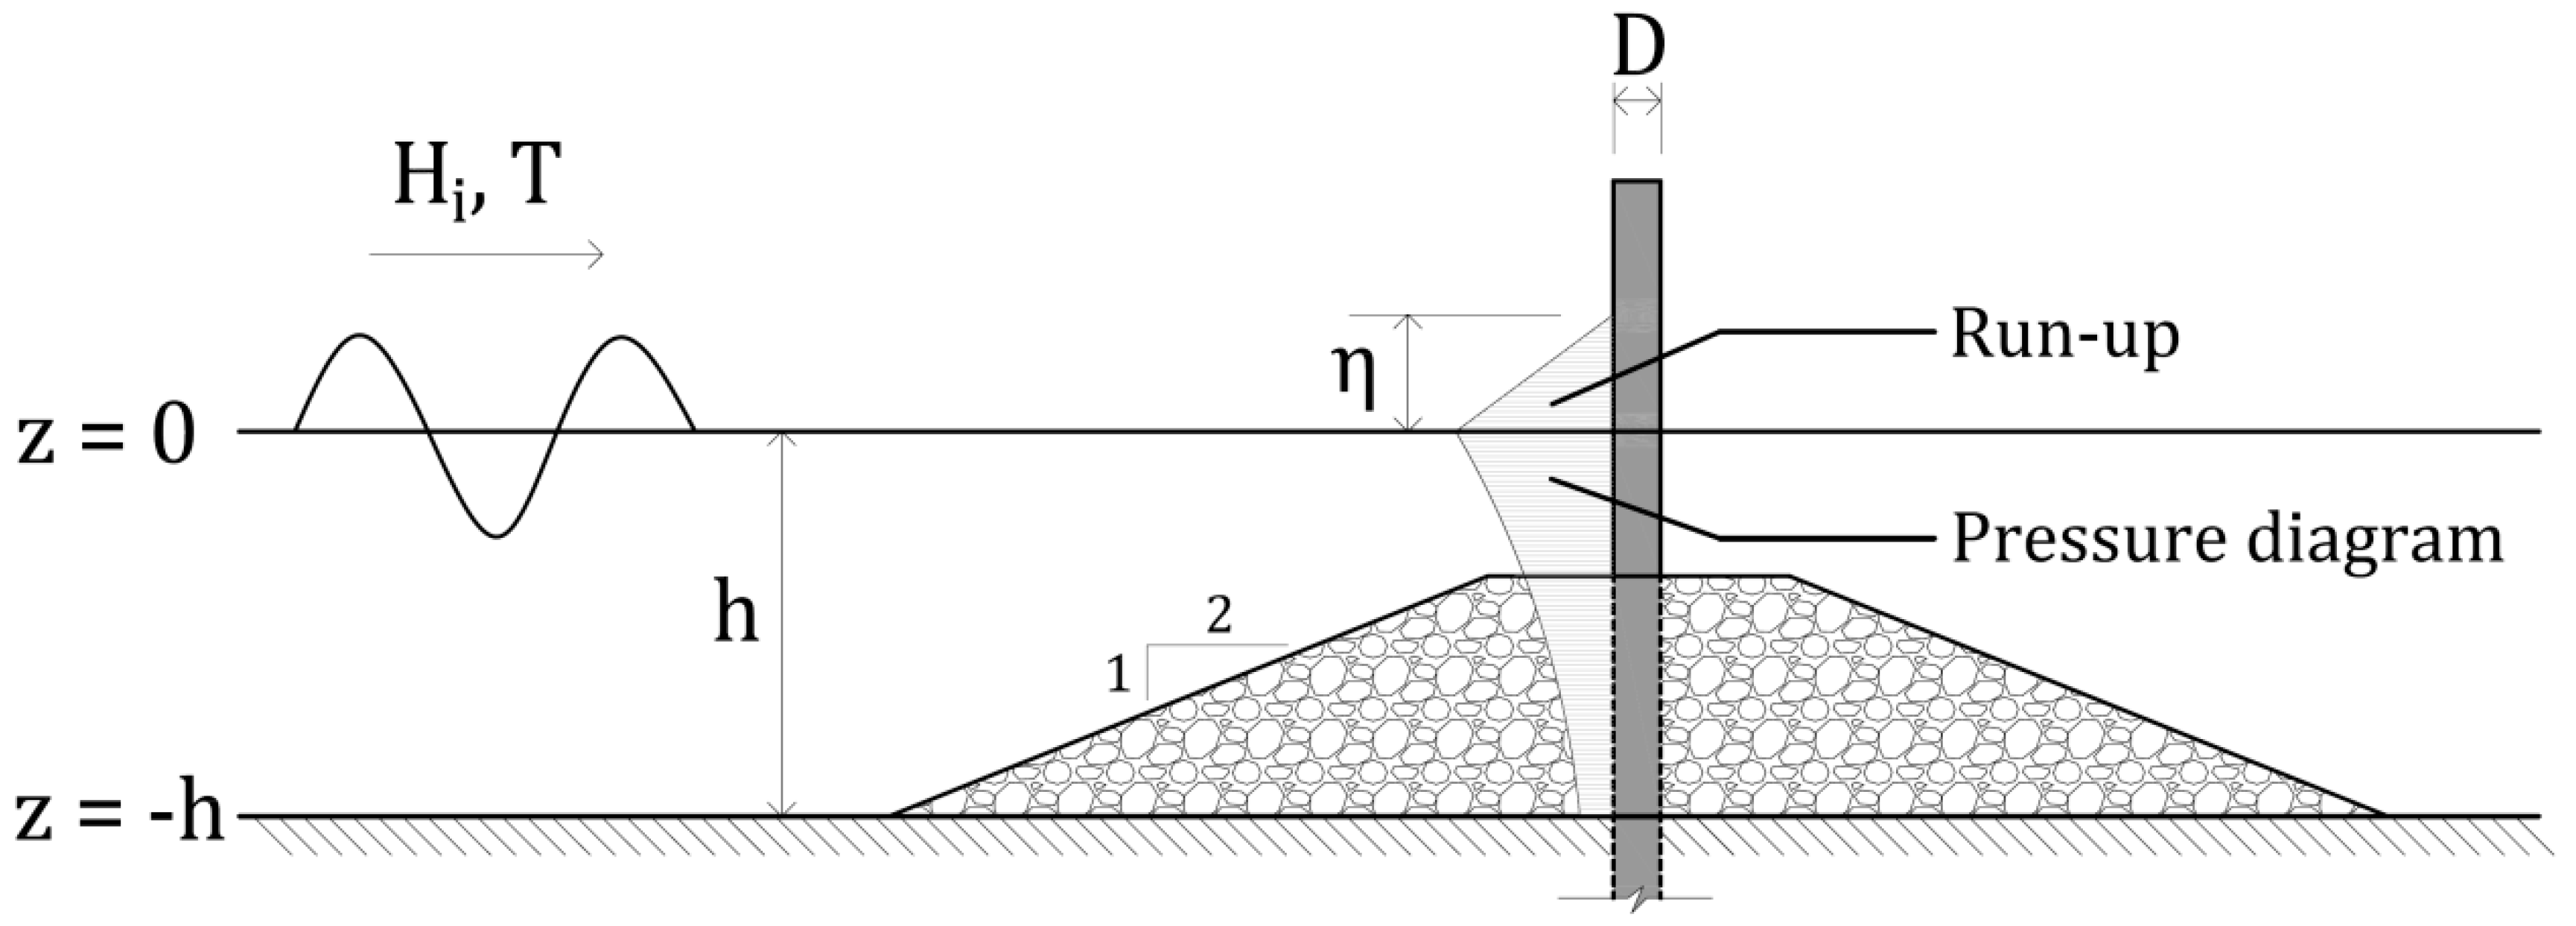
- The final aim of this investigation is to determine which would be the proper level to install the deck (protected from run-up effects). Theoretical models have been addressed for intermediate water depths and flat bottom, since for much deeper waters other types of structures are the ones used and for shallow waters, turbulence effects do not allow the use of such simplified theoretical models.
- Two groups of theoretical formulations may be used: those for cylinders and those for GBS. There is not a clear boundary between both types of structures. Theoretical formulations give accurate results. The designer should choose between the different expressions here presented or apply them all studying the goodness of approach of each one of them.
- The models herein presented should be used only for preliminary design. They are very simplified. In further stages of the design, more complex criteria need to be considered (breaking waves, different return periods, accurate correlation between Hmax and Hs, different hydrodynamic domains…)
- Return periods should be increased from the current 100 years to higher values, up to 500 or even 1000 years. Consequently, the number of active waves in the design storms will increase, up to 10,000 or even more.
- The authors propose a preliminary estimation of 2.50 < Ru/Hsi < 3.00, applicable for GBS and large diameter cylinders, for a site condition of intermediate water depths and flat bottom seabed.
Author Contributions
Funding
Acknowledgments
Conflicts of Interest
Notation
| Hs | significant wave height, average of highest one third of wave heights [m]. |
| Hsi | incident significant wave height [m]. |
| Hb | breaking wave height [m]. |
| H1/3 | mean wave height of highest one third waves, similar to Hs [m]. |
| H1/10 | mean wave height of highest one tenth waves [m]. |
| Hmax | maximum wave height [m]. |
| KC | Keulegan-Carpenter number [-]. |
| Fr | Froude number [-]. |
| v | velocity [m/s]. |
| g | gravity acceleration [m/s2]. |
| gp | gravity acceleration in prototype [m/s2]. |
| gm | gravity acceleration in model [m/s2]. |
| D | nominal diameter [m]. |
| Frp | Froude number in prototype [-]. |
| Frm | Froude number in model [-]. |
| vp | velocity in prototype [m/s]. |
| Dp | nominal diameter in prototype [m]. |
| vm | velocity in model [m/s]. |
| Dm | nominal diameter in model [m]. |
| u | maximum kinematic velocity [m/s]. |
| T | undulatory period [s]. |
| Tr | return period of the wave storm [years]. |
| n | useful life [years]. |
| Pf | probability of failure [-]. |
| ƞ | wave profile according to linear wave theory [m]. |
| ƞmax | maximum wave profile according to linear wave theory (cosθ = 1) [m]. |
| h | water depth, similar to d [m]. |
| Tp | spectral peak period [s]. |
| L0 | wave length in deep water conditions [m]. |
| L | wave length in front of the structure [m]. |
| Hmax,N, | maximum wave height according to Longuet-Higgins model [m]. |
| N | number of active waves [-]. |
| H1/250 | mean wave height of highest one-out-of-two hundred and fifty waves [m]. |
| γb | breaking wave coefficient [-]. |
| Ru | run-up level, relative to still water level [m]. |
| ƞ | maximum crest elevation, similar to ƞmax [m]. |
| H | wave height from trough to crest [m]. |
| Ru2% | run-up level exceeded by only 2% of the incident waves [m]. |
| d | water depth, similar to h [m]. |
| β | slope of the natural seabed soil [rad]. |
| H0 | wave height in deep water conditions [m]. |
| ƞmax | maximum crest elevation, similar to ƞ [m]. |
| H2% | wave height exceeded by only 2% of the incident waves [m]. |
| θ | angle of wave attack [rad]. |
| HD | design wave height [m]. |
| h0 | crest elevation using Sainflou expression [m]. |
| k | wave number [m−1]. |
| q | unitary water flow (overtopping rate) [m3/ms]. |
| H0 | wave height in front of the structure [m]. |
| hc | water crown level [m]. |
| hc,max | water crown level for extreme conditions [m]. |
| hc,s | water crown level for significant conditions [m]. |
References
- EWEA-Wind Europe (European Wind Energy Association). Key Trends and Statistics; EWEA Tech. Rep.; EWEA: Brussels, Belgium, 2017. [Google Scholar]
- EWEA-Wind Europe (European Wind Energy Association). Key Trends and Statistics H1, for Internal Use Only; EWEA Tech. Rep.; EWEA: Brussels, Belgium, 2018. [Google Scholar]
- Offshore Wind. Available online: www.offshorewind.biz (accessed on 10 November 2018).
- 4C Offshore. Available online: www.4coffshore.com (accessed on 11 November 2018).
- BP–British Petroleum. Statistical Review of World Energy; BP p.l.c.; British Petroleum: London, UK, 2017; p. 66. [Google Scholar]
- Luengo, J.; Negro, V.; García-Barba, J.; López-Gutiérrez, J.S.; Esteban, M.D. New detected uncertainties in the design of foundations for offshore wind turbines. Renew. Energy 2019, 131, 667–677. [Google Scholar] [CrossRef]
- DNV-GL. Recommended Practice, DNV-rp-C205, on Environmental Conditions and Environmental Loads. 2010. Available online: https://rules.dnvgl.com/docs/pdf/dnv/codes/docs/2010-10/rp-c205.pdf (accessed on 9 January 2019).
- DNV-GL. International Guidelines, DNV-GL-ST-0126, on Support Structures for Wind Turbines. 2016. Available online: http://rules.dnvgl.com/docs/pdf/dnvgl/ST/2016-04/DNVGL-ST-0126.pdf (accessed on 9 January 2019).
- DNV-GL. International Guidelines, DNV-GL-ST-0437, on Loads and Site Conditions for Wind Turbines. 2016. Available online: https://rules.dnvgl.com/docs/pdf/DNVGL/ST/2016-11/DNVGL-ST-0437.pdf (accessed on 9 January 2019).
- DNV-GL. International Guidelines DNV-os-j101, on Design of Offshore Wind Turbine. 2013. Available online: https://rules.dnvgl.com/docs/pdf/DNV/codes/docs/2013-02/Os-J101.pdf (accessed on 9 January 2019).
- Nielsen, A.W. Final Report on the PSO Project “Wave Run-Up on Offshore Wind Turbines”; DHI–Energinet.dk.; DHI: Horsholm, Denmark, 2008; p. 43. [Google Scholar]
- Frigaard, P.; Andersen, T.L.; Rodriguez, J.R.; Sorensen, H.; Martinelli, L.; Lamberti, A.; Troch, P.; De Vos, L.; Kisacik, D.; Stratigaki, V.; et al. Loads on entrance platforms for offshore wind turbines. In Proceedings of the HydralabIII Joint Transnational Access under Meeting, Hannover, Germany, 2–4 February 2010; pp. 25–28. [Google Scholar]
- MacCamy, R.C.; Fuchs, R.A. Wave Forces on Piles: A Diffraction Theory. Technical Memorandum, N° 69; U.S. Army Beach Erosion Board: Washington, DC, USA, 1954. [Google Scholar]
- Ning, D.; Wang, R.; Chen, L.; Li, J.; Zang, J.; Cheng, L. Extreme wave run–up and pressure on a vertical seawall. Appl. Ocean Res. 2017, 67, 188–200. [Google Scholar] [CrossRef]
- Fang, Z.; Xiao, L.; Guo, Y.; Kou, Y.; Li, J. Wave run–up on a fixed surface–piercing square column using multi–layer barrier. Appl. Ocean Res. 2018, 71, 105–118. [Google Scholar] [CrossRef]
- Viotti, C.; Carbone, F.; Dias, F. Conditions for extreme wave run–up on a vertical barrier by nonlinear dispersion. J. Fluids Mech. 2014, 748, 768–788. [Google Scholar] [CrossRef]
- Cao, H.; Wan, D. Benchmark computations of wave run–up on single cylinder and four cylinders by naoe–FOAM–STJU solver. Appl. Ocean Res. 2017, 65, 327–337. [Google Scholar] [CrossRef]
- Hiroi, I. On a method of estimating the force of waves. J. Coll. Eng. Imp. Univ. Tokyo 1919, 10, 1–19. [Google Scholar]
- Sainflou, G. Essai sur les digues maritimes verticals. Annales de ponts et chaussées 1928, 98, 5–48. [Google Scholar]
- Goda, Y. A new method of wave pressure calculation for the design of composite breakwater. In Proceedings of the 14th International Conference on Coastal Engineering, ASCE, Copenhagen, Denmark, 24–28 July 1974; pp. 1702–1720. [Google Scholar]
- Goda, Y. Random Seas and Design of Maritime Structures, 2nd ed.; World Scientific Publishing: Singapore, 2000. [Google Scholar]
- Suh, K.D.; Jung, H.Y.; Pyun, C.K. Wave reflection and transmission by curtainwall-pile breakwaters using circular piles. Ocean Eng. 2007, 34, 2100–2106. [Google Scholar] [CrossRef]
- De Vos, L.; Frigaard, P.; De Rouck, J. Wave run-up on cylindrical and cone shaped foundations for offshore wind turbines. Coast. Eng. 2007, 54, 17–29. [Google Scholar] [CrossRef]
- Sarpkaya, T.; Isaacson, M. Mechanics of Wave forces on Offshore Structures; Van Nostrand Reinhold: New York, NY, USA, 1981. [Google Scholar]
- Sarpkaya, T. Wave Forces on Offshore Structures; Cambridge University Press: New York, NY, USA, 2014. [Google Scholar]
- De Soneville, B.; Paulsen, B.T.; Hofland, B. Wave Impact Loads on Gravity Based Structures. In Proceedings of the 34th International Conference on Ocean, Offshore and Arctic Engineering, OMAE34, St. John’s, NL, Canada, 31 May–5 June 2015. [Google Scholar]
- Negro, V.; Varela, O.; García-Palacios, J.H.; López-Gutiérrez, J.S. Diseño de Diques verticales (Design of vertical breakwaters), 2nd ed.; Colección Seinor. n° 26; Colegio de Ingenieros de Caminos: Canales y Puertos, Madrid, Spain, 2008. (In Spanish) [Google Scholar]
- Negro, V.; López-Gutiérrez, J.S.; Esteban, M.D.; Matutano, C. Uncertainties in the design of support structures and foundations for offshore wind turbines. Renew. Energy 2014, 63, 125–132. [Google Scholar] [CrossRef] [Green Version]
- Longuet Higgins, M.S. On the statistical distribution of the heights of sea waves. J. Mar. Res. 1952, 11, 245–266. [Google Scholar]
- Arena, F.; Laface, V.; Malara, G.; Romolo, A.; Viviano, A.; Fiamma, V.; Sannino, G.; Carillo, A. Wave climate analysis for the design of wave energy harvesters in the Mediterranean Sea. Renew. Energy 2015, 77, 125–141. [Google Scholar] [CrossRef]
- CERC. Shore Protection Manual, 4th ed.; US Army Corps of Engineers, Coastal Engineering Research Centre. P.O.: Vicksburg, MS, USA, 1984. [Google Scholar]
- USACE. Coastal Engineering Manua; EM 1110-2-1100, CECW-CE, USACE Publications. Part II.; USACE: Washington, DC, USA, 2002.
- Keulegan, G.H.; Carpenter, L.H. Forces on cylinders and plates in an oscillating fluid. J. Res. Natl. Bur. Stand. 1958, 60, 423–440. [Google Scholar] [CrossRef]
- Zang, J.; Taylor, P.H.; Morgan, G.; Stringer, R.; Orszaghova, J.; Grice, J.; Tello, M. Steep wave and breaking wave impact on offshore wind turbine foundations–ringing re-visited. In Proceedings of the 25th International Workshop on Water Waves and Floating Bodies, Harbin, China, 9–12 May 2010. [Google Scholar]
- Puertos del Estado. ROM 0.3-91. Waves; Ministry of Public Works: Madrid, Spain, 1991. [Google Scholar]
- Puertos del Estado. ROM 1.0-09. Breakwaters (Part 1): Calculation and project factors. Climate Agents; Ministry of Public Works: Madrid, Spain, 2009. [Google Scholar]
- Puertos del Estado. Available online: www.puertos.es (accessed on 3 November 2018).
- Luengo, J.; García-Barba, J.; Negro, V.; López-Gutiérrez, J.S.; Esteban, M.D. Offshore wind energy. Create a lot of questions. Give some answers. Ocean Eng. 2018. under review. [Google Scholar]
- Peregrine, D.H. Water wave impact on walls. Annu. Rev. Fluid Mech. 2003, 35, 23–43. [Google Scholar] [CrossRef]
- Clauss, G.F. Wave forces on Slender Cylinders; Delft University of Technology: Delft, The Netherlands, 1992; Chapter 12.
- Hasselmann, K.; Baruett, T.P.; Bouws, E.; Carlson, H.; Cartwright, D.E.; Enke, K.; Ewing, J.A.; Gienapp, H.; Hasselmann, D.E.; Kruseman, P.; et al. Measurements of wind wave growth and swell decay during the JONSWAP. In Hydraulic Engineering Reports; Deutches Hydrographisches Institut: Hamburg, Germany, 1973. [Google Scholar]
- Van der Meer, J.W. Rock Slopes and Gravel Beaches under Wave Attack. Ph.D. Thesis, Technical University of Delft, Delft, The Netherlands, 1988. [Google Scholar]
- Van der Meer, J.W. Conceptual Design of Rubble Mound Breakwaters; Delft Hydraulic Publication; Delft Hydraulics: Delft, The Netherlands, 1993; p. 483. [Google Scholar]
- Puertos del Estado. ROM 0.2-90. Actions in the Design of Maritime and Harbour Works; Ministry of Public Works: Madrid, Spain, 1990. [Google Scholar]
- Puertos del Estado. ROM 0.0-01. General Procedure and Requirements in the Design of Harbor and Maritime Structures; Ministry of Public Works: Madrid, Spain, 2002. [Google Scholar]
- Esteban, M.D.; Diez, J.J.; López-Gutiérrez, J.S.; Negro, V. Why offshore wind energy? Renew. Energy 2011, 36, 444–450. [Google Scholar] [CrossRef] [Green Version]


| Relative Depth | h (m) | Hs (m) | Tp (s) | L0 (m) | L (m) | h/L (-) | Tr (yr) | Wave Regime |
|---|---|---|---|---|---|---|---|---|
| 1/25 < h/L < 1/2 | 25.00 | 8.80 | 11.5 | 206.48 | 157.20 | 0.16 | 100 | Intermediate |
| 1/25 < h/L < 1/2 | 43.80 | 10.80 | 12.0 | 224.64 | 198.40 | 0.22 | 100 | Intermediate |
| Theory | HIROI | GODA | SAINFLOU | SUH ET AL | GODA NOMOGRAM |
|---|---|---|---|---|---|
| Run-up | 19.80 ̴ 24.30 m | 23.76 ̴ 29.16 m | 22.43 ̴ 26.22 m | 15.84 ̴ 19.44 m | 34.85 ̴ 42.77 m 17.60 ̴ 21.60 m |
| MODEL USED | h = 25 m | h = 43.80 m | ||
|---|---|---|---|---|
| Ru/Hs | Ru/Hmax | Ru/Hs | Ru/Hmax | |
| Potential flow theory | 2.60 | 1.44 | 2.60 | 1.44 |
| MacCamy and Fuchs | 0.84 | 0.84 | 0.73 | 0.73 |
| Niedzwecki and Huston | 2.23 | 1.24 | 2.03 | 1.13 |
| Hiroi | 2.25 | 1.25 | 2.25 | 1.25 |
| Goda | 2.70 | 1.50 | 2.70 | 1.50 |
| Sainflou | 2.55 | 1.42 | 2.43 | 1.35 |
| Suh et al. | 1.80 | 1.00 | 1.80 | 1.00 |
| Goda nomogram | 2.00 | 2.20 | 2.00 | 2.20 |
| Hydraulic model tests | 2.32 | 1.28 | 1.90 | 1.05 |
© 2019 by the authors. Licensee MDPI, Basel, Switzerland. This article is an open access article distributed under the terms and conditions of the Creative Commons Attribution (CC BY) license (http://creativecommons.org/licenses/by/4.0/).
Share and Cite
Luengo Frades, J.; Negro, V.; García Barba, J.; Martín-Antón, M.; López-Gutiérrez, J.S.; Esteban, M.D.; Moreno Blasco, L.J. Preliminary Design for Wave Run-Up in Offshore Wind Farms: Comparison between Theoretical Models and Physical Model Tests. Energies 2019, 12, 492. https://doi.org/10.3390/en12030492
Luengo Frades J, Negro V, García Barba J, Martín-Antón M, López-Gutiérrez JS, Esteban MD, Moreno Blasco LJ. Preliminary Design for Wave Run-Up in Offshore Wind Farms: Comparison between Theoretical Models and Physical Model Tests. Energies. 2019; 12(3):492. https://doi.org/10.3390/en12030492
Chicago/Turabian StyleLuengo Frades, Jorge, Vicente Negro, Javier García Barba, Mario Martín-Antón, José Santos López-Gutiérrez, M. Dolores Esteban, and Luis J. Moreno Blasco. 2019. "Preliminary Design for Wave Run-Up in Offshore Wind Farms: Comparison between Theoretical Models and Physical Model Tests" Energies 12, no. 3: 492. https://doi.org/10.3390/en12030492