A Simple Method of Finding New Dry and Isentropic Working Fluids for Organic Rankine Cycle


1
Budapest University of Technology and Economics, Department of Energy Engineering, Muegyetem rkp. 3, H-1111 Budapest, Hungary
2
MTA Centre for Energy Research, Department of Thermohydraulics, POB. 49, H-1525 Budapest, Hungary
*
Author to whom correspondence should be addressed.
Energies 2019, 12(3), 480; https://doi.org/10.3390/en12030480
Submission received: 17 January 2019
/
Revised: 28 January 2019
/
Accepted: 1 February 2019
/
Published: 1 February 2019
Abstract
:One of the most crucial challenges of sustainable development is the use of low-temperature heat sources (60–200 °C), such as thermal solar, geothermal, biomass, or waste heat, for electricity production. Since conventional water-based thermodynamic cycles are not suitable in this temperature range or at least operate with very low efficiency, other working fluids need to be applied. Organic Rankine Cycle (ORC) uses organic working fluids, which results in higher thermal efficiency for low-temperature heat sources. Traditionally, new working fluids are found using a trial-and-error procedure through experience among chemically similar materials. This approach, however, carries a high risk of excluding the ideal working fluid. Therefore, a new method and a simple rule of thumb—based on a correlation related to molar isochoric specific heat capacity of saturated vapor states—were developed. With the application of this thumb rule, novel isentropic and dry working fluids can be found applicable for given low-temperature heat sources. Additionally, the importance of molar quantities—usually ignored by energy engineers—was demonstrated.
1. Introduction
In the last few decades, power generation started to turn to alternative energy sources, such as wind energy and photovoltaics, as well as unconventional sources of heat, such as geothermal energy, solar heat, biomass-firing plants, or waste heat from other industrial processes. Generally, these unconventional heat sources do not have as high energy density as the conventional ones nor a high cycle efficiency, since the heat is supplied at a lower temperature level. Nevertheless, they can perform better under specific circumstances.
Conventional Rankine Cycle-based thermal power plants use water as working fluid. Because of the thermal properties of the water, the cycle cannot exploit such unconventional heat sources efficiently. Organic Rankine Cycle (ORC) provides an alternative solution, because it uses non-conventional working fluids, mainly organic ones. These unconventional working fluids are suitable for power generation from various low-temperature heat sources [1,2], including geothermal heat [3,4] or low-temperature industrial waste heat [5]. According to the ORC World Map [6], in the middle of 2016, the number of installed major ORC units exceeded 700.
Obviously, using different working fluids would also influence the actual layout. In some cases, it requires a superheater, a recuperator, or other auxiliary units [7]. Also, the type of expander in use depends on the fluid properties [8,9,10,11], but this problem is not addressed in this paper.
Traditionally, the working fluid for a given ORC is selected using a trial-and-error procedure through experience from chemically similar materials, although recently there were more and more attempts to use chemical or physical properties to predict the applicability of a given fluid as an ORC working fluid. In some cases, simple optimization algorithms are used to select the ideal existing working fluid, while, in other cases, the optimization is based on molecular or equation-of-state parameters [12,13,14,15,16,17]. Usually, possible candidates are identified using information collected from similar systems. In this way, one might risk excluding novel, previously unused working fluids, which could be better than any traditional ones.
A novel classification method was developed by us [18] not only to describe and categorize all the potential working fluids, but also to use some elements of the classification as a tool for finding the best working fluid for a given heat source. A short review of the novel classification is given in Section 3. The basis of the new classification is the relative location of some characteristic points on the saturation curve of a given material in specific entropy–temperature diagram. Using one or two of these points and correlating them with the isochoric molar specific heat capacities of the equilibrium vapor phase, we are able to give a “rule of thumb” to select working fluids, where droplet formation during expansion and, hence, the potentially harmful droplet erosion of turbine blades—common for traditional and some organic Rankine processes using wet working fluids [19,20]—can be avoided. In this way, several new potential working fluids can be found and used for further evaluation, using general criteria for ORC working fluid selection including thermodynamics [18,21], safety and environmental impact [22,23], availability, compatibility, and cost-effectiveness [24], or most often, a combination of these criteria.
2. Traditional Classification
The widespread traditional classification of working fluids is based on the shape of the vapor saturation curve of the fluids and, hence, the quality of the expanded vapor at the outlet of the turbine [21,25]. Expander is a more common term in ORC technology, which refers to the differences in size and construction compared to steam turbines. The traditional classification of ORC working fluids differentiates three categories, namely wet, dry, and isentropic, usually with a smooth transition between them [12,24,26,27,28].
The working fluid is called wet or wet-type if an isentropic (adiabatic and reversible) expansion starting from a saturated vapor state will end in the two-phase region, which is also called “saturated liquid vapor region” or “wet region”. The vapor curve of a wet fluid in a temperature–entropy diagram has a negative slope at each point (dT/ds < 0). The working fluid is called dry if an isentropic expansion starting from a saturated vapor state will end in the single-phase vapor region, which is also called “superheated vapor region” or sometimes simply “dry region”. The vapor curve of dry fluids has mainly a positive slope (dT/ds > 0). At high temperatures, the vapor curve has necessarily a negative slope, where the entropy increases until reaching a maximum value (ds/dT = 0), and then the curve bends back to smaller entropy values. Finally, the working fluid is called isentropic if an isentropic expansion starts and ends in a saturated vapor state. The saturated vapor curve of an ideal isentropic fluid has an infinite slope (dT/ds → ∞) at each point after reaching the point where ds/dT = 0.
The visualization of the three traditional categories can be seen in Figure 1, marking isentropic expansion processes with initial (1) and final (2) states.
Deficiencies in Traditional Classification
Owing to the spread of ORC technology and, hence, the application of new working fluids, the traditional classification is deemed narrow and does not reflect significant differences between fluids from the same categories. These differences have theoretical and even practical significance. The development and the wide variety of applied working fluids raise the need for a more sophisticated classification, which contains more precise information about the applicability of the fluid.
Concerning dry fluids, the “dryness” has practical significance and an effect on the layout of the ORC power plant. After the isentropic expansion of the fluid in the expander (turbine), the vapor is in a superheated state. The extent of superheating also has a great effect on the thermal efficiency of the cycle. Also, there is a mainly theoretical issue relating to the dryness of the fluid. If the fluid is “very dry”, it bends back greatly to lower entropies; however, at least underneath the critical point, it becomes possible to fully liquefy vapor using an isentropic compression and vice versa (to fully evaporate liquid using an isentropic expansion) [18].
Another very significant issue relates to the isentropic category. It is not proven, but neither real fluid properties available in the NIST Chemistry Webbook database (NIST) Chemistry Webbook database [29] nor theoretical analyses of model fluids [7,30] confirm the existence of any fluids with a perfectly isentropic saturation vapor curve. It means that, for real or even model fluids, entropy cannot be constant in a finite temperature range. These theoretical analyses also show that probably all isentropic fluids have an S-shaped vapor saturation curve (negative–positive–negative slopes in sequence). In practice, we can find some fluids that approach the “ideal” isentropic behavior at least in a smaller part of the vapor curve, for instance, a common refrigerant, trichlorofluoromethane (CCl3F, R-11). These facts inspired the authors to redefine the meaning of isentropic-type fluids. According to the new definition, the fluid is isentropic if it is possible to find an isentropic expansion line starting from and ending in a saturated vapor state, whereby the expansion line does not enter the two-phase (wet) region. A “real” isentropic-type working fluid can be seen in Figure 2 (biggest diagram), which shows the importance of the reverse S-shaped vapor curve by displaying three isentropic expansion lines (blue, red, and green). In the first case (blue), the working fluid behaves like a wet type, because the expansion ends in the wet region. In the second case (red), isentropic behavior can be observed (initial and final points of the expansion located on the saturation curve). In the third case (green), the fluid shows dry behavior,
Since the expansion ends in the dry (superheated vapor) region. The quality of the vapor during the expansion is maybe the most crucial issue when designing a power plant, since it has strict limits regarding the extent of liquid droplet formation in the expander for safety and lifetime reasons.
3. Novel Classification
3.1. Characteristic Points
The basis of the novel classification is five well-definable characteristic points located on the T–s saturation curve. The relative location or even the existence of these points defines the categories (sequences) and gives them their names. These characteristic points marked by A, C, M, N, and Z can be seen in Figure 2.
Points A and Z are defined as points with the lowest temperature on the saturated liquid and vapor curve, respectively. This temperature is chosen to be the triple-point temperature of the fluid as a physical property, although one might choose another limit which fits more to the given application (for example, environmental temperature, in the case of air-cooled processes). Point C indicates the critical point of the working fluid, which is also a well-defined physical property. Points M and N are defined as the local or even global entropy extrema on the saturated vapor curve. Point M is the one with a higher temperature. Points A, C, and Z can be defined for every working fluid; however, this is not true for points M and N. Wet-type fluids have only points A, C, and Z, while dry-type fluids have point M, but do not have point N. Isentropic-type fluids have both points M and N.
3.2. Sequences (Categories)
According to the relative location and existence of the characteristic points, eight sequences (categories) can be defined, based on the increasing order of corresponding entropy values, namely ACZ, ACZM, AZCM, ANZCM, ANCMZ, ANCZM, ANCMZ, ACNZM, and ACNMZ. There are some more mathematically, but not physically possible sequences forbidden by certain constraints on characteristic points [18]. The names of the sequences mirror the entropy of the characteristic points in ascending order. For a better understanding, see Figure 2.
The novel classification is compatible with the traditional one. Only one wet-type sequence exists, namely ACZ. Two dry-type sequences exist, namely ACZM and AZCM. Five isentropic-type sequences exist, namely ANZCM, ANCZM, ANCMZ, ACNZM, and ACNMZ. The compatibility can be followed in Table 1. All of the listed sequences can be seen in Figure 2. Further information about the characteristic points and a detailed analysis of the sequences can be found in Reference [18].
Table 1 gives examples for most of the sequences. The data for the temperature–entropy diagrams and other physical properties of the fluids are from the NIST database [29]. The database (Table S1, Supplementary Materials) contains 74 working fluids with their saturation curve properties, but no examples of ACZM and ACNZM sequences could be found. Theoretical analyses of the shape of the saturation curve using two equations of state, namely van der Waals [7] and Redlich–Kwong [29], also indicate that there is no working fluid which can be sorted into sequences ACZM or ACNMZ. The two categories, however, could be important if the environmental temperature (for example 15 °C) is used as the lower limit, instead of the triple point. This way, two new practical end-points should be defined for the T–s curve as A* and Z*, corresponding to the state at 15 °C. Then, some of the fluids might show AC*Z*M- and A*CNZ*M-type curves (butane for the first, 1,1-dichloro-1-fluoroethane (R-141b) for the second). These types of transitions are discussed elsewhere [18].
It should be clarified here that, when we use the term “isentropic” for a given class, it does not mean that the corresponding T–s diagram has any non-zero temperature range, where the entropy of the saturated steam is constant. We use “isentropic” in the sense that, for the given T–s curve, it is possible to define a finite isentropic expansion step from a saturated vapor state to another saturated vapor state. On one hand, in a strict sense, it would be better to call these types “pseudo-isentropic”. On the other hand, neither real nor model fluids (see, for example, References [18,28]) can be found with a real isentropic T–s diagram; even the “nearest” ones (like R-11) show a reversed S-shaped saturated vapor curve, yet they are still labeled as isentropic. This is the reason why we use the term “isentropic” instead of creating a new one (pseudo-isentropic) for all categories, where the abovementioned finite isentropic expansion step is possible.
4. Application and Correlations
Novel classification can help in finding thermodynamically optimal working fluids for a given heat source. Since other thermodynamic cycles use various types of working fluids such as refrigeration cycles or heat pumps, creation of a database that contains the main thermodynamic properties and the sequence of the working fluids or refrigerants makes the search even easier and faster. Our database includes 74 working fluids (data taken from the NIST [29]), and continuous updates and expansions can make it valuable not only for researchers, but also for the industry. Since the triple-point temperature of some working fluids is far below the normal environmental circumstances, the database also includes the sequence of all 74 working fluids at 15 °C ambient temperature (TA = 15 °C), as well for a more realistic limit for most applications (except cryogenic cycles [31] where temperature can approach the triple point of most relevant working fluids). The present form of the database is included in Table S1 (Supplementary Materials).
After introducing the novel classification, our research turned to finding a simple, measurable physical property with the help of which it is possible to easily differentiate the eight sequences or at least the traditional categories (dry, wet, and isentropic). Based on the results of studies on model fluids [7], isochoric molar specific heat capacity (cV) seemed to be a proper candidate to establish some correlation with the novel classes. Therefore, our research focused on examining the cV of the saturated vapor curve of real working fluids [32] from the NIST database.
Figure 3 displays the isochoric specific heat capacity values (given in mass-related kJ/kg·K units) of the saturated vapor curve of working fluids available in the NIST database with respect to their reduced temperature (defined as actual temperature in Kelvin divided by the critical temperature of the given fluid, also in Kelvin). Blue lines represent wet-type, red lines represent isentropic-type, and green lines represents dry-type sequences. Circles and squares mark points M and N, previously defined on the temperature–entropy curve of the given material. No correlation between the fluid categories (wet, dry, and isentropic) and the isochoric specific heat capacity values can be seen here. On the other hand, a strong correlation between categories and the isochoric “molar” specific heat capacity was reported for model fluids [7,30].
Using molar heat capacity values might be unusual for engineering applications, but one should be aware that, in several cases, when comparing materials with the same mass—instead of the same mole number—it might be misleading. For example, the isochoric heat capacity of helium—expressed in J/g∙K or kJ/kg∙K—is one order of magnitude higher than that of argon; however, while using J/mol∙K or kJ/kmol∙K, these quantities are equal. The reason for this difference is that the molar mass of argon is ten times higher than the molar mass of helium and, accordingly, in the same mass, one can find ten times more helium atoms than argon ones. Therefore, in certain analyses, the use of properties related to the same amount (instead of the same mass) of substances is advised (i.e., using quantities with mol, instead of kg). Figure 4 displays the molar isochoric specific heat capacity values of the saturated vapor curve of working fluids with respect to their reduced temperature (circles and squares mark points M and N; blue lines represent wet-type, red lines represent isentropic-type, and green lines represent dry-type sequences). Here, one can see a strong correlation between the fluid category and the molar heat capacity. It can easily be seen that wet-type fluids, i.e., ACZ sequences, are located exclusively at the bottom part of the diagram. Above this ACZ region, there is a narrow transition zone where isentropic-type fluids, i.e., ACNMZ sequences, appear. ACNMZ may be said to be the closest in behavior to wet-type fluids (see Figure 2). Right until the appearance of the first dry-type fluid (AZCM), only sequence ACNMZ of isentropic-type fluids can be found. Above this region, only sequences starting with AN, where the characteristic point N has a lower entropy value than point C, exist. The disappearance of sequences starting with AC can be explained by the fact that, if we consider a wet–dry global transition, then isentropic fluids have to reflect this in some intermediate steps; thus, with the increase of cV, they become closer and closer to dry-type behavior, with point N shifting below point C in the entropy scale. As we go higher with cV, only the dry-type sequence AZCM and isentropic-type sequence ANZCM exist. The NIST database seems to have a shortage in dry-type fluids, but it is probable that, above a certain cV value, only dry-type fluids with sequence AZCM can exist. Nevertheless, there are some sequences (AZCM) mixed with isentropic-type fluids; it can also be observed that these fluids have a high triple-point temperature compared to their critical temperature.
In Figure 4, square markers represent characteristic points N, while circle markers represent points M of each fluid. Although a kind of regularity (U-shape) can be discovered in the relative location of the characteristic points, it is still not clear how to find the right way to describe them with a trend line, since these measured values should be supported with theoretical explanation as well. Nevertheless, an outer envelope (dotted curve) can be drawn, and a rule of thumb can be established by appointing the minimum of this envelope as a border point between wet and non-wet fluids. This point is plotted in Figure 3 and is indicated by a triangle marker at the lowest molar isochoric specific heat capacity value of the envelope; here, points M and N are identical. According to this rule, if the isochoric specific heat capacity of a fluid in a saturated vapor state is smaller than 80 J/(mol∙K) at its reduced temperature of 0.74 (0.74∙TC), corresponding to the minimum on the dotted envelope, marked with a triangle, then the fluid is very possibly a wet-type one (ACZ). However, when it is higher than 80 J/(mol∙K), then the fluid is most probably isentropic or dry.
cV (T = 0.74 · Tc) < 80 J/(mol∙K) → wet−type fluid,
cV (T = 0.74 · Tc) ≥ 80 J/(mol∙K) → dry− or isentropic−type fluid.
cV (T = 0.74 · Tc) ≥ 80 J/(mol∙K) → dry− or isentropic−type fluid.
This value almost coincides with characteristic point N of trichlorofluoromethane (CCl3F) that was already said to be practically an “ideal” isentropic fluid; thus, it is one of the best examples for describing the start of the wet isentropic transition region. The difference between the molar entropy of the characteristic points M and N of CCl3F is approximately 0.12 J/(mol∙K); hence, they are almost identical. A similar rule of thumb can be established for the relative position of points C and N; however, so far, it has been made only for model fluids [33].
In addition to this rule of thumb, two other results can be deduced from the presentation used in Figure 4. All cV lines are plotted from the triple-point temperature to the critical one. It can be seen that, for dry working fluids (green lines), the absence of point N is simply caused by the fact that freezing happens at temperatures higher than the expected crossing of the cV line and the outer envelope (represented by the dotted line) of points N and M. It means that, by using dry working fluids, which have the tendency to supercool (i.e., remain liquid for a while below the freezing point, e.g., glycerol), one might obtain wet vapor during expansion instead of the expected dry one. For model fluids (i.e., for fluids described by van der Waals of by Redlich–Kwong equations of state) the presence of this low-temperature local entropy minimum (point N) can be found for all substances [7,30,33], but this is the first indirect experimental proof for its general existence in real fluids.
Finally, one can see that sharp borders between various novel working fluid classes do not exist. However, taking a fixed reduced temperature value (for example, T = 0.74·Tc, given above), one can assume that all fluids with cV > 165 J/(mol∙K) should be either dry or ANZCM-type, while those with 80 J/(mol∙K) < cV < 105 J/(mol∙K) are probably ACNZM-type. These differences are crucial not only for ORC applications, but also for other thermodynamic cycles such as the Trilateral Flash Cycle (TFC) [33].
5. Conclusions
The traditional classification of working fluids with its three categories (wet, dry, isentropic), is not sufficient to reliably predict or exclude the formation of liquid droplets in the low-pressure stage of the expander of an ORC power plant. In this paper, a brief overview is given for a novel and more sophisticated classification [17], which eliminates these deficiencies and makes it easier to select working fluids for ORC applications. The novel classification contains eight categories, also called sequences. These categories have different thermodynamic characteristics and they require different layouts for ORC machinery. A database was created to make the choice of optimal working fluid even easier and faster. The database contains 74 fluids (so far) with their significant thermodynamic properties and their traditional and novel classifications.
Using the location of two of these characteristic points in isochoric (molar) heat capacity–reduced temperature space, a rule of thumb can be defined to distinguish between wet and non-wet working fluids. If the molar isochoric heat capacity of the saturated vapor phase of the given working fluid is smaller than 80 J/(mol∙K) at a temperature 0.74∙Tc, then it is most likely a wet fluid (or ACZ according to the novel classification), while fluids with heat capacity values above this limit (at this temperature) are very likely dry or isentropic. Real fluids show the theoretically proven trend that, with the increase of molar isochoric heat capacity, the fluid is more and more probably isentropic or dry. In a similar way, one can assume that all fluids with cV > 165 J/(mol∙K) at T = 0.74·Tc temperature are either dry or ANZCM-type, while the ones with 80 J/(mol∙K) < cV < 105 J/(mol∙K) are probably ACNZM-type. These correlations can be seen only when isochoric heat capacities are plotted in molar units (in J/(mol∙K)), which shows the importance of molar quantities in comparative analysis. There are other methods—developed by Garrido et al. [12,13] and White et al. [27]—to separate wet fluids from dry (and isentropic) ones, using various quantities. Combining the criterion of isochoric molar heat capacity given in this paper with the other two criteria (given for critical molar volume [27] and for a material-dependent generalized psi-function [12,13]) should give an even more accurate selection method for classifying a fluid as wet or dry/isentropic. Therefore, the usage of the three methods in combination is strongly advised.
Finally, it was shown that, even for the so-called dry fluids, a local entropy maximum (point N) might exist, i.e., they might have a low-temperature part on their saturated vapor line (in the T–s diagram) with a negative slope. Therefore, having a properly deep expansion in these dry fluids, the final state might be wet. Since this part of the saturation curves usually “hides” below the freezing point, it can be relevant only for fluids where supercooling of the liquid phase is possible.
Supplementary Materials
The following are available online at https://www.mdpi.com/1996-1073/12/3/480/s1: Table S1: Temperature and entropy data of characteristic points used for novel classification, novel (sequence-based) classification for the whole temperature range (from triple point to critical point), or the “realistic” temperature range (from 15 °C to critical point), former classification (wet, dry, isentropic).
Author Contributions
G.G., A.G., and A.R.I. developed the concept and worked on the research project; G.G. collected the data; G.G. and A.R.I. performed the calculations; G.G., A.G., and A.R.I. wrote the paper.
Funding
This work was performed in the framework of the FIEK_16-1-2016-0007 project, implemented with the support provided from the National Research, Development, and Innovation Fund of Hungary, financed under the FIEK_16 funding scheme.
Acknowledgments
The APC was covered with the help of the Open Access publication program of the Hungarian Academy of Science.
Conflicts of Interest
The authors declare no conflict of interest.
Nomenclature
| ORC—Organic Rankine Cycle |
| TFC—Trilateral Flash Cycle |
| A—characteristic point A, related to the low-temperature, low-entropy end of the temperature–entropy curve |
| C—characteristic point C, refers to critical point of the fluid |
| M—characteristic point M, related to the local entropy maximum on the saturated vapor curve |
| N—characteristic point N, related to the local entropy minimum on the saturated vapor curve |
| Z—characteristic point Z, related to the low-temperature, high-entropy end of the temperature–entropy curve |
| cV—isochoric molar heat capacity; J/(mol∙K) or isochoric heat capacity J/(kg∙K) |
| s—molar entropy; J/(mol∙K) |
| T—temperature; K |
| Tc—critical temperature; K |
| Tr—reduced temperature; K/K |
References
- Quoilin, S.; Van Den Broek, M.; Declaye, S.; Dewallef, P.; Lemort, V. Technoeconomic survey of Organic Rankine Cycle (ORC) systems. Renew. Sustain. Energy Rev. 2013, 22, 168–186. [Google Scholar] [CrossRef]
- Macchi, E.; Astolfi, M. (Eds.) Organic Rankine Cycle (ORC) Power Systems: Technologies and Applications; Elsevier: Amsterdam, The Netherlands, 2016. [Google Scholar]
- Mayer, M.J.; Nyerges, V.; Schróth, Á. Investigation of Geothermal Power Generation on Abandoned Hydrocarbon Wells. IEEE Xplore 2015. [Google Scholar] [CrossRef]
- Zhang, C.; Fu, J.; Yuan, P.; Liu, J. Guidelines for Optimal Selection of Subcritical Low-Temperature Geothermal Organic Rankine Cycle Configuration Considering Reinjection Temperature Limits. Energies 2018, 11, 2878. [Google Scholar] [CrossRef]
- Varga, Z.; Palotai, B. Comparison of low temperature waste heat recovery methods. Energy 2017, 137, 1286–1292. [Google Scholar] [CrossRef]
- ORC World Map. Available online: http://orc-world-map.org/ (accessed on 12 September 2018).
- Groniewsky, A.; Györke, G.; Imre, A.R. Description of wet-to-dry transition in model ORC working fluids. Appl. Therm. Eng. 2017, 125, 963–971. [Google Scholar] [CrossRef]
- Ziviani, D.; James, N.A.; Accorsi, F.A.; Braun, J.E.; Groll, E.A. Experimental and numerical analyses of a 5 kWe oil-free open-drive scroll expander for small-scale organic Rankine cycle (ORC) applications. Appl. Energy 2018, 230, 1140–1156. [Google Scholar] [CrossRef]
- Hou, X.C.; Zhang, H.G.; Yu, F.; Liu, H.D.; Yang, F.B.; Xu, Y.H.; Tian, Y.N.; Li, G.S. Free piston expander-linear generator used for organic Rankine cycle waste heat recovery system. Appl. Energy 2017, 208, 1297–1307. [Google Scholar] [CrossRef]
- Alshammari, F.; Karvountzis-Kontakiotis, A.; Apostolos Pesyridis, A.; Usman, M. Expander Technologies for Automotive Engine Organic Rankine Cycle Applications. Energies 2018, 11, 1905. [Google Scholar] [CrossRef]
- Leduc, P.; Smague, P.; Leroux, A.; Henry, G. Low temperature heat recovery in engine coolant for stationary and road transport applications. Energy Procedia 2017, 129, 834–842. [Google Scholar] [CrossRef]
- Garrido, J.M.; Quinteros-Lama, H.; Mejía, A.; Wisniak, J.; Segura, H. A rigorous approach for predicting the slope and curvature of the temperature-entropy saturation boundary of pure fluids. Energy 2012, 45, 888–899. [Google Scholar] [CrossRef]
- Albornoz, J.; Mejía, A.; Quinteros-Lama, H.; Garrido, J.M. A rigorous and accurate approach for predicting the wet-to-dry transition for working mixtures in organic Rankine cycles. Energy 2018, 156, 509–519. [Google Scholar] [CrossRef]
- Wang, J.; Zhang, J.; Chen, Z. Molecular entropy, thermal efficiency, and designing of working fluids for Organic Rankine Cycles. Int. J. Thermophys. 2012, 33, 970–985. [Google Scholar] [CrossRef]
- He, C.; Liu, C.; Gao, H.; Xie, H.; Li, Y.; Wu, S.; Xu, J. The optimal evaporation temperature and working fluids for subcritical organic Rankine cycle. Energy 2012, 38, 136–143. [Google Scholar] [CrossRef]
- Wang, Z.Q.; Zhou, N.J.; Guo, J.; Wang, X.Y. Fluid selection and parametric optimization of organic Rankine cycle using low temperature waste heat. Energy 2012, 40, 107–115. [Google Scholar] [CrossRef]
- Imre, A.R.; Quinones-Cisneros, S.E.; Deiters, U.K. Adiabatic processes in the liquid–vapor two-phase region—1. Pure fluids. Ind. Eng. Chem. Res. 2014, 53, 13529–13542. [Google Scholar] [CrossRef]
- Györke, G.; Deiters, U.K.; Groniewsky, A.; Lassu, I.; Imre, A.R. Novel classification of pure working fluids for Organic Rankine Cycle. Energy 2018, 145, 288–300. [Google Scholar] [CrossRef]
- Zare, V.; Mahmoudi, S.M.S. A thermodynamic comparison between organic Rankine and Kalina cycles for waste heat recovery from the Gas Turbine-Modular Helium Reactor. Energy 2015, 79, 398–406. [Google Scholar] [CrossRef]
- Chidambaram, P.K.; Kim, H.D. A numerical study on the water droplet erosion of blade surfaces. Comput. Fluids 2018, 164, 125–129. [Google Scholar] [CrossRef]
- Badr, O.; Probert, S.D.; O’Callaghan, P.W. Selecting a Working Fluid for a Rankine-Cycle Engine. Appl. Energy 1985, 21, 1–42. [Google Scholar] [CrossRef]
- Wang, E.H.; Zhang, H.G.; Fan, B.Y.; Ouyang, M.G.; Zhao, Y.; Mu, Q.H. Study of working fluid selection of organic Rankine cycle (ORC) for engine waste heat recovery. Energy 2011, 36, 3406–3418. [Google Scholar] [CrossRef] [Green Version]
- Bao, J.; Zhao, L. A review of working fluid and expander selections for Organic Rankine Cycle. Renew. Sustain. Energy Rev. 2013, 24, 325–342. [Google Scholar] [CrossRef]
- Chen, H.; Goswami, D.Y.; Stefanakos, E.K. A review of thermodynamic cycles and working fluids for the conversion of low grade heat. Renew. Sustain. Energy Rev. 2010, 14, 3059–3067. [Google Scholar] [CrossRef]
- Tabor, H.; Bronicki, L. Establishing Criteria for Fluids for Small Vapor Turbines. SAE Tech. Pap. 1964, 640823. [Google Scholar] [CrossRef]
- Liu, B.-T.; Chien, K.-H.; Wang, C.-C. Effect of working fluids on organic Rankine cycle for waste heat recovery. Energy 2004, 29, 1207–1217. [Google Scholar] [CrossRef]
- White, J.A.; Velasco, S. Characterizing wet and dry fluids in temperature-entropy diagrams. Energy 2018, 154, 269–276. [Google Scholar] [CrossRef]
- White, J.A.; Velasco, S. A Simple Semiempirical Method for Predicting the Temperature–Entropy Saturation Curve of Pure Fluids. Ind. Eng. Chem. Res. 2019, 58, 1038–1043. [Google Scholar] [CrossRef]
- NIST Chemistry WebBook. Available online: http://webbook.nist.gov/ (accessed on 12 September 2018).
- Groniewsky, A.; Imre, A.R. Prediction of the ORC Working Fluid’s Temperature Entropy Saturation Boundary Using Redlich-Kwong Equation of State. Entropy 2018, 20, 93. [Google Scholar] [CrossRef]
- Sadaghiani, M.S.; Ahmadi, M.H.; Mehrpooya, M.; Pourfayaz, F.; Feidt, M. Process development and thermodynamic analysis of a novel power generation plant driven by geothermal energy with liquefied natural gas as its heat sink. Appl. Therm. Eng. 2018, 133, 645–658. [Google Scholar] [CrossRef]
- Györke, G.; Groniewsky, A.; Imre, A.R. Classification of pure working fluids for Organic Rankine Cycle. In Proceedings of the 3rd South East European Conference on Sustainable Development of Energy, Water and Environment Systems (3rd SEE SDEWES), Novi Sad, Serbia, 30 June–4 July 2018. Abstract No. 0101. [Google Scholar]
- Imre, A.R.; Groniewsky, A. Various ways of adiabatic expansion in Organic Rankine Cycle (ORC) and in Trilateral Flash Cycle (TFC). Z. Phys. Chem. 2018. [Google Scholar] [CrossRef]
Figure 1.
Traditional categorization: wet, dry, and isentropic. Curves represent saturated states. One-phase states are located above the saturation curves (liquid states: low-entropy side; vapor states: high-entropy side). Two-phase states (liquid + vapor) are located below the saturation curve. Lines 1 and 2 represent isentropic expansion processes (see corresponding text).
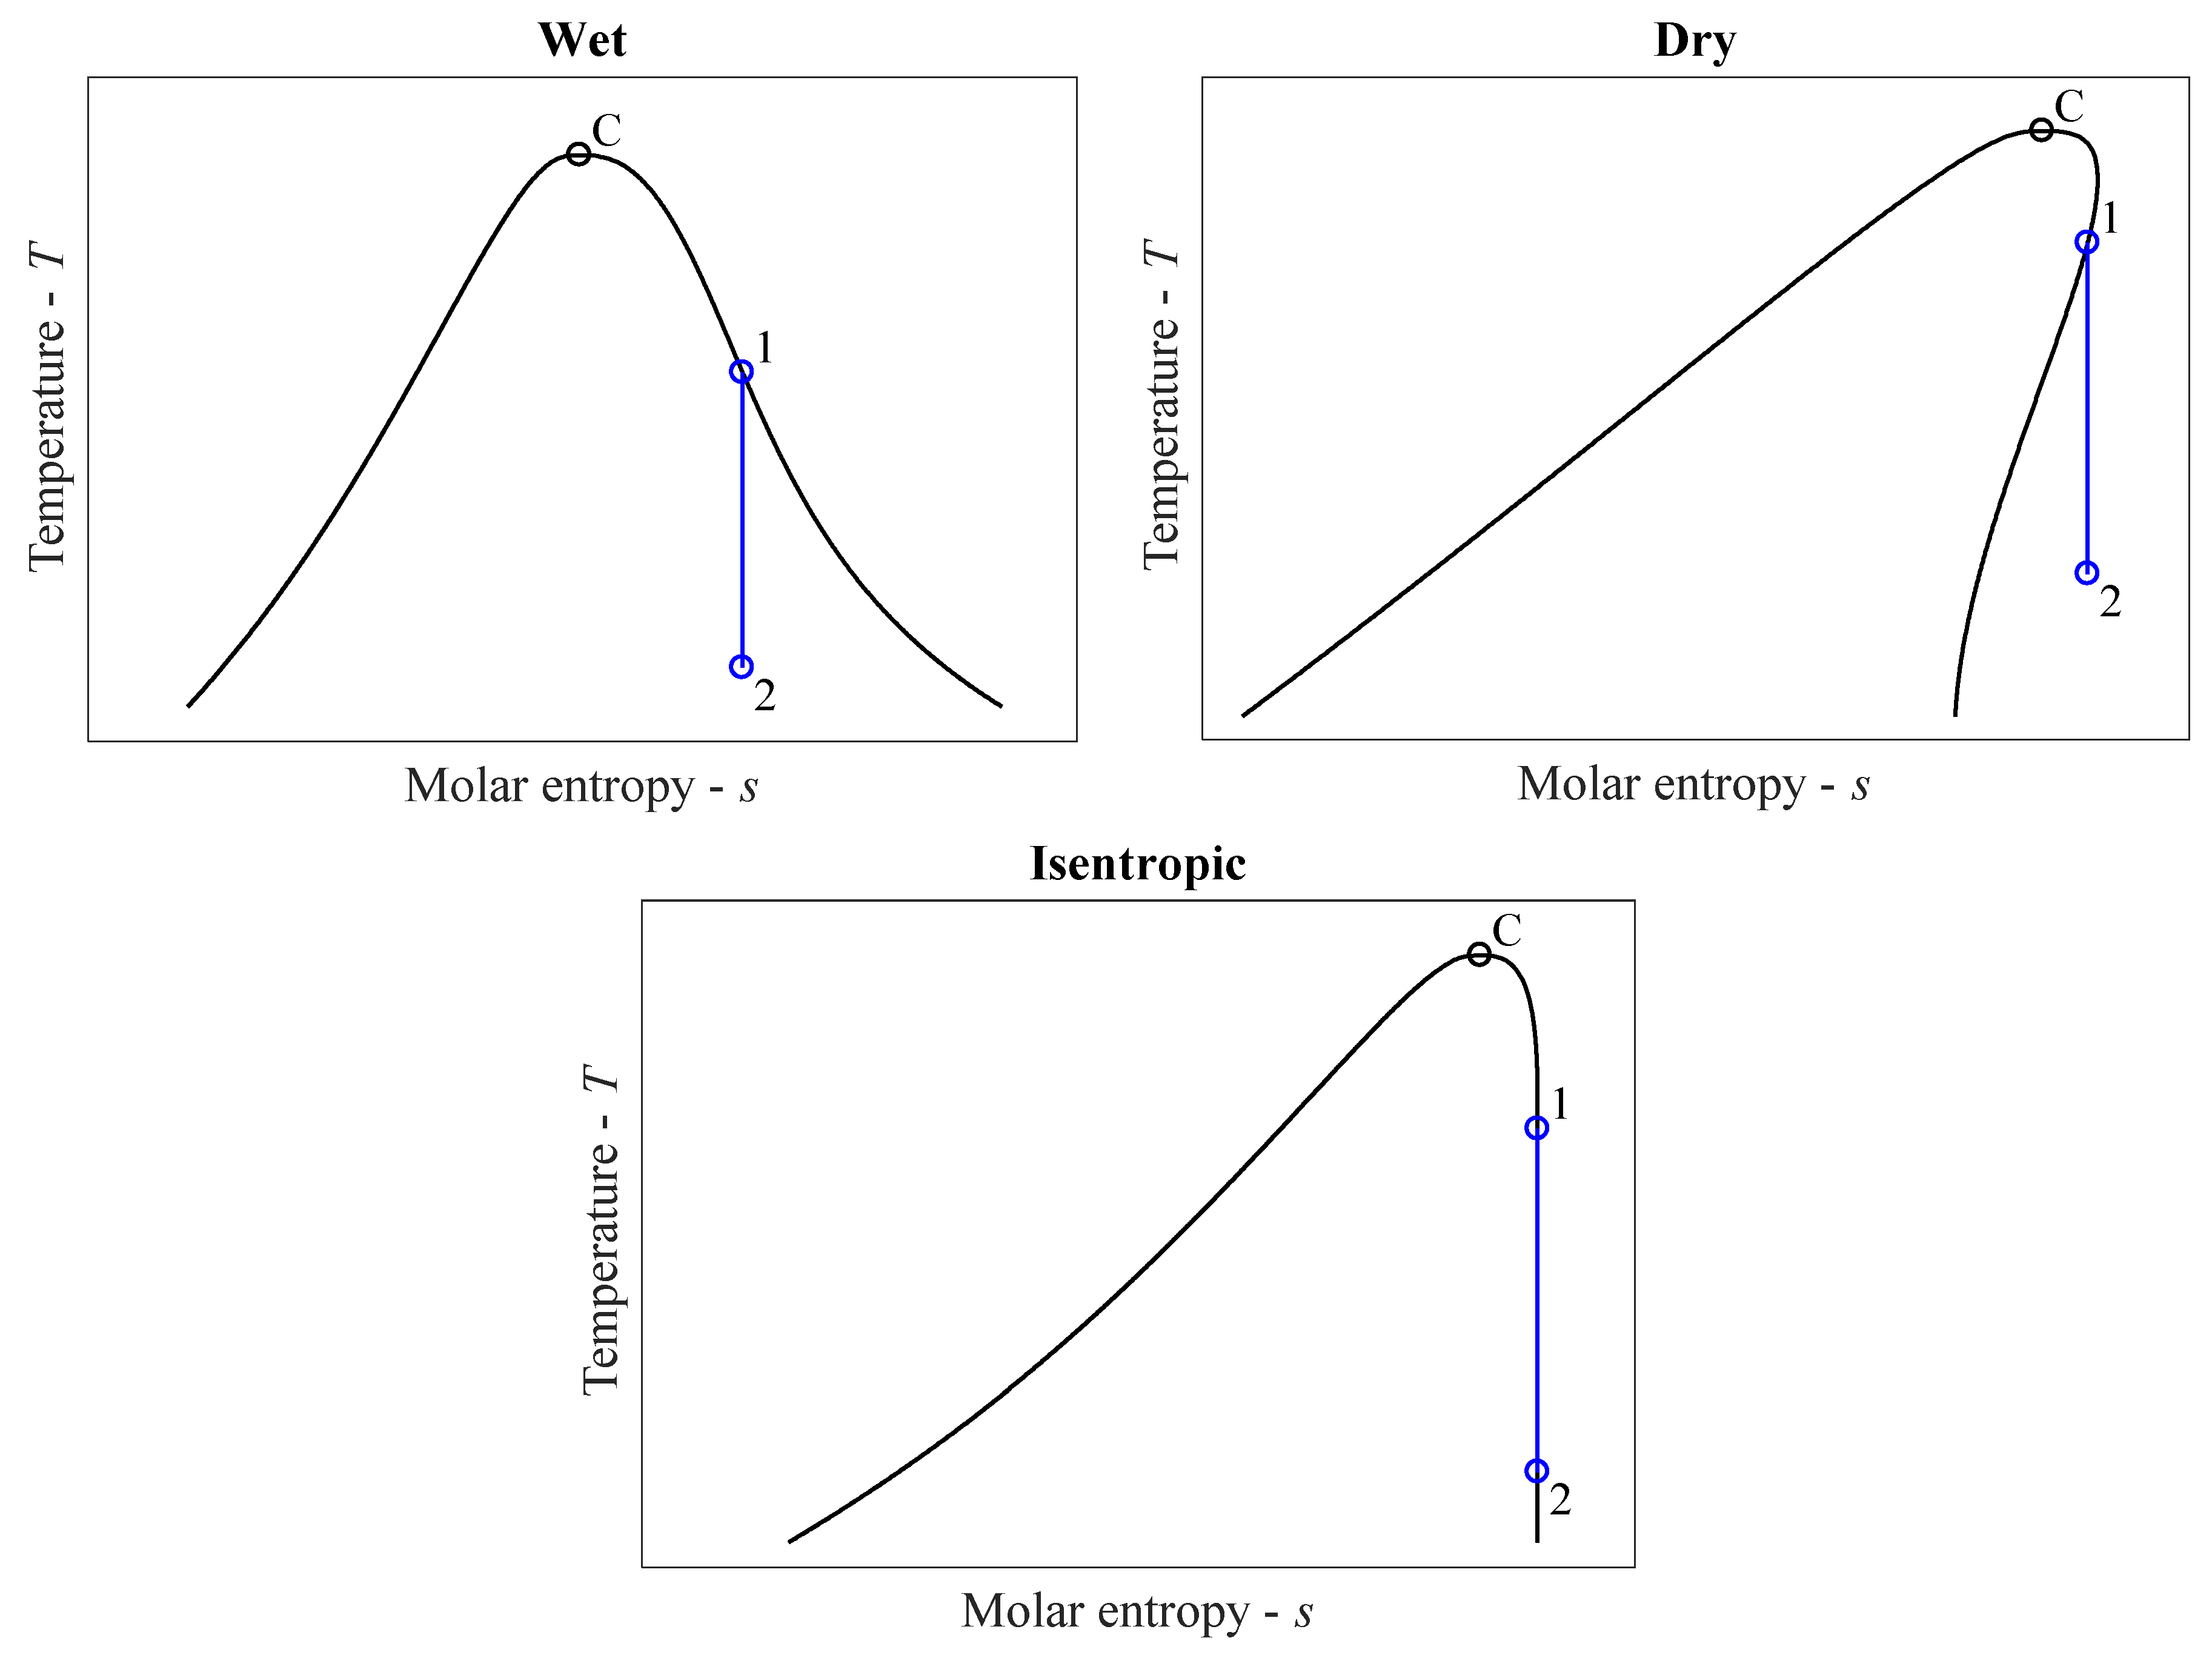
Figure 2.
Novel classification: visualization of characteristic points and the novel eight categories (sequences). a detailed description, see corresponding text below or for further details, Reference [18].
Figure 2.
Novel classification: visualization of characteristic points and the novel eight categories (sequences). a detailed description, see corresponding text below or for further details, Reference [18].

Figure 3.
Isochoric specific heat capacity (kJ/kg·K) curves of various working fluids in saturated vapor conditions; blue, red, and green curves represent wet, isentropic, and dry materials, respectively. Squares and circles represent points N (lower temperature) and M (higher temperature).
Figure 3.
Isochoric specific heat capacity (kJ/kg·K) curves of various working fluids in saturated vapor conditions; blue, red, and green curves represent wet, isentropic, and dry materials, respectively. Squares and circles represent points N (lower temperature) and M (higher temperature).

Figure 4.
Molar isochoric specific heat capacity (kJ/mol·K) curves of various working fluids in saturated vapor conditions; blue, red, and green curves represent wet, isentropic, and dry materials, respectively. Squares and circles represent points N (lower temperature) and M (higher temperature). The triangle shows the border between wet and non-wet fluids, located at Tr = 0.74 and cV = 80 J/mol∙K. The dotted curve represents the outer envelope for points M and N.


Table 1.
Examples of the new categories.
| Novel Classification | Traditional Category | Working Fluid |
|---|---|---|
| ACZ | wet | water, carbon dioxide |
| ACZM | dry | — |
| AZCM | dry | neopentane, dodecane |
| ANZCM | isentropic | hexane, heptane |
| ANCZM | isentropic | benzene |
| ANCMZ | isentropic | pentane, toluene |
| ACNZM | isentropic | — |
| ACNMZ | isentropic | butane, trichlorofluoromethane |
© 2019 by the authors. Licensee MDPI, Basel, Switzerland. This article is an open access article distributed under the terms and conditions of the Creative Commons Attribution (CC BY) license (http://creativecommons.org/licenses/by/4.0/).
Share and Cite
MDPI and ACS Style
Györke, G.; Groniewsky, A.; Imre, A.R. A Simple Method of Finding New Dry and Isentropic Working Fluids for Organic Rankine Cycle. Energies 2019, 12, 480. https://doi.org/10.3390/en12030480
AMA Style
Györke G, Groniewsky A, Imre AR. A Simple Method of Finding New Dry and Isentropic Working Fluids for Organic Rankine Cycle. Energies. 2019; 12(3):480. https://doi.org/10.3390/en12030480
Chicago/Turabian StyleGyörke, Gábor, Axel Groniewsky, and Attila R. Imre. 2019. "A Simple Method of Finding New Dry and Isentropic Working Fluids for Organic Rankine Cycle" Energies 12, no. 3: 480. https://doi.org/10.3390/en12030480
Note that from the first issue of 2016, this journal uses article numbers instead of page numbers. See further details here.