Sensitivity Analysis of Fuel Injection Characteristics of GDI Injector to Injector Nozzle Diameter

School of Energy and Power Engineering, Shandong University, Jinan 250061, China
*
Author to whom correspondence should be addressed.
Energies 2019, 12(3), 434; https://doi.org/10.3390/en12030434
Submission received: 23 December 2018
/
Revised: 23 January 2019
/
Accepted: 24 January 2019
/
Published: 30 January 2019
Abstract
:The accuracy of a nozzle diameter directly affects the difference of the injection characteristics between the holes and productions of a GDI (gasoline direct injection) injector. In order to reduce the difference and guarantee uniform injection characteristics, this paper carried out a CFD simulation of the effect of nozzle diameter which fluctuated in a small range on single-cycle fuel mass. The sensitivity of the fuel injection quantity to the injector nozzle diameter was obtained. The results showed that the liquid phase ratio at the nozzle outlet decreased and the velocity of the outlet increased with the increase of the nozzle diameter. When fluctuating in a small range of nozzle diameters, the sensitivity of the single-hole fuel mass to the nozzle diameter remained constant. The increase of the injection pressure lead to the increase of the sensitivity coefficient of the single-hole fuel mass to the nozzle diameter. The development of cavitation in the nozzle and the deviation of the fuel jet from the axis were aggravated with the increase of the injection pressure. However, the fluctuation in a small range of nozzles had little effect on the near-nozzle flow.
1. Introduction
The internal flow characteristics of injector nozzle and the mechanism of spray fragmentation in gasoline engine are complex, and their characteristics directly affect the mixing process in the cylinder. They also affect the combustion process and emission characteristics of the engine. Therefore, a GDI injector plays an important role in the power, economy, and emission of a GDI engine [1]. The cavitation phenomenon easily occurs in the injector nozzle once pressure is lower than the saturated vapor pressure [2]. Hence, cavitation could strengthen the turbulent flow and improve spray characteristics [3,4]. However, it may also affect the mass flow of the injector nozzle significantly [5]. The structure of a GDI injector nozzle has an important influence on its internal cavitation and flow state, which greatly affects the velocity, mass flow rate, and turbulent kinetic energy distribution at the outlet of the nozzle [6,7]. The processing quality of the injector leads to differences in the circulation of the fuel injection between injectors, which leads to an uneven performance of each cylinder in the engine [8]. In order to obtain an accurate fuel controlling and uniform spray characteristics, it is necessary to study the influence of the local structural parameters of the nozzle on the injection characteristics. It is also necessary to provide guidance for the processing accuracy by studying the sensitivity of the structure of the injection characteristics.
The internal flow of the injector is a very complicated flow process. Through visual experiments, Huang et al. studied the effects of the injection pressure and hole diameter on the atomization of diesel blends. The results showed that the increase of the nozzle diameter would lead to the increase of the spray penetration distance and cone angle. Furthermore, the increase of the nozzle diameter would directly lead to the increase of the fuel injection quantity and the deterioration of fuel atomization characteristics [9,10]. Li et al. studied the effects of the injection pressure and the ratio of length to diameter of the nozzle on the velocity and flow rate. They discovered that there was a linear relationship between the velocity ratio at the outlet of the nozzle [11]. Han et al. analyzed the initial fragmentation state and the development process of spray with different nozzle structures. They discovered that the entrance structure of nozzles directly affected the cavitation phenomenon, which resulted in the difference of the initial fragmentation state [12]. Moon et al. found that with the increase of the length–diameter ratio of the nozzle, the flow velocity along the nozzle axis increased and the penetration distance increased [13]. Saha et al. analyzed the gas–liquid phase in the nozzle under different pressures by the simulation method. Their results showed that the phenomenon of cavitation increased with the increase of the pressure difference [14].
In summary, the injector nozzle diameter has an important influence on the single hole cycle fuel injection rate and spray shape. In order to reduce the differences of the fuel injection characteristics between injectors and the inhomogeneity of each cylinder, it is necessary to analyze and study the differences caused by the machining accuracy of the injection nozzle diameter. The method of CFD (Computational Fluid Dynamics) simulation analysis is used in this paper. The effect of a small range fluctuation of the GDI injector nozzle diameter on the injection characteristics is studied via quantitative analysis. The sensitivity of the single-hole cycle fuel mass to the nozzle diameter is studied, and the influence of the injection pressure on its sensitivity strength is analyzed. The influence of the fuel injection state on the spray characteristics is also analyzed based on the liquid fraction volume of the nozzle outlet. Our findings could be used to guide machining technology and the precision of the injection hole diameter of the GDI injector under different injection pressures.
2. Basic Mathematical Model
The analytical process follows mass conservation, kinetic energy conservation, and the continuity equation. On this basis, the κ − ε turbulence model, the Euler model, and the Rayleigh equation considering cavitation change are used [15].
(1) Cavitation model
The Rayleigh equation is a differential equation used to simulate the motion of a hollow bubble in a fluid. The non-linear cavitation model takes into account all the terms in the Rayleigh equation. The bubble radius R time derivative is expressed using the Rayleigh equation as:
Then the interfacial mass exchange term becomes:
where is the bubble number density, is the pressure difference between the inside and outside of bubble, is the liquid phase density and is the gas phase density.
Based on the Rayleigh equation, the mass exchange of the gas–liquid phase is calculated and then the gas-phase and liquid-phase, respectively, follow their conservation equation of momentum, energy, and mass.
(2) Mass flow equation
Because of the short duration of the injection pulse width, it can be assumed that there is no heat exchange with the outside world during the process, the temperature of the fluid remains constant, and the influence of gravity is ignored. The inlet velocity of the injector is as follows: m/s. According to the Bernoulli equation of incompressible fluid:
where pin is the injection pressure Pa, pb is the back pressure Pa, ρ is the density Kg/m3, is the inlet velocity m/s, is the outlet velocity m/s.
The mass flow equation can be expressed as:
where
is the mass flow Kg/s, Cd is the discharge coefficient, A is the section area of the nozzle outlet m2.
From Formulas (3) and (4), the injection rate formula of the GDI injector hole is obtained as follows:
where is the pressure difference between the inlet and outlet of the nozzle.
(3) Sensitivity coefficient
In order to analyze the variation of the cycle injection fuel mass caused by the change of the nozzle diameter, the sensitivity coefficient is proposed and the equation is expressed as:
where, Sr is sensitivity coefficient, Δd is the change of the nozzle diameter, Δm is the change of single-nozzle cycle injection fuel mass.
3. Problem Description
Based on the GDI injector which is commonlyused [16,17,18], the nozzle called “Spray G” is shown in Figure 1a. Figure 1b shows that the head structure of the GDI injector includes a needle valve head, needle valve seat, and six injection holes. Due to the six injection holes which are distributed evenly around the injector axis, one-sixth of the injector fluid domain model is abstracted and meshed by CFD code AVL-FIRE, as shown in Figure 1c. The injector needle moves in accordance with the needle lift curve, as shown in Figure 1c. The mesh model contains a pressure inlet boundary (BND_inlet), a pressure outlet boundary (BND_Outlet), moving boundary of needle and symmetry boundary.
Figure 2 shows the structural parameters of the GDI injector nozzle. It includes an inner nozzle and an outer nozzle. The structure parameters of the inner nozzle contain the diameter d, length L1, and inlet round r. The structure parameters of the outer nozzle contain the diameter D, length L2 round R. The nozzle angle is α. The detail value, boundary conditions, and mathematical models can be found in Table 1.
4. Validation of Mathematical Model
To validate the above mathematical models, a structural nozzle (α = 0) is used in the following experiment setup, which is shown in Figure 3a. The model is established and meshed by the CFD code AVL-FIRE. The mesh is shown in Figure 3b. The numerical results could be validated by the experimental measurements of the mass flow rate, momentum flux, or effective injection velocity [19]. In order to validate the effectiveness of the turbulence model and cavitation model, we compared the development of cavitation under different inlet pressures with images which were obtained by visualization technology. Next, the turbulence was tested by a mass flow comparison between the simulation and experimental results.
To validate the effectiveness of the multi-phase model, experiment data were compared to identify the simulation model. A fuel pump test bench was used to investigate cavitation in the nozzle, as shown in Figure 3c. The practical nozzle had a diameter of 0.2 mm and a length of 2 mm. As the nozzle was magnified five times, the present experimental nozzle had a diameter of 1 mm and a length of 10 mm. All the specifications of the test apparatus were based on the similarity principle, which is the same cavitation number (Table 2). The cavitation number was given by CN = (pin − pv)/(pin − pb), in which pv = 0.0352 MPa is saturated vapor pressure. In the experiment process, the mass flow of the nozzle outlet was measured under different injection pressures and back pressures with a constant ambient temperature of 25 °C.
The simulation and experiment results of cavitation inception and development, and the stable stage of cavitation in the nozzle were compared in Figure 4. The cavitation phenomenon started at the nozzle orifice under pin = 1.8 MPa and back pressure pb = 0.3 MPa, and the cavitation area continued to expand from the entrance to the nozzle outlet with the increasing of the pin. As the pin went up to 5 MPa, the cavitation area almost reached a stable cavitation. Thus, the mathematic model was deemed suitable for the analysis of the cavitation phenomenon in an injector nozzle.
Figure 5a showed that the mass flow of the nozzle exit changed as the mesh number increased, while the mass flow remained stable even though the grid number became larger. Figure 5b showed the comparison of the mass flow of the nozzle-outlet between the simulation and experiment results under different injection pressures for the back pressure pb = 0.3 MPa. This comparison indicated that the trends of the experiment and simulation results were consistent: The mass flow rose with the increase of the differential pressure and the deviation was no more than 8%. In other words, the established model was effective for researching cavitation in the nozzle based on the results of the phase cut-plane and mass-flow curve.
5. Results and Discussions
5.1. Influences of Injection Pressure on Injection Process
Figure 6a showed the injection law curve under different injection pressures. The diameter of the injection hole was 0.15 mm and the back pressure of the injection was 0.5 MPa. To easily analyze the influence of the different injection pressures on the injection process, the injection process was divided into the initial injection period, the transition period, and the stable period. In the initial stage of injection, with the opening of the needle valve, the injection rate increased rapidly. This was due to the opening of the needle valve and the increase of the minimum flow cross section in the injector, which resulted in the rapid increase of the injection rate. During the initial injection period, the increase of fuel injection rate increased with the increase of the injection pressure. According to the mass flow Formula (5), the increase of the injection rate was proportional to the square root of the pressure difference (). During the transition period, the injection rate increased slowly and tended to stabilize gradually. The transition period became shorter with the increase of the injection pressure. At this stage, the minimum cross-section of the fuel flow was transferred from the needle valve control area to the nozzle area, as shown in Figure 6b. Through the comparison and analysis of the velocity field and cavitation development process, we found that the gas phase and liquid phase flow velocity in the injection hole increased and the injection rate became stable more quickly with the increase of the injection pressure. During the stable period, the steady injection rate increased with the increase of the injection pressure, and the increase amplitude of the injection rate decreased gradually.
Figure 6c showed the variation of the injection rate and nozzle exit velocity with the injection pressure during the steady state period. The mass flow rate of the nozzle and the jet velocity at the outlet showed the same change tendency which rose with the increase of the injection pressure. According to the gas and liquid phase distribution and pressure distribution of the injection hole in the steady state period of each injection pressure in Figure 7, it could be seen that with the increase of the injection pressure, the low pressure region on the wall of the nozzle hole increased, the cavitation degree increased, and the liquid phase duty ratio decreased. As a result, the effective fuel flow area would reduce. When the injection pressure was 15 MPa, the volume fraction of the liquid phase at the exit section was about 0.9025. When the injection pressure was increased to 35 MPa, the volume fraction of the liquid phase decreased to 0.8769.
5.2. Sensitivity Analysis of Fuel Injection Characteristics to Nozzle Diameter
Figure 8a showed the injection mass flow under different injector nozzle diameters under the injection pressure of 35 MPa and the injection back pressure of 0.5 MPa. Under the current injector nozzle structure, the transition period of the fuel injection rate became shorter with the increase of the nozzle diameter. According to the mass conservation equation,
where is the entrance cross-section area and remains unchanged.
Formulas (3) and (7) are simultaneous:
It can be concluded that the pressure differences of the injection remained constant, and the flow velocity increased with the increase of the nozzle diameter. The internal cavitation state of the different nozzle diameters at t = 0.34 ms was also shown in the diagram. With the increase of the nozzle diameter, the flow velocity in the nozzle increased, which lead to the acceleration of the development of cavitation in the nozzle outlet, and promoted the stability of the gas–liquid ratio in the nozzle. Figure 8b showed the single-hole cycle injection fuel mass and flow coefficient under different nozzle diameters. According to the mass flow calculation Formula (5), the relationship between the nozzle diameter and injection mass flow was expressed as the following equation:
It can be seen that the circulating injection fuel mass of the single-nozzle should be quadratic with the nozzle diameter. However, due to the small variation range of the nozzle diameter, the injection quantity of the single-hole cycle can be approximately regarded as a linear change with the increase of the injector nozzle diameter. As a result, the sensitivity coefficient of the circulation injection fuel mass of the single-nozzle to the nozzle diameter is constant. In order to describe the relationship between the fuel injection rate and nozzle diameter, a linear function was used to fit the model.
The linear function was expressed as:
where K is the slope of fitting curve, m is the single nozzle cycle fuel injection, b is the constant term.
As a result, the linear function was .
In order to understand clearly the influence of the nozzle diameter on the single-hole circulating injection quantity, Figure 9 showed the relationship between the liquid phase ratio and the effective flow cross section with the nozzle diameter during the steady state period. It can be seen from the figure that with the increase of the nozzle diameter, the flow velocity in the nozzle increased and the negative pressure region became larger. Finally, the cavitation phenomenon intensified, which resulted in the decrease of the liquid phase ratio at the nozzle outlet. The effective flow cross-section area at nozzle outlet was calculated by liquid phase ratio, the effective flow cross-section area increased with the increase of the nozzle diameter.
5.3. Sensitivity Coefficient of Fuel Mass to the Nozzle Diameter under Different Injection Pressures
Figure 10 showed the variation of the fuel injection rate of the single-hole cycle with the increase of the nozzle diameter under different injection pressures. The single-nozzle injection fuel mass under different injection pressures showed the same trend, and increased approximately linearly with the increase of the nozzle diameter. In order to analyze the effect of the injection pressure on the sensitivity coefficient of the single nozzle cycle fuel injection to the nozzle diameter, the sensitivity coefficients corresponding to the nozzle diameter were obtained by using Formula (6), as shown in Figure 10b. The sensitivity coefficient corresponding to the injector nozzle diameter increased nonlinearly with the increase of the injection pressure. This indicated that the increase of the injection pressure lead to the enhancement of the sensitivity of the fuel mass to the nozzle diameter. Therefore, with the increase of injection pressure, the requirement for the processing quality of GDI nozzle diameter should be improved.
A fitting function was proposed to describe the variation of the cyclic fuel mass with the increase of the nozzle diameter and injection pressure. Figure 10b showed the slope (i.e., sensitivity coefficient) and cyclic fuel mass at d = 0.14 mm under different injection pressures. As can be seen from the graph, the initial value and slope increased exponentially with the increase of the injection pressure. Therefore, the equation of the initial value could be expressed as:
where y0 = 6.33644, A = −5.72808 and t = 47.46531. The fitting accuracy: The maximum relative error is 1.4‰. Therefore, the point (0.14, md = 0.14) would describe the fuel mass of d = 0.14 mm under different injection pressures. The constant term b could be expressed as:
The equation of the slope could be expressed as:
where y1 = 73.79519, A1 = −62.03988 and t1 = 48.67904. The fitting accuracy: The maximum relative error is 0.8‰.
Formulas (10)–(13) were combined to obtain the fitting function, which could be expressed as:
The current machining accuracy of the injection hole was ±2 μm [20]. When the injection pressure was 15 MPa, the fluctuation range of the single-nozzle circulating injection fuel mass could be obtained according to Formula (13). In order to ensure the same difference of the single-hole cycle fuel mass (absolute error), when the injection pressure increased to 35 MPa, the machining error of the nozzle diameter must be reduced to ±1.2 μm.
5.4. The Effect of the Nozzle Diameter on the Fuel Jet Condition of Near-Nozzle
To gain a comprehensive understanding on the effect of the nozzle and injection pressure on the fuel jet condition of the near-nozzle area, Figure 11 displayed the cut-planes of the gas–liquid ratio under different injection pressures and nozzle diameters. Section A-A represented the small nozzle outlet and section B-B represented the large nozzle outlet of the GDI injector. In the diagram, with the increase of injection pressure, the degree of cavitation in the nozzle increased, the gas fraction volume of section A-A increased and the liquid phase shape of section B-B had obvious eccentricity. This indicated that the cavitation in the nozzle promoted the mixing of liquid fuel gasification and air. With the increase of the nozzle diameter, the liquid volume fraction of section A-A decreased and the liquid fuel distribution of section B-B became slightly eccentric. Especially when the injection pressure was high, the fluctuation of the diameter of the jet hole had a lower influence on the jet state near the orifice region. Therefore, in determining the machining process and accuracy of the nozzle diameter, the influence of the nozzle diameter on the near-nozzle flow characteristic could be neglected, but the increasing of the injection pressure obviously aggravated the jet eccentricity of nozzle outlet.
6. Conclusions and Outlook
The effects of the small range fluctuation and injection pressure on the flow characteristics in the nozzle were simulated and the following conclusions were obtained.
- The increase of the injection pressure accelerated the stability of the flow in the injector nozzle, intensified the cavitation in the nozzle, and decreased the liquid fraction volume of the nozzle outlet.
- The increase of the nozzle diameter increased the flow velocity of the nozzle outlet, shortened the transition period, and accelerated the stability of the fuel injection rate. The cycle injection fuel mass increased linearly with the increase of the nozzle diameter.
- The sensitivity of the circulating injection volume to nozzle diameter became strong with the increase of the injection pressure. A fitting function was proposed to calculate the effect of the nozzle diameter and injection pressure on the fuel mass, and it could be used to provide guidance for the choice of machining accuracy of the nozzle diameter.
- Through the analysis of the flow characteristic near-nozzle field, the effect of the fluctuation in the small range of the diameter of the nozzle on the flow near the orifice was small. However, the increase of the injection pressure intensified cavitation in the nozzle and aggravated the deviation of the outlet liquid from the nozzle axis.
Outlook
In this paper, only the fluctuation of the nozzle diameter and the influence of the injection pressure on the flow characteristics in the injection hole were studied. In subsequent studies, more factors (e.g., the nozzle length, rounded nozzle orifice, nozzle angle and temperature) and the relationship between them will be considered to optimize the injector performance.
Author Contributions
Conceptualization, Y.C.; Methodology, X.L.; Software, X.L.; Validation, X.L. and X.Y.; Formal Analysis, X.L.; Investigation, S.J.; Resources, Y.C.; Writing—Original Draft Preparation, X.L.; Writing—Review & Editing, X.L.; Visualization, L.W.; Supervision, Y.C.; Project Administration, Y.C.; please turn to the CRediT taxonomy for the term explanation. Authorship must be limited to those who have contributed substantially to the work reported.
Funding
This research received no external funding.
Conflicts of Interest
The authors declare no conflict of interest.
References
- Li, B.; Li, Y.Q.; Wang, D.F. Numerical Simulation and Experiment on Spray Characteristics of GDI Engines. Trans. Csice 2012, 1, 9–15. [Google Scholar]
- Tao, Q.; Xin, S.; Yan, L.; Hui, X. Cavitation Process and Flow Characteristics inside Diesel Injector Nozzle. Trans. Chin. Soc. Agric. Mach. 2016. [Google Scholar] [CrossRef]
- Knorsch, T.; Mamaikin, D.; Leick, P.; Rogler, P.; Wang, J.; Li, Z.; Wensing, M. Comparison of Shadowgraph Imaging, Laser-Doppler Anemometry and X-Ray Imaging for the Analysis of Near Nozzle Velocities of GDI Fuel Injectors. Int. Powertrainsfuels Lubr. Meet. 2017. [Google Scholar] [CrossRef]
- Knorsch, T.; Rogler, P.; Miller, M.; Wiese, W. On the evaluation methods for systematic further development of direct-injection nozzles. SAE Int. Powertrainsfuels Lubr. Meet. 2016. [Google Scholar] [CrossRef]
- He, Z.; Zhong, W.; Wang, Q.; Jiang, Z.; Fu, Y. An investigation of transient nature of the cavitating flow in injector nozzles. Appl. Therm. Eng. 2013, 54, 56–64. [Google Scholar] [CrossRef]
- Zhang, M.J.; Song, R.Z.; Wang, L.L. The effect of cavitation on the inner-flow and spray characteristic of GDI injector. Veh. Engine 2015, 6, 79–84. [Google Scholar]
- Wu, S.; Xu, M.; Hung, D.L.; Pan, H. Effects of nozzle configuration on internal flow and primary jet breakup of flash boiling fuel sprays. Int. J. Heat Mass Transf. 2017, 110, 730–738. [Google Scholar] [CrossRef]
- Chen, Z.; Yao, C.; Wang, Q.; Han, G.; Dou, Z.; Wei, H.; Wang, B.; Liu, M.; Wu, T. Cylinder-to-Cylinder Variation in a Diesel Engine Fueled with Diesel/Methanol Dual Fuel. J. Combust. Sci. Technol. 2017, 23, 41–46. [Google Scholar] [CrossRef]
- Huang, H.; Zhang, X.; Jia, C.; Shi, C.; Teng, W. Effects of injection pressure and nozzle diameter and fuel property on spray characteristics of blended diesel fuel. Trans. Chin. Soc. Agric. Eng. (Trans. Csae) 2018, 34, 45–51. [Google Scholar]
- Huang, H.Z.; An, Y.Z.; Su, W.H.; Mao, L.W.; Liang, Y.F.; Dai, Y.L. Investigation on the Influence of Injection Pressure and Nozzle Diameter on the Spray of Blended Fuel in Diesel Engine. Trans. Chin. Soc. Intern. Combust. Engines 2013, 31, 200–207. [Google Scholar]
- Li, T.; Moon, S.; Sato, K.; Yokohata, H. A comprehensive study on the factors affecting near-nozzle spray dynamics of multi-hole GDI injectors. Fuel 2016, 190, 292–302. [Google Scholar] [CrossRef]
- Han, J.S.; Lu, P.H.; Xie, X.B.; Lai, M.C.; Henein, N.A. Investigation of Diesel Spray Primary Break-up and Development for Different Nozzle Geometries. Simul. Model. 2002, 1, 2528–2548. [Google Scholar]
- Moon, S.; Komada, K.; Sato, K.; Yokohata, H.; Wada, Y.; Yasuda, N. Ultrafast X-ray study of multi-hole GDI injector sprays: Effects of nozzle hole length and number on initial spray formation. Exp. Therm. Fluid Sci. 2015, 68, 68–81. [Google Scholar] [CrossRef]
- Saha, K.; Som, S.; Battistoni, M.; Li, Y.; Quan, S.; Senecal, P.K. Numerical simulation of internal and near-nozzle flow of a gasoline direct injection fuel injector. J. Phys. Conf. Ser. 2015, 656, 012100. [Google Scholar] [CrossRef] [Green Version]
- Simpson, A.; Ranade, V.V. Modelling of Hydrodynamic Cavitation with Orifice: Influence of different orifice designs. Chem. Eng. Res. Des. 2018, 136, 698–711. [Google Scholar] [CrossRef]
- Zhou, J.W.; Pei, Y.Q.; Peng, Z.J.; Zhang, Y.F.; Qin, J.; Wang, L.; Liu, C.W.; Zhang, X.Y. Characteristics of near-nozzle spray development from a fouled GDI injector. Fuel 2018, 219, 17–29. [Google Scholar] [CrossRef]
- Lee, S.; Park, S. Spray atomization characteristics of a GDI injector equipped with a group-hole nozzle. Fuel 2014, 137, 50–59. [Google Scholar] [CrossRef]
- Duke, D.J.; Kastengren, A.L.; Matusik, K.E.; Swantek, A.B.; Powell, C.F.; Payri, R.; Vaquerizo, D.; Itani, L.; Bruneaux, G.; Grover, R.O., Jr.; et al. Internal and near nozzle measurements of Engine Combustion Network “Spray G” gasoline direct injectors. Exp. Therm. Fluid Sci. 2017, 88, 608–621. [Google Scholar] [CrossRef] [Green Version]
- Qiu, T.; Song, X.; Lei, Y.; Liu, X.; An, X.; Lai, M. Influence of inlet pressure on cavitation flow in diesel nozzle. Appl. Therm. Eng. 2016, 109, 364–372. [Google Scholar] [CrossRef]
- Zhang, J.; Tang, W.P.; Yan, D.U. Technical Research of Nozzle Spray Hole. Mod. Veh. Pwer 2010, 1, 43–46. [Google Scholar]
Figure 1.
Simulation models. (a) ”Spray G” nozzle, (b) GDI injector head structure, (c) Mesh model, (d) Injector needle lift curve.
Figure 1.
Simulation models. (a) ”Spray G” nozzle, (b) GDI injector head structure, (c) Mesh model, (d) Injector needle lift curve.

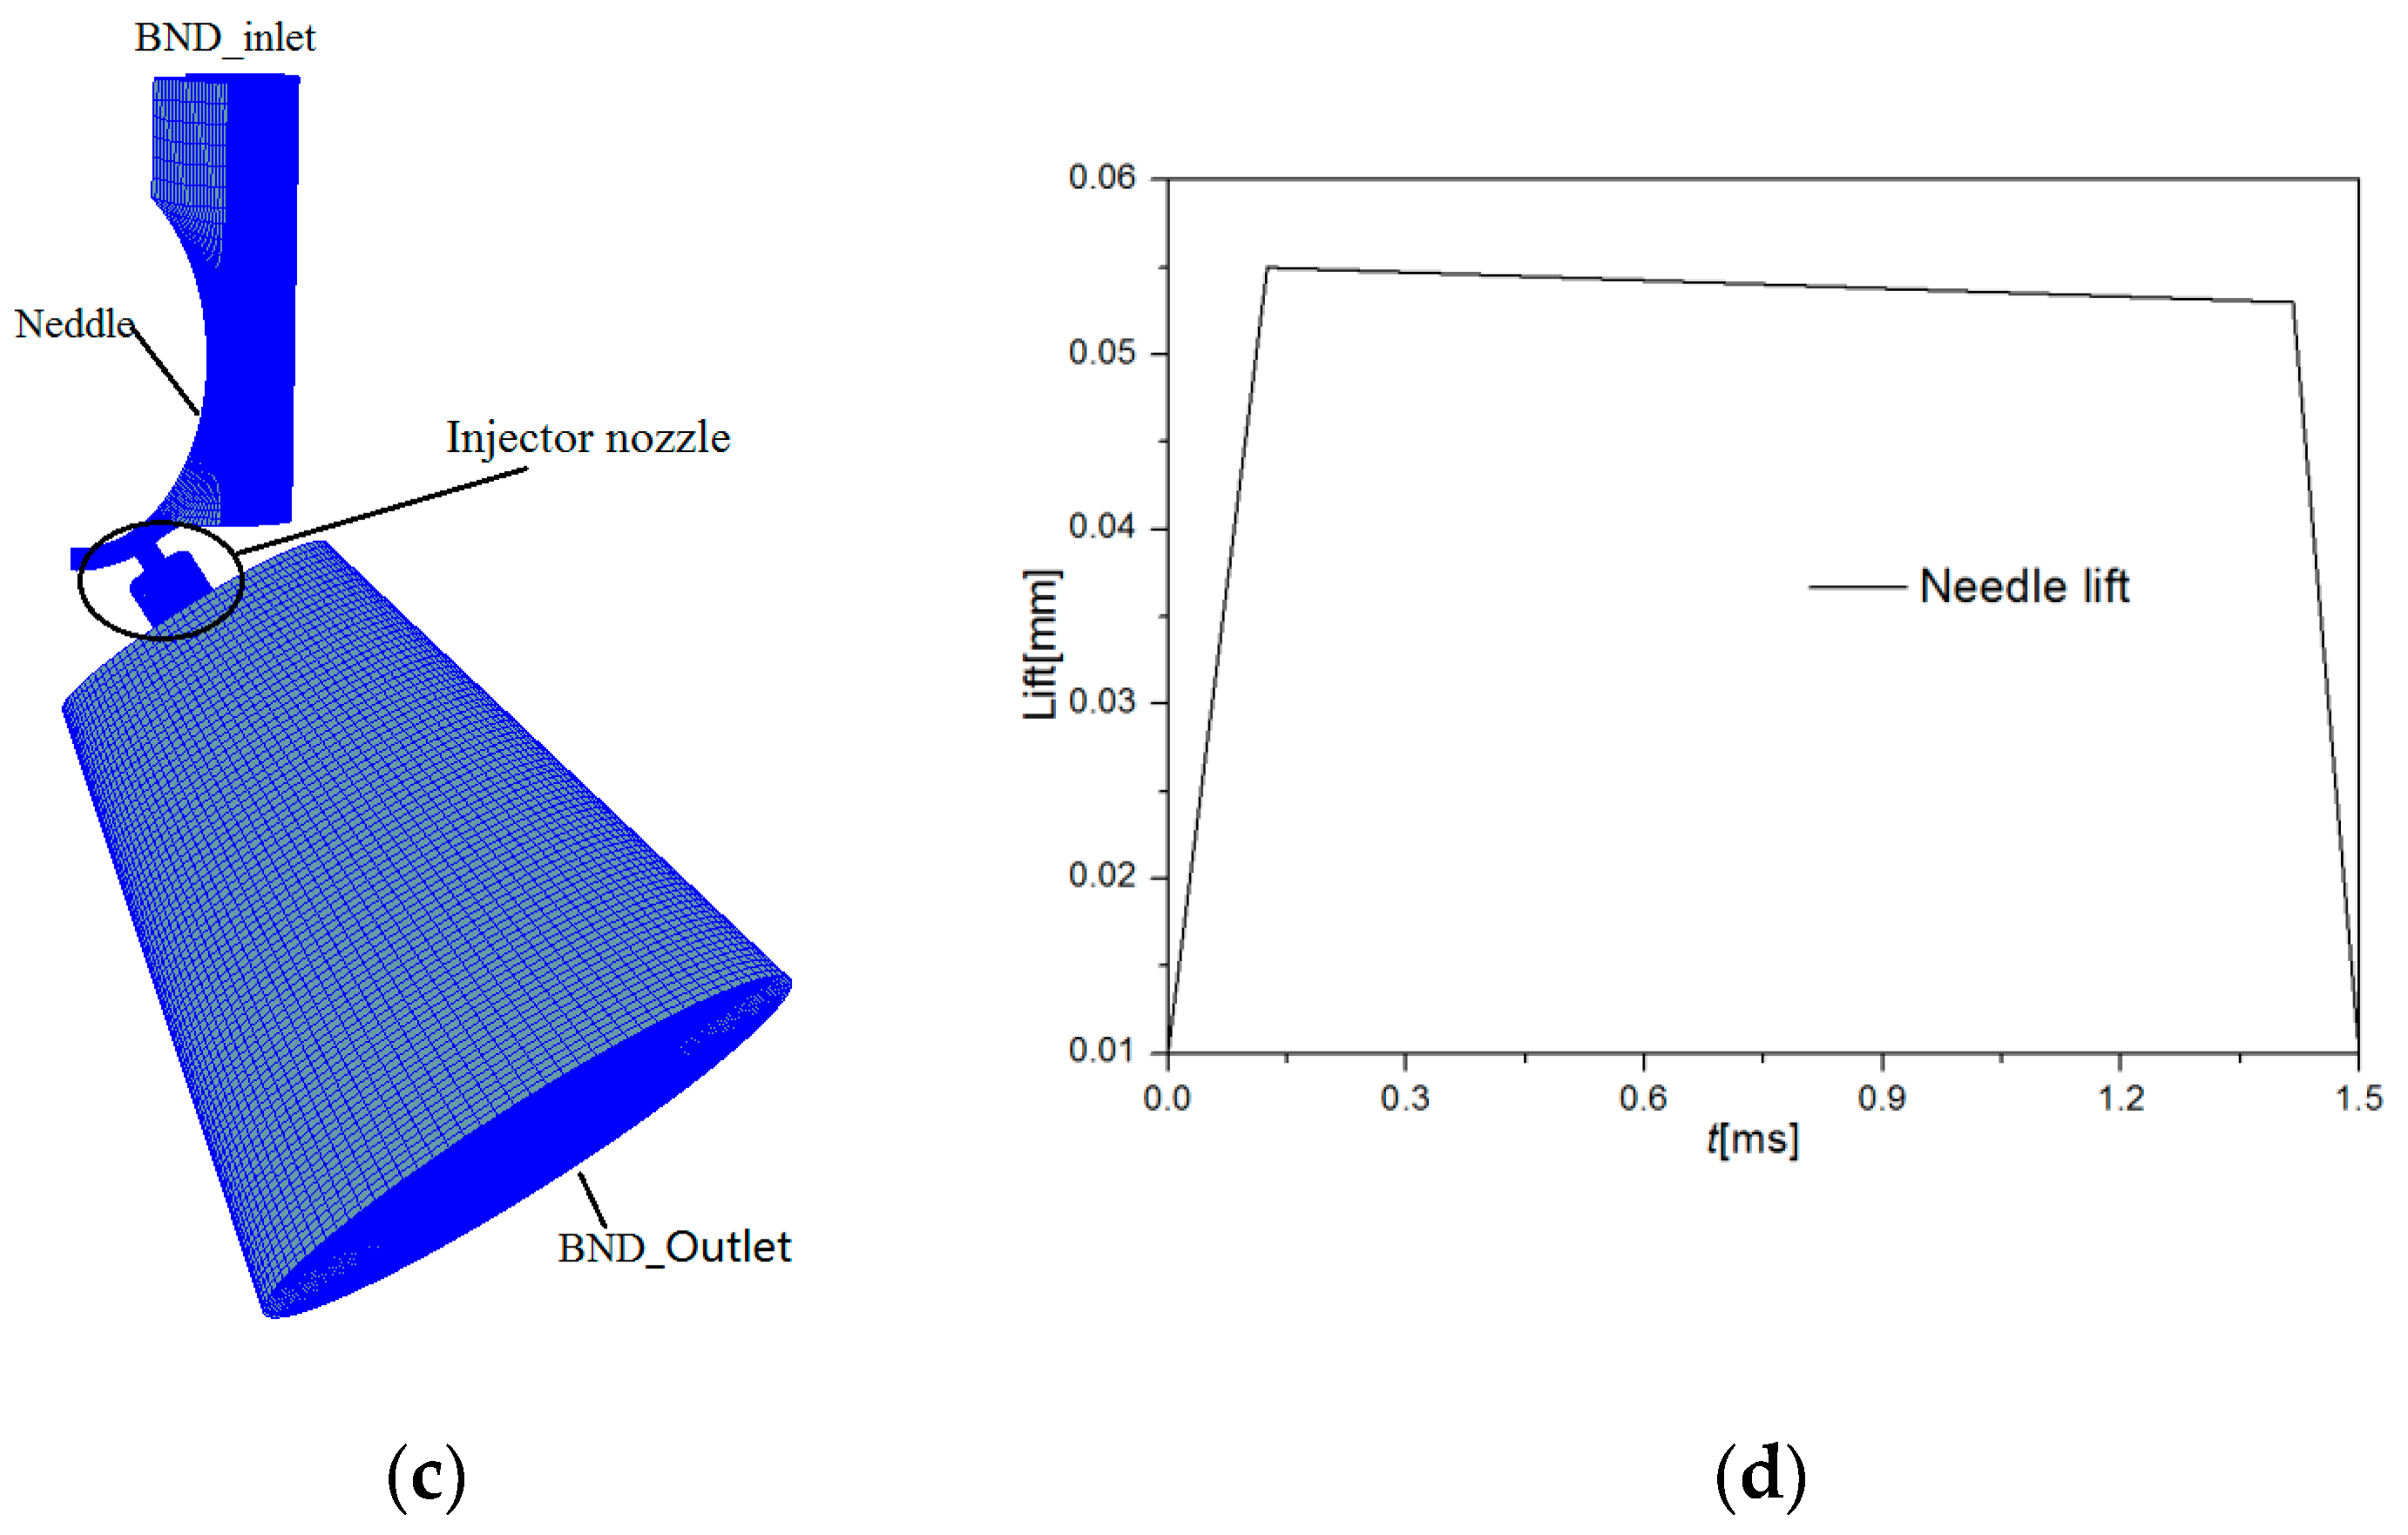
Figure 2.
Structural parameters of the GDI injector nozzle.
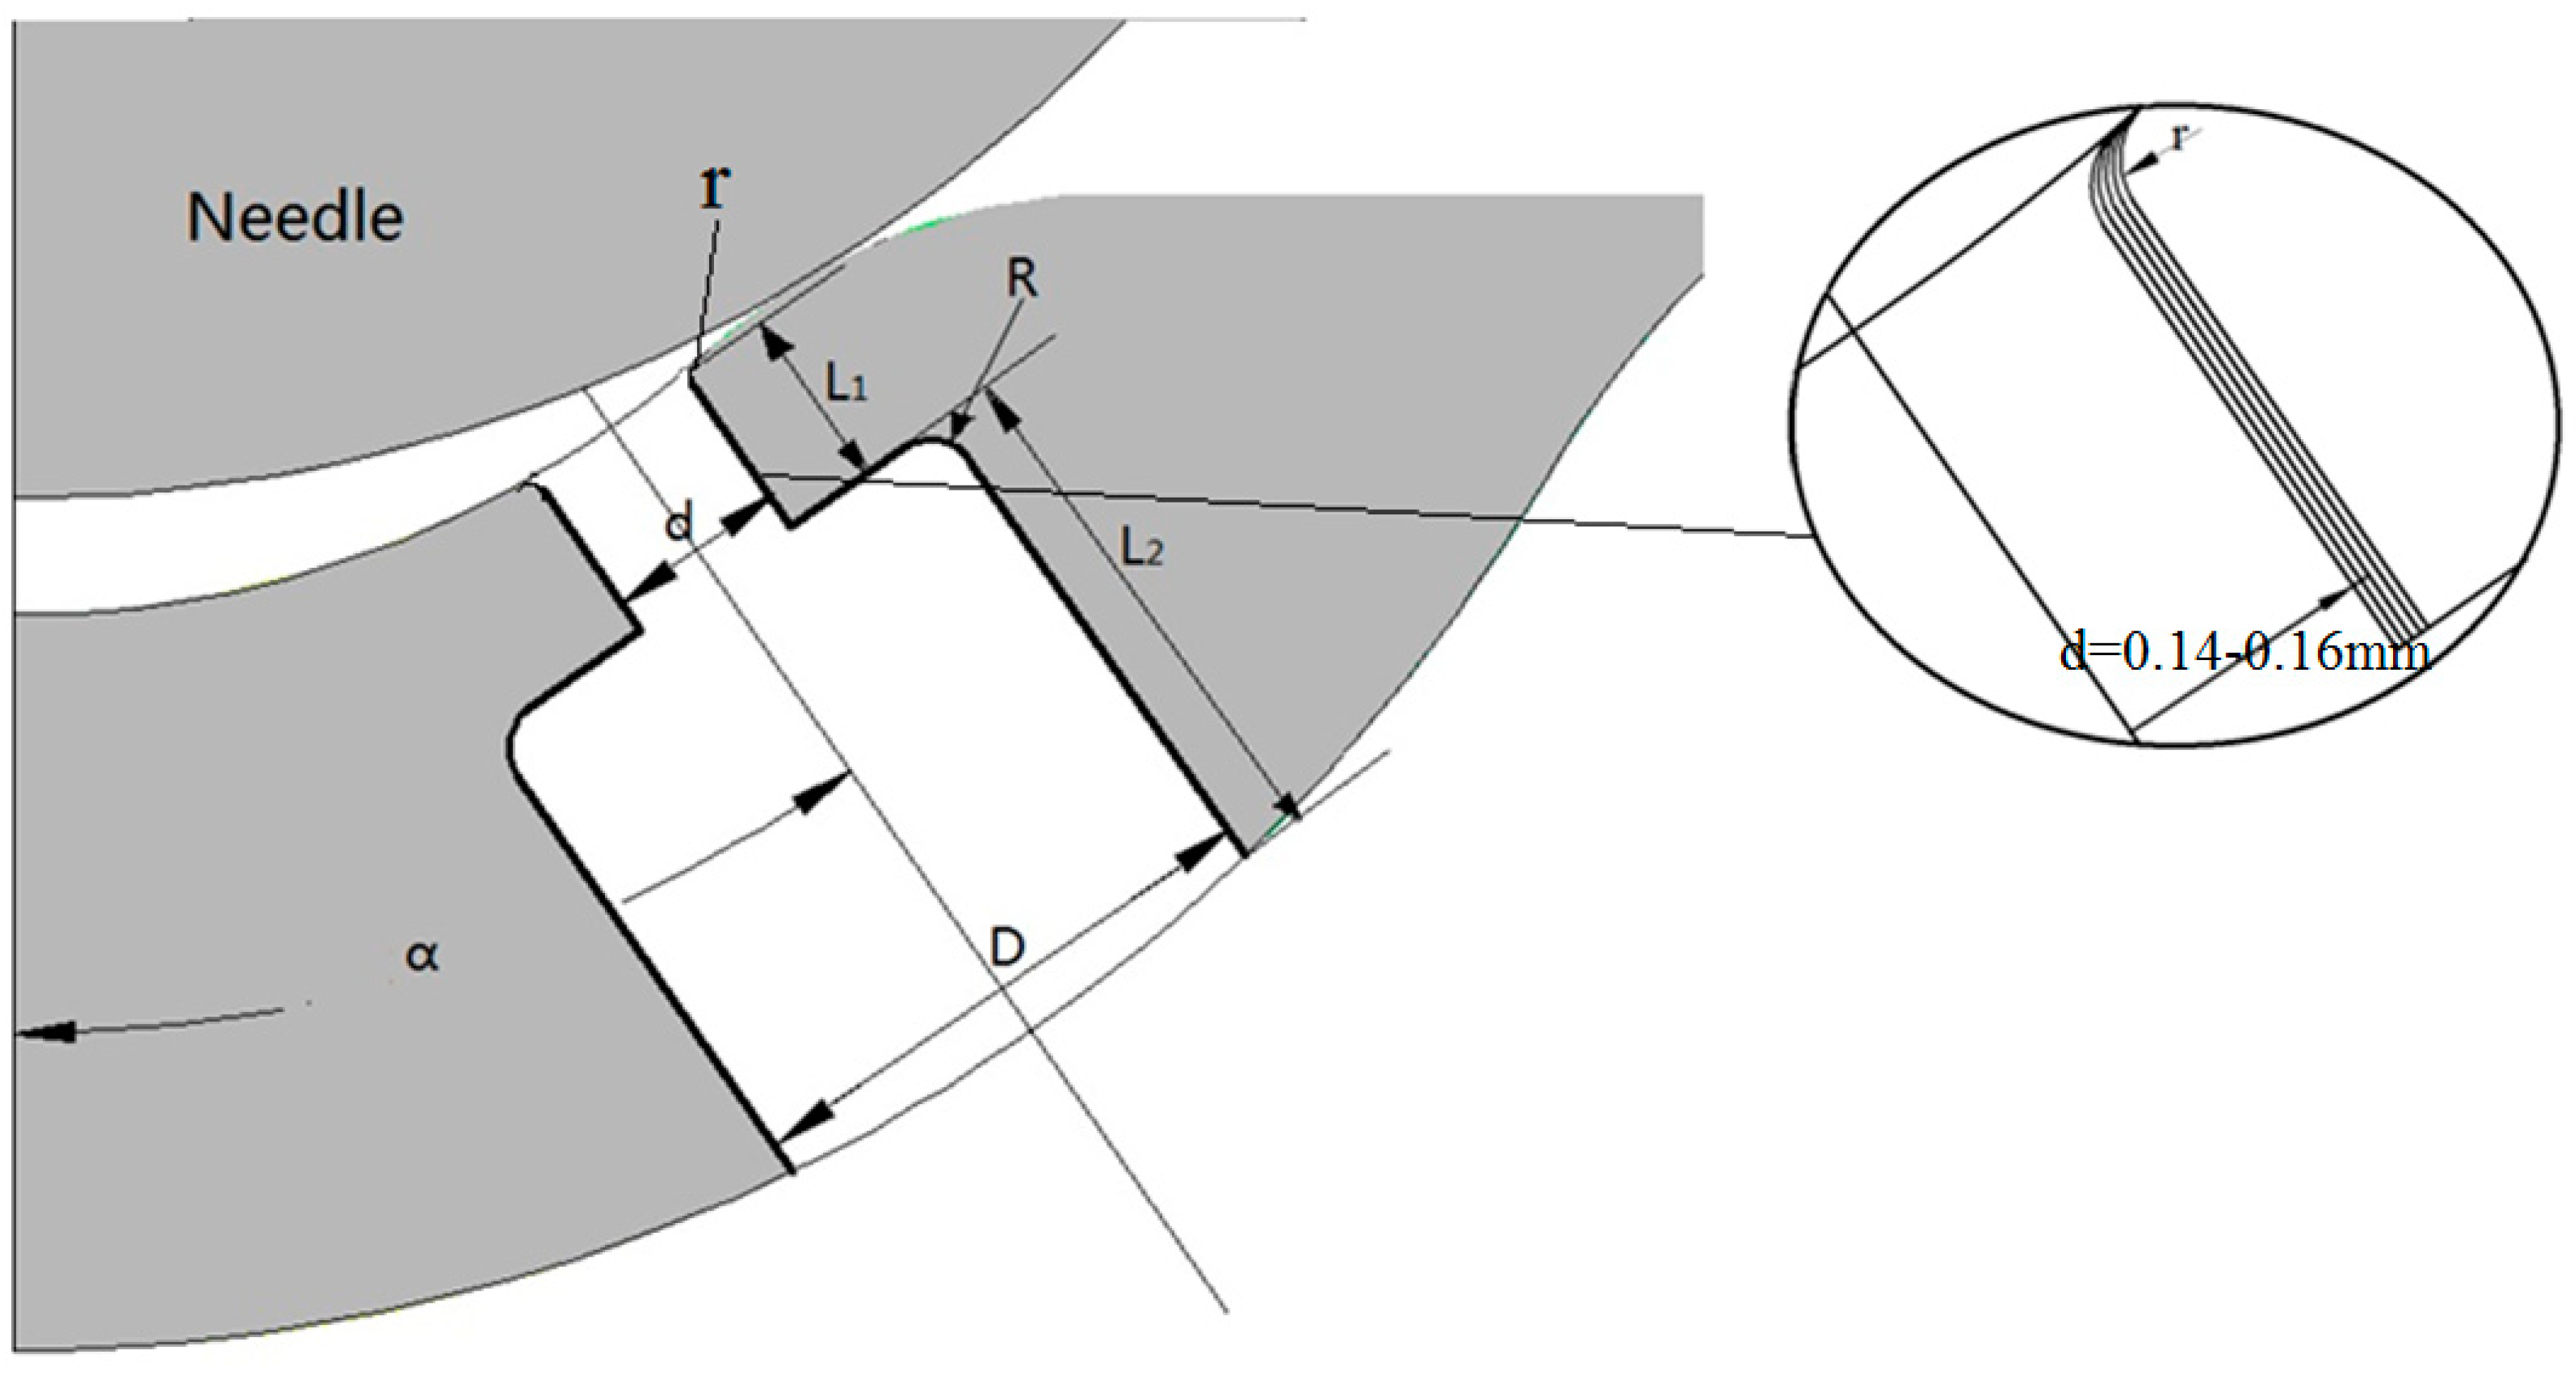
Figure 3.
Practical nozzle and experimental bench. (a) Experimental model, (b) Mesh model, (c) Test rig.
Figure 3.
Practical nozzle and experimental bench. (a) Experimental model, (b) Mesh model, (c) Test rig.
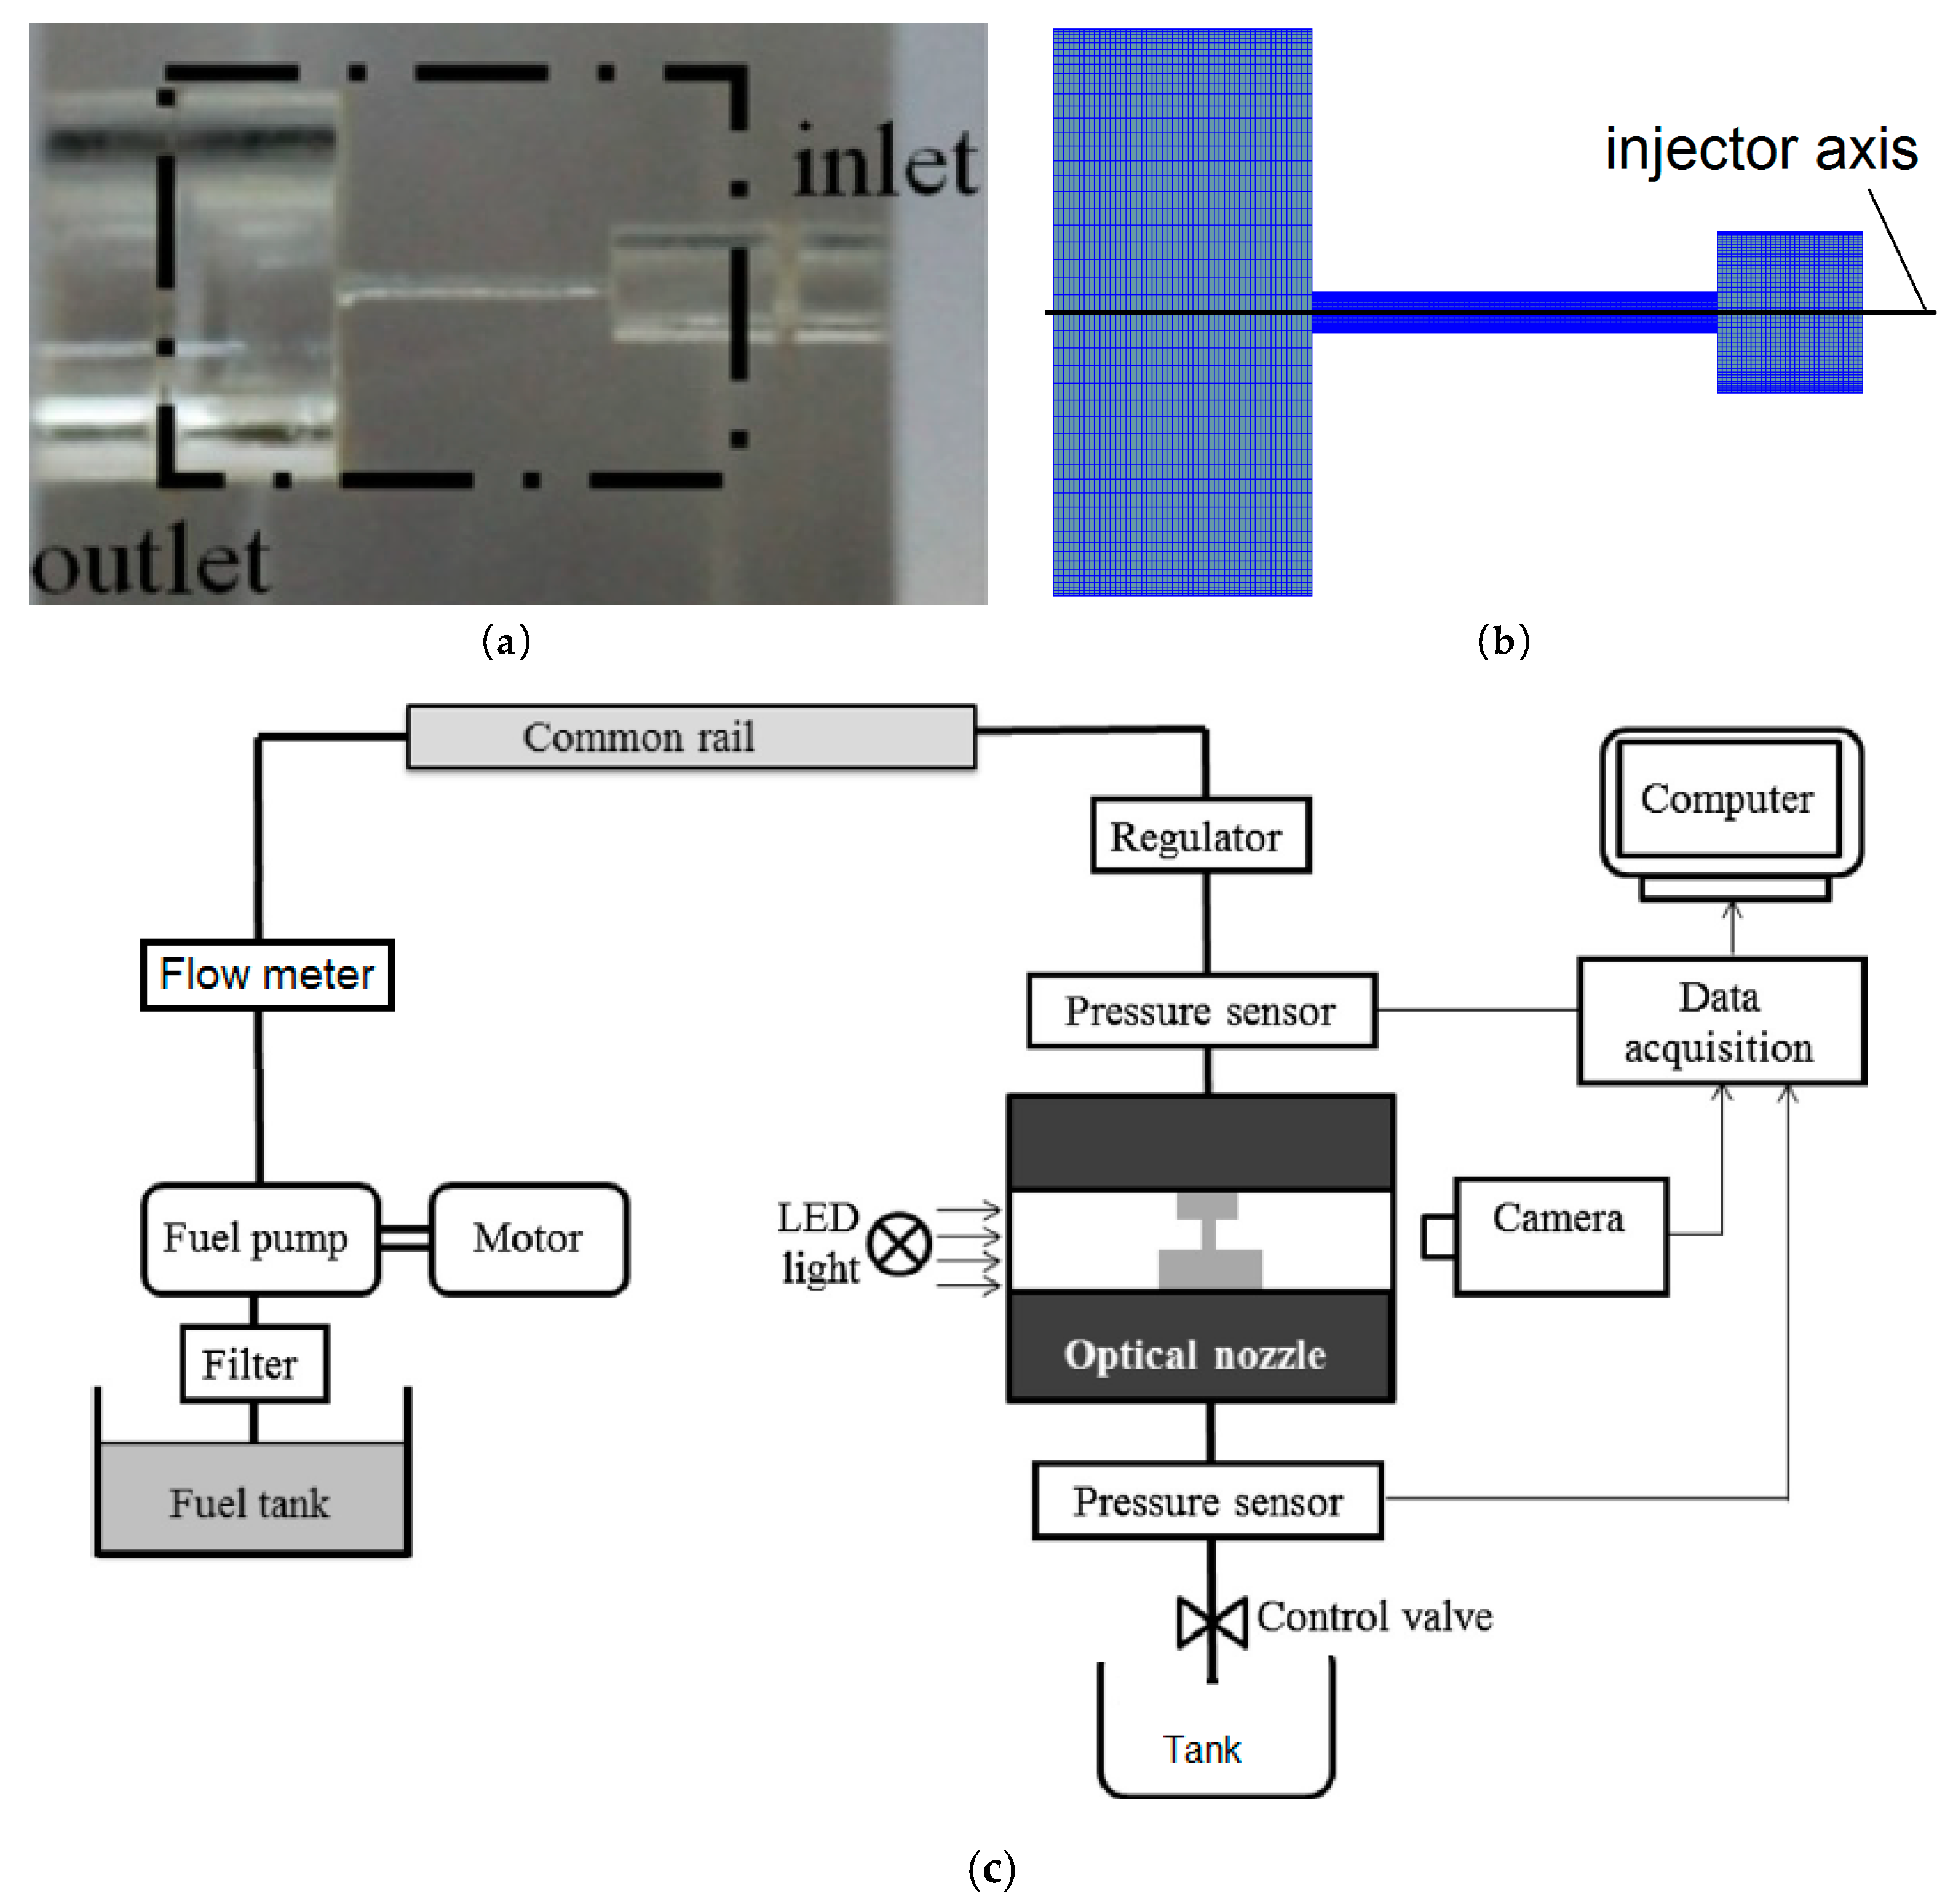
Figure 4.
Comparison of experimental and simulation results (pb = 0.3 MPa).

Figure 5.
Comparison of experimental data and simulation result. (a) Grid independency, (b) Mass flow comparison.
Figure 5.
Comparison of experimental data and simulation result. (a) Grid independency, (b) Mass flow comparison.
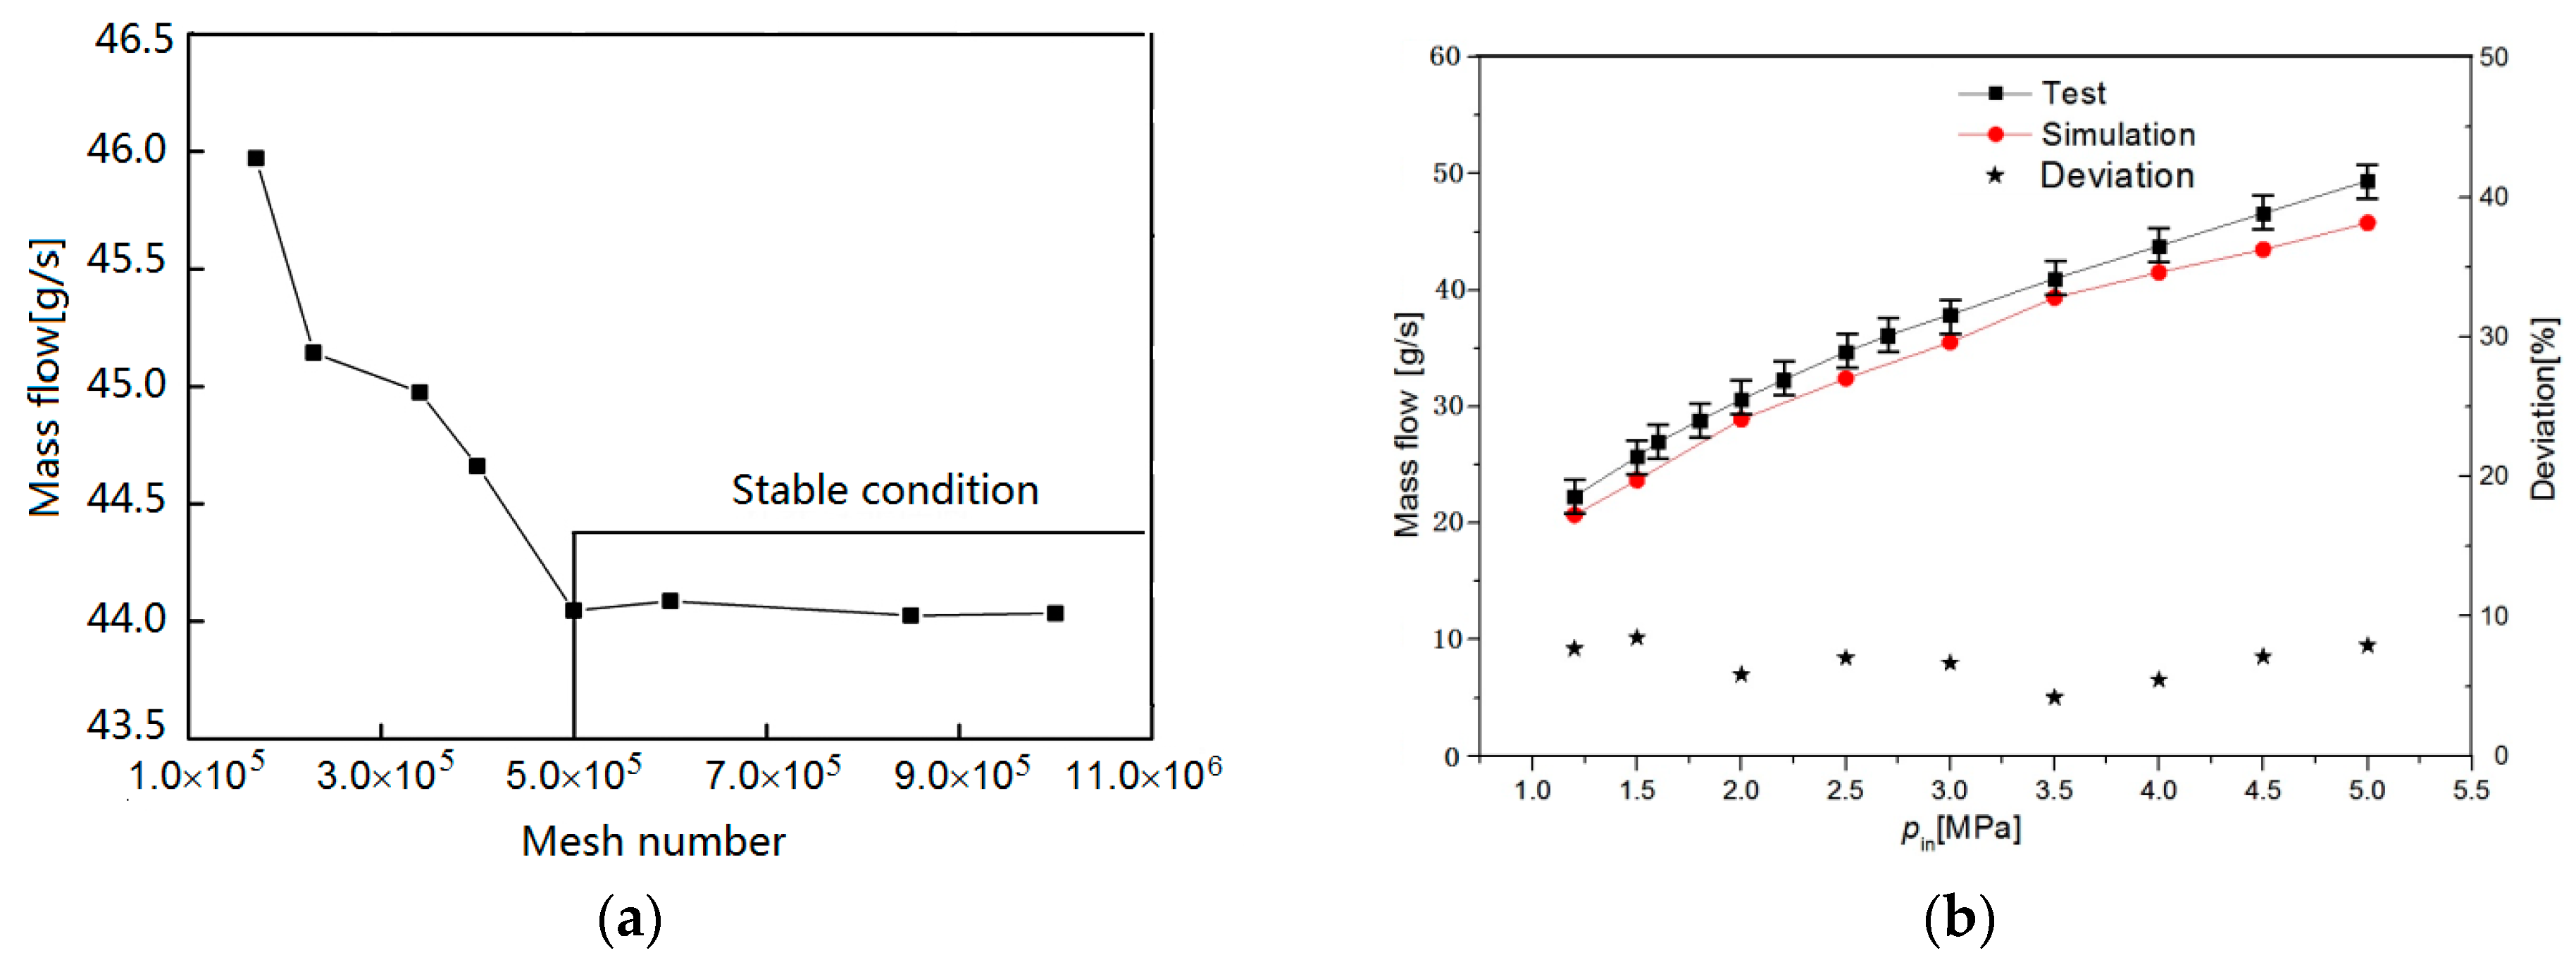
Figure 6.
The effect of injection pressure on the injection characteristic. (a) The effect of injection pressure on the injection law, (b) Control of minimum flow section area, (c) The influence of injection pressure on the injection velocity.
Figure 6.
The effect of injection pressure on the injection characteristic. (a) The effect of injection pressure on the injection law, (b) Control of minimum flow section area, (c) The influence of injection pressure on the injection velocity.


Figure 7.
The cut-planes of pressure and air–liquid ratio in the nozzle under different injection pressures.
Figure 7.
The cut-planes of pressure and air–liquid ratio in the nozzle under different injection pressures.
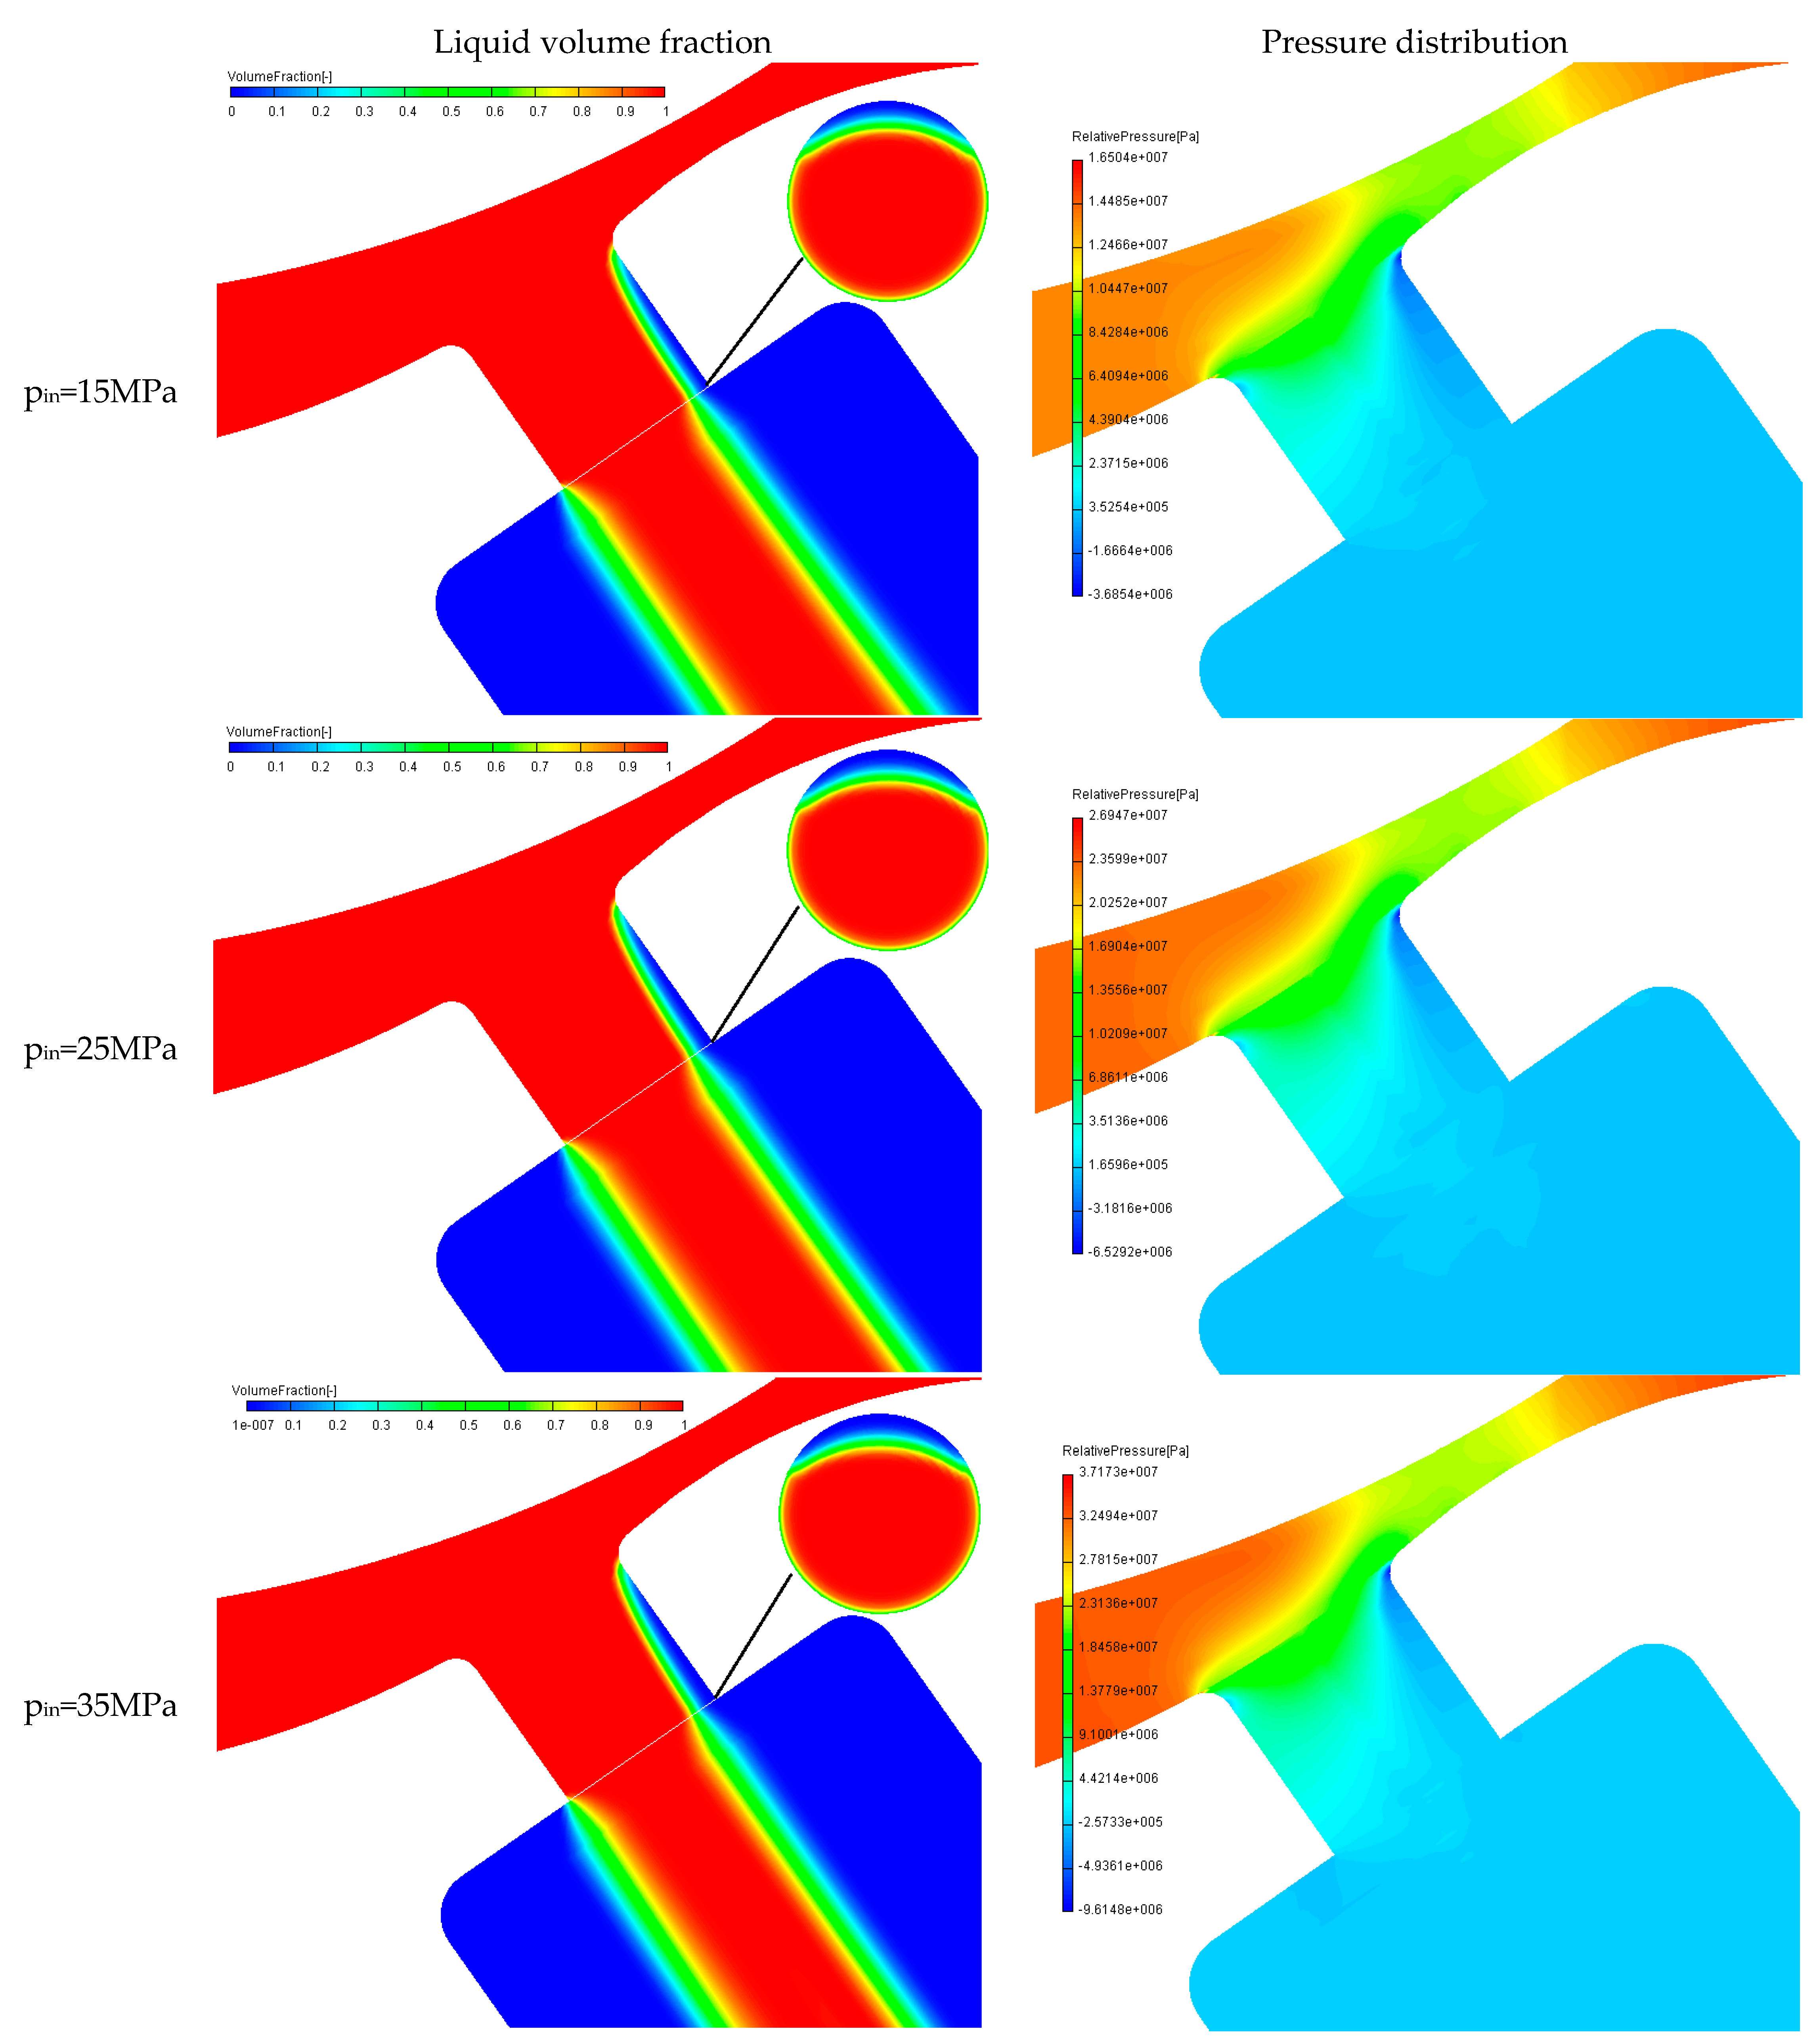
Figure 8.
The effect of injector nozzle diameter on injection characteristics of GDI injector. (a) The effect of nozzle diameter on injection law, (b) The effect of nozzle diameter on the fuel mass.
Figure 8.
The effect of injector nozzle diameter on injection characteristics of GDI injector. (a) The effect of nozzle diameter on injection law, (b) The effect of nozzle diameter on the fuel mass.

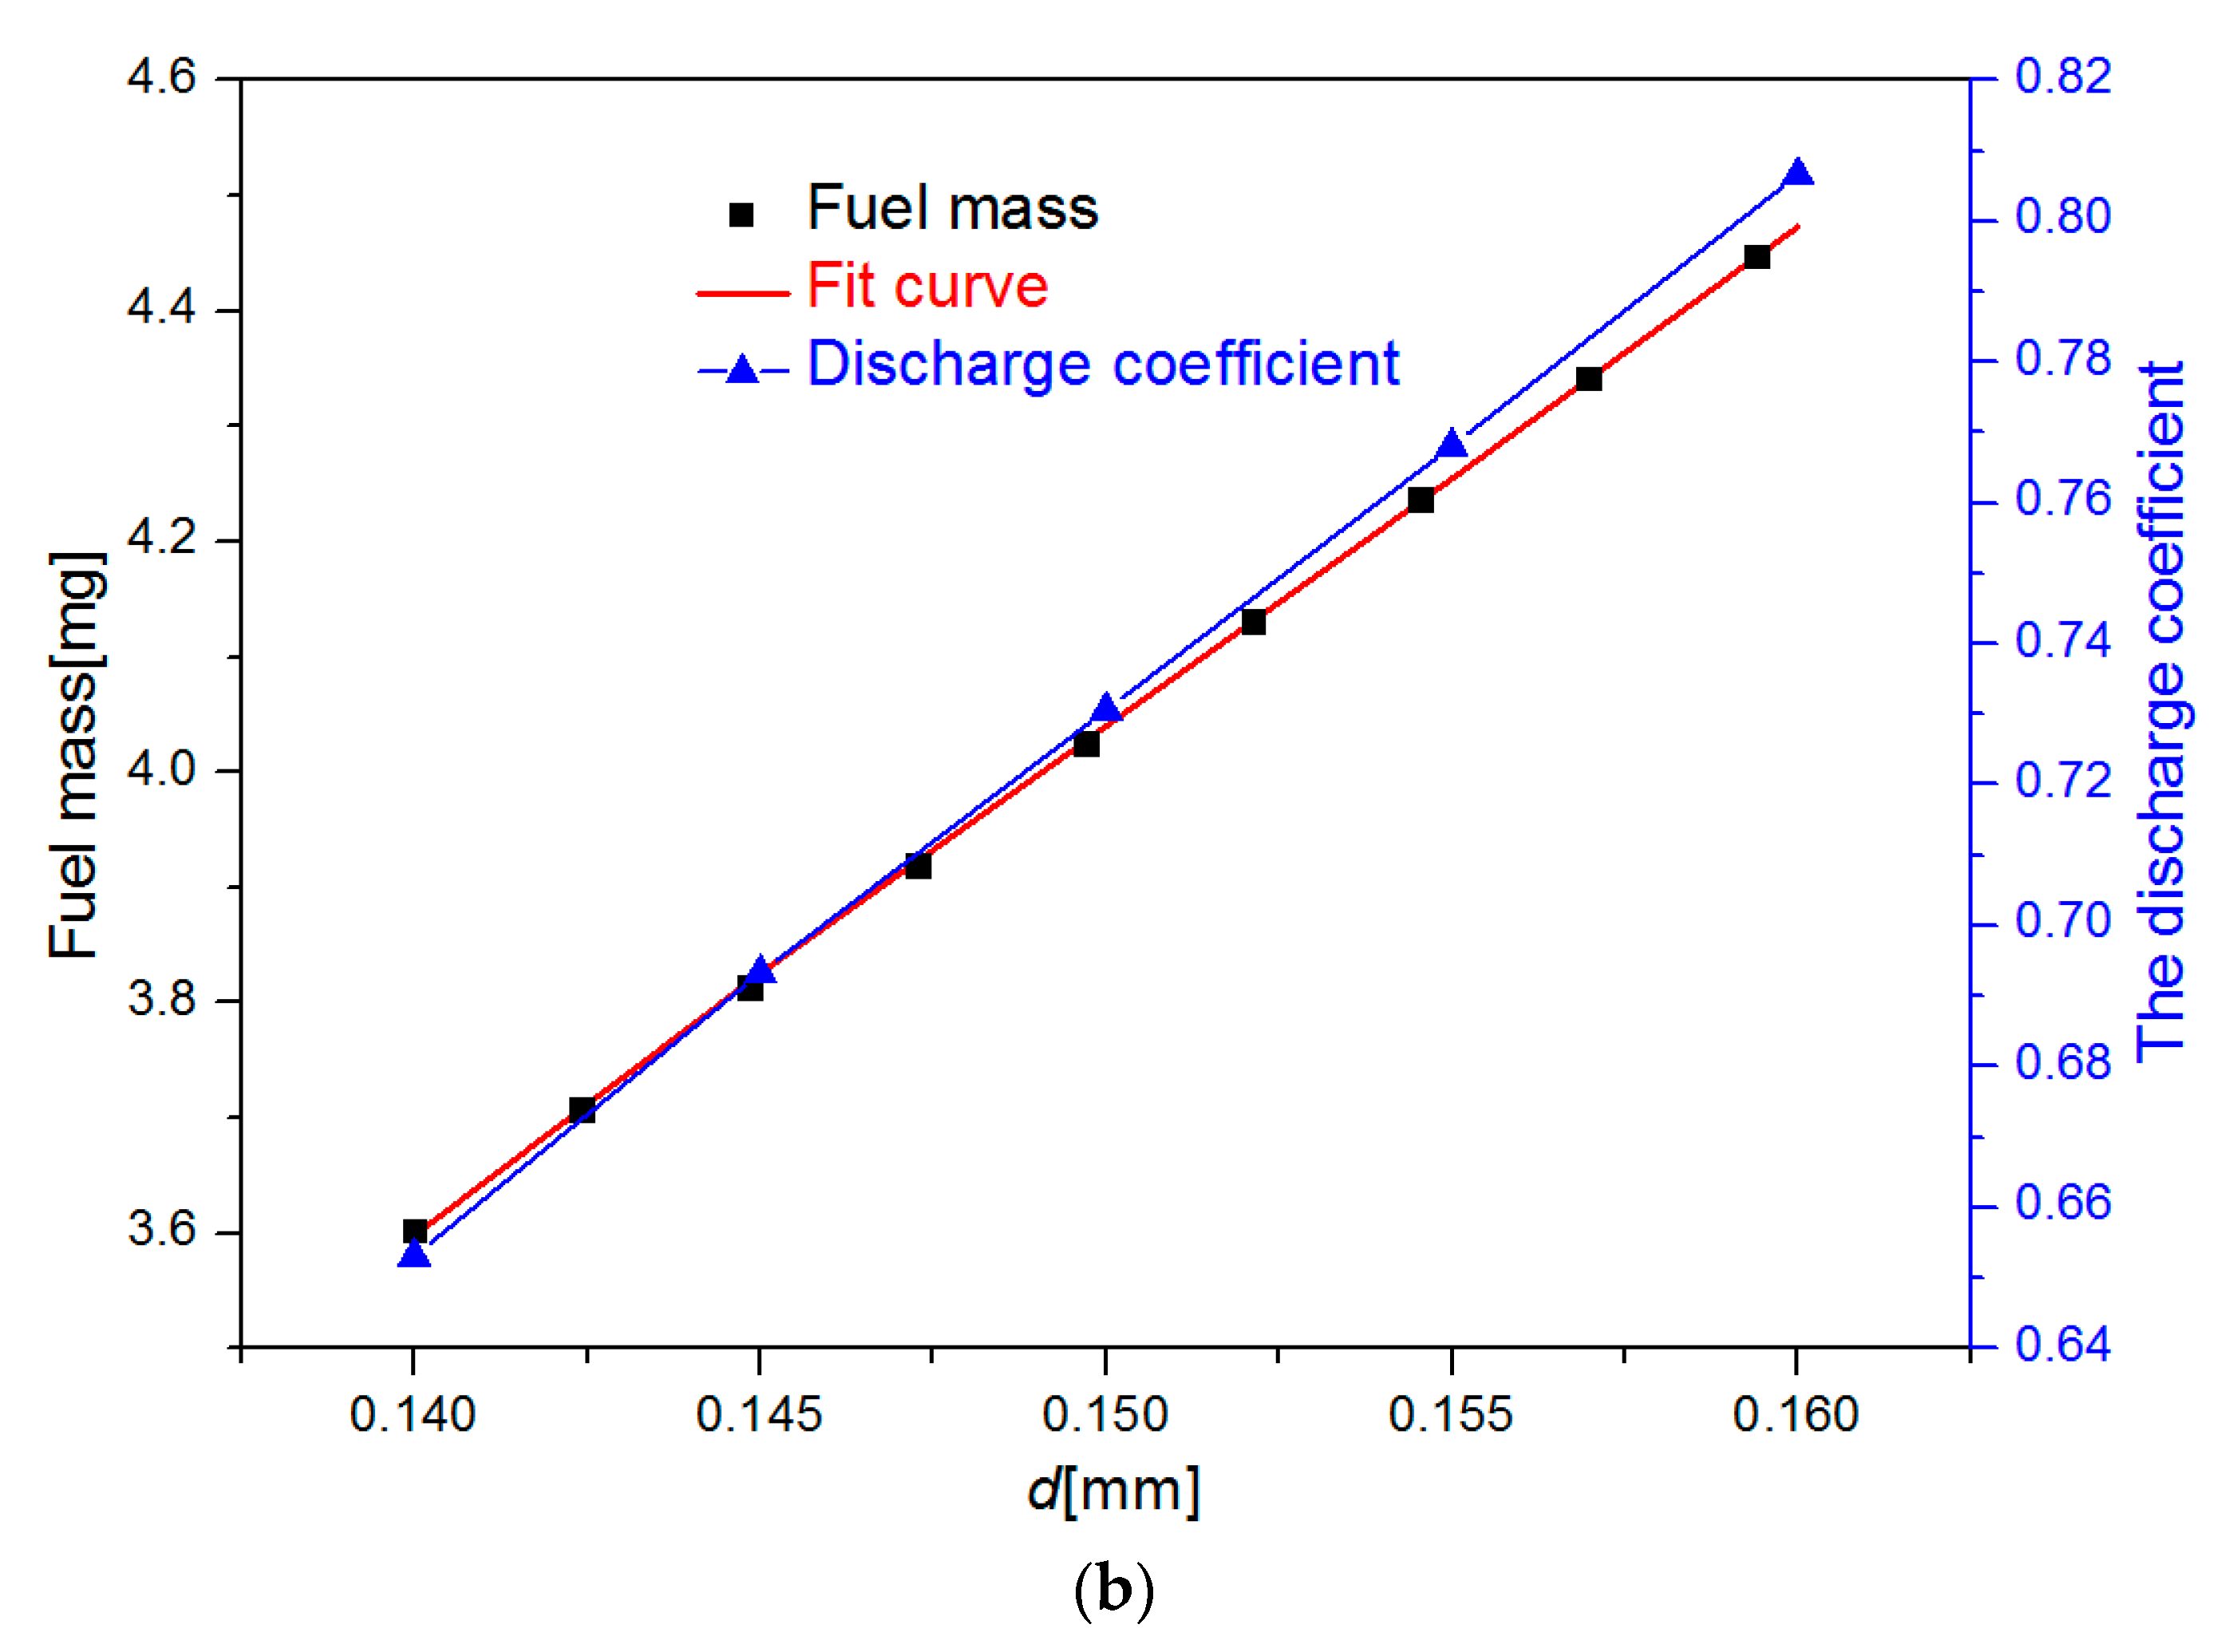
Figure 9.
The effect of nozzle diameter on liquid phase ratio of nozzle outlet.

Figure 10.
Sensitivity analysis of cyclic fuel mass to nozzle diameter under different injection pressure. (a) The effect of injection pressure and nozzle diameter on the fuel mass, (b) Sensitivity of single-nozzle cycle fuel mass to injection pressure.
Figure 10.
Sensitivity analysis of cyclic fuel mass to nozzle diameter under different injection pressure. (a) The effect of injection pressure and nozzle diameter on the fuel mass, (b) Sensitivity of single-nozzle cycle fuel mass to injection pressure.
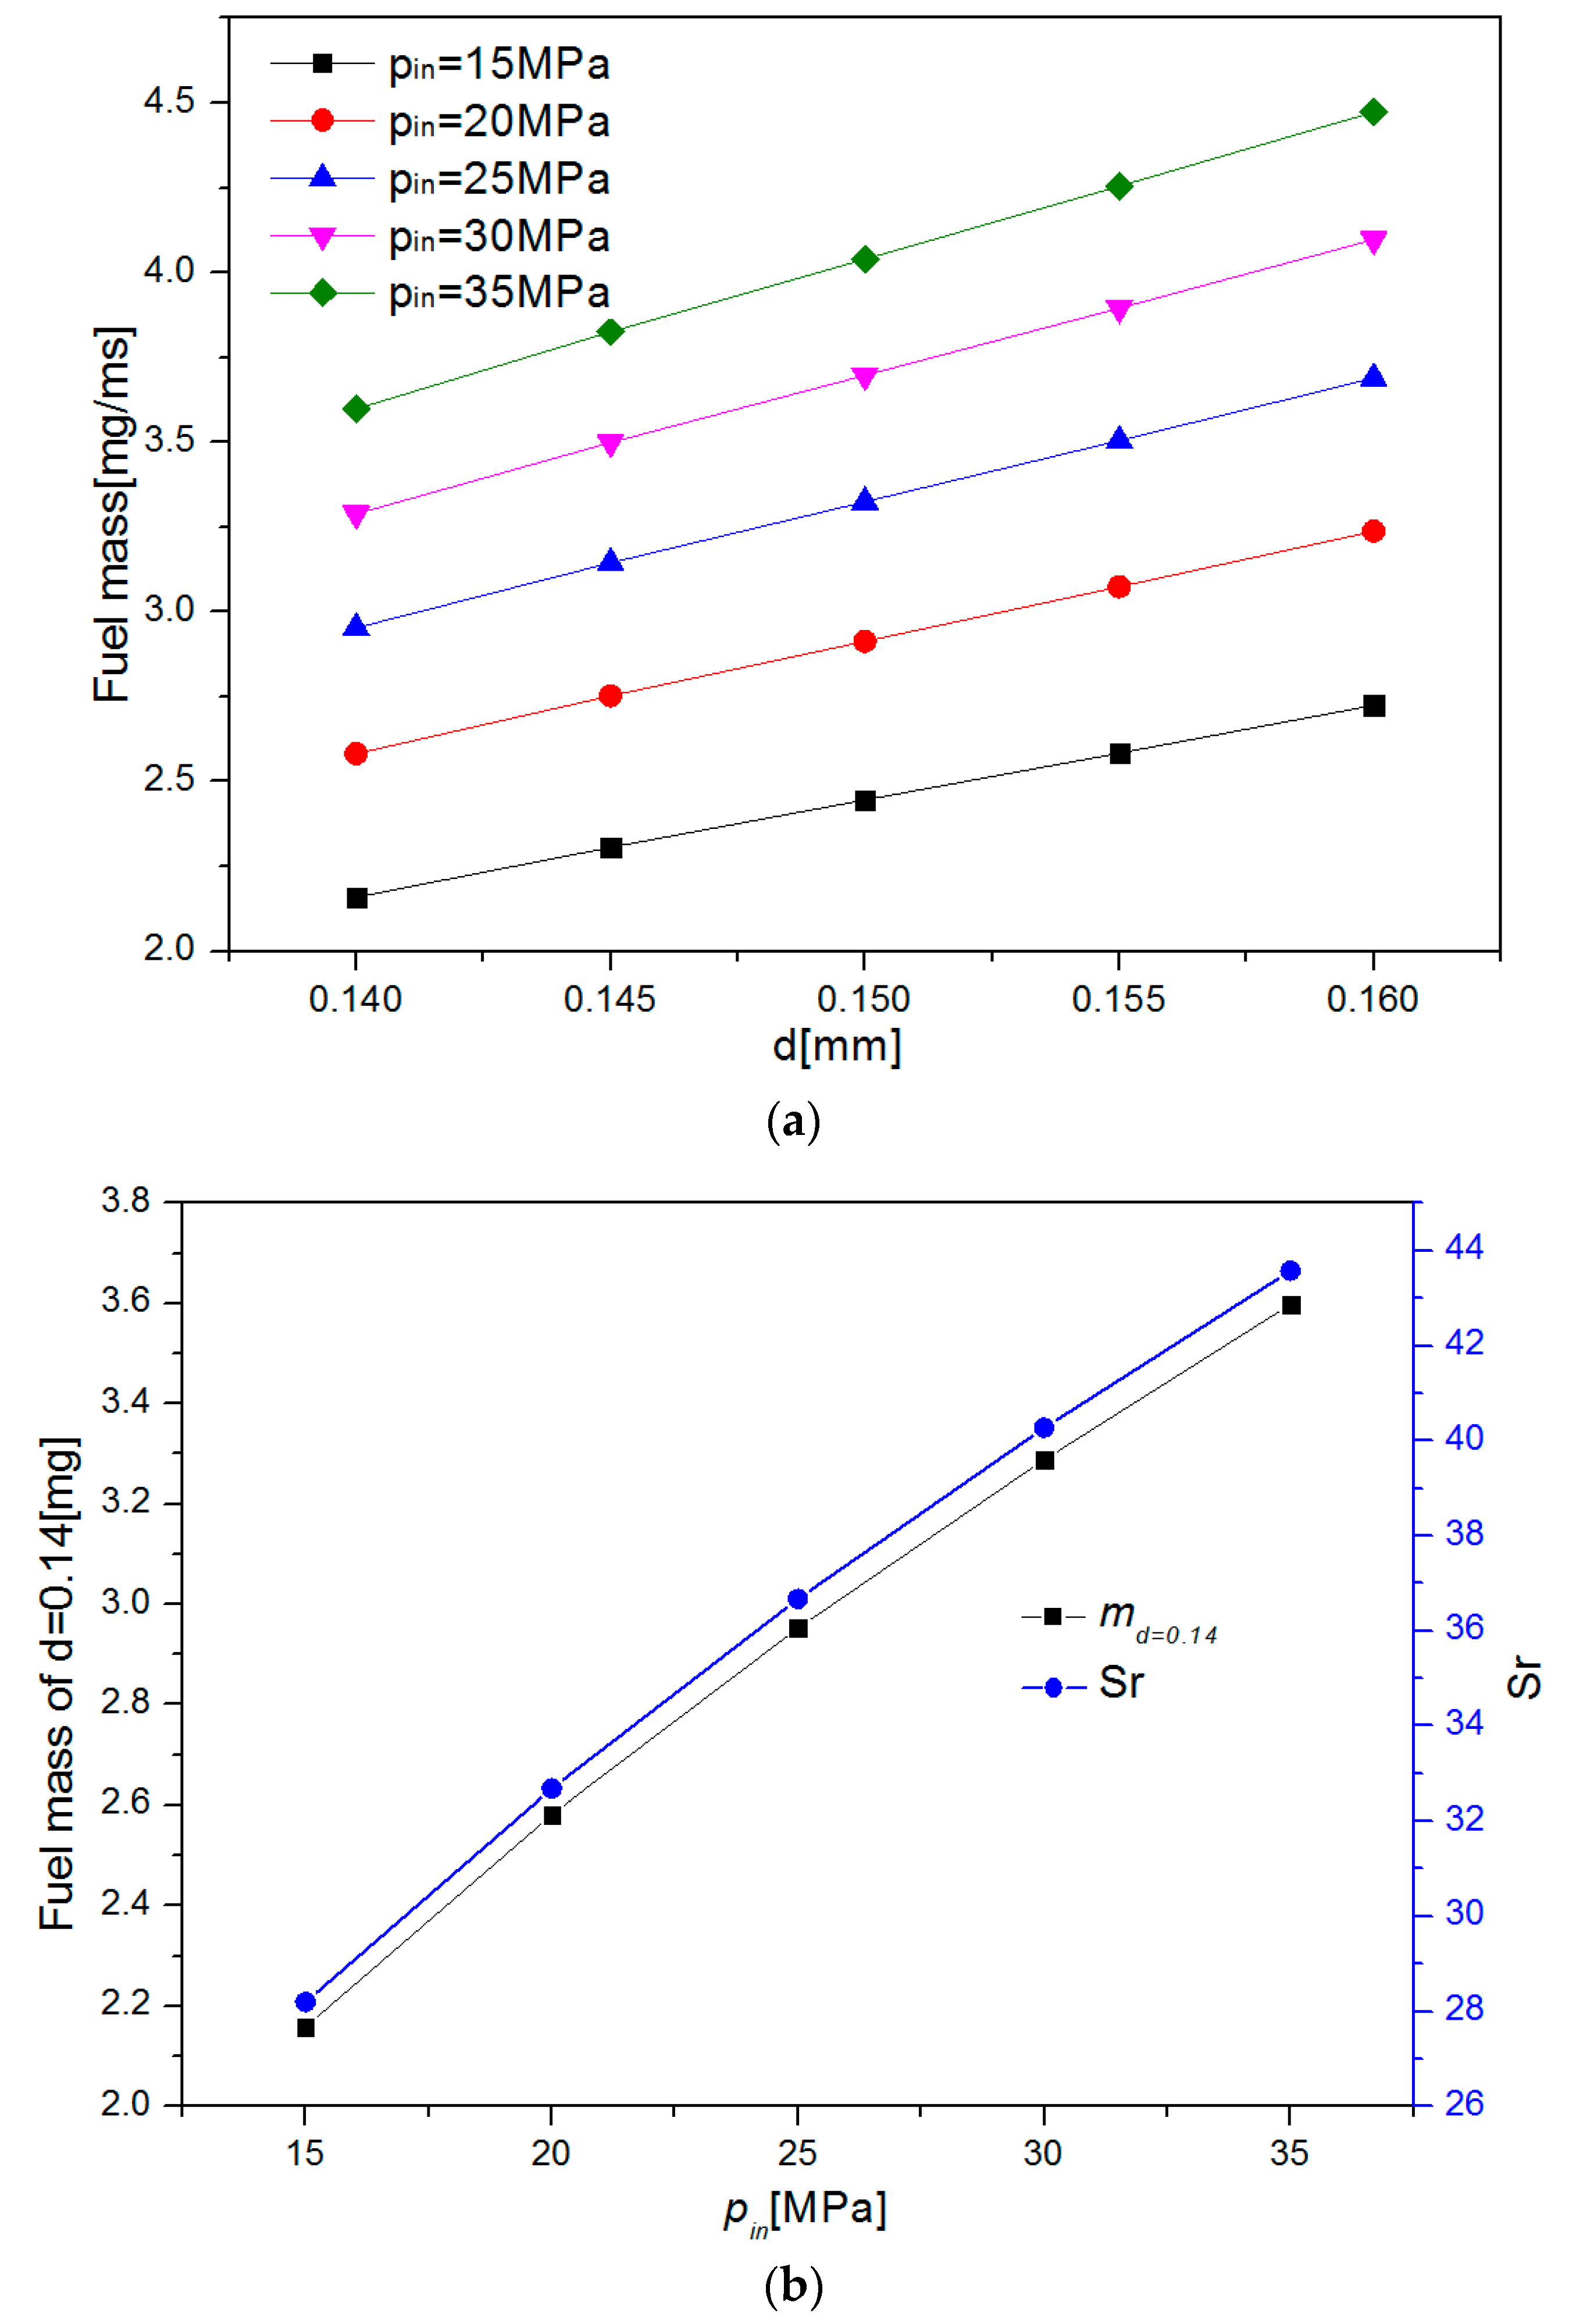
Figure 11.
Effects of injection pressure and nozzle diameter on near-nozzle flow.


Table 1.
Boundary conditions, nozzle sizes, and mathematical models.
| Parameters | Value | Parameters | Value |
|---|---|---|---|
| BND_inlet | 15, 20, 25, 30, 35 MPa | Cavitation model | non-linear cavitaiton model |
| BND_Outlet | 0.5 MPa | d | 0.140, 0.145, 0.150, 0.155, 0.160 mm |
| Fuel type | Gasoline | D | 0.45 mm |
| Fuel density | 725.1 kg/m3 | L1 | 0.15 mm |
| Fuel Viscosity | 0.721 mm2/s | L2 | 0.45 mm |
| Saturated vapor pressure | 44 kPa | R | 0.04 mm |
| Temperature | 293 K | r | 0.02 mm |
| Turbulence model | κ-ε model | α | 35° |
Table 2.
Experimental conditions.
| Cavitation Number/CN | Back Pressure of Baseline Nozzle/MPa | Equivalent Back Pressure/MPa | Inlet Pressure of Baseline Nozzle/MPa | Equivalent Inlet Pressure/MPa |
|---|---|---|---|---|
| 1.06 | 8 | 0.3 | 140 | 5 |
| 1.08 | 8 | 0.3 | 100 | 4 |
| 1.11 | 8 | 0.3 | 80 | 3 |
| 1.25 | 8 | 0.3 | 40 | 1.5 |
© 2019 by the authors. Licensee MDPI, Basel, Switzerland. This article is an open access article distributed under the terms and conditions of the Creative Commons Attribution (CC BY) license (http://creativecommons.org/licenses/by/4.0/).
Share and Cite
MDPI and ACS Style
Li, X.; Cheng, Y.; Ji, S.; Yang, X.; Wang, L. Sensitivity Analysis of Fuel Injection Characteristics of GDI Injector to Injector Nozzle Diameter. Energies 2019, 12, 434. https://doi.org/10.3390/en12030434
AMA Style
Li X, Cheng Y, Ji S, Yang X, Wang L. Sensitivity Analysis of Fuel Injection Characteristics of GDI Injector to Injector Nozzle Diameter. Energies. 2019; 12(3):434. https://doi.org/10.3390/en12030434
Chicago/Turabian StyleLi, Xinhai, Yong Cheng, Shaobo Ji, Xue Yang, and Lu Wang. 2019. "Sensitivity Analysis of Fuel Injection Characteristics of GDI Injector to Injector Nozzle Diameter" Energies 12, no. 3: 434. https://doi.org/10.3390/en12030434
Note that from the first issue of 2016, this journal uses article numbers instead of page numbers. See further details here.