Numerical Study on Heat Transfer Performance in Packed Bed


School of Energy and Power engineering, Huazhong University of Science and Technology, Wuhan 430074, China
*
Author to whom correspondence should be addressed.
Energies 2019, 12(3), 414; https://doi.org/10.3390/en12030414
Submission received: 17 December 2018
/
Revised: 18 January 2019
/
Accepted: 22 January 2019
/
Published: 28 January 2019
(This article belongs to the Special Issue Selected Papers from SDEWES 2018 Conferences on Sustainable Development of Energy, Water and Environment Systems)
Abstract
:Packed beds are widely used in industries and it is of great significance to enhance the heat transfer between gas and solid states inside the bed. In this paper, numerical simulation method is adopted to investigate the heat transfer principle in the bed at particle scale, and to develop the direct enhanced heat transfer methods in packed beds. The gas is treated as continuous phase and solved by Computational Fluid Dynamics (CFD), while the particles are treated as discrete phase and solved by the Discrete Element Method (DEM); taking entransy dissipation to evaluate the heat transfer process. Considering the overall performance and entransy dissipation, the results show that, compared with the uniform particle size distribution, radial distribution of multiparticle size can effectively improve the heat transfer performance because it optimizes the velocity and temperature field, reduces the equivalent thermal resistance of convection heat transfer process, and the temperature of outlet gas increases significantly, which indicates the heat quality of the gas has been greatly improved. The increase in distribution thickness obviously enhances heat transfer performance without reducing the equivalent thermal resistance in the bed. The result is of great importance for guiding practical engineering applications.
1. Introduction
Packed beds are widely used in various industry process, such as catalytic reactors, high temperature gas-cooled nuclear reactors, absorption towers, and so on [1,2]. The structure of the packed reactor is simple and the efficiency is high, so it is the most commonly used reactor in industrial production and scientific research. However, the heat transfer coefficient of the packed bed is relatively low, which is very detrimental for high temperature reactors, such as nuclear reactors. Therefore it is very import to improve the heat transfer performance, cool the bed, and raise the outlet gas temperature of the packed bed reactors.
The flow structure inside the packed bed is complex, so flow maldistribution exists, especially when the tube-to-particle dt/dp ratio is small. The ratio dt/dp affects the properties near the wall region because the porosity is large here [3,4,5,6], and the changes of porosity and velocity may cover the core area of the bed, where the heat transfer mainly occurs [7,8]. The flow maldistribution is obvious with low tube-to-particle ratio (dt/dp < 15) and will seriously affect the heat transfer or reaction in the bed [9], which determines the design of the bed. When the bed is packed with uniform size particles, there exists a large void fraction near the wall region and it can be called wall effects [10]. Several studies aim to reveal the flow and heat transfer characteristics in the packed bed. However, the correlations of heat transfer in the packed bed with small value of dt/dp is hardly to satisfy all the packed beds [4,11]. There are no standard empirical correlations which can be applied to all the range of tube-to-particle ratios. So, various effective parameters under steady state are proposed, including effective thermal conductivities [12], overall heat transfer coefficient, and effective transport parameters [13,14,15]. Recently, with the development of computer technology, the Computational Fluid Dynamics (CFD) method is adopted to save the time and economic cost. Nijemeisland [16] found that local heat transfer rates did not correlate statistically with the local flow field but related to large scale flow structures—the CFD method is adopted to study the velocity and temperature distribution. The method of composite packing can improve the heat transfer efficiency and heat flux of packed bed with low tube-to-particle ratio and restrain the wall effects [17], compared with the randomly packing. By studying the creeping, transition, and turbulent flow with tube-to-particle ratio dt/dp equals to 3 and 10, Reddy [11] concluded that the wall effects decrease as the ratio increases in the creeping and turbulent regimes. Many researches focus on the flow and heat transfer characteristics with low tube-to-particle ratio using CFD methods [18,19], some of them compared the effects of different computational models on the result. The CFD results show that the wall effects and flow maldistribution are obvious. However, the CFD modeling ignores the interaction among particles, which is important in dense gas–solid flow.
Theoretically, the flow in the packed bed includes particle motion, fluid flow, and the interactions between particles and fluid, between particles and particles, so particle scale study is necessary to get the information of particles and has been a research focus in the past decades [20]. The Computational Fluid Dynamics coupled with Discrete Element Method (CFD-DEM) approach has been fully developed and widely used in granular flows and fluidized beds [21,22]. The motion of discrete particles is solved by the Newton’s second law, which is known as Discrete Element Method (DEM [23]), while the flow of continuum fluid is solved by the locally averaged Navier-Stokes equations, which is known as CFD. It combines the CFD for the continuum fluid and DEM for the discrete particles, and this method is able to capture the particle physics compared with CFD methods [21]. The coupling between fluids and particles is performed by Eulerian–Lagrangian framework for dense flow [24]. Some researchers apply this method to study the flow behavior of fluidized beds [24,25,26], and find that the simulation results agree well with experimental results, which means this method is reliable enough; the CFD-DEM methods also have some other applications in industrial [27,28,29,30]. However, in terms of packed beds, few studies apply CFD-DEM approach to research the flow and heat transfer characteristics and enhance the heat transfer inside the bed. J. Yang [17] used the discrete element model to generate the randomly packed bed, but not involved in the calculation for the flow and heat transfer. H. Wu [31] studied the thermal radiation of high temperature gas-cooled reactor using CFD-DEM approach.
In order to better understand the nature of the convective heat transfer, Guo el al. [32,33] proposed the field synergy principle, then further developed by Liu et al. [34,35], to guide the design of convective heat trnsfer process with higher heat transfer efficiency and lower flow resistance. With the development of the computation techonology, there are a tendency to design heat transfer unit or system based on the combination of the CFD and optimization algorithm [36,37,38,39]. In the current work, to better compare the performance of different parameter configurations, a new physical quantity entransy is introduced, which represents the heat transfer ability of an object [40], and the expression of entransy dissipation is derived from the entransy balance equation. It concluded that the entransy dissipation can be used to measure the irreversibility of the heating or cooling process [41]; moreover, the entransy dissipation extremum principle is proposed as a criterion to guide the optimization of heat transfer process [42]. However, this criterion is different from minimum entropy production principle. Chen et al. [43] pointed that the minimum entropy production principle should be adopted to minimize the usable energy dissipation, while the entransy dissipation extremum principle should be adopted to maximum the heat transfer ability. For heat transfer process only to heat or cool fluids, entransy dissipation is more suitable as a measure of irreversibility. Actually, entransy is an unconserved quantity during the heat transfer process, the entransy dissipation is inevitable, so based on the concept of entransy dissipation, the equivalent thermal resistance of the multidimensional problem is defined, and the goal of the heat transfer optimization is to minimize the equivalent thermal resistance [42].
From all available literatures about packed beds, most focus on the uniform size particles with CFD methods, and aimed to reveal the flow and heat transfer characteristics. However, the effects of multisizes particle mixing and its distribution are still not clear, and few studies have optimized the heat transfer performance inside the bed. J. Yang [17] pointed that the method of composite packing of different particle size can restrain the wall effects. Therefore, based on the CFD-DEM methods, a full numerical simulation is carried out for packed beds with low tube-to-particle ratios in this work. When the wall effects are obvious, the fluid will flow away from the wall region and heat transfer in the center is poor, so the optimal objective is to restrain wall effects, reduce the porosity near the wall, and strengthen the heat transfer in the core area. Considering particle motion and heat conduction between particles, the effects of radial distribution of particle size and the distribution thickness on the heat transfer and fluids flow are discussed. Entransy dissipation is used as criteria to evaluate the performance of different parameter configurations. The result is of great significance to design the packed beds reactors and reduce the volume of beds, especially for high temperature gas-cooled reactors.
2. Mathematical Model
In the CFD-DEM coupling approach, the discrete element model is based on the so called soft sphere model, and the gas phase is modeled as a continuum. The force and motion of particles are tracked at particle-scale level, and the key assumption is that the time step is small enough that the disturbances propagation distance is no more than one particle, so the velocity and acceleration of each individual particle are constant in one time step, so the interaction between particles within each time step can be ignored, and, after the end of one time step, the information of the interaction between particles will be updated and will be the start of the next step [44]; the macroscopic behavior of particles clusters is the cumulative result of the particle-scale behavior. The interaction of solid particles on gas phase is considered as the source of mass, momentum and energy equations. In current work, the mass exchange between particle and gas is neglected. The model description is given below.
2.1. Governing Equations for Solid Particles
There are two types of motion for a particle in moving bed—translation and rotation—and the motion of individual particles is determined by Newton’s second law of motion, while the Hertz–Mindlin contact theory is adopted for the interaction between particles. So, the governing Equations of particle i with mass mi and moment of inertia can be written as
where and are the translation velocities and rotation velocities of the particle i, and is the number of particles interacting with particle i. and are the contact force and non-contact force respectively, is the particle–fluid interaction force acting on the particle i, represents the gravitational force. and are the torques generated by tangential force and rolling friction force. In this work, the expressions of forces and torques have been listed in the literature [20].
Contacts between particles are significant for dense phase such that conductive heat transfer must be taken into account. The heat flux between the particles is defined as Equation (3), and the contact area is incorporated in the heat transfer coefficient , as shown in Equation (4). The temperature change over time of each particle is updated explicitly by Equation (5).
where is the temperature difference between particle i and particle j, and are the thermal conductivity of particle i and j, respectively, and is the contact normal force. is the geometric mean of the particles radii according to the Hertz–Mindlin contact theory and is the effective Young’s modulus. The heat flux is the heat conduction flux between particles i and j, and is the convection heat flux between fluid and solid particles. is the radiation heat flux between particle i and its surrounding environment.
2.2. Governing Equations for Gas Phase
The gas is treated as a continuum phase, and for the incompressible fluid, the fluid field can be solved by continuity, momentum, and energy conservation equations. In the current work, the standard model is adopted to solve fluid flow, and the governing Equations are given as follows.
Continuity Equation:
Momentum Equation:
Energy Equation:
where , , and p are the fluid density, velocity, and pressure. and are the porosity and temperature of the fluid and and are the specific heat capacity and thermal conductivity of fluid. is the momentum source term due to the effect of solid particles on fluid motion and is the energy source term because of the heat exchange between fluids and particles, CFD and DEM are coupled by the source terms and , the expressions of , are given in detail [45].
2.3. Heat Transfer Models
The fluid and particles are obtained by solving Equations (1), (2), (6) and (7); while the heat transfer between particles and fluid is governed by Equations (5) and (8). In the present work, the temperature of particles is up to 800 K, so there are three heat transfer mechanisms considered—heat conduction, heat convection, and particle radiation—where the convection heat transfer between fluid and the wall is not considered and the wall is regarded as adiabatic. The models used to describe the different heat transfer mechanisms have been described in detail [33], and for the sake of simplicity, are no longer described here.
In order to better describe the heat transfer performance in the packed beds, several parameters are defined here. The Reynolds number and pore scale hydraulic diameter dk are defined as follows.
The heat transfer coefficient and the Nusselt number are defined below.
where, is total heat flux of the heat convection in the packed beds and and are the average temperature of the particles and fluids in the beds, respectively. Because of the improvement in heat transfer, at the cost of the increase of pressure drop, in order to compare the overall performance of different configurations, the expression is defined:
where the and is the Nusselt number and friction factor of the packed with uniform particle size distribution.
2.4. Entransy Dissipation
As described above, the entransy dissipation is introduced to describe the heat transfer ability. Different from the energy destruction minimization [46,47], for the simple heating or cooling process, entransy dissipation is more suitable as a measure of the irreversibility of the heat transfer process. The heat transfer process studied in this paper is to cool the high temperature particles with cold air, so it is suitable to take entransy dissipation as a measure of heat transfer performance.
According to a previously described definition [43], the entransy of flow fluid in the opening system is as follows.
where H is the enthalpy of the flow fluid and is the mass flow rate.
Entransy is not conserved and will dissipate during fluid flow, the entransy dissipation rate of unit volume and unit time is
Equation (15) is derived from the entransy balance equation, which is derived from the thermal energy conservation equation, and the can be considered as the local entransy dissipation. The detailed derivation has been given by the researchers [41], and it is omitted here due to the complexity of the derivation. According to the entransy dissipation extremum principle, when the boundary temperature difference is given, maximizing the entransy dissipation leads to maximum boundary heat flux, which leads to the minimum of equivalent thermal resistance, which is the best performance for the heat transfer [48]. It can be expressed as
The entransy dissipation is the function of heat flux and temperature gradient, as shown in Equation (11), applying the variational method [49] to the entransy balance equation, Equation (12) can be obtained. At a given temperature difference, the equivalent thermal resistance is defined as the ratio of the square of temperature different divided by the entransy dissipation, which can be written as
where, is the average temperature difference. The smaller is, the better the heat transfer performance and the stronger the heat transfer ability is. Due to entransy dissipation is the function of heat flux and the temperature gradient, the total entransy dissipation, because of the finite temperature difference in the packed bed, is defined as follows.
where, and are the temperature of high particles and temperature of cold fluid. So the T–Q graph can be used to visually represent the entransy dissipation of the heating or cooling process.
3. Simulation Conditions
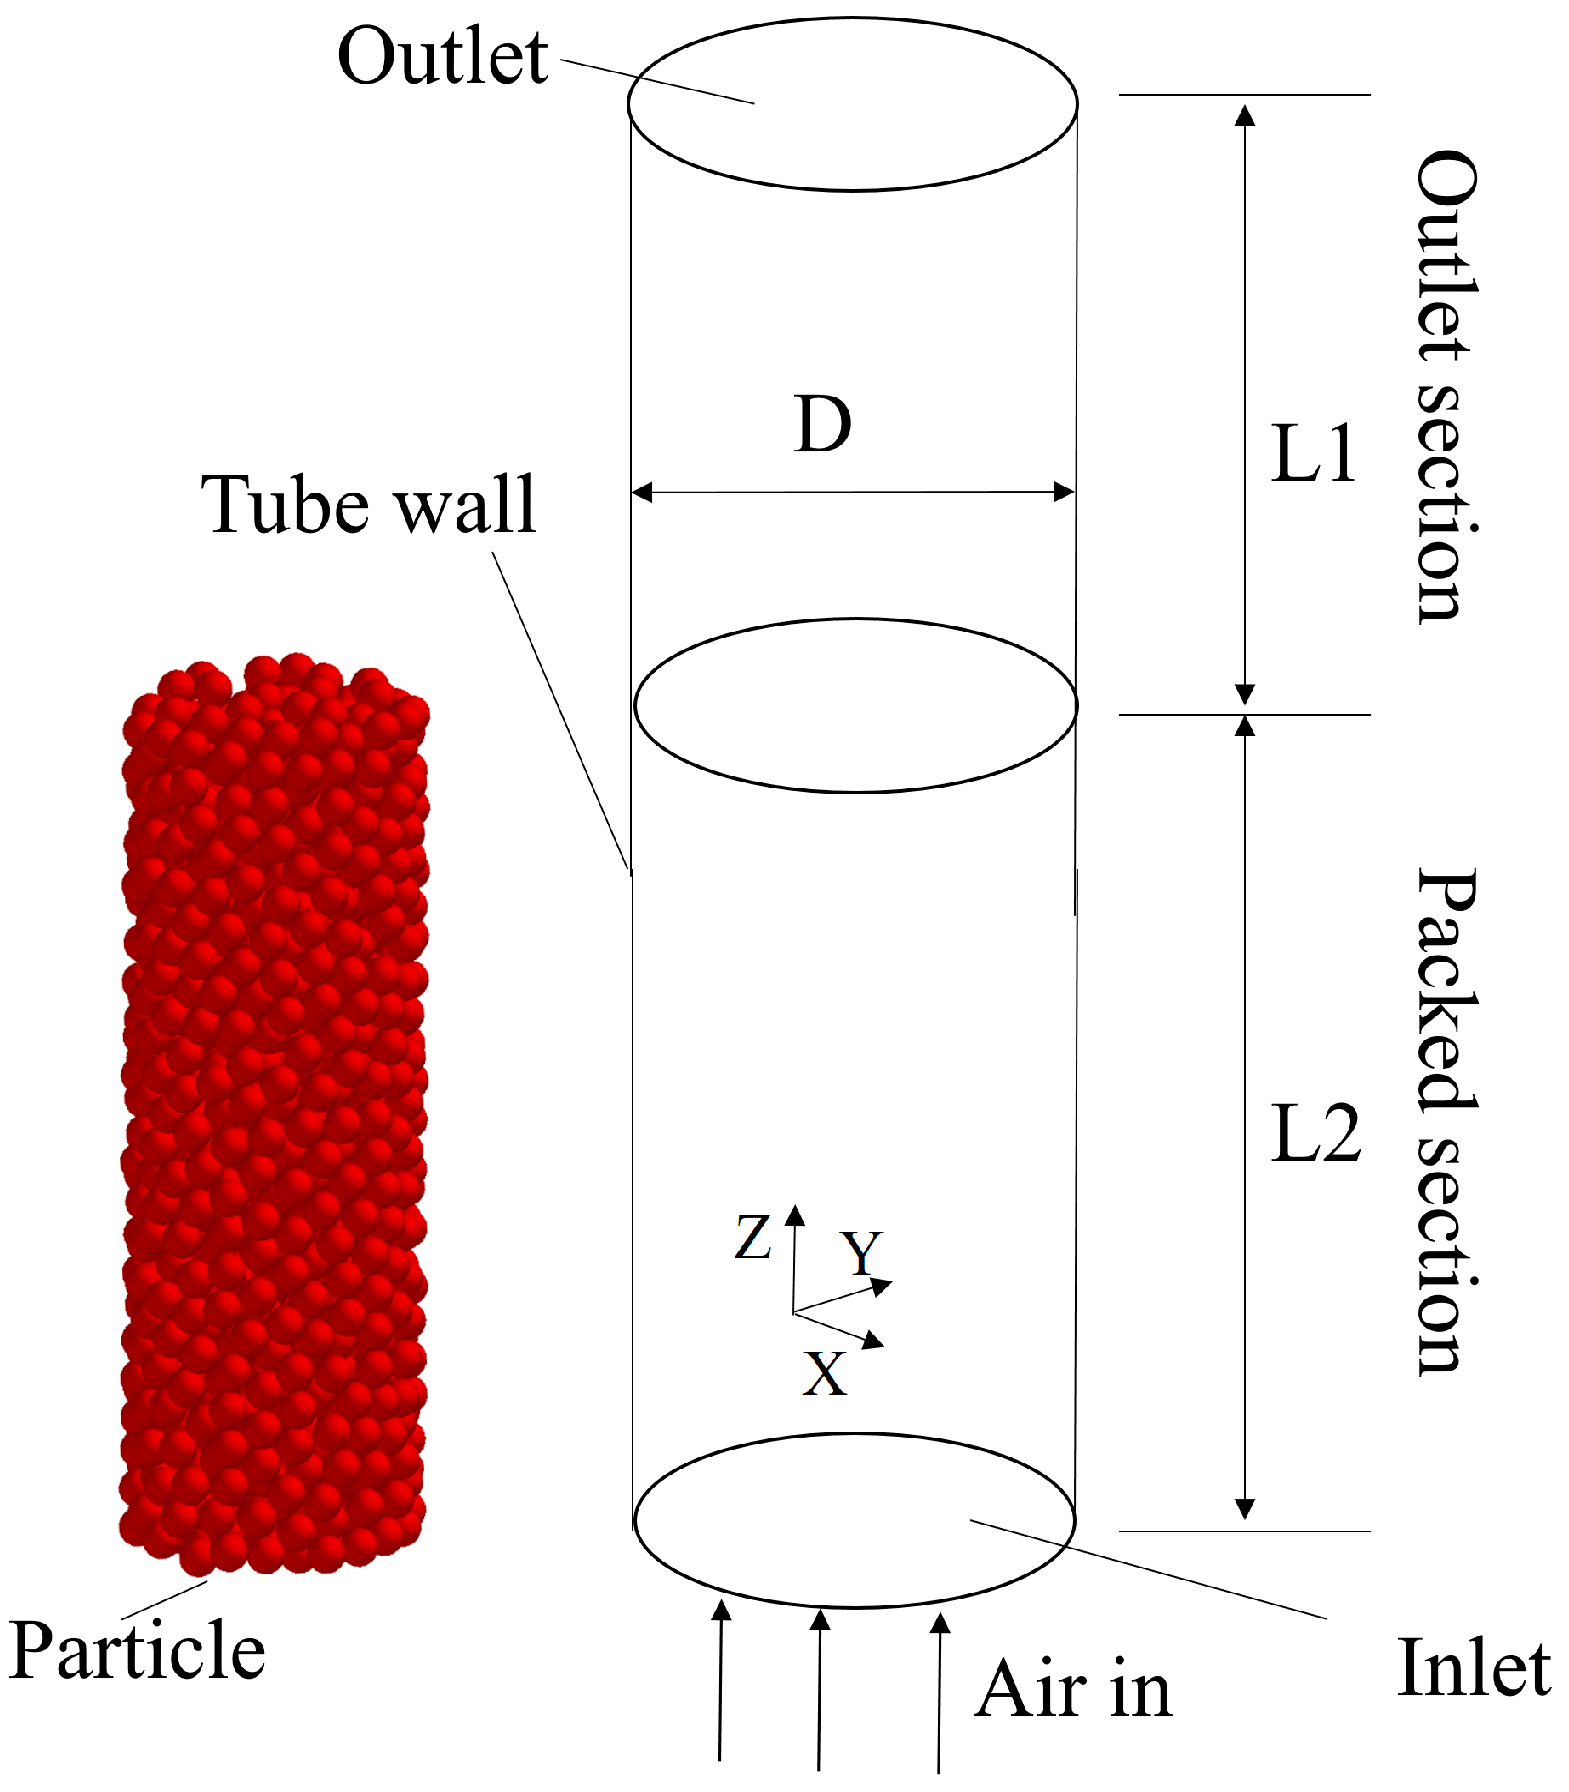
The physical model of packed bed used in this work and the boundary conditions is shown in Figure 1. There are two sections of the physical model: packed section and outlet section. Considering the complexity of the gas flow in the particle section, and avoiding the influence of the outlet reversed flow, the outlet extends 90 mm downstream. The inlet is specified as a velocity inlet, the outlet is specified as a pressure outlet, and the wall is considered as adiabatic. The packed section is filled with particles with different sizes. Detailed geometric parameters of the packed bed and boundary conditions are shown in Table 1. Firstly, the particles with temperature of 800 K fill with the packed section, until the steady state of the particles is achieved, and then the gas is introduced from the bottom with velocity of 5 m/s, with temperature of 293 K, and after sufficient heat exchange between particles and gas, the gas flows out at the outlet and will be recycled for other use.
In order to study the strengthening effects of the mixing of particles with different sizes, the packed beds with different particle size distribution are shown in Figure 2. Five kinds of different particle size distributions in the radial direction are studied here, namely, random packing with uniform size of 5 mm (d = 5 mm), random mixing distribution with size of 4–5 mm (mixing 4–5 mm), radial distribution of 4–5 mm (d = 4–5 mm), random mixing distribution of 3–5 mm (mixing 3–5 mm), and radial distribution of 3–5 mm (d = 3–5 mm). When the particles are distributed along the radial direction, the central region is filled with basic particles with diameter of 5 mm, while the near wall region is filled with small particles with diameter of 4 mm or 3 mm, as shown in Figure 2c,e, the average porosity of mixing 4–5 mm and d = 4–5 mm, mixing 3–5 mm, and d = 3–5 mm are the same, respectively.
In order to further study the influence of particle size distribution on the heat transfer process and the range of the wall effects in the bed, packed beds with different distribution thickness are studied, as shown in Figure 3. There are three cases with different distribution thickness: case1 (the same as the d = 3–5 mm in Figure 2e), case2, and case3, and the near wall region of the three cases are packed with small particles of 3 mm, as shown in Figure 3b–d. Meanwhile, the packed beds filled with big particles with diameter of 5 mm and small particles with diameter of 3 mm are also studied here as comparison, as shown in Figure 3a,e. All the particles in the packed beds are generated by discrete element methods.
The CFD-DEM method is used to study the flow and heat transfer characteristics between gas and particles, to meet the key assumptions, the time step is selected carefully. For the cases with the minimum particle diameter of 3 mm, 4 mm, and 5 mm, the time step is selected as 1e-5s, 2e-5s, and 2e-5s, respectively. In the case d = 5 mm, there are 1927 particles with diameter 5 mm; and in the case d = 4–5 mm and mixing 4–5 mm, the number of particles with diameter of 4 mm and 5 mm are 1931 and 953, respectively. In the case d = 3–5 mm and mixing 3–5 mm, the number of particles of 3mm and 5 mm are 4723 and 983, respectively. For case2, the number of particles of 3 mm and 5 mm are 6687 and 582, respectively. For case3, the number of particles with diameter of 3 mm and 5 mm are 7870 and 320, respectively. For case d = 3 mm, there are 9393 particles with diameter 3 mm.
4. Results and Discussion
4.1. Model Validation
The packed bed which is randomly packed with uniform size of 5 mm is selected for model validation. And the empirical correlations proposed by Sug Lee [50] are chosen for the validation of friction factor, and the empirical correlations proposed by Demirel [43] are chosen for the validation of heat transfer process, which can be expressed by Nusslet number. The friction factor is calculated by the following expressions [37].
where n is the factor related to porosity, and can be expressed as
and the Nusslet number concluded by Demirel [43] for spheres can expressed as
The CFD-DEM results of friction factor and Nusslet number are compared with the empirical correlation results, which are shown in Figure 4, and the quantitative are given in Table 2. As can be seen from Figure 4a, the numerical simulation results agree well with the results of correlations of Sug Lee [50], and the maximum deviation is 10.25% when Rep number is 6592.9; and, as can be found from Figure 4b, the numerical simulation results are in good agreement with the correlation results proposed by Demirel [49], and the maximum deviation is 6.65% when the number is 5405.4. Therefore, it can be concluded that the CFD-DEM approach used in the present work is reliable to simulate the fluid flow and heat transfer in packed beds with low tube-to-particle ratio.
4.2. The Effect of Particle Diameter Distribution
The radial distribution of particle with different sizes determines the distribution of porosity along the radial direction. To analyze the results conveniently, four typical cross-sections are selected, as shown in Figure 5, the sections of Z = 0.07922 m, Z = 0.06922 m, and Z = 0.05922 m are XY planes close to the outlet, and the plane of Y-section is ZX plane that is at the location of Y = 0 m. In the present work, the tube-to-particle ratio is relatively low (8 < dt/dp < 13.3), as discussed above, for low tube-to-particle ratio, the porosity near the wall region is larger than that in the central region when the bed is packed with particles of uniform size; and the gas flows away from the near wall region without sufficient heat exchange with the solid particles, so higher gas velocity can be found near wall region, as shown in Figure 6b, meanwhile, the temperature of the gas is lower than that in the central region, as shown in Figure 6a. Also it can be found from Figure 7 that there is large difference in temperature along the radial direction from the wall to the center of the tube, and the max temperature difference is almost 10 °C near the wall region (one diameter from the wall to the center in the radial direction) at the different cross-sections, which means that the wall effects is obvious. So it is important to decrease the porosity near wall region, improve the velocity, and optimize the flow field and temperature field.
Figure 8 compares the Nusselt number, friction factor at the different Re numbers, as shown in Figure 8a, and the Nu of multiparticle size distributions, which is higher than that of uniform particle size distribution at different Re, meaning that the heat transfer performance is better, and the heat transfer performance of case d = 3–5 mm is the best. However, the improvement of heat transfer performance is at the cost of the increase of pressure drop, as shown in Figure 8b, the better heat transfer performance corresponds to the higher friction factor. Figure 8c compares the overall performance of different configurations, with the performance of uniform particle size distribution as a reference. It can be seen that at low Re, the overall performance of multiparticle size distribution is better than reference, but with the increase of Re, the overall performance becomes worse than the reference, which is mainly because the pressure drop increase too fast. So at low Re, d = 3–5 mm is recommend because of the better overall performance.
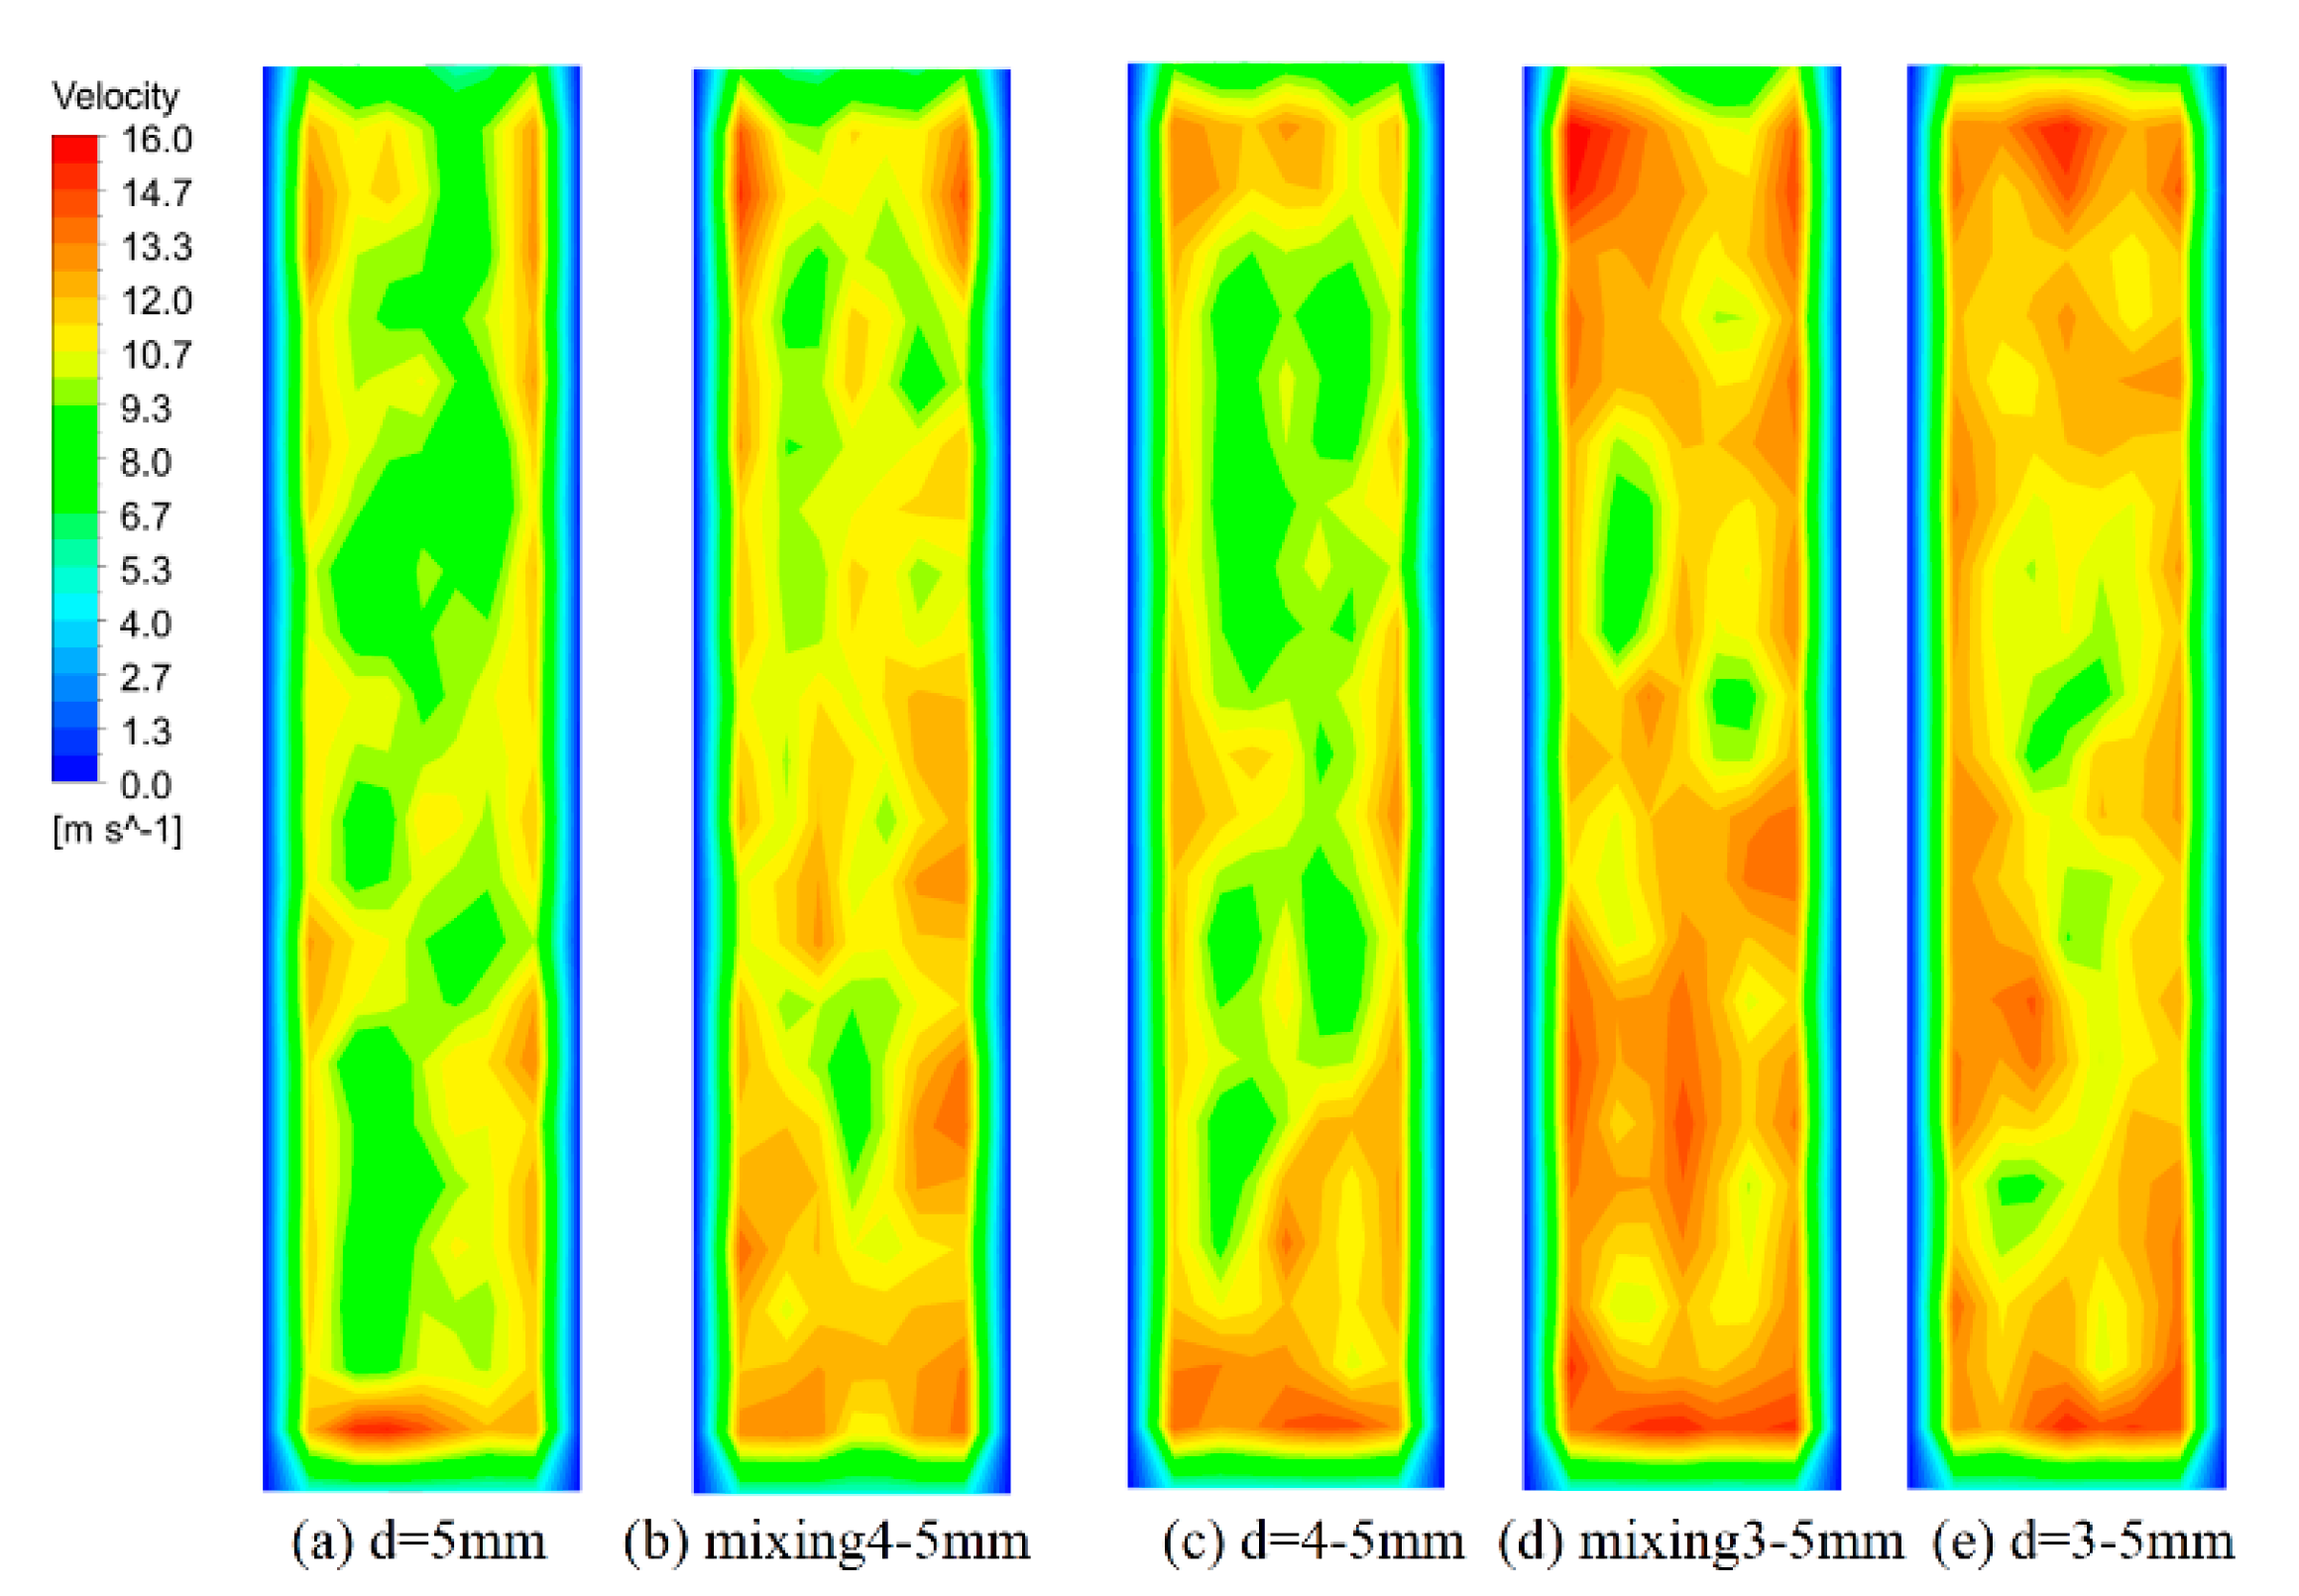
To analyze the nature of the different heat transfer performances, the temperature and velocity distributions of different particle size distribution at section Y-Sec are shown in Figure 9 and Figure 10 (Re = 6399). It is found that, due to the small particles are placed in the near wall region, the velocity distribution throughout the bed is more uniform compared with the uniform particle size distribution, and the temperature of the near wall region is close to that of the central region in the case d = 4–5 mm, as shown in Figure 9c and Figure 10c. Moreover, with the decrease of particle size near wall region (d = 3–5 mm), the porosity decreases further, so the velocity throughout the bed has been increased, so the heat transfer in the core area is enhanced, as shown in Figure 9e and Figure 10e, the temperature at the outlet is higher, as listed in Table 3. The radial temperature distributions of five different particle size distributions at the same section (Z = 0.07922 m) are shown in Figure 11. The uniform particle size distribution d = 5 mm, and the random distribution mixing 4–5 mm, mixing 3–5 mm have similar temperature distributions in the radial direction, namely, the temperature in the near wall region is lower than that in the central region, so it indicates the random mixing of big and small particles cannot restrain the wall effects. While the cases of d = 4–5 mm and d = 3–5 mm can improve the temperature in the near wall region, they also restrain the wall effects and optimize heat transfer in the beds.
The effects on heat transfer also can be found from the change of the isothermal lines, for the uniform particle size d = 5 mm, as shown in Figure 9a, the isothermal lines are concave, and both the temperature gradient and heat flux are toward to the center of the tube, but the gas velocity in the center is low, which indicates the heat transfer in the central area is weak; while for d = 4–5 mm and d = 3–5 mm, the isothermal lines are convex, so both the temperature gradient and heat flow are toward to the near wall region, and the velocity in the near wall region is relatively high, as shown in Figure 9c–e, as a result, the heat transfer throughout the beds are improved. Due to the fact that the velocity of the case of 3–5 mm distribution is higher than that of 4–5 mm, there is more heat flux in the d = 3–5 mm, so the outlet gas temperature is higher, as listed in Table 3. The isothermal lines in the cases of mixing 4–5 mm and mixing 3–5 mm are similar to the uniform size distributions, as shown in Figure 9b,d, the heat transfer in the bed is not optimal. So the radial distribution of particle size can obviously enhance the heat transfer in the bed.
In order to evaluate the loss of the heat transfer ability in the process, the T–Q graph and the equivalent thermal resistance is shown in Figure 12. The larger the area surround by the curve is, the greater the entransy dissipation is, and, according to the minimum thermal resistance principle [36], the heat flux is larger, which corresponds to the better heat transfer performance when the boundary temperature is constant, as shown in Figure 12a; the equivalent thermal resistance is smaller, as shown in Figure 12b. It can be seen from Figure 12 that, the area enclosed by the curve corresponding to the distribution of d = 3–5 mm is the largest, and the equivalent thermal resistance is the smallest, so for the d = 3–5 mm, the heat transfer ability between the gas and solid is utilized in the greatest extent. It should be noticed that there are small difference of the thermal difference between the case of d = 3–5 mm and mixing 3–5 mm, d = 4–5 mm and mixing 4–5 mm, but the difference among d = 5 mm, d = 4–5mm and d = 3–5 mm is obvious.
As a result, considering the overall performance and the loss and heat transfer ability, it can be concluded that the improvement of heat transfer effect is at the cost of the loss of heat transfer ability. And the radial particle size distribution of 3–5 mm is the optimal configuration.
4.3. The Effect of Distribution Thickness
As discussed above, the radial distribution of particle size can obviously improve the heat transfer performance in the bed, in order to study the range of the wall effects the influence of radial distribution thickness on heat transfer is investigated, as shown in Figure 3.
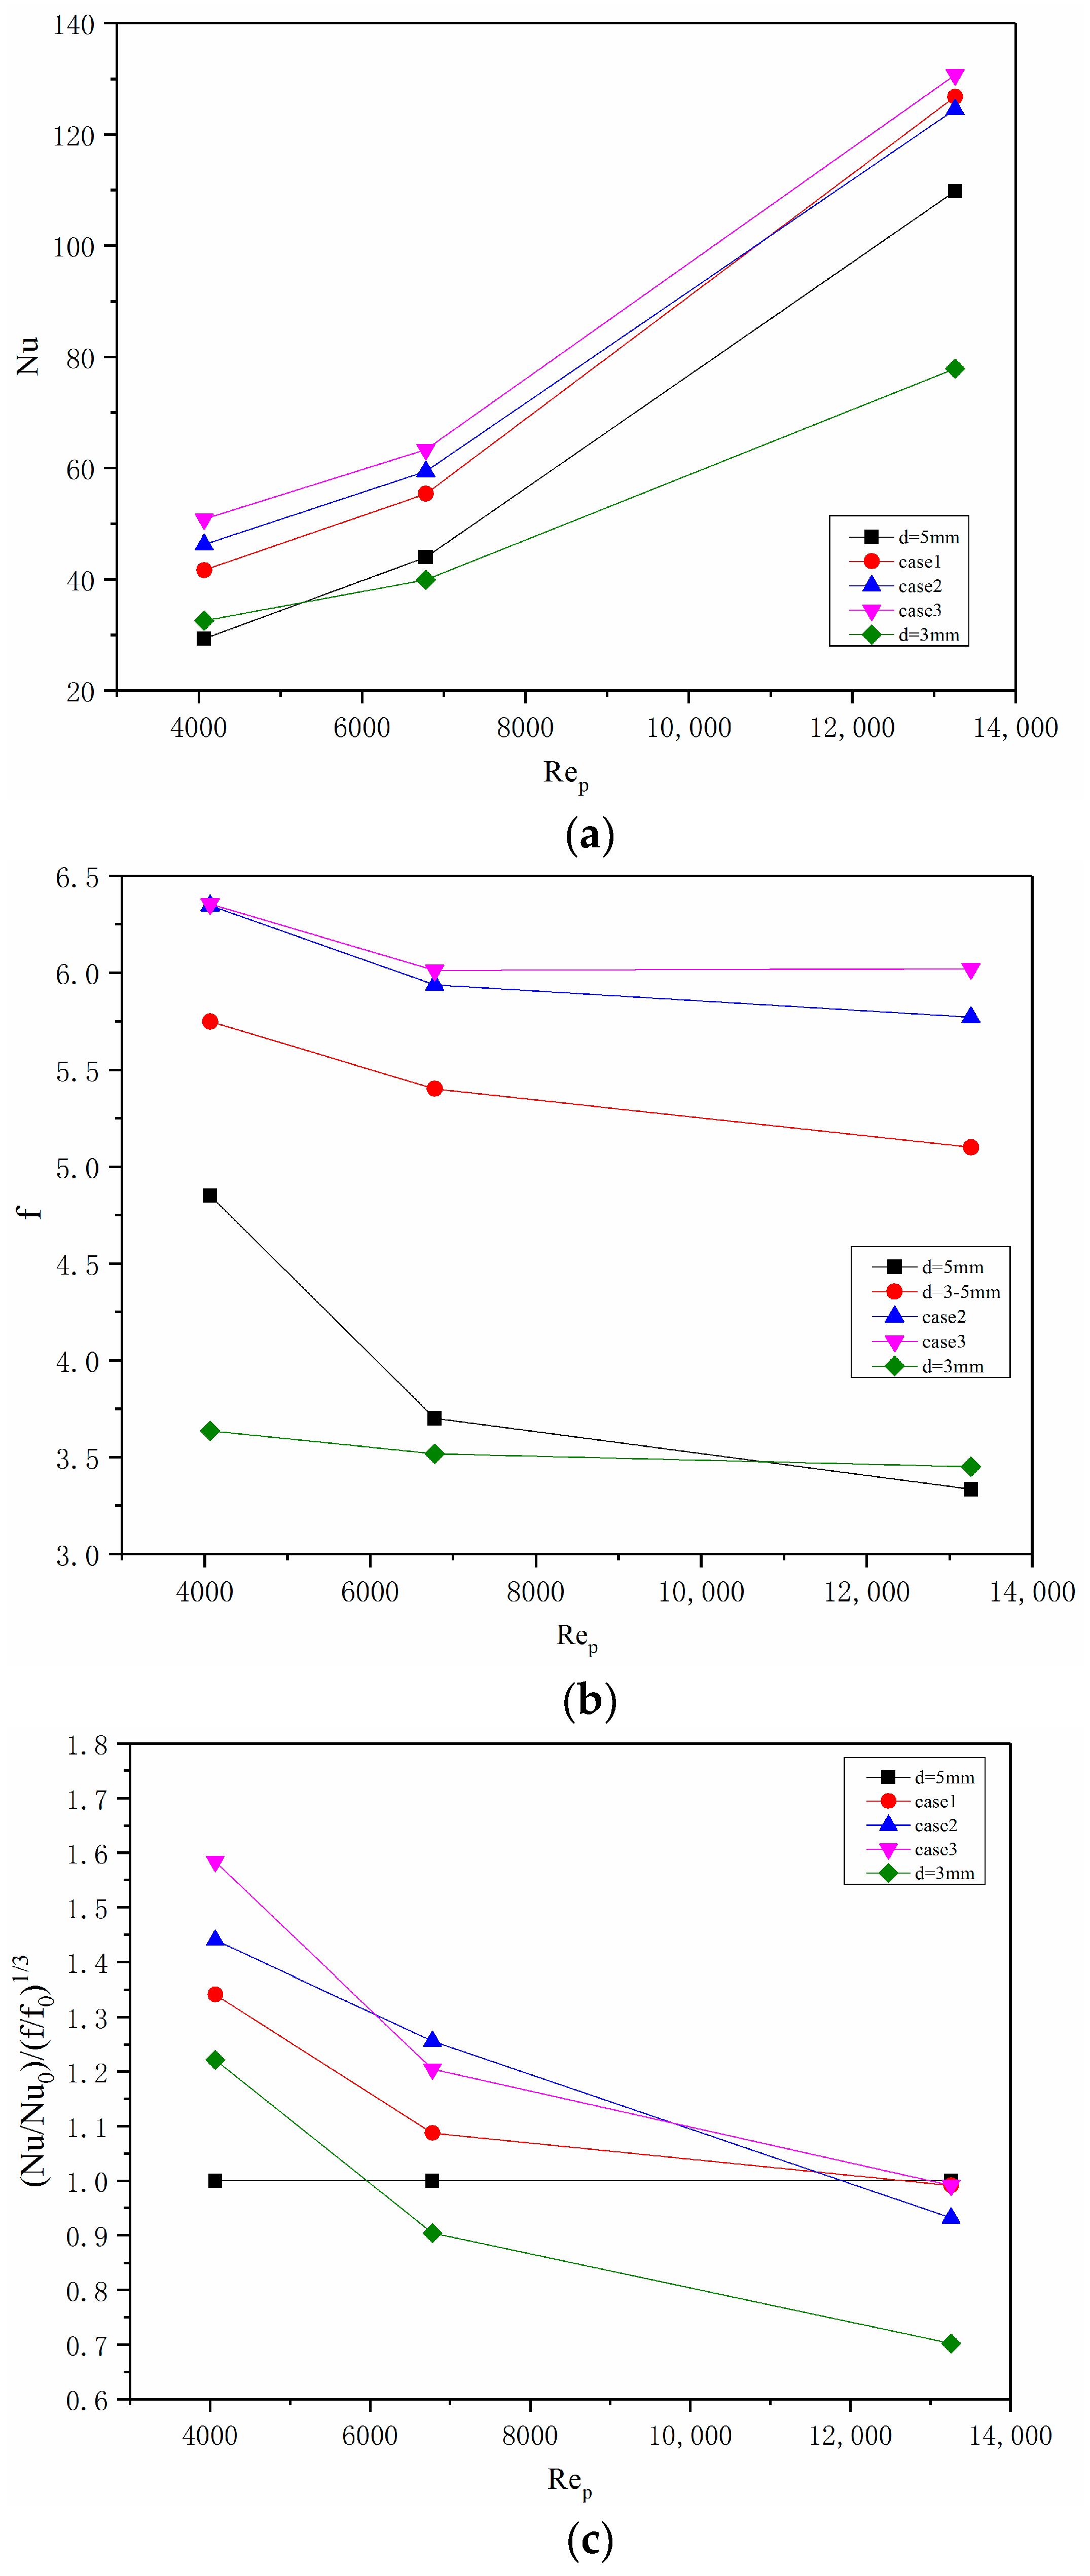
The flow and heat transfer performance are greatly affected by the distribution thickness, as shown in Figure 13, with the increase in distribution thickness, the Nu increases at different Re, but the f also increases. However, with further increase in distribution thickness, the multiparticle size distribution becomes the uniform size distribution of d = 3 mm, and the heat transfer performance decrease obviously. The overall performance is shown in Figure 13c, and the performance of the case3 is best, the case d = 3 mm is worse than case d = 5 mm, which indicates that for the uniform size distribution, the decrease of particle size cannot improve the performance of the beds, and the increase of the outlet temperature is due to the increase of the heat transfer area. The temperature distributions along the radial directions at the same section (Z = 0.07922 m) are shown in Figure 14. It is clearly that the average temperature increases with the increase of distribution thickness, and there is a big jump of temperature when the radial distribution of particles starting from uniform size (from the d = 5 mm) to the case1. Moreover, the temperature distribution trends of case1, case2, and case3 are the same: the temperature increases first and then decreases along the wall to the center of the tube, the turning point of temperature change is one particle diameter away from the wall, so it can be inferred that the wall effects are just one diameter away from the wall
The different performance can be analyzed from the flow and temperature filed, as shown in Figure 15 and Figure 16 (Re = 6399). With the increase of the radial distribution thickness (from Figure 3a–e), the big local flow channels formed in the central region decrease, and the local gas velocity increases, which leads to the improvement of heat transfer throughout the bed, and the outlet temperature is obviously increased, as listed in Table 3. But as the distribution thickness further increases (Figure 3e), the flow and heat transfer characteristics are the same as that of the uniform particle size. For the uniform size of d = 5 mm and d = 3 mm, the isothermal lines change in the similar trend along the radial direction from the tube wall to the center, namely, the isothermal lines are concave, the wall effects are obvious, the outlet temperature of d = 3 mm is higher than that of d = 5 mm—because the average porosity of the whole bed is lower and the heat transfer area is larger–but the heat transfer performance in the bed is not improved.
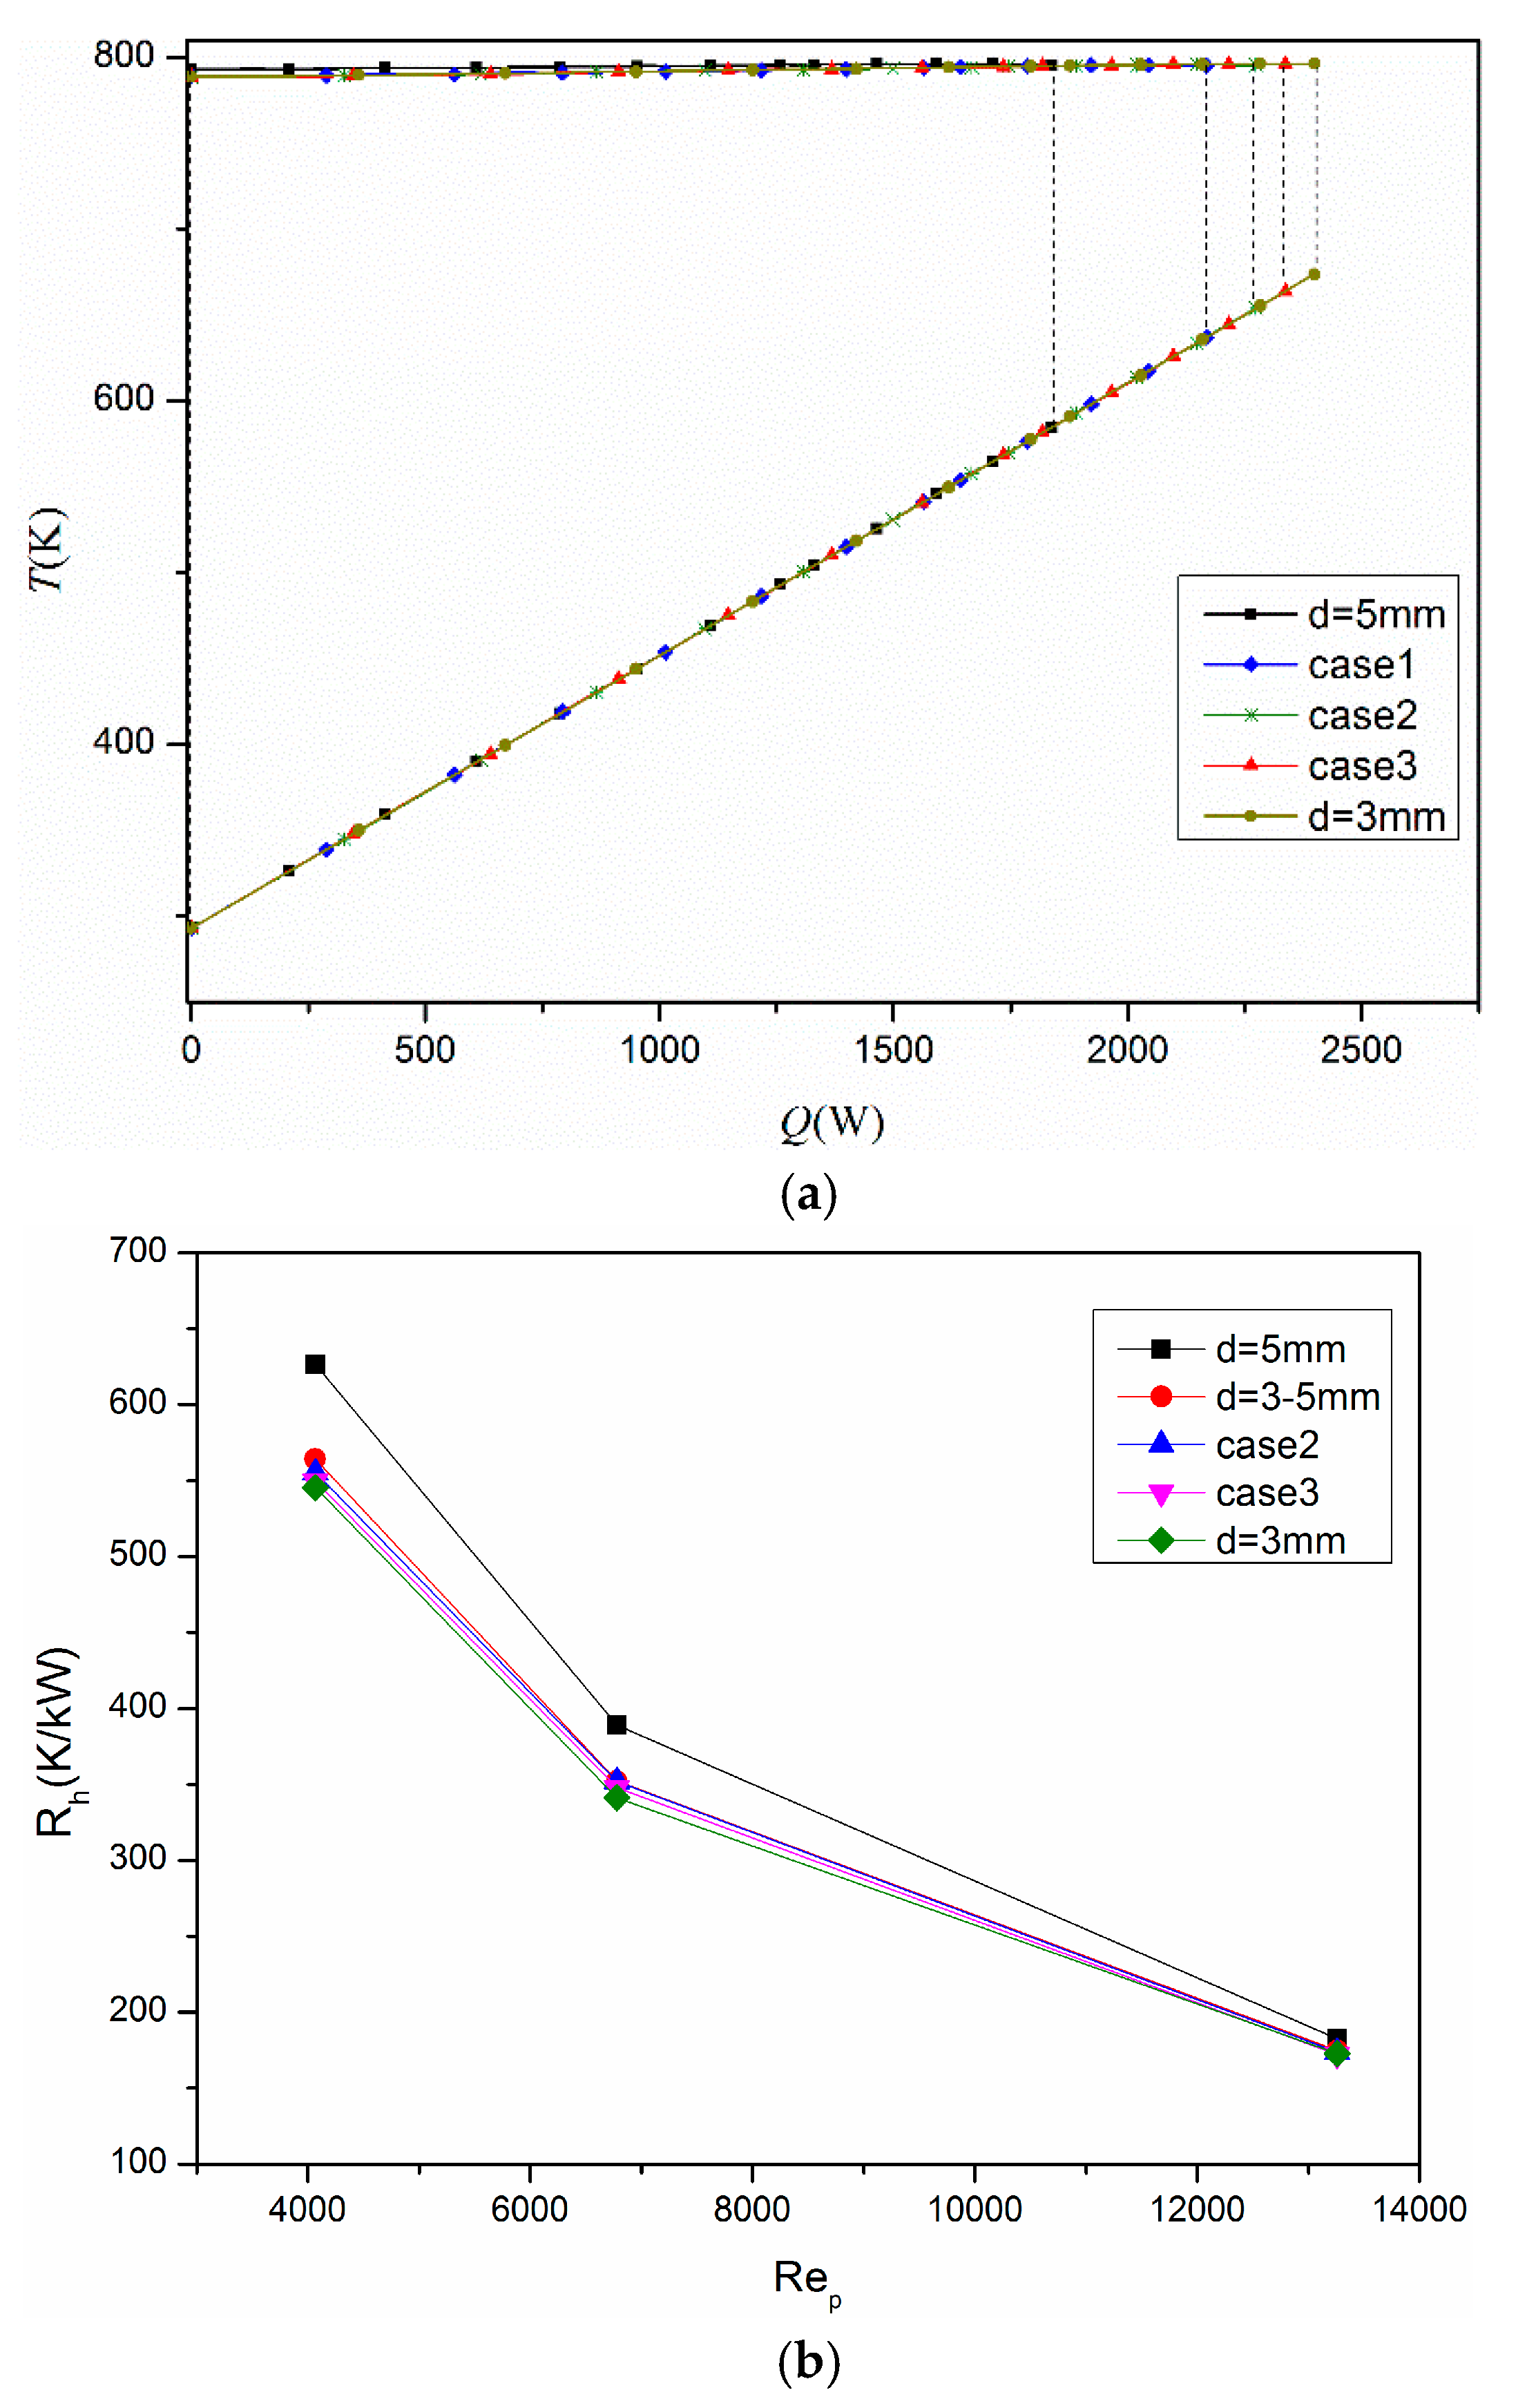
The entransy dissipation and the equivalent thermal resistance of the five different distributions are shown in Figure 17, the area enclosed by the curve increases gradually with the change of the distribution thickness. So it shows that the entransy dissipation and the heat flux Q increase obviously when the particle size changes from uniform size of d = 5 mm to the case1, and the equivalent thermal resistances decrease obviously, as shown in Figure 17b. The obvious increase in entransy dissipation and heat flux from the uniform size of d = 5 mm to the case1 occurs because the heat transfer performance is obviously improved. However, the difference of thermal resistance of case1, case2, and case3 is very small, and this is because the change of the distribution thickness do not improved the temperature and flow filed so much, as shown in Figure 14 and Figure 15, the fields of case1, case2, and case3 are similar, and the temperature gradient is similar, so there is a small difference in entransy dissipation and the equivalent thermal resistance.
As a result, considering the overall performance and the entransy dissipation, it can be concluded that the range of wall effects is just one particle diameter away from the wall, the heat transfer effects can be obviously improved by filling small particles in the near wall region, and the increase of distribution thickness can improve the heat transfer performance. The wall effects can be well restrained by the radial distribution of the particle size.
5. Conclusions
In the present paper, by adopting the CFD-DEM coupling method, the effects of radial distribution on particle size and distribution thickness on heat transfer are studied, the utilization of the heat transfer ability and the equivalent thermal resistance in the packed bed is analyzed. The main findings are as follows.
- By changing the radial distribution of the particle size in the bed the velocity distribution and temperature distribution in the bed can be effectively improved, the wall effects are well restrained, and the heat transfer ability between the gas and solid is utilized in the greatest extent.
- The range of wall effects is just one particle diameter (5 mm) away from the wall, and the heat transfer performance can be obviously improved by filling small particles in the near wall region.
- The increase of distribution thickness can obviously improve the heat transfer effects, and the equivalent thermal resistance is reduced compared to the uniform size distribution.
The configurations in this work has improved the heat transfer in the packed bed, and increased the outlet temperature, it is important for energy saving, emission, and industrial applications.
Author Contributions
Conceptuallization: Z.L. and W.L.; methodology: S.W.; software: S.W.; validation: S.W.; resources: S.W.; formal analysis: S.W.; investigation: S.W.; datacuration: S.W.; writing: S.W.; review and editing: Z.L.; visualization: S.W.; supervision: S.W.; project administration: S.W.; funding acquisition: C.X.
Funding
The financial supporting was provided by National Key R&D Program of China (No. 2017YFB0603501).
Acknowledgments
We would like to acknowledge financial supports for this work provided by National Key R&D Program of China (No. 2017YFB0603501).
Conflicts of Interest
The authors declare no conflict of interest.
Nomenclature
| Surface area of particle (m2) | |
| Specific heat capacity of gas (J/kg/K) | |
| Specific heat capacity of particle i (J/kg/K) | |
| D | The diameter of bed (m) |
| pore scale hydraulic diameter (m) | |
| Particle diameter (m) | |
| f | Friction factor |
| G | Entransy (W.K) |
| Moment of inertia of particle i (kg/m2) | |
| L1 | The length of extended domain (m) |
| L2 | The length of particle domain (m) |
| Mas of particle i (kg) | |
| Angular velocity of particle i (rad/s) | |
| p | Pressure of gas (Pa) |
| Q | Heat flow (J/s) |
| equivalent thermal resistance (K/W) | |
| Temperature of gas (T) | |
| Temperature of particle i (T) | |
| Volume of particle (m3) | |
| Velocity of particle i (m/s) | |
| Energy source | |
| Momentum source | |
| Density of gas (kg/m3) | |
| Porosity of bed | |
| entransy dissipation (W.K) | |
| Temperature difference (K) | |
| Temperature gradient (K/m) | |
| k | Thermal conductivity |
References
- Bu, S.S.; Yang, J.; Zhou, M.; Li, S.Y.; Wang, Q.W.; Guo, Z.X. On contact point modifications for forced convective heat transfer analysis in a structured packed bed of spheres. Nucl. Eng. Des. 2014, 270, 21–33. [Google Scholar] [CrossRef]
- Yang, J.; Wang, J.; Bu, S.S.; Zeng, M.; Wang, Q.W.; Nakayama, A. Experimental analysis of forced convective heat transfer in novel structured packed beds of particles. Chem. Eng. 2012, 71, 126–137. [Google Scholar] [CrossRef]
- Dixon, A.G.; Di Constanzo, M.A.; Soucy, B.A. Fluid-phase radial transport in packed beds of low tube-to-particle diameter ratio. Heat Mass Transf. 1984, 27, 1701–1713. [Google Scholar] [CrossRef]
- Dixon, A.G. Heat transfer in fixed beds at very low (<4) tube-to-particle diameter ratio. Eng. Chem. Res. 1997, 36, 3053–3064. [Google Scholar]
- Borkink, J.G.H.; Westerterp, K.R. Influence of tube and particle diameter on heat transfer in packed beds. AIChE J. 1992, 38, 703–715. [Google Scholar] [CrossRef]
- Gunn, D.J.; Ahmad, M.M.; Sabri, M.N. Radial heat transfer to fixed beds of particles. Chem. Eng. Sci. 1987, 42, 2163–2171. [Google Scholar] [CrossRef]
- Ge, Y.; Liu, Z.C.; Liu, W. Multi-objective genetic optimization of the heat transfer for tube inserted with porous media. Int. J. Heat Mass Transf. 2016, 101, 981–987. [Google Scholar] [CrossRef]
- Zheng, N.; Liu, P.; Shan, F.; Liu, Z.; Liu, W. Effects of rib arrangements on the flow pattern and heat transfer in an internally ribbed heat exchanger tube. Int. J. Therm. Sci. 2016, 101, 93–105. [Google Scholar] [CrossRef]
- Reddy, R.K.; Joshi, J.B. CFD modeling of pressure drop and drag coefficient in fixed beds: Wall effects. Particuology 2010, 8, 37–43. [Google Scholar] [CrossRef]
- Muller, G.E. Radial void fraction distribution in randomly packed fixed beds of uniformly sized spheres in cylindrical containers. Powder Technol. 1992, 72, 269–275. [Google Scholar] [CrossRef]
- McGreavy, C.; Foumeny, E.A.; Javed, K.H. Characterization of transport properties for fixed bed in terms of local bed structure and flow distribution. Chem. Eng. Sci. 1986, 41, 787–797. [Google Scholar] [CrossRef]
- De Beer, M.; Du Toit, C.G.; Rousseau, P.G. A methodology to investigate the contribution of conduction and radiation heat transfer to the effective thermal conductivity of packed graphite pebble beds, including the wall effect. Nucl. Eng. Des. 2017, 314, 67–81. [Google Scholar] [CrossRef]
- Coberly, C.A.; Marshall, W.R. Temperature gradient in gas stream flowing through fixed granular beds. Chem. Eng. Prog. 1951, 47, 141–150. [Google Scholar]
- Ferreira, L.M.; Castro, J.A.M.; Rodrigues, A.E. An analytical and experimental study of heat transfer in fixed bed. Int. J. Heat Mass Transf. 2002, 45, 951–961. [Google Scholar] [CrossRef] [Green Version]
- Collier, A.P.; Hayhurst, A.N.; Richardson, J.L.; Scott, S.A. The heat transfer coefficient between a particle and a bed (packed of fluidized) of much larger particles. Chem. Eng. Sci. 2004, 59, 4613–4620. [Google Scholar] [CrossRef]
- Nijemeisland, M.; Dixon, A.G. CFD study of fluid flow and wall heat transfer in a fixed bed of spheres. AIChE J. 2004, 50, 906–921. [Google Scholar] [CrossRef]
- Yang, J.; Wu, J.Q.; Zhou, L.; Wang, Q.W. Computational study of fluid flow and heat transfer in composite packed beds of spheres with low tube to particle diameter ratio. Nucl. Eng. Des. 2016, 300, 85–96. [Google Scholar] [CrossRef]
- Yang, J.; Wang, Q.W.; Zeng, M.; Nakayama, A. Computational study of forced convective heat transfer in structured packed beds with spherical or ellipsoidal particles. Chem. Eng. Sci. 2010, 65, 726–738. [Google Scholar] [CrossRef]
- Guardo Coussirat, M.; ALarrayoz, M.; Recasens, F.; Egusquiza, E. Influence of the turbulence model in CFD modeling of wall-to-fluid heat transfer in packed beds. Chem. Eng. Sci. 2005, 60, 1733–1742. [Google Scholar] [CrossRef]
- Zhu, H.P.; Zhou, Z.Y.; Yang, R.Y.; Yu, A.B. Discrete particle simulation of particulate systems: Theoretical developments. Chem. Eng. Sci. 2003, 62, 3378–3396. [Google Scholar] [CrossRef]
- Li, Y.; Ji, W. Acceleratio of coupled granular flow and fluid flow simulations in pebble bed energy systems. Nucl. Eng. Des. 2013, 258, 275–283. [Google Scholar] [CrossRef]
- Zhao, Y.; Jiang, M.; Lium, Y.; Zheng, J. Particle-scale simulation of the flow and heat transfer behaviors in fluidized bed with immersed tube. AIChE J. 2009, 55, 3109–3124. [Google Scholar] [CrossRef]
- Cundall, P.A.; Strack, O.D.L. A discrete numerical model for granular assemblies. Geotechnique 1979, 29, 47. [Google Scholar] [CrossRef]
- Zhong, W.; Yu, A.B.; Zhou, C.; Xie, J.; Zhang, H. CFD simulation of dense particulate reaction system: Approaches, recent advances and applications. Chem. Eng. Sci. 2016, 140, 16–43. [Google Scholar] [CrossRef]
- Chu, K.W.; Yu, A.B. Numerical simulation of complex particle–fluid flows. Powder Technol. 2008, 179, 104–114. [Google Scholar] [CrossRef]
- Gui, N.; Fan, J.R.; Luo, K. DEM–LES study of 3-D bubbling fluidized bed with immersed tubes. Chem. Eng. Sci. 2008, 63, 3654–3663. [Google Scholar] [CrossRef]
- Zhou, H.; Flamant, G.; Gauthier, D.; Flitris, Y. Simulation of coal combustion in a bubbling fluidized bed by distinct element method. Chem. Eng. Res. Des. 2003, 81, 1144–1149. [Google Scholar] [CrossRef]
- Li, J.T.; Mason, D.J. Application of the discrete element modelling in air drying of particulate solids. Dry. Technol. 2002, 20, 255–282. [Google Scholar] [CrossRef]
- Natsui, S.; Nogami, H.; Ueda, U.; Kano, J.; Inoue, R.; Ariyama, T. Simultaneous threedimensional analysis of gas-solid flow in blast furnace by combining discrete element method and computational fluid dynamics. ISIJ Int. 2011, 51, 41–50. [Google Scholar] [CrossRef]
- Yang, W.J.; Zhou, Z.Y.; Yu, A.B. Particle scale studies of heat transfer in a moving bed. Powder Technol. 2015, 281, 99–111. [Google Scholar] [CrossRef]
- Wu, H.; Gui, N.; Yang, X.T.; Tu, J.Y.; Jiang, S.Y. Numerical simulation of heat transfer in packed pebble beds: CFD-DEM coupled with particle thermal radiation. Int. J. Heat Mass Transf. 2017, 110, 393–405. [Google Scholar] [CrossRef]
- Guo, Z.Y.; Li, D.Y.; Wang, B.X. A novel concept for convective heat transfer enhancement. Int. J. Heat Mass Transf. 1998, 41, 2221–2225. [Google Scholar] [CrossRef]
- Guo, Z.Y.; Tao, W.Q.; Shah, R. The field synergy (coordination) principle and its applications in enhancing single phase convective heat transfer. Int. J. Heat Mass Transf. 2005, 48, 1797–1807. [Google Scholar] [CrossRef]
- Liu, W.; Liu, Z.C.; Guo, Z.Y. Physical quantity synergy in laminar flow field of convective heat transfer and analysis of heat transfer enhancement. Chin. Sci. Bull. 2009, 54, 3579–3586. [Google Scholar] [CrossRef]
- Liu, W.; Liu, P.; Dong, Z.M.; Yang, K.; Liu, Z.C. A study on the multi-field synergy principle of convective heat and mass transfer enhancement. Int. J. Heat Mass Transf. 2019, 134, 722–734. [Google Scholar] [CrossRef]
- Sun, H.N.; Ge, Y.; Liu, W.; Liu, Z.C. Geometric optimization of two-stage thermoelectric generator using genetic algorithm and thermodynamic analysis. Energy 2019, 171, 37–48. [Google Scholar] [CrossRef]
- Ge, Y.; Shan, F.; Liu, Z.C.; Liu, W. Optimal structural design of a heat sink with laminar single-phase flow using computational fluid dynamics based multi-objective genetic algorithm. J. Heat Transfer 2018, 9, 13–18. [Google Scholar] [CrossRef]
- Ge, Y.; Liu, Z.C.; Sun, H.N.; Liu, W. Optimal design of a segmented thermoelectric generator based on three-dimensional numerical simulation and multi-objective genetic algorithm. Energy 2018, 147, 1060–1069. [Google Scholar] [CrossRef]
- Ge, Y.; Wang, S.C.; Liu, Z.C.; Liu, W. Optimal shape design of a minichannel heat sink applying multi-objective optimization algorithm and three-dimensional numerical method. Appl. Thermal Eng. 2019, 148, 120–128. [Google Scholar] [CrossRef]
- Guo, Z.Y.; Zhu, H.Y.; Liang, X.G. Entransy-A physical quantity describing heat transfer ability. Heat Mass Transf. 2007, 50, 2545–2556. [Google Scholar] [CrossRef]
- Chen, Q.; Zhu, H.Y.; Pan, N.; Guo, Z.Y. An alternative criterion heat transfer optimization. Math. Phys. Eng. Sci. 2011, 467, 1012–1028. [Google Scholar] [CrossRef]
- Chen, Q.; Liang, X.G.; Guo, Z.Y. Entransy Theory for the optimization of heat transfer—A review and update. Heat Mass Transf. 2013, 63, 65–81. [Google Scholar] [CrossRef]
- Chen, Q.; Wang, M.; Pan, N.; Guo, Z.-Y. Optimization principles for convective heat transfer. Energy 2009, 34, 1199–1206. [Google Scholar] [CrossRef]
- Malone, F.; Xu, B.H. Particle-scale simulation of heat transfer in liquid-fluidized beds. Powder Technol. 2008, 184, 189–204. [Google Scholar] [CrossRef]
- Zhou, Z.Y.; Yu, A.B.; Zulli, P. Particle scale study of heat transfer in packed and bubbling fluidized beds. AIChE J. 2009, 55, 868–884. [Google Scholar] [CrossRef]
- Wang, J.; Liu, W.; Liu, Z. The application of exergy destruction minimization in convective heat transfer optimization. Appl. Therm. Eng. 2015, 88, 384–390. [Google Scholar] [CrossRef]
- Liu, W.; Liu, Z.; Jia, H. Entransy expression of the second law of thermodynamics and its application to optimization in heat transfer process. Int. J. Heat Transf. 2011, 54, 3049–3059. [Google Scholar] [CrossRef]
- Cheng, X.G.; Li, Z.X.; Guo, Z.Y. Variational principles in heat conduction. J. Eng. Thermophys. 2004, 25, 457–459. [Google Scholar]
- Demirel, Y.; Sharma, R.N.; Al-Ali, H.H. On the effective heat transfer parameters in a packed bed. Int. J. Heat Mass Transf. 2000, 43, 327–332. [Google Scholar] [CrossRef]
- Sug Lee, J.; Ogawa, K. Pressure drop through packed beds. J. Chem. Eng. Jpn. 1974, 27, 691–693. [Google Scholar]
Figure 1.
Computational physical model.

Figure 2.
Radial distribution of different particle sizes: (a) random packing with single size particles of 5 mm; (b) random mixing of 4–5 mm; (c) radial distribution of 4–5 mm; (d) random mixing of 3–5 mm; and (e) radial distribution of 3–5 mm.
Figure 2.
Radial distribution of different particle sizes: (a) random packing with single size particles of 5 mm; (b) random mixing of 4–5 mm; (c) radial distribution of 4–5 mm; (d) random mixing of 3–5 mm; and (e) radial distribution of 3–5 mm.

Figure 3.
Radial distribution of different distribution thickness: (a) single particle size of 5 mm; (b) case1; (c) case2; (d) case3; and (e) single particle size of 3 mm.
Figure 3.
Radial distribution of different distribution thickness: (a) single particle size of 5 mm; (b) case1; (c) case2; (d) case3; and (e) single particle size of 3 mm.
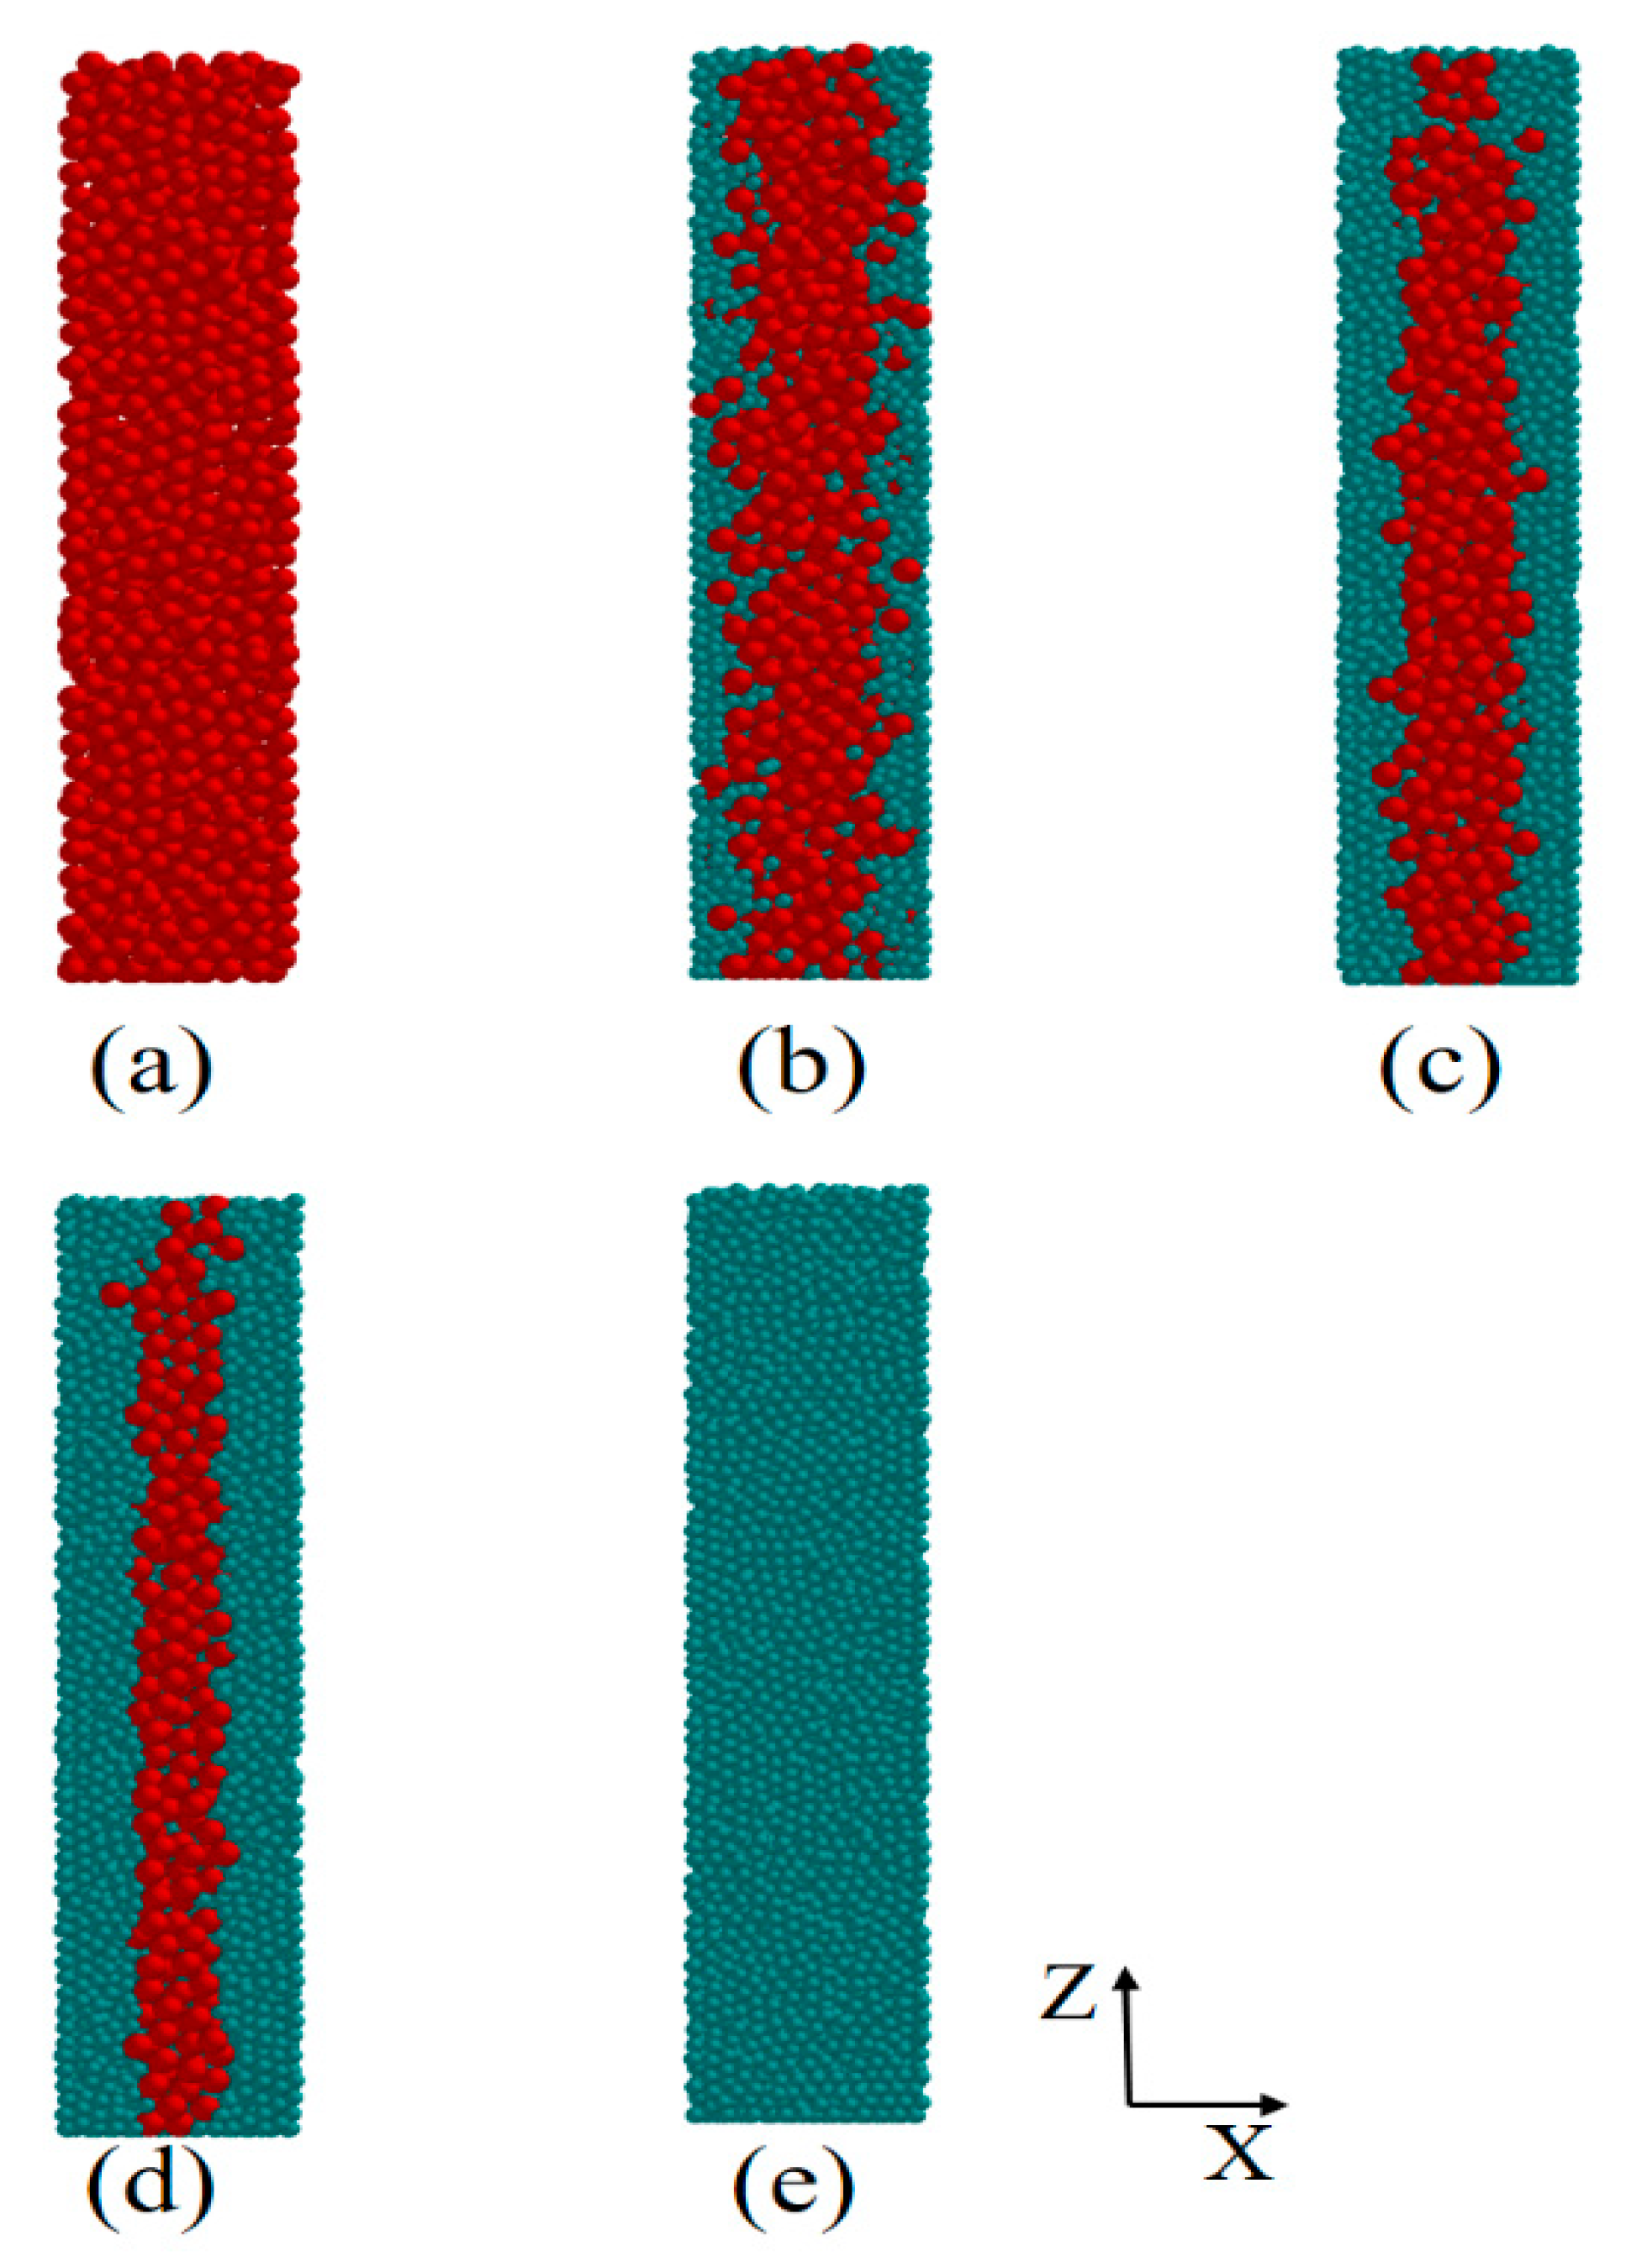
Figure 4.
Validation of the computation model compared with empirical correlations: (a) friction factor and (b) Nusselt number.
Figure 4.
Validation of the computation model compared with empirical correlations: (a) friction factor and (b) Nusselt number.
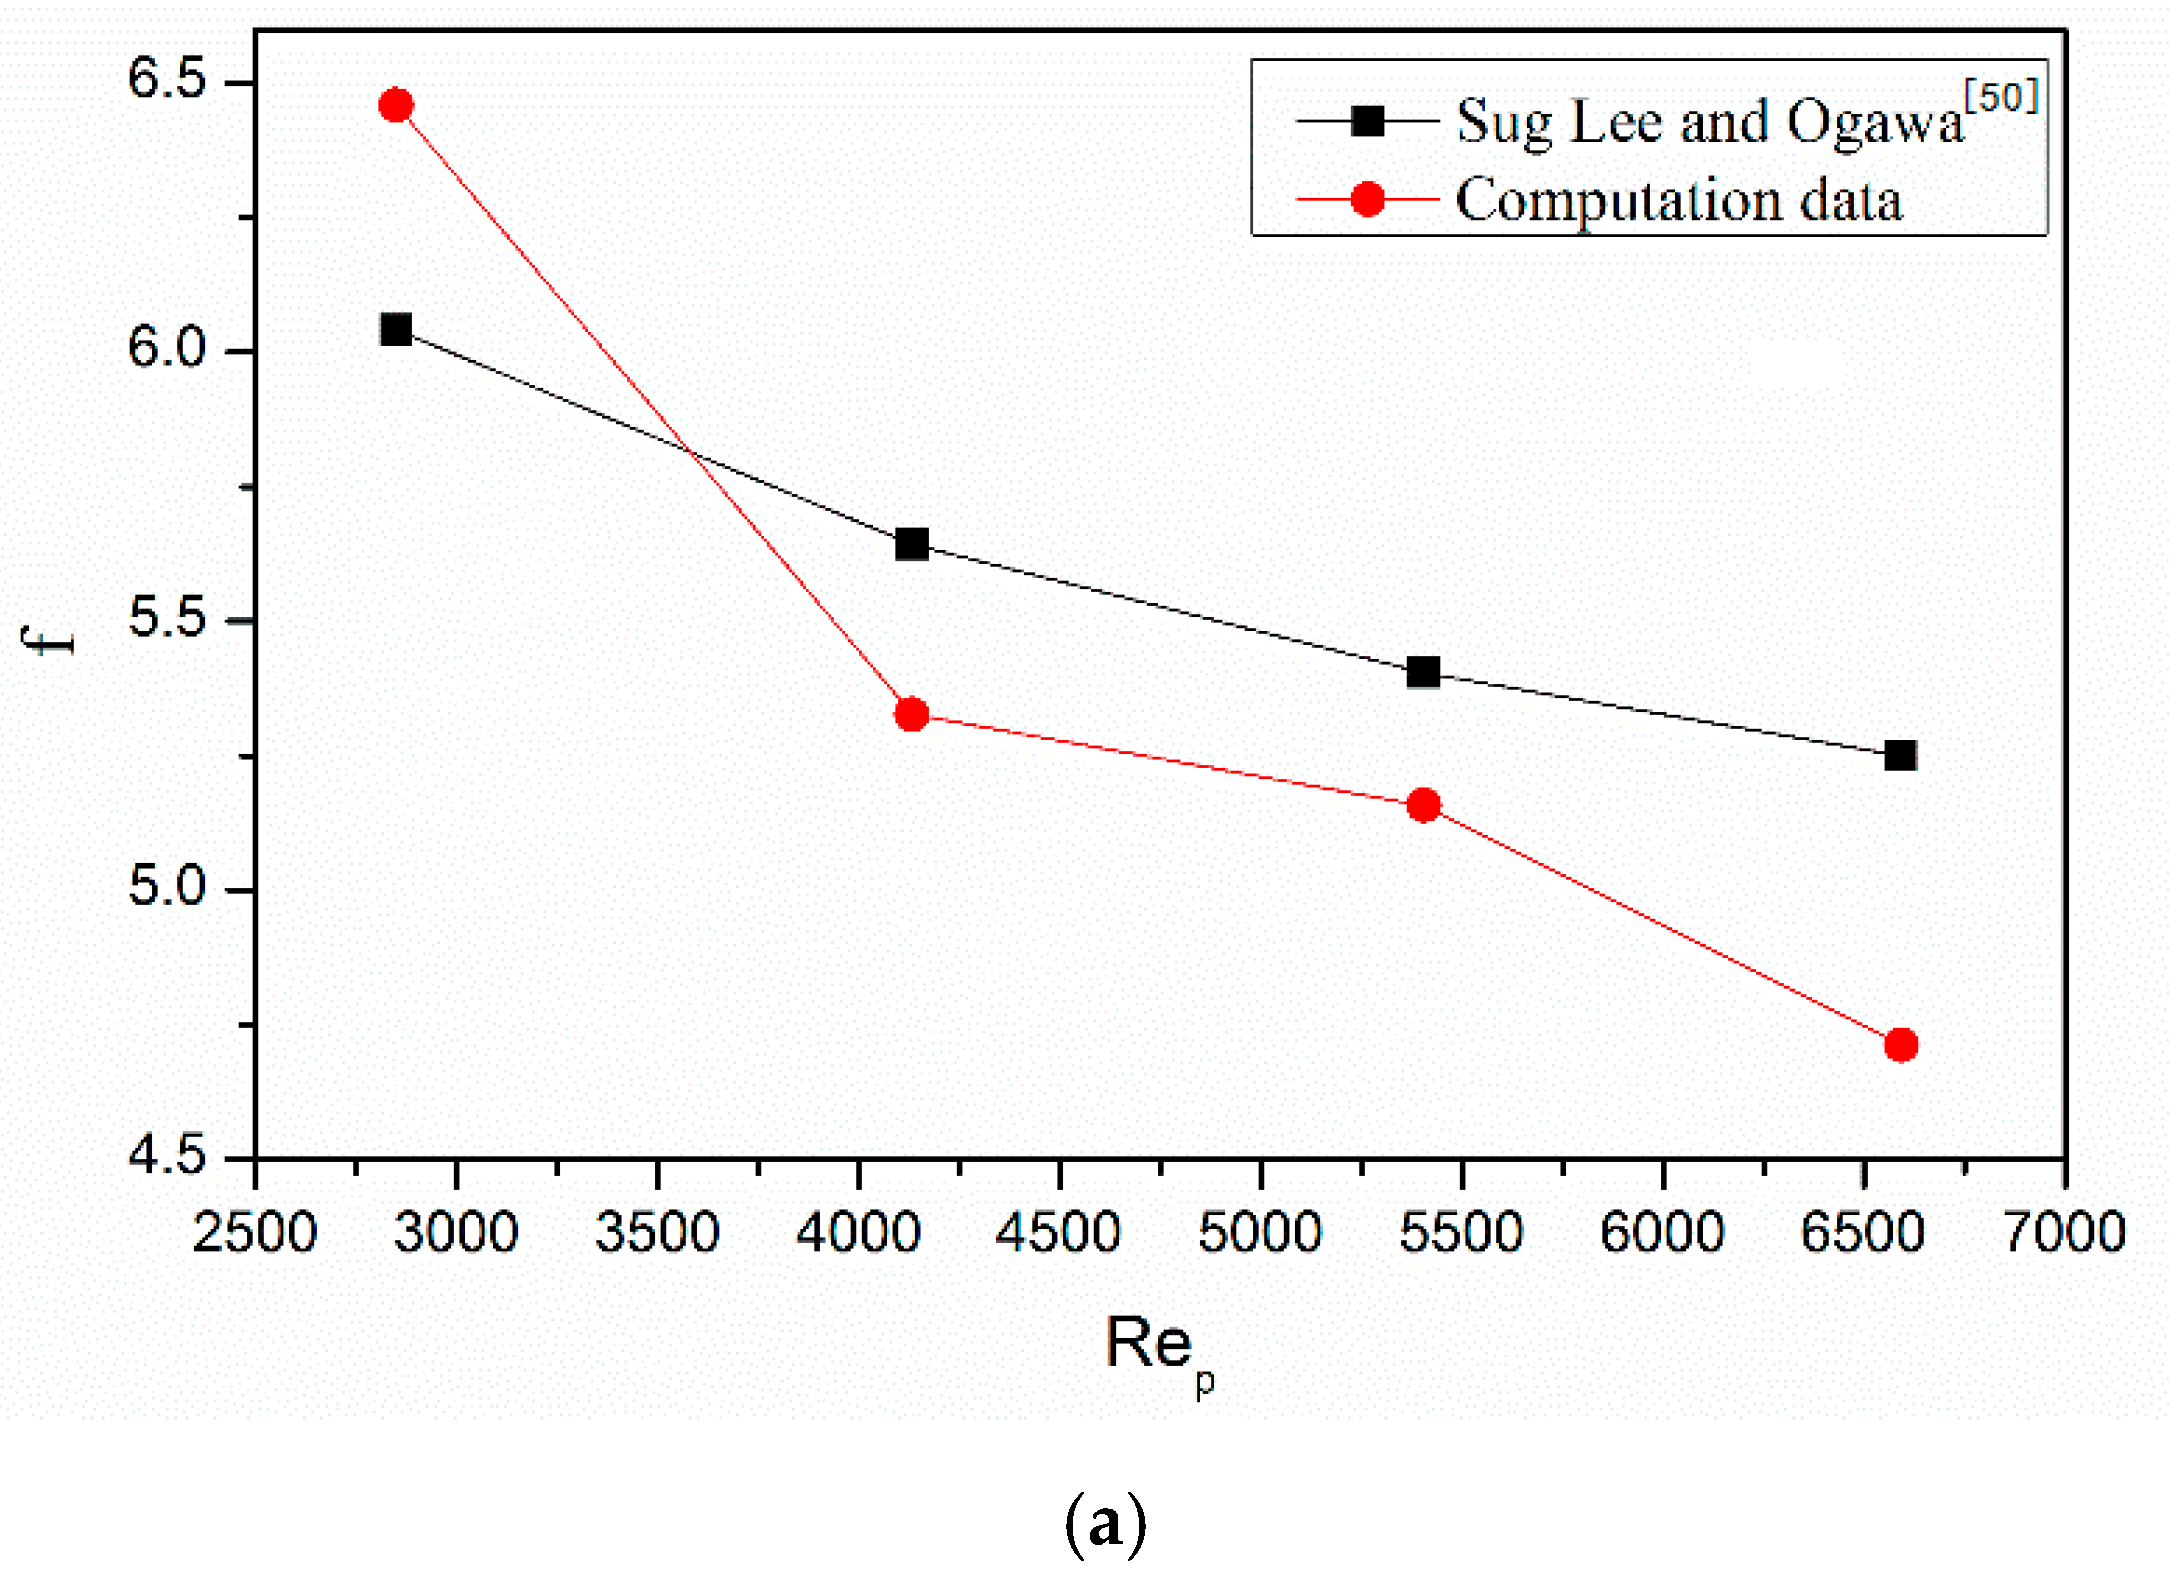
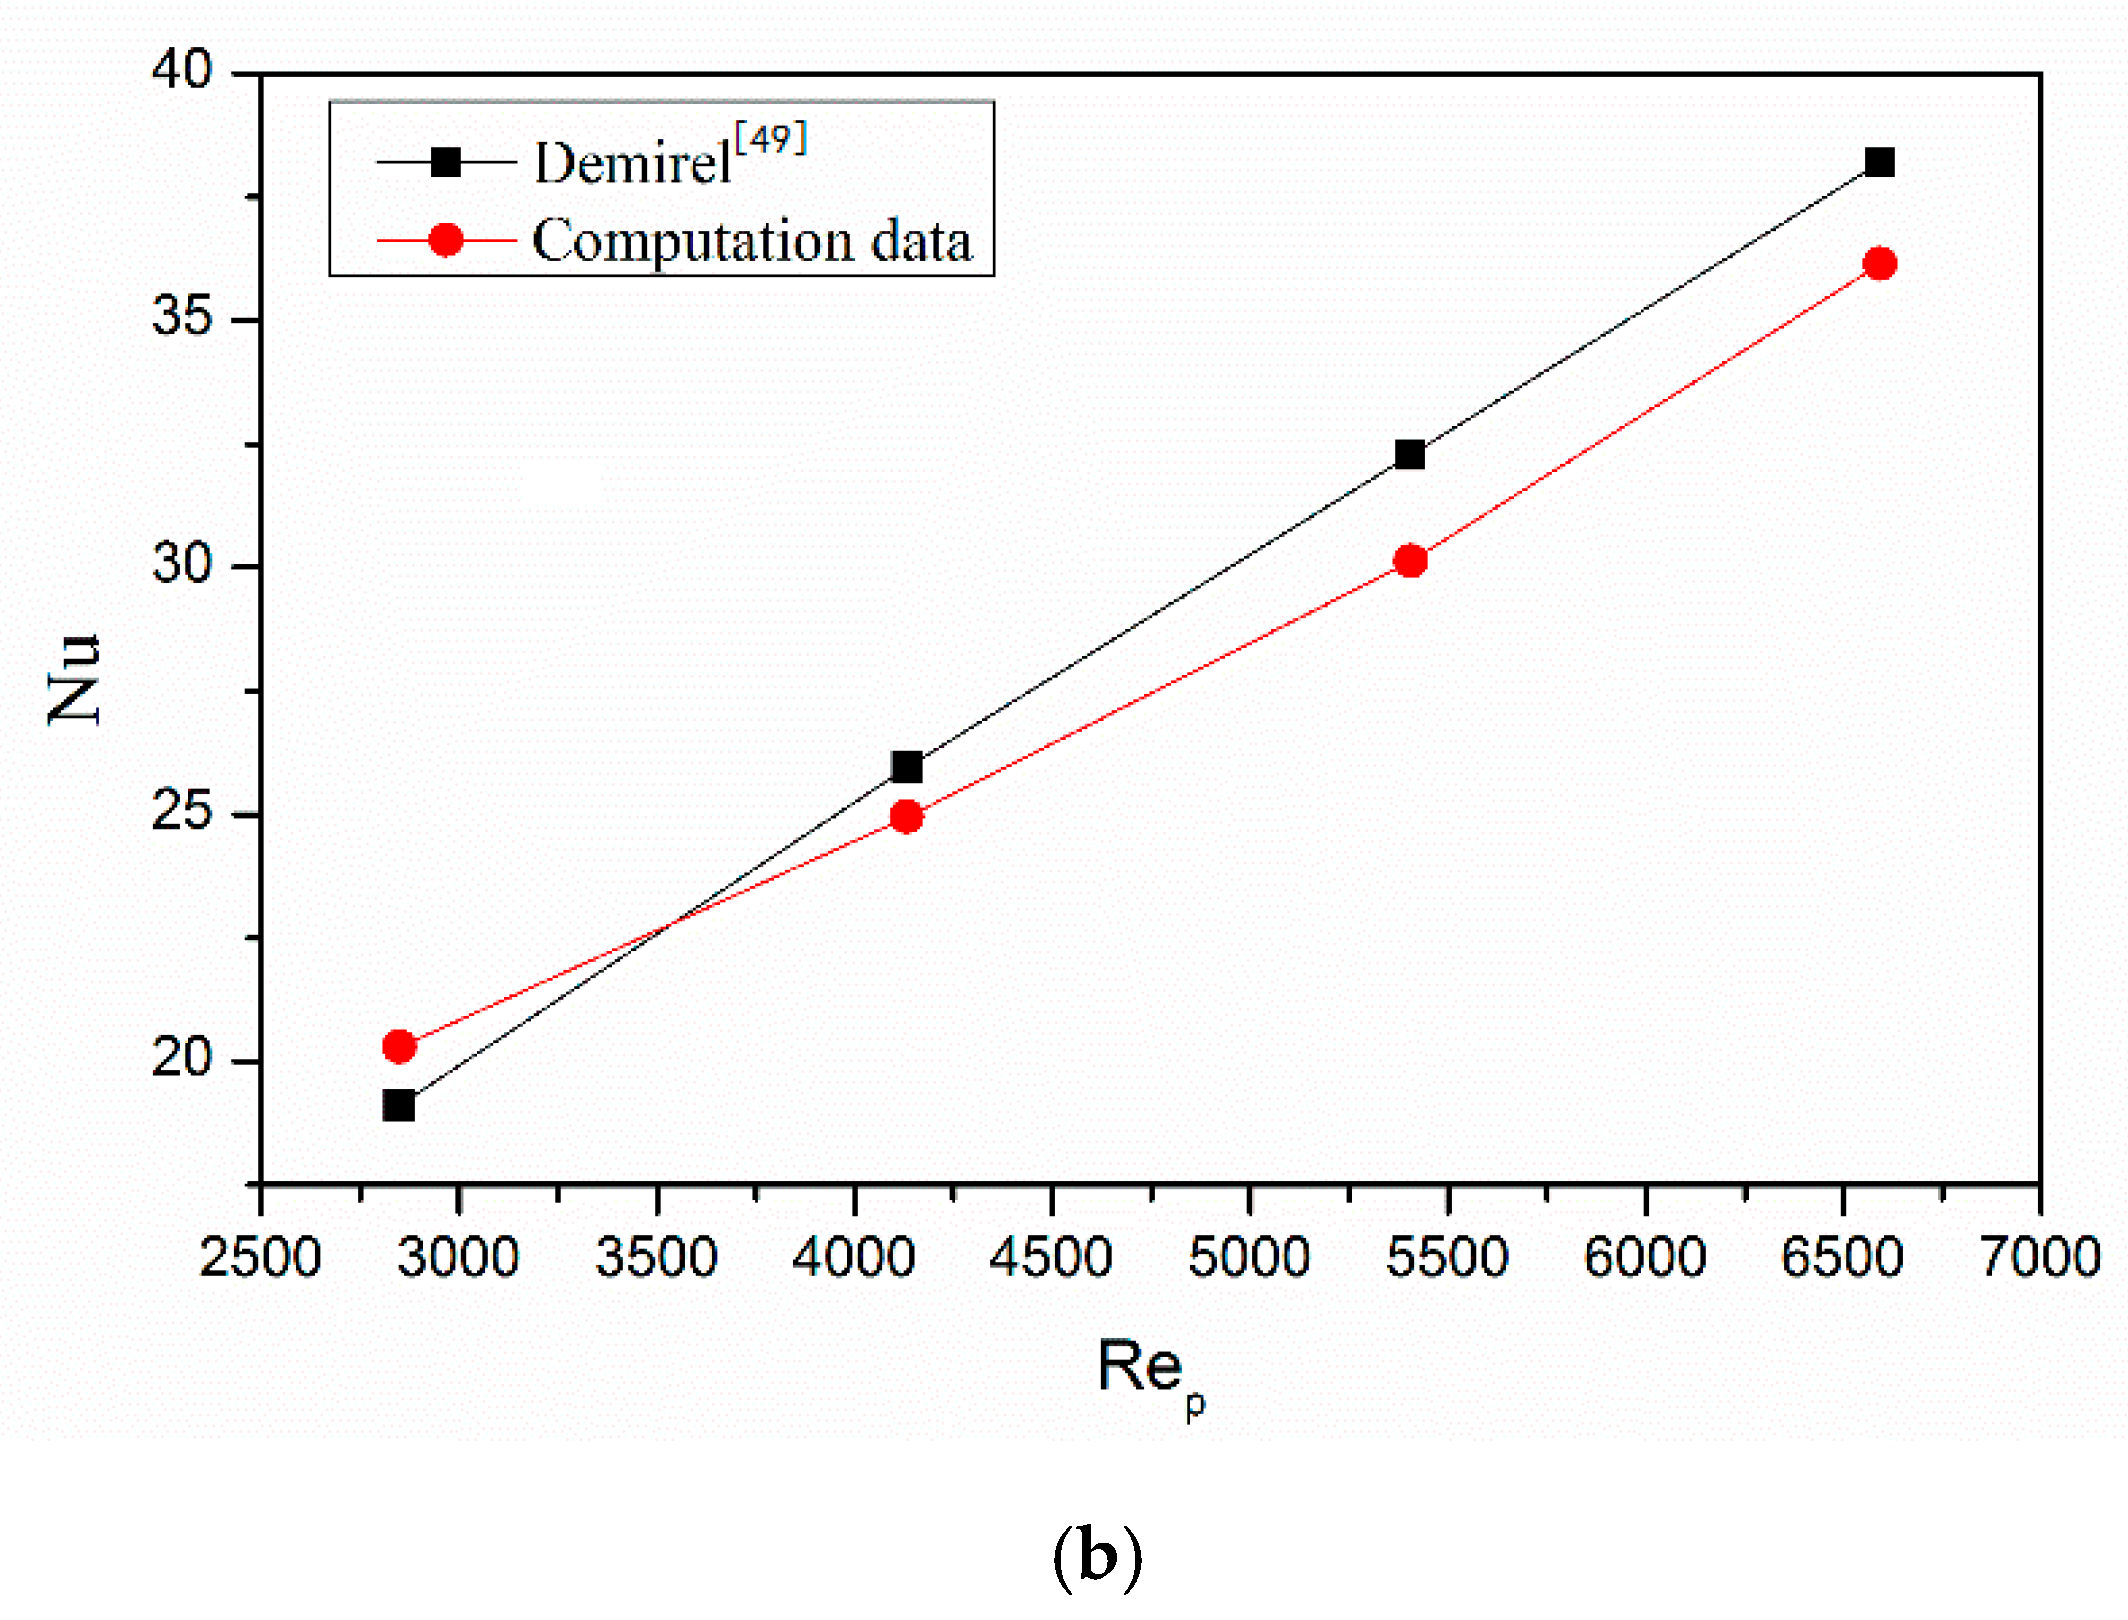
Figure 5.
Typical cross-sections in the packed bed.

Figure 6.
(a) Temperature distribution at Y-sec and (b) velocity distribution at Y-sec.
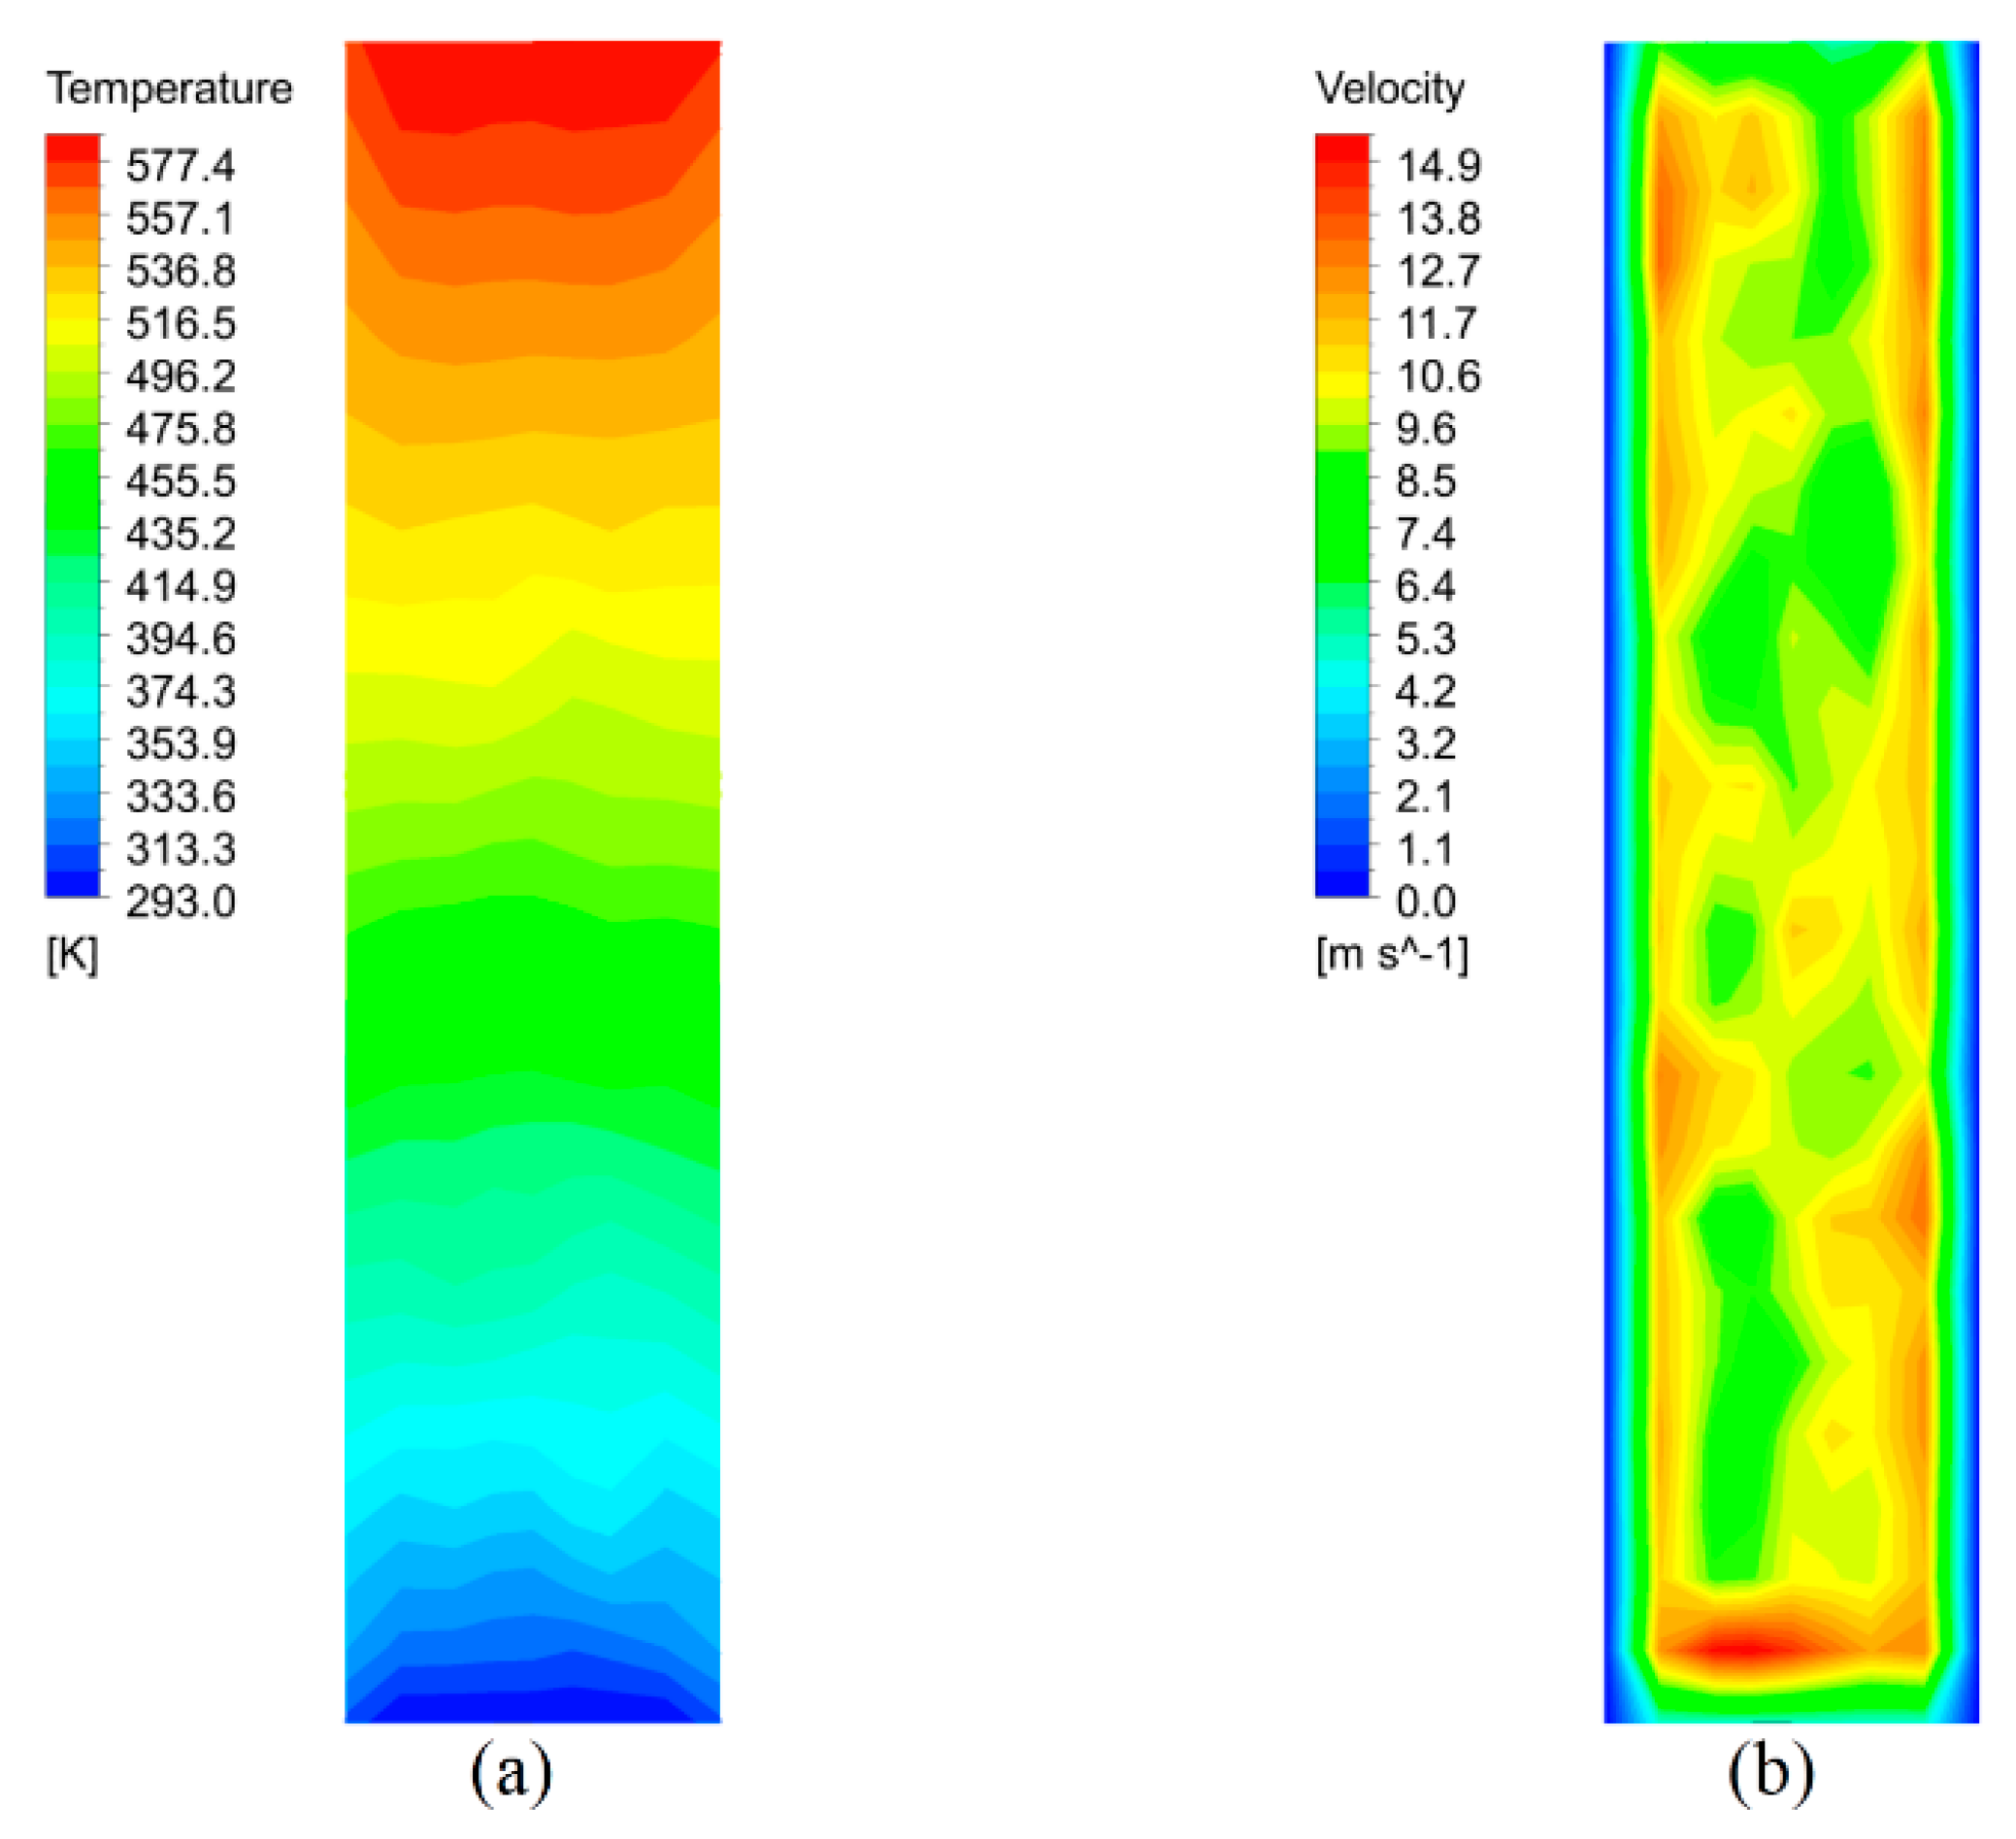
Figure 7.
Radial distribution of temperature of particle size 5 mm.
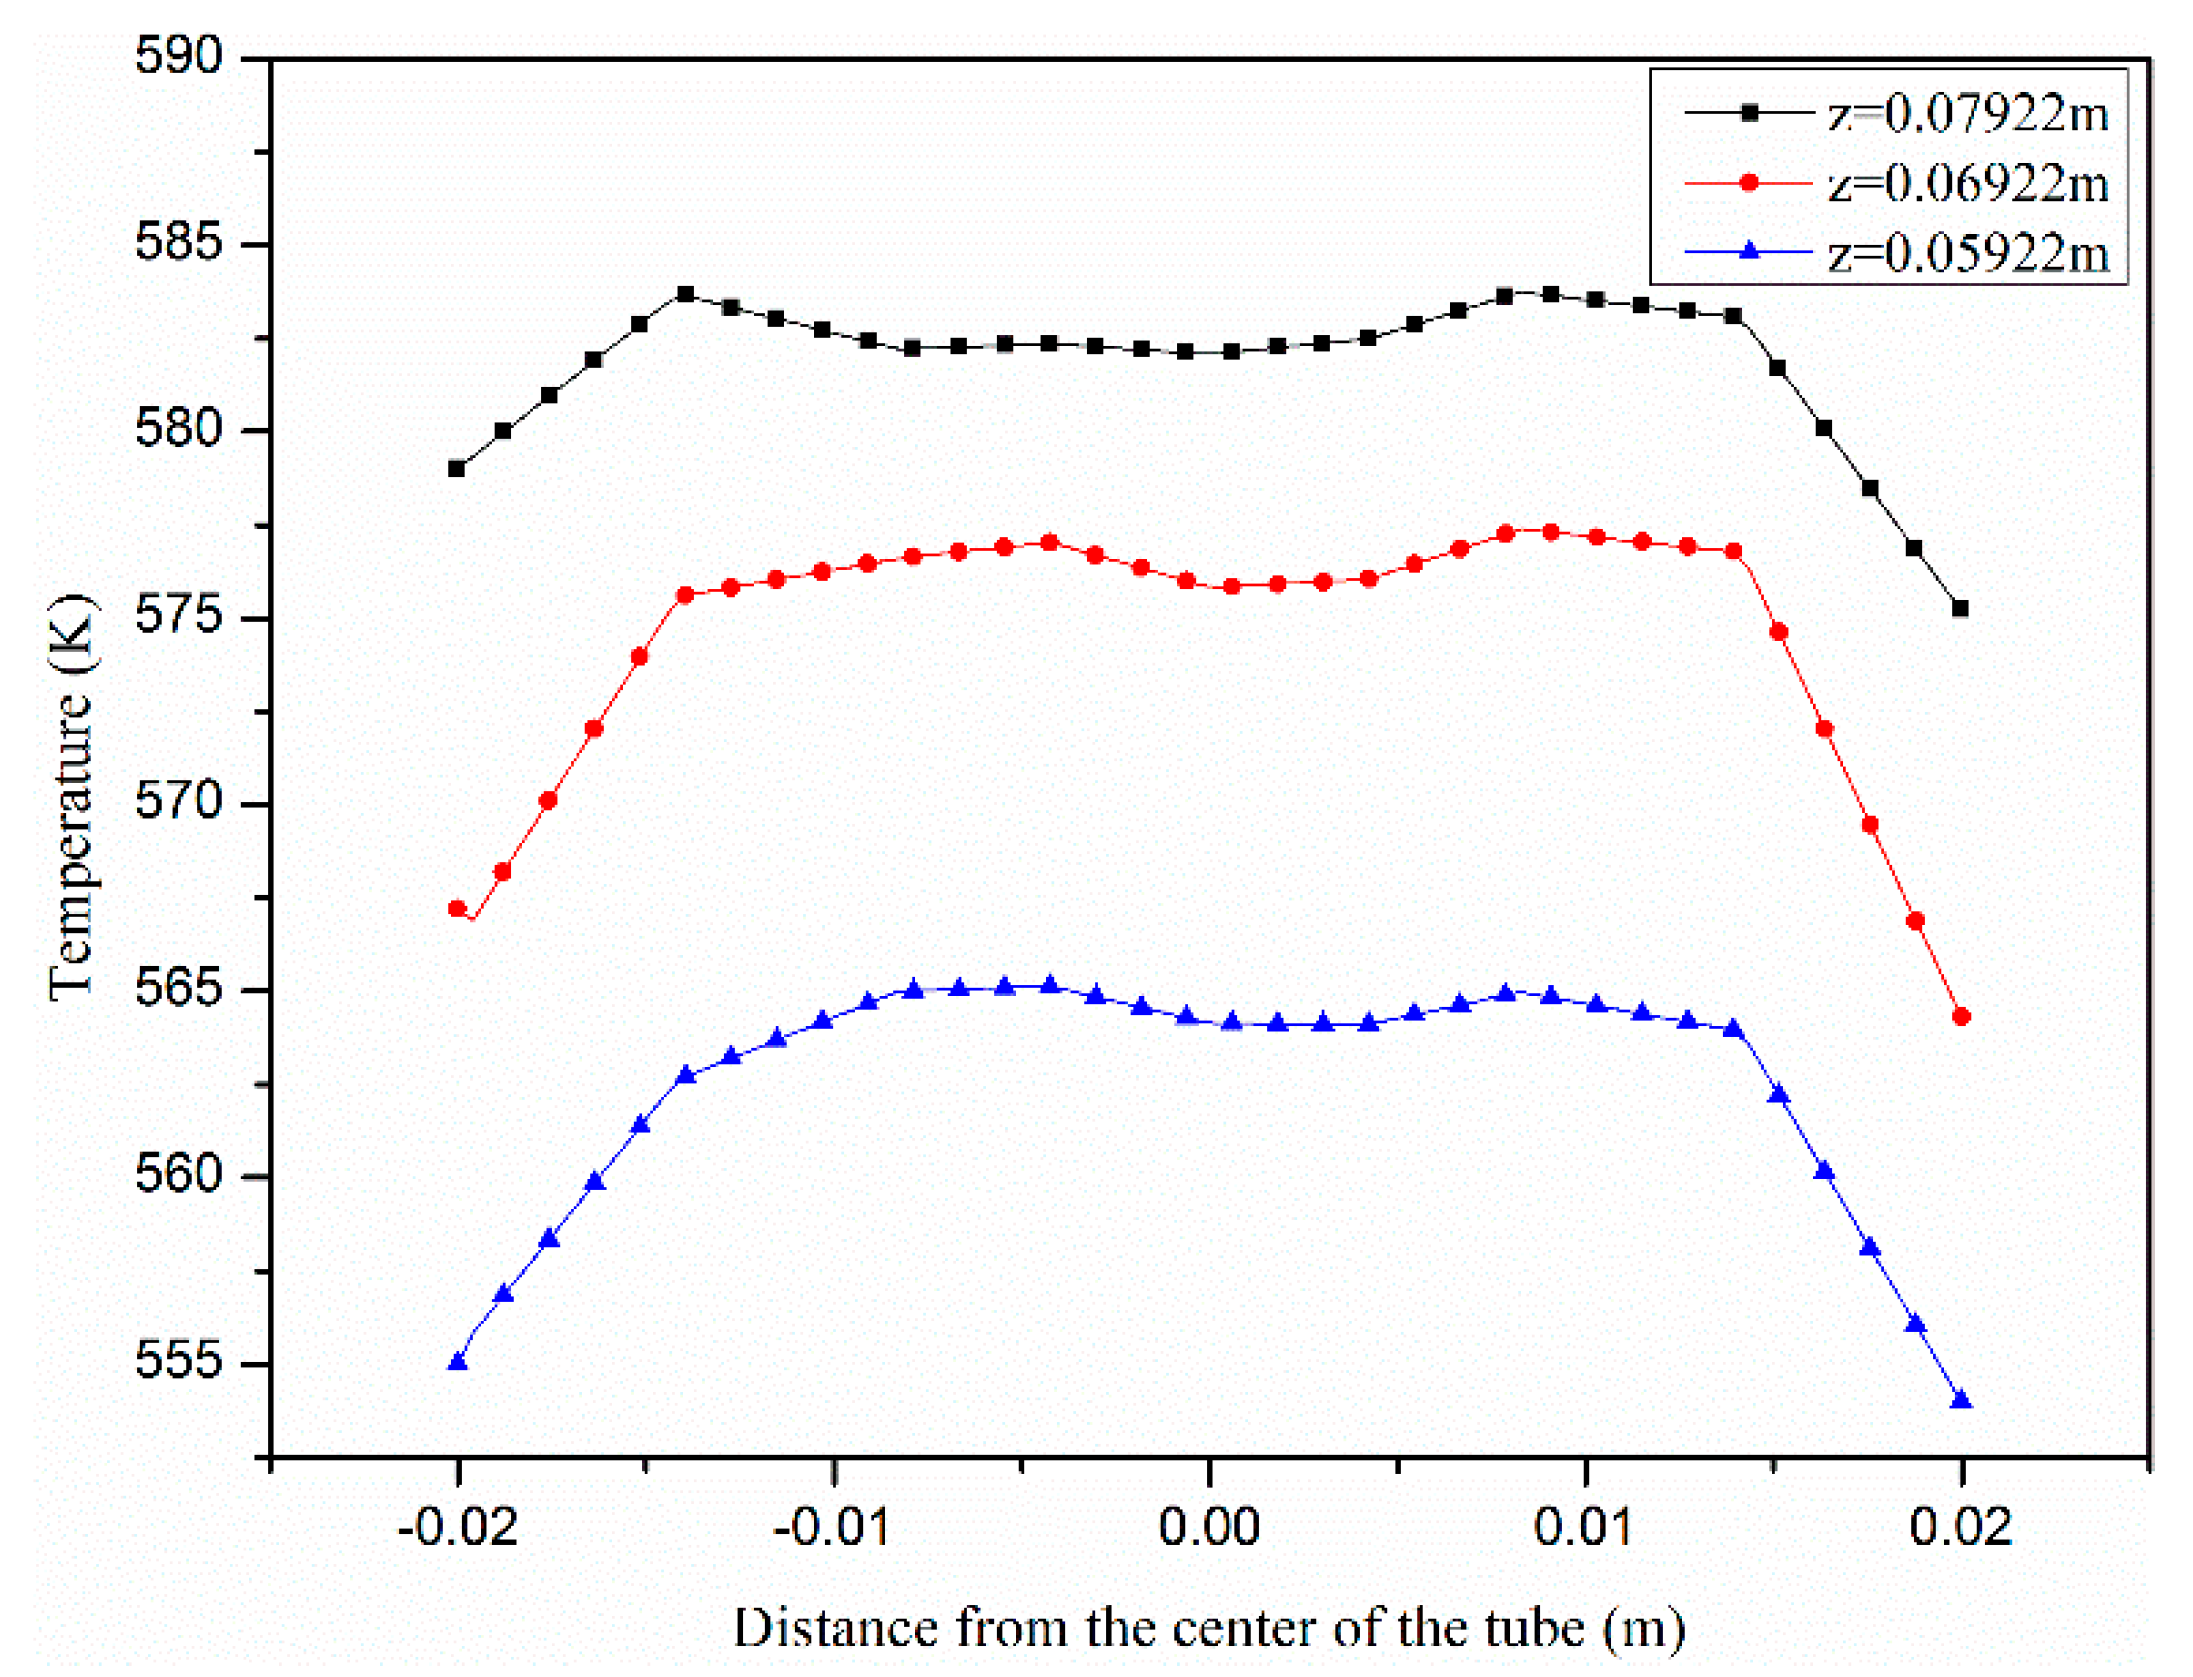
Figure 8.
Performance comparisons of different particle size distributions: (a) Nusselt number; (b) friction factor; and (c) the overall performance.
Figure 8.
Performance comparisons of different particle size distributions: (a) Nusselt number; (b) friction factor; and (c) the overall performance.
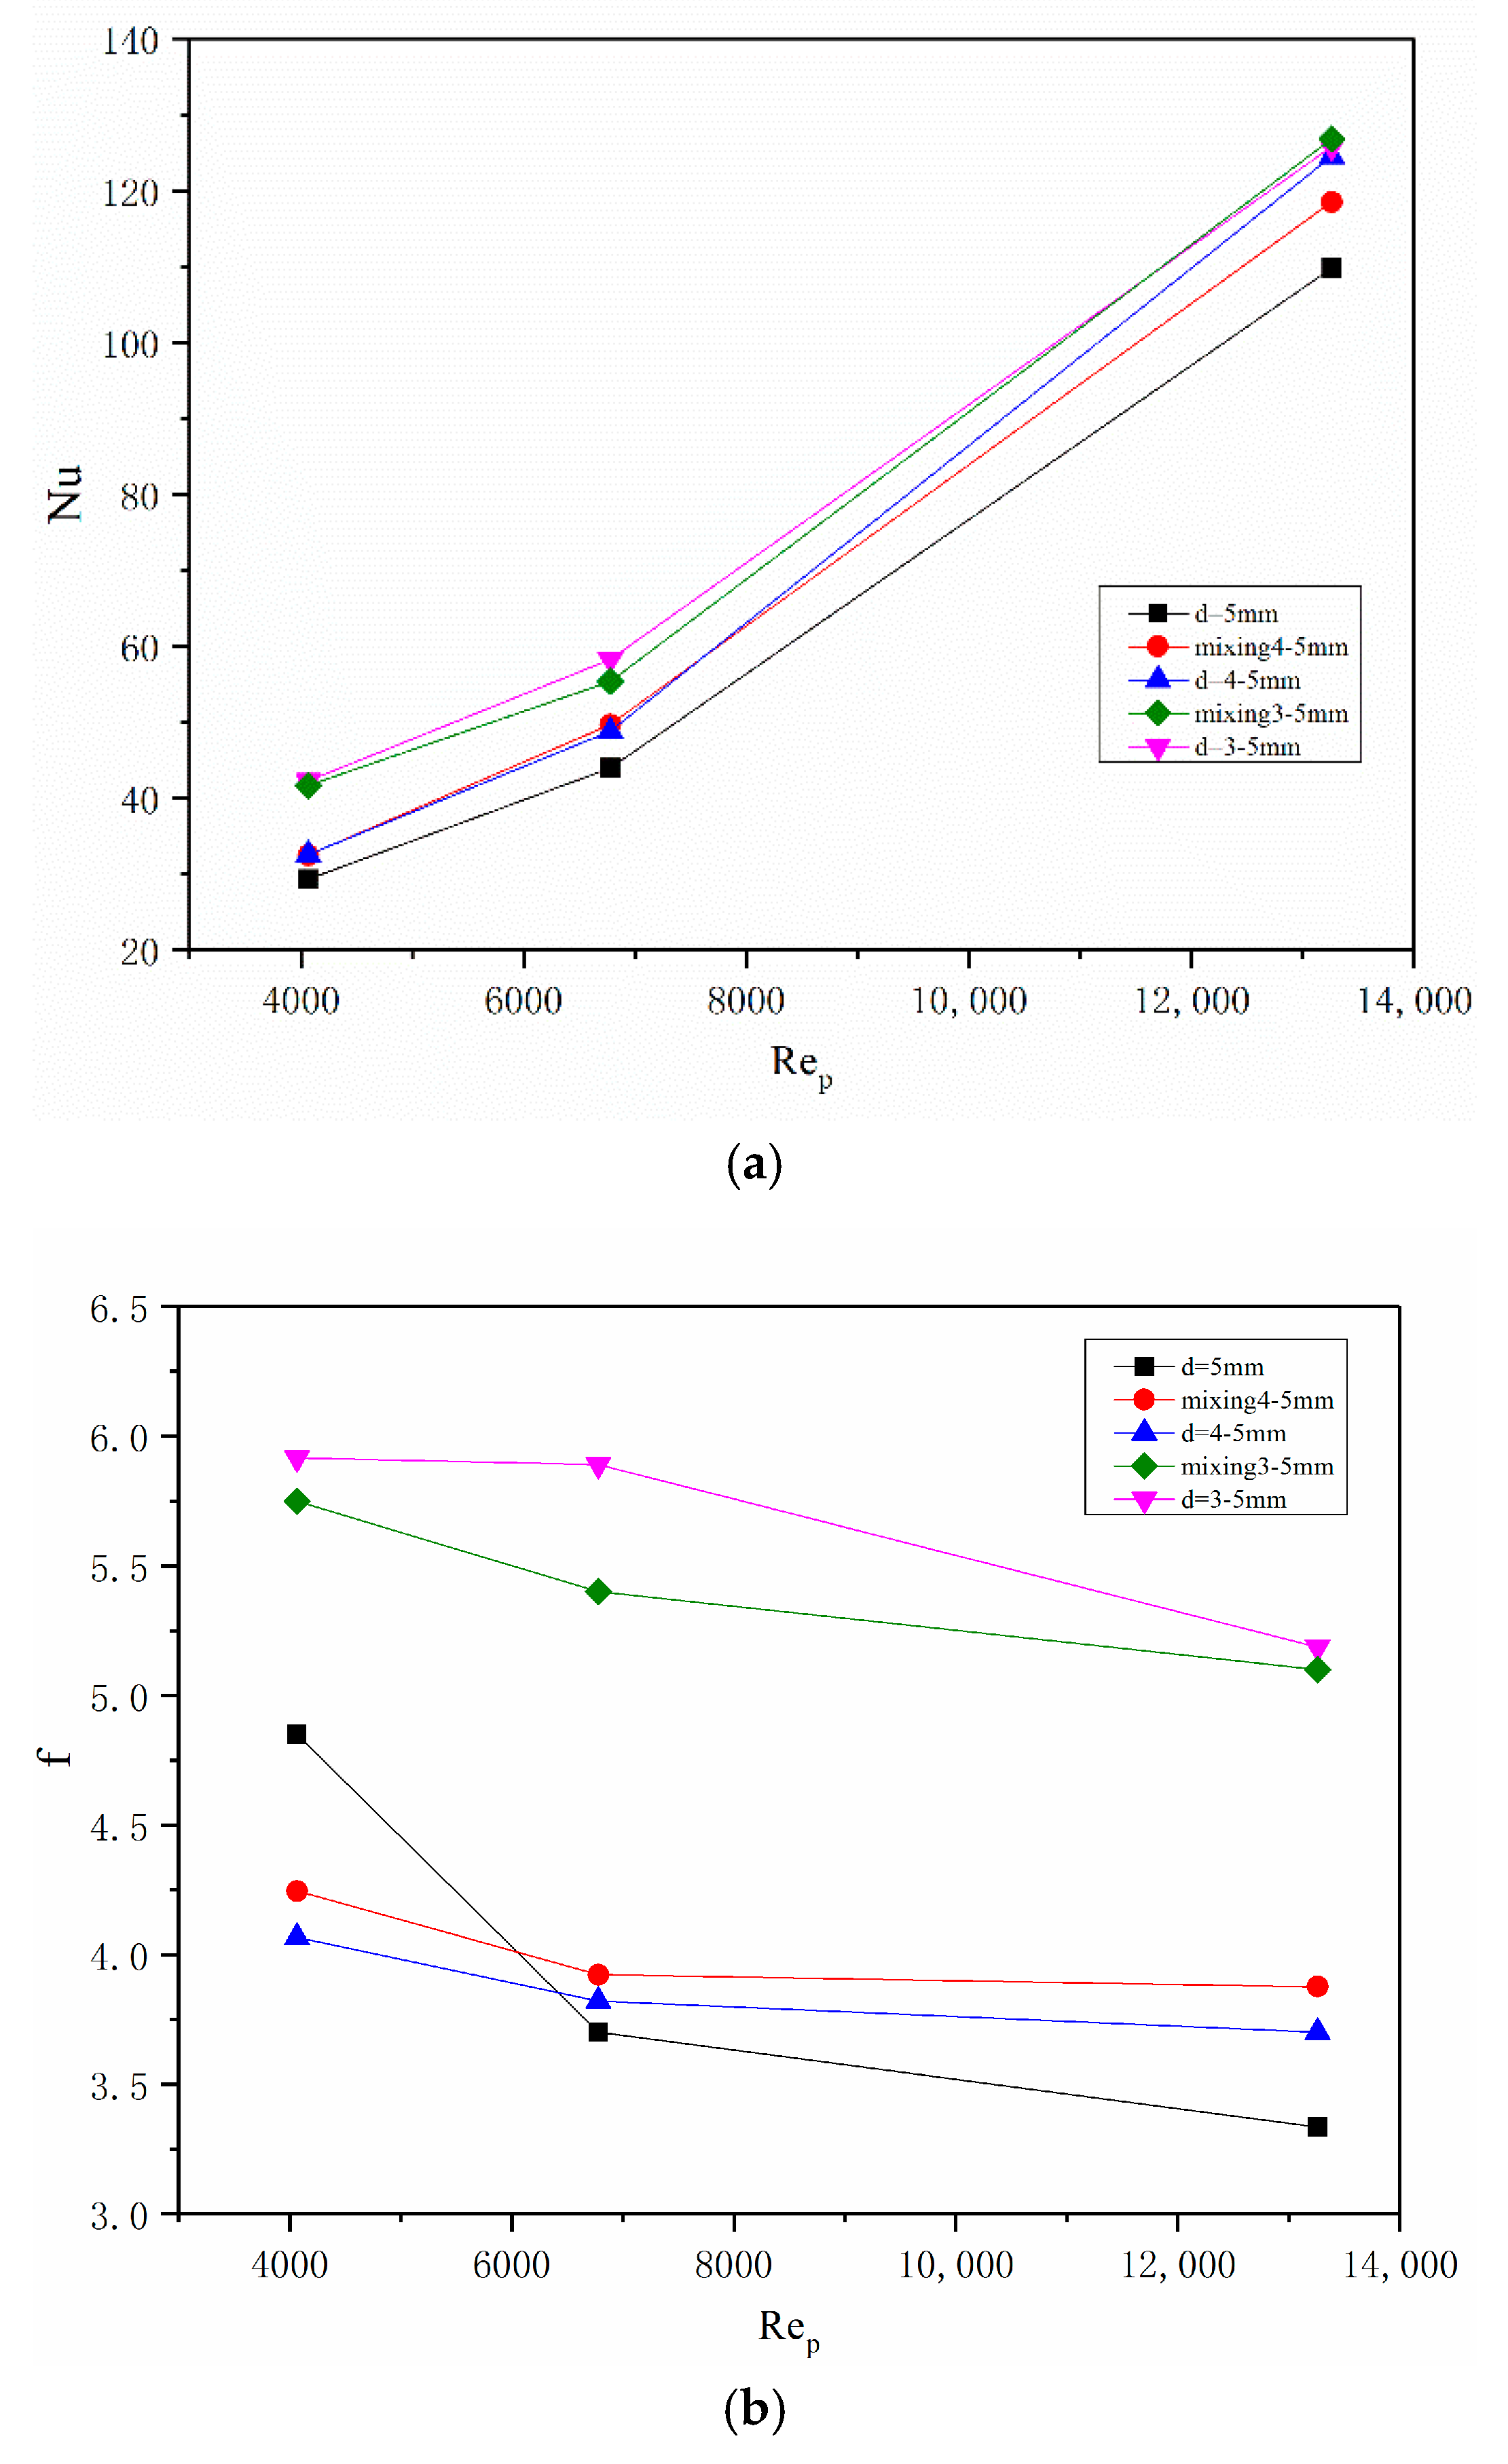
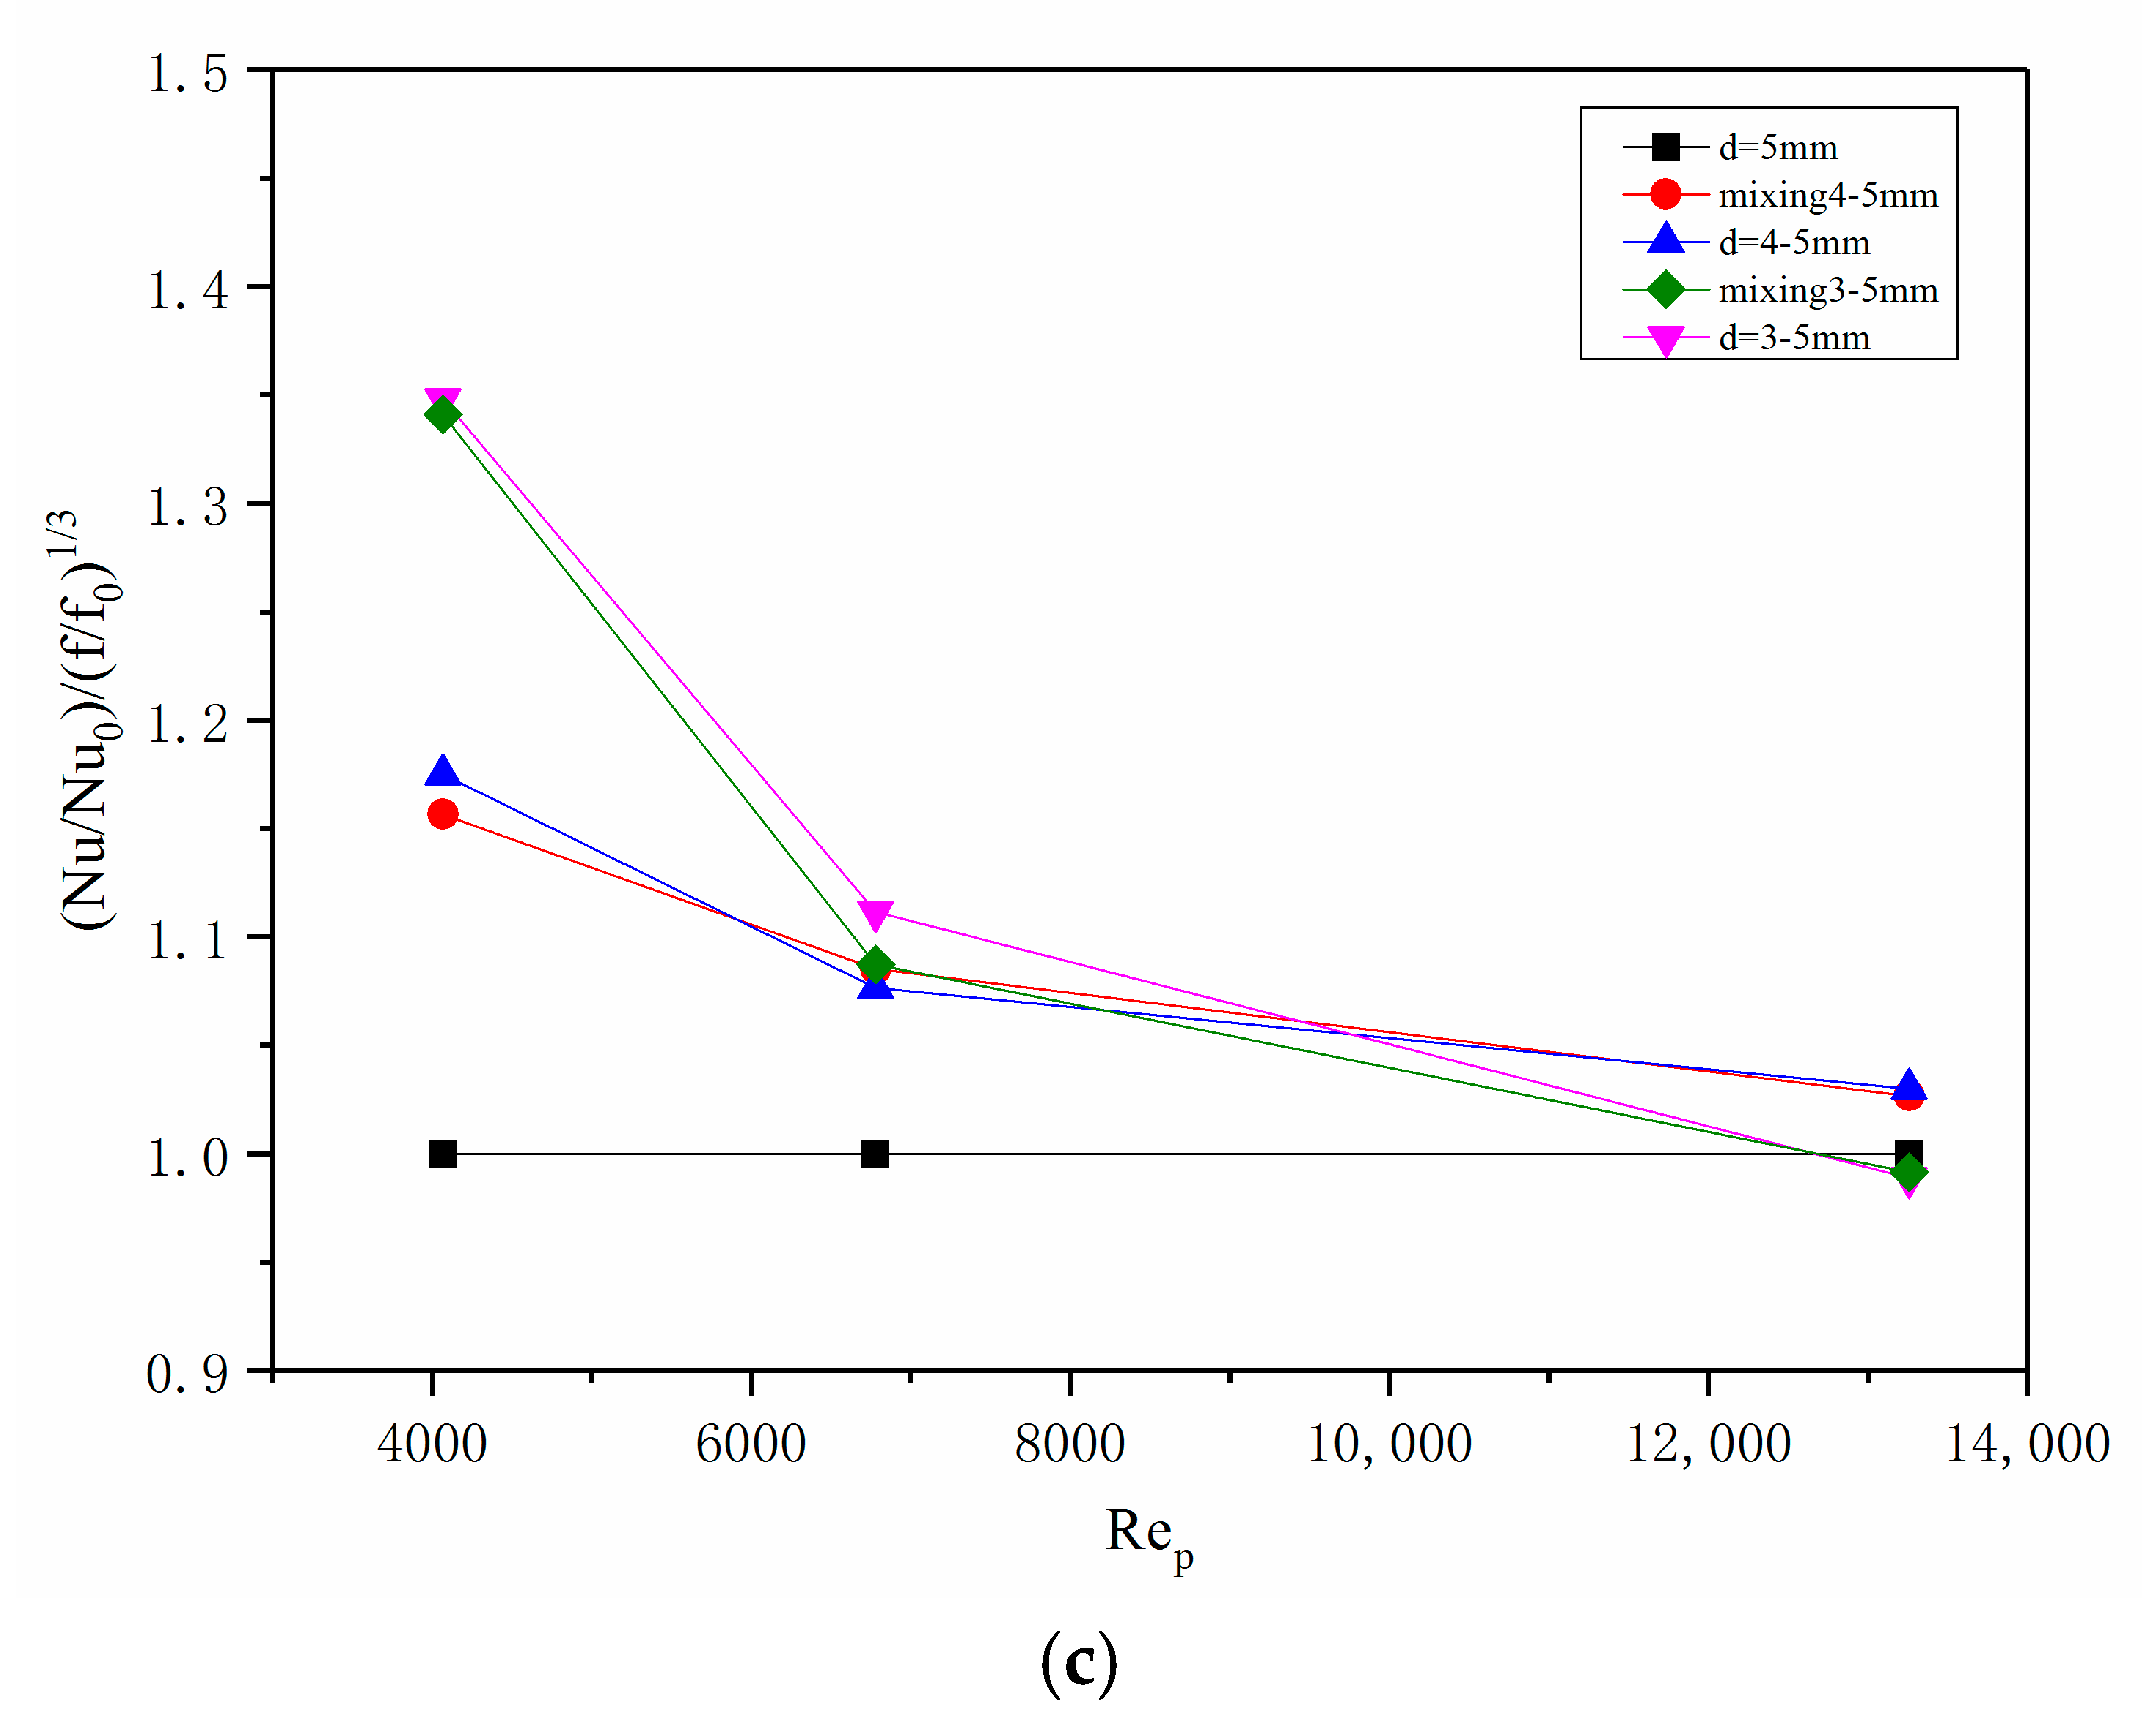
Figure 9.
Local temperature distributions of different particle size distributions (Y-Sec).
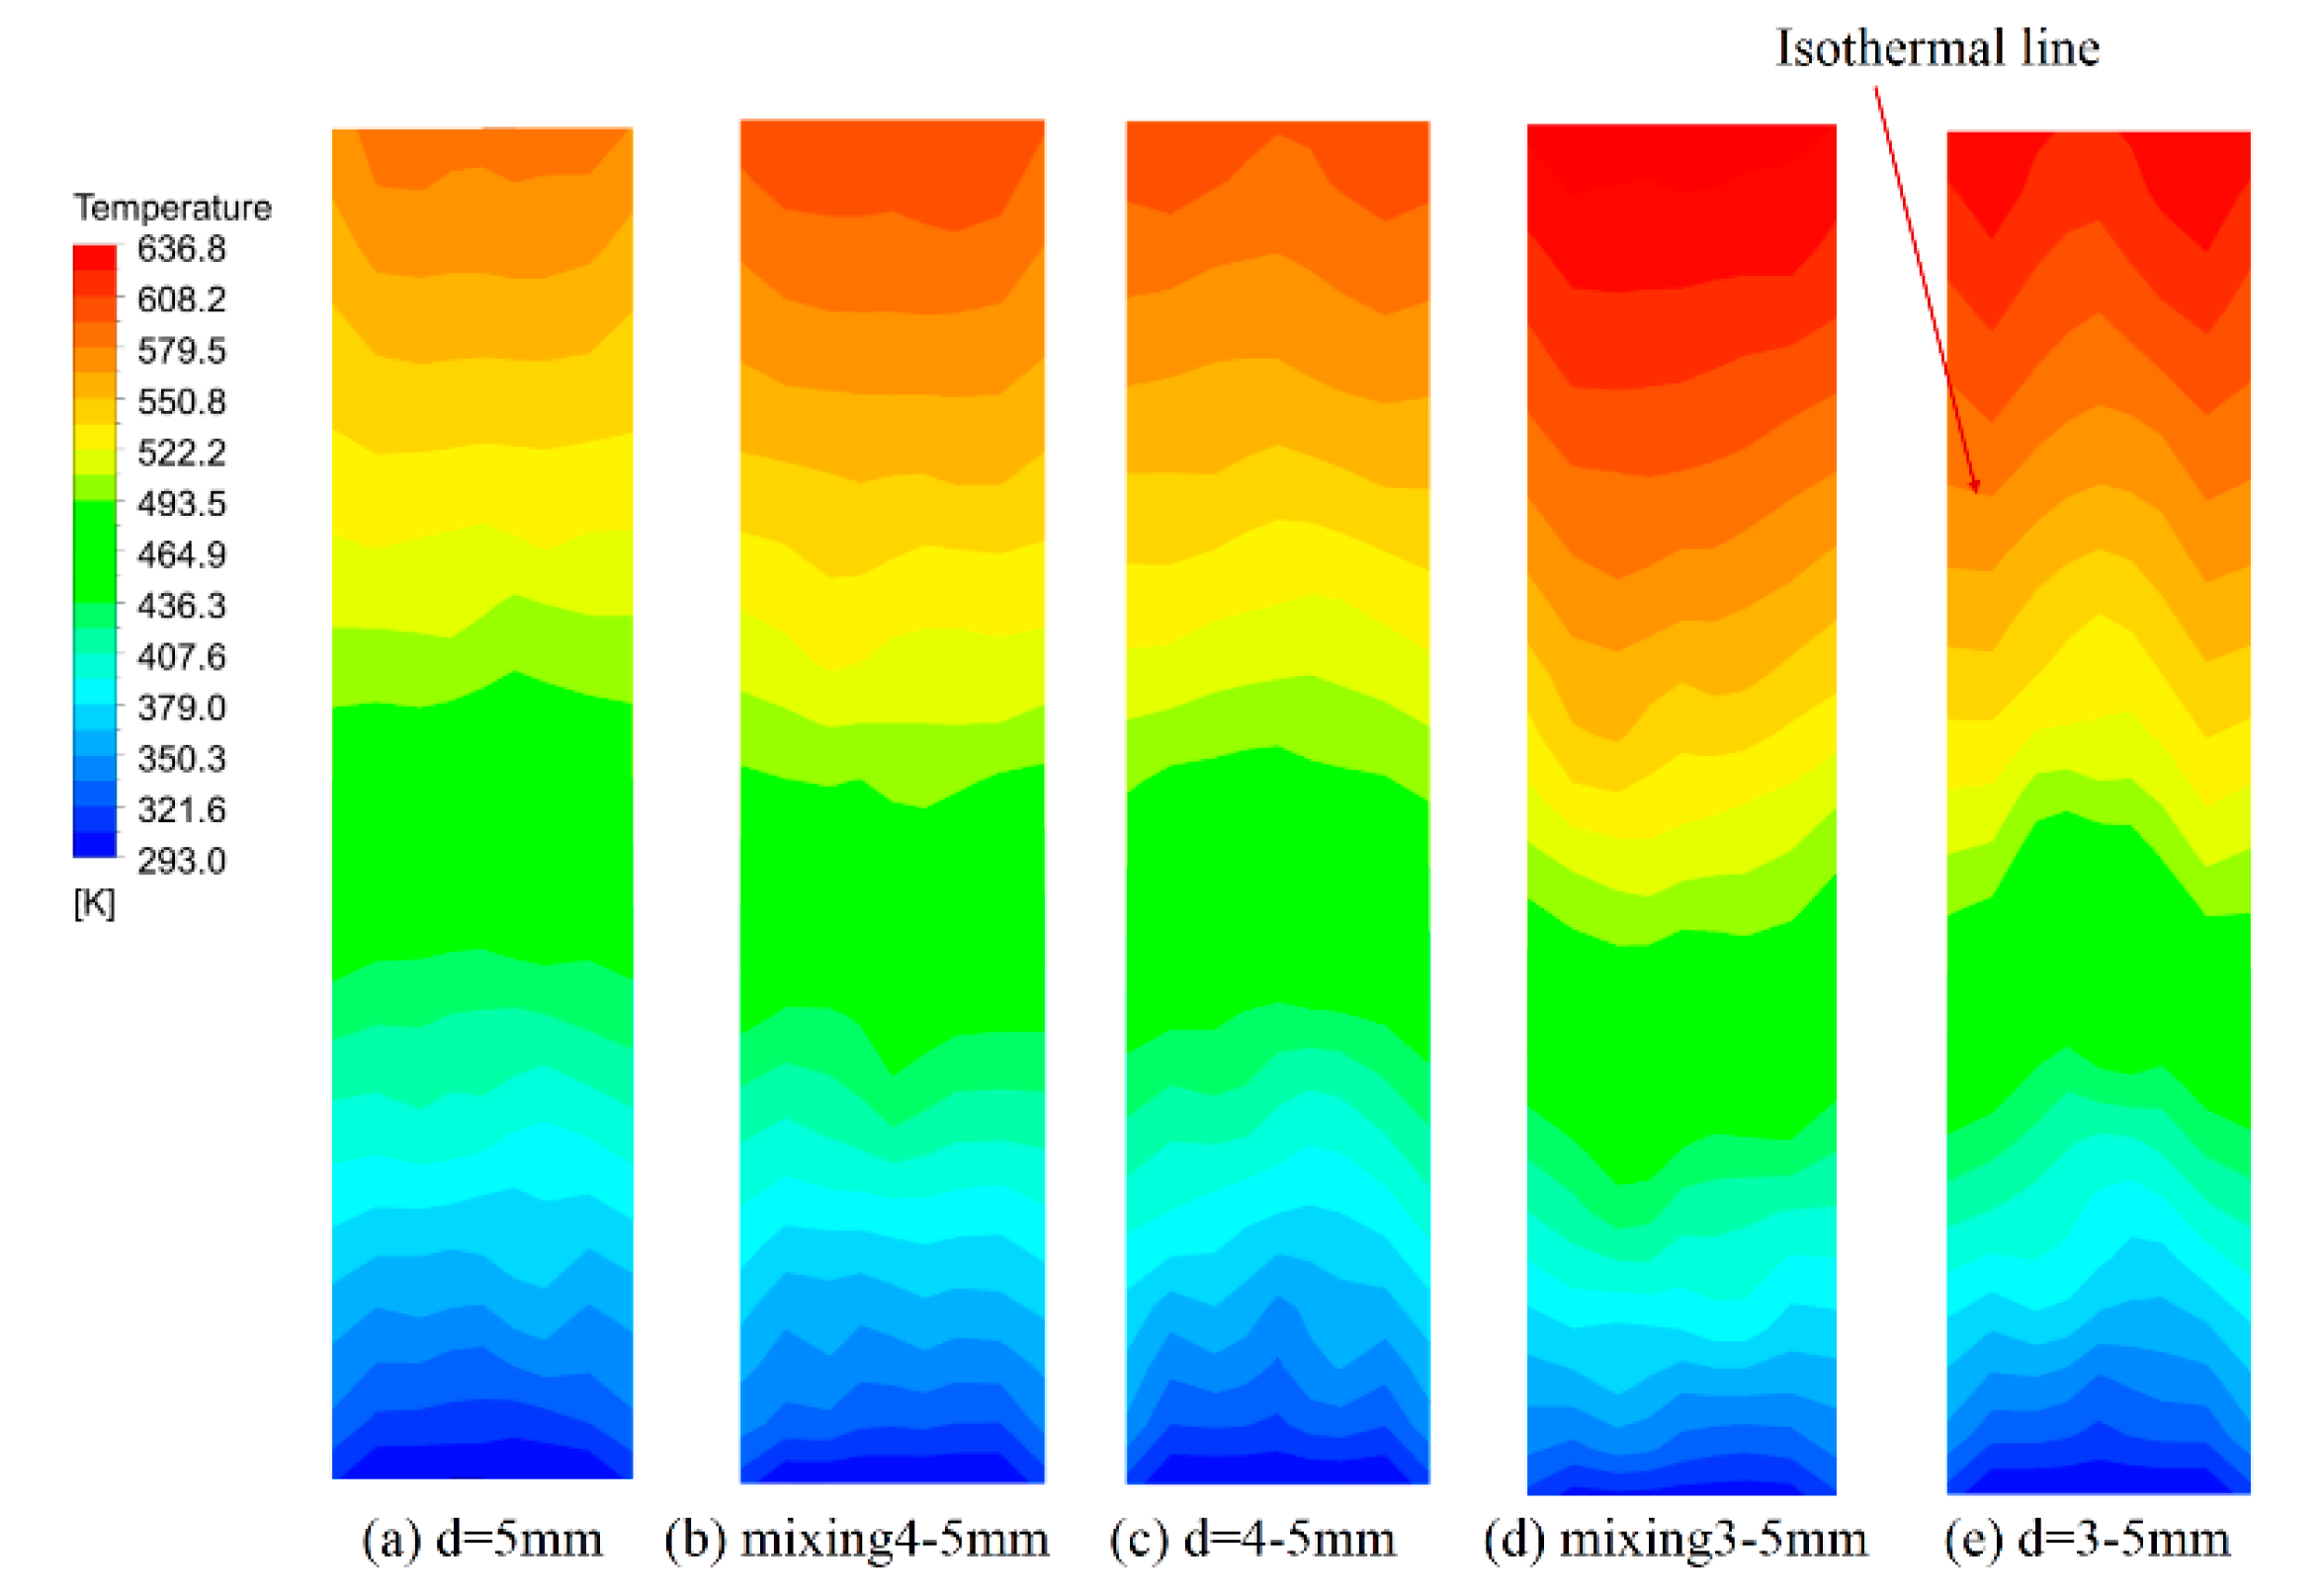
Figure 10.
Local velocity distributions of different particle size distributions (Y-Sec).

Figure 11.
Radial temperature distribution of different particle size distributions (section Z = 0.07922 m).
Figure 11.
Radial temperature distribution of different particle size distributions (section Z = 0.07922 m).
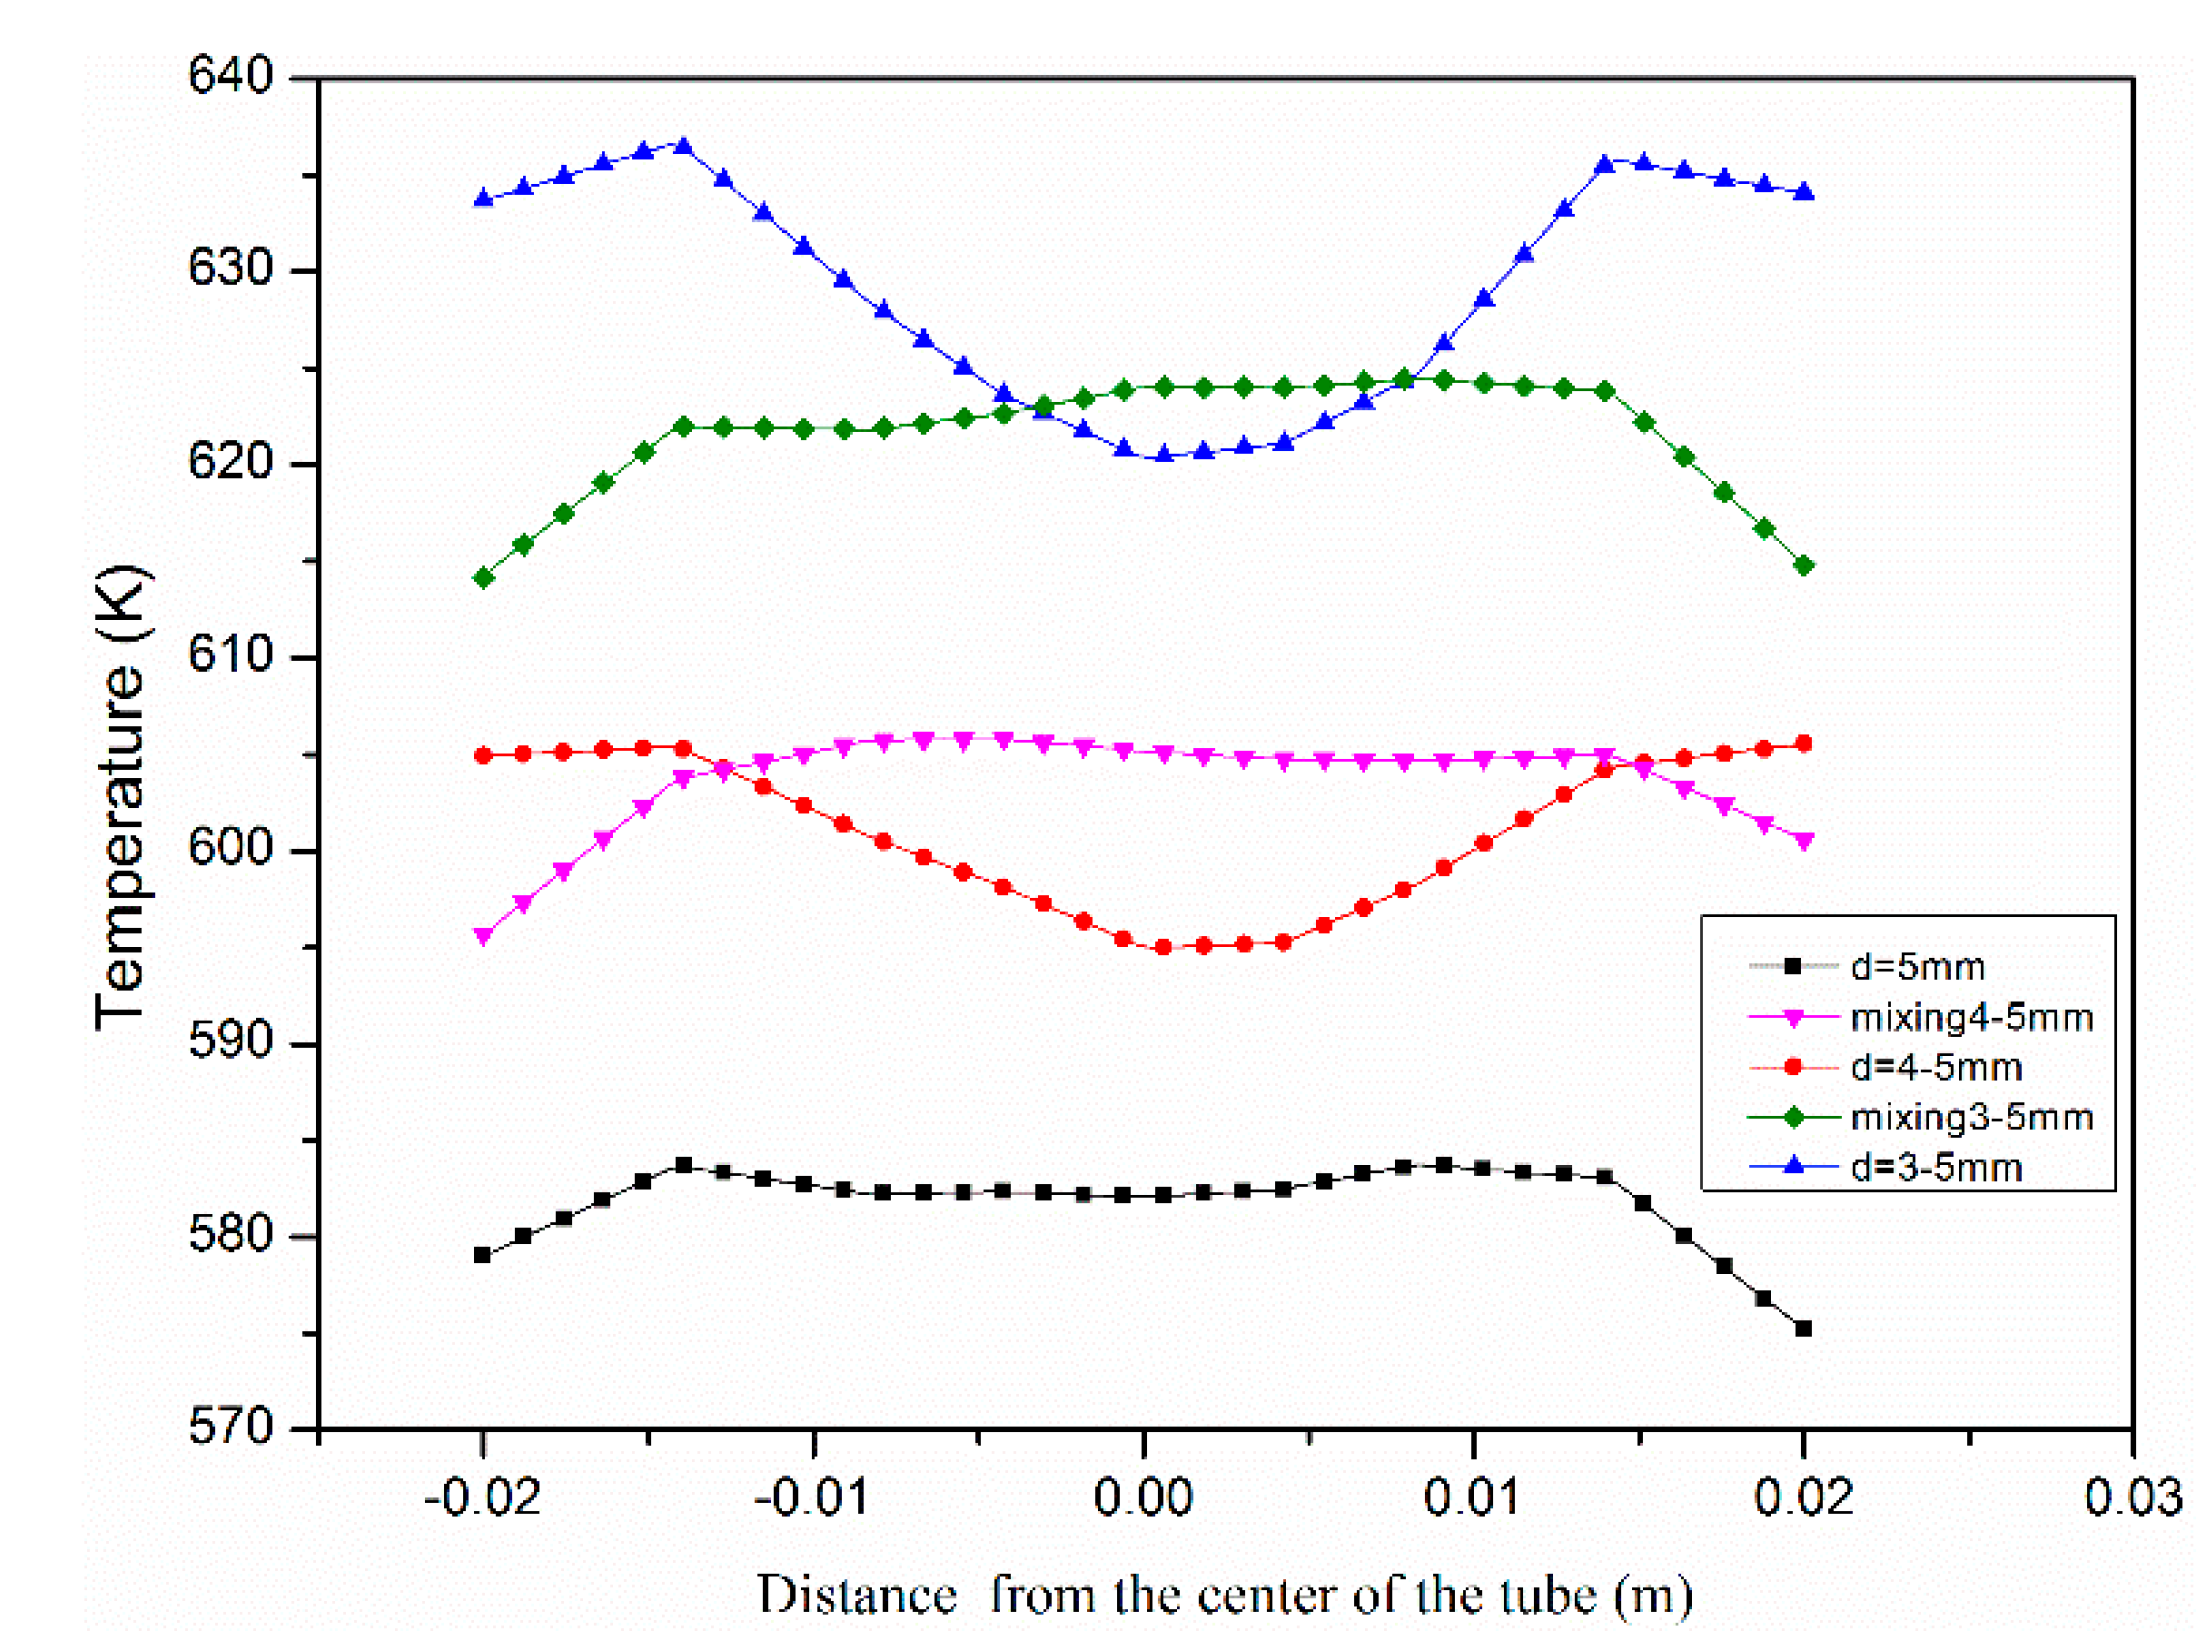
Figure 12.
(a) T–Q graph of different particle size distributions. (b) Equivalent thermal resistance.
Figure 12.
(a) T–Q graph of different particle size distributions. (b) Equivalent thermal resistance.
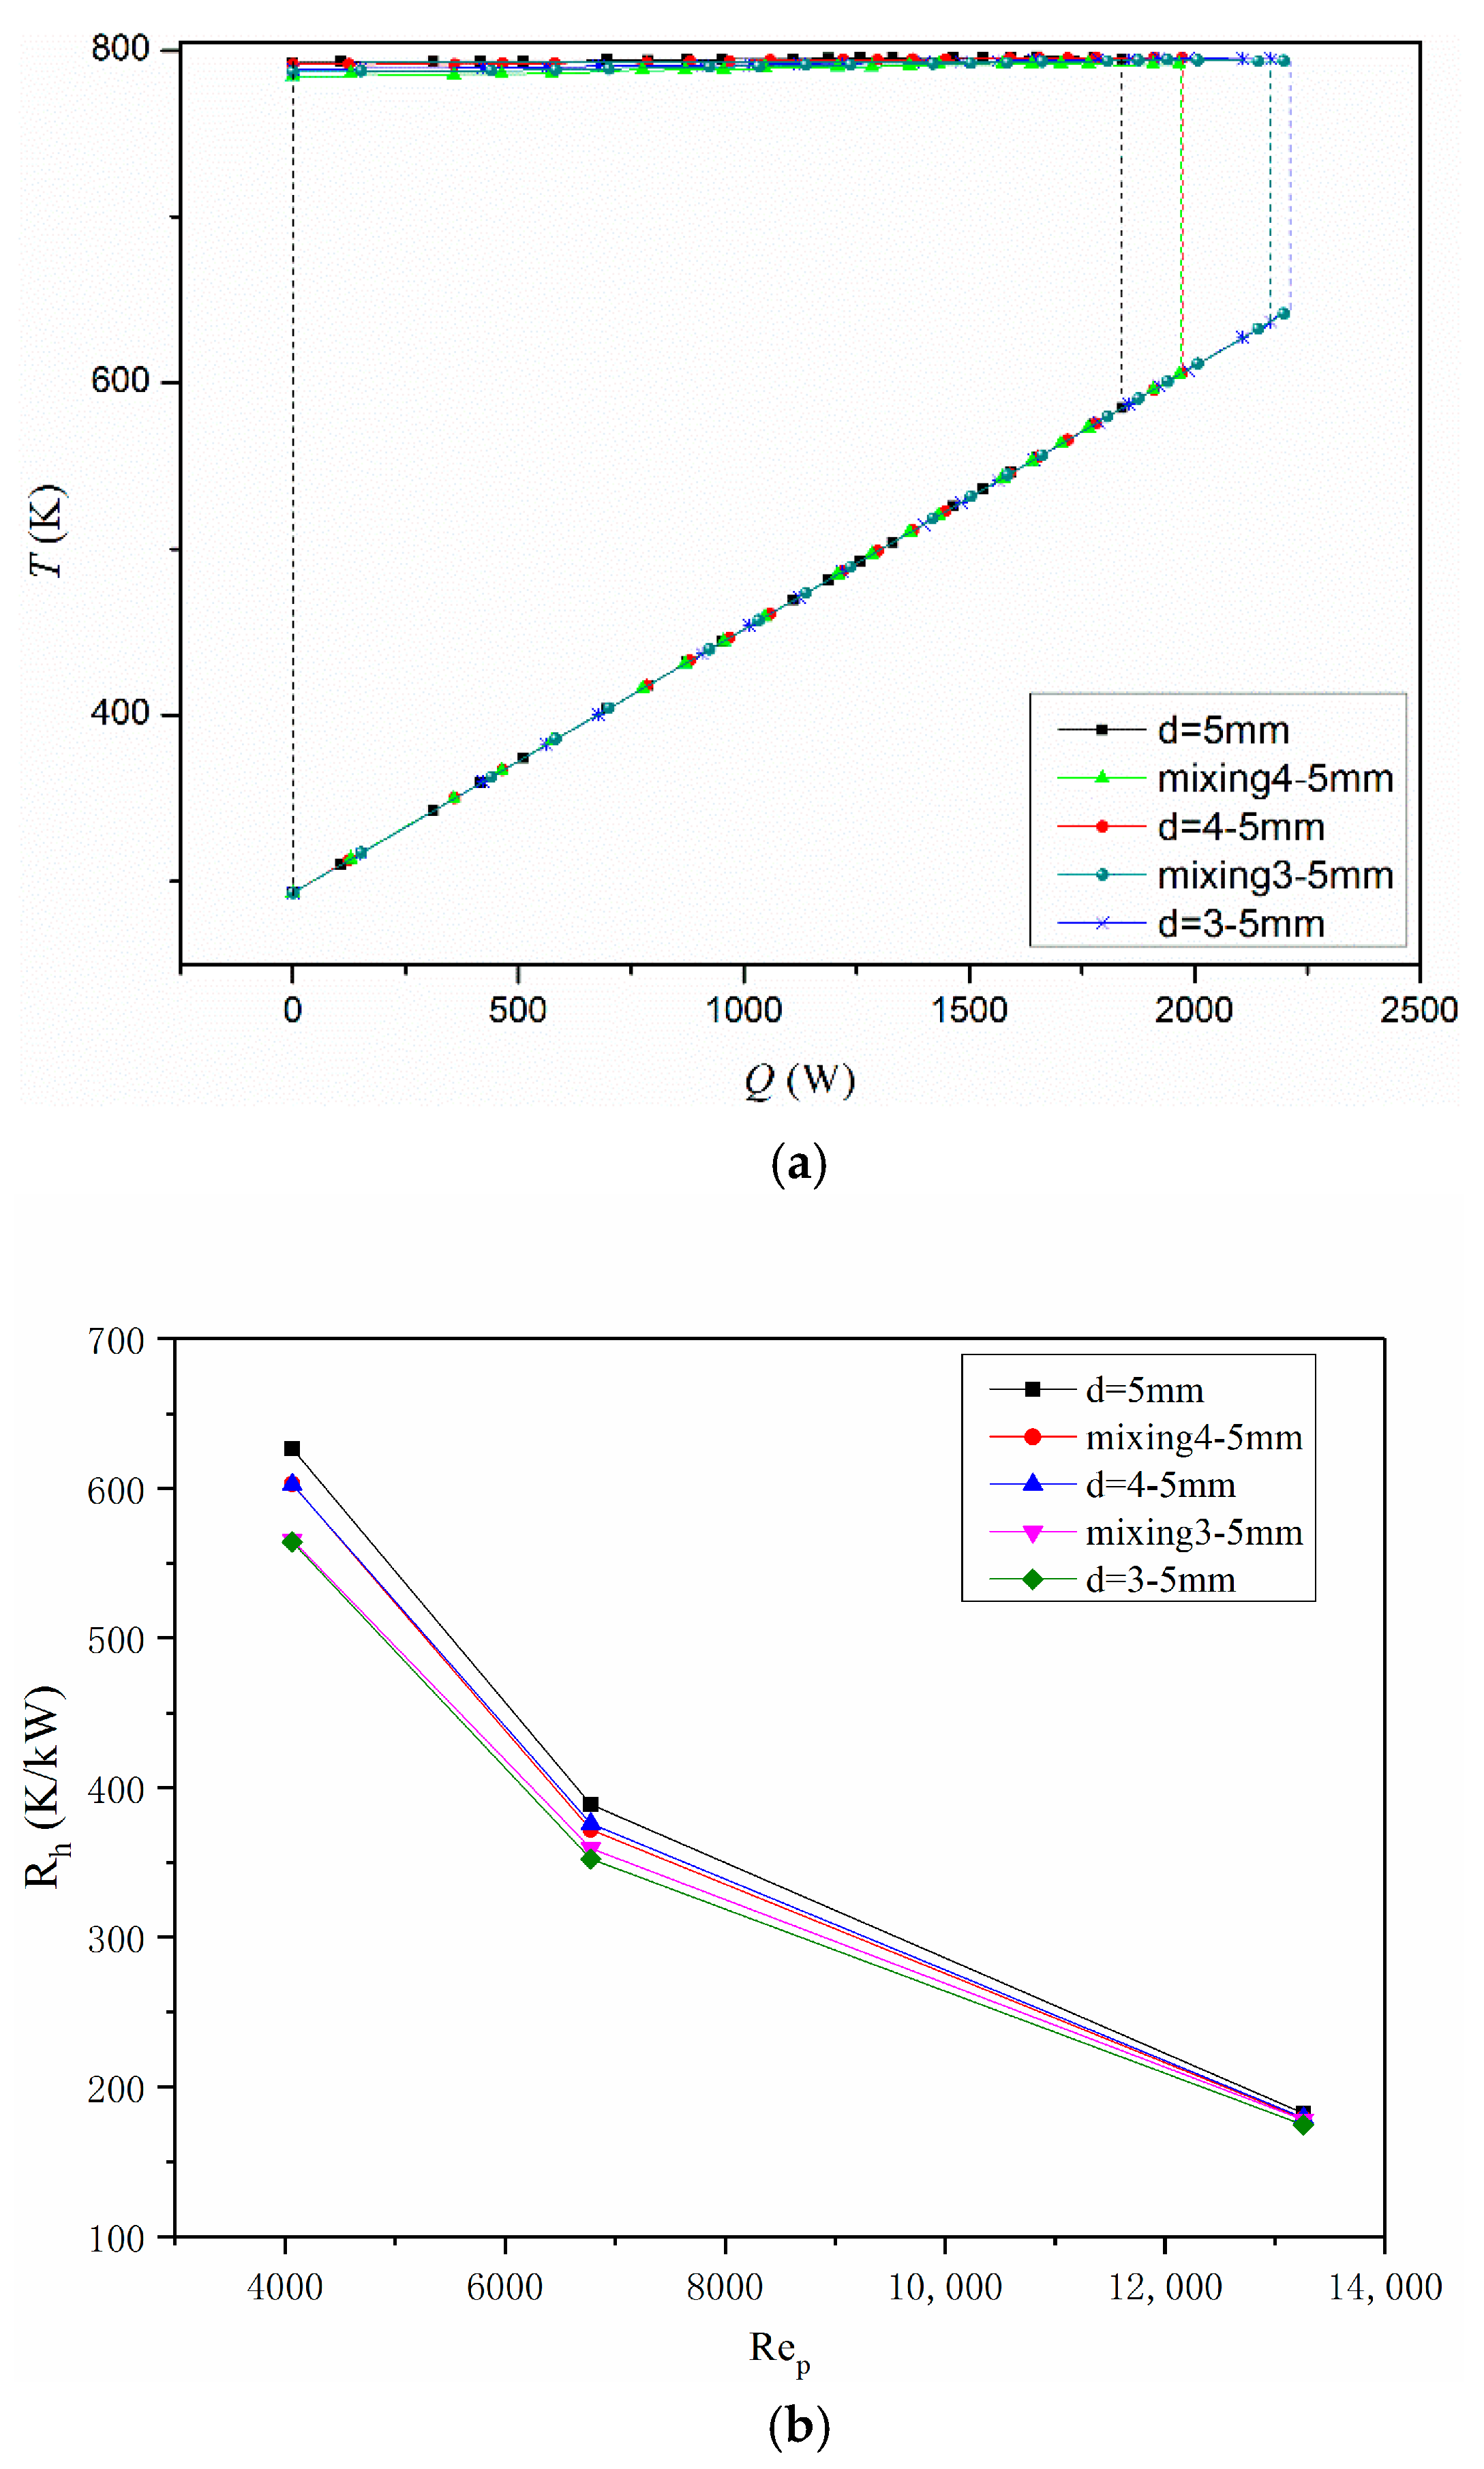
Figure 13.
Performance comparisons of different radial distribution thickness: (a) Nusselt number; (b) friction factor; and (c) the overall performance.
Figure 13.
Performance comparisons of different radial distribution thickness: (a) Nusselt number; (b) friction factor; and (c) the overall performance.

Figure 14.
Radial temperature distribution of different radial distribution thickness (section Z = 0.07922 m).
Figure 14.
Radial temperature distribution of different radial distribution thickness (section Z = 0.07922 m).
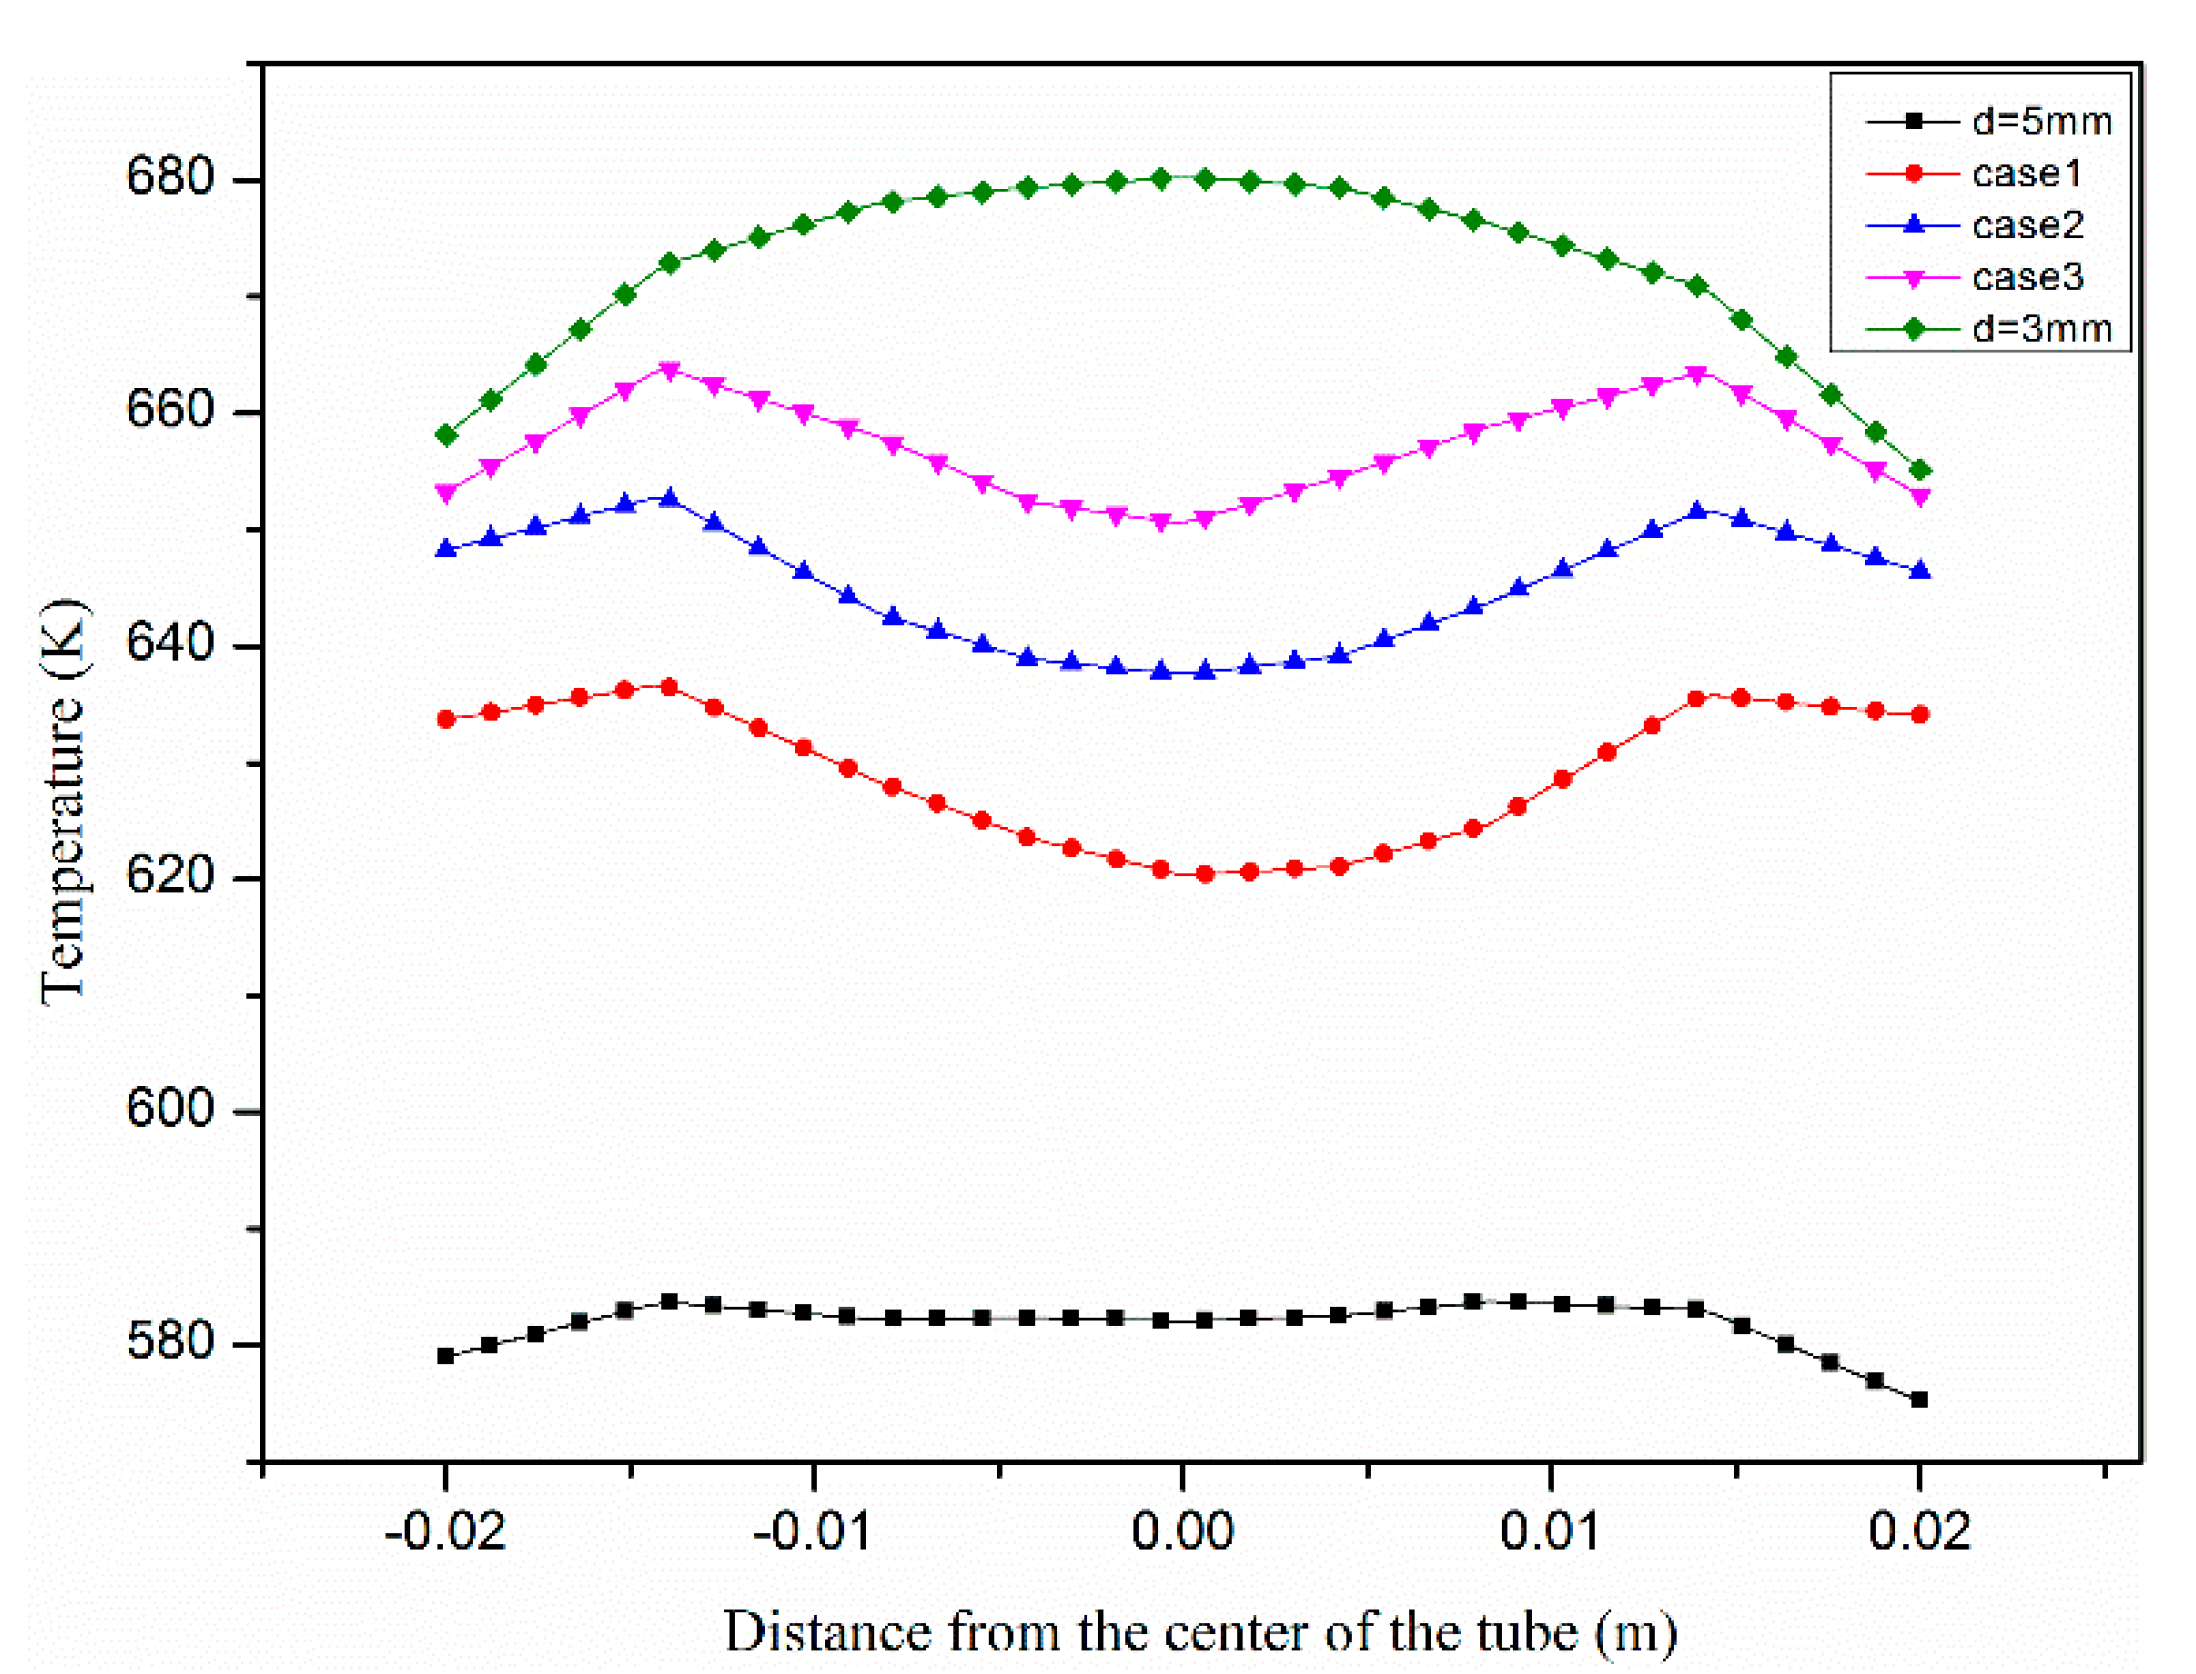
Figure 15.
Temperature distribution of different radial distribution thickness (Y-Sec).
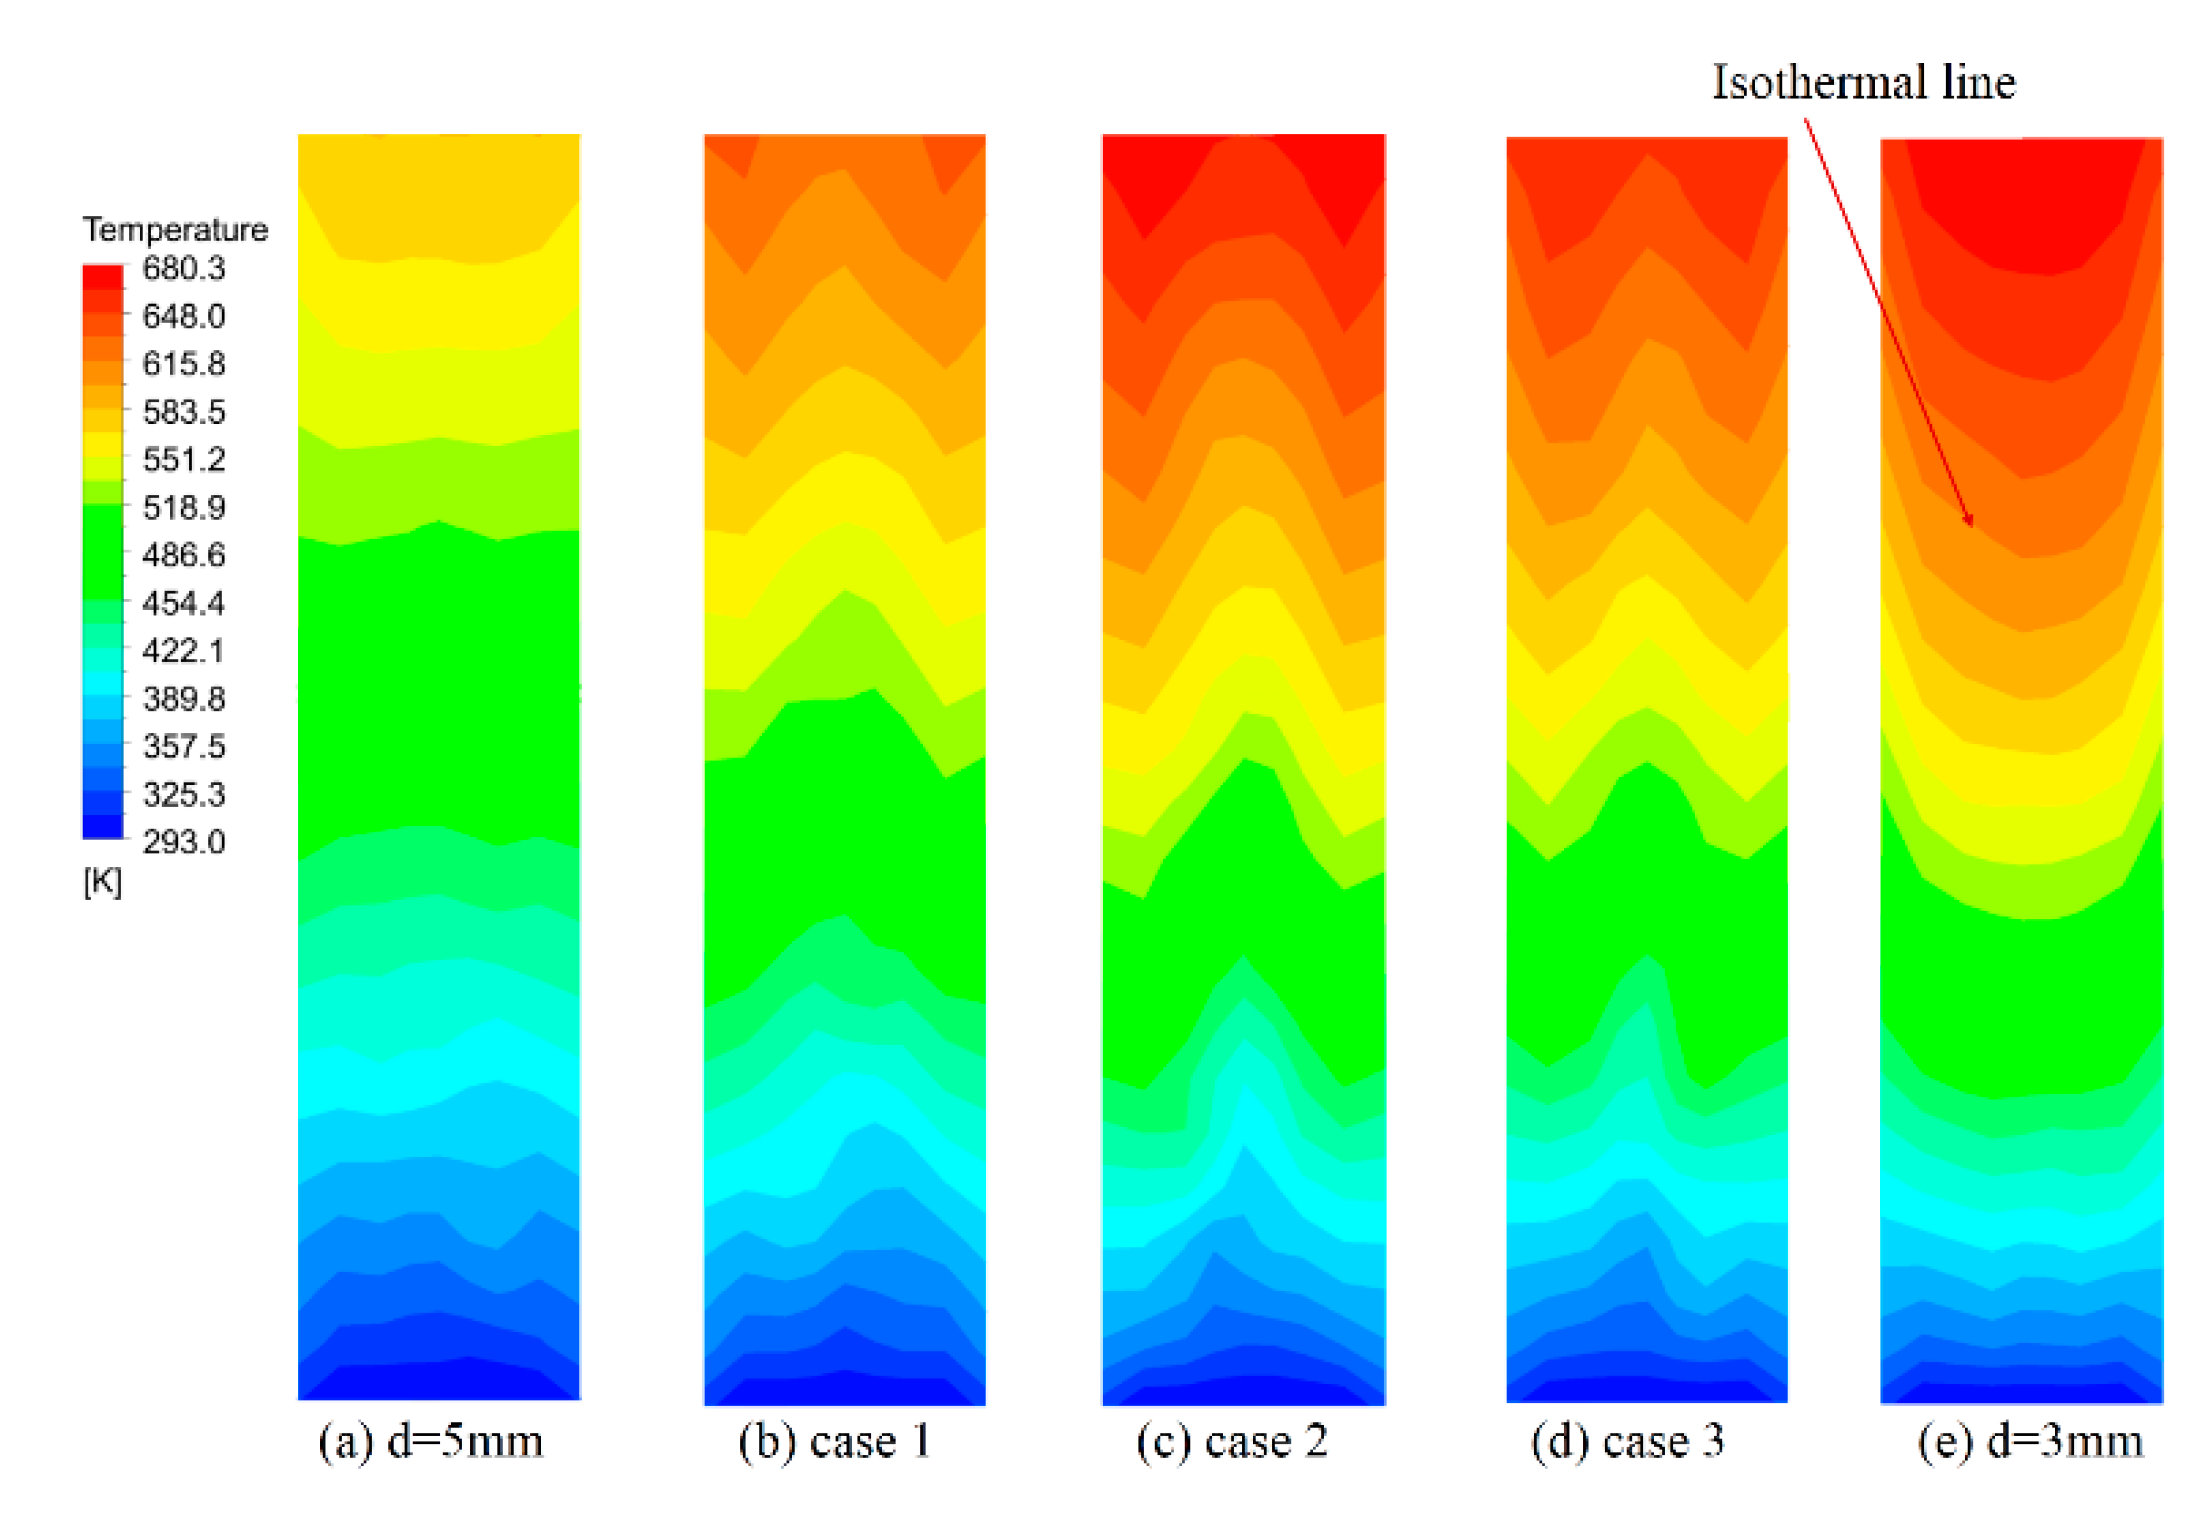
Figure 16.
Velocity distribution of different radial distribution thickness (Y-Sec).
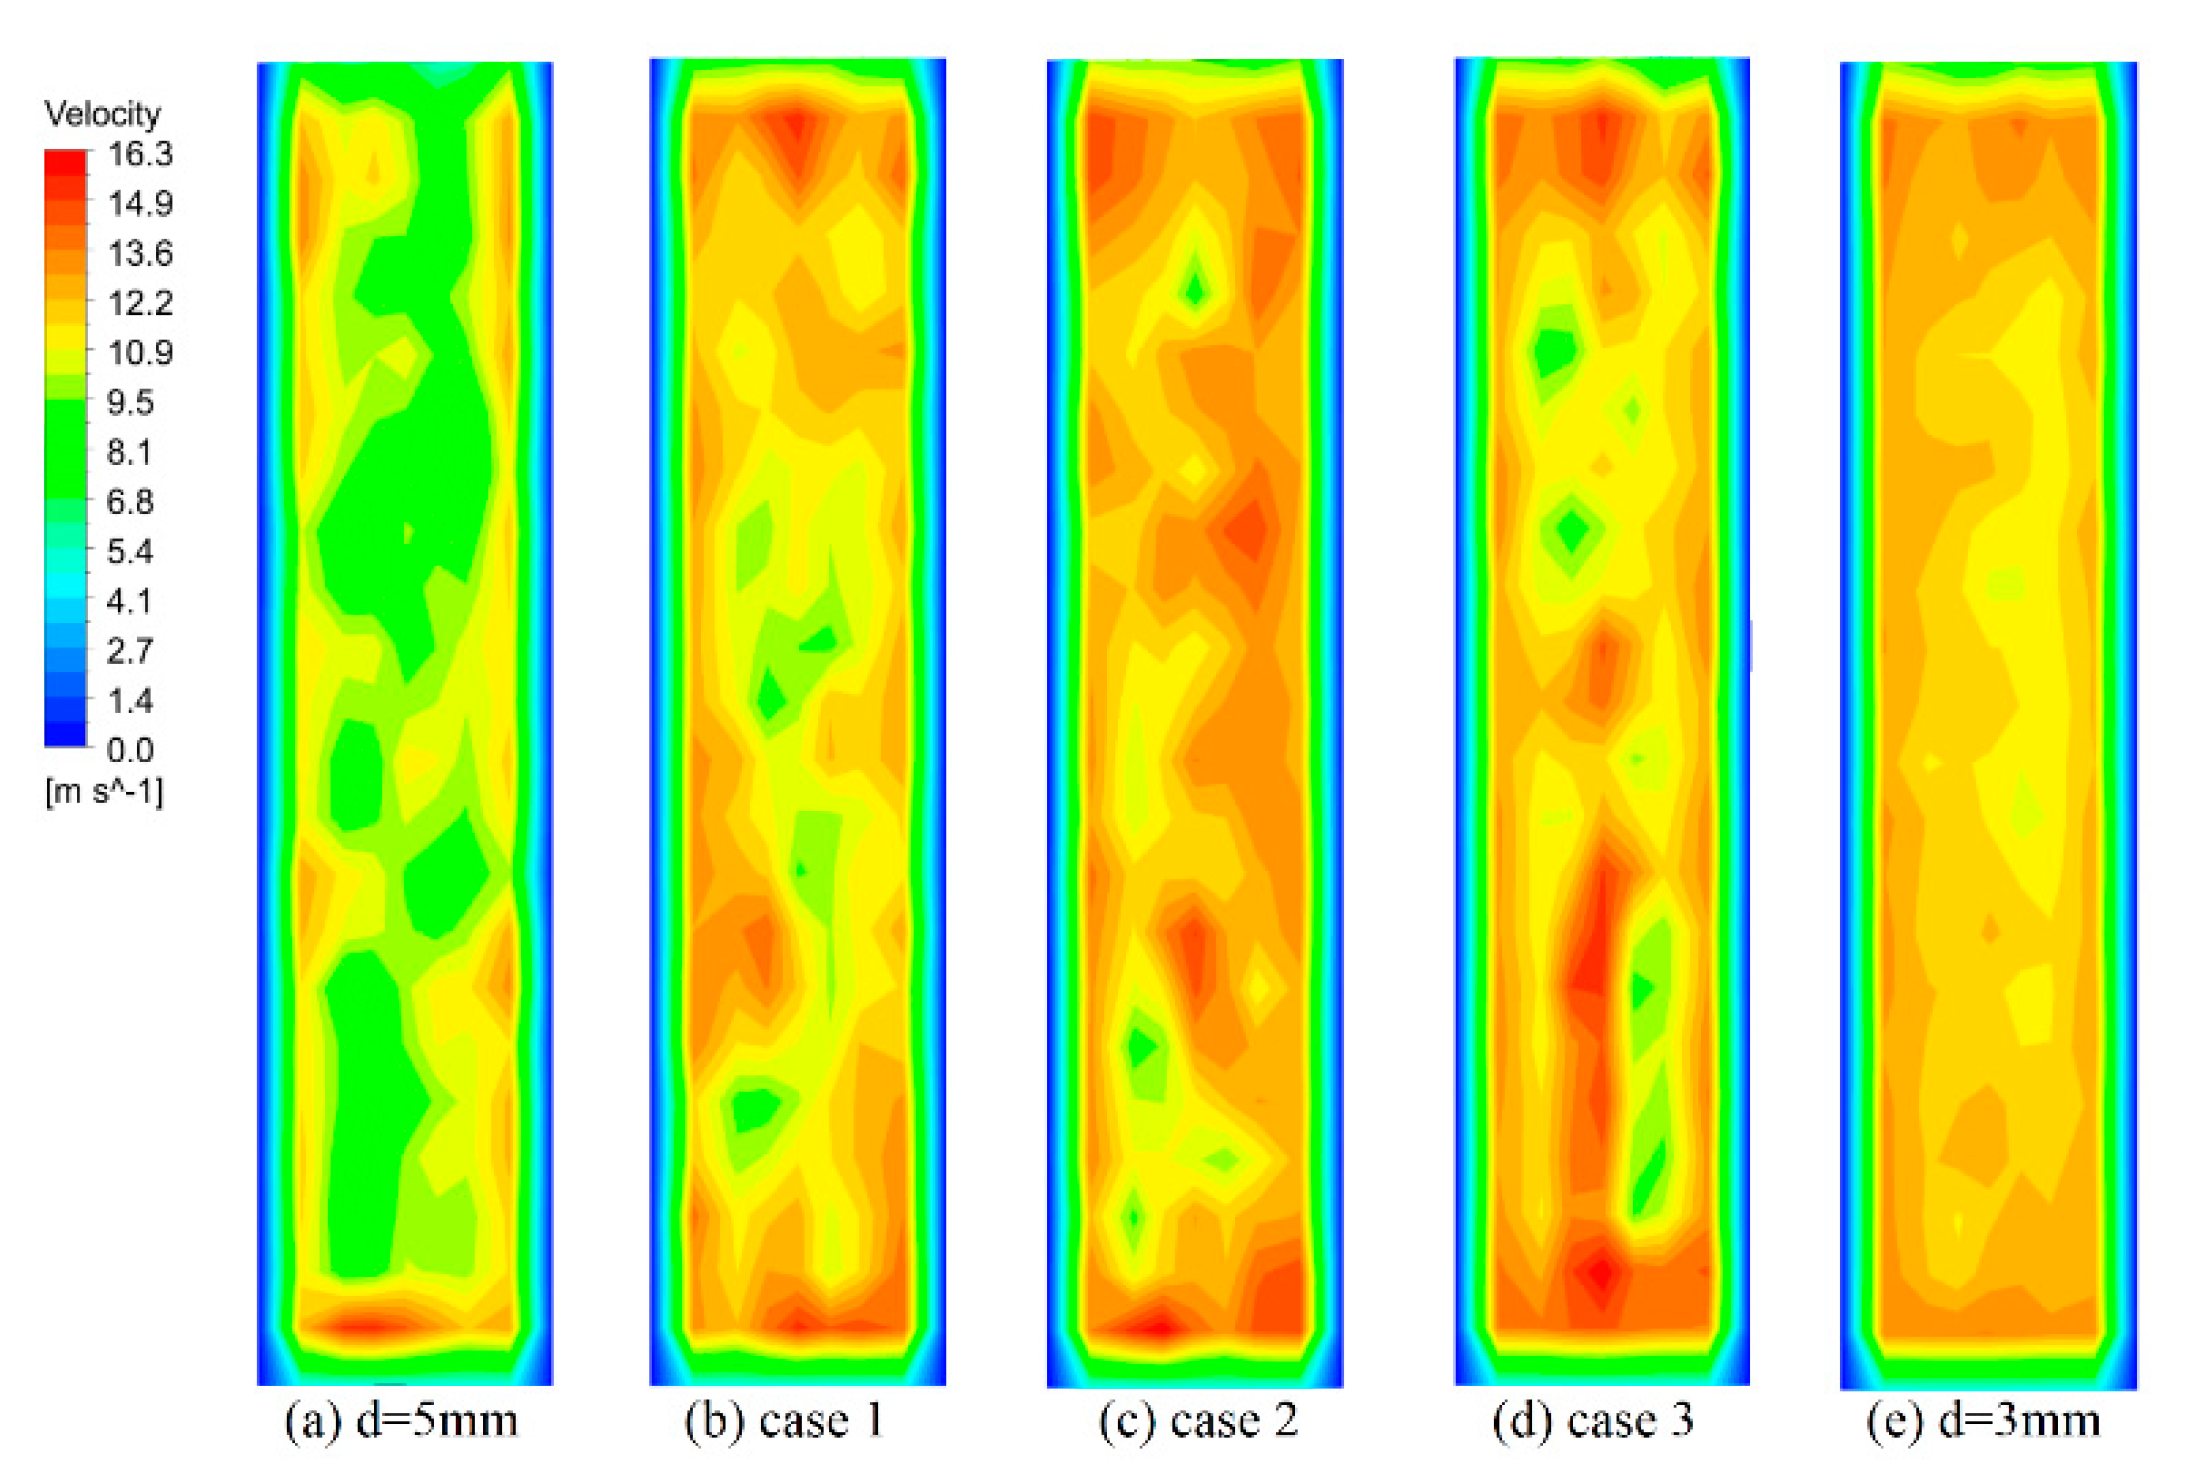
Figure 17.
(a) T–Q graph of different radial distribution thickness and (b) equivalent thermal resistance.
Figure 17.
(a) T–Q graph of different radial distribution thickness and (b) equivalent thermal resistance.

Table 1.
Detailed parameters of the physical model.
| Bed Geometry | Diameter D (mm) | 40 |
|---|---|---|
| Particle domain L2 (mm) | 180 | |
| Extended domain L1(mm) | 90 | |
| Particle | diameter d (mm) | 3/4/5 |
| Density (kg/m3) | 4540 | |
| thermal conductivity (W/(m.K) | 24.6 | |
| thermal capacity Cp (J/(kg.K) | 630 | |
| initial temperature (K) | 800 | |
| Gas | Density (kg/m3) | 0.9944 |
| Thermal conductivity (W/(m.K) | 0.03066 | |
| thermal capacity Cp (J/(kg.K) | 1009 | |
| initial velocity (m/s) | 5 | |
| Initial temperature (K) | 293 | |
| dynamic viscosity (m2/s) | 2.13e-05 | |
| Contact parameter | Poisson ratio | 0.3 |
| Young’s modulus (Mpa) | 64.52 | |
| rolling friction coefficient | 0.01 | |
| static friction coefficient | 0.545 | |
| restitution coefficient | 0.2 |
Table 2.
Quantitative comparison of model validation.
| 2849.9 | 4132.4 | 5405.3 | 6592.8 | ||
| Nu | Sug Lee and Ogawa [50] | 19.108 | 25.962 | 32.270 | 38.200 |
| Computation data | 20.290 | 24.950 | 30.124 | 36.148 | |
| Deviation | 6.2% | 3.9% | 6.6% | 5.4% | |
| f | Demirel [49] | 6.041 | 5.642 | 5.404 | 5.249 |
| Computation data | 6.459 | 5.326 | 5.157 | 4.712 | |
| Deviation (%) | 6.9% | 5.6% | 4.5% | 10.2% | |
Table 3.
Outlet temperature and average porosity of different distributions (Re = 6399).
| Particle Size Distribution | d = 5 mm | Mixing 4–5 mm | d = 4–5 mm | Mixing 3–5 mm | d = 3–5 mm (Case1) | Case2 | Case3 | d = 3 mm |
|---|---|---|---|---|---|---|---|---|
| Outlet temperature (K) | 584.4 | 605.1 | 606.8 | 624.2 | 636.3 | 652.4 | 662.2 | 672.1 |
| Average porosity | 0.4397 | 0.4177 | 0.4177 | 0.4127 | 0.4127 | 0.4114 | 0.589 | 0.41 |
© 2019 by the authors. Licensee MDPI, Basel, Switzerland. This article is an open access article distributed under the terms and conditions of the Creative Commons Attribution (CC BY) license (http://creativecommons.org/licenses/by/4.0/).
Share and Cite
MDPI and ACS Style
Wang, S.; Xu, C.; Liu, W.; Liu, Z. Numerical Study on Heat Transfer Performance in Packed Bed. Energies 2019, 12, 414. https://doi.org/10.3390/en12030414
AMA Style
Wang S, Xu C, Liu W, Liu Z. Numerical Study on Heat Transfer Performance in Packed Bed. Energies. 2019; 12(3):414. https://doi.org/10.3390/en12030414
Chicago/Turabian StyleWang, Shicheng, Chenyi Xu, Wei Liu, and Zhichun Liu. 2019. "Numerical Study on Heat Transfer Performance in Packed Bed" Energies 12, no. 3: 414. https://doi.org/10.3390/en12030414
Note that from the first issue of 2016, this journal uses article numbers instead of page numbers. See further details here.