Article

Effect of Aerobic Hydrolysis on Anaerobic Fermentation Characteristics of Various Parts of Corn Stover and the Scum Layer

1
Department of Agriculture Biological Environment and Energy Engineering, School of Engineering, Northeast Agriculture University, Harbin 150030, China
2
College of Engineering, Heilongjiang Bayi Agricultural University, Daqing 163319, China
3
Key Laboratory of Renewable Resources Utilization Technology and Equipment for Cold Region Agriculture, Northeast Agriculture University, Harbin 150030, China
*
Author to whom correspondence should be addressed.
Energies 2019, 12(3), 381; https://doi.org/10.3390/en12030381
Submission received: 16 December 2018 / Revised: 21 January 2019 / Accepted: 22 January 2019 / Published: 25 January 2019

Abstract

:
To solve the difficulty of lignocellulose hydrolysis and the formation of crusted scum in anaerobic fermentation, various parts of corn stover, i.e., pith, rind and leaf, were subjected to a two-phase processing including aerobic hydrolysis (AH) and anaerobic fermentation. The results showed that AH significantly broke down the lignin structure of the various components of corn stover and increased the rate of lignin degradation. After 16 h of AH, the lignin degradation rates of the pith, rind and leaf were 4.20%, 3.91% and 4.90%, respectively, and the acetic acid produced accounted for more than 60% of the total amount of volatile fatty acids (VFAs) and ethanol. After hydrolyzing the pith and rind for 12 h and the leaf for 8 h, the maximum methane yields of fresh mass volatile solid (VS) were 323 mL g−1, 251 mL g−1 and 264 mL g−1, respectively, which were increased by 35.02%, 30.05% and 8%, respectively, while the fermentation cycle of T90 (90% of the total gas production) was shortened by 4–5 days. After hydrolyzing the rind and leaf for 12 h and the pith for 16 h, the thicknesses of the scum layer were only 7.1%, 13.6% and 18%, respectively, of that of the untreated group, indicating that AH coupled with anaerobic fermentation can effectively degrade lignin, reduce the thickness of the scum layer and increase the methane yield.

1. Introduction

The use of anaerobic fermentation technology to convert stover waste into biogas with high calorific value is an effective way to solve energy and environmental problems and has important economic and social benefits [1,2]. The main components of corn stover are cellulose, hemicellulose and lignin, which are intermingled and cross-linked to form a dense physical barrier in the plant cell wall [3] that restricts the accessibility of extracellular hydrolyzing enzymes of microbes to the cellulose, resulting in a slow fermentation process for acid production from hydrolysis. Therefore, the maximal destruction of the lignin structure in the stages of hydrolysis, acid production, and fermentation and the promotion of the complete accessibility of hydrolyzing microorganisms to the cellulose and hemicellulose are critical for the anaerobic fermentation of the stover [4]. The physical properties of the stover (low density and poor mobility) cause it to float up to the gas-liquid interface to form a scum layer under the action of buoyancy and gas, which, if not disturbed, can harden after long dehydration to form a crust that impedes the separation and emission of biogas and reduces the accessibility of the substrate to anaerobic microorganisms, as well as the effective volume of the reactor, seriously affecting the continuous gas production and long-term operation of the reactor [5,6,7]. Thus, effectively resolving the formation of crusted scum has become another research focus of biogas production through stover fermentation.
Various pretreatments (e.g., thermal, chemical, biological, and mechanical methods or various combinations of these methods) have been employed to break down the lignin structure to a certain extent and promote the hydrolysis of organic matter in the substrate [8,9,10,11,12,13,14,15,16]. However, some pretreatment methods generate high costs due to the high consumption of energy and chemicals (biological agents) needed for maintaining the normal fermentation conditions, as well as byproducts that are not biodegradable, making the subsequent treatment of the biogas slurry more difficult and making the method impractical for biogas production [11]. A variety of measures, e.g., composting pretreatment, an appropriate increase in the fermentation temperature, a suitable substrate concentration, smaller substrate particle size, and anti-encrustation reactor have been employed, and it has been shown that the thickness of the crusted scum layer can be reduced to some extent [17,18,19], although still with unsatisfactory overall effectiveness. The commonly used crust-breaking methods in stover fermentation projects still have some drawbacks such as required external power consumption, complicated structures, operational inconvenience, low breakage rates, and impediments to continuous reactor use [5,20]. In biogas production from corn stover fermentation, the propagation of aerobic microorganisms is much higher than that of anaerobic microorganisms [21]. At the same time, in the initial hydrolysis of stover lignin, the presence of molecular oxygen is required, and the lignin that has not undergone aerobic treatment cannot significantly be degraded by microbes in an anaerobic environment [21,22,23]. Therefore, in this study, we treated corn stover with aerobic hydrolysis (AH) and anaerobic fermentation. Pre-experiments demonstrated that AH can improve the sedimentation performance of corn stover and reduce the thickness of the scum layer to some extent. However, reducing the scum layer thickness through AH has not been reported.
For the anaerobic fermentation of corn stover, the current pretreatments are mostly performed on the stover as a whole, which ignores the differences in the structure and composition of various parts of the stover, as well as the difference in the effectiveness of the pretreatment process on different parts [23,24]. In this study, the corn stover was divided into three parts, i.e., the rind, pith and leaf [25], which were subjected to AH pretreatment separately, and the changes in the acid production from AH, lignocellulose, gas production from anaerobic fermentation, and the scum layer were investigated to find the suitable duration of AH to maximally improve the methane yield and comprehensive utilization efficiency of corn stover while providing process parameters for the production of biogas from corn stover.

2. Materials and Methods

2.1. Experimental Materials

The corn stover used in this study was from the farm of Northeast Agricultural University. After the harvest, the corn stover was air-dried, and the pith, rind and leaf (leaf, leaf sheath, and husk) were separated from the stover and then pulverized with a pulverizer (Model 9FQ-36B; motor power: 5.5 kW; sieve size: 5 mm in diameter; Sida, Luoyang, China) and stored at 4 °C. The highly viable inoculum was from the methane tank of the two-phase anaerobic fermentation industrializing pilot system (anaerobic fermentation of corn stover for 40 days at 37 °C) of Northeast Agricultural University and passed through a 20-mesh sieve before use. The properties of the test material are summarized in Table 1.

2.2. Experimental Design

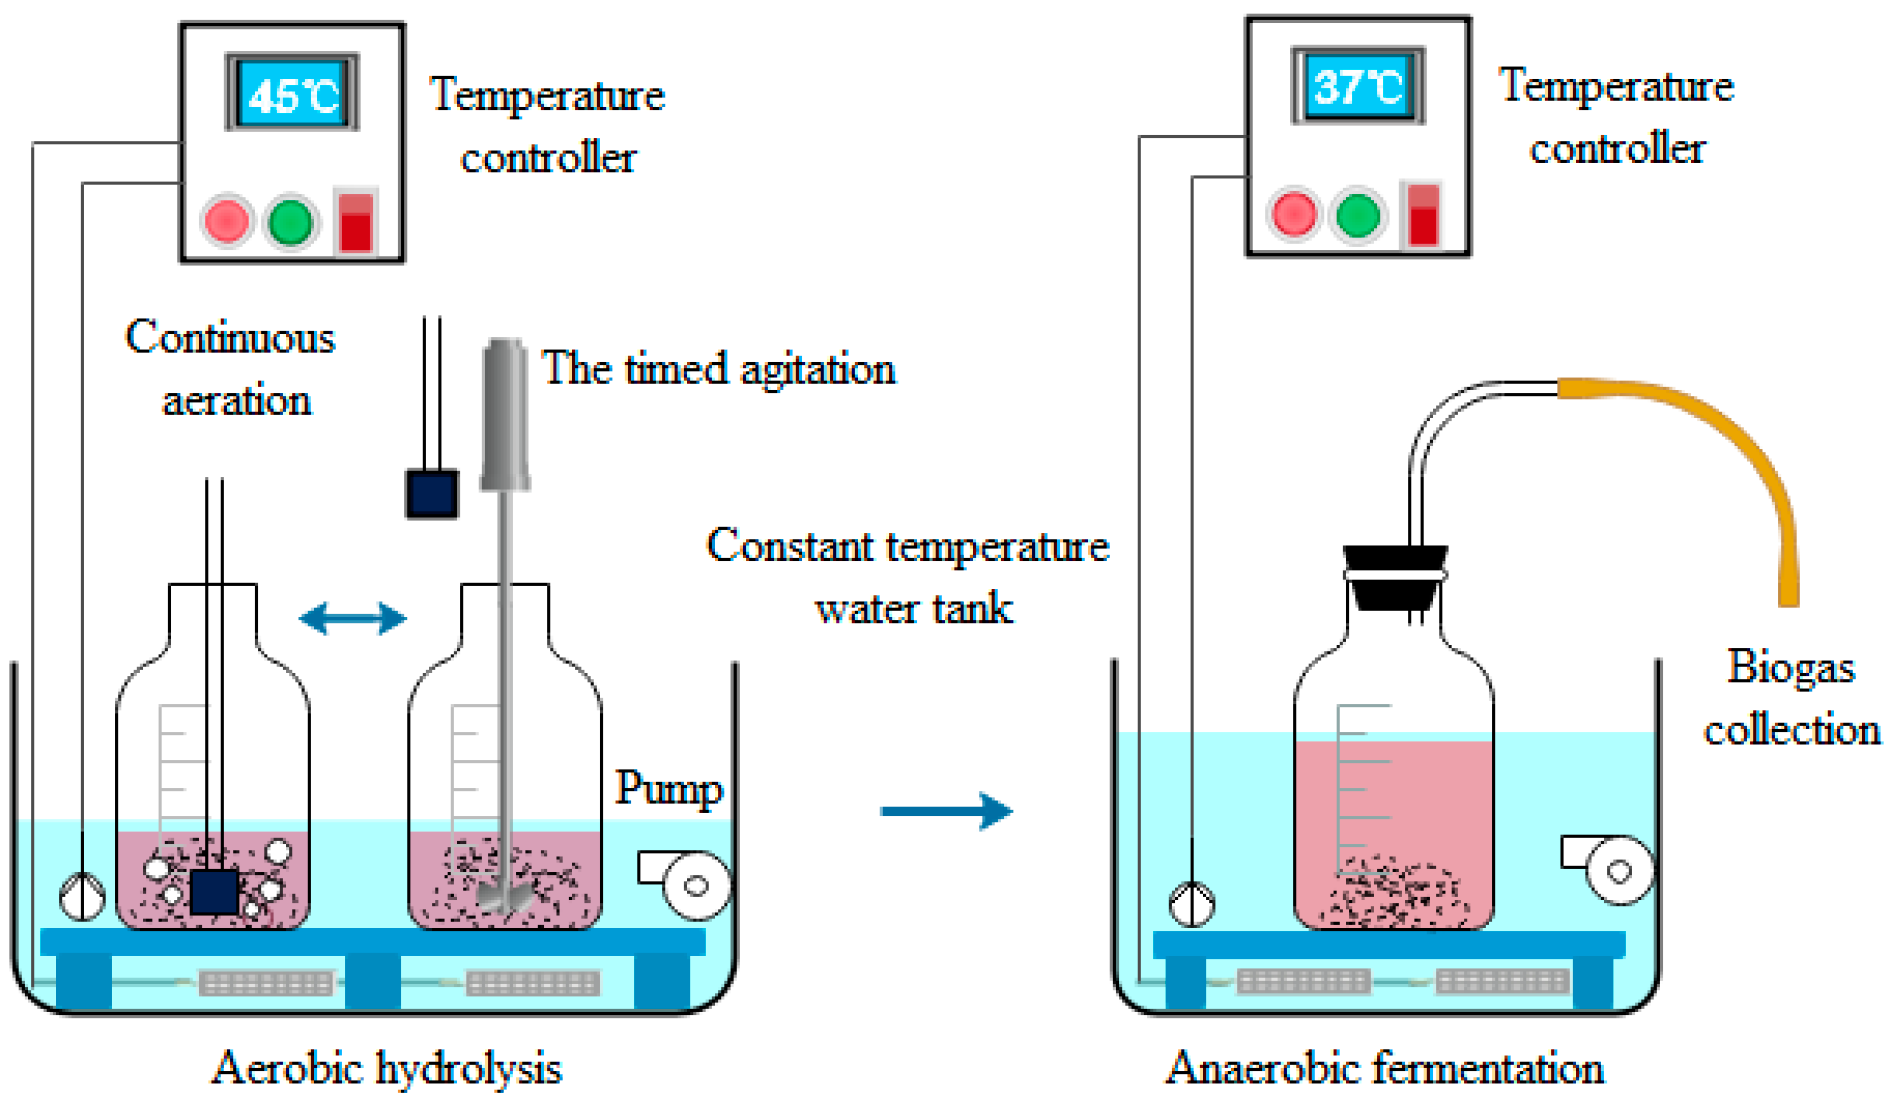
2.2.1. Aerobic Hydrolysis Stage

Jars of 2500 mL, each with an effective volume of 1750 mL, were used as AH reactors. The experiments were divided into three groups, in which the pith, rind and leaf were separately tested. Each group contained nine treatments. 50 g of rind and a certain amount of inoculum were placed in a reactor, and the total solids (TS) of the fermentation broth was adjusted to 8%. An aerator (for continuous aeration at 0.5 mL/L) was then installed in each reactor, and each jar was sealed with plastic film and inoculated in a water bath with a constant temperature (temperature 45 ± 1 °C, with a circulating pump) for the AH test. The fermentation broth was stirred for 30 s every hour at 100 r/min with a digital constant speed electric mixer (Model JJ-1A, Ronghua, Changzhou, China) to ensure the uniformity of the dissolved oxygen content in the liquid phase. Prior to inoculation, the inoculum was heated to 45 °C to facilitate the rapid start of the hydrolysis reaction. Four treatments, with hydrolysis durations of 4 h, 8 h, 12 h, and 16 h, were for the measurements of the pH value, soluble sugars, volatile fatty acids (VFAs), lignin, cellulose and hemicellulose, and infrared spectroscopy. Another five treatments were hydrolyzed for 0 h, 4 h, 8 h, 12 h, and 16 h and then added to the inoculum to initiate anaerobic fermentation. The experimental groups of pith and leaf were treated similarly, except that after 40 g of pith and a certain amount of inoculum were placed in a reactor, the TS of the fermentation broth was adjusted to 6% based on the result of the pre-test given the differences in tissue structure and water absorbance to ensure the homogeneity and mobility of the hydrolysate. The reactor that was not subjected to hydrolysis (with 0 h of hydrolysis) was not inoculated with the inoculum and was directly used for anaerobic fermentation. Schematic diagram of the experimental device is shown in Figure 1.

2.2.2. Anaerobic Fermentation Stage

After AH, approximately 1100 mL of inoculum (the total volume of the reaction was 1750 mL) was added to each reactor, and the pH of AH treatment group were adjusted to provide an appropriate anaerobic environment for the microorganisms (adjusted pH 6.85 to 7.05); the reactor without AH (with 0 h of hydrolysis) was supplemented with 1750 mL of inoculum to keep the amount of inoculum at the same level as in the other treatments. In another reactor, 1750 mL of the inoculum was directly added as a blank sample for anaerobic fermentation (when calculating the gas production of various parts of the stover, the residual gas production of the inoculum was deducted.). Then, the reactor was flushed with nitrogen gas (N2) for 5 min, and after the flush, the reactor was sealed with a rubber stopper and inoculated in a water bath (37 ± 1 °C) with a built-in circulating pump to conduct the anaerobic fermentation test. Each group contained three replicates. During the experiment, the reactors were manually agitated for 15 s twice a day at a fixed time, and the gas volume and the components were measured once per day at the fixed time. The thickness of the scum layer was measured daily at a fixed time (before manual agitation) until the end of the experiment. The schematic diagram of the experimental device is shown in Figure 1.

2.3. Measurement Method

The TS, VS (volatile solid) and pH were measured according to the Standard Methods for the Examination of Water and Wastewater (APHA, 2005). The contents of hemicellulose, cellulose, and lignin were determined with a semiautomatic cellulose analyzer (ANKOM 200i., MANKOM Technology, New York, NY, USA) according to the method adapted from Soest et al. [26]. Soluble sugars were analyzed using anthrone colorimetry. The gas volume was measured using the water displacement method, and then converted to STP state (273 K, 1.01 bar) volume uniformly [27]. The gas composition, VFAs and ethanol were analyzed using the gas chromatograph (GC-6890N, Agilent Inc., Santa Clara, CA, USA). The test conditions were as follows: (1) A thermal conductivity detector (TCD) and a stainless-steel column (1 m × 3 mm i.d. carbon molecular sieve TDX-01: 1.5 to 2.0 nm) were used to determine the biogas. The carrier gas was argon with a flow rate of 40 mL min−1; the gas measurement time is 2.5 min; temperatures of detector, oven and injector were set to 220 °C, 155 °C and 120 °C, respectively. (2) A Flame Ionization Detector (FID) and a capillary column (Agilent 1909/N-133 HP-INNOWAX Polyethylene Glycol) were used to determine VFAs and ethanol. The temperatures of injector port, oven, and detector were 220 °C and 250 °C, respectively. The initial temperature of the oven was 60 °C, then increased to 140 °C at a rate of 15 °C min−1 and maintained for 2 min. The carrier gas was argon with a flow rate of 30 mL min−1 and constant pressure of 187 kPa; the gas measurement time was 7.4 min. Carbon and nitrogen were analyzed using an elemental analyzer (EA 3000, LEEMAN Technologies Co., Ltd., Beijing, China). The functional groups of the samples were characterized through Fourier transform infrared (FTIR) spectroscopy using the Spectrum One B infrared spectrometer. All the measurements were repeated three times, and the means were used in the analyses.
The standard deviations and statistical differences were analyzed by MS Excel 2013 and SPSS 17.0 for Windows. All the figures in this paper were drawn by software Origin Pro 8.6.

2.4. Methane Production Model and Data Analysis

The modified Gompertz model and the first-order model have been widely used in the field of methane production [28,29] and were also adopted in this study to predict the methane production process. The modified Gompertz model is shown in Formula (1):
P ( t ) = P × exp { exp [ R m × e P ( λ t ) + 1 ] }
in which P(t) is the cumulative gas yield at time t (mL g−1VS); P is the maximum cumulative gas yield (mL g−1VS); Rm is the maximum gas production rate (mL g−1VS day); λ is the lag period (d); t is the fermentation time; and e is the Euler constant (2.718282).
The First-order model is shown in Formula (2):
B ( t ) = B [ 1 exp ( k H ( t L P ) ) ]
in which B(t) is the cumulative gas yield at time t (mL g−1 VS); B is the maximum cumulative gas yield (mL g−1VS); k H is the hydrolysis constant (d−1); t is the fermentation time; and Lp is the lag period (d).
The cumulative yield of methane was obtained in this study through fitting using the modified Gompertz and First-order models.

3. Results and Discussion

3.1. Aerobic Hydrolysis Stage

3.1.1. pH and VFAs

In the hydrolysis and acid production stage, complex polymer organic matter is hydrolyzed into monomers (monosaccharides, amino acids, fatty acids), which are then converted to VFAs and alcohols under the action of acid-producing bacteria, in which the generation of VFAs is the main factor leading to pH changes. Figure 2 shows that as the duration of the AH increased, the pH value decreased and ultimately stabilized. In the first four hours of the hydrolysis, the stover was soaked and the cellulose was swollen, which caused the cell wall to burst, releasing substrate components that are readily degradable such as sugars. The precipitation of the proteins enabled the protein-ammonifying bacteria to gradually become established, while the growth and propagation of acidogenic microbial strains still took some time, resulting in a slight decrease in pH [19]. After 4–8 h of hydrolysis, as the dissolution or precipitation of the easily degradable substrates such as sugars occurred and the acidogenic microbial strains rapidly became established, the sugars were rapidly converted into acids, causing the pH to drop. The leaves were thinner, with an incompletely lignified structure and thus low in mechanical strength and readily pulverized into powder, which was more prone to release the easily degradable products such as sugars that can be degraded by acid-producing microorganisms to generate acids. Hence, after 8 h of hydrolysis, the acid production was stabilized. The rind and pith contained more sugars than the leaf (as shown in Table 1) but had a more highly lignified structure that caused slightly decreased levels of hemicellulose break-down, so it took longer for the substrates that are readily dissolved or precipitated to degrade, which in turn led to a slightly slower hydrolysis rate, stabilizing after 12 h.
In the acid production stage, the composition of the fermentation end products could affect the stability of the methanogenic stage [30]. In the AH stage, the accumulation of acidic substances is beneficial to the subsequent anaerobic fermentation. Figure 2 shows that as the hydrolysis time increased, the concentration of VFAs in hydrolysis liquor increased rapidly in initial 8 h, then increased slowly after 8 h of aerobic hydrolysis. This is because in the early stage of the hydrolysis, the aerobic bacteria interacted rapidly with the easily degradable cellulose and hemicellulose in the stover, and as the hydrolysis continues, the amount of the easily degradable cellulose and hemicellulose gradually decreased. The substrate that can be utilized by the microorganisms gradually changed from those easily degradable components to the wrapped or crystallized lignin, resulting in a decreased degradation rate, which is consistent with the pH change.
During aerobic hydrolysis, the concentration of acetic acid in pith, rind and leaf increases rapidly as the hydrolysis time increased. After 8 h of hydrolysis, the concentrations of acetic acid produced from the pith, rind and leaf were 105.85, 101.13 and 122.38 mmol/L, respectively. The concentrations of acetic acid from the pith, rind, and leaf accounted for 61.49%, 67.33%, and 74.81% after 12 h of hydrolysis, respectively, of the total amounts of VFAs and ethanol that are produced in the AH process. While the concentrations of ethanol varied greatly. After 16 h of hydrolysis, the maximum concentration of ethanol from the pith was 45.23 mmol/L, which was 1.6 times that from the rind and 2.6 times that from the leaf. The presence of propanoic acid is disadvantageous to the subsequent anaerobic fermentation because its accumulation leads to reduced concentrations of acetic acid and butyric acid, which are considered better precursors for methane production [31]. Figure 2 shows that the concentration of propionic acid under the aerobic condition was not high; during 0–8 h of hydrolysis, the concentrations of propionic acid from the pith, rind, and leaf decreased from 12.81 mmol/L, 13.50 mmol/L, and 13.54 mmol/L, respectively, to 4.81 mmol/L, 5.57 mmol/L, 4.18 mmol/L, indicating that most of the propionic acid is consumed in the hydrolysis process. During the 12–16 h hydrolysis, the propionic acid concentrations slightly increased, indicating that a suitable hydrolysis time facilitate the subsequent fermentation for methane production.
The change trend of total butyric acid in the pith, rind and leaf is quite different. After 8 h of hydrolysis, the total concentration of butyric acids from the pith was also higher than those from the rind or leaf, indicating that the acidogenic potential of the pith is higher than that of the rind or leaf, mainly due to the differences induced by variations in the structure and composition of various parts of the stover as well as in the acid-producing bacterial species. After the pith was hydrolyzed for 16 h and the rind for 12 h, the n-butyric acid concentration peaked, at 27.48 mmol/L, 15.34 mmol/L, and 15.30 mmol/L in the pith, rind, and leaf, respectively. Previous studies on anaerobic fermentation have demonstrated that propionic acid and butyric acid can be converted to acetic acid with further hydrolysis by specific hydrogen and acetic acid-producing microorganisms, then used by methanogen for methane production, which explains why the concentration of acetic acid is much higher than that of other organic acids.

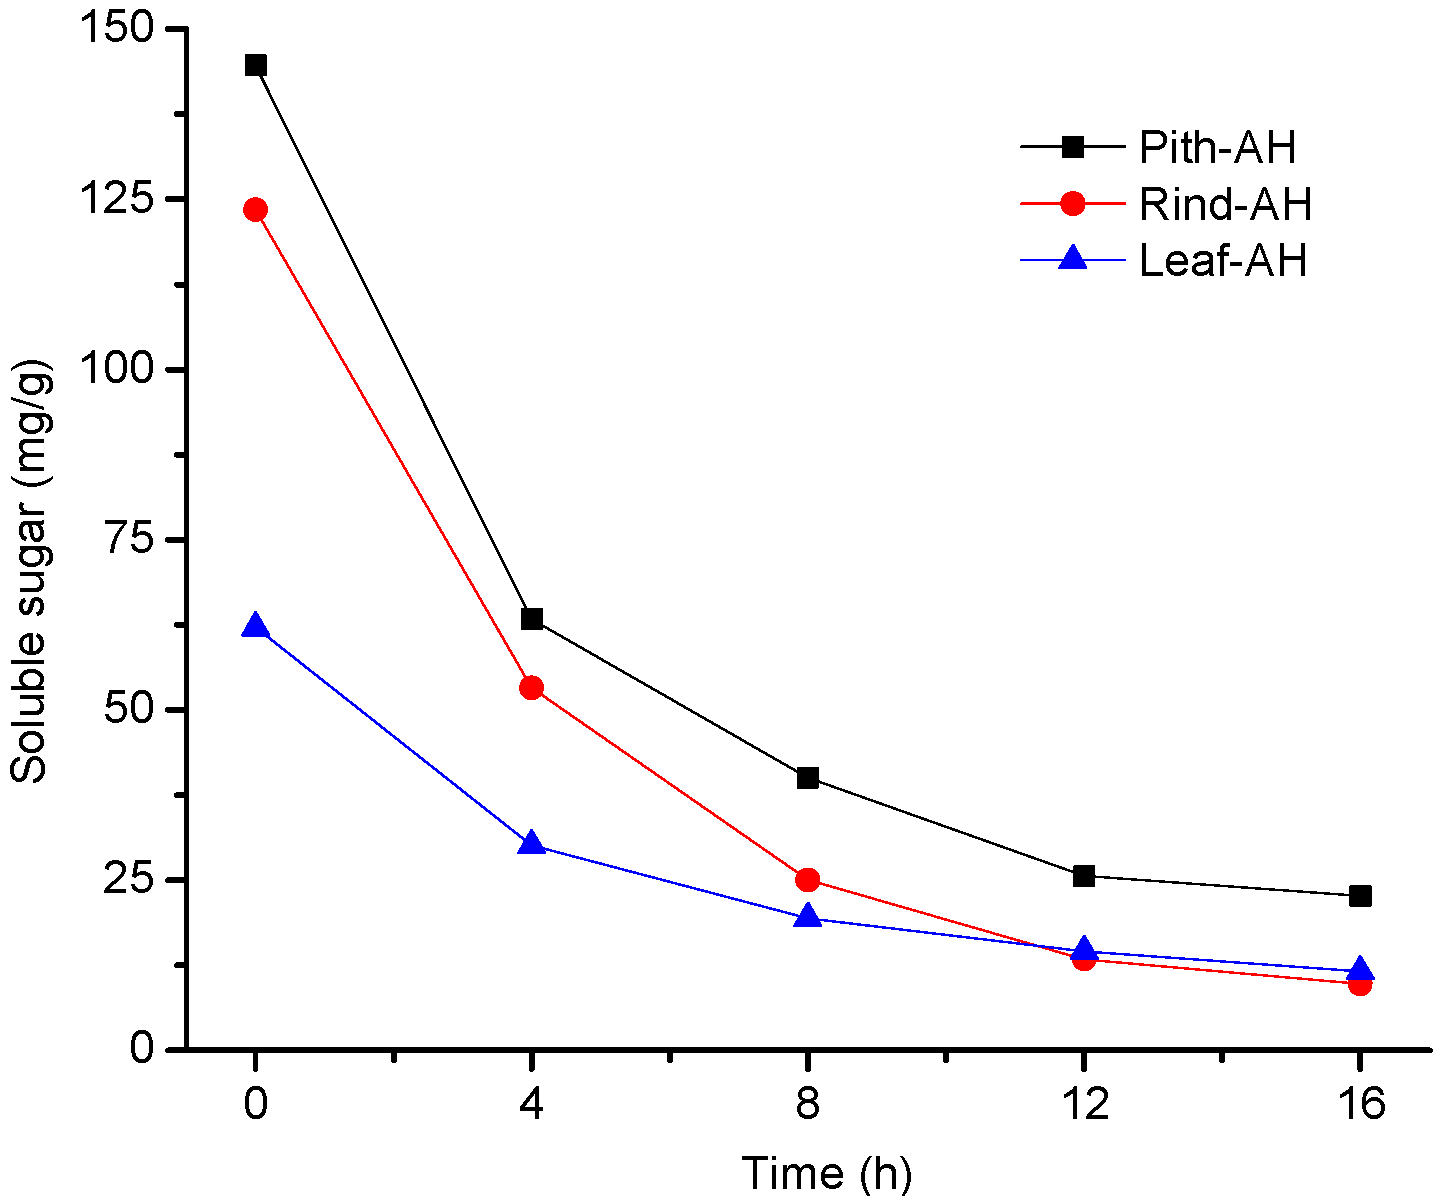
3.1.2. Soluble Sugars

The chemical properties of the materials transported in the phloem in various parts of the corn stover lead to different levels of soluble sugars in the parts. Among them, sucrose is the main form of carbohydrate transported in the phloem and has a high water solubility and high transport rate [32]. Table 1 shows that the soluble sugar content of the pith was the highest, higher than that of the leaf by 57% and that of the rind by 15%. Figure 3 shows that 4 h after start of the hydrolysis, the soluble sugar content dropped sharply. This occurred because the stover was completely soaked and swelled, causing the cell wall, which is made of cellulose, to rupture and rapidly release or precipitate the easily degradable soluble sugars. Variations in the tissue structure and different lignocellulose contents in various parts of the stover led to different release rates of soluble sugars from different stover parts. After 8 h of hydrolysis, 72.22%, 79.32%, and 68.81% of the soluble sugar were released from the pith, rind, and leaf, respectively, into the hydrolysis liquor. The release of a large amount of sugars provided an adequate substrate for various microorganisms, and some of the sugars were converted to alcohols, as shown in Figure 3. During 12–16 h of hydrolysis, the release rate of soluble sugars was low, and the soluble sugars released from the pith, rind, and leaf accounted for 84.73%, 92.08%, and 81.38% at 16 h of hydrolysis, respectively.

3.1.3. Lignocellulose

The tissue structures of the various parts of the corn stover varied significantly in morphology, chemical composition and density. Table 1 shows that the lignin content of the rind was the highest, more than those of the leaf and pith by 47%, but the ash content was low. The manual harvesting of the standing stover avoided the contamination of soil (ash) particles, so the ash content indicated the level of inorganic components incorporated into the cell walls of various tissues. The content of hemicellulose in the leaf was the highest, and those of the rind and pith were similar. The ash content of the leaf was also the highest, indicating that the content of inorganic components in the leaf was high, which is consistent with the results of Zeng et al. [25].
The degradation rates of the lignocellulose of the various parts gradually increased with the hydrolysis time. The external parts of the cellulose in the stover were entangled with the covalently linked hemicellulose and lignin, making it difficult for the enzyme molecules to access the cellulose during anaerobic fermentation, thereby reducing its utilization [15]. Figure 4 shows that with the same hydrolysis time, the degradation rates of the hemicellulose of the rind and pith were higher than those of cellulose and lignin, while the degradation rate of the hemicellulose of the leaf was similar to that of cellulose. This is mainly because in the parenchyma cells, mesophyll cells (with concentrated carbon dioxide), and bundle sheath cells (in which photosynthesis takes place) of the leaf, serious lignification was absent, making it easier for molecular oxygen to react with the side chain groups of the lignin to change the lignin structure and expose more cellulose to the degrading enzymes in AH [25]. Therefore, after 16 h of hydrolysis, the lignin degradation rate of the leaf was the highest, 4.90%, which was higher than that of the pith (4.20%) and rind (3.91%). After 8 h of AH, the hemicellulose degradation rates of the various parts were similar; however, after 16 h of AH, the hemicellulose degradation rate of the pith was the highest, 26.29%, which was higher than that of the rind by 7.6 percentage points, indicating that the differences in the tissue structure and composition of the various parts of the corn stover lead to differences in the effectiveness of the AH and that a suitable hydrolysis time can reduce the cost of enzymatic hydrolysis and energy consumption as well.

3.1.4. FTIR Analysis

Figure 5 shows that the FTIR spectra of the various parts of the corn stover with different hydrolysis times were similar, exhibiting absorption peaks at 3408, 2923, 1735, 1605, 1515, 1426, 1375, 1243, 1036 and 899 cm−1. In the IR spectra of the various hydrolysis samples, no new absorption peaks were present, indicating that no new functional groups were generated during the hydrolysis process, and only the intensities of certain absorption peaks changed. The peak intensities of all hydrolysis samples at 1735 cm−1 gradually decreased with the hydrolysis time, and the peaks tended to disappear, indicating that a large amount of hemicellulose in the stover was hydrolyzed and that the ester bonds of the carbonyl esters formed by the non-binding carbonyl bond C=O in the lignin or hemicellulose of the various parts of the corn stover are susceptible to hydrolyzing enzymes and degradation. After 4 h of AH, the intensities of the characteristic peaks of the leaf decreased significantly, which was in line with the degradation rate of hemicellulose in AH described above.
Figure 5 also shows that peaks at 1245–950 cm−1 exhibited a gradually decreasing tendency in the hydrolysis process, indicating that the C-O bonds of the lignin in the samples also broke up, which occurred most profoundly in the pith, followed by the rind and leaf, resulting from their different structures [25]. The peaks at 1426, 1375, 1321, 1162, 1036, and 899 cm−1 were typical characteristic peaks of cellulose and slightly decreased in intensity with the hydrolysis time but did not disappear, indicating that during the enzymatic hydrolysis process, the structure of the cellulose macromolecules also changed. The peak at 3408 cm−1 represented the stretching vibration of the hydroxyl groups of cellulose and hemicellulose and the hydroxyl groups of the adsorbed water, and the intensities of this peak in the hydrolyzed samples of various stover parts varied with the hydrolysis time. After 4 h of hydrolysis, the intensities of the peaks of all the samples increased slightly, and after 8–16 h, they gradually decreased. In the early stage of hydrolysis, the cellulose and hemicellulose absorbed water and swelled, and water molecules entered the fiber and formed hydrogen bonds with fiber molecules [33,34], thus increasing the peak intensity. With the infiltration of cellulose hydrolase molecules, some absorbed water molecules were replaced. Hydrogen bonds formed between the cellulose molecular chains and water molecules broke up, resulting in gradually weakening absorption peaks at this position, indicating that the action of water molecules can make the cellulose and hemicellulose swell, which plays an important role in improving the degradability of stover. For details, see the gas production characteristics section.

3.2. Anaerobic Fermentation Stage

3.2.1. Changes in the Scum Layer

The changes in the scum layer of the various treatment groups in the process of anaerobic fermentation are shown in Figure 6. The structural differences between the various stover parts led to a large variation in the thickness of the scum layer. Figure 6a,c show that the thicknesses of the scum layers of the leaf and pith of the untreated group assumed the trend of increasing first and then decreasing, while that of the rind assumed the trend of increasing first and then decreasing sharply (Figure 6b), but the thickness of the scum layer ultimately stabilized. This is because in the first two days of fermentation, the substrates were afloat. The flocculent content of the stover absorbed water and swelled, and the floating stover particles interfered with each other, forming a distinct interface layer in the fermenter in which the scum layer stayed afloat. From Day 3 until the stabilization of the scum layer, it entered the compressing and floating stage, in which the scum layer was no longer floating, and the buoyancy generated from the escaped biogas squeezed the pore water from the stover particles and compressed the scum layer from the bottom up. Meanwhile, smaller stover particles had a large accessible surface area, which increased the water absorption capacity and the density as well, and when the weight of the layer was equal to the buoyancy, the layer was adrift or sunken, continuously reducing the thickness of the scum layer. To facilitate the methane production from fermentation, the fermenter was agitated twice per day, through which the thicknesses of the scum layers from the rind, pith and leaf were decreased by 64.3%, 73.6% and 64%, respectively. If fermented statically, the thickness of the scum layer was only reduced by 22.5% [35]. The results of this study indicated that proper agitation can effectively reduce the thickness of the scum layer.
Figure 6 shows that the thicknesses of the scum layers of the AH treatment groups were significantly lower than that of the untreated group, indicating that in the AH process, the hydrolysis temperature of 45 °C, the timely aeration, and the timed agitation increased the water absorption rate of the substrate, so that the adsorbed water can quickly penetrate into the cellulose to cause it to swell and the overall density to increase to reach the state of water adsorption saturation [33]. The mobility of the microorganisms was also improved, while the local precipitation of nutrients or uneven water absorption was avoided, enabling the maximum enzymatic hydrolysis of organic matter. Other aerobic microorganisms with a high reproduction ability clung to the surface of the substrate through viscous substances such as extracellular polymers to form biofilms, which absorbed or enzymatically digested the soluble nutrients in the stover, while the precipitated soluble substances increased the porosity of the particles, which improved the accessibility for the microorganisms. With the increased aeration time, the viscous substances on the particle surface increased and adsorbed a plurality of substances during the anaerobic fermentation process, which, coupled with the viscosity of the fermentation broth, caused the density of the stover particles to further increase, making the particles become suspended or sink in the fermentation broth [20]. For the above reasons, the rind and leaf particles of the corn stover were able to reach their respective saturated water contents in a short time, which increased their own weights, so they became suspended or sank in the fermentation broth. Therefore, in the early stage of the anaerobic fermentation of the rind and leaf, the scum layer barely existed; as the fermentation progressed, only a small amount of the substrate floated, and after 12 h of AH, the thicknesses of the thickest scum layers of rind and leaf were only 7.1% and 13.6%, respectively, of that of the untreated group, indicating that the change in the thickness of the scum layer can be regarded as an outcome of the aerobic pretreatment. Due to its physical structure characteristics, the highly water-absorbent pith tended to aggregate, leading to very large particles that were unable to reach maximum water saturation in a short time, and the thickness of the scum layer gradually decreased with the time of AH. After 12 h of AH, 53.8% of the pith was suspended or sunken in the anaerobic fermentation broth. It is possible for the pith to achieve the thickness of the scum layer of the rind or leaf with a long AH, although too long an AH is not able to improve the methane production [23].

3.2.2. Cumulative Yield of Methane

The cumulative production of methane is an important indicator for the effectiveness of biogas production from stover through anaerobic fermentation. In this study, changes in the cumulative methane yield were fitted using the Gompertz and first-order equation models. Table 2 shows that the R2 values were all higher than 0.98, indicating that the models can accurately reflect the changes in the cumulative gas production rate during fermentation. Both models indicated that AH is beneficial to improving the methane production and shortening the gas production cycle of anaerobic fermentation. The lag period refers to the time it takes for methane to be produced in the anaerobic fermentation process (the startup time of the system). Table 2 shows that the groups with the AH treatment all had a short lag time, suggesting that the effect of AH on methane production is exerted in the AH stage. Among them, the pith had the most profound variation in the lag time, followed by the leaf, which was also confirmed through the analyses of the pH and VFAs. The kH constant of each AH treatment group was also superior to that of the control (0 h), indicating that the aerobic treatment accelerated the rate of hydrolysis in the fermentation process and undermined the dense structure of lignocellulose to some extent, so that the organic substrates that underwent aerobic treatment were more readily utilized by microorganisms. The leaf had the most profound variation in the kH constant, and the high nitrogen content in the leaf was conducive to microbial growth and reproduction, which can accelerate the hydrolysis rate and shorten the lag period [36].
The values predicted by the Gompertz model were closer to the actual cumulative methane gas production rates, with smaller errors, indicating that this model can simulate the methane production very well. Figure 7 shows that the cumulative production of methane of the AH treatment group was significantly higher than that of the control (0 h), and compared with that of the control, the cumulative methane yields of the rind after 4 h, 8 h, 12 h, and 16 h of AH were increased by 4.08%, 28.62%, 30.05% and 20.92%, respectively, and those of the pith were increased by 17.14%, 26.23%, 35.02% and 29%. However, those of the leaf had little variation and only increased by 8.9% after 8 h of AH, but with a higher maximum gas production rate Rm than those of the control, rind and pith, indicating that the leaf has a shorter fermentation cycle and is relatively easily degradable [37]. This is because the sedimentation performance of the various parts of the corn stover increases by AH, resulting in a decline in thickness of the upper scum layer of the fermentation liquor (Figure 6), and more substrates are in contact with the lower layer of high-density anaerobic bacteria. The generated biogas is released from the thin scum layer to the air chamber in time to reduce the biogas partial pressure of the fermentation liquor. At the same time, AH increases the degradation rate of lignin, increases the porosity of pith, rind and leaf, making it easier for microorganisms to enter the interior, increasing gas production rate and methanogenic capacity.
The maximum methane yields of the rind and pith after 12 h of AH were 251 mL g−1VS and 323 mL g−1 VS, indicating that the maximum gas production rate Rm is also higher than those of the other groups. In the period from 12 h to 16 h, little change in the soluble organic matter was observed, while the easily utilized solid organic substances could still be converted through aerobic respiration. Some organic substances that can be used for methane production were consumed, leading to decreased methane production at 16 h in the AH treatment group. Therefore, it is disadvantageous to increase the gas production by the long-term AH of the substrate, and a suitable AH time is beneficial to improving the economy and efficiency of the fermentation process. Under the conditions of this experiment, an AH time of 12 h was the most appropriate for the rind and pith, and 8 h was appropriate for the leaf. It is generally considered that when the cumulative gas production reaches more than 90% of the total gas production (T90), the fermentation is complete [38,39]. In the present study, after 8–12 h of AH, the gas production cycle of T90 in all parts of the stover was 8–9 days through Gompertz model analysis. Compared with that of the control group, the gas production cycle was reduced by 4–5 days (Table 2), indicating that the biodegradation rate of the substrate was increased.
Mechanical crushing of stover was a pretreatment method during anaerobic fermentation. Compared with chopped samples, fine crushing reduced the grain size of stover and increased the contact area of microbial reaction, which increased gas production to some extent, but had little impact on the scum layer [40]. However, after AH pretreatment, the methane production of various parts of stover increased significantly, and the sedimentation performance of rind and leaf achieved a better level namely, the scum layer obviously thinned or even disappeared. Moreover, due to the loose structures of pith can be changed to some extent via AH the thickness and sedimentation performance of pith scum layer was shown an improved trend with prolonged hydrolysis time, but excessive hydrolysis time simultaneously reduced the biogas production rate. Therefore, finding effective pretreatment methods, such as mashing or compact-shape, to further destroy the loose structure of the pith would be the focus of future research. At the same time, particle size directly affects the water absorption performance of stover, specific surface area and microbial reaction contact area, so the influence of particle size on AH gas production and sedimentation performance required further research, and the process parameters need to be further optimized based on energy consumption and cost.

4. Conclusions

(1) After 8 h of AH, the acetic acid contents of the various parts of corn stover that can be consumed by methanogenic microorganisms accounted for more than 60% of the total amount of VFAs and ethanol. The propionic acid concentration remained unchanged during the same period of AH.
(2) AH significantly broke down the lignin structure of corn stover. After 16 h of hydrolysis, the lignin degradation rates of the pith, rind and leaf were 4.2%, 3.91% and 4.9%, respectively. AH effectively promoted the hydrolysis of cellulose, and the cellulose degradation rates of the pith, rind and leaf were 17.69%, 14.49% and 22.59%, respectively, indicating that differences in the tissue structures and compositions of various parts of the corn stover directly affect the degradation of cellulose.
(3) The AH pretreatment of the stover could effectively reduce the thickness of the scum layer during anaerobic fermentation, and it gradually decreased with the AH time. After 12 h of AH, the thicknesses of the thickest scum layers of the rind and leaf were only 7.1% and 13.6%, respectively, of the thickness of the untreated group, while the thickness of the thickest scum layer of the pith was 18% of that of the untreated group after 16 h of AH.
(4) The aerobic-anaerobic two-phase fermentation process significantly increased the cumulative methane yields of various parts of the corn stover. The optimal AH time for the rind and pith of the corn stover was 12 h, which increased their cumulative methane yields by 30.05% and 35.02%, respectively, while that for the leaf was 8 h, which was able to increase its cumulative methane yield by 8%. At the same time, the fermentation cycle of T90 was 8–9 days, reduced by 4–5 days relative to that of the control group, and the degradation rate of the substrates was improved.

Author Contributions

B.Z. and W.L. conceived and designed the experiments; B.Z., X.X., P.L. and N.L. performed the experiments; X.X., H.Z. and Y.S. contributed reagents/materials/analysis tools; B.Z. analyzed the data and wrote the paper.

Acknowledgments

This work was supported by the Harbin special fund for scientific and technological innovation talents research project (2016RAXXJ009), the Youth Science Foundation of Heilongjiang Province (QC2016033), and the Training Project of Heilongjiang Bayi Agricultural University (XZR2017-09).

Conflicts of Interest

The authors declare no conflict of interest.

References

  1. Li, L.; Li, X.; Zheng, M. Influence on inoculum sources on the anaerobic digestion of corn stover. In Proceedings of the International Conference on Biomass Energy Technologies, Guangzhou, China, 3–5 December 2008; pp. 459–463. [Google Scholar]
  2. Guo, P.; Mochidzuki, K.; Cheng, W.; Zhou, M.; Gao, H.; Zheng, D.; Wang, X.; Cui, Z. Effects of different pretreatment strategies on corn stalk acidogenic fermentation using a microbial consortium. Bioresour. Technol. 2011, 102, 7526–7531. [Google Scholar] [CrossRef] [PubMed]
  3. Pei, J.C. Plant fiber chemistry; China Light Industry Press: Beijing, China, 2012. [Google Scholar]
  4. Parawira, W.; Murto, M.; Zvauya, R.; Mattiasson, B. Anaerobic batch digestion of solid potato waste alone and in combination with sugar beet leaves. Renew. Energy 2004, 29, 1811–1823. [Google Scholar] [CrossRef]
  5. Chen, L.; Zhao, L.X.; Dong, B.C.; WAN, X.C.; GAO, X.X. The status and trends of the development of biogas plants for crop straws in China. Renew. Energy Resour. 2010, 2010, 145–162. [Google Scholar]
  6. Cui, W.W.; Liang, J.F.; Du, L.Z.; Zhang, K.G. The current situation and problems of the large-scale biogas plants for straw in China. Chin. Agric. Sci. Bull. 2013, 29, 121–125. [Google Scholar]
  7. Appels, L.; Baeyens, J.; Degrève, J.; Dewil, R. Principles and potential of the anaerobic digestion of waste—Activated sludge. Prog. Energy Combust. Sci. 2008, 34, 755–781. [Google Scholar] [CrossRef]
  8. Yang, D.Y.; Pang, Y.A.; Yuan, H.R.; Chen, S.L.; Ma, J.W.; Yu, L.; Li, X.J. Enhancing biogas production from anaerobically digested wheat straw through ammonia pretreatment. Chin. J. Chem. Eng. 2014, 22, 576–582. [Google Scholar] [CrossRef]
  9. Zhao, C.; Shao, Q.; Ma, Z.; Li, B.; Zhao, X. Physical and chemical characterizations of corn stalk resulting from hydrogen peroxide presoaking prior to ammonia fiber expansion pretreatment. Crops Prod. 2016, 83, 86–93. [Google Scholar] [CrossRef]
  10. Hassan, M.; Ding, W.; Bi, J.; Mehryar, E.; Talha, Z.A.A.; Huang, H. Methane enhancement through oxidative cleavage and alkali solubilization pre-treatments for corn stover with anaerobic activated sludge. Bioresour. Technol. 2016, 200, 405–412. [Google Scholar] [CrossRef]
  11. Taherzadeh, M.J.; Karimi, K. Pretreatment of lignocellulosic wastes to improve ethanol and biogas production: A review. Int. J. Mol. Sci. 2008, 9, 1621–1651. [Google Scholar] [CrossRef]
  12. Hendriks, A.T.W.M.; Zeeman, G. Pretreatments to enhance the digestibility of lignocellulosic biomass. Bioresour. Technol. 2009, 100, 10–18. [Google Scholar] [CrossRef]
  13. Liu, C.; Sun, Y.; Yang, F.; Liu, J. Effect of solar irradiance on photo biochemical transformation process of direct absorption methane digester. Energy Convers. Manag. 2018, 172, 173–181. [Google Scholar] [CrossRef]
  14. Fu, S.F.; He, S.; Shi, X.S.; Katukuri, N.R.; Dai, M.; Guo, R.B. The chemical properties and microbial community characterization of the thermophilic microaerobic pretreatment process. Bioresour. Technol. 2015, 198, 497–502. [Google Scholar] [CrossRef] [PubMed] [Green Version]
  15. Wang, F.Q.; Xie, H.; Chen, W.; Wang, E.T.; Du, F.G.; Song, A.D. Biological pretreatment of corn stover with ligninolytic enzyme for high efficient enzymatic hydrolysis. Bioresour. Technol. 2013, 144, 572–578. [Google Scholar] [CrossRef] [PubMed]
  16. Wagner, A.O.; Schwarzenauer, T.; Illmer, P. Improvement of methane generation capacity by aerobic pre-treatment of organic waste with a cellulolytic Trichoderma viride culture. J. Environ. Manag. 2013, 129, 357–360. [Google Scholar] [CrossRef] [PubMed]
  17. Satjaritanun, P.; Khunatorn, Y.; Vorayos, N.; Shimpalee, S.; Bringley, E. Numerical analysis of the mixing characteristic for napier grass in the continuous stirring tank reactor for biogas production. Biomass Bioenergy 2016, 86, 53–64. [Google Scholar] [CrossRef]
  18. Kaparaju, P.; Angelidaki, I. Effect of temperature and active biogas process on passive separation of digested manure. Bioresour. Technol. 2008, 99, 1345–1352. [Google Scholar] [CrossRef] [PubMed]
  19. Hill, D.T.; Bolte, J.P. Methane production from low solid concentration liquid swine waste conventional anaerobic fermentation. Bioresour. Technol. 2000, 74, 241–247. [Google Scholar] [CrossRef]
  20. Li, S.; Mei, Z.; Liu, P.; Xi, J.; Kong, C. Harmfulness of Scum in the Corn Straw Fermentation and Influence Factors of Scum Forming. China Biogas 2015, 33, 42–44. [Google Scholar]
  21. Li, W.; Ding, Q.; Wei, D.; Luo, W.; Wang, Q.; Wang, J. Aerobic and Anaerobic Two-phase Fermentation Process and Biogas Production Characteristic of Rice Straw. Trans. Chin. Soc. Agric. Mach. 2016, 47, 150–157. [Google Scholar]
  22. Ramos, I.; Fdz-Polanco, M. The potential of oxygen to improve the stability of anaerobic reactors during unbalanced conditions: Results from a pilot-scale digester treating sewage sludge. Bioresour. Technol. 2013, 140, 80–85. [Google Scholar] [CrossRef]
  23. Ma, Y.; Li, W.; Luo, L.; Zhang, H.; Li, P.; Zhang, X.; Xu, X.; Zhang, B. Effects of Aerobic Pre-Treatment on Anaerobic Batch Digestion of Corn Straw. Biobased Mater. Bioenergy 2017, 11, 622–628. [Google Scholar] [CrossRef]
  24. Hu, Y.; Pang, Y.; Yuan, H.; Zou, D.; Liu, Y.; Zhu, B.; Chuf, W.A.; Jaffar, M.; Li, X. Promoting anaerobic biogasification of corn stover through biological pretreatment by liquid fraction of digestate (LFD). Bioresour. Technol. 2015, 175, 167–173. [Google Scholar] [CrossRef] [PubMed]
  25. Zeng, M.; Ximenes, E.; Ladisch, M.R.; Mosier, N.S.; Vermerris, W.; Huang, C.P.; Sherman, D.M. Tissue-specific biomass recalcitrance in corn stover pretreated with liquid hot-water:enzymatic hydrolysis (part 1). Biotechnol. Bioeng. 2012, 109, 398–404. [Google Scholar] [CrossRef] [PubMed]
  26. Van Soest, P.J.; Robertson, J.B.; Lewis, B.A. Methods for dietary fiber, neutral detergent fiber, and nonstarch polysaccharides in relation to animal nutrition. J. Dairy Sci. 1991, 74, 3583–3597. [Google Scholar] [CrossRef]
  27. Kafle, G.K.; Kim, S.H. Kinetic study of the anaerobic digestion of swine manure at mesophilic temperature: A lab scale batch operation. J. Biosyst. Eng. 2012, 37, 233–244. [Google Scholar] [CrossRef]
  28. Benbelkacem, H.; Bayard, R.; Abdelhay, A.; Zhang, Y.; Gourdon, R. Effect of leachate injection modes on municipal solid waste degradation in anaerobic bioreactor. Bioresour. Technol. 2010, 101, 5206–5212. [Google Scholar] [CrossRef] [PubMed]
  29. Díaz, I.; Donoso-Bravo, A.; Fdz-Polanco, M. Effect of microaerobic conditions on the degradation kinetics of cellulose. Bioresour. Technol. 2011, 102, 10139–10142. [Google Scholar] [CrossRef] [PubMed]
  30. Wu, C.; Zhou, Y.; Wang, P.; Guo, S. Improving hydrolysis acidification by limited aeration in the pretreatment of petrochemical wastewater. Bioresour. Technol. 2015, 194, 256–262. [Google Scholar] [CrossRef] [PubMed]
  31. Jagadabhi, P.S.; Kaparaju, P.; Rintala, J. Effect of micro-aeration and leachate replacement on COD solubilization and VFA production during mono-digestion of grass-silage in one-stage leach-bed reactors. Bioresour. Technol. 2010, 101, 2818–2824. [Google Scholar] [CrossRef] [PubMed]
  32. Cai, D.; Li, P.; Luo, Z.; Qin, P.; Chen, C.; Wang, Y.; Wang, Z.; Tan, T. Effect of dilute alkaline pretreatment on the conversion of different parts of corn stalk to fermentable sugars and its application in acetone-butanol-ethanol fermentation. Bioresour. Technol. 2016, 211, 117–124. [Google Scholar] [CrossRef]
  33. Carrillo, F.; Colom, X.; Sunol, J.J.; Saurina, J. Structural FTIR analysis and thermal characterisation of lyocell and viscose-type fibres. Eur. Polym. J. 2004, 40, 2229–2234. [Google Scholar] [CrossRef]
  34. Luo, Z.; Li, P.; Cai, D.; Chen, Q.; Qin, P.; Tan, T.; Cao, H. Comparison of performances of corn fiber plastic composites made from different parts of corn stalk. Ind. Crops Prod. 2017, 95, 521–527. [Google Scholar] [CrossRef]
  35. Xiong, X.; Shi, G.Z.; Mei, Z.L.; Kong, C.X. Influence of Different Corn stalk Particle-size on Scum Crusting in Anaerobic Fermentation. China Biogas 2017, 35, 56–61. [Google Scholar]
  36. Zhang, J.; Wang, Y.H.; Qu, Y.S.; Wei, Q.Y.; Li, H.Q. Effect of the organizational difference of corn stalk on hemicellulose extraction and enzymatic hydrolysis. Ind. Crops Prod. 2018, 112, 698–704. [Google Scholar] [CrossRef]
  37. Chen, H.; Li, H.; Liu, L. The inhomogeneity of corn stover and its effects on bioconversion. Biomass Bioenergy 2011, 35, 1940–1945. [Google Scholar]
  38. Zhang, B.; Jiang, T.; Gao, L.; Wei, X.; Liu, K.; Yang, X. Aerogenesis characteristics of swine feces mixed with corn straw under mesophilic fermentation. Chin. J. Environ. Eng. 2014, 8, 4991–4997. [Google Scholar]
  39. Zhong, W.; Zhang, Z.; Luo, Y.; Sun, S.; Qiao, W.; Xiao, M. Effect of biological pretreatments in enhancing corn straw biogas production. Bioresour. Technol. 2011, 102, 11177–11182. [Google Scholar] [CrossRef]
  40. Xiao, X.; Zhang, R.; He, Y.; Li, Y.; Feng, L.; Chen, C.; Liu, G. Influence of particle size and alkaline pretreatment on the anaerobic digestion of corn stover. Bioresources 2013, 8, 5850–5860. [Google Scholar] [CrossRef]
Figure 1. Schematic diagram of aerobic and anaerobic experimental device.
Energies 12 00381 g001
Figure 2. Changes in pH and volatile fatty acids (VFAs) of various parts of stover with hydrolysis time.
Energies 12 00381 g002
Figure 3. Changes of soluble sugars in various stover parts with hydrolysis time.
Energies 12 00381 g003
Figure 4. Changes in lignocellulose degradation rates of various parts of corn stover with aerobic hydrolysis (AH) time.
Energies 12 00381 g004
Figure 5. FTIR spectra of various parts of corn stover with different hydrolysis times.
Energies 12 00381 g005
Figure 6. Changes in the scum layer of various stover parts. Note: (ac) are expressed as pith, rind and leaf.
Energies 12 00381 g006
Figure 7. Cumulative methane yields of various stover parts under different treatments. The points represent the experimental measurements, and the lines are the fitted curves. Note: (a,c,e) are the Gompertz fitting curves; (b,d,f) are First-order fitting curves.
Energies 12 00381 g007
Table 1. Properties of various parts of corn stover and inoculum.
ParametersUnitsPithRindLeafInoculum
Total solids (TS)%94.14 ± 0.6593.41 ± 0.5593.08 ± 0.441.78 ± 0.22
Volatile solids (VS)%90.14 ± 0.5990.46 ± 0.7884.98 ± 0.260.98 ± 0.13
Carbon (C)%40.05 ± 0.0542.06 ± 0.0640.28 ± 0.0730.04 ± 0.04
Nitrogen (N)%0.51 ± 0.010.61 ± 0.010.95 ± 0.022.55 ± 0.10
pH----7.29 ± 0.01
Ash%3.73 ± 0.153.2 ± 0.038.26 ± 0.25-
Soluble sugarmg/g144.67 ± 2.05123.49 ± 2.3662.10 ± 1.45-
Cellulose %TS23.44 ± 0.19 c33.20 ± 0.15 a25.12 ± 0.13 b 15.55 ± 0.06
Hemicellulose %TS24.54 ± 0.30 b22.73 ± 0.29 c32.05 ± 0.25 a8.73 ± 0.22
Lignin %TS5.30 ± 0.09 b7.85 ± 0.07 a5.35 ± 0.06 b 12.9 ± 0.21
Notes: %: Content of fresh matter; mg/g: Content of dry matter weight; -: not determined. Values are expressed as means ± standard deviations (n = 3). Mean values denoted by different letters differ significantly at p < 0.05.
Table 2. Fittings of cumulative methane production in various parts of corn stover.
Hydrolysis TimeGompertzFirst-Order
P (mLg−1VS)Rm (mLg−1VS d) λ (d)R2T90 (d)B (mL g−1VS)kH (d−1)Lp (d)R2
Pith-AH-0h239.80 ± 2.1929.10 ± 1.081.62 ± 0.160.995512260.45 ± 7.270.15 ± 0.011.39 ± 0.170.9819
Pith-AH-4h280.89 ± 2.8830.54 ± 1.261.05 ± 0.200.993010295.01 ± 2.810.17 ± 0.010.82 ± 0.080.9967
Pith-AH-8h302.69 ± 1.4751.84 ± 1.490.80 ± 0.090.99739312.07 ± 4.550.26 ± 0.021.05 ± 0.120.9834
Pith-AH-12h323.77 ± 1.5656.81 ± 1.700.74 ± 0.090.99698331.17 ± 2.580.28 ± 0.010.94 ± 0.070.9939
Pith-AH-16h309.34 ± 3.2449.66 ± 3.180.24 ± 0.220.98428315.55 ± 2.080.28 ± 0.010.75 ± 0.060.9952
Rind-AH-0h193.36 ± 2.8220.21 ± 1.051.06 ± 0.250.989713208.35 ± 4.950.15 ± 0.011.16 ± 0.150.9875
Rind-AH-4h201.24 ± 2.3327.98 ± 1.740.80 ± 0.240.98499206.30 ± 1.620.24 ± 0.010.77 ± 0.070.9951
Rind-AH-8h248.70 ± 2.7439.27 ± 2.620.72 ± 0.230.98298253.84 ± 1.710.28 ± 0.010.74 ± 0.060.9951
Rind-AH-12h251.00 ± 1.3143.81 ± 1.410.73 ± 0.100.99638256.87 ± 1.990.28 ± 0.010.94 ± 0.070.9941
Rind-AH-16h233.82 ± 1.0740.34 ± 1.100.76 ± 0.080.99758240.91 ± 3.540.26 ± 0.021.05 ± 0.120.9829
Leaf-AH-0h242.78 ± 1.5530.56 ± 0.821.75 ± 0.110.997713263.58 ± 8.800.15 ± 0.021.35 ± 0.210.9736
Leaf-AH-4h241.26 ± 0.7639.74 ± 0.750.57 ± 0.060.99879246.64 ± 2.180.27 ± 0.010.84 ± 0.080.9924
Leaf-AH-8h264.39 ± 1.3251.68 ± 1.790.57 ± 0.100.99578268.94 ± 1.610.33 ± 0.010.83 ± 0.050.9951
Leaf-AH-12h245.28 ± 1.4256.66 ± 2.580.52 ± 0.110.99268248.20 ± 1.000.40 ± 0.010.80 ± 0.040.9970
Leaf-AH-16h231.23 ± 1.5159.65 ± 3.330.48 ± 0.120.99037233.47 ± 0.840.46 ± 0.010.76 ± 0.030.9971
Notes: T90 is duration for approximately 90% of methane production.

