1. Introduction
Conventional energies have been a suitable and expedient form of technology to adopt as a primary source of energy. This is because of their simplicity and ease of availability and adoption. Compared to alternate energies, several negative aspects oppress conventional energy adoption. The escalating global population, persistent struggle to meet the growing energy demand, global awareness of mitigating greenhouse gas (GHG) emissions, and the volatile energy market have now accentuated the focus on the Renewable Energy System (RES) [
1,
2]. A previous study has suggested that there is going to be an energy deficit of more than 1000 EJ by the end of 2050 globally [
3]. In this scenario, RE would be a suitable option to address the aforementioned disadvantages of the conventional energies and can substitute the available conventional energy sources gradually over time. The energy scenario of 2040 forecasts shows that RE will have approximately half of its share in energy supply, with significant developments in photovoltaics and wind energies, in addition to biomass [
4]. Therefore, RE would slowly encroach upon the conventional energies position sooner. Highlighting this scenario, governments across the globe are forceful in contributing their share of RE. Many countries like Germany, Spain, Denmark, and the US are precursors, with significant contributions in RE share through effective energy policies [
5].
With the advancement in RE technology, there is a continuing emphasis on RES replacing conventional energies [
6] in the distributed generation units (DG) in micro-grids [
7,
8]. Due to the stochastic nature of RE, more than one RE source is employed in DG. Thus, the term Hybrid Renewable Energy System (HRES) is coined. HRES is either connected with the storage units like batteries in the stand-alone mode of operation or directly connected to the electricity grid. The stand-alone systems have commonly been used to provide electricity to remote communities which lack grid access [
9]. In locations where grid access is available, the purpose of RE integration as an alternate means has set in. In this regard, the governments of individual countries, including India, are striving to achieve RE adoption through a set of targets [
10,
11]. Many countries are encouraging their citizens to adopt RE through energy policies and Feed-in-tariffs (FiTs), and by providing rebates on RE technologies like solar panels and Wind Turbines (WT), to name a few. These small shares of an individual or a group of communities’ contribution initiate bigger impacts on the county’s drive for RE adoption.
TBL is a type of accounting framework that includes factors other than just financial ones, such as environmental and social factors. This is different from any traditional reporting framework as it includes social and environmental (or ecological) parameters, which are difficult to measure. The TBL dimensions are also referred to as 3P’s, which stands for Plane, People, and Profits [
12]. The current study forms a paradigm for RE adoption. Focusing on RE adoption in a small community in India, the advantages and disadvantages of RE adoption for the present Indian scenario are studied. The study highlights the hurdles of RE adoption through a method called TBL. There are many studies in the literature focusing on the techno-economic aspects of RE adoption [
13,
14,
15]. This study is novel in focusing on the social aspect, along with the techno-economic scenario, of RE energy adoption. The social factors highlighted in this study include the job provision factor, making this study unique compared to existing studies presented in the literature. The iHOGA software tool has been chosen in this regard to perform the sizing and to further execute TBL analysis for various practical scenarios. iHOGA has the unique feature of Human Development Index (HDI) and job criteria calculations for any given scenario compared to the vastly explored software like HOMER (v 3.11.2, NREL, USA). Such distinctive features of iHOGA software have remained unexplored in the literature.
2. Energy Status of India
India, with its developing economy, represents the sixth-largest economy by nominal Gross Domestic Product (GDP) and the third largest by purchasing power parity (PPP) [
16]. India is already confronting the crucial issue of population explosion and at the current rate, could surpass China by 2050. Regardless, India is keen to focus on the overall development, with its energy sector taking a prime status, with a more significant emphasis on environmental sustainability. This has made India prioritize the RE sector, particularly solar and wind energy. In this aspect, there has been considerable progress in the installed power capacity, from 30,000 MW to 126,990 MW (until 2011). Coal contributes to about half of the energy mix in the country, which has resulted in it becoming the second largest coal producer in the world. India is the third largest electricity producer globally, succeeding China and the USA, and the seventh largest producer of RE in the world [
17]. Studies suggest that by 2020, India will have become the world’s largest coal importer, overtaking Japan, the EU, and China, and its oil import dependence will escalate to beyond 90% by 2040. India is the sixth largest energy consumption country in the world; its energy predominantly comes from poor quality and less efficient coal (comprised of more than 40% ash content).
CO
2 emissions increased 2.5 times in India between 1990 and 2014, even though the per-capita emissions are still below the average level in OECD countries. India is the world’s fourth largest source of energy-related CO
2 emissions, for the reason that fossil fuels such as coal continue to play a major role in the energy mix. Additionally, there has been extensive pressure on India to contribute to the green energy sector. A survey suggests that the country’s future economic growth relies on the perennial availability of energy sources that are inexpensive, easily adoptable, and eco-friendly [
18,
19]. To mitigate the carbon intensity of India, adopting RE with a low marginal cost compared to fossil fuels would be the ultimate solution as the power sector contributes to half of the country’s carbon emissions.
India has declared an aim to install a non-hydro RE capacity of 175 GW by 2022 (of which solar PV is 100 GW) [
20]. For the development and deployment of solar energy technology to attain the grid power parity by 2022, the Government of India approved the “Jawaharlal Nehru National Solar Mission” (JNNSM) [
21], now renamed as the National Solar Mission (NSM). Initially, through JNNSM, India aimed to achieve 20,000 MW of RET by 2022, which was later revised to 100,000 MW. This includes 60,000 MW from medium- and large-scale solar projects and the remaining 40,000 MW from solar rooftops. The Indian Government has set targets for every region in the country, along with statewide targets. They are 31 GW for the Northern region, 26.5 GW for the Southern region, 28.4 GW for the Western region, and 12.2 GW for the Eastern region [
22].
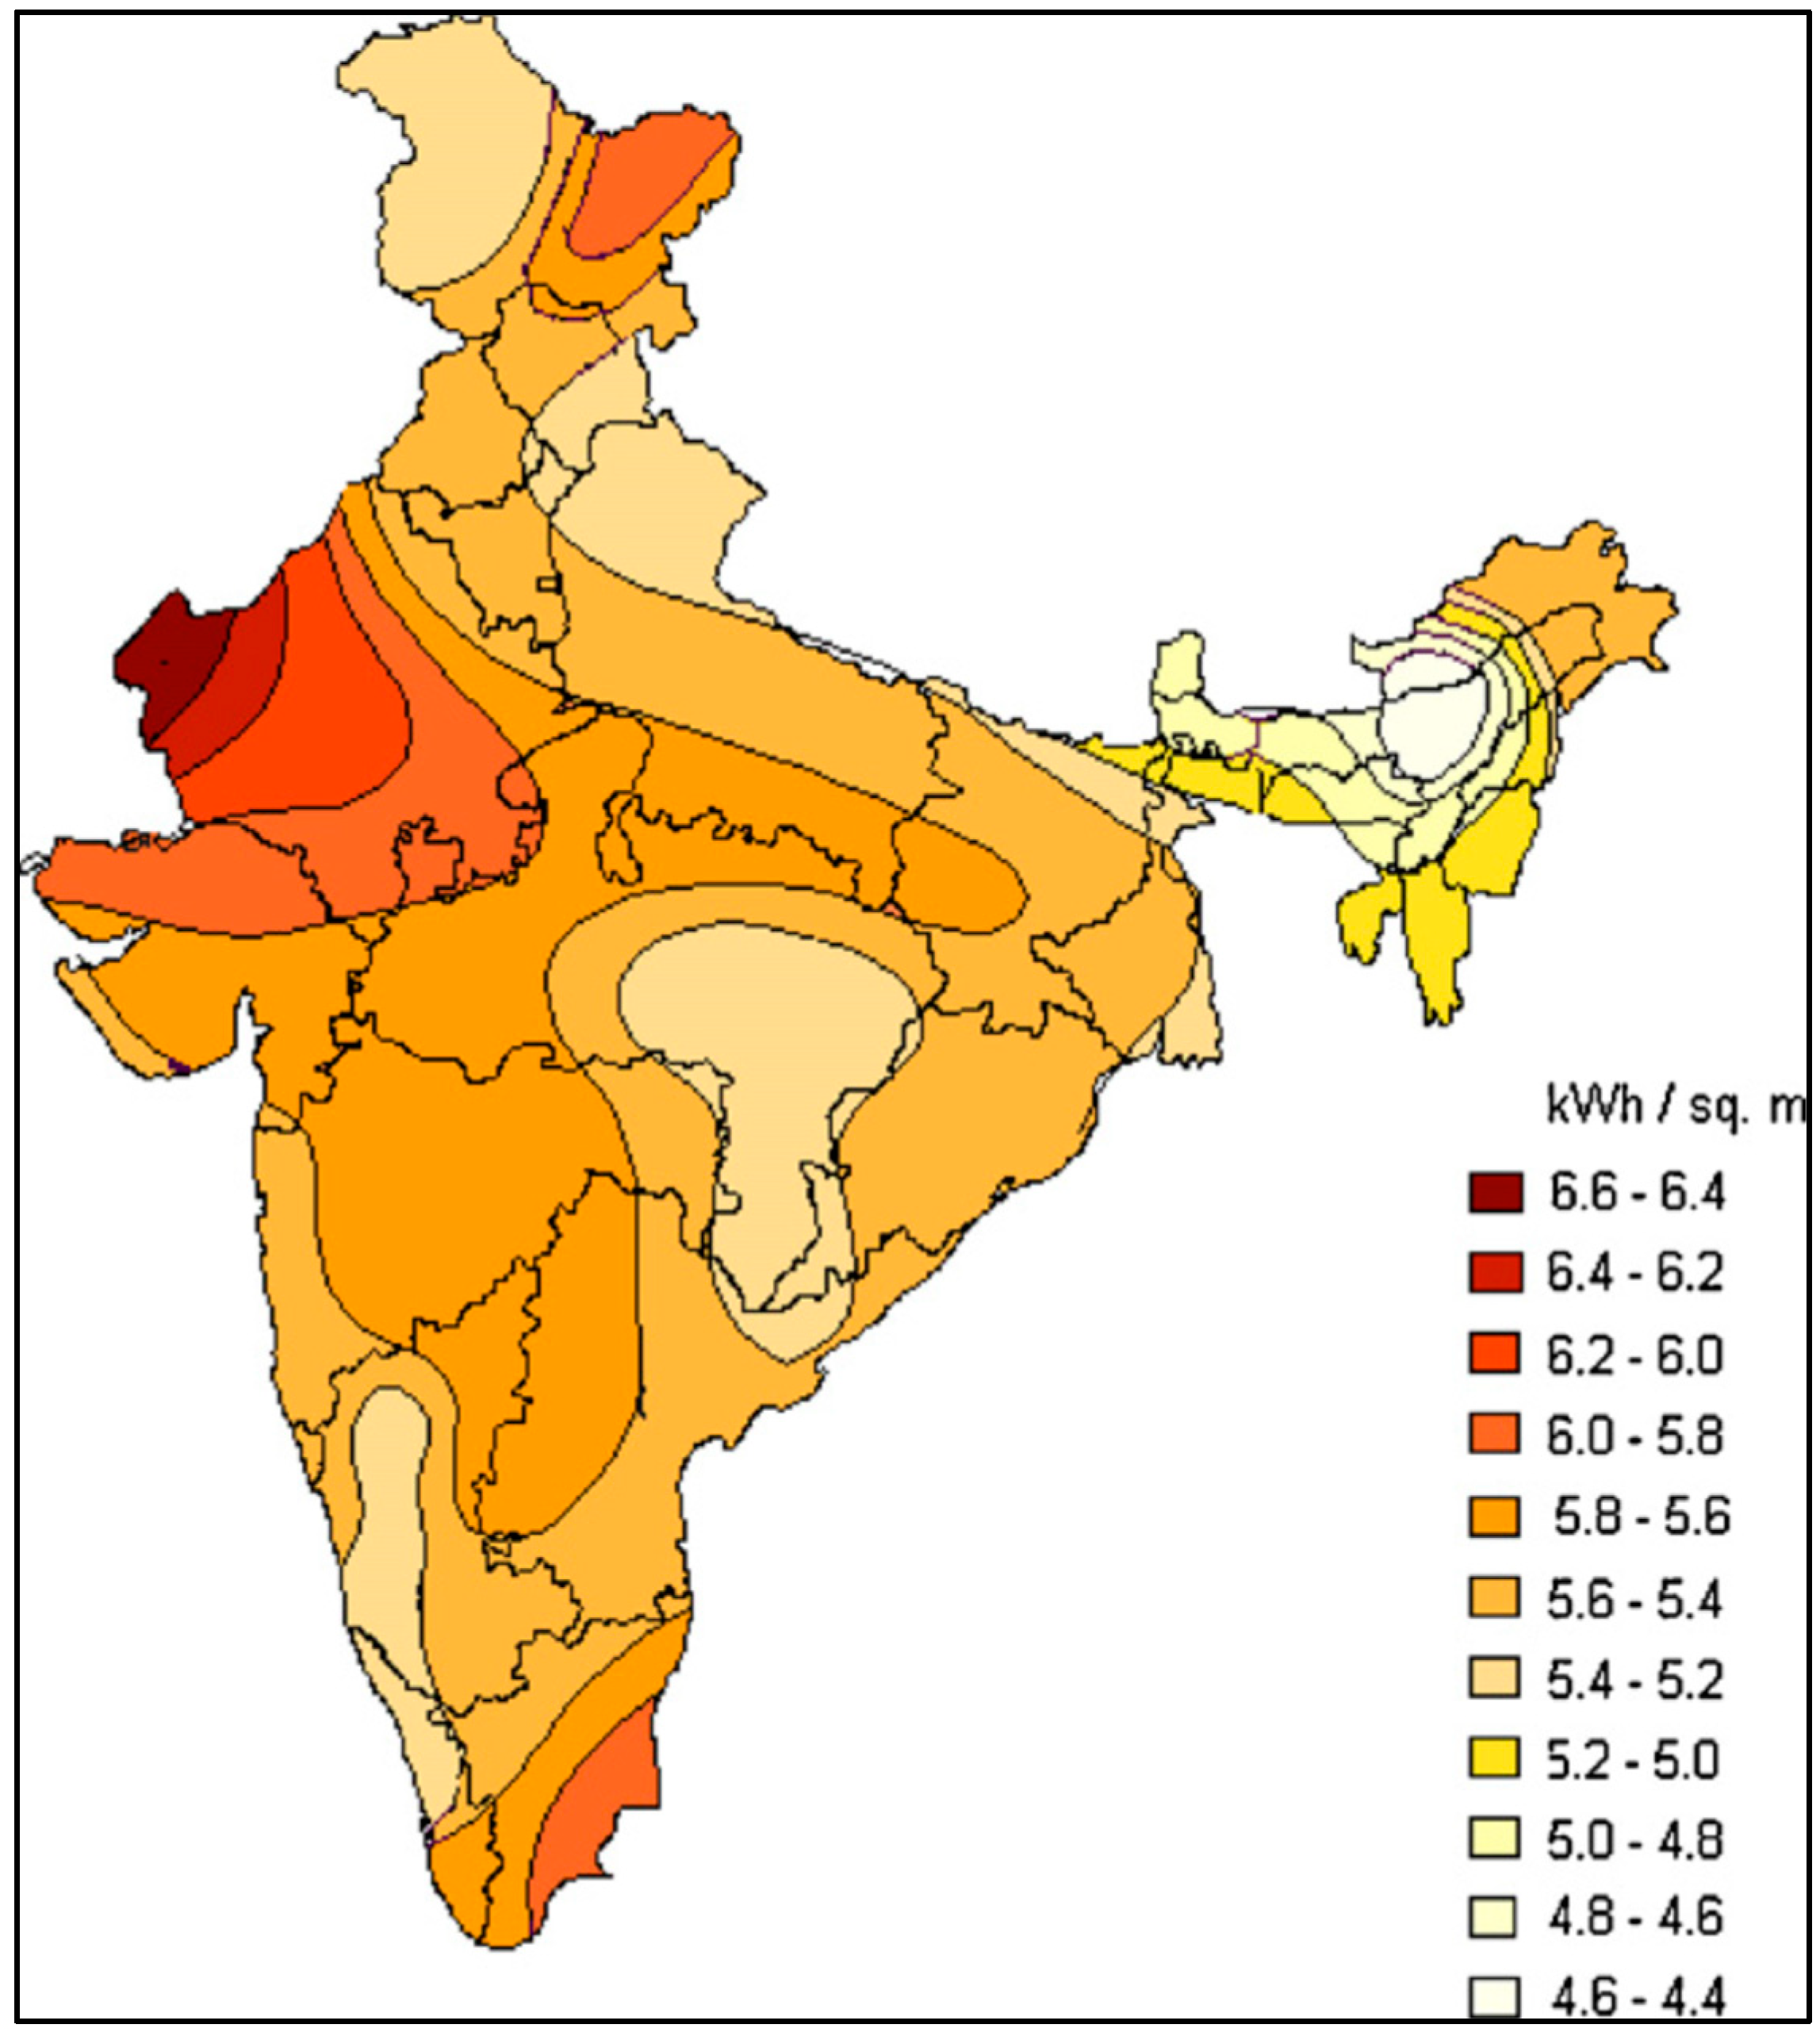
The annual global solar radiation in India varies from 1600 kWh/m
2 to 2200 kWh/m
2, which is equivalent to 6000 million GWh energy per year [
23]. The radiation levels are distinct for different parts of the country, as shown in
Figure 1. Exploiting the available natural resources in an efficient way is key to achieving India’s RET. India’s contribution to wind energy is significant and this is the motivation behind this project. Government-aided RE policies have helped India explore wind energy, along with the hub of WT manufacturing industries situated in India, including Suzlon, Vestas, etc. [
24].
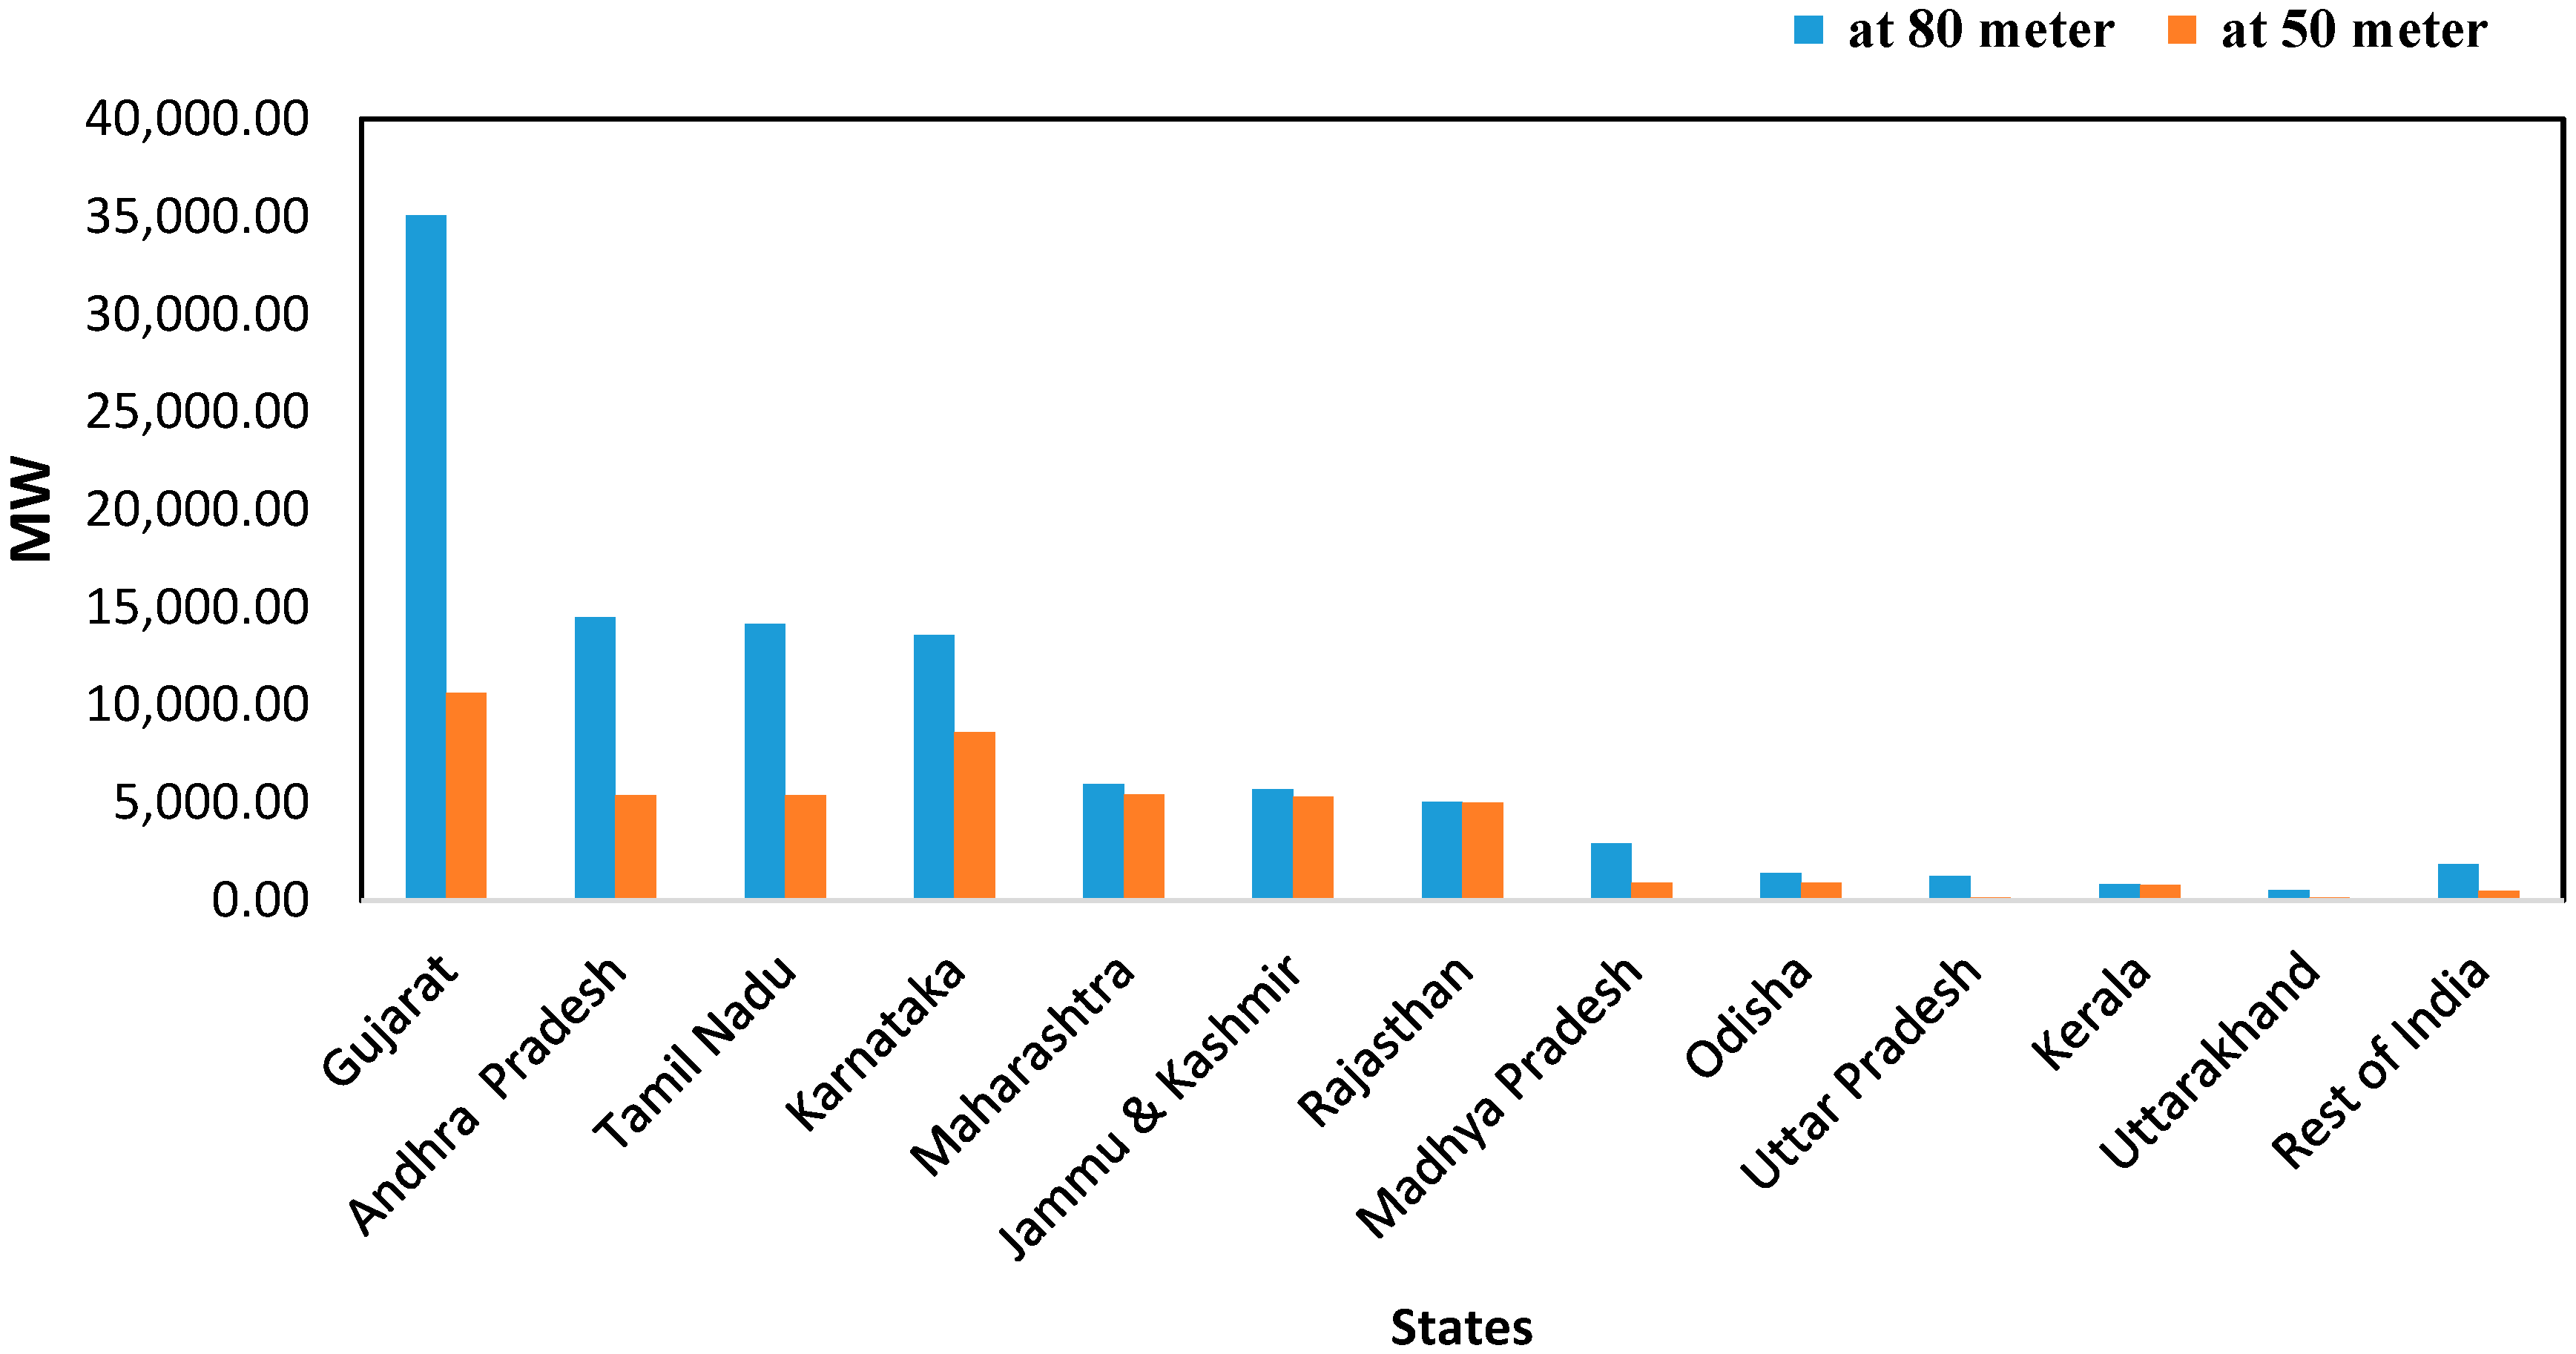
Similar to the solar potential, the wind potential in India is abundant, particularly in Gujrat, Andhra Pradesh, Karnataka, and Tamil Nadu.
Figure 2 depicts the wind energy potential of different states in India at the heights of 80 m and 50 m. The wind potential in India is about 102,788 MW and 49,130 MW at the heights of 80 m and 50 m, respectively [
25]. By 2022, the government is looking at aggressively achieving the cumulative capacity of 60 GW, and as of 31 March 2015, about 23.44 GW has been installed. Thus, adopting RE as distributed energy sources and connecting them to the grid contribute to the prerequisites of grid development.
3. Methodology Used for the Case Study
To meet the ever-increasing energy demand of the growing population, an energy system that is capable of handling a high demand and yet is resilient and reliable is the need of the hour. This need is more appropriate in a country like India, where grid failure and blackouts are very common and predominantly observed in summer and rainy seasons. The current study considers the use of grid support to help in setting up a reliable and efficient energy system connected through a storage system like a battery through HRES. Designing and optimizing a micro-grid and analyzing its economic, social, and environmental impacts are assessed in this study. However, similar studies have been conducted using PV, WTs, and fuel cells (used either for energy conversion or as a storage unit) for isolated villages, islands, wind farms, and resorts [
26,
27,
28].
iHOGA software is exceptional in a way compared to well-known software like HOMER. Although both the software packages involve the optimum sizing of HRES, iHOGA has a detailed controlled strategy compared to HOMER software. Furthermore, iHOGA software has a unique feature of calculating the HDI and job creation factor. This feature has been explored for a battery-connected grid HRES in this research, in addition to the aforementioned contributions of this study. However, this study also includes real-time data collection of a community in India comprised of 70 houses by procuring the electricity bills for two years. Modelling of the currently available HRES in the Indian market and featuring of the market price of these individual indispensable units are other prominent attributes of this analysis. This has helped in exploring and understanding the status of the HRES in the Indian market. The present discount rate and inflation rate of India have been used in the calculations, displaying the realistic and practical approach to this research. Contemplating the social aspect of RE adoption and using job creation as one of the criteria have provided a further new dimension compared to the existing techno-economic approaches studied in the literature.
Various methods have been used to optimize a micro-grid, including the genetic algorithm and swarm optimization techniques [
29]. Many software packages explored in such studies viz. MATLAB, Simulink, HOMER, iHOGA, and RETScreen [
30]. The methods used by these software packages to optimally size the RES either consider the economic criteria or the power reliability criteria as performance indicators to size the RE system. However, if multiple criteria are considered, there is no optimum RES system designed.
In this research, iHOGA software is chosen for the optimum sizing of HRES. The results for HRES integration have been validated for iHOGA software by the literature [
31]. As a preliminary study for this work, HRES integration for the Aralvaimozhi community was conducted using HOMER and iHOGA software packages and their results have been compared [
32]. This study is an extension of our previous work. The HRES design and control strategies used for this study have been explained in detail in [
28].
iHOGA-based HRES sizing and optimization has been studied for multi-objective optimization in [
33]. Another study highlights the effect of NPC for the variation in solar radiation and wind energy [
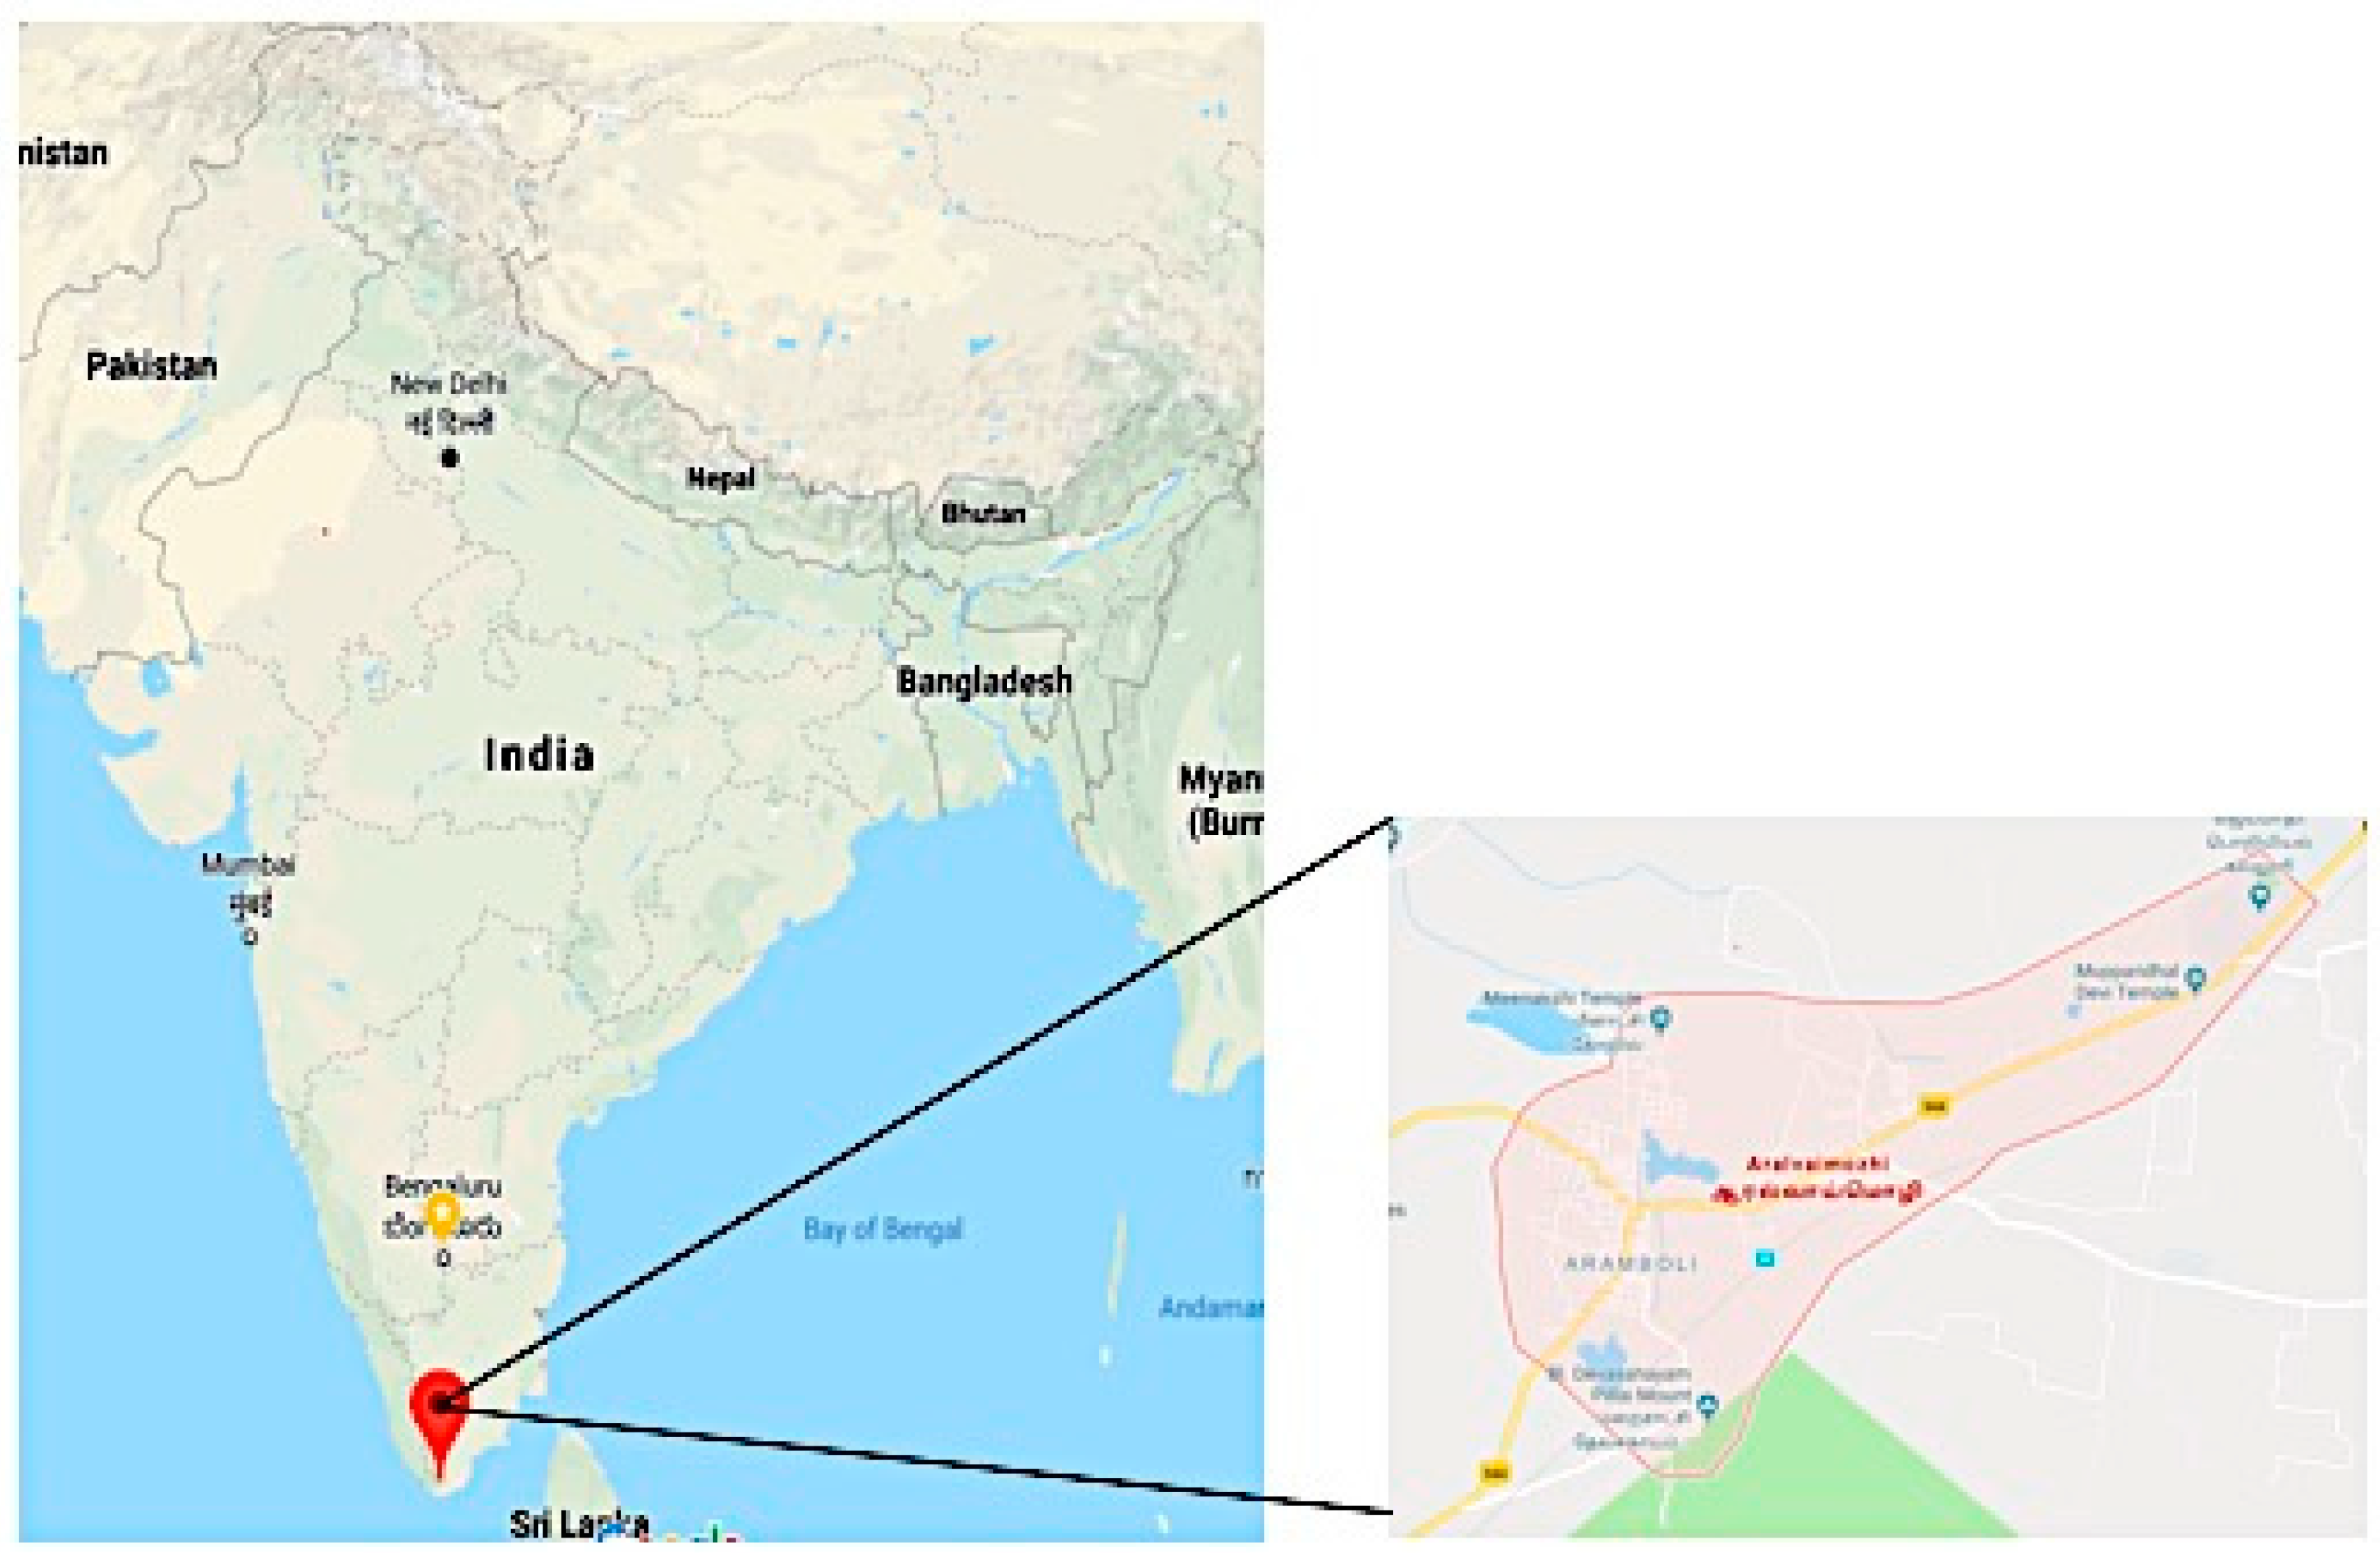
31]. In the literature survey conducted, iHOGA software has not been widely used like HOMER, and many features of iHOGA remain unexplored. This paper discusses the sizing options of HRES for a small community in Aralvaimozhi, in the state of Tamil Nadu, India. The location of the community is shown in
Figure 3. Optimum sizing and the techno-economic, environmental, and social impacts on RE adoption for various probable scenarios are scrutinized and their results are analyzed here.
3.1. Identifying the Available Resources
Given the arbitrary behavior of RE sources, their energy prediction and hence unit sizing have always been challenging, and an optimization method study would help to downsize the system cost and improve the system reliability. Although oversizing the system components may make the system costly, under-sizing would lead to an unmet load. Hence, optimum resource management is a pivotal strategy for a reasonable trade-off between them [
34]. In this section, the available RE sources are identified for effective utilization to provide an alternate energy using HRES connected to the micro-grid.
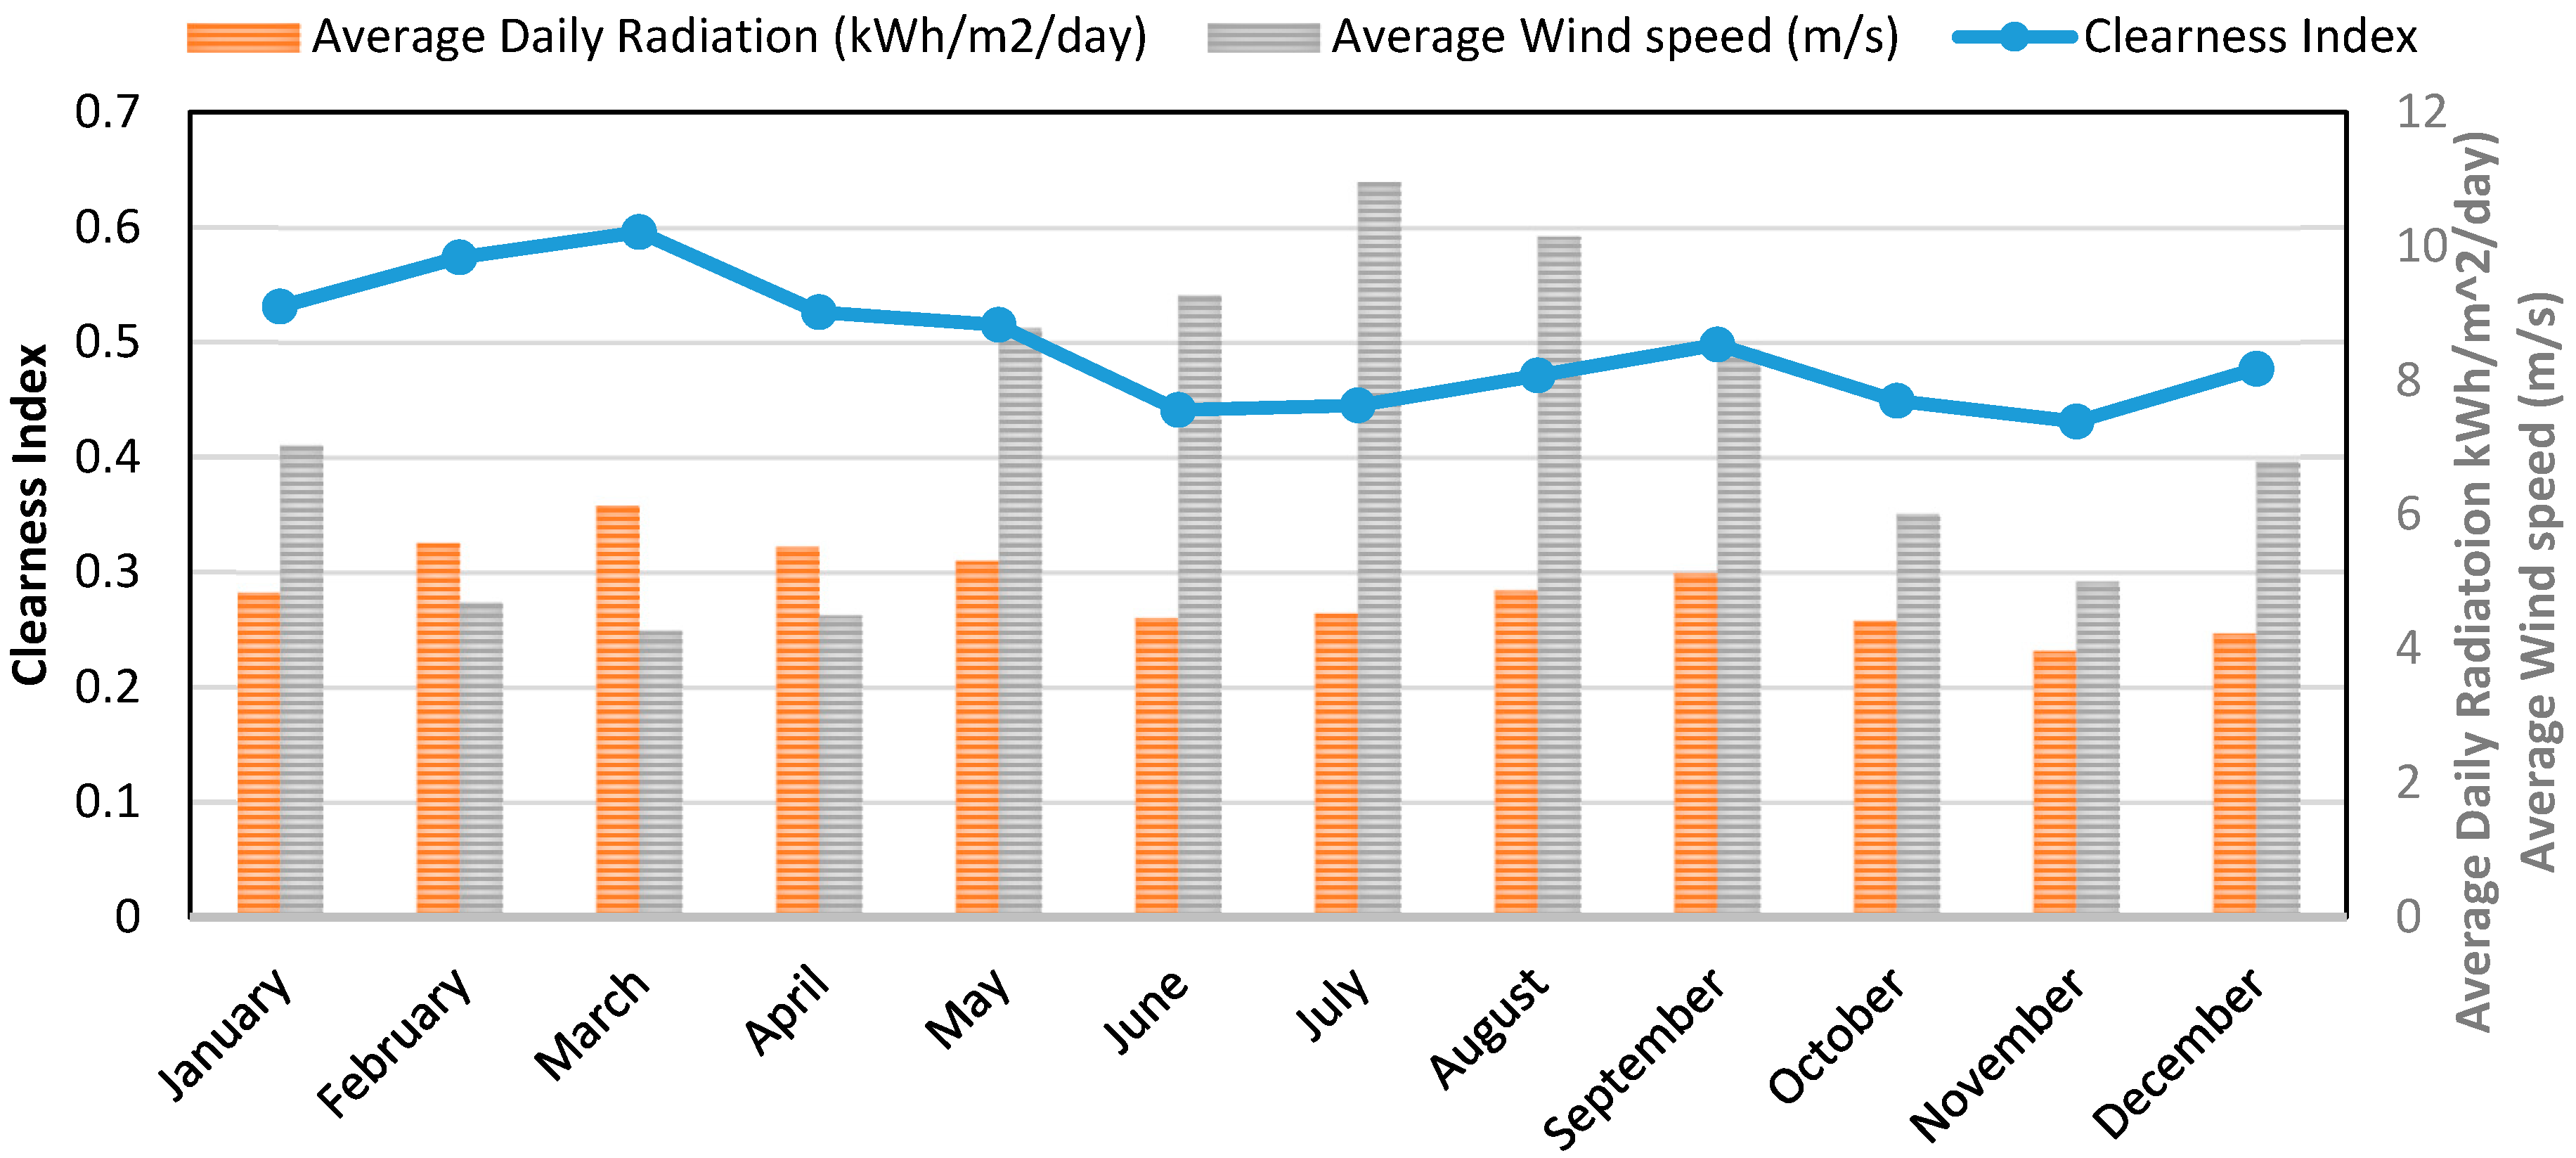
Aralvaimozhi has a good source of solar and wind energy. Wind speed was measured at a site near Aralvaimozhi; the annual average was 7.16 m/s. Using the NASA surface and solar energy database [
35], the average solar radiation at Aralvaimozhi was 5.05 kWh/m
2/day. Also considered was the clearness index measured as the clearness of the atmosphere at a desired place. It has been observed that the clearness index at Aralvaimozhi has a minimum value of 0.431 in June and a maximum value of 0.596 in March. Aralvaimozhi has been identified as a potential wind farm location according to the Government of Tamil Nadu.
Figure 4 represents the solar energy and wind energy availability in Aralvaimozhi, India.
3.2. Load Analysis
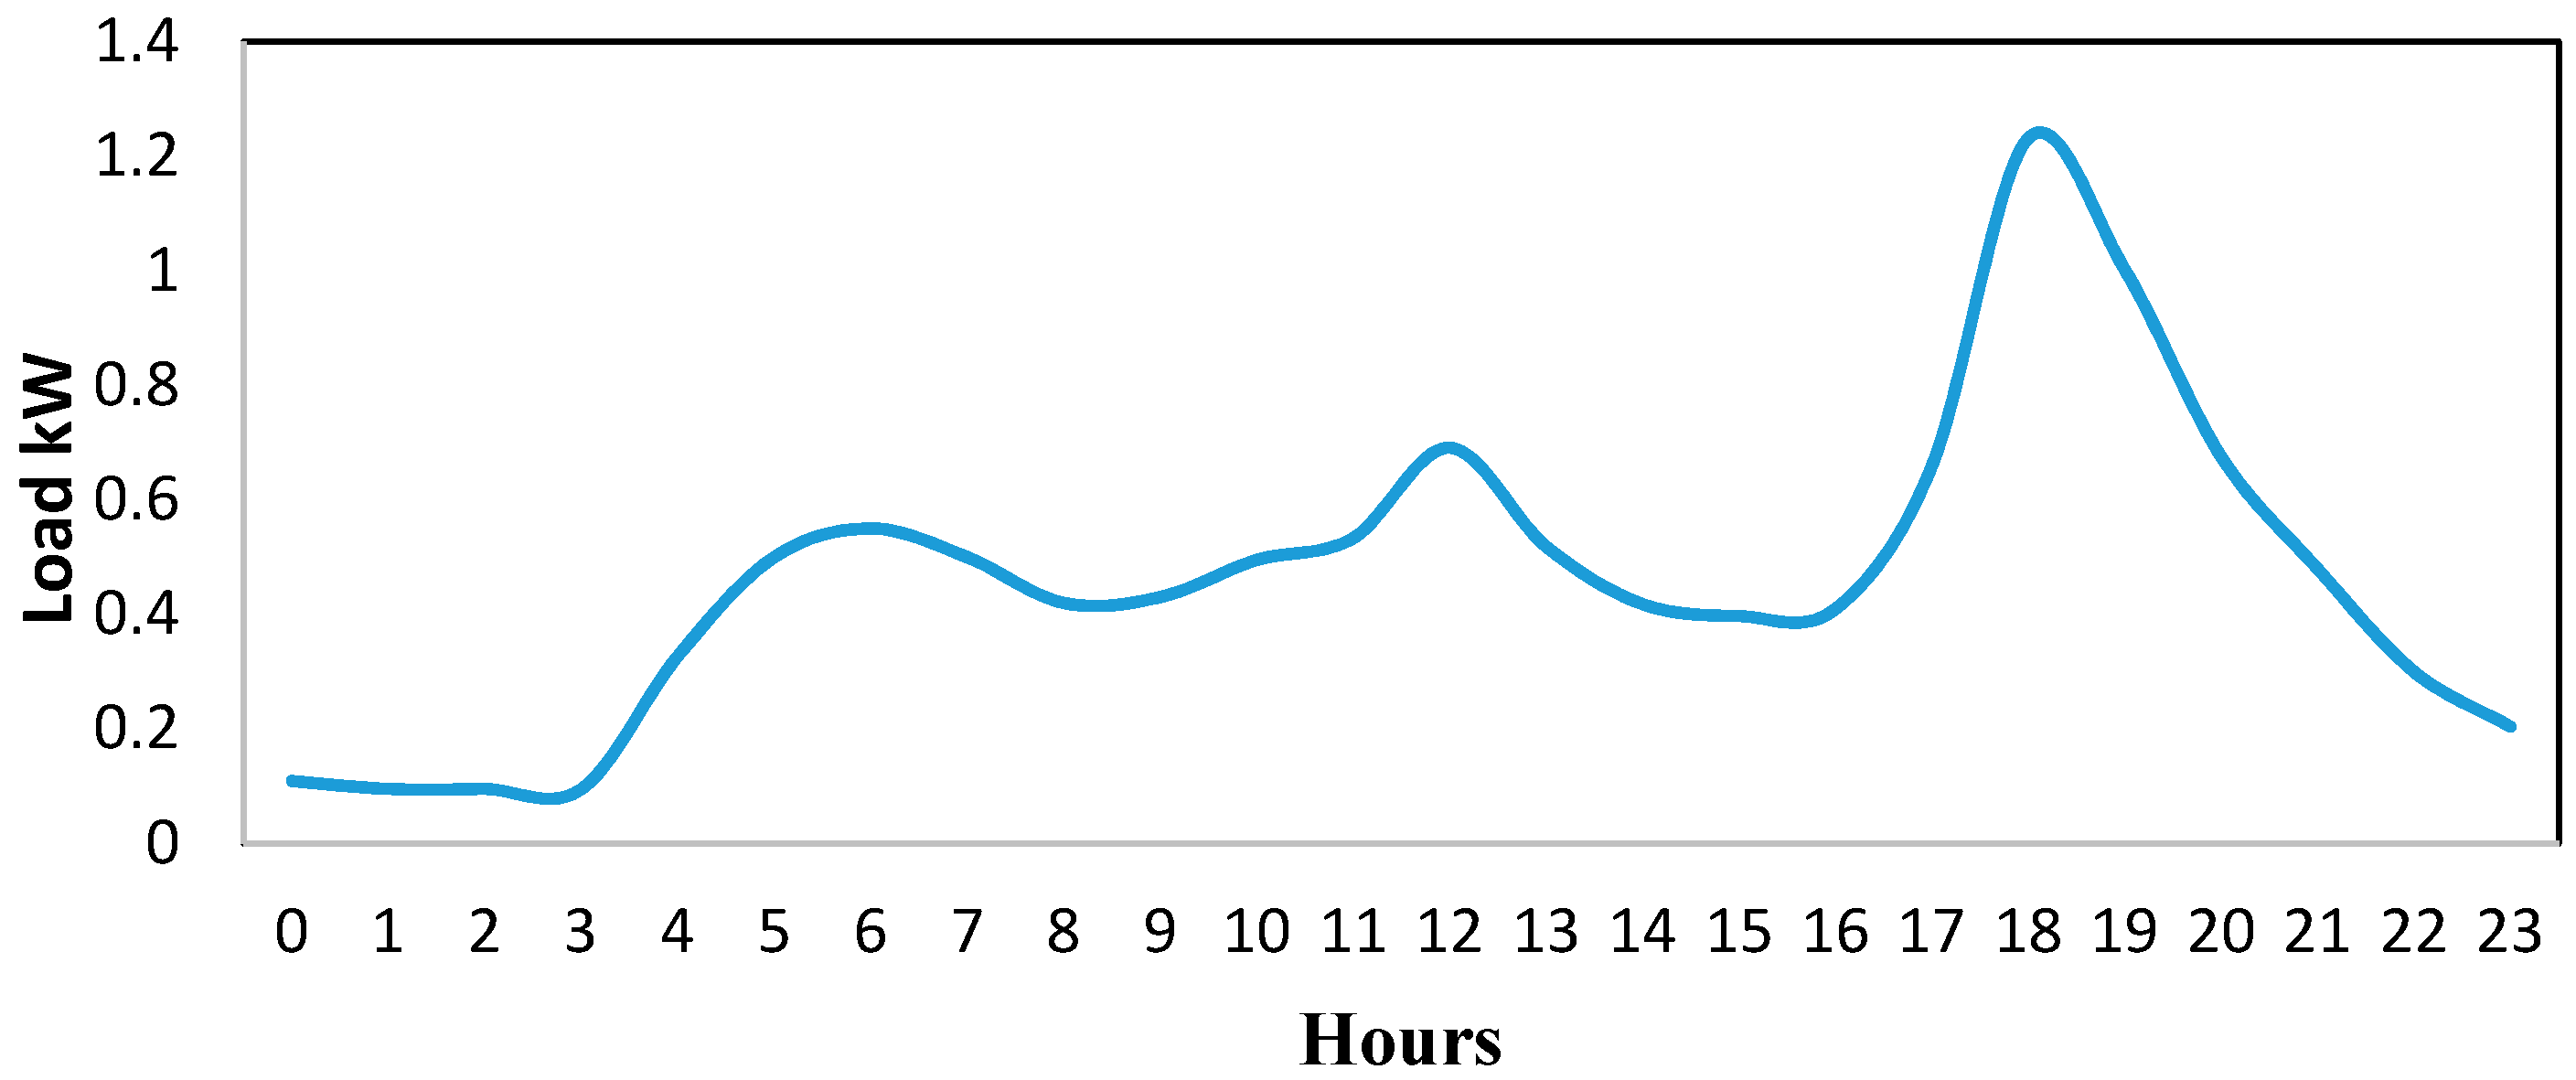
To design and optimize any micro-grid, it is essential to understand and study the load requirement of the desired location. This step is crucial during the design of a micro-grid, without which it could lead to underestimating or overestimating the consumption, which could result in an unmet load or oversized setup, respectively. The task of integrating solar and wind energy systems in small communities is challenging. Hence, it is most important to understand the stochastic behavior of available energy to serve the load. To understand the load for integrating RE at Aralvaimozhi, the energy consumption for 70 houses for two years is considered. Average energy consumption is 183.403 kWh/day for 70 houses with 34.05 kW peak consumption of the load, as shown in
Figure 5. The scaled average energy consumed by the community is about 7.64 kW, which is approximately 2.62 kWh/day/house, as shown in
Figure 5 [
36]. A similar load consumption of a village has been used for a village located in Chhattisgarh in India [
37]; although, it should be noted that the energy consumption of a location is completely dependent on the temperature of a given location. Chhattisgarh is situated in the Northern Part of India, while Aralvaimozhi is situated in the South of India, hence the respective load values are dependent on the locations. Another study involving the integration of HRES for a district in Chhattisgarh and Orissa (situated in eastern India) [
38] has an energy consumption of the household similar to Aralvaimozhi.
Due to the unavailability of the hourly consumption profile, the residential energy consumption profile from HOMER was considered. The energy consumption data per day was calculated and analyzed from the energy consumption bills for 70 houses. The daily activity of a house is between 0600 hrs to 2100 hrs. In the morning, when there is enough sunlight, PV can meet the electrical load. However, there is a necessity to address the load, which mostly peaks in the evening. Hence, WTs and a battery were introduced into the model. iHOGA considers the available resources and constraints set by the user and the size of the HRES for the given location, according to the least NPC for a mono-objective analysis. NPC decides the profitability of an HRES, which is why for a developing country like India, it is considered as a prime economic factor. Additionally, this study explores the TBL analysis, which includes the techno-economic, environmental, and social factors involved in designing an HRES. For environmental and social factors, CO2 emissions and job creation criteria have been considered.
3.3. System Description
The HRES is designed by considering PV, WT, and a battery with 2.4 hours of autonomy and connecting them to the grid. The sensitive variables considered to perform the financial analysis are as shown in
Table 1. The inflation rate dropped to a record low of 2.99% in April 2017 in India [
39]. Demonetization was one of the other reasons for this fall in the inflation rate. Hence, the inflation rate of 7.13%, as the average from 2012 until 2017, has been considered in the calculation. The interest rate provided by a nationalized bank in India was considered with the range 15.5% [
40] and minimum RE penetration of 70%. The HRES was modeled for the annual capacity shortage of 0%, which means the total load is either met by RE, a battery, or the AC grid and no load is unmet, as shown in
Table 1.
A generic 1 kW PV with a capital cost of INR
∗79,600 is considered. A Unitron Energy 1.5 kW WT with the capital cost INR 2.5 Lac (INR = Indian rupee; 10 Lac = 1 Million) and Trojan 105 batteries of the capital cost INR 19,500 were considered. These costs are the actual market costs provided by the supplier. These systems were modeled according to the specifications shown in
Table 2 using iHOGA software and the results were then analyzed.
4. iHOGA + Pro Software Analysis
Improved hybrid optimization using the Genetic Algorithm called iHOGA (with additional Pro version) is one of the useful software tools for studying the sizing and optimization of RE sources connected to the grid or stand-alone systems. Like HOMER, iHOGA can result in an optimum solution by minimizing the cost of the energy systems along the term of the project, which reflects on the NPC as a single-objective optimization. iHOGA has another salient feature which permits the user to choose multi-objective optimization. The multi-objective variables include:
Minimizing NPC;
Minimizing the unmet load;
Minimizing CO2 emissions;
Maximizing Human Development Index (HDI) and job creation.
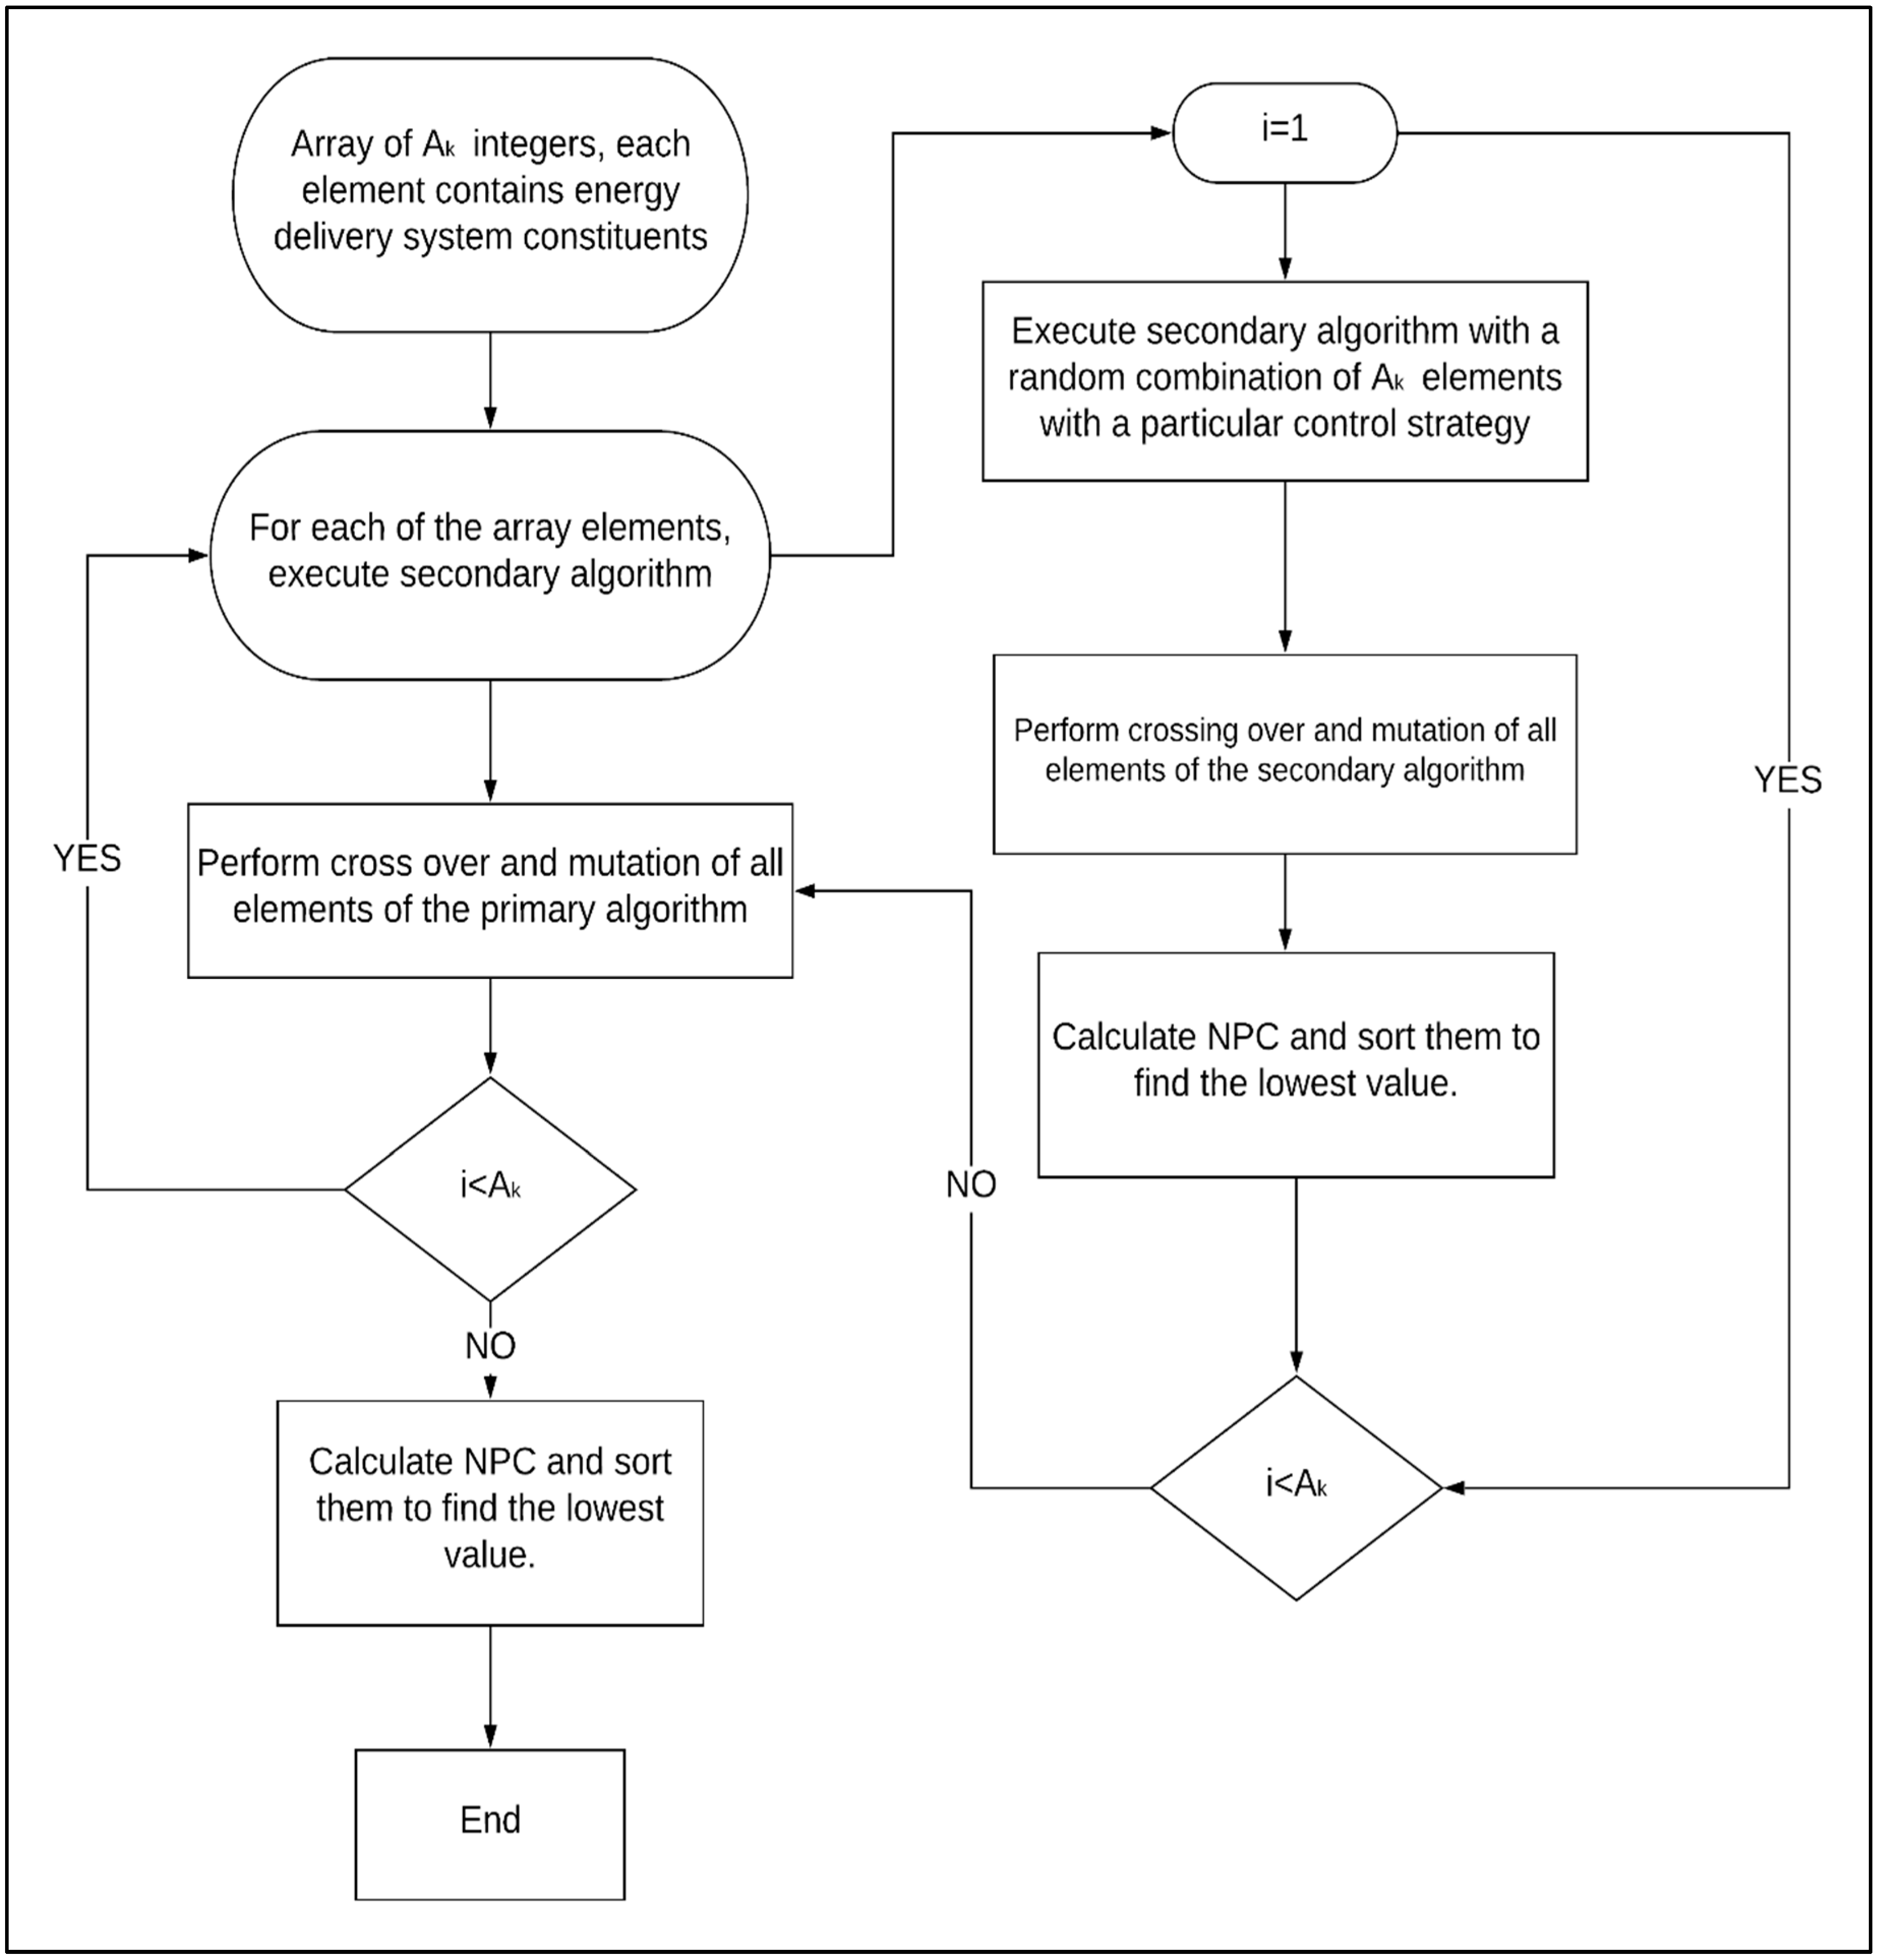
The user can choose the multi-objective variables accordingly. The multi-objective optimization could result in multiple feasible solutions. This is due to the detrimental behavior of each objective function to provide a feasible optimum solution. The software can simulate systems of any size ranging from Wh to MWh. iHOGA uses the Genetic Algorithm (GA) technique to find the optimum solution for a single-objective optimization or multi-objective optimization. iHOGA uses the flowchart explained in
Figure 6 to provide a feasible solution and the procedure of the analysis is as follows [
41].
The GA consists of two parts: the main algorithm and the secondary algorithm. The aim of the main algorithm is to produce the best combination of PV panels connected in parallel, type of generator (PV here), type of battery used, number of batteries, and any other type of generator (Diesel, wind etc.) required to achieve the lowest cost for an energy delivery system. The best combination of HRES is calculated by considering the electrical load (either in hours or minutes), which is the input provided by the user. For a given location, the energy availability is considered (this data is either given by the user manually or can be downloaded from the NASA website considering the given latitude and longitude of the desired location). The aim of the secondary algorithm is to produce the best result for the cost of the system based on a particular control and this is done based on each of the elements in the first algorithm. The algorithm used by iHOGA is shown in
Figure 6.
Consider the main algorithm as consisting of an array of Ak integers. Each of the contents of the array represents the number of constituents of the energy delivery system that we are trying to optimize.
For each array of the Ak integers, the secondary algorithm is executed with a random combination of each of the Asec vector elements using a particular control strategy.
This results in calculating the NPC for that particular setup.
Once the NPCs are calculated, we perform crossing and mutation of the different options.
All the NPCs calculated are sorted to find the best one.
Fitness calculated for the secondary algorithm is represented mathematically as follows:
The fittest vector is the one that has the probability to reproduce themselves by crossing over with the other elements. Crossing over of the vector elements will result in a new vector called the Descendent. This is evaluated further and results in replacing the less capable elements with the most capable.
However, for achieving the optimal solution, the solutions have to go through the mutation process, by which more changes that are random are introduced by varying the control strategies.
The resultants achieved by the mutation and reproduction make up the elements for the next generation.
The mathematical representation of the Fitness of the main algorithm is as follows:
This process continues until the final criterion of the number of determined generations is satisfied and that becomes the solution.
For each of these determined generations, NPC, COE, Jobs creation, and HDI are calculated.
The results are sorted according to largest to the smallest values of NPC, with the lowest value of the NPC of the system being the economically best solution [
41].
5. Mathematical Equations Used for iHOGA Analysis
The mathematical equations used by iHOGA software are as follows:
6. Proposed HRES for Aralvaimozhi
Preliminary analysis in
Section 3.1 and
Section 3.2 highlighted Aralvaimozhi’s availability of abundant energy resources, namely solar and wind energies. These available resources are exploited for the RE option for the community.
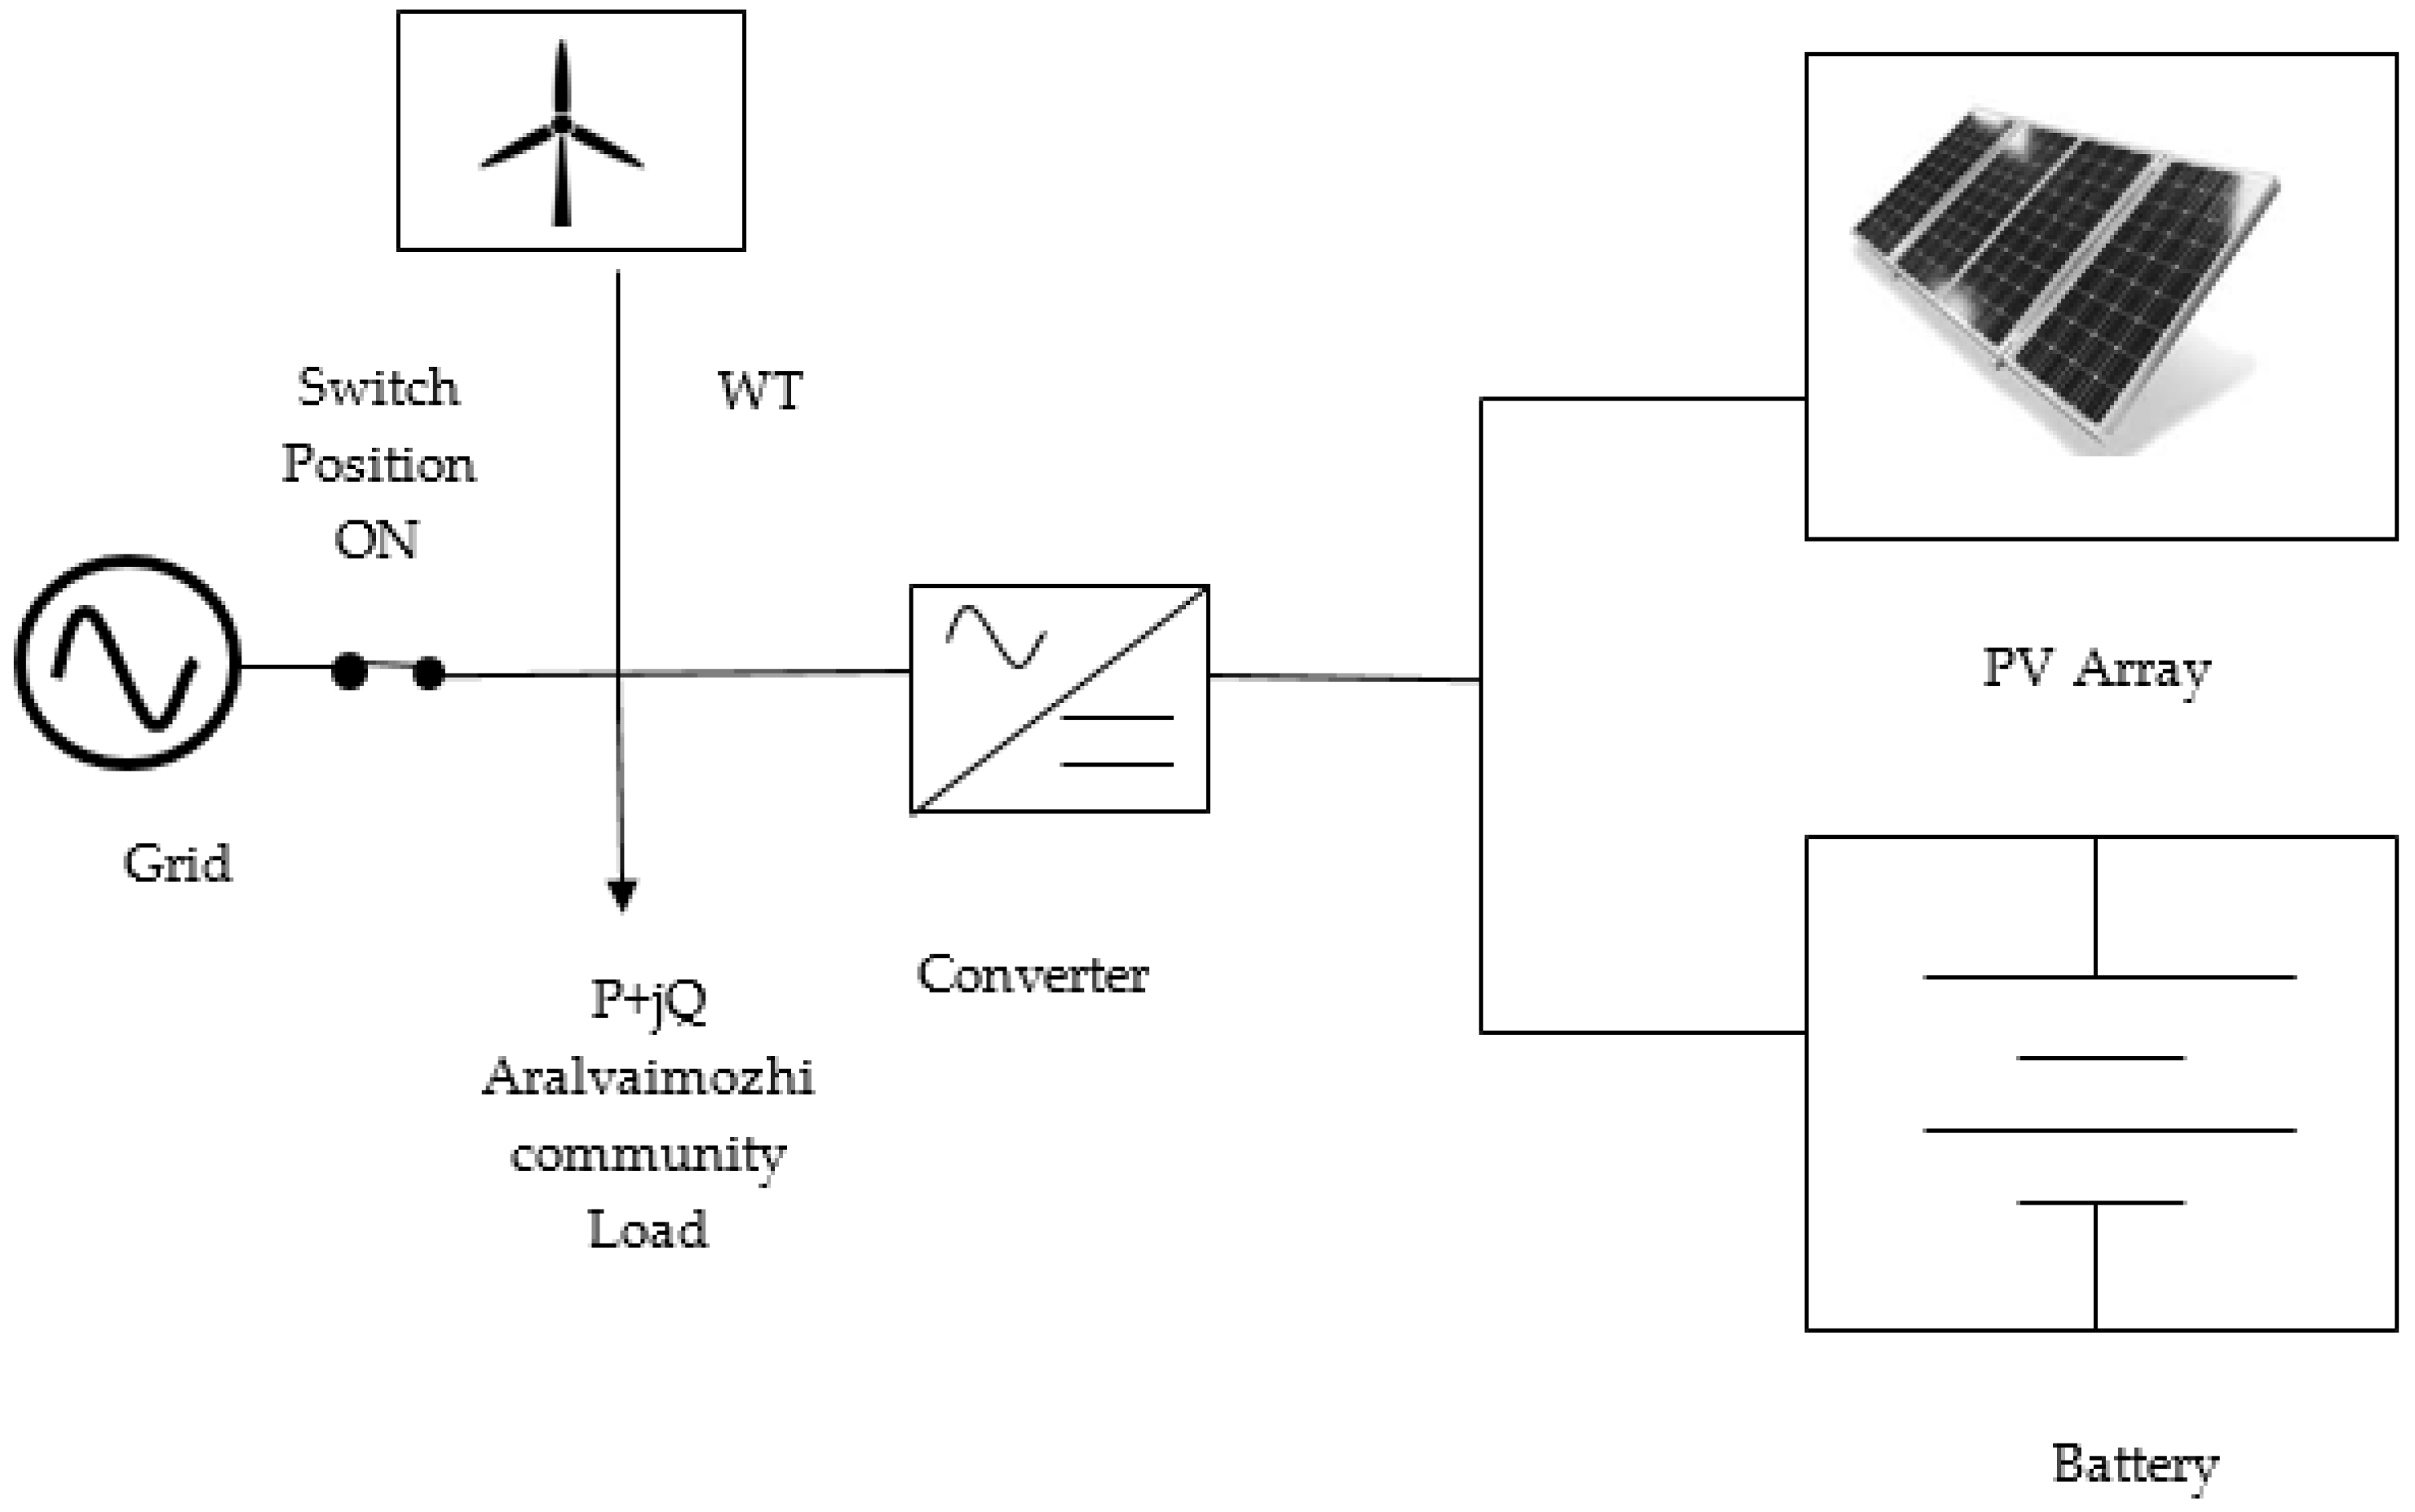
Figure 7 elucidates the HRES used for RE adoption for the Aralvaimozhi community. This includes generic PV, UE1500 WT, and a set of Trojan batteries connected to the grid. The specifications of the components used for the study are provided in
Table 2. Analysis of the electricity bill has been carried out to find the average electricity price paid by the community for 1kWh; this was INR 2.16/kWh. The feed-in tariff was not given for TN in any literature. However, it was considered as INR 5.1/kWh according to a report [
45].
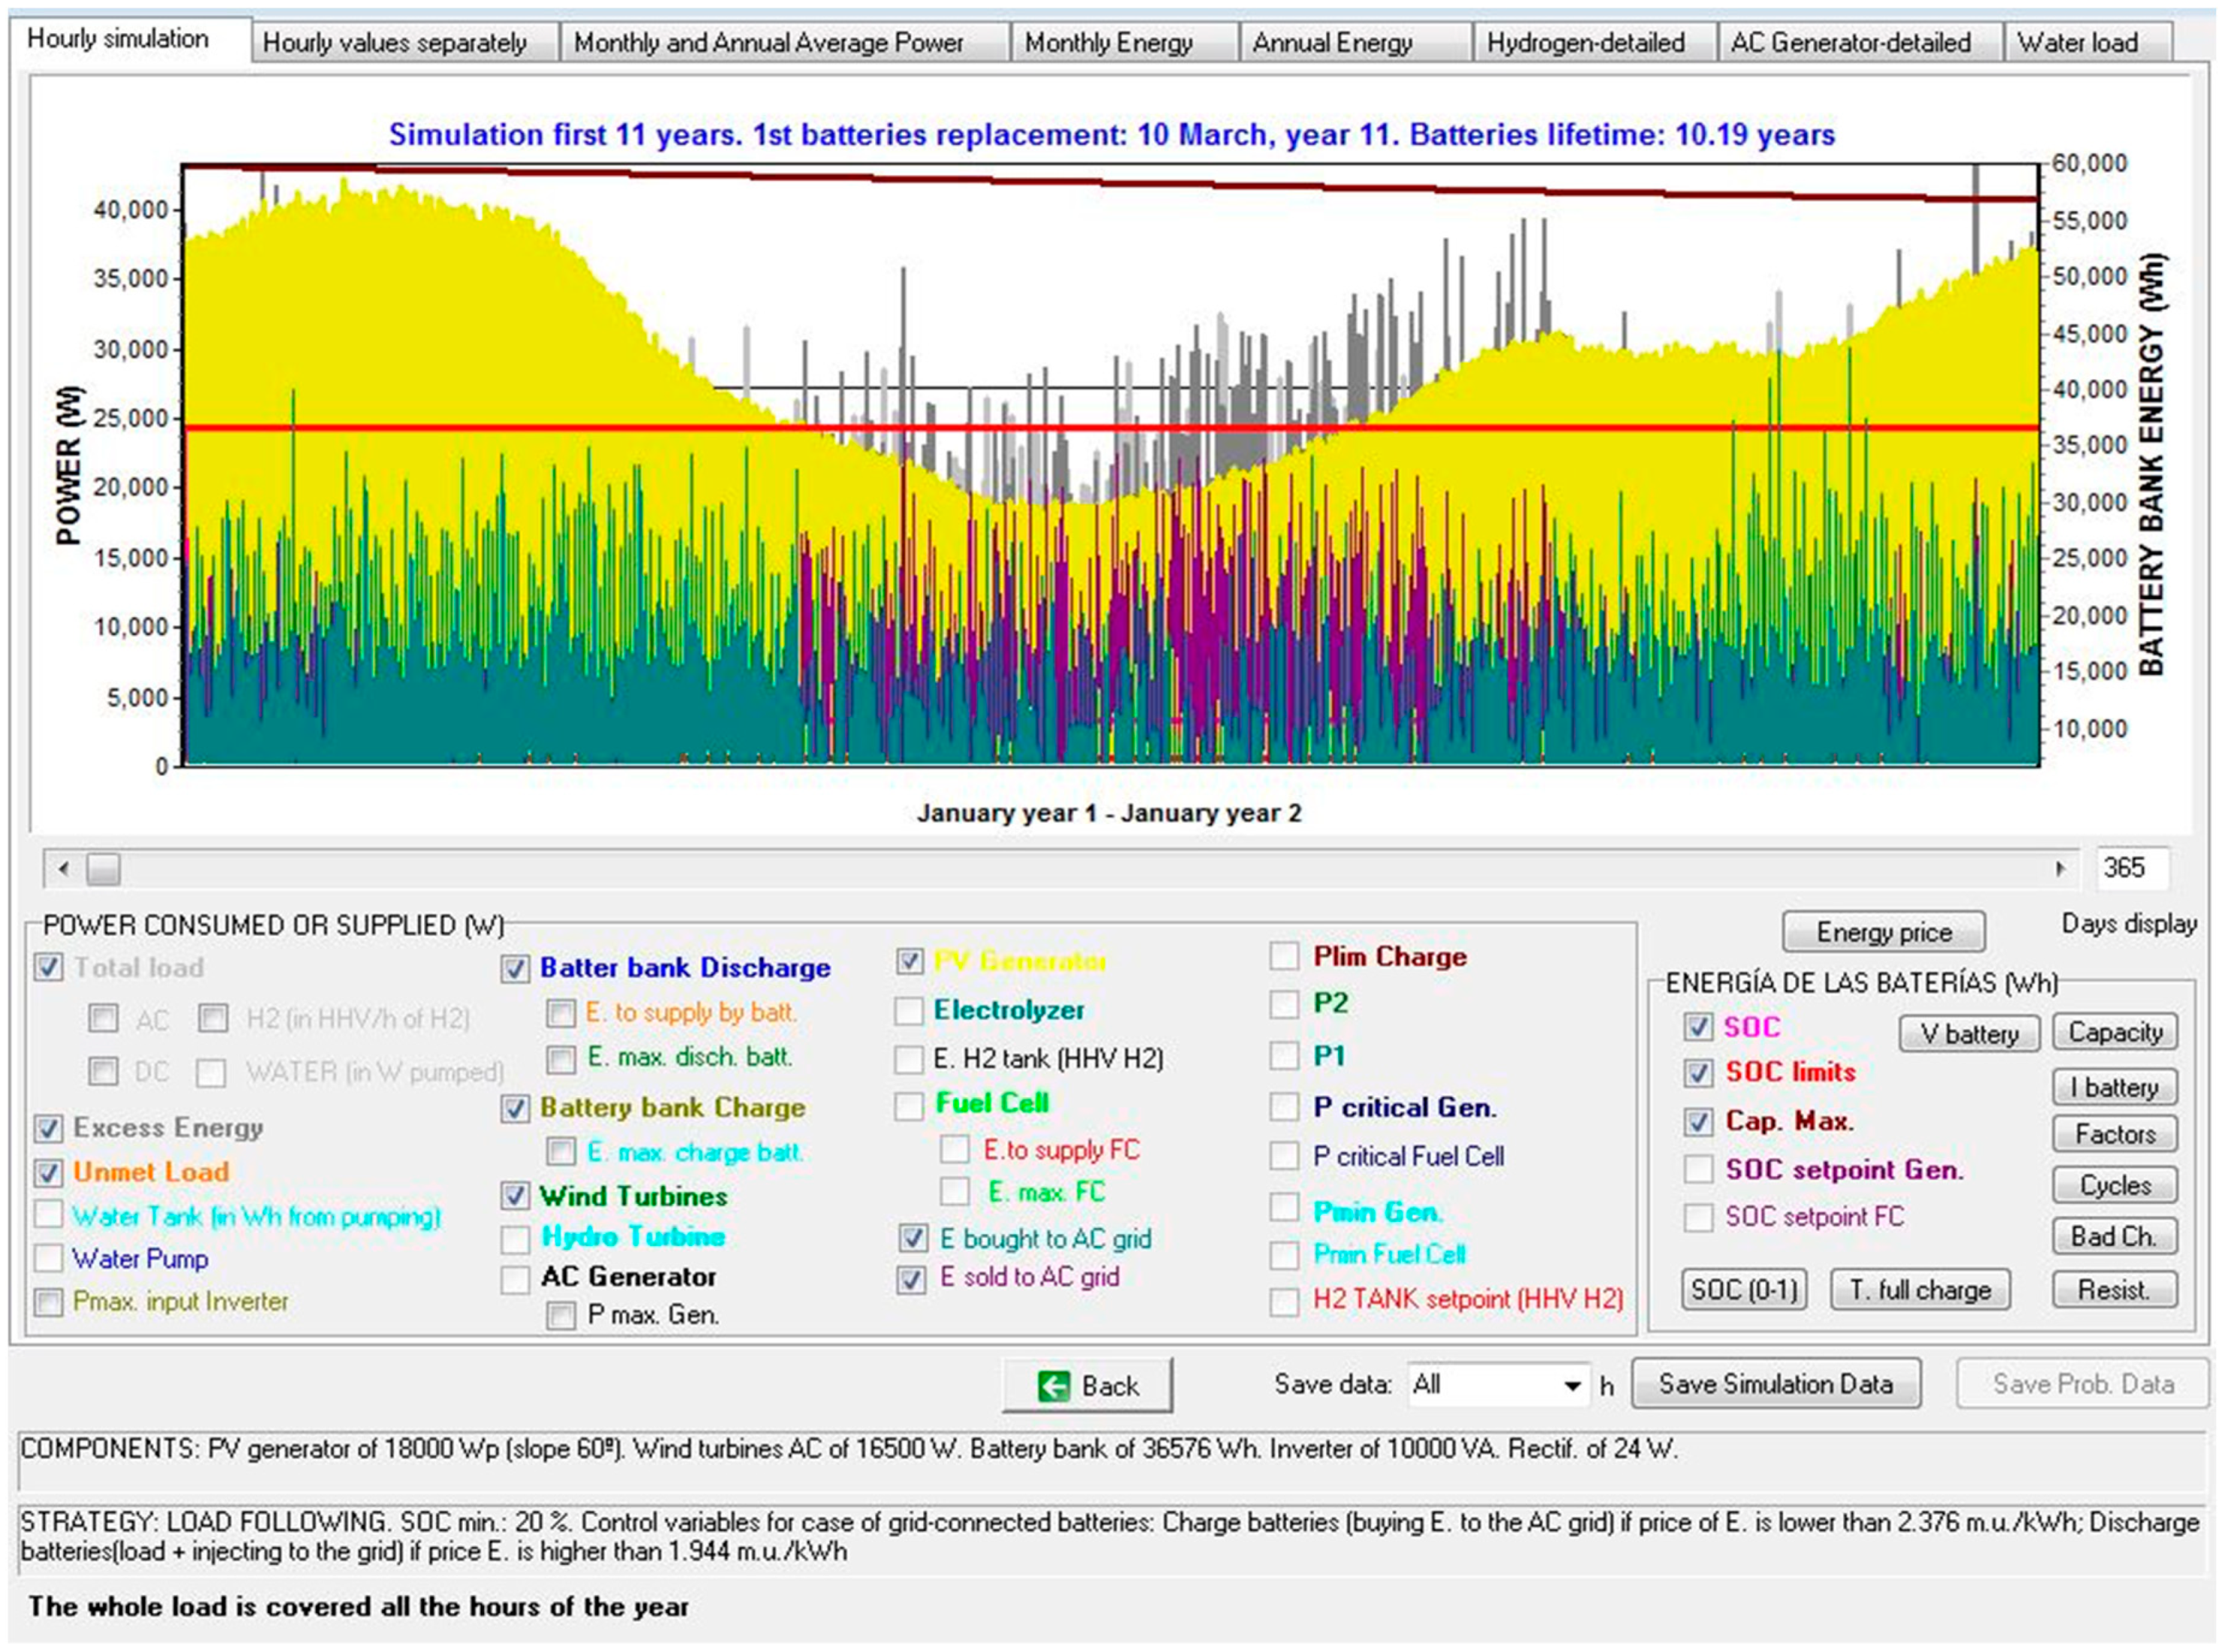
For the control strategy, the Load Following (LF) option was considered, and this means that the unmet load from the RE system will be met by the charged batteries. This is shown in
Figure 8 and illustrates the hourly simulation of the HRES in a year. It is observed that at times when the PV and WT are unable to meet the load, the battery discharges the power at any instant. This is shown as the variation of SOC of batteries at that instant of time.
Figure 8 also highlights the output of PV and WT generation, in addition to the community load. A bi-directional inverter of 100kVA and acquisition cost of INR 68,500 was included. With one day of minimum autonomy, the HRES was sized for a minimum RE fraction of 65%. The grid system used acts as additional support in case the energy to the load is not met by the RE system or from the batteries. The grid is also used to dump the excess power after the load is met by the RE system.
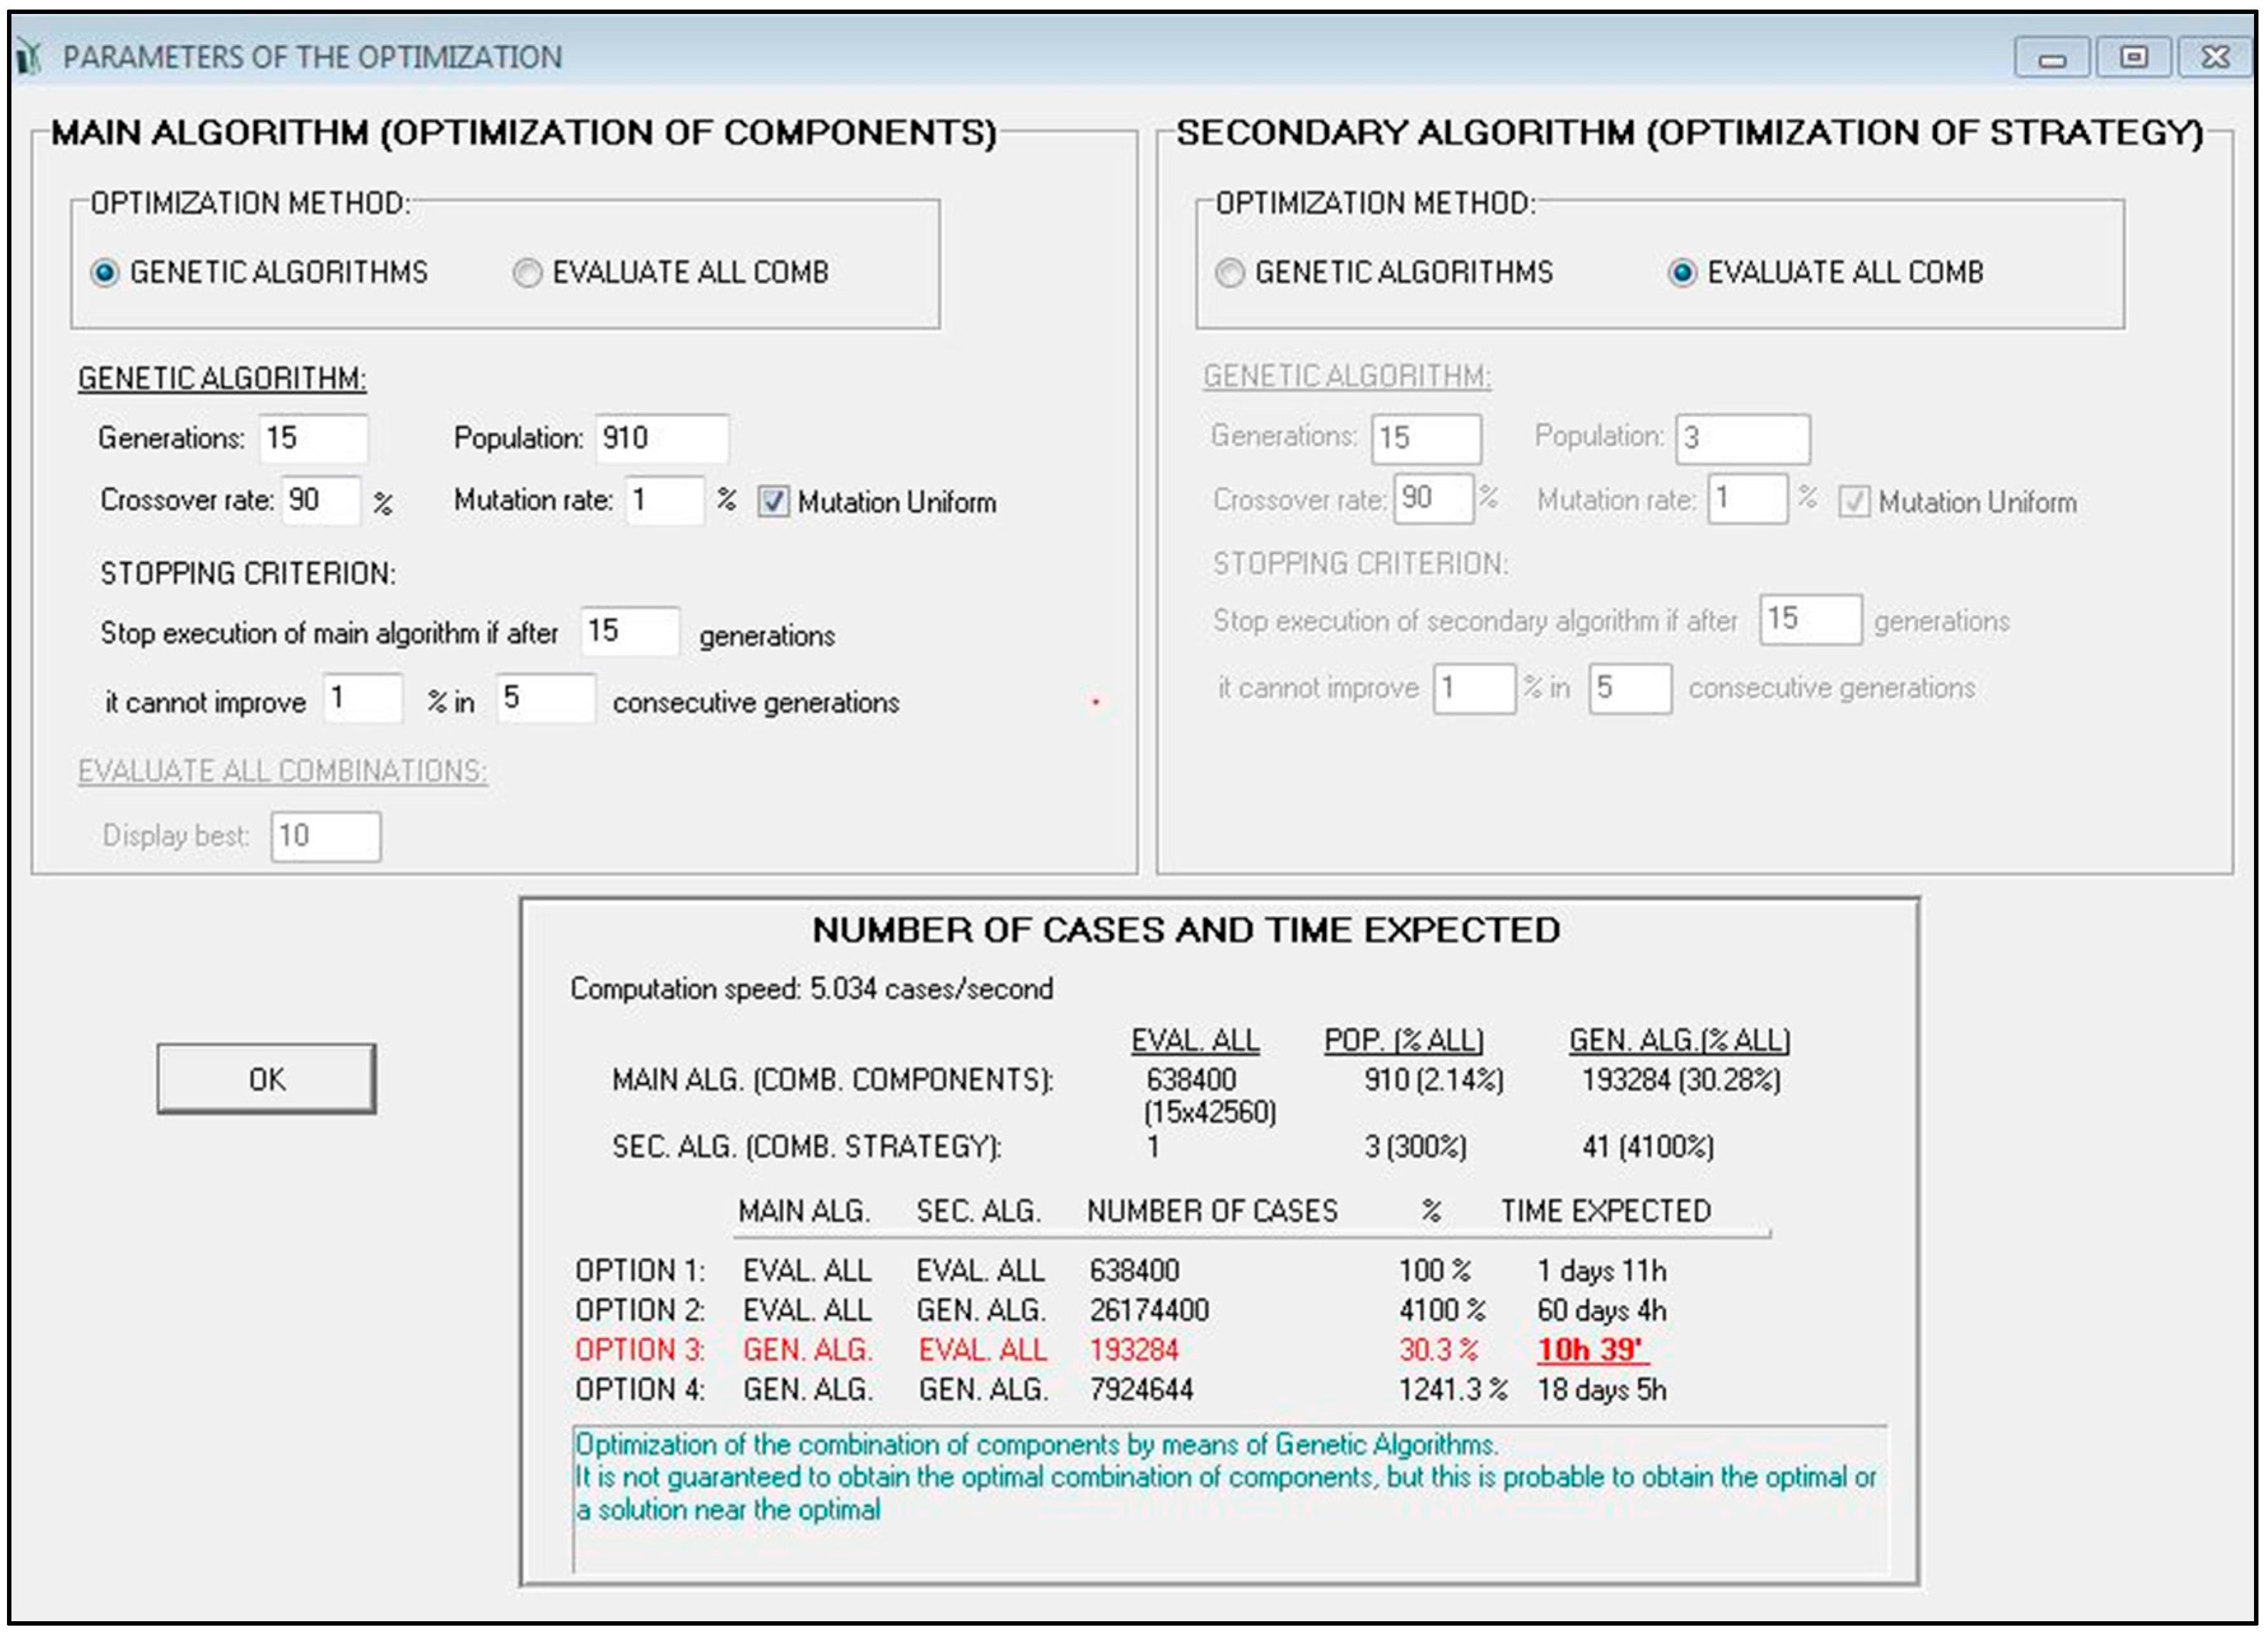
iHOGA considers primary and secondary algorithms, simulating results close to the optimized result taking a longer time. For the user-defined time, iHOGA chose all combinations of HRES for primary algorithm analysis, and for secondary algorithm analysis, GA was chosen. This long duration in the simulation is also due to the control strategy defined for iHOGA. Priority to charge the batteries was given to the renewable energy source that has been considered. If the renewable energy is excess at any instant, it can be sold to the grid. In the current study case, the control strategy considers prioritizing the renewable energy and battery to meet the load, and if in any case the renewable energy and battery are not available to meet the load, the grid is flexible to meet the load. Thus, the presence of the grid in the designed micro-grid system is used to supply any excess energy to the load in case of a deficit in renewable energy supply, and it also acts as the dumping unit when there is excess renewable energy, thus creating revenue through FiT. The screenshot of the GA parameters considered for the simulation is elucidated in
Figure 9. Fifteen generations were chosen with 910 populations. Considering a crossover of 90% and 1% mutation rate, iHOGA performed simulations for all the aforementioned sensitivity cases for about 10 h 39 min.
7. Results and Discussion
The study considers sensitivity analysis for the Aralvaimozhi case study. The sensitive cases include the probable variables that could have a larger impact on the economics of HRES; for example, the price of the components, the variation in load, the variation of wind energy, and solar radiation at the location. In this study, the following sensitivity study has been carried out.
1. Sensitivity analysis for load.
This sensitivity case considers the different values of load, which probably changes and affects the economics and size of the HRES system. The different sensitivity cases considered are as follows:
The base case with average load: In this sensitivity case, called the base case, to optimally size the HRES, the actual load of the community, 183.4 kWh/day, was used.
Base Case × 0.75 scale factor: This case considers 0.75 times (75%) the actual load of the community considered in Case a. Additionally, 75% of the community load value, which is 137.55 kWh/day, is considered for optimally sizing the HRES.
Base Case × 1.15 scale factor: This case considers 1.15 times the actual load of the community considered in Case a. Additionally, 1.15 times the community load value, which is 210.91 kWh/day, is considered for optimally sizing the HRES.
2. Sensitivity analysis for acquisition cost of the components.
This analysis considers the variation of acquisition cost of each of the components of HRES and its effect on size and economics of HRES. The different cases considered in the analysis are as follows:
Base case: This case considered the Present Cost of PV, WT, and batteries procured from the HRES suppliers, which is discussed in
Table 3 as Sensitivity Case 1.
0.5 × acquisition cost of PV, 0.5 × WT acquisition coast, 0.5 × batteries cost: This case considers the price of PV, WT, and batteries to be 50% of the actual cost (considered in Case a). The effect of the pricing of HRES on the sizing and economics is discussed.
0.5 × acquisition cost of PV, 1 × WT acquisition coast, 1 × batteries cost: This case considers the price of PV to be 50% of the actual cost (considered in Case a). However, the current prices of WT and batteries are considered (as in Case a for WT and batteries only). The effect of the pricing of PV on the sizing and economics is discussed in this case.
1 × acquisition cost of PV, 0.5 × WT acquisition coast, 1 × batteries cost: This case considers the price of WT to be 50% of the actual cost (considered in Case a). However, the prices of WT and batteries are considered to be the current prices (as considered in Case a for PV and batteries). The effect of the pricing of WT on the sizing and economics is discussed in this case.
1 × acquisition cost of PV, 1 × WT acquisition coast, 0.5 × batteries cost: This case considers the price of batteries to be 50% of the actual cost (considered in Case a). However, the prices of WT and PV are considered to be the current prices considered in Case a for PV and WT. The effect of the pricing of batteries on the sizing and economics is discussed in this case.
A single-objective optimization for minimizing the NPC of the system is considered in this study. Several studies conducted in the literature include multi-objective optimization; results obtained in these studies are mutually counter-productive outcomes. Depending on the objectives selected to be optimized, many solutions are provided by the system. In such cases, many of them may offer the least emission and others may provide the lowest cost or unmet load. The solutions presented are sorted according to the best value of NPCs. Considering the objectives discussed earlier, minimizing the NPC, a single objective function is analysed for various sensitive cases. The study conducted primarily explores the probable variables for the Indian scenario. The variation in the price of the RE system in the energy market forms one of the significant criteria for this analysis. Although the bill analyzed for the community is for more than a year (the normal duration used in the literature to study the load), it was observed that the community had a moving population. This implies that not all the people in the community owned the house they lived in. Since some of the community leased or rented the property, the load was a variable value. This was considered as the second sensitive case. The load used in the analysis was considered with variable values, with 0.75 times and 1.15 times the actual load. In the literature survey conducted, such analysis for the optimization of HRES was not observed; no such study has ever been conducted using iHOGA software, to the best of our knowledge.
iHOGA software simulated 15 sets of results for each value of loads considered, i.e., 3 values of load × 5 combinations of acquisition costs = 15 sensitive cases. Each of these 15 cases was simulated by iHOGA software that performed single objective optimization considering 15.5% as the interest rate and 7.13% as the inflation rate for a study period of 15 years. iHOGA considered GA for the main algorithm and evaluated all the combinations of the secondary algorithm with 12,6601 cases. For each combination of sensitive cases, iHOGA produced at least 15 results in the form of a tabular column, with the first row being the best-optimized result. iHOGA sized the RE system considering PV, WT, and batteries, as shown in
Figure 10. A generic bi-directional inverter was used for the chosen HRES system. NPC, CO
2 emissions, and job creation prospects have been discussed for each of the sensitive cases. For a developing country like India, it is a key requirement to understand the job creation prospects when such projects are to be sanctioned. This objective is unique for iHOGA software, where the job creation data of each technology (number of jobs per GWh of generated energy) is considered by the software to calculate this criteria.
7.1. Analysis of Each Sensitive Cases
This sub-section summarizes the optimum sized HRES system for all the sensitive cases discussed earlier in
Section 6. The sensitivity analysis includes the variation in load and price of the HRES system discussed in
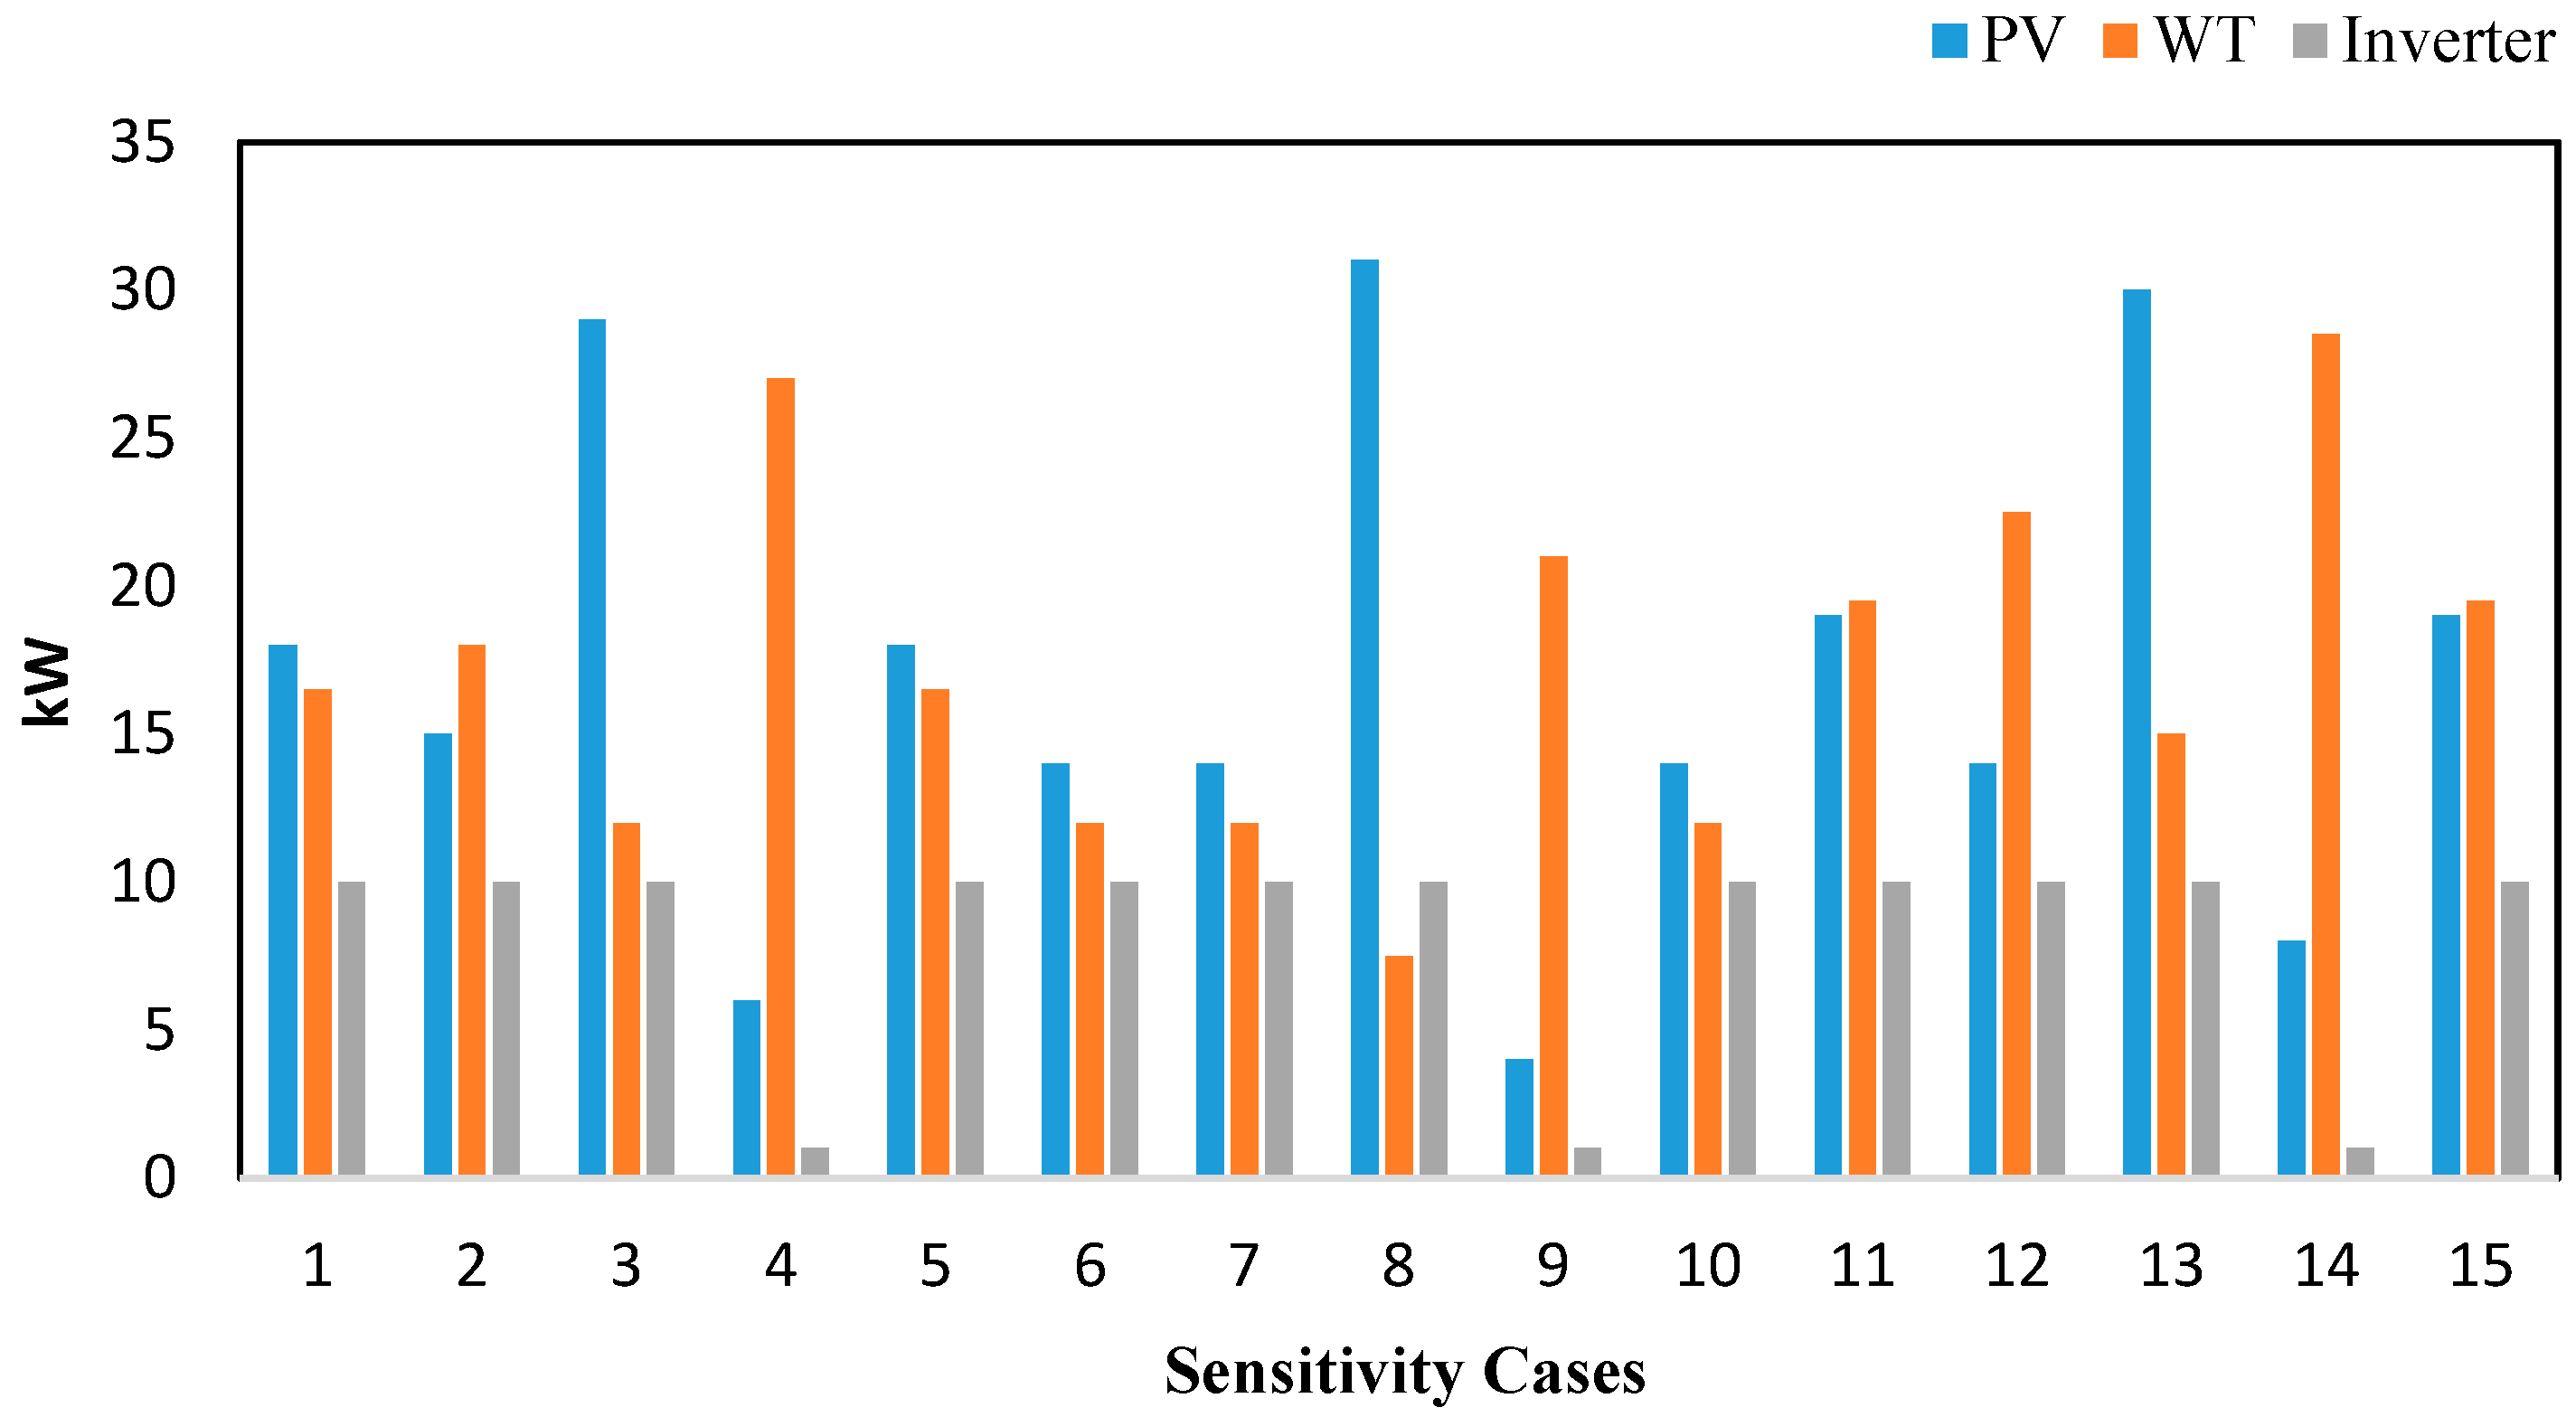
Section 7. Considering the three load values, an actual load of Aralvaimozhi of 183.4kWh/day, 0.75 times the actual load value, and 1.15 times the actual load are considered as probable load variations. However, with the technological development in the RE world, it is also necessary to analyze the impact of the variation of the price of the RES. Hence, variation of PV, WT, and battery has been studied. The size of HRES for the lowest value of NPC for all the aforementioned sensitive cases is shown in
Figure 11. It can be noted that for any considered value of the load, the prices of WT and PV place a significant role in the sizing of the respective energy system. It is evident that, as the price of the PV reduces by 50% of its actual value in Cases 3, 8, and 13, the PV penetration is higher. A similar trend is observed for wind energy penetration, which is high in Cases 4, 9, and 14.
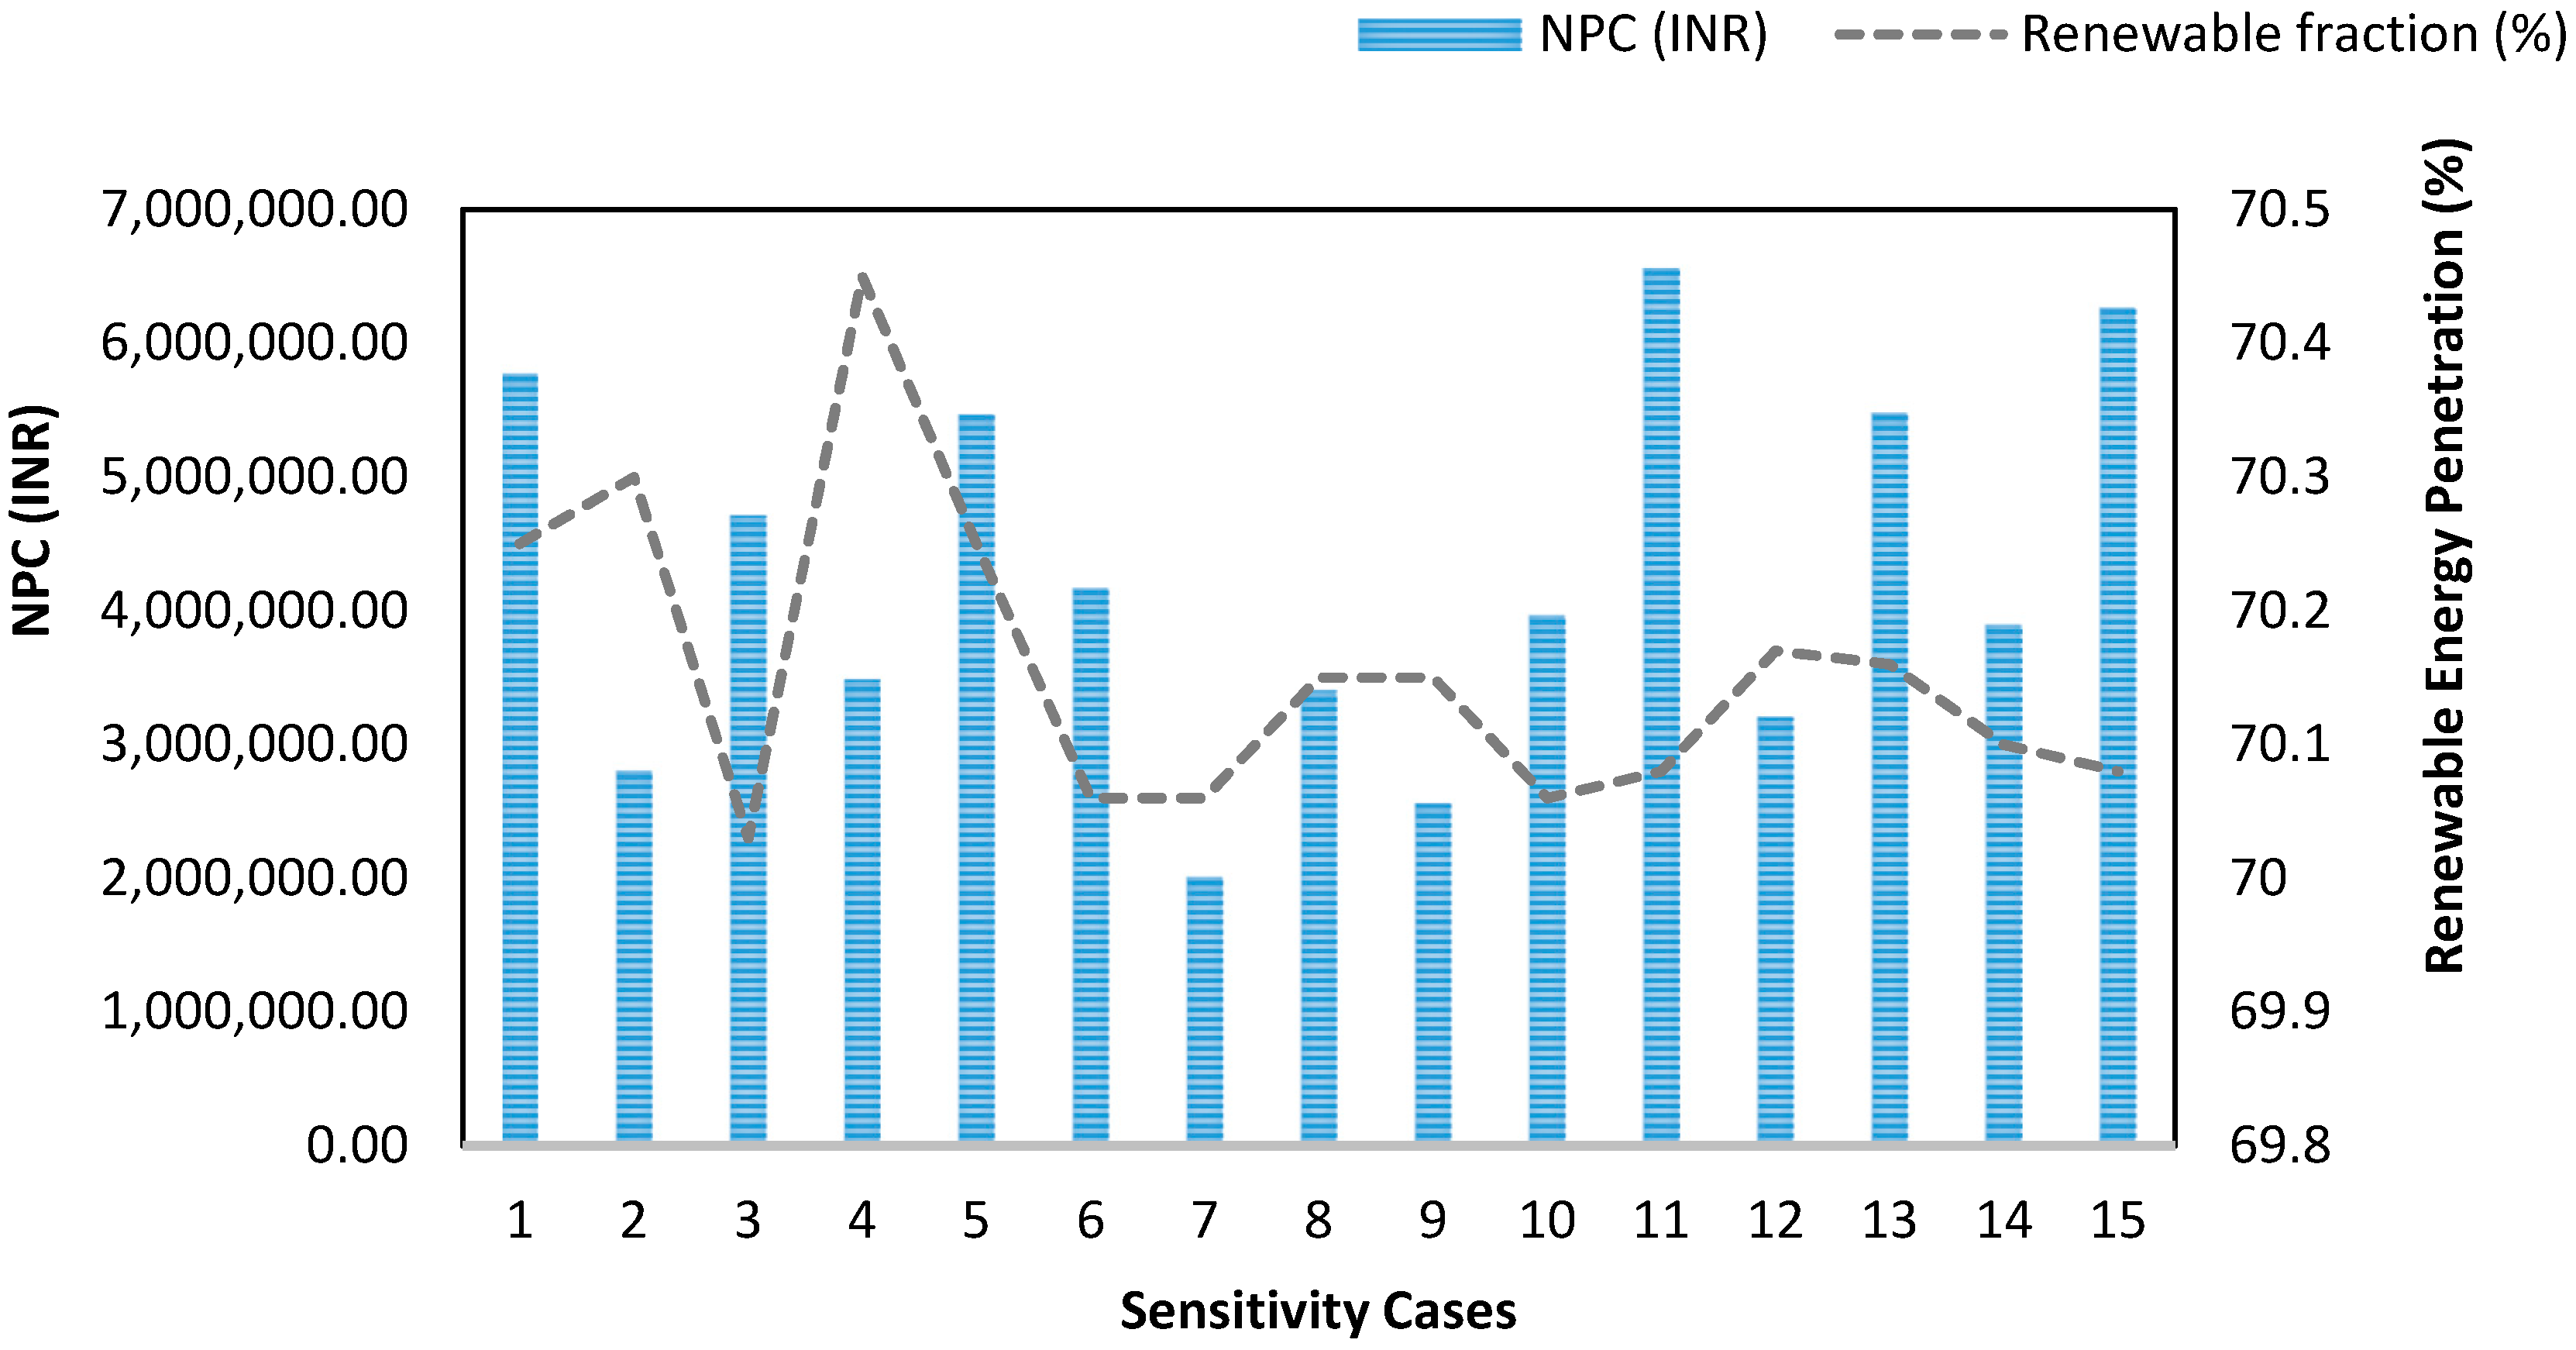
In
Figure 12, the relationship between the NPC and RE penetration is shown. The RE constraint for the analysis was kept to a minimum of 70%. The system with maximum RE penetration is for Sensitivity 4, with 70.45%. The NPC of the system is 34.8Lac (3.48M). This implies that the battery price helps in storing RE efficiently, thus improving the RE penetration. The RE penetration has the lowest value of 70.03 for Sensitivity 3. When Sensitivity 1 and 11 are considered, the NPC increases with the load due to the size of the HRES, which is required to meet the load. However, the smaller the load, the smaller the HRES size required and hence the smaller number of jobs that will be created, which is observed in Sensitivity cases 2, 7, and 12.
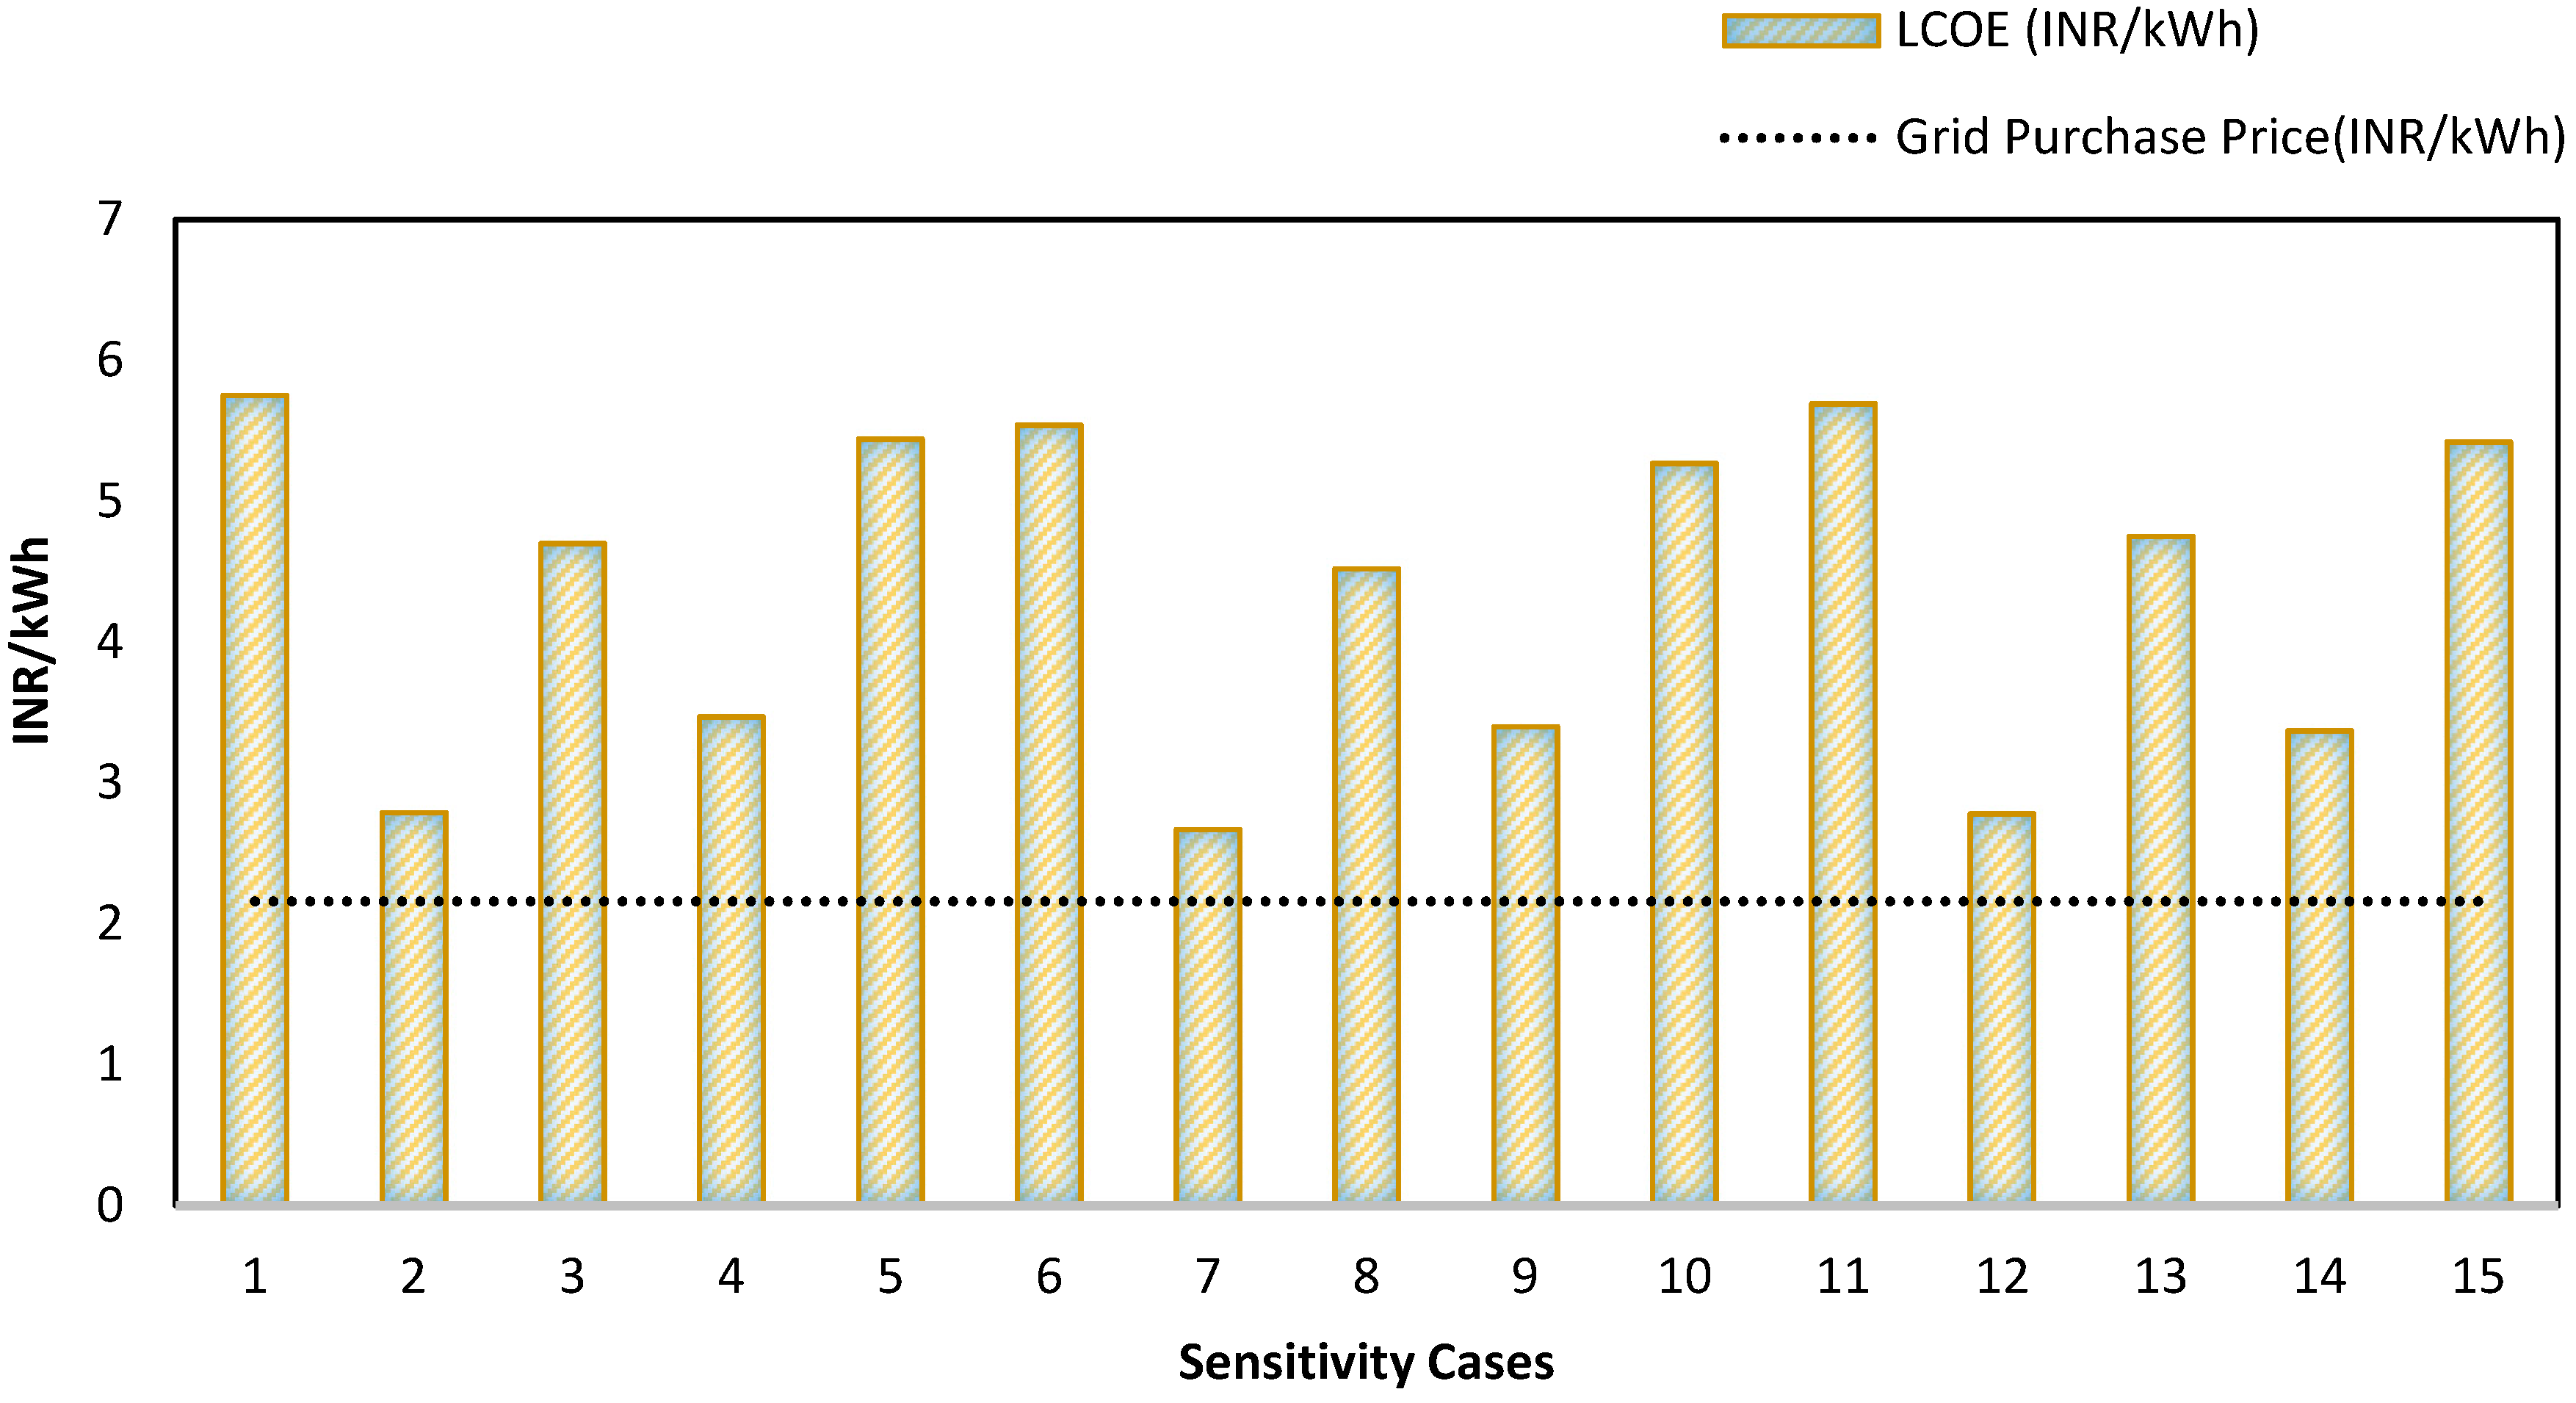
The LCOE from HRES is larger than the power purchased from the electricity grid. However, when the HRES price drops by 50%, the LCOE from the HRES is comparable to the grid power purchase price; this is observed from
Figure 13.
7.2. Triple Bottom Line Analysis
In conventional accounting, to conclude the profitability or the loss of any project, the TBL approach is commonly used. TBL also summarizes the revenues/expenses of a project. In the current study, TBL analysis includes the discussion on the techno-economic, social, and environmental aspects involved in adopting HRES for Aralvaimozhi community. In this study, the techno-economic analysis aspect of the TBL approach elucidates the costs involved (NPC) in adopting the technology, while the social aspect explains the job creation aspect if this project is adopted. Finally, the environmental aspects include the CO
2 emissions from the HRES.
Table 3 summarizes the NPC, CO
2 emissions, and jobs creation, the aspects involved in the TBL approach, of the best-generated result for each sensitive case studied. All the sensitive cases provided in
Table 3 consider HRES connected to the grid through battery storage with an autonomy of 2.4 h.
7.2.1. Techno-economic analysis
For the current market price of the technology considered in cases 1, 6, and 11, the results elucidate that the NPC of the system directly relates to the load of the community. This is due to the direct relationship between the cost of the system and the load value. When the community load is 0.75 * the actual load (Sensitivity 6), there is a decrease in NPC by 1.45 times the NPC of the current scenario (sensitivity 1). As the load increases to 1.15 times the actual load, the NPC increases by 16Lac (1.6M). Due to RE output of PV and WT, which in turn depends on the size of the system, there is an inverse relationship observed between NPC and CO2 emissions. As the size of PV or WT increases, the NPC of the system increases, and this in turn decreases the CO2 emission, as projected in Cases 3, 4, 5, 8, 9, 10, 13, 14, and 15.
For any given load value, the market price of the HRES has a considerable influence on the NPC and LCOE. As the market price of the HRES drops by more than 50% of the current price, the COE reduces to a minimum of approximately 2.8 INR/kWh, as highlighted in Cases 2, 7, and 12. Scrutinizing the relationship between NPC and COE of the system, a 50% decrease in the individual prices of PV and WT results in a sharp decrease in NPC and LCOE, as emphasized in Cases 3, 4, 8, 9, 13, and 14. The decrease in the price of WT by 50% has a phenomenal impact on the economics of the system, with the COE reducing to half of the price in Cases 4, 9, and 14. Considering Cases 2, 7, and 12, when the acquisition cost of all the components drops by a minimum of 50%, there is a remarkable decrease in the NPC of the HRES. However, there is not much impact on NPC and LCOE when the battery price is reduced to 50%, as showcased in Cases 5, 10, and 15. This is due to the battery autonomy being considered, which has a small value of about 2.4 hours only. Nonetheless, a significant influence is seen on the LCOE of HRES being reduced by at least 3 INR/kWh when the overall price of PV, WT, and the battery are reduced by 50%. Thus from the techno-economic analysis, the study projects promising economical gains from this project if at least the price of WT reduces by 50%. If the price of the overall HRES decreases by 50%, this project will have a high economic benefit. For the present situation, the economic gains are not significant due to the high capital cost of the system.
7.2.2. Environmental Analysis
India has been consistently working on mitigating the GHG emissions as it exhibits an impact on climate change. As a part of the mitigation plan, India has formulated the National Action Plan on Climate Change and is a part of the United Nations Framework Convention on Climate Change (UNFCC), and aims to mitigate the GHG of its GDP by 20–25% by 2020. A study conducted has found an affirmative and explicit impact of financial development on per capita CO
2 emissions, which further elaborates on how financial development helps in alleviating environmental issues [
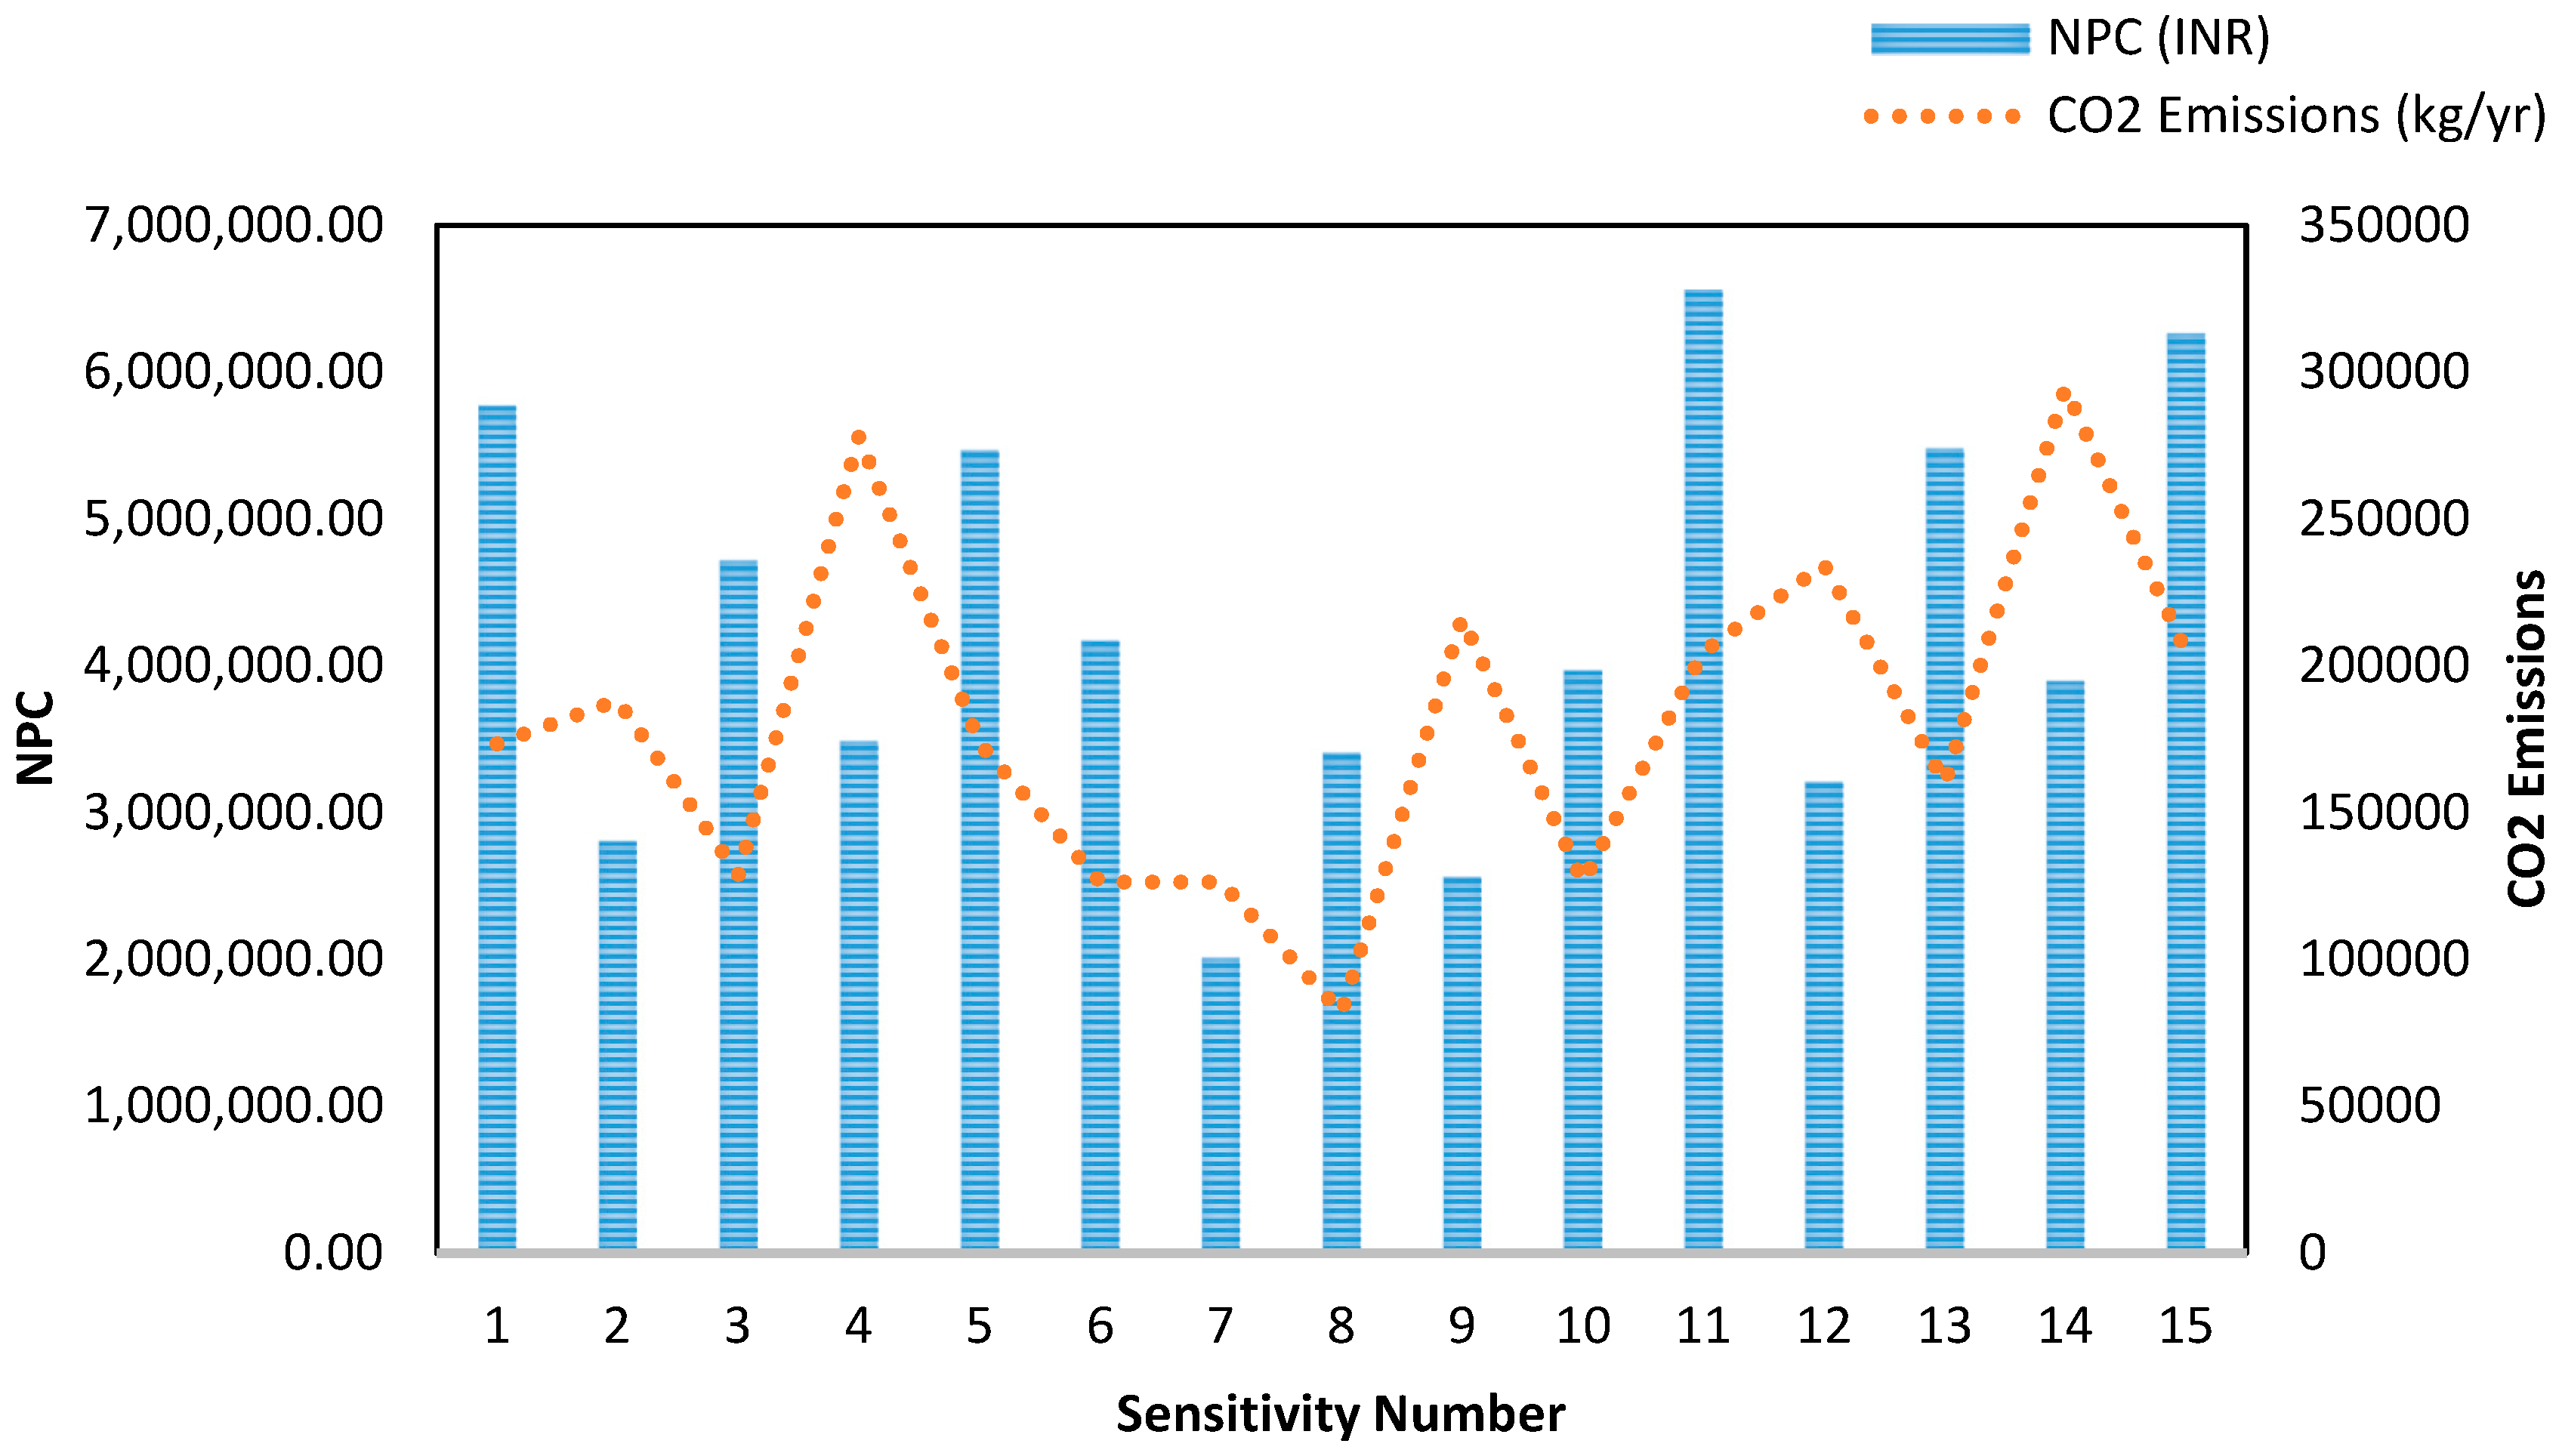
46]. Thus, it is necessary to understand how the adoptability of HRES affects the environment. From
Figure 14, it is concluded that the HRES with a smaller value of NPC had larger CO
2 emissions, while the HRES with smaller CO
2 emissions had a larger NPC value. The CO
2 emissions are least 81874.9/ kgCO
2/yearfor HRES with 34Lac (3.4 M), and the emission is maximum emission for Sensitivity 14 with 294,547.59. If the CO
2 emission trend is observed, Sensitivity 3, 6, 8, and 10 have CO
2 emissions less than 13,000 kg/yr. Thus, it could be concluded that the load and capital cost of the HRES have an inverse effect on the CO
2 emissions. From the environmental analysis, it can be concluded that the CO
2 emission can be mitigated by adopting HRES compared to the present situation of conventional energies supplying electricity to Aralvaimozhi through the grid. Thus, from the environmental analysis, integrating HRES provides a significantly positive influence for the project.
7.2.3. Social factor
The social factor considered in this study is the jobs created due to HRES integration into a micro-grid in the Aralvaimozhi community. Employment created by photovoltaic and wind power is considered in jobs per MW of peak power [
42].
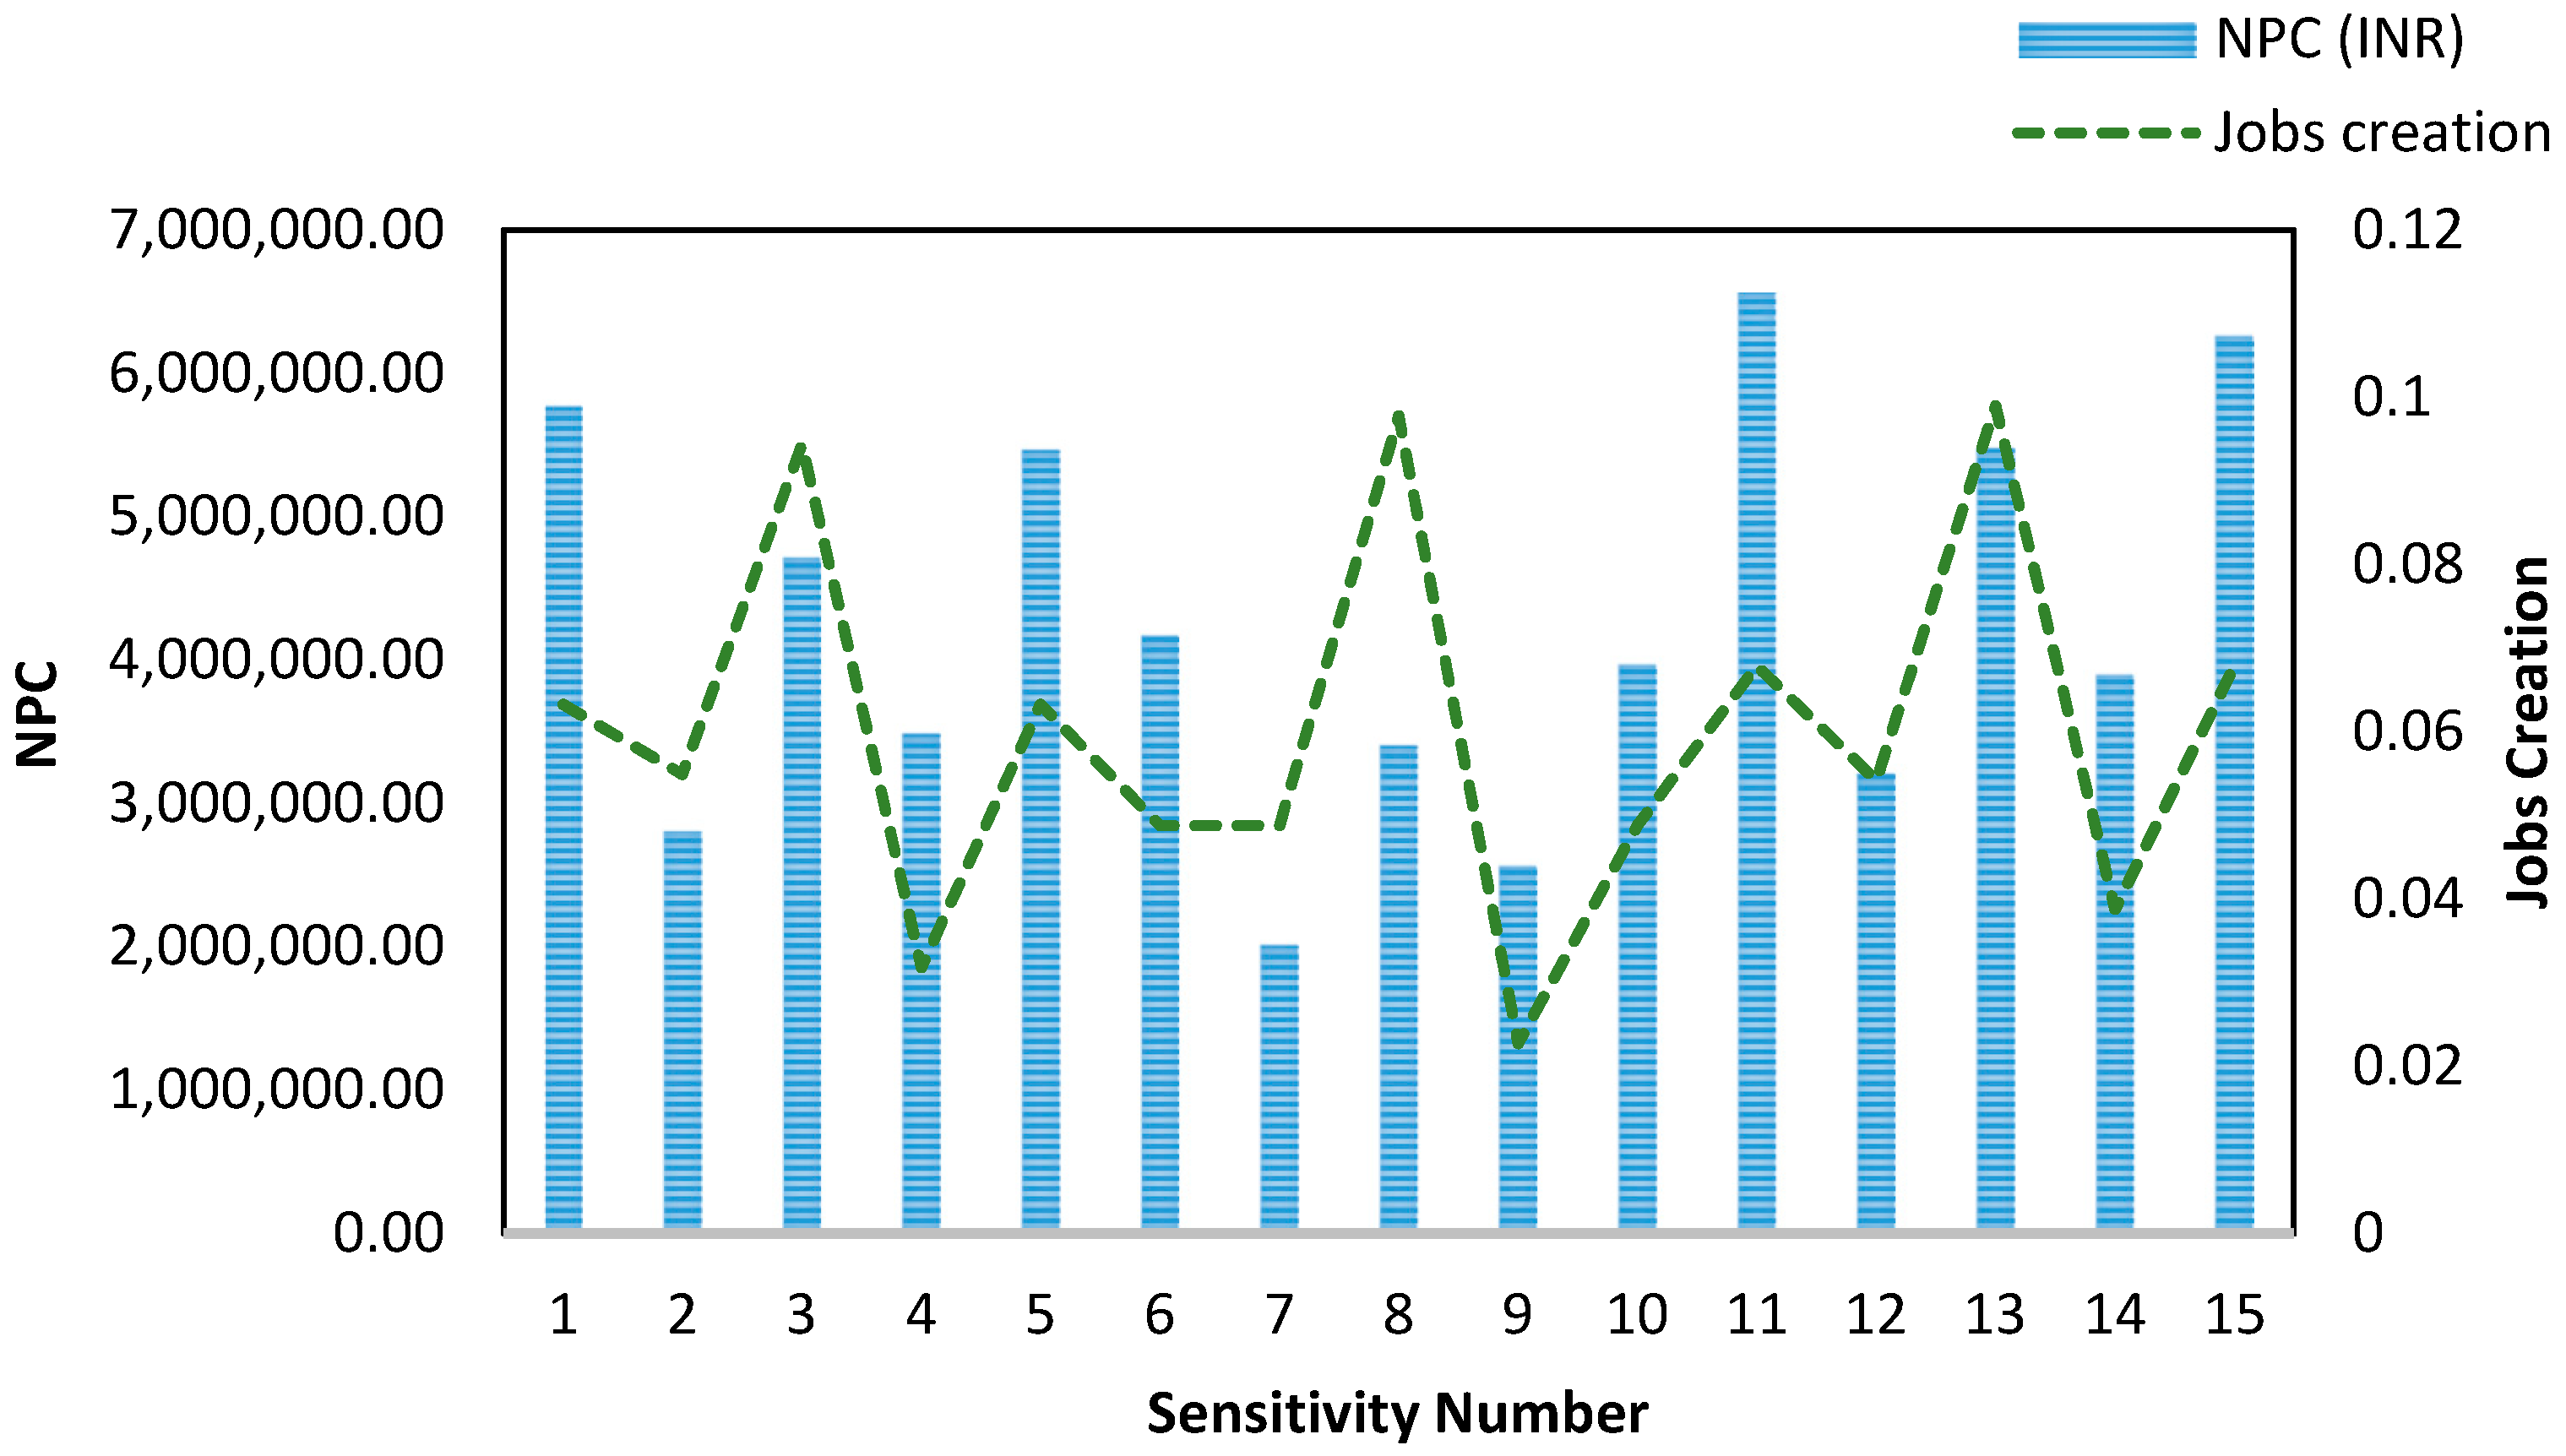
Figure 15 shows the NPC and jobs created for the best solution for each sensitivity case considered. Job creation is a maximum of 0.99 for Sensitivity Case 13. This validates the calculation of Job created per MW of energy by iHOGA. This concludes that for larger load values, a bigger HRES is required to serve the load. This influence on the NPC, being a large value utilization, results in the maximum number of jobs created. For Cases 4, 9, and 14, the job opportunities are considerably low because batteries do not influence or create much of a job market compared to other RE systems.
Figure 15 also illustrates that when the PV penetration is larger, as the price of the PV reduces by 50%, the jobs created variable is at its maximum, as observed in Cases 3, 8, and 13.
This implies that larger integration of PV for the Aralvaimozhi community provides a positive social impact by creating greater job opportunity for Aralvaimozhi and for India in general. Thus, from the perspective of the influence of social factors on HRES integration, there is a significantly positive outcome due to the job opportunities the HRES creates for the Aralvaimozhi community and for a developing country like India.
8. Conclusions
Despite India facing its biggest challenge, pollution, in recent years, its reliance on coal for its main energy source has also been a significant cause of the pollution. Due to the population explosion, the currently available energy source has been unsuccessful for meeting the electricity demand. Exploring and exploiting RE for India is indeed the need of the hour. Adopting RE solves multiple problems, including mitigating CO2 emissions, meeting the energy deficit, and reliance on the inexhaustible energy source, and provides jobs for the local community. Though the Government of India has taken significant steps to aid in RE adoption (this is observed to be existing on a larger scale), there remains a wider gap between the aims and achievements of the Indian Government. If people of India take an initiative in RE adoption, the aforementioned problems that India is currently facing can be eased to a large extent. This study highlights one such example. For a developing country like India, such initiatives from the local community represent a valuable action. This is one of the important lessons that India has to learn from other developed countries, like the USA, Germany, etc.
From the TBL analysis conducted, the conclusion is that if NPC were to be considered as the prime factor to decide the economic viability, it can be understood that other than the load capacity, the acquisition cost plays a crucial part in the economics of HRES. However, HRES with smaller NPC has more emissions and less job creation. This is related to the size of HRES and the renewable energy fraction; the smaller the RE fraction which in turn is related to the size of HRES, the larger the emissions. This implies that a balance between these factors is necessary to decide the best HRES as all the three factors crucially affect the community adoption of HRES. It is also observed that as the market price of the HRES drops to 50% of the current price, the COE reduces by at least INR 3/kWh for all the loads considered. This implies that an RE has to be easily made available, which can then compete with the easily available conventional energy source of the community. This can only be made possible when the price of HRES reduces by at least 50% of the current price for the current scenario. The plunge in the oil price in recent years has resulted in cost effective RES [
47]; however, how this situation impacts the price of RES for a long-term scenario is debatable.
There is a necessity for further rebates to be provided for HRES to be adopted easily for the general community in India, especially when the HRES involves WT and battery setup. This implies that there is an urgent need to revolutionize the RE price in order to challenge the grid power price, as has been established through this study for the Indian context. A strong energy policy to aid in RE adoption is necessary to supplement the ease of adoption. Other than financial challenges, the very prevalent corruption and politics in India would be the biggest challenges or hurdles for a community like Aralvaimozhi to overcome and become one of the model communities regarding HRES adoption. This study examines the possible HRES adoption and its impacts by performing TBL for a small community in India. This model exemplifies the current situation in India from the TBL perspective. There is a compromise between the least CO2 emitted system and least NPC HRES system. This critical relationship between the economic, environmental, and social factors has been studied thoroughly for different options, and the results are critically examined.
Finally, the key findings and interpretations from this work are as follows:
India is striving hard to achieve its RET; however, there has been no evidence of social commitment from the citizens.
There is a lack of knowledge and information in terms of RE adoption amongst the citizens.
India has a good source of solar and wind energies, and tapping these energies in an efficient manner can aid in increasing the RE adoption.
A timely update of India’s achievement with respect to central and state government policies can help India achieve its RET.
India provides considerable rebates on the RES; this is mostly available for large-scale RE projects.
There has been no FiTs set either by the state government or by the central government to assist in RE adoption for the RE customers (citizens).
The Aralvaimozhi case study explores the current RE market and forms a prototype for RE adoption in terms of techno-economic, environmental, and social aspects.
The present innovative work of pursuing the social aspect of HRES adoption provides a new dimension to the most commonly used techno-economic perspective for RE adoption in the literature.
For the Aralvaimozhi community, RE adoption could help in mitigating the CO2 emissions and provide job opportunities to the community.
The conventional energy reaching the community through the grid is cheaper compared to the COE from the RES; this would be the biggest barrier India (community like Aralvaimozhi) has to encompass to achieve RE adoption.
Author Contributions
Conceptualization, N.S., A.K. and A.Z.; Methodology, N.S.; Software, N.S.; Validation, N.S., A.K., A.Z.; Formal Analysis, N.S.; Investigation, N.S.; Resources, N.S.; Data Curation, N.S.; Writing-Original Draft Preparation, N.S.; Writing-Review & Editing, A.K. and A.Z.; Visualization, N.S.; Supervision, A.K. and A.Z.; Project Administration, A.K. and A.Z.
Funding
This research received no external funding.
Acknowledgments
The authors gratefully acknowledge the contribution of P.Ravindranath, Director, Unitron Energy Systems Pvt. Ltd., India; Shajan.C, IndoWind Energy Ltd., Tamil Nadu, India; and Manak, Manak engineering Services, India, for providing us with the data for this research work. We would also like to thank Victoria University for granting us a scholarship to pursue this work.
Conflicts of Interest
The authors declare no conflict of interest. The funders had no role in the design of the study; in the collection, analyses, or interpretation of data; in the writing of the manuscript, and in the decision to publish the results.
Nomenclature
| RE | Renewable Energy |
| RES | Renewable Energy System |
| DG | Distributed Generation |
| HRES | Hybrid Renewable Energy System |
| GHG | Green House Gas |
| NSM | National Solar Mission |
| JNNSM | Jawaharlal Nehru National Solar Mission |
| FiTs | Feed-in- tariffs |
| PV | Photovoltaic cell or solar cell |
| WT | Wind Turbine |
| RET | Renewable Energy Target |
| GDP | Gross Domestic Product |
| PPP | Purchasing Power Parity |
| NPC | Net Present Cost |
| CO2 | Carbon-di-Oxide |
| HDI | Human Development Index |
| RE | Renewable Energy |
| RES | Renewable Energy Sources |
| DG | Distributed Generation |
| HRES | Hybrid Renewable Energy System |
| GHG | Green House Gas |
| NSM | National Solar Mission |
| JNNSM | Jawaharlal Nehru National Solar Mission |
| FiTs | Feed-in- tariffs |
| PV | Photovoltaic cell or solar cell |
| WT | Wind Turbine |
| RET | Renewable Energy Target |
| GDP | Gross Domestic Product |
| PPP | Purchasing Power Parity |
| NPC | Net Present Cost |
References
- Dubey, S.R. Energy Crisis in India: A Commentary on India’s Electricity Sector; Partridge Publishing: Gurgaon, India, 2015. [Google Scholar]
- Mittal, S.; Dai, H.; Fujimori, S.; Masui, T. Bridging greenhouse gas emissions and renewable energy deployment target: Comparative assessment of China and India. Appl. Energy 2016, 166, 301–313. [Google Scholar] [CrossRef]
- Moriarty, P.; Honnery, D. What is the global potential for renewable energy? Renew. Sustain. Energy Rev. 2012, 16, 244–252. [Google Scholar] [CrossRef]
- Kralova, I.; Sjöblom, J. Biofuels–renewable energy sources: A review. J. Dispers. Sci. Technol. 2010, 31, 409–425. [Google Scholar] [CrossRef]
- Lipp, J. Lessons for effective renewable electricity policy from Denmark, Germany and the United Kingdom. Energy Policy 2007, 35, 5481–5495. [Google Scholar] [CrossRef]
- Panwar, N.L.; Kaushik, S.C.; Kothari, S. Role of renewable energy sources in environmental protection: A review. Renew. Sustain. Energy Rev. 2011, 15, 1513–1524. [Google Scholar] [CrossRef]
- Hafez, O.; Bhattacharya, K. Optimal planning and design of a renewable energy based supply system for microgrids. Renew. Energy 2012, 45, 7–15. [Google Scholar] [CrossRef]
- Erdinc, O.; Uzunoglu, M. Optimum design of hybrid renewable energy systems: Overview of different approaches. Renew. Sustain. Energy Rev. 2012, 16, 1412–1425. [Google Scholar] [CrossRef]
- Kaundinya, D.P.; Balachandra, P.; Ravindranath, N. Grid-connected versus stand-alone energy systems for decentralized power—A review of literature. Renew. Sustain. Energy Rev. 2009, 13, 2041–2050. [Google Scholar] [CrossRef]
- Kumar, A.; Kumar, K.; Kaushik, N.; Sharma, S.; Mishra, S. Renewable energy in India: Current status and future potentials. Renew. Sustain. Energy Rev. 2010, 14, 2434–2442. [Google Scholar] [CrossRef]
- Sen, S.; Ganguly, S.; Das, A.; Sen, J.; Dey, S. Renewable energy scenario in India: Opportunities and challenges. J. Afr. Earth Sci. 2016, 122, 25–31. [Google Scholar] [CrossRef]
- Hall, T.J. The triple bottom line: What is it and how does it work? Indiana Bus. Rev. 2011, 86, 4–8. [Google Scholar]
- Kalinci, Y.; Hepbasli, A.; Dincer, I. Techno-economic analysis of a stand-alone hybrid renewable energy system with hydrogen production and storage options. Int. J. Hydrogen Energy 2015, 40, 7652–7664. [Google Scholar] [CrossRef]
- Makhija, S.P.; Dubey, S.P. Techno-economic analysis of standalone hybrid energy systems to run auxiliaries of a cement plant located in Jamul, Chhattisgarh, India. Environ. Prog. Sustain. Energy 2016, 35, 221–229. [Google Scholar] [CrossRef]
- Saiprasad, N.; Kalam, A.; Zayegh, A. Optimum Sizing and Techno-Economic Environmental Analysis of Renewable Energy Sources Integration into a Micro-Grid for a University: A Case Study. In Proceedings of the Lectures on Modelling and Simulation; A Selection from AMSE, Calcutta, India, 4–5 November 2017; Volume 2, pp. 11–20. [Google Scholar]
- Varshney, A. Adverse effect of demonetization in India. Int. J. 2017, 5, 166–168. [Google Scholar]
- Girish, G.; Singhania, K.; Vincent, E.N. Solar REC Trading in India. Int. J. Renew. Energy Res. (IJRER) 2017, 7, 1529–1534. [Google Scholar]
- Acharjee, P. Strategy and implementation of Smart Grids in India. Energy Strateg. Rev. 2013, 1, 193–204. [Google Scholar] [CrossRef]
- Bhatia, M.; Banerjee, S.G. Unleashing the Potential of Renewable Energy in India; World Bank Publications: Washington, DC, USA, 2011. [Google Scholar]
- Palchak, D.; Cochran, J.; Deshmukh, R.; Ehlen, A.; Soonee, S.K.; Narasimhan, S.; Mohit, J.; Brendan, M.; Michael, M.; Priya, S. Greening the Grid: Pathways to Integrate 175 Gigawatts of Renewable Energy into India’s Electric Grid, 1. National Study; Lawrence Berkeley National Lab. (LBNL): Berkeley, CA, USA; National Renewable Energy Lab. (NREL): Golden, CO, USA; Power System Operation Corporation (POSOCO): New Delhi, India; US Agency for International Development (USAID): Washington, DC, USA, 2017.
- Sharma, N.K.; Tiwari, P.K.; Sood, Y.R. Solar energy in India: Strategies, policies, perspectives and future potential. Renew. Sustain. Energy Rev. 2012, 16, 933–941. [Google Scholar] [CrossRef]
- Kar, S.K.; Sharma, A.; Roy, B. Solar energy market developments in India. Renew. Sustain. Energy Rev. 2016, 62, 121–133. [Google Scholar] [CrossRef]
- Garud, S.; Purohit, I. Making Solar Thermal Power Generation in India a Reality–Overview of Technologies, Opportunities and Challenges; The Energy and Resources Institute (TERI): New Delhi, India, 2009; p. 110003. [Google Scholar]
- Wencong, S.; Zhiyong, Y.; Mo-Yuen, C. Microgrid planning and operation: Solar energy and wind energy. In Proceedings of the Power and Energy Society General Meeting, Providence, RI, USA, 25–29 July 2010. [Google Scholar]
- Kar, S.K.; Gopakumar, K. Progress of renewable energy in India. Adv. Energy Res. 2015, 3, 97–115. [Google Scholar] [CrossRef]
- Kanase-Patil, A.B.; Saini, R.P.; Sharma, M.P. Integrated renewable energy systems for off grid rural electrification of remote area. Renew. Energy 2010, 35, 1342–1349. [Google Scholar] [CrossRef]
- Velo, R.; Osorio, L.; Fernández, M.D.; Rodríguez, M.R. An economic analysis of a stand-alone and grid-connected cattle farm. Renew. Sustain. Energy Rev. 2014, 39, 883–890. [Google Scholar] [CrossRef]
- Dalton, G.J.; Lockington, D.A.; Baldock, T.E. Feasibility analysis of renewable energy supply options for a grid-connected large hotel. Renew. Energy 2009, 34, 955–964. [Google Scholar] [CrossRef]
- Baños, R.; Manzano-Agugliaro, F.; Montoya, F.G.; Gil, C.; Alcayde, A.; Gómez, J. Optimization methods applied to renewable and sustainable energy: A review. Renew. Sustain. Energy Rev. 2011, 15, 1753–1766. [Google Scholar] [CrossRef]
- Sinha, S.; Chandel, S.S. Review of software tools for hybrid renewable energy systems. Renew. Sustain. Energy Rev. 2014, 32, 192–205. [Google Scholar] [CrossRef]
- Fulzele, J.B.; Daigavane, M.B. Design and Optimization of Hybrid PV-Wind Renewable Energy System. Mater. Today Proc. 2018, 5, 810–818. [Google Scholar] [CrossRef]
- Saiprasad, N.; Kalam, A.; Zayegh, A. Comparative study of optimization of HRES using HOMER and iHOGA Software. JSIR 2018, 77, 677–683. [Google Scholar]
- Rathish, R.J.; Mahadevan, K. Multi-Objective Optimization of Stand-alone Renewable Energy Hybrid System. In Intelligent and Efficient Electrical Systems; Springer Singapore: Singapore, 2018; pp. 1–13. [Google Scholar]
- Bajpai, P.; Dash, V. Hybrid renewable energy systems for power generation in stand-alone applications: A review. Renew. Sustain. Energy Rev. 2012, 16, 2926–2939. [Google Scholar] [CrossRef]
- A. S. D. Center and NASA. NASA Surface Meteorology and Solar Energy. Available online: https://eosweb.larc.nasa.gov/cgi-bin/sse/[email protected] (accessed on 15 June 2016).
- Saiprasad, N.; Kalam, A.; Zayegh, A. Zero-emission renewable energy system model for a community in India. In Proceedings of the 2017 IEEE PES Asia-Pacific Power and Energy Engineering Conference (APPEEC), Bangalore, India, 8–10 November 2017; pp. 1–6. [Google Scholar]
- Sen, R.; Bhattacharyya, S.C. Off-grid electricity generation with renewable energy technologies in India: An application of HOMER. Renew. Energy 2014, 62, 388–398. [Google Scholar] [CrossRef]
- Lal, D.K.; Dash, B.B.; Akella, A. Optimization of PV/wind/micro-hydro/diesel hybrid power system in HOMER for the study area. Int. J. Electr. Eng. Inform. 2011, 3, 307. [Google Scholar]
- Economics, T. IndiaInflationRate. Available online: http://www.tradingeconomics.com/india/inflation-cpi (accessed on 18 May 2017).
- Bank, H. BusinessLoan. Available online: http://www.hdfcbank.com/personal/products/loans/business-loan/rates-fees (accessed on 9 May 2017).
- Dufo-López, R.; Bernal-Agustín, J.L.; Contreras, J. Optimization of control strategies for stand-alone renewable energy systems with hydrogen storage. Renew. Energy 2007, 32, 1102–1126. [Google Scholar] [CrossRef]
- López, R.D. iHOGA. 2017. Available online: http://personal.unizar.es/rdufo/iHOGA%202.4%20User%20manual.pdf (accessed on 10 May 2017).
- Cameron, L.; van der Zwaan, B. Employment factors for wind and solar energy technologies: A literature review. Renew. Sustain. Energy Rev. 2015, 45, 160–172. [Google Scholar] [CrossRef]
- Dufo-López, R.; Cristóbal-Monreal, I.R.; Yusta, J.M. Optimisation of PV-wind-diesel-battery stand-alone systems to minimise cost and maximise human development index and job creation. Renew. Energy 2016, 94, 280–293. [Google Scholar] [CrossRef]
- Magazine, P. Solar PV feed-in Tariffs Cut in Tamil Nadu. 2016. Available online: https://www.pv-magazine.com/2016/04/04/solar-pv-feed-in-tariffs-cut-in-tamil-nadu_100024002/ (accessed on 15 May 2017).
- Boutabba, M.A. The impact of financial development, income, energy and trade on carbon emissions: Evidence from the Indian economy. Econ. Model. 2014, 40, 33–41. [Google Scholar] [CrossRef]
- Khan, M.I.; Yasmeen, T.; Shakoor, A.; Khan, N.B.; Muhammad, R. 2014 oil plunge: Causes and impacts on renewable energy. Renew. Sustain. Energy Rev. 2017, 68, 609–622. [Google Scholar] [CrossRef]
© 2019 by the authors. Licensee MDPI, Basel, Switzerland. This article is an open access article distributed under the terms and conditions of the Creative Commons Attribution (CC BY) license (http://creativecommons.org/licenses/by/4.0/).


