Evaluation of Energy Efficiency Potential for the Building Sector in the Arab Region

Building Systems Program, University of Colorado Boulder, Boulder, CO 80309, USA
Energies 2019, 12(22), 4279; https://doi.org/10.3390/en12224279
Submission received: 23 October 2019
/
Revised: 7 November 2019
/
Accepted: 8 November 2019
/
Published: 9 November 2019
(This article belongs to the Special Issue Energy Efficiency in Buildings: Both New and Rehabilitated)
Abstract
:The paper overviews the current energy demand trends in the building sector for the Arab region using reported historical energy consumption. Moreover, the paper describes the current energy efficiency policies and regulations for all the Arab countries specific to both residential and commercial buildings. Finally, the paper evaluates potential benefits for large-scale energy efficiency programs specific to new and existing building stocks within the Arab region using a bottom-up analysis approach. The analysis of the available energy consumption for all the Arab countries has shown that the Arab region presents a significant variation in energy consumption levels between its sub-regions and countries. Indeed, the Arab region includes oil-producing countries such as Saudi Arabia with the largest energy use per capita in the World with over 9000 kWh/person of electricity used annually in buildings. However, the same region has the least developed countries such as Sudan and Yemen with the lowest energy use per capita in the World with barely 100 kWh/person/year of electrical consumption. The review of the existing regulations has indicated that several Arab countries have not implemented any energy efficiency codes and standards for building envelope, lighting, heating and cooling equipment, and appliances. A cost-effectiveness analysis has indicated that the Arab region can incur significant benefits in upgrading the energy efficiency of its new and existing buildings especially its households. Specifically, the adoption and the enforcement of stringent energy efficiency codes for new residential and commercial buildings can result in a reduction of 12.7 TWh/year in final annual energy consumption for the Arab region. Moreover, retrofit programs targeting existing buildings can save up to 470 TWh or a third of the building sector final energy consumption per year after 2030. Combining comprehensive energy efficiency requirements for new buildings and extensive retrofit programs for existing buildings would reduce the total final energy consumption of the building sector in the Arab region by 600 TWh by 2030 and by 900 TWh by 2050 if all the energy programs start to be implemented by 2020.
Keywords:
Arab region; building sector; energy efficiency; energy productivity; GCC; Maghreb; Mashreq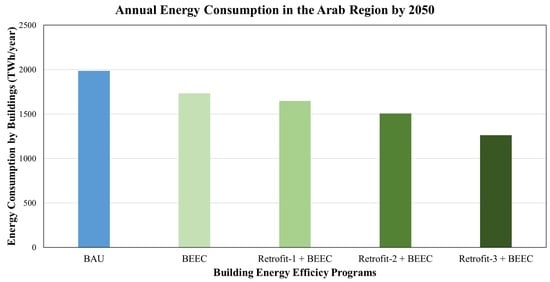
1. Introduction
From 1990 to 2015, the total primary energy supply (TPES) in the Arab region (The Arab region includes the following countries: Algeria, Bahrain, Egypt, Iraq, Jordan, Kuwait, Lebanon, Libya, Mauritania, Morocco, Oman, Palestine, Qatar, Saudi Arabia, Sudan, Syria, Tunisia, United Arab Emirates, and Yemen.) has increased three-fold following the same trend of population growth as noted in Figure 1a using recent International Energy Agency (IEA) data [1]. However, the gross domestic product (GDP) has increased only 60% during the same period indicating an increase in energy intensity and ultimately a decrease in the energy productivity of the overall Arab region economy (The energy productivity, defined as the inverse of the energy intensity, is the ratio of GDP per total primary energy supply). Specifically and during the 1990–2015 period, the per capita GDP in the Arab region has been only slightly above the World averages but has remained significantly less than similar indicators reported for the European Union (EU) and the United States (US) as noted in Figure 1b. It should be noted, however, that the per capita GDP varies significantly within the Arab region, especially between the Gulf Cooperation Council (GCC) countries and other countries. During the 1990–2015 period, the Arab region’s primary energy use (expressed in ton of oil equivalent or TOE) per capita has increased steadily and has reached the World average of 2.0 TOE/person during 2015 as indicated in Figure 1c. Both the EU and US have significantly higher energy use per capita values which have been declining since 2008 to settle at 3.0 TOE/person and 7.0 TOE/person levels during 2015 [1].
Because of these trends for both GDP and TPES, the overall energy productivity, defined as the ratio of GDP and TPES, has been decreasing in the Arab region while it is increasing in the rest of the World including EU and US as shown in Figure 1d. It has been argued that energy productivity value provides an indicator of a country’s economy, energy, and environmental performance and helps to allocate energy resources to optimize economic growth [2,3]. In particular, the EU has been able to improve its energy productivity by more than 50% between 1990 and 2015 most likely through diversification of its economy in order to rely less on energy-intensive industries and more on the service sector. The improvement in energy productivity can also be associated with enhancements of energy efficiency for the building and transport sectors. Similar arguments have been given to justify the increase in energy productivity, albeit less significant compared to that of EU region, in several countries including the US [4].
The relative decrease in the energy productivity for the Arab region shown in Figure 1d can be attributed to a wide range of factors. In particular, the region has experienced in the last two decades a growing rate of urbanization and a rising standard of living. These two factors have resulted in a sharp increase in energy consumption especially for services that are not directly related to the productive sectors. In addition, the significant reliance in some Arab countries on energy-intensive activities (i.e., industry) with low value added has resulted in a significant increase in energy consumption outpacing the rise in the GDP level. Another significant factor for low energy productivity is the reduced penetration of high energy efficiency practices and best available technologies in all economic sectors. In order to improve its energy productivity and decouple its energy consumption from its GDP creation, the Arab region has to start diversifying its economy and most importantly improving the energy efficiency of all its sectors (i.e., industry, transport, and buildings). In this paper, potential benefits of large-scale implementation in the Arab region of energy efficiency programs are evaluated for the building sector. First, general trends of energy consumption are assessed for the Arab region and are compared to other regions in the World. In particular, contributions of the building sector to the total primary and final energy consumptions are estimated based on available historical data. Current energy efficiency indicators, as well as energy policies related to the building sector, are then presented for the Arab region, sub-regions, and various countries. Finally, potential benefits from specific energy efficiency programs targeting new and existing residential and commercial buildings in all Arab countries are analyzed. In particular, predictions of the impacts of large-scale implementation of these energy policies on future energy demands in the building sector are estimated for various countries of the Arab region.
The analyses conducted in this study are based on well-documented data sets, methods, and models as noted throughout this paper. However, the study provides a unique application of these analyses to consider the potential energy, economic, and environmental benefits of improving the energy efficiency of new and existing buildings in all the countries of the Arab region.
2. Overall Energy Consumption Trends
2.1. Analysis for Arab Region
2.1.1. Primary Energy Supply
Throughout the last two decades, the Arab region consumed mostly oil products and natural gas to power its economy. During 2015, the Arab region relied mainly on oil products (50%) and natural gas (46%) to meet its primary energy needs. Besides biofuels and waste (2%) and hydro (1%), insignificant other renewable energy resources are utilized as noted in Figure 2 which compares the primary energy mix of the Arab region to that reported for the World, the EU, and the US during 2015 [1]. Unlike the case of the Arab region, coal has been used to meet a significant part of the energy needs of other regions in the World contributing respectively 28%, 16%, and 17% of the total primary energy supply (TPES) specific to the World, the EU, and the US. Nuclear, hydro, and renewables (i.e., sources with no carbon emissions) are also prominent in other regions of the World serving up to 18% (World), 28% (EU), and 17% (US) of TPES.
2.1.2. Final Energy Consumption
Figure 3 presents the annual variation and distribution of total final energy consumption (TFEC) in the Arab region during the 1990–2015 period using reported data [1]. As noted in Figure 3, the Arab region has seen a significant increase in energy consumption with an average annual growth rate of 10% since 1990. During 2015, the Arab region consumed almost 5000 TWh of energy to meet its economy’s needs. Most of these needs are attributed to the industry and transport sectors with 31% and 32%, respectively. However, the contribution of the building sector, estimated at 21% during 2015, has been steadily increasing especially during the last decade. Indeed, the increase in energy used by non-residential buildings has more than doubled compared to the annual growth of the overall TFEC for the Arab region. Specifically, the annual growth rate in energy consumption specific to commercial and public services buildings has averaged almost 25% during the period between 1990 and 2015 [1]. As noted in Figure 8, the annual growth rate of the energy used by the residential buildings follows closely that reported for the overall Arab region TFEC during the 1990–2015 period.
The overall Arab region per capita final energy consumption, electricity use, and carbon emission are rather low as noted in Figure 4 comparing the annual energy indicators with those reported for the World, US, and EU [5]. Overall, the per capita energy use and electricity consumption in the Arab region are close to the World averages but significantly lower than those reported for EU and US as clearly indicated in Figure 4a,b. Due to this low per capita energy use, the Arab region generates slightly less carbon emissions per person than the World average and significantly less than the EU and US as noted by Figure 4c. However, the per capita energy use and carbon emissions have been steadily increasing in the Arab region while decreasing in EU and the US especially during the last decade. The trend for higher energy consumption including electricity demand in the Arab region is expected to continue over the next decade especially in the building sector due to a high population growth, a significant urbanization rate, as well as rising standards of living associated with aspirations for greater comfort. The increase in energy consumption in the Arab region is also aided by reduced prices of some household equipment, often with very poor efficiency ratings, making them affordable to an increasingly high number of potential consumers. Indeed, the annual urban population growth rates in Arab countries range between 2% to 6% with an average for the region of 3.8% [6]. Moreover, a total of 4.3 USD trillion is forecast to be spent on construction in the Arab region over the next decade, representing cumulative growth of 80% [7,8].
2.2. Analysis of Sub-Regions
The Arab region is generally divided into four sub-regions as defined in Table 1 based on several criteria including geographical locations, cultural tendencies, and living standards. These sub-regions include:
- Gulf Cooperation Council (GCC) countries with Bahrain, Kuwait, Oman, Qatar, Saudi Arabia, and the United Arab Emirates
- Mashreq countries with Egypt, Iraq, Jordan, Lebanon, Palestine, and Syria
- Maghreb countries with Algeria, Libya, Morocco, and Tunisia
- Least developed countries (LDC) including Mauritania, Sudan, and Yemen.
Table 1 summarizes the population, the GDP per capita, and the total primary energy supply (TPES) per person for each sub-region based on 2015 data [1]. The GCC with the lowest population has the highest values for both primary energy use as well as GDP per person. The Mashreq and the Maghreb have similar economic and energy indicators even though the Mashreq has almost double the population due to the inclusion of Egypt. As expected, the LDC region has the lowest energy use and GDP per capita for all the Arab sub-regions.
Figure 5 illustrates the variation during the 1990–2015 period in the Arab sub-regions of the per capita GDP, per capita TPES, and energy productivity (i.e., ratio of GDP and TPES). As expected, the GCC region has significantly higher levels for both economic output and energy consumption per person. Meanwhile the LDC sub-region has the lowest economic and energy use indicators among not only the Arab region but the World. The GDP and the TPES per person follow the same trend during the entire 1990–2015 period for both the Mashreq and Maghreb regions. When considering the energy intensity or the economic output per unit of primary energy supply, referred to as the energy productivity, the LDC region has higher and increasing energy productivity levels during the last decade among all Arab sub-regions. Meanwhile, the GCC region has the lowest and decreasing energy productivity values since 2000 as illustrated in Figure 5c. The energy productivity levels of the Mashreq and Maghreb regions are between those of GCC and LDC with the Mashreq energy productivity exhibiting an increasing trend while that of the Maghreb is decreasing since 2007.
2.3. Country-Specific Analysis
Basic macro-economic indicators for the Arab countries are listed in Table 2 based on 2015 data except for Palestine where 2013 data for 2013 are used [1,5,9]. Moreover, annual variations of these macro-economic indicators for representative countries of the Arab sub-regions are presented in Figure 6. Specifically, Figure 6a–c shows the annual variation of during 1990–2015 period in Saudi Arabia (KSA), Egypt, Tunisia, and Yemen respectively, the per capita GDP the TPES per capita, and the GDP/TPES ratio. As expected, KSA as a representative of GCC sub-region has significantly higher values for both economic output and energy consumption per person. Meanwhile, Yemen representing the LDC sub-region has the lowest economic and energy use indicators. The GDP and the TPES per person follow the same trend during the entire 1990–2015 period for both Egypt and Tunisia representing respectively, the Mashreq and Maghreb sub-regions. Figure 15 indicates that KSA has lower and decreasing energy productivity (i.e., inverse of energy intensity) while Egypt and Tunisia have stagnant energy productivity over the last decade and Yemen is exhibiting a higher albeit inconsistent energy productivity levels.
3. Building Sector Energy Consumption
First, the main drivers for energy use in the building sector are described for the Arab region including the climatic conditions, building stock size, penetration rates of air conditioning systems, and energy subsidies, and current regulations and standards. Then, energy consumption trends for the building sector are presented at various scales including the overall Arab region, the four sub-regions, and the individual countries. Finally, energy efficiency metrics of both residential and non-residential buildings are estimated for the Arab region and its sub-regions with a discussion of typical end-uses for both residential and commercial buildings in the region and representative countries.
3.1. Climate Characteristics
Using hourly weather data for 162 cities, degree-days for both heating and cooling have been estimated throughout the Arab region [10]. Figure 7a shows a contour map of annual heating degree-days (HDD) (Heating degree-days represent the number of degrees for all days in a season with average temperatures below 18 °C) with a base temperature of 18 °C obtained for the Arab region where hourly climatic data are available. Figure 7b presents a similar map obtained for the annual cooling degree-days (CDD) (Cooling degree-days represent the number of degrees for all days of the year with average temperatures above 18 °C) with a base temperature of 18 °C [10]. As indicated in Figure 7a, HDD values of the cities close to coastal areas in the Mediterranean region (characterized by temperate climates using CSa of Koppen–Gieger classification) are higher than in the Arabian Desert region (dominated by arid and semi-arid climates using BWh/BWk and Bsh/BSk of Koppen–Gieger classifications). Therefore, Mediterranean cities would have higher space heating energy requirements in order to maintain acceptable indoor thermal comfort in conditioned buildings during the heating season. In contrast, Figure 7b clearly indicates that sites located in the Arabian Desert are extremely hot and thus require significant energy use to cool buildings compared to sites located in the Mediterranean region. In hot climates such as those in the GCC region, energy consumption for the building sector follows the climatic conditions since most of the buildings are air-conditioned as noted by analyses conducted by Krarti [11] and Krarti et al. [12]. For Saudi Arabia, for instance, the monthly total electricity consumption closely follows the average ambient temperatures [12]. The strong correlation between the electricity consumption and the ambient temperature clearly reflects the importance of air-conditioning during the summer months when electrical demands double compared to levels reported during the winter period.
3.2. Building Stock Floor Area
Detailed census data for building stock and especially building floor area in the Arab region is almost inexistent. However, some studies have utilized limited available census data to estimate the building floor area for residential and non-residential buildings for few Arab countries. Table 3 summarizes these studies, the reported estimated building floor area, and the calculated per capita floor area based on the population data reported by the United Nations (UN) for the census year.
Models for estimating building floor areas have been developed and utilized to assess the energy performance of various building types for countries and regions. In particular, Navigant has indicated that the Middle East and North Africa (MENA) region, which includes most of the Arab countries, has a total building floor area of 4.5 billion m2 during 2014 or 11.5 m2/person [17]. Moreover, another study [18] has reported that the MENA region has 8 billion m2 of building floor area or 18.65 m2/person, a close to the estimate of 20.5 m2/person provided by Harvey et al. [19]. IEA developed based on existing data, a model that provides per capita floor area for residential buildings as a function of GDP per capita for a country or a region [20]. Using the IEA building sector model, Table 4 summarizes the average, minimum, and maximum values per capita household floor area
Using the GDP data for the Arab region, per capita residential building floor area is estimated to range between 11.6 m2/person and 48.1 m2/person with an average of 24.2 m2/person, a metric that is close to the values listed in Table 3 for Tunisia and Saudi Arabia, and to a lesser extent, to that found for Egypt. Indeed, the reported per capita residential floor area of 19 m2/person for Egypt (GDP = 10,000 USD/person) is lower than the average of 23 m2/person, as it may be expected for a country with densely populated urban areas, but is still higher than the minimum value of 9 m2/person.
For non-residential buildings, the estimation of the floor area is even more challenging for the Arab region. Only a few models have been reported with a large variation in per capita floor area estimations for the MENA region and include (i) 5.5 m2/person [21]; (ii) 4.5 m2/person [20]; (iii) 4.0 m2/person [19], and (iv) 2.5 m2/person [22]. The per capita floor area of 2.8 m2/person found for non-residential buildings in Tunisia seems to be in the low range of the reported model’s estimates. Using the range of 2.5 to 5.5 m2/person, the non-residential floor area for the Arab region can be estimated as a function of the population size. In particular, the total floor area for non-residential buildings during 2015 is estimated to range from 950 million m2 to 2091 million m2 with a mean value of 1521 million m2.
3.3. Penetration Rates of Air Conditioning Systems
As noted in Figure 7, the vast majority of the Arab region is characterized by a cooling dominated climate. Thus, air conditioning (AC) systems are generally required to maintain desired indoor thermal comfort for both residential and commercial buildings. Moreover, refrigerators are required to preserve food longer and prevent it from spoiling quickly. The use of AC in buildings, however, depends on the Arab sub-regions. While, AC is available for almost all buildings within the GCC region (i.e., 100% penetration rate, that is, all the buildings have AC systems), the use of active systems (i.e., mechanical equipment) to cool buildings depend on the country and its standard of living. Reported penetration rates of AC systems, as well as refrigerators, are listed in Table 5 for residential buildings for some Arab countries representatives of the Mashreq, Maghreb, and LDC sub-regions. The AC penetration rates forecasted for the Maghreb countries are also provided [23]. As noted in several studies, the penetration rate of AC systems and appliances depends significantly on the income level per capita in each country. The penetration rate of AC systems for residences in the Maghreb and Mashreq ranges currently between 40% and 50% and are forecasted to exceed 80% by 3030 [23]. In the LDC region, the AC penetration rate as well refrigerators are low and do not exceed 30%
Within the Arab region, the GCC sub-region is and will remain in the next decade a significant market for the AC industry. Table 6 lists the number of AC sold during the 2011–2016 period in the Arab region itemized by country using reported data [26]. As indicated in Table 6, GCC represents over 80% of the total AC demand in the Arab region. However, the AC demand in most of the GCC countries has stabilized and has been even slightly decreasing in the last two years most likely to slower economic activities associated with low oil prices.
3.4. Energy Subsidies
Energy prices are highly subsidized in the Arab region as depicted in Table 7 providing total energy subsidies as well as subsidies per capita based on the 2015 International Monetary Fund (IMF) data [27]. Table 8 lists electricity rates for typical households as well as available electricity generating capacity, electricity consumption per capita, and carbon emissions per capita for most Arab countries [1,5,28,29]. As indicated in Table 7, the energy subsidies especially for GCC and oil-exporting countries are among the highest in the World and may explain the high electricity consumption and carbon emissions per person prevalent in several Arab countries as illustrated in Table 8. According to reported IEA data, the Arab countries are among the largest subsidizers of energy in the World. Indeed, six of the World’s ten largest subsidizers are from the Arab region, led by Kuwait, Saudi Arabia, and Qatar [30,31]. Moreover, GCC countries have the highest electricity consumption per capita in the World due to the significant air conditioning loads for buildings, especially during the summer months. However, there is a wide variation in energy consumption levels between Arab countries. Indeed, the Arab region includes some of the highest (i.e., GCC countries as noted earlier) but also some of the lowest users of electricity in the World. For instance, an average person in Yemen consumes only 147 kWh per year, as noted in Table 8, most likely due to low energy accessibility in rural areas.
Table 8 indicates that the Arab region has 232,675 MW of available electric power generating capacity with 6% coming from renewable resources mostly from hydroelectric plants (about 11,000 MW). As part of their national renewable energy plans, most of the Arab countries have set ambitious targets to meet between 10% to 100% of the electricity needs using renewable energy resources by 2030 [29].
3.5. Building Sector Energy Consumption Trends
In this section, the energy consumption specific to the building sector is compiled for the Arab region, sub-regions, and individual countries based on reported data over the last two decades [1]. In particular, the general trends of energy consumption and mix for both residential and non-residential (i.e., commercial and services) buildings are evaluated and discussed.
3.5.1. Overall Trends for the Arab Region
As shown in Figure 8, the total final energy consumption (TFEC) attributed to the building sector has been increasing steadily in the Arab region since 1990 with a clear transition from oil products to electricity use. Indeed, and as clearly illustrated in Figure 8a, the energy mix for the building sector has transitioned from a preference for oil products during 1990 representing 41% of the overall buildings TFEC to a dominance of electricity used to meet over 60% of the total Arab region-building sector needs during 2015. Moreover, the annual total final energy consumption of the buildings has increased consistently since 1990 as indicated in Figure 8b showing a linear trend between years and total building energy uses. If the linear trend continues unchanged, buildings in the Arab countries would consume 1450 TWh by 2030 doubling the 2006 energy consumption level and 2000 TWh by 2050 almost doubling the 2015 energy use level. The share of the building sector in TFEC remained in the range of 18% to 23% over the 1990–2015 period mostly dominated by households’ energy use. Using the reported efficiencies for converting primary energy supply to final energy consumption, the share of the building sector in TPES is estimated for the Arab region has increased over the year from 22% in 1990 to 28% in 2015. Specifically and during 2015, buildings in the Arab countries consumed 1062 TWh mostly electricity (60%) to operate increasing demands attributed mainly to lighting, appliances, and cooling systems [10]. For commercial and public buildings, electricity represents 88% of the total energy consumed in the Arab region. While for residential buildings, electricity covers 50% of the energy needs in most Arab countries. Oil products, natural gas, and renewables provide respectively 21%, 10%, and 9% of TFEC associated with the building sector to meet most likely non-electrical energy demands specific to domestic hot water, cooking, and space heating needs [10].
It should be noted that while electricity represents 60% of the energy used by buildings, it accounts for only 18% of the overall TFEC for the Arab region during 2015. Electricity is generated primarily from natural gas (65%) and oil products (30%) with renewables (3%) and coal (2%) providing minor contributions.
3.5.2. Trends for Arab Sub-Regions
The annual energy consumption associated with the building sector varies significantly among the Arab sub-regions. Since 2010, GCC consumes the most energy attributed to buildings among all four sub-regions due to the drivers outlined in Section 3.1, Section 3.2, Section 3.3 and Section 3.4. However, the building sector represents less than 13% of the overall GCC in the GCC TFEC, one of the lower shares with the Arab region as illustrated in Figure 9. In particular, buildings are responsible during the period 2010–2015 for 27%, 28%, and 42% of TFEC for respectively, the Mashreq, Maghreb, and LDC.
When considering the primary energy requirements to generate electricity commonly used in buildings within the Arab region, the building sector share to TPES increases in all the sub-regions as shown in Figure 10 for 2015. In particular, the building sector share for the GCC sub-region increases from 13% relative to TFEC to 32% relative TPES due to the heavy reliance on electricity to meet the energy needs of buildings.
3.5.3. Trends for Individual Arab Countries
The contribution of the building sector in the national total final energy consumption (TFEC) varies also significantly among countries within the Arab region. Figure 11a shows the annual contribution of the building sector in national TFC for three years 1990, 2000, and 2015 for all the Arab countries with reported data [1]. Among the Arab countries, the TFEC share of the building sector is highest for Sudan (57% in 2015) and is the lowest for Qatar (10% in 2015). For all the Arab countries, residential buildings consume more energy than commercial/public buildings as indicated in Figure 11b.
During 2015, residential buildings in the entire Arab region have consumed 791 TWh of total final energy representing 75% of all energy used by the building sector. Figure 12a illustrates the energy mix used by households in each Arab country during 2015 [1]. Similarly, Figure 12b shows the energy mix for commercial and public buildings specific to the Arab countries with available data during 2015. Generally, the GCC countries utilize mostly electricity while other countries combine electricity with fossil fuels to meet the energy needs for their residential and commercial building stocks. As indicated in Figure 12, Sudan relies heavily on hydroelectric power to cover the electricity needs of its buildings including 84% of the total energy consumed by households. Among all the Arab countries, Saudi Arabia consumes the highest energy for both residential and commercial buildings. Indeed, buildings in Saudi Arabia have consumed 260 TWh during 2015 representing a third of the total final energy used by the building sector in the Arab region.
3.6. Energy Efficiency Indicators
Typically, two indicators are considered to assess the energy efficiency of the building sector: energy use per capita and energy use per floor area. In this section, estimations of these energy efficiency indicators are provided for the Arab region and its sub-regions.
3.6.1. Building Energy Use per Capita
The average building energy consumption per capita for the Arab region has been steadily increasing to almost double from 1990 (1475 kWh/person) to 2015 (2665 kW/person). However, the Arab region per capita building energy use remains low compared to the values reported for the World and the developed countries including EU and especially US as illustrated in Figure 13a [1]. It should be noted that the building energy consumption per capita for EU and US has started to decline since 2009 even though they remain significantly higher than the global average. Similar observations can be made about the building electricity consumption per capita as outlined in Figure 13b. Since 2010, buildings in the Arab region consume slightly more electricity per capita than the average reported for the World. Moreover, electricity meets increasingly higher percentage of the energy needs of the building sector jumping from 34% in 1990 to 60% in 2015.
The per capita building total energy consumption as well as electricity energy use vary widely within the Arab region as clearly shown in Figure 14 for both sub-regions and representative countries. It is clear that buildings in the GCC countries consume significantly more total energy use and electricity per capita than those in the other sub-regions. As noted earlier, electricity constitutes increasingly the vast majority of the energy used by buildings in the GCC and to a lesser extent in the other sub-regions.
The total energy use per capita as well electricity use per capita for both residential and non-residential buildings in the four Arab sub-regions are illustrated in Figure 15 and Figure 16, respectively. The results confirm the observations made earlier: the GCC sub-region’s energy use per capita is significantly higher for both types of buildings compared to the other sub-regions. On the other hand, the LDC sub-region has the lowest energy use per capita not only of the Arab region but of the World.
3.6.2. Building Energy Use per Floor Area
Building energy use per floor area provides another measure of building energy performance using the total occupied space. However, the use of this metric has to be considered with other factors such as the number of occupants and the type of equipment present within the building. For instance, improvements to the envelope, lighting, and heating/cooling systems typically reduce the overall building energy use and thus the building energy use per floor area. However, the addition of spaces may increase the building energy use while decreasing the building energy use per floor areas.
Table 9 lists reported energy use per building floor area, commonly known as energy use intensity (EUI), for the World, EU, US, China, and India [32]. The EUI values for the Arab region, estimated based on the IEA energy consumption data and the average floor area estimates outlined in Section 3.2, are also listed in Table 9 [32].
Two observations can be made from the EUI values summarized in Table 9. First, the Arab region EUI for the building sector has increased during the 2000–2012 period. This increase may be attributed to improvement in living standards and the use of energy-consuming devices such as air conditioning equipment, lighting, and appliances. The EUI values for the building sector in other regions of the World are significantly higher than that of the Arab region, but they have been decreasing. Worldwide, EUI for the building sector has decreased 17.5% in 2012 relative to 2000 levels most likely driven by the adoption and the implementation of significant energy efficiency programs in large economies and countries including US, EU, China, and India.
However, as noted earlier for the building energy consumption per capita, the EUI values vary widely among countries within the Arab region. Figure 17 shows the EUI variations for the 1990–2015 period for the four Arab sub-regions. The GCC sub-region has seen its building EUI doubles from 150 kWh/m2 in 1990 to 300 kWh/m2 in 2015. Meanwhile, the building sector EUI for the Mashreq and Maghreb sub-regions has slightly increased from 45 kWh/m2 in 1990 to respectively 66 kWh/m2 and 85 kWh/m2, in 2015. The EUI for the LDC sub-region has remained constant at about 50 kWh/m2 during the entire 1990–2015 period most likely due to stagnant and low living standards as well as lack of energy-intensive equipment in the building sector including AC systems as discussed in Section 3.3.
Figure 18 shows the EUI variations for the total final energy and electricity consumed by residential buildings during the 1990–2015 period for the four Arab sub-regions. The EUI values outlined in Figure 18 are consistent with reported energy use data of existing residential buildings in some Arab countries that represent three sub-regions: GCC, Mashreq, and Maghreb as summarized in Table 10 and Table 11. In particular, Table 10 summarizes the compiled total residential building floor areas for Tunisia, Egypt, and Saudi Arabia [1]. Table 11 lists data obtained for a wide range of sources for some Arab countries using surveys or audits of existing residential buildings [25,33,34,35,36].
Figure 19 shows the EUI variations for non-residential buildings during the 1990–2015 period for the four Arab sub-regions. The EUI values outlined in Figure 19 are consistent with reported energy use data of existing non-residential buildings in some Arab countries that represent three sub-regions: GCC, Mashreq, and Maghreb as summarized in Table 12.
4. Analysis of Energy Efficiency Potential for the Building Sector
The potential for improving the energy performance of buildings in the Arab region is significant for both new and existing building stocks due to the lack of any stringent energy efficiency codes and practices in most Arab countries. Indeed, several opportunities are available to reduce energy consumption and enhance the sustainability of buildings in the Arab region through well designed and targeted energy policies. In this section, some of these opportunities are compiled and evaluated based on detailed analyses and reported studies. In particular, the potential benefits of large-scale implementation of selected energy efficiency programs are presented for both new and existing building stocks. The analysis is based on a bottom-up approach of the building stock to account for the characteristics of the building stock in the Arab region. The details of the bottom-up approach, as well as the specific characteristics of the building energy models used in the simulation and optimization analyses are outlined in the literature for various countries in the Arab region [2,10,11,12,42,43,44,45,46].
4.1. Benefits for Improved MEPS
The potential benefits of setting minimum energy performance standards (MEPS) based on currently available energy efficiency equipment and appliances commonly used in buildings have been estimated by a study reported by United for Energy Efficiency [47]. In particular, the analysis has considered energy-consuming products commonly used in residential buildings including air conditioners, refrigerators, and lighting. The potential annual savings in both electricity consumption and carbon emissions during 2030 for several Arab countries are summarized in Table 13 (lighting), Table 14 (refrigerators), and Table 15 (room air conditioners) based on the implementation of stricter MEPS in 2020 [47]. While refrigerators are specific to residential buildings, lighting, and room air conditioners can affect energy consumption of both residential and commercial buildings.
As noted in the results shown in Table 13 through Table 15, the overall annual electrical savings that can be achieved by 2030 from updating, implementing, and enforcing MEPS in the Arab region are highest for lighting (26.847 TWh/year) followed by refrigerators (13.851 TWh/year) and then room air conditioners (11.271 TWh/year). Based on business as usual (BAU) projections for 2030, these savings represent 1.9% (lighting), 0.9% (refrigerators), and 0.8% (room air conditioners) of the final energy consumption of the building sector in the Arab region.
Table 16 summarizes the cumulative savings in both electricity energy use and carbon emissions due to improved MEPS for lighting, residential refrigerators, and room air conditioners for each Arab country [47]. It is clear that improved lighting standards have the highest impact among all three options with potential savings over the 10 year period (2020 through 2030) of 227 TWh in electricity consumption and 144 million tonnes in carbon emissions, three times the benefits of improving MEPS for either residential refrigerators or room air-conditioners.
4.2. Impact of LED Systems for Commercial Buildings
For commercial and public buildings, LED fixtures integrated with advanced control capabilities are now becoming more widespread due their ease of installation and lower costs. In particular, LED fixtures with integrated control systems allow a reduction in both lighting power density and lighting energy use since they can act as sensors in small or open spaces and provide daylight dimming controls. A field study has demonstrated and documented the performance of the integrated control LED fixtures for two commercial buildings in the US [48]. Each integrated control LED unit includes LED lamp, driver, a set of daylighting controls, and an occupancy sensor. The LED units are designed to replace T-8 and T-12 fluorescent fixtures using existing wiring systems [48]. The analysis of the reported experimental studies, as well as other simulation based analyses, have shown that integrated controls LED units can save more than 50% of the lighting energy consumption as well as 30% of lighting power density in commercial buildings [48,49,50]. In this section, a large-scale replacement program of fluorescent lighting systems with integrated control LED units is considered for both commercial and public buildings in the Arab region with a 10 year implementation plan starting by 2020. Conservative savings of 40% and 20%, respectively, in electricity energy use and peak demand, are considered for the Arab countries. The conservative estimates are made to take into account that electrical peak demands may not occur at the same time for all building types and all countries. In recent years, however, the vast majority of Arab countries have their highest electricity demands occur during the hot summer days.
The potential benefits for such a program are summarized in Table 17 for each Arab country for both 2025 and 2030 including savings in electricity consumption, peak electrical demand, and carbon emissions using the same approach as detailed in [47]. The overall reduction in annual electrical energy use is estimated at 21.660 TWh at the end of 2030 representing 1.5% of total final energy consumed by the building sector in the Arab region. It should be noted that this program can be implemented and enforced through a retrofit program specific to commercial and public buildings. Moreover, it should be noted that while lighting MEPS affect only the power density installed, the control LED lighting units result in lower time of use of the lighting systems and thus are more effective in reducing in electricity consumption as illustrated by their potential savings shown in Table 17 for non-residential buildings. These savings have the same order of magnitude as those estimated for improved lighting MEPS applied to both residential and non-residential buildings listed in Table 13.
4.3. Impact of EE Programs for New Buildings
As noted earlier, there are no specific mandatory building energy efficiency codes (BEECs) in several Arab countries. BEECs includes a set of mandatory design requirements to improve the energy performance of buildings. Since the 1970s, BEECs have been developed and enforced successfully in several countries and have been shown to be effective in reducing energy consumption of buildings. In particular, the implementation of mandatory BEECs has resulted in significant energy use reduction of households for most EU countries [32]. Typically, two approaches are commonly considered for the development and adoption of BEECs specific to new buildings including:
- Prescriptive-based approach: In this case, the BEECs include sets of minimum energy performance requirements for each component of the building—windows, walls, and heating and cooling equipment.
- Performance-based approach: In this option, the BEECs are based on sets of performance requirements and targets for the overall building energy consumption. Thus, performance-based BEECs encourage integrated design approach to account for interactions between building components in order to optimize the energy performance for the entire building.
Based on a detailed review of existing energy efficiency regulations related to the building sector, Table 18 summarizes the status of building energy efficiency regulations for various Arab countries [2,6,10,11,12,43,44,45,46,51]. Moreover, Table 18 lists the Regulatory Indicators for Sustainable Energy (RISE) score provided for each country for their efforts to implement energy efficiency policies [52]. In particular and as indicated in Table 18, Tunisia has the highest score mostly due to its adoption and enforcement of building energy efficiency codes for both residential and commercial buildings. Indeed, the energy efficiency code for Tunisia for new buildings is one of the most comprehensive in the Arab region and includes both prescriptive and performance paths for compliance.
4.3.1. Building Envelope Thermal Performance
In this section, the benefits of improved building envelope thermal performance are evaluated for those Arab countries without mandatory codes. While the addition of thermal insulation may not be always beneficial to reduce overall energy consumption of buildings, especially those located in temperate climates [53], analyses specific to both residential and commercial buildings located in all Arab countries have indicated that thermal insulation applied to walls and roofs result in reduction of heating and cooling energy end-uses [10,45]. Moreover, it has been shown that the addition of insulation can be beneficial even for non-conditioned buildings since it can improve indoor thermal comfort while may not affect significantly the buildings energy consumption [10]. Recent analyses have shown that dynamic insulation systems that can change their thermal properties depending on the seasons and even outdoor conditions can achieve even more energy savings and indoor thermal comfort than conventional static insulation systems [54,55]. However, affordable prototypes of these systems are still not commercially available.
If 50 mm polystyrene thermal insulation for walls and roofs as well as double-pane glazing for windows are required for new buildings, an estimated average reduction of annual energy consumption of at least 10% reduction in energy consumption and electrical peak demand can be achieved for new buildings in the Arab region [10,45]. The savings for countries with hot climates such as GCC countries are expected to be higher as noted in the previous section. Using the bottom-up analysis carried by Krarti [11], the economic and environmental benefits of the thermal insulation requirements on new buildings are estimated for the Arab countries as summarized in Table 19. Only countries with no building energy efficiency codes prior to 2014 (refer to Table 18) are included in estimating the analysis summarized in Table 19. The carbon emissions for generating electricity are based on each country’s emission factor [1]. The analysis assumes that the annual contribution of energy consumption due to new buildings is 4% [11].
4.3.2. Integrated Building Energy Performance
When combined, proven energy efficiency strategies can be effective in significantly reducing building energy consumption in the Arab region [31,33,34,56,57,58]. Indeed, when appropriate energy efficiency strategies are applied to new buildings, over 30% of energy use can be saved relative to the current construction practices in the Arab region. In particular, the potential energy savings and implementation costs associated to design high-performance residential buildings in the Arab region have been evaluated for the Arab countries using the integrated analysis approach described in [8,10]. This approach involves modeling the energy performance of representative buildings as well as optimization analysis to select among various energy efficiency measures using the life-cycle cost (LCC) method and has already been applied to several Arab countries [8,10,33,34,57,58]. Table 20 summarizes the results of the analysis for the Arab countries including the annual electrical energy consumption, reduction in life-cycle costs for 30 years, and increase in construction costs to achieve optimal energy efficiency designs [8]. The optimal analysis for villas located in various Arab cities is detailed in [8]. The increase in construction costs listed in Table 20 considers additional capital costs required to integrate energy efficiency designs. As shown in Table 20, a savings range of 31% to 56% in energy use is found in all Arab cities considered in the analysis. The optimal design for the residential buildings has lower LCC values with a reduction ranging from 13% to 25% relative to the baseline cases. It should be noted that the additional costs to implement the optimized energy efficiency options are rather reasonable with an increase of construction costs relative to that of the baseline designs varying between 2% and 20% depending on the climate and the set of energy-efficiency measures to implement [8]. The reduction of the LCCs is mainly attributed to lower operating costs associated with the decrease in annual energy consumption. Over the building lifetime, the annual energy cost reduction outweighs the increase in building construction costs to implement more energy-efficient features [8].
As noted in Table 20, annual primary energy savings ranging between 35% and 55% can be achieved using optimal designs. The highest savings are achieved for hot climates especially in the GCC region while the lowest savings are obtained for regions with mild climates.
Based on the reported literature, more effective building energy efficiency codes (BEECs) can be developed throughout the entire Arab region and for all new buildings. As illustrated in Table 20, 35% to 55% savings can be achieved using integrated and optimal designs for residential buildings [8]. For this study, the impact of integrated design based BEEC is assumed to be 30% savings in both energy consumption and peak demand associated with the new building stock in the Arab region. This conservative saving level is used in this analysis specific to the Arab region to account for the diversity of climate conditions, behavioral changes, and energy efficiency rebound effects [59,60,61]. In particular, the impacts of occupant behavior on the energy efficiency of the built environment can be significant even though these impacts depend on several factors and remain difficult to quantify for a large-scale analysis [62,63,64]. The benefits of integrated design based BEECs applied to the new buildings are estimated and are summarized as shown in Table 21.
The baseline (i.e., BAU) scenario for future energy consumption for buildings in the Arab region can be estimated based on a regression analysis of the trend shown in Figure 20. The regression analysis indicates an average annual growth rate from 2015 to 2050 of 3.1%. This growth rate is consistent with the rates considered for the MENA region of 3.6% by IEA specific to the building sector and of 2.9% for the electricity demand [1].
As indicated in the projection profiles of Figure 20, the implementation starting from 2020 of the two BEEC types outlined above reduces future energy consumption slowly as the building stock is replaced by new construction over time. To account for new construction addition including demolition and renovation of the existing building stock, a 4% annual rate is considered for the addition of new construction for the Arab region [12]. The impact of improving building envelope systems (i.e., through the addition of thermal insulation) is rather minimal since most of the Arab countries have already mandatory thermal insulation code requirements and are not included in the analysis of this study. However, the implementation starting from either 2020 (Figure 20a) or 2030 (Figure 20b) of an integrated design based BEEC has the potential to reduce substantially the energy demand of the building sector. Specifically, when the integrated design based BEEC requirements are set to start in 2020, the annual savings in the Arab region can reach 127 TWh and 382 TWh by 2030 and 2050, respectively. Lower annual savings of only 210 TWh are obtained for 2050 when the integrated BEEC is required by 2030.
4.4. Impact of EE programs for Existing Buildings
In order to improve the energy performance of existing building stock, three levels of building retrofits are typically considering with different capital cost requirements and varying energy saving potentials and ultimately economic and environmental benefits. These three levels of energy retrofits of existing buildings include [50,60]:
- Level-1 of energy retrofit: This basic retrofit involves mostly low-cost energy efficiency measures such as replacement of lighting fixtures with LED units and weatherization of building shells to reduce air infiltration. As detailed in several other studies, the estimated average savings from a Level-1 retrofit program are about 8% for all building types based on the simulation analysis carried out for several Arab countries as well as case studies reported for residential, commercial, and governmental buildings [2,10,42,43,44,45,46,56,57,58].
- Level-2 of energy retrofit: In addition to Level-1 measures, this retrofit includes the use of energy-efficient equipment as well as temperature and lighting controls. Based on reported studies in the Arab region as well as from the simulation results outlined in this study for Arab countries, average savings of about 23% can be achieved for Level-2 retrofits for all building types [2,42,43,44,45,46].
- Level-3 of energy retrofit: This type of retrofit, known as a deep retrofit, requires the implementation of capital-intensive measures including the addition of roof thermal insulation, cooling system replacement, and installation of automated control systems. While deep retrofits are typically costly, they can provide significant energy use savings exceeding 50% as noted in several reports and as noted for the optimal analysis conducted for the Arab region [2,10,42,43,44,45,46].
The specific measures of each retrofit level have to be tailored to the building type and the climate. Table 22 illustrates three options of specific energy efficiency measures that can be considered for residential building types based on a study performed for Oman for all three retrofit levels [2]. Table 22 provides estimates for the annual energy savings associated with each option and retrofit level.
Table 23 summarizes the annual energy use, electricity peak demand, carbon emissions savings for Level-1, Level-2, and Level-3 building energy efficiency retrofit programs applied to the entire existing building stock in the Arab region. As clearly shown in Table 23, significant energy and environmental benefits can be achieved for all the levels of the building energy retrofit programs. While requiring higher implementation costs, higher benefits can be achieved for the Level-2 and Level-3 retrofit programs compared to the Level-1 retrofit program. The economic and environmental benefits that can be realized for residential buildings are significantly higher than those obtained for commercial and public buildings for all energy retrofit levels. Indeed, over 74% of the overall benefits can be achieved by solely retrofitting residential buildings in the Arab region as indicated in Table 23.
It is expected that the implementation of large-scale building energy retrofit programs to be gradual requiring several years due to two main reasons: (i) the significant investments needed for renovating the entire existing building stock, and (ii) the lack of qualified energy efficiency contractors in most Arab countries requiring at least few years to develop and train. However, any of the three energy retrofit programs can result in significant economic and environmental benefits for the Arab region even when only a small fraction of the existing stock is targeted as noted in the results shown in Table 23. The energy retrofit programs for the existing building stock have significant impacts on both final energy consumption, peak electrical demand, and carbon emissions in the Arab region even when implemented gradually over a 10 year period starting either (a) in 2020 or (b) in 2030 as noted in Figure 21. As expected, a Level-3 retrofit has the highest impact with an annual energy consumption reduction of 470 TWh as well as a decrease in electricity demand of 65 GW and 146 million tons per year of carbon emissions when the program is fully implemented by 2030. A basic Level-1 retrofit program would still save 85 TWh in annual final energy consumption without significant investment requirements [12].
The retrofit programs can start initially with non-residential buildings since they provide higher energy savings per unit floor area than residential buildings for the Arab region [56]. Moreover, it is easier to perform energy audits and retrofits for larger non-residential buildings through ESCOs than it is for smaller residential buildings. In addition, retrofitting residential buildings offer specific privacy and cultural sensitivity challenges in several countries within the Arab region [12]. As indicated in Figure 21, the potential benefits depend on when the programs are actually initiated and the rate of the retrofit. The results of Figure 21 assume a 10% rate of retrofit (that is that 10% of the existing building stock is retrofitted each year). If lower retrofit rates are considered, the potential benefits will be reduced accordingly.
The highest impact scenario for reducing the final energy use and peak demand would be to simultaneously (i) implement integrated BEEC for new buildings and (ii) upgrade over a 10 year span the entire existing building stock using Level-3 energy retrofit. Figure 22 shows that there is a significant potential saving in annual energy consumption of buildings especially when Level-3 energy retrofit program is implemented during a 10 year period and new buildings are constructed using an integrated energy efficiency code starting in 2020 as illustrated in Figure 22a or in 2030 as indicated in Figure 22b. In particular, if the code and the retrofit program are implemented by 2020 the total Arab region’s annual final energy consumption could be reduced by 597 TWh (or 43%) from a projected 1409 TWh per year under baseline scenario (BAU) to be only 812 TWh per year. Similar reductions in both electrical peak demands and carbon emissions can be achieved. While the required investments to implement these energy efficiency programs can be significant as highlighted later for the special case of Saudi Arabia in Table 23, the economic benefits can be substantial for most Arab countries as documented for the GCC countries [2,42,43,44,45,46].
The cost of the retrofit programs varies with the level and the country. For instance, Table 24 summarizes the required investments and the potential benefits of the three retrofit levels, outlined earlier in this section, for the entire existing residential and non-residential buildings of the Kingdom of Saudi Arabia (KSA). Specifically, it is found that [12]:
- Given the low electricity prices in Saudi Arabia, it makes little sense for households and other private organizations to invest in energy efficiency. The subsidies for energy prices have to be reduced in order for building owners and/or operators to cost-effectively invest in energy efficiency.
- When the economic benefits from avoided fuel consumption and reduced need for electricity generation capacity are considered, energy-efficiency investments by the KSA government for retrofitting existing buildings are highly cost-effective. For instance, a basic retrofit (i.e., Level-1) of households can pay for itself within less than one year. Indeed this program can avoid the construction of 22,900 MW in power plant capacity and the consumption of 100,000 GWh electrical energy per year.
- Other benefits include the reduction of carbon emissions as well as employment creation in energy auditing. Specifically, over 76 million tons of carbon emissions can be eliminated when the Level-3 retrofit program is implemented for the existing KSA building stock. In addition, the Level-3 retrofit program would create 247,000 new jobs per year over a 10 year implementation period for a total of 2,470,000 job-years created.
- Innovative financing mechanisms need to be developed to incentivize the private sector to undertake large-scale energy efficiency investments. For instance, the creation of energy service companies can be initiated by the government using the concept of performance contracting as a means of financing energy efficiency based on future savings.
- The successful implementation of any energy efficiency program for both new and existing buildings requires the development of strong institutional and labor force capacity.
4.5. Impact of Integrated Renewable Energy with Buildings
In this section, the integration of renewable energy systems in buildings is evaluated for the Arab region through the installation of rooftop photovoltaic (PV) panels. Recent studies have assessed the implementation costs and the benefits of installing PV systems on roofs of existing Saudi Arabia housing stock [16]. Table 25 summarizes the main findings of these studies specific to Saudi Arabia as well as results from a similar analysis conducted for Tunisia. In particular, Table 25 estimates the annual avoided carbon emissions and the electrical energy that can be generated when rooftop PV systems can be installed on top of all available roof areas for the existing residential building stock within Saudi Arabia and Tunisia. The new analysis for the PV rooftop systems for Tunisia is based on statistical data for the number and type of housing units obtained from the most recent census [65]. As noted in Table 25, the potential rooftop PV electricity generation is 51.0 TWh/year in Saudi Arabia representing about the third of current electricity needs for the residential buildings. For Tunisia, the rooftop PV panels can provide 15.2 TWh/year of energy equivalent to the overall current electricity consumption of the entire housing stock.
One approach to promote integration of PV systems in buildings is to require net-zero energy buildings (NZEBs) for new housing units. NZEB requirements are set in several regions of the World include EU and select US states. The analysis for prototypical residential buildings throughout the Arab region has shown that NZEB designs are possible based on integration of proven energy efficiency measures with rooftop PV systems [46]. Figure 23 presents the impact of NZEB requirements starting for all new residential buildings on the future final energy consumption of the Arab region buildings for two starting dates (a) 2020, and (b) 2030. When the program starts is set to 2020, annual energy savings are expected to reach 221 TWh by 2030 and 664 TWh by 2050 compared to BAU scenario. The main challenge for implementing the NZEB program would be the capital investments needed to install the PV rooftop systems. Based on 2500 USD/kW installation cost, the required capital costs for the rooftop PV panels are estimated to be 90.6 USD Billion in Saudi Arabia and 25.4 USD Billion in Tunisia [16]. However, the cost of PV panels is expected to decrease further in the coming years possibly making NZEB designs cost-effective for most Arab countries especially when energy subsidies are reduced or eliminated. When the NZEB requirements for residential buildings are implemented to start in 2030, the potential benefits are delayed and reduced for 2050 to 450 TWh.
5. Summary and Conclusions
In the study summarized in this paper, past and current energy consumption trends in the building sector are first analyzed for the Arab region and sub-regions. While the building sector contributes only 21% of the total final energy consumed in the Arab region, the energy used by households has doubled between 2005 and 2015. The set of analyses presented in the paper has clearly shown that the Arab region is not homogeneous in both past and current energy consumption trends and future energy challenges.
In particular, past and current energy consumption trends have shown that there is a large inequity between energy consumption between Arab countries and sub-regions. The inequities in per capita use of electricity for the building sector are as significant as the inequities in per capita use of overall primary energy. In 2015, the average citizen in the Gulf Cooperation Council sub-region used 8500 kWh of electricity. In contrast, the average citizen in the least developed countries used 1200 kWh. The per capita average use of electricity for the built environment in the Mashreq and Maghreb sub-regions was 1900 kWh and 2100 kWh, respectively, during 2015. These sub-regionally aggregated figures mask even starker disparities among Arab countries. For instance, a citizen in Yemen consumes only 147 kWh of electricity annually while a citizen in Bahrain uses almost 20,200 kWh per year.
A comprehensive overview of current energy policies related to buildings has indicated that several countries have only recently adopted either minimum energy performance standards (MEPS) for air conditioners, lighting fixtures, and appliances. Moreover, more than half of the Arab countries have adopted energy efficiency codes for new buildings. However, these codes are typically limited to prescriptive requirements and consist of thermal insulation addition to walls and roofs and the use of double-pane glazing for windows. The enforcement of these recently adopted MEPS and building energy efficiency codes are still a challenge for most Arab countries.
As part of the analyses outlined in the second part of this paper, the benefits of large-scale implementation of energy efficiency programs for the building sector in the Arab region are quantified. The analysis includes strategies to improve the energy performance of both new and existing building stocks as well as improved minimum energy performance standards (MEPS). Specifically, implementing MEPS for energy-intensive equipment in buildings (i.e., lighting, appliances, and air conditioners) can be a good first step to reduce energy consumption and carbon emissions in the Arab region. Indeed, adoption of more stringent MEPS can achieve an annual energy savings of about 51.9 TWh by 2030 if these MEPS are implemented and strictly enforced starting in 2020. Moreover, the analysis presented in this paper shows that the replacement of existing fluorescent lamps by integrated controls LED units in commercial and public buildings can save additional 21.7 TWh annually. As a second phase, the adoption and the implementation of integrated and comprehensive energy efficiency codes for both residential and commercial buildings can result in an additional reduction of 12.7 TWh/year in final energy consumption for the overall Arab region. Finally, the analysis presented in this paper has clearly indicated that the most significant potential to save energy in the Arab region lies in retrofitting existing building stock. Indeed, even with a basic retrofit program with no significant capital investments about 85 TWh/year can be saved for the Arab region by 2030. A more aggressive retrofit program can save up to 470 TWh or the third of building sector final energy consumption per year after 2030. When combining the adoption of comprehensive energy efficiency codes for new buildings and the implementation of extensive retrofit programs for existing buildings, the annual energy consumption by the building sector in the Arab region can be lowered by 600 TWh by 2030. In addition, these programs can create significant high skilled jobs, avoid the need for additional future power plants, and reduce substantially carbon emissions.
Acknowledgments
The research was funded by United Nations ESCWA program, grant number 2500114522.
Conflicts of Interest
The author declares no conflict of interest.
Nomenclature
| AC | Air Conditioners |
| BAU | Business as Usual |
| BEEC | Building Energy Efficiency Code |
| CDD | Cooling Degree Days |
| CFL | Compact Fluorescent Lamp |
| COP | Coefficient of Performance |
| EEM | Energy Efficiency Measure |
| EER | Electrical Efficiency Ratio |
| EU | European Union |
| EUI | Energy Use Intensity |
| GCC | Gulf Cooperation Council |
| GDP | Gross Domestic Product |
| HDD | Heating Degree Days |
| IEA | International Energy Agency |
| IMF | International Monetary Fund |
| KSA | Kingdom of Saudi Arabia |
| LCC | Life Cycle Cost |
| LDC | Least Developed Countries |
| LED | Lighting Emitting Diode |
| LEED | Leadership in Energy and Environment Design |
| MENA | Middle East and North Africa |
| MEPS | Minimum Energy Performance Standard |
| NZEB | Net Zero Energy Building |
| PV | Photovoltaic |
| TFEC | Total Final Energy Consumption |
| TOE | Ton of Energy Equivalent |
| TPES | Total Primary Energy Supply |
| UAE | United Arab Emirates |
| US | United States |
| USD | US Dollar (1 USD = 0.90 EURO) |
References
- IEA. International Energy Agency Statistics: Energy Balance; IEA: Paris, France, 2017; Available online: http://www.iea.org/statistics (accessed on 16 January 2018).
- Krarti, M.; Dubey, K. Energy productivity evaluation of large scale building energy efficiency programs for Oman. Sustain. Cities Soc. 2017, 29, 12–22. [Google Scholar] [CrossRef]
- KAPSARC. Global Shift: The Energy Productivity Transformation; KAPSRAC Energy Workshop Series; The King Abdullah Petroleum Studies and Research Center: Riyadh, Saudi Arabia, 2015; Available online: http://www.kapsarc.org (accessed on 18 December 2017).
- KAPSARC. The Case of Energy Productivity: It’s Not Just Semantics; KAPSRAC Discussion Paper; The King Abdullah Petroleum Studies and Research Center: Riyadh, Saudi Arabia, 2014; Available online: http://www.kapsarc.org (accessed on 18 December 2017).
- World Bank. World Development Data. 2017. Available online: http://databank.Worldbank.org/data/home.aspx (accessed on 11 December 2017).
- UN-Habitat. States of Arab Cities 2012. In Challenges of Urban Transition; United Nations Human Settlements Programme: Nairobi, Kenya, 2013. [Google Scholar]
- GCOOE. Oxford Economics and Global Construction Perspectives. In Global Construction 2020; Executive Report; Global Construction Perspectives and Oxford Economics: Oxford, UK, 2011. [Google Scholar]
- Asif, M. Growth and sustainability trends in the buildings sector in the GCC region with particular reference to the KSA and UAE. Renew. Sustain. Energy Rev. 2016, 55, 1267–1273. [Google Scholar] [CrossRef]
- United Nations. Statistical Data, UN Statistics Division. 2017. Available online: https://unstats.un.org/unsd/databases.htm (accessed on 15 January 2018).
- Krarti, M.; Ihm, P. Evaluation of Net-Zero Energy Residential Buildings in the MENA Region. Sustain. Cities Soc. 2016, 22, 116–125. [Google Scholar] [CrossRef]
- Krarti, M. Evaluation of large scale building energy efficiency retrofit program in Kuwait. Renew. Sustain. Energy Rev. 2015, 50, 1069–1080. [Google Scholar] [CrossRef]
- Krarti, M.; Dubey, K.; Howarth, N. Evaluation of building energy efficiency investment options for the Kingdom of Saudi Arabia. Energy 2017, 134, 595–610. [Google Scholar] [CrossRef]
- USAID. Housing Study for Urban Egypt; Final Report for US Agency for International Development: Washington, DC, USA, 2018. Available online: http://pdf.usaid.gov/pdf_docs/Pnady276.pdf (accessed on 10 January 2018).
- CAPMAS. Census Data for Egypt; Central Agency for Public Mobilization and Statistics: Cairo, Egypt, 2017; Available online: http://egypt.opendataforafrica.org/tadpaqg/egypt-census-data (accessed on 15 December 2017).
- ANME. Elaboration d’un Plan pour la Rénovation Thermique et Energétique des Bâtiments Existants en Tunisie. In Partie-1: Connaissance et Analyse du Secteur; Technical Report by TEMA Consulting and CESEEN for Agence Nationale pour la Maitrise de l’Energie; ANME: Tunis, Tunisia, 2010. [Google Scholar]
- Khan, M.M.A.; Asif, M.; Stach, E. Rooftop PV Potential in the Residential Sector of the Kingdom of Saudi Arabia. Buildings 2017, 7, 46. [Google Scholar] [CrossRef]
- Navigant. Global Building Stock Database Commercial and Residential Building Floor Space by Country and Building Type: 2014–2024; Navigant: Boulder, CO, USA, 2015. [Google Scholar]
- GABC. Towards Zero-Emission Efficient and Resilient Buildings, Global Alliance for Building and Construction. 2016. Available online: http://www.planbatimentdurable.fr/IMG/pdf/gabc_report.pdf (accessed on 12 December 2017).
- Harvey, L.D.D.; Korytarovab, K.; Luconc, O.; Roshchankada, V. Construction of a global disaggregated dataset of building energy use and floor area in 2010. Energy Build. 2014, 76, 488–496. [Google Scholar] [CrossRef]
- IEA-ETP. Annex E: Buildings Sector Model, Energy Technology Perspectives. Available online: https://www.iea.org/media/etp/etp2016/AnnexE_UrbanBuildingsEnergyEstimationMethodology_web.pdf (accessed on 22 December 2017).
- McNeil, M.A.; Letschert, V.E.; de la Rue du Can, S.; Ke, J. Bottom-up energy analysis system (BUENAS)—An international appliance efficiency policy tool. Energy Effic. 2013, 6, 191–217. [Google Scholar] [CrossRef]
- Ürge-Vorsatz, D.; Petrichenko, K.; Antal, M.; Staniec, M.; Ozden, E.; Labzina, E. Best Practice Policies for Low Carbon & Energy Buildings Based on Scenario Anal-Ysis; Centre for Climate Change and Sustainable Policy (3CSEP) for the GlobalBuildings Performance Network: Paris, France, 2013. [Google Scholar]
- WBG. Energy-Efficient Air Conditioning: A Case Study of the Maghreb Opportunities for a More Efficient Market; Khalfallah, E., Missaoui, R., el Khamlichi, S., Hassine, H.B., Eds.; World Bank Group: Washington, DC, USA, 2016; Available online: http:// http://documents.Worldbank.org/curated/en/754361472471984998/pdf/105360-REVISED-PUBLIC-MENA-Digital-Print-English-sep-2016.pdf (accessed on 15 January 2018).
- RCREEE. Energy Efficiency Indicators in The Southern and Eastern Mediterranean Countries; Missaoui, R., Hassine, H.B., Mourtada, A., Eds.; RCREEE: al-Qāhira, Egypt, 2012; Available online: http:// http://www.rcreee.org/sites/default/files/rs_eeindicatorsinthesouthernandeasternmediterraneancountries_2012_en.pdf (accessed on 24 January 2018).
- MEDENER. Energy Efficiency Trends in Mediterranean Countries, Report Prepared by Eenerdata. 2013. Available online: http://medener-indicateurs.net/uk/download/094 (accessed on 21 December 2017).
- JRAIA. World Air Conditioner Demand by Region; Japan Refrigeration and Air Conditioning Industry Association: Tokyo, Japan, 2017; Available online: https://www.jraia.or.jp/english/World_AC_Demand.pdf (accessed on 27 January 2018).
- IMF. How Large Global Energy Subsidies? Country level estimates, International Monetary Fund, Fiscal Affairs Department: Washington, DC, USA, 2015. [Google Scholar]
- RCREEE. Arab Future Energy Index 1015—Energy Efficiency; Regional Center for Renewable Energy and Energy Efficiency (RCREEE): Cairo, Egypt, 2015; Available online: www.rcreee.org (accessed on 15 December 2017).
- IRENA. Renewable Energy in the Arab Region: Overview of Developments; Report in Collaboration with Arab LAS and RCREEE, International Renewable Energy Agency; IRENA: Abu Dhabi, UAE, 2016. [Google Scholar]
- Fattouh, B.; El-Katiri, L. Energy Subsidies in the Arab Region, Research Paper Series on Arab Human Development Report for United Nations Development Programme—Regional Bureau of Arab States. 2012. Available online: http://www.undp.org (accessed on 21 December 2017).
- Ameer, B.; Krarti, M. Impact of Subsidization on High Energy Performance Designs for Kuwaiti Residential Buildings. Energy Build. 2016, 116, 249–262. [Google Scholar] [CrossRef]
- IEA. Building Energy Performance Metrics, Supporting Energy Efficiency Progress in Major Economies; International Energy Agency: Paris, France, 2015. [Google Scholar]
- Taleb, H.M.; Sharples, S. Developing sustainable residential buildings in Saudi Arabia: A case study. Appl. Energy 2011, 88, 383–391. [Google Scholar] [CrossRef]
- Alaidroos, A.; Krarti, M. Optimal design of residential building envelope systems in the Kingdom of Saudi Arabia. Energy Build. 2015, 86, 104–117. [Google Scholar] [CrossRef]
- Radhi, H. Evaluating the potential impact of global warming on the UAE residential buildings—A contribution to reduce the CO2 emissions. Build. Environ. 2009, 44, 2451–2462. [Google Scholar] [CrossRef]
- Ecofys. A Roadmap for Developing Energy Indicators for Buildings in Lebanon, Energy Efficiency in the Construction Sector in the Mediterranean; Final Report for MED-NEC; Ecofys: Utrecht, The Netherlands, 2013; Available online: http:// https://www.ecofys.com/files/files/med-enec-2013-roadmap-ee-indicators-buildings-lebanon.pdf (accessed on 20 December 2017).
- UNEP. Development of a System of Energy Intensity Indicators for the Egyptian Economy, Report for United Nations Environment Program by Environics. 2011. Available online: http://www.mdgfund.org/sites/default/files/ENV_STUDY_Egypt_Development%20of%20Energy%20Indicactor%20System.pdf (accessed on 10 January 2018).
- Fasiuddin, M.; Budaiwi, I. HVAC system strategies for energy conservation in commercial buildings in Saudi Arabi. Energy Build. 2011, 43, 3457–3466. [Google Scholar] [CrossRef]
- Fasiuddin, M.; Budaiwi, I.; Abdou, A. Zero-investment HVAC system operation strategies for energy conservation and thermal comfort in commercial buildings in hot-humid climate. Int. J. Energy Res. 2010, 34, 1–19. [Google Scholar] [CrossRef]
- Alajmi, A. Energy audit of an educational building in a hot summer climate. Energy Build. 2012, 47, 122–130. [Google Scholar] [CrossRef]
- Radhi, H.; Sharples, S. Benchmarking carbon emissions of office buildings in Bahrain. In Proceedings of the PLEA 2007—24th Conference on Passive and Low Energy Architecture, Singapore, 22–24 November 2007. [Google Scholar]
- Krarti, M.; Dubey, K. Review Analysis of Economic and Environmental Benefits of Improving Energy Efficiency for UAE Building Stock. Renew. Sustain. Energy Rev. 2018, 82, 14–24. [Google Scholar] [CrossRef]
- Krarti, M.; Ali, F.; Alaidroos, A.; Houchati, M. Macro-economic benefit analysis of large-scale building energy efficiency programs in Qatar. Int. J. Sustain. Built Environ. 2018. [Google Scholar] [CrossRef]
- Krarti, M.; Dubey, K. Evaluation of High Performance of Residential Buildings in Bahrain. J. Build. Eng. 2018, 18, 40–50. [Google Scholar] [CrossRef]
- Ihm, P.; Krarti, M. Design optimization of energy efficient office buildings in Tunisia. ASME J. Sol. Energy Eng. 2013, 135. [Google Scholar] [CrossRef]
- Ihm, P.; Krarti, M. Design optimization of energy efficient residential buildings in Tunisia. Build. Environ. 2012, 58, 81–90. [Google Scholar] [CrossRef]
- U4E. United for Energy Efficiency, Country Assessments. 2017. Available online: http://united4efficiency.org (accessed on 27 December 2017).
- Shackelford, J.; Robinson, A.; Rubinstein, F. Retrofit Demonstration of LED Fixtures with Integrated Sensors and Controls; Lawrence Berkeley National Laboratory Report Prepared for US General Services Administration: Berkeley, CA, USA, 2015. [Google Scholar]
- Khilifi, A.; Krarti, M. Genetic Algorithm Based Controls for Daylighting. In Proceedings of the ASME Solar Energy Conference, Denver, CO, USA, 13–18 July 2016. [Google Scholar]
- Krarti, M. Energy Audit of Building Systems: An Engineering Approach, 2nd ed.; CRC Pres: Boca Raton, FL, USA, 2011. [Google Scholar]
- Liu, F.; Meyer, A.S.; Hogan, J.F. Mainstreaming Building Energy Efficiency Codes in Developing Countries, Global Experiences and Lessons from Early Adopters; Paper No. 204; The World Bank: Washington, DC, USA, 2010; Available online: http://www.Worldbank.org (accessed on 12 December 2017).
- RISE. Regulatory-Indicators-for-Sustainable-Energy (RISE). Report by World Bank. 2015. Available online: http://documents.Worldbank.org/curated/en/538181487106403375/pdf/112828-REVISED-PUBLIC-RISE-2016-Report.pdf (accessed on 10 March 2018).
- Kwag, B.C.; Adamu, B.M.; Krarti, M. Analysis of high-energy performance residences in Nigeria. Energy Effic. 2019, 12, 681–695. [Google Scholar] [CrossRef]
- Park, B.; Srubar, W.V.; Krarti, M. Energy performance analysis of variable thermal resistance envelopes in residential buildings. Energy Build. 2015, 103, 317–325. [Google Scholar] [CrossRef]
- Menyhart, K.; Krarti, M. Potential energy savings from deployment of Dynamic Insulation Materials for US residential buildings. Build. Environ. 2017, 114, 203–218. [Google Scholar] [CrossRef]
- Al-Ragom, F. Retrofitting residential buildings in hot and arid climates. Energy Convers. Manag. 2003, 44, 2309–2319. [Google Scholar] [CrossRef]
- Znouda, E.; Ghrab-Morcos, N.; Hadj-Alouane, A. Optimization of Mediterranean building design using genetic algorithms. Energy Build. 2007, 39, 148–153. [Google Scholar] [CrossRef]
- Al-Sanea, S.A.; Zedan, M.F.; Al-Hussain, S.N. Effect of thermal mass on performance of insulated building walls and the concept of energy savings potential. Appl. Energy 2012, 89, 430–442. [Google Scholar] [CrossRef]
- Jacobsen, G.D.; Kotchen, M.J. Are building codes effective at saving energy? Evidence from residential billing data in Florida. Rev. Econ. Stat. 2013, 95, 34–49. [Google Scholar] [CrossRef]
- ASHRAE. Procedures for Commercial Building Energy Audits, 2nd ed.; Guide Developed; The American Society for Heating, Refrigerating, and Air Conditioning Engineers: Atlanta, GA, USA, 2011. [Google Scholar]
- Campisi, D.; Simone Gitto, S.; Morea, D. An Evaluation of Energy and Economic Efficiency in Residential Buildings Sector: A Multi-Criteria Analysis on an Italian Case Study. Int. J. Energy Econ. Policy 2018, 8, 185–196. [Google Scholar]
- Yan, D.; O’Brien, W.; Hong, T.; Feng, X.; Gunay, H.B.; Tahmasebi, F.; Mahdavi, A. Occupant behavior modeling for building performance simulation: Current state and future challenges. Energy Build. 2015, 107, 264–278. [Google Scholar] [CrossRef] [Green Version]
- D’Oca, S.; Hong, T.; Langevin, J. The human dimensions of energy use in buildings: A review. Renew. Sustain. Energy Rev. 2018, 81, 731–742. [Google Scholar] [CrossRef] [Green Version]
- Pereira, P.F.; Ramos, N.M. Occupant behaviour motivations in the residential context—An investigation of variation patterns and seasonality effect. Build. Environ. 2019, 148, 535–546. [Google Scholar]
- ST. Statistiques de Tunisie, Census Data of 2014: Number of Housing Units by Governorate, Area and Type. 2014. Available online: http://regions.ins.tn (accessed on 20 January 2018).
Figure 1.
Annual variation gross domestic product (GDP), Total primary energy supply (TPES), and population of the Arab region compared to those of US, EU, and World. (a) GDP, TPES, population index to 1990; (b) per capita GDP; (c) per capita TPES; (d) GDP per TPES (Data Source: International Energy Agency (IEA) [1]).

Figure 2.
Primary energy resources for (a) Arab region, (b) World, (c) EU, and (d) US during 2015 (Source of the data: IEA [1]).
Figure 2.
Primary energy resources for (a) Arab region, (b) World, (c) EU, and (d) US during 2015 (Source of the data: IEA [1]).


Figure 3.
Annual total final energy consumption in the Arab region between 1990 and 2015.

Figure 4.
Annual per capita (a) final energy consumption (b) electricity use, and (c) carbon emissions in Arab region compared to averages for EU, US, and the World for the period 1990–2014 (Source of the data: World Bank [5]).
Figure 4.
Annual per capita (a) final energy consumption (b) electricity use, and (c) carbon emissions in Arab region compared to averages for EU, US, and the World for the period 1990–2014 (Source of the data: World Bank [5]).

Figure 5.
Annual variation of (a) per capita GDP, (b) per capita TPES, and (c) energy productivity for the Arab sub-regions.
Figure 5.
Annual variation of (a) per capita GDP, (b) per capita TPES, and (c) energy productivity for the Arab sub-regions.

Figure 6.
Annual variation of (a) per capita GDP, (b) per capita TPES, and (c) energy productivity for Saudi Arabia (KSA), Egypt, Tunisia, and Yemen.
Figure 6.
Annual variation of (a) per capita GDP, (b) per capita TPES, and (c) energy productivity for Saudi Arabia (KSA), Egypt, Tunisia, and Yemen.


Figure 7.
Contour map of Arab region for annual (a) heating and (b) cooling degree-days with a base temperature of 18 °C (Source: [10]).
Figure 7.
Contour map of Arab region for annual (a) heating and (b) cooling degree-days with a base temperature of 18 °C (Source: [10]).

Figure 8.
Total annual energy use of the building sector in the Arab region between 1990 and 2015. (a) Energy mix; (b) trend between energy consumption and year.
Figure 8.
Total annual energy use of the building sector in the Arab region between 1990 and 2015. (a) Energy mix; (b) trend between energy consumption and year.

Figure 9.
Annual share of the building sector of the overall total final energy consumption (TFEC) for the Arab sub-regions.
Figure 9.
Annual share of the building sector of the overall total final energy consumption (TFEC) for the Arab sub-regions.

Figure 10.
Share of the building sector in the Arab Sub-regions TPES and TFEC for 2015.

Figure 11.
Share of (a) entire building sector and (b) the residential buildings in total final energy consumption in most countries within the Arab region for 1990, 2000, and 2015.
Figure 11.
Share of (a) entire building sector and (b) the residential buildings in total final energy consumption in most countries within the Arab region for 1990, 2000, and 2015.


Figure 12.
Total final consumption by energy sources for (a) residential and (b) non-residential (i.e., commercial and public) buildings for most Arab countries during 2015.
Figure 12.
Total final consumption by energy sources for (a) residential and (b) non-residential (i.e., commercial and public) buildings for most Arab countries during 2015.

Figure 13.
Annual per capita building (a) total final energy consumption and (b) total electricity consumption of the Arab region compared to those of the US, EU, and World.
Figure 13.
Annual per capita building (a) total final energy consumption and (b) total electricity consumption of the Arab region compared to those of the US, EU, and World.


Figure 14.
Annual per capita building (a) total energy consumption and (b) electricity consumption of the Arab sub-regions during the 1990–2015 period.
Figure 14.
Annual per capita building (a) total energy consumption and (b) electricity consumption of the Arab sub-regions during the 1990–2015 period.

Figure 15.
Annual per capita residential building (a) total energy consumption and (b) electricity consumption per capita of the Arab sub-regions during the 1990–2015 period.
Figure 15.
Annual per capita residential building (a) total energy consumption and (b) electricity consumption per capita of the Arab sub-regions during the 1990–2015 period.

Figure 16.
Annual per capita non-residential building (a) total energy consumption and (b) electricity consumption for the Arab sub-regions during the 1990–2015 period.
Figure 16.
Annual per capita non-residential building (a) total energy consumption and (b) electricity consumption for the Arab sub-regions during the 1990–2015 period.


Figure 17.
Building sector energy use per floor area for Arab sub-regions for the 1990–2015 period.

Figure 18.
Annual residential buildings energy use intensity for (a) total energy use and (b) electricity consumption specific to the Arab Region and its sub-regions during the 1990–2015 period.
Figure 18.
Annual residential buildings energy use intensity for (a) total energy use and (b) electricity consumption specific to the Arab Region and its sub-regions during the 1990–2015 period.


Figure 19.
Annual non-residential buildings energy use intensity of the Arab sub-regions during the 1990–2015 period.
Figure 19.
Annual non-residential buildings energy use intensity of the Arab sub-regions during the 1990–2015 period.

Figure 20.
Impact on total final energy consumption of buildings due to implementation of energy efficiency codes for new buildings in the Arab region with the start of implementation in (a) 2020 and (b) 2030.
Figure 20.
Impact on total final energy consumption of buildings due to implementation of energy efficiency codes for new buildings in the Arab region with the start of implementation in (a) 2020 and (b) 2030.

Figure 21.
Impact on load profiles for electrical energy consumption due to implementation of energy retrofit programs for the entire existing building stock when the programs start during (a) 2020 and (b) 2030.
Figure 21.
Impact on load profiles for electrical energy consumption due to implementation of energy retrofit programs for the entire existing building stock when the programs start during (a) 2020 and (b) 2030.


Figure 22.
Impact on final energy consumption due to the implementation of both comprehensive energy efficiency code for new buildings and energy retrofit programs for the entire existing building stock when the programs start during (a) 2020 and (b) 2030.
Figure 22.
Impact on final energy consumption due to the implementation of both comprehensive energy efficiency code for new buildings and energy retrofit programs for the entire existing building stock when the programs start during (a) 2020 and (b) 2030.

Figure 23.
Impact on load profiles for electrical energy consumption due to implementation starting in (a) 2020, and (b) 2030 of net-zero residential buildings for the new housing stock in the Arab region.
Figure 23.
Impact on load profiles for electrical energy consumption due to implementation starting in (a) 2020, and (b) 2030 of net-zero residential buildings for the new housing stock in the Arab region.


Table 1.
Characteristics of Arab sub-regions including countries, population, GDP per capita, and TPES per capita.
Table 1.
Characteristics of Arab sub-regions including countries, population, GDP per capita, and TPES per capita.
| Sub-Region | List of Countries | Population (Million) | GDP/Capita (USD/person) | TPES/Capita (TOE/person) |
|---|---|---|---|---|
| Gulf Cooperation Council (GCC) | Bahrain; Kuwait; Oman; Qatar; Saudi Arabia; United Arab Emirates | 52.70 | 55,601 | 7.87 |
| Mashreq | Egypt; Iraq; Jordan; Lebanon; Palestine; Syria | 164.67 | 9915 | 0.94 |
| Maghreb | Algeria; Libya; Morocco; Tunisia | 91.58 | 10,805 | 1.11 |
| Least Developed Countries (LDC) | Mauritania; Sudan; Yemen | 71.24 | 3296 | 0.29 |
Table 2.
Summary of basic macro-economic indicators for Arab countries for 2015 (colors refer to the sub-regions: green for GCC, yellow for Mashreq, maroon for Maghreb, and blue for LDC).
Table 2.
Summary of basic macro-economic indicators for Arab countries for 2015 (colors refer to the sub-regions: green for GCC, yellow for Mashreq, maroon for Maghreb, and blue for LDC).
| Country | Population (Million) | GDP/Capita 1 (2011 PPP USD/person) | TPES/Capita (TOE/person) | TEPS/GDP (TOE/1000 USD) |
|---|---|---|---|---|
| Algeria | 39.67 | 13,725 | 1.36 | 0.10 |
| Bahrain | 1.38 | 43,926 | 10.34 | 0.24 |
| Egypt | 91.51 | 10,096 | 0.87 | 0.09 |
| Iraq | 36.42 | 14,929 | 1.31 | 0.09 |
| Jordan | 7.60 | 8491 | 1.13 | 0.11 |
| Kuwait | 3.89 | 68,476 | 8.91 | 0.13 |
| Lebanon | 5.85 | 13,353 | 1.306 | 0.10 |
| Libya | 6.28 | 13,048 | 2.75 | 0.21 |
| Mauritania | 4.17 | 3602 | 0.31 | 0.30 |
| Morocco | 34.38 | 7286 | 0.56 | 0.08 |
| Oman | 4.49 | 40,139 | 5.65 | 0.15 |
| Qatar | 2.24 | 119,749 | 20.29 | 0.15 |
| Palestine 2 | 4.79 | 1860 | 0.33 | 0.18 |
| Saudi Arabia | 31.54 | 50,724 | 7.03 | 0.14 |
| Sudan | 40.24 | 4037 | 0.39 | 0.10 |
| Syria | 18.50 | 2030 | 0.54 | 0.27 |
| Tunisia | 11.25 | 10,750 | 0.97 | 0.09 |
| United Arab Emirates | 9.16 | 65,975 | 8.00 | 0.12 |
| Yemen | 26.83 | 2641 | 0.13 | 0.05 |
Table 3.
Reported total floor area for buildings in Arab countries based on census data.
| Country, Type of Buildings | Census Year | Total Building Floor Area (million m2) | Per Capita Floor (m2/person) | Reference |
|---|---|---|---|---|
| Egypt, Residential | 2006 | 1476 | 19 | [13,14] |
| Tunisia, Residential | 2006 | 274 | 27 | [15] |
| Tunisia, Non-Residential | 2006 | 28 | 3 | [15] |
| Saudi Arabia, Residential | 2010 | 652 | 24 | [16] |
Table 4.
Residential floor area per capita as a function of GDP per capita [20].
Table 4.
Residential floor area per capita as a function of GDP per capita [20].
| GDP per Capita (2012 PPP USD/person) | Average | Minimum | Maximum |
|---|---|---|---|
| 0 | 12 m2/person | 7 m2/person | 30 m2/person |
| 10,000 | 23 m2/person | 9 m2/person | 50 m2/person |
| 20,000 | 34 m2/person | 17 m2/person | 62 m2/person |
| 30,000 | 44 m2/person | 25 m2/person | 68 m2/person |
| 40,000 | 49 m2/person | 30 m2/person | 71 m2/person |
| 50,000 | 51 m2/person | 31 m2/person | 72 m2/person |
| 60,000 | 52 m2/person | 32 m2/person | 73 m2/person |
Table 5.
Penetration rates of air conditioning (AC) systems and refrigerators in residential buildings for some Arab countries.
Table 5.
Penetration rates of air conditioning (AC) systems and refrigerators in residential buildings for some Arab countries.
| Country | AC Penetration Rate (Year) | Forecasted AC Penetration Rate (2030) | Refrigerator Penetration Rate (Year) | References |
|---|---|---|---|---|
| Algeria | 37.2% (2015) | 84.5% | 90% (2009) | [23] |
| Morocco | 9.3% (2015) | 49.0% | 85% (2009) | [23] |
| Syria | 9% (2009) | NA | 40% (2009) | [24] |
| Tunisia | 40.3% (2015) | 84.5% | 80% (2009) | [23] |
| Yemen | 12% (2009) | NA | 30% (2009) | [24] |
| Lebanon | 50% (2010) | NA | 100% (2010) | [25] |
Table 6.
The total number of AC units (in thousands) sold in the Arab region during the 2011–2016 period [26].
Table 6.
The total number of AC units (in thousands) sold in the Arab region during the 2011–2016 period [26].
| Country | 2011 | 2012 | 2013 | 2014 | 2015 | 2016 |
|---|---|---|---|---|---|---|
| Saudi Arabia | 1581 | 1666 | 2226 | 2238 | 2164 | 1926 |
| UAE | 497 | 493 | 713 | 737 | 763 | 731 |
| Oman | 248 | 217 | 297 | 321 | 320 | 296 |
| Qatar | 189 | 179 | 275 | 284 | 286 | 278 |
| Kuwait | 144 | 147 | 214 | 217 | 225 | 211 |
| Iraq | 274 | 296 | 315 | 320 | 193 | 187 |
| Bahrain | 77 | 82 | 82 | 78 | 77 | 80 |
| Lebanon | 69 | 68 | 69 | 77 | 76 | 80 |
| All Others | 181 | 168 | 162 | 173 | 174 | 168 |
| Arab Region | 3260 | 3316 | 4353 | 4445 | 4278 | 3958 |
Table 7.
Energy subsidies in the Arab region (Source, International Monetary Fund (IMF) [27]).
Table 7.
Energy subsidies in the Arab region (Source, International Monetary Fund (IMF) [27]).
| Country | Total Energy Subsidies 1 (Billions USD) | Percent GDP (%) | Subsidies of Total Energy Per Capita (USD/person) | Subsidies of Electricity per Capita (USD/person) |
|---|---|---|---|---|
| Algeria | 23.870 | 10.0 | 604.70 | 59.83 |
| Bahrain | 3.940 | 11.2 | 3224.74 | 1179.72 |
| Egypt | 32.349 | 10.0 | 365.79 | 33.20 |
| Iraq | 0.495 | 0.2 | 13.37 | 0.00 |
| Jordan | 1.424 | 3.6 | 208.67 | 89.90 |
| Kuwait | 14.097 | 7.8 | 3429.95 | 409.78 |
| Lebanon | 5.246 | 10.3 | 1151.99 | 465.14 |
| Libya | 6.442 | 10.2 | 1021.64 | 0.00 |
| Mauritania | 0.058 | 1.3 | 15.53 | 15.53 |
| Morocco | 1.957 | 1.6 | 58.41 | NA |
| Oman | 7.267 | 8.9 | 1718.97 | 102.13 |
| Qatar | 14.471 | 6.4 | 5995.25 | 1041.12 |
| Saudi Arabia | 106.556 | 13.2 | 3395.03 | 352.54 |
| Sudan | 1.375 | 2.1 | 35.77 | NA |
| Tunisia | 2.004 | 4.0 | 180.37 | 115.28 |
| United Arab Emirates | 28.961 | 6.6 | 3022.85 | 337.03 |
| Yemen | 0.359 | 0.7 | 12.69 | 6.08 |
| Arab region | 250.868 | 8.3 | 715.65 | 85.31 |
1 The price-gap method, based on global reference energy costs, is used to estimate energy subsidies.
Table 8.
Electricity prices, energy use, and carbon emissions indicators for Arab countries.
| Country | Cost of Electricity (USD/kWh) 1 | Electricity Generation Capacity (MW) 2 | Electricity Consumption per Capita (kWh/person) 3 | Total Final Energy Consumption per Capita (TOE/person) 3 | CO2 Emissions per Capita (tons/person) 4 |
|---|---|---|---|---|---|
| Algeria | 0.051 | 13,000 | 1451 | 0.944 | 3.717 |
| Bahrain | 0.008 | 3889 | 20,190 | 4.568 | 23.450 |
| Egypt | 0.033 | 32,483 | 1754 | 0.604 | 2.199 |
| Iraq | 0.009 | 25,600 | 1218 | 0.496 | 4.812 |
| Jordan | 0.092 | 4882 | 2288 | 0.73 | 3.003 |
| Kuwait | 0.007 | 18,000 | 14,951 | 4.523 | 25.224 |
| Lebanon | 0.046 | 2710 | 2861 | 0.835 | 4.296 |
| Libya | 0.016 | 10,000 | 1656 | 1.322 | 9.187 |
| Morocco | 0.123 | 8202 | 892 | 0.435 | 1.744 |
| Oman | 0.026 | 8750 | 6588 | 4.548 | 15.443 |
| Qatar | 0.022 | 8900 | 17460 | 8.769 | 45.423 |
| Saudi Arabia | 0.013 | 46,400 | 9926 | 4.6 | 19.529 |
| Sudan | 0.049 | 3253 | 264 | 0.265 | 0.309 |
| Syria | 0.004 | 3154 | 811 | 0.357 | 1.599 |
| Tunisia | 0.127 | 4491 | 1458 | 0.7 | 2.587 |
| UAE | 0.080 | 29,348 | 12,916 | 5.805 | 23.202 |
| Yemen | 0.041 | 1500 | 147 | 0.095 | 0.865 |
Table 9.
Energy use intensity (EUI) (expressed in kWh/m2) for the building sector for Arab region, World, US, EU, China, and India estimated for 2000, 2006, and 2016.
Table 9.
Energy use intensity (EUI) (expressed in kWh/m2) for the building sector for Arab region, World, US, EU, China, and India estimated for 2000, 2006, and 2016.
| Country Region | 2000 | 2006 | 2012 |
|---|---|---|---|
| World | 200 | 175 | 165 |
| EU | 223 | 215 | 187 |
| US | 212 | 207 | 197 |
| China | 131 | 108 | 102 |
| India | 195 | 180 | 165 |
| Arab region * | 72 | 89 | 96 |
(*) Estimated using the average building floor area estimations discussed in Section 3.2.
Table 10.
Estimation of EUI for residential buildings based on data reported for three Arab countries.
Table 10.
Estimation of EUI for residential buildings based on data reported for three Arab countries.
| Country | Census Year | Total Building Floor Area (million m2) | Energy Consumption (TWh/year) * | Energy Use Intensity (kWh/m2) | ||
|---|---|---|---|---|---|---|
| Total | Electricity | Total | Electricity | |||
| Egypt | 2006 | 1476.463 | 99.967 | 36.603 | 67.7 | 24.8 |
| Tunisia | 2006 | 274.254 | 21.708 | 2.969 | 79.2 | 10.8 |
| Saudi Arabia | 2010 | 651.616 | 127.582 | 108.647 | 195.8 | 166.7 |
(*) Source of data: [1].
Table 11.
Reported EUI values for residential buildings in select Arab countries.
| Country (City) | Year of Reported Data | Type of Analysis | Energy Use Intensity (kWh/m2/year) | References |
|---|---|---|---|---|
| Lebanon (Entire Country) | 2013 | Survey | 135 (Total) 47 (Elec. Only) | [25] * |
| Tunisia (Entire Country) | 2013 | Survey | 79 (Total) 12 (Elec. Only) | [25] |
| Saudi Arabia (Jeddah) | 2011 | Audit, Apartment | 350 | [33] |
| Saudi Arabia (Riyadh) | 2015 | Calibrated Modeling, Villa | 228 | [34] |
| UAE (Al-Ain) | 2008 | Audit, Villa | 306 | [35] |
| UAE (AL-Ain) | 2008 | Audit, Villa | 269 | [35] |
(*) Average housing unit in Lebanon is set to 120 m2 [36].
Table 12.
Reported EUI values for non-residential buildings in select Arab countries.
| Country (City) | Year of Reported Data | Type of Analysis | Energy Use Intensity (kWh/m2/year) | References |
|---|---|---|---|---|
| Egypt (Entire Country) | 2009 | Survey | [37] | |
| Office Buildings | 84 | |||
| Shopping Malls | 770 | |||
| Hotels | 730 | |||
| Tunisia (Entire Country) | 2006 | Survey | [15] | |
| Office Buildings | 21 | |||
| Retail Stores | 231 | |||
| Hotels | 266 | |||
| Banks | 284 | |||
| Universities | 26 | |||
| All Non-Residential Buildings | 87 | |||
| Saudi Arabia (Dammam) | 2011 | Audit, Shopping Malls | 268 | [38] |
| Saudi Arabia (Dammam) | 2010 | Audit, Six Shopping Malls | 250–276 | [39] |
| Kuwait (Kuwait-City) | 2011 | Audit, Educational Buildings | 300–600 | [40] |
| Bahrain (Manama) | 2007 | Audit, Office Buildings | 100–805 | [41] |
Table 13.
Potential annual benefits attributed to lighting minimum energy performance standards (MEPS) in the Arab region.
Table 13.
Potential annual benefits attributed to lighting minimum energy performance standards (MEPS) in the Arab region.
| Country | Electricity Use 1 (TWh/year) | Energy Cost 1 (USD Million/year) | Carbon Emissions 2 (Million Tonnes/year) | |||
|---|---|---|---|---|---|---|
| 2025 | 2030 | 2025 | 2030 | 2025 | 2030 | |
| Algeria | 2.365 | 2.371 | 70.9 | 71.1 | 1.470 | 1.474 |
| Bahrain | 0.305 | 0.316 | 7.0 | 7.3 | 0.207 | 0.215 |
| Egypt | 1.711 | 2.198 | 78.7 | 101.1 | 0.840 | 1.079 |
| Iraq | 1.333 | 1.387 | 10.7 | 11.1 | 1.351 | 1.406 |
| Jordan | 0.442 | 0.468 | 88.4 | 93.6 | 0.284 | 0.300 |
| Kuwait | 1.571 | 1.618 | 15.7 | 16.2 | 1.355 | 1.396 |
| Lebanon | 0.452 | 0.477 | 28.9 | 30.5 | 0.344 | 0.363 |
| Libya | 1.417 | 1.418 | 42.5 | 42.5 | 1.023 | 1.024 |
| Morocco | 1.479 | 1.476 | 177.5 | 177.2 | 1.118 | 1.115 |
| Oman | 0.725 | 0.746 | 37.7 | 38.8 | 0.593 | 0.610 |
| Palestine | 0.150 | 0.156 | 23.7 | 24.6 | 0.119 | 0.124 |
| Qatar | 1.395 | 1.437 | 34.9 | 35.9 | 0.693 | 0.714 |
| Saudi Arabia | 8.000 | 8.200 | 400.1 | 412.4 | 6.400 | 6.600 |
| Syria | 0.251 | 0.325 | 2.5 | 3.3 | 0.163 | 0.212 |
| Sudan | 0.180 | 0.225 | 8.4 | 10.4 | 0.061 | 0.076 |
| Tunisia | 0.771 | 0.715 | 69.4 | 64.3 | 0.383 | 0.355 |
| UAE | 3.100 | 3.200 | 361.1 | 367.3 | 2.038 | 2.072 |
| Yemen | 0.109 | 0.114 | 3.0 | 3.1 | 0.075 | 0.078 |
| Total | 25.756 | 26.847 | 1461.1 | 1510.7 | 18.517 | 19.213 |
Table 14.
Potential annual benefits attributed to MEPS for refrigerators in the Arab region.
| Country | Electricity Use 1 (TWh/year) | Energy Cost 1 (USD Million/Year) | Carbon Emissions 2 (Million Tonnes/year) | |||
|---|---|---|---|---|---|---|
| 2025 | 2030 | 2025 | 2030 | 2025 | 2030 | |
| Algeria | 0.803 | 1.545 | 24.1 | 46.4 | 0.499 | 0.960 |
| Bahrain | 0.047 | 0.090 | 1.1 | 2.1 | 0.032 | 0.061 |
| Egypt | 1.901 | 3.963 | 87.40 | 182.3 | 0.933 | 1.945 |
| Iraq | 0.511 | 1.020 | 4.1 | 8.2 | 0.518 | 1.034 |
| Jordan | 0.117 | 0.243 | 23.4 | 48.6 | 0.075 | 0.156 |
| Kuwait | 0.180 | 0.325 | 1.8 | 3.3 | 0.156 | 0.280 |
| Lebanon | 0.094 | 0.189 | 6.0 | 12.1 | 0.072 | 0.144 |
| Libya | 0.136 | 0.262 | 4.1 | 7.9 | 0.098 | 0.189 |
| Morocco | 0.458 | 0.897 | 55.0 | 107.7 | 0.346 | 0.678 |
| Oman | 0.069 | 0.137 | 3.6 | 7.1 | 0.056 | 0.112 |
| Palestine | 0.074 | 0.153 | 11.7 | 24.2 | 0.059 | 0.112 |
| Qatar | 0.035 | 0.072 | 0.90 | 1.8 | 0.017 | 0.036 |
| Saudi Arabia | 0.800 | 1.500 | 40.4 | 77.20 | 0.600 | 1.200 |
| Syria | 0.376 | 0.756 | 3.8 | 7.6 | 0.245 | 0.493 |
| Sudan | 0.608 | 1.255 | 28.3 | 58.4 | 0.206 | 0.425 |
| Tunisia | 0.177 | 0.336 | 15.9 | 30.2 | 0.088 | 0.167 |
| UAE | 0.400 | 0.700 | 40.9 | 85.7 | 0.231 | 0.484 |
| Yemen | 0.186 | 0.408 | 5.0 | 11.0 | 0.127 | 0.280 |
| Total | 6.972 | 13.851 | 357.5 | 721.8 | 4.358 | 8.756 |
Table 15.
Potential annual benefits attributed to improved MEPs for room air-conditioners in the Arab region.
Table 15.
Potential annual benefits attributed to improved MEPs for room air-conditioners in the Arab region.
| Country | Electricity Use Savings 1 | Carbon Emissions Reduction 2 | ||
|---|---|---|---|---|
| (TWh/year) | (Million Tons/year) | |||
| 2025 | 2030 | 2025 | 2030 | |
| Algeria | 0.392 | 0.756 | 0.215 | 0.415 |
| Bahrain | 0.021 | 0.033 | 0.008 | 0.012 |
| Egypt | 0.687 | 1.266 | 0.275 | 0.507 |
| Iraq | 0.683 | 1.246 | 0.693 | 1.264 |
| Jordan | 0.105 | 0.18 | 0.061 | 0.105 |
| Kuwait | 0.055 | 0.091 | 0.039 | 0.065 |
| Lebanon | 0.072 | 0.122 | 0.056 | 0.094 |
| Libya | 0.122 | 0.201 | 0.237 | 0.391 |
| Morocco | 0.252 | 0.484 | 0.140 | 0.269 |
| Oman | 0.117 | 0.2 | 0.057 | 0.097 |
| Palestine | 0.003 | 0.006 | 0.002 | 0.005 |
| Qatar | 0.051 | 0.085 | 0.015 | 0.026 |
| Saudi Arabia | 2.2 | 3.6 | 1.258 | 2.058 |
| Sudan | 0.346 | 0.852 | 0.081 | 0.199 |
| Sudan | 0.346 | 0.852 | 0.183 | 0.451 |
| Tunisia | 0.133 | 0.238 | 0.063 | 0.113 |
| UAE | 1.1 | 1.7 | 0.499 | 0.770 |
| Yemen | 0.04 | 0.082 | 0.083 | 0.170 |
| Total | 6.448 | 11.271 | 3.965 | 7.012 |
Table 16.
Cumulative from 2020 to 2030 benefits attributed to improved MEPs for, lighting, residential refrigerators, and room air-conditioners in the Arab region.
Table 16.
Cumulative from 2020 to 2030 benefits attributed to improved MEPs for, lighting, residential refrigerators, and room air-conditioners in the Arab region.
| Country | Lighting | Residential Refrigerators | Air Conditioners | |||
|---|---|---|---|---|---|---|
| Electricity Use Savings 1 (TWh) | Carbon Emissions Reduction 2 (Million Tonnes) | Electricity Use Savings 1 (TWh) | Carbon Emissions Reduction 2 (Million Tonnes) | Electricity Use Savings 1 (TWh) | Carbon Emissions Reduction 2 (Million Tonnes) | |
| Algeria | 20.5 | 11.2 | 8.7 | 4.8 | 4.3 | 2.4 |
| Bahrain | 2.7 | 1.0 | 0.5 | 0.2 | 0.2 | 0.1 |
| Egypt | 16.3 | 6.5 | 21.3 | 8.5 | 7.3 | 2.9 |
| Iraq | 11.8 | 12.0 | 5.6 | 5.7 | 7.3 | 7.4 |
| Jordan | 3.9 | 2.3 | 1.3 | 0.8 | 1.1 | 0.6 |
| Kuwait | 13.8 | 9.8 | 1.9 | 1.4 | 0.6 | 0.4 |
| Lebanon | 4 | 3.1 | 1 | 0.8 | 0.7 | 0.5 |
| Libya | 12.3 | 23.9 | 1.5 | 2.9 | 1.3 | 2.5 |
| Morocco | 12.8 | 7.1 | 5 | 2.8 | 2.7 | 1.5 |
| Oman | 6.4 | 3.1 | 0.8 | 0.4 | 1.2 | 0.6 |
| Palestine | 1.3 | 0.8 | 0.8 | 0.7 | 0 | 0.0 |
| Qatar | 12.2 | 3.7 | 0.4 | 0.1 | 0.5 | 0.2 |
| Saudi Arabia | 70.3 | 40.2 | 8.7 | 5.0 | 22.5 | 12.9 |
| Syria | 2.4 | 0.6 | 4.2 | 1.0 | 0.7 | 0.2 |
| Sudan | 1.7 | 0.9 | 6.8 | 3.6 | 4.2 | 2.2 |
| Tunisia | 6.6 | 3.1 | 1.9 | 0.9 | 1.4 | 0.7 |
| UAE | 27.2 | 12.3 | 4 | 1.8 | 10.7 | 4.8 |
| Yemen | 1 | 2.1 | 2.1 | 4.4 | 0.5 | 1.0 |
| Total | 227.2 | 143.7 | 76.5 | 45.6 | 67.2 | 40.9 |
Table 17.
Potential annual benefits attributed to using integrated control LED lighting units in commercial and services buildings in the Arab region.
Table 17.
Potential annual benefits attributed to using integrated control LED lighting units in commercial and services buildings in the Arab region.
| Country | Electricity Use Savings (TWh/year) | Peak Demand Reduction (MW) | Carbon Emissions Reduction (Million Tons/year) | |||
|---|---|---|---|---|---|---|
| 2025 | 2030 | 2025 | 2030 | 2025 | 2030 | |
| Algeria | 0.000 | 0.000 | 258.960 | 517.920 | 0.000 | 0.000 |
| Bahrain | 0.246 | 0.491 | 77.220 | 154.440 | 0.090 | 0.180 |
| Egypt | 1.607 | 3.214 | 929.500 | 1859.000 | 0.644 | 1.288 |
| Iraq | 0.101 | 0.202 | 762.960 | 1525.920 | 0.103 | 0.205 |
| Jordan | 0.184 | 0.368 | 132.200 | 264.400 | 0.107 | 0.214 |
| Kuwait | 0.615 | 1.229 | 720.000 | 1440.000 | 0.438 | 0.875 |
| Lebanon | 0.113 | 0.227 | 76.680 | 153.360 | 0.088 | 0.175 |
| Libya | 0.133 | 0.266 | 309.600 | 619.200 | 0.258 | 0.517 |
| Morocco | 0.568 | 1.137 | 216.808 | 433.616 | 0.316 | 0.632 |
| Oman | 0.402 | 0.804 | 269.500 | 539.000 | 0.195 | 0.391 |
| Qatar | 0.251 | 0.501 | 228.908 | 457.816 | 0.075 | 0.150 |
| Saudi Arabia | 3.930 | 7.861 | 1545.660 | 3091.320 | 2.247 | 4.494 |
| Sudan | 0.690 | 1.380 | 109.873 | 219.746 | 0.161 | 0.323 |
| Syria | 0.137 | 0.273 | 78.750 | 157.500 | 0.072 | 0.145 |
| Tunisia | 0.300 | 0.600 | 134.280 | 268.560 | 0.142 | 0.285 |
| United Arab Emirates | 1.487 | 2.973 | 994.740 | 1989.480 | 0.674 | 1.347 |
| Yemen | 0.066 | 0.133 | 57.600 | 115.200 | 0.138 | 0.276 |
| Total | 10.830 | 21.660 | 6903.239 | 13806.478 | 5.748 | 11.496 |
Table 18.
Status of building energy efficiency regulations in Arab countries.
| Country | Building EE Regulation (Year of Implementation) | Type of Compliance | Mandatory/Voluntary | EE RISE Score (Max. 100) |
|---|---|---|---|---|
| Algeria | Thermal Insulation for building envelope (2005) | Prescriptive | Mandatory | 56 |
| Bahrain | Thermal Insulation Requirements for commercial buildings (1999) and other building types (2013) | Prescriptive | Mandatory | 25 |
| Egypt | Energy Efficiency code for residential (2005), commercial (2009), and public buildings | Prescriptive and Performance | Mandatory | 48 |
| Iraq | Energy Efficiency Specifications for Buildings (2012) | Prescriptive | Voluntary | NA |
| Jordan | Energy Conservation Building Code (2010) | Prescriptive | Mandatory | 57 |
| Kuwait | Energy Conservation Code of Practice No. R-6 (1983 updated 2014) | Prescriptive | Mandatory | 30 |
| Mauritania | None | NA | NA | 9 |
| Morocco | Energy Efficiency Code (2015) | Prescriptive and Performance | Mandatory | 42 |
| Lebanon | Thermal Insulation Requirements | Prescriptive | Voluntary | |
| ARZ Building Rating System for Existing Buildings (LBGC, 2011) | Evidence-based building rating systems for existing commercial buildings | Voluntary | 35 | |
| Libya | None | NA | NA | NA |
| Oman | None | NA | NA | |
| Palestine | Energy Efficiency Code for Buildings (2004) | Prescriptive | Voluntary | NA |
| Qatar | Global Building Assessment System (GSAS): | Sustainable Building Label System | Mandatory | 50 |
| All new Public Buildings (2012) | ||||
| All new Commercial Buildings (2016) | ||||
| All new Residential Buildings (2020) | ||||
| Saudi Arabia | Thermal Performance Code (2014) | Prescriptive | Mandatory | 49 |
| Sudan | None | NA | NA | 19 |
| Syria | Thermal Insulation Code (2009) | Prescriptive | Mandatory | NA |
| Tunisia | Energy Efficiency code for residential (2009) and select commercial and institutional buildings (2008) | Prescriptive and Performance | Mandatory | 68 |
| United Arab Emirates (Dubai) | Thermal Insulation requirements (2003) | Prescriptive | Mandatory | |
| Green Building Regulations and Specifications (2011) | Performance | Voluntary | 63 | |
| Yemen | None | NA | NA | 12 |
Table 19.
Economic and environmental benefits for requiring better-insulated building envelope systems for all new buildings in the Arab region (only countries without any building energy efficiency codes (BEECs) prior to 2014 are considered as listed in Table 18).
Table 19.
Economic and environmental benefits for requiring better-insulated building envelope systems for all new buildings in the Arab region (only countries without any building energy efficiency codes (BEECs) prior to 2014 are considered as listed in Table 18).
| Building Type | Annual Energy Use Savings (TWh/year) | Peak Demand Savings (MW) | Annual CO2 Emissions Savings (Million Tons/year) |
|---|---|---|---|
| Residential Buildings | 1.263 | 228 | 0.39 |
| Commercial and Public Buildings | 0.532 | 96 | 0.17 |
| Total | 1.795 | 324 | 0.560 |
Table 20.
Summary of energy use savings and normalized life-cycle cost (LCC) values and implementation costs for minimizing LCC to achieve optimal designs for residential buildings in select Arab cities.
Table 20.
Summary of energy use savings and normalized life-cycle cost (LCC) values and implementation costs for minimizing LCC to achieve optimal designs for residential buildings in select Arab cities.
| Country | City | Optimal Energy Saving [%] | Optimal LCC Reduction [%] | Construction Cost Increase for Optimal Design * |
|---|---|---|---|---|
| Algeria | Oran-Senia | 33 | 14 | 5 |
| Egypt | Cairo | 31 | 13 | 4 |
| Jordan | Amman | 45 | 15 | 17 |
| Kuwait | Kuwait | 56 | 25 | 20 |
| Lebanon | Beyrouth | 32 | 14 | 3 |
| Libya | Tripoli | 47 | 16 | 17 |
| Morocco | Rabat | 33 | 15 | 2 |
| Oman | Salalah | 32 | 14 | 2 |
| Qatar | Doha | 47 | 17 | 14 |
| Saudi Arabia | Riyadh | 55 | 22 | 20 |
| Syria | Damascus | 49 | 18 | 17 |
| Tunisia | Tunis | 47 | 16 | 17 |
| UAE | Abu-Dhabi | 43 | 16 | 11 |
(*): The construction costs considered in the analysis include those of walls, roofs, heating, air conditioning, and lighting systems [8].
Table 21.
Economic and environmental benefits for implementing integrated BEECs for all new buildings in the Arab region.
Table 21.
Economic and environmental benefits for implementing integrated BEECs for all new buildings in the Arab region.
| Building Type | Annual Energy Use Savings (TWh/year) | Peak Demand Savings (MW) | Annual CO2 Emissions Savings (Million Tons/year) |
|---|---|---|---|
| Residential Buildings | 9.490 | 1543 | 2.960 |
| Commercial and Public Buildings | 3.249 | 528 | 1.014 |
| Total | 12.739 | 2071 | 3.974 |
Table 22.
Options for energy efficiency measures specific to three retrofit levels of Omani residential buildings (source: [2]).
Table 22.
Options for energy efficiency measures specific to three retrofit levels of Omani residential buildings (source: [2]).
| Recommended Options | Retrofit Description (a) | Retrofit Level for Residential Buildings | ||
|---|---|---|---|---|
| Level-1 | Level-2 | Level-3 | ||
| 1. | List of EEMs | EEM-1 | EEM-1, EEM-2, and EEM-3 | EEM-1, EEM-2, EEM-3, and EEM-4 |
| Energy Use Savings | 12% | 28% | 54% | |
| Range of reduction in savings due to behavioral and rebound effects (b) | 0%–6% | 0%–6% | 0%–6% | |
| 2. | List of EEMs | EEM-2 | EEM-4 | EEM-2, EEM-3, and EEM-6 |
| Energy Use Savings | 10.0% | 29% | 51.0% | |
| Range of reduction in savings due to behavioral and rebound effects (b) | 0%–4% | 0%–4% | 0%–4% | |
| 3. | List of EEMs | EEM-3 | EEM-5 | EEM-5, and EEM-6 |
| Energy Use Savings | 10% | 28% | 52% | |
| Range of reduction in savings due to behavioral and rebound effects (b) | 0%–4% | 0%–6% | 0%–6% | |
Notes:
- (a)
- Description of EEMs:
- ⮚
- EEM-1: Increase the cooling set from 21 °C to 23 °C, from 22 °C to 24 °C, or from 23 °C to 25 °C depending on the existing operating conditions.
- ⮚
- EEM-2: Replace existing lighting fixtures by LEDs.
- ⮚
- EEM-3: Seal air leakage sources around the building envelope (i.e., window and door frames so ACH = 0.21).
- ⮚
- EEM-4: Replace the existing AC unit by a high-efficiency system (COP = 4.0).
- ⮚
- EEM-5: Better lighting controls including dimming daylighting and occupancy sensors for commercial buildings.
- ⮚
- EEM-6: Insulate the roof using RSI-3.
- (b)
- The behavioral and rebound effects are estimated based on previous studies. Typically, the effects are higher for measures that relay on temperature and lighting controls (i.e., EEM-1 and EEM-5).
Table 23.
The energy and environmental benefits for three levels of building energy efficiency retrofit programs for the Arab region *.
Table 23.
The energy and environmental benefits for three levels of building energy efficiency retrofit programs for the Arab region *.
| Retrofit Program | Level-1 | Level-2 | Level-3 |
|---|---|---|---|
| Annual Energy Savings (TWh/year) | |||
| ● Residential Buildings | 63.269 | 166.523 | 344.180 |
| ● Commercial Buildings | 21.660 | 59.346 | 125.623 |
| Total Existing Building Stock | 84.929 | 225.870 | 469.803 |
| Peak Demand Savings (MW) | |||
| ● Residential Buildings | 9720 | 24,301 | 49,074 |
| ● Commercial Buildings | 3328 | 8318 | 16,358 |
| Total Existing Building Stock | 13,048 | 32,619 | 65,432 |
| Annual CO2 Savings Tons/year) | |||
| ● Residential Buildings | 19.764 | 52.561 | 109.326 |
| ● Commercial Buildings | 6.729 | 17.896 | 37.224 |
| Total Existing Building Stock | 26.493 | 70.458 | 146.550 |
(*) The benefits are estimated when the entire existing building stock within the Arab region is retrofitted.
Table 24.
Summary of investments and benefits for building energy retrofit programs in Saudi Arabia (Source: [12]).
Table 24.
Summary of investments and benefits for building energy retrofit programs in Saudi Arabia (Source: [12]).
| Retrofit Program | Level 1 | Level 2 | Level 3 |
|---|---|---|---|
| Investments Required (USD Billion) | 10 | 104 | 207 |
| Avoided Electricity Consumption (GWh/year) | 16,000 | 46,000 | 100,000 |
| Value of Avoided Electricity Consumption (USD Billion/year) | 0.5–1.7 | 1.4–4.9 | 3.0–10.5 |
| Avoided Electricity Generation Capacity (MW) | 3700 | 10,500 | 22,900 |
| Value of Avoided Electricity Capacity (USD Billion) | 2.8 | 7.9 | 17.2 |
| Jobs Created (per year for a 10-year period) | 12,000 | 123,000 | 247,000 |
| Reduced Carbon Emissions (million ton/year) | 12 | 35 | 76 |
Table 25.
Size and benefits of photovoltaic (PV) systems installed on roofs of the entire existing residential buildings in Saudi Arabia and Tunisia.
Table 25.
Size and benefits of photovoltaic (PV) systems installed on roofs of the entire existing residential buildings in Saudi Arabia and Tunisia.
| Size/Benefits | Saudi Arabia | Tunisia |
|---|---|---|
| PV Roof Area Available for Housing Units (Million m2) | 221.8 | 70.0 |
| Size of Roof-PV Systems (GW) | 38.0 | 10.5 |
| Annual Electricity Generated by PV (TWh/year) | 51.0 | 15.2 |
| Carbon Emissions Avoided (Million Tons/year) | 29.2 | 7.2 |
© 2019 by the author. Licensee MDPI, Basel, Switzerland. This article is an open access article distributed under the terms and conditions of the Creative Commons Attribution (CC BY) license (http://creativecommons.org/licenses/by/4.0/).
Share and Cite
MDPI and ACS Style
Krarti, M. Evaluation of Energy Efficiency Potential for the Building Sector in the Arab Region. Energies 2019, 12, 4279. https://doi.org/10.3390/en12224279
AMA Style
Krarti M. Evaluation of Energy Efficiency Potential for the Building Sector in the Arab Region. Energies. 2019; 12(22):4279. https://doi.org/10.3390/en12224279
Chicago/Turabian StyleKrarti, Moncef. 2019. "Evaluation of Energy Efficiency Potential for the Building Sector in the Arab Region" Energies 12, no. 22: 4279. https://doi.org/10.3390/en12224279
Note that from the first issue of 2016, this journal uses article numbers instead of page numbers. See further details here.