Article

Influence of the Particle Size of Sandy Sediments on Heat and Mass Transfer Characteristics during Methane Hydrate Dissociation by Thermal Stimulation

1
Key Laboratory of Gas Hydrate, Guangzhou Institute of Energy Conversion, Chinese Academy of Sciences, Guangzhou 510640, China
2
Guangzhou Center for Gas Hydrate Research, Chinese Academy of Sciences, Guangzhou 510640, China
3
Guangdong Key Laboratory of New and Renewable Energy Research and Development, Guangzhou 510640, China
4
University of Chinese Academy of Sciences, Beijing 100083, China
5
Institute of Environmental and Ecological Engineering, Guangdong University of Technology, Guangzhou 510006, China
*
Author to whom correspondence should be addressed.
Energies 2019, 12(22), 4227; https://doi.org/10.3390/en12224227
Submission received: 25 September 2019 / Revised: 27 October 2019 / Accepted: 29 October 2019 / Published: 6 November 2019

Abstract

:
Natural gas hydrate could be regarded as an alternative energy source in the future. Therefore, the investigation of the gas production from hydrate reservoirs is attracting extensive attention. In this work, a novel set-up was built to investigate sand production and sediment deformation during hydrate dissociation by heat stimulation. The influence of the particle sizes on the hydrate dissociation and sediment deformation was first investigated experimentally. The experimental results indicated that the rate of hydrate decomposition by heat stimulation was in proportion to the particle size of the sediment. The heat transfer rate and the energy efficiency decreased with the decrease of the particle size of the sediment. This was because higher permeability might lead to a larger sweep area of the fluid flow, which was beneficial for the supply of heat for hydrate dissociation. The sand production was found during hydrate dissociation by heat stimulation. The particle migration was due to the hydrodynamics of the water injection. The sand sediment expanded under the drive force from water injection and hydrate dissociation. Additionally, the smaller permeability led to the larger pressure difference leading to the larger sediment deformation. Because the sediment became loose after hydrate dissociation, small particle migration due to the hydrodynamics of the water injection could happen during the experiments. However, the sand production in the sediment with the larger particle size was more difficult, because the larger particles were harder to move due to the hydrodynamics, and the larger particles were harder to move across the holes on the production well with a diameter of 1 mm. Therefore, the sediment deformation during hydrate dissociation by heat stimulation should not be ignored.

1. Introduction

Due to the increase of energy demand, it is imperative to develop an alternative energy source to solve energy shortage issues. Natural gas hydrate (NGH) could be regarded as an alternative energy source in the future due to huge reserves of methane gas trapped in hydrate-bearing formations. Although the precise estimation of methane hydrate all over the world is uncertain, the estimation varies from 2.8 × 10¹⁵ to 8.0 × 10¹⁸ m3 [1,2]. The energy reserves in gas hydrate are considered as huge. The common sense idea can be expressed that gas hydrates contain most of the methane on earth and they account for roughly a third of the mobile organic carbon all over the world [3]. Huge reserves and worldwide distribution are the great advantages of methane hydrate, which make methane hydrate the most important substitute energy resource for petroleum, coal, and natural gas in the twenty-first century [4].
NGH is an ice-like solid compound that is stabilized when water and guest molecules are in contact in the conditions of high pressure and low temperature, such as in marine deposits and the permafrost regions [5,6,7]. Methane, ethane, propane, nitrogen, hydrogen, and so on, are regarded as the guest molecules trapped in the cage constituted by water molecules. Methane is the most common guest gas in nature. It is commonly recognized that 1 m3 of hydrate can release 160 m3 of natural gas [8].
Unlike the conventional gas and oil reserves, recovering natural gas from NGH involves a hydrate dissociation process. This complex process combines a multi-phase change, heat transfer, and mass transfer. Hydrate dissociation from an in-situ situation should break the stable pressure−temperature condition for NGH, and the gas released from the NGH must overcome the Van der Waals force between the water molecule and the guest molecule [9].
During the past four decades, over 230 natural gas hydrate deposits have been found on our planet. Depressurization [10,11,12,13], thermal stimulation [14,15], chemical injection [16,17], and their combined application have been applied and investigated for hydrate destabilization [18,19]. Models of hydrate dissociation using different methods have been reported [20,21]. If only 17%–20% of this resource can be exploited, NGH can be a sufficient energy source supply for at least 200 years [22]. Field testing of NGH exploitation not only plays an important role in improving production technology but also in assessing environmental and security effects. Seven field tests of gas production from hydrate deposits have been conducted around the world since 2002. Four field tests have been carried out in the permafrost region, and three tests have been performed in a marine environment [23,24,25,26,27,28,29].
Field tests play a crucial role in the development path from fundamental research to the commercial exploitation for NGH. However, considering the drawbacks of huge costs, long preparation periods, and the risks of environmental damage, laboratory-scale experimental testing is indispensable for the in-depth study of exploitation technology. During the past few decades, the laboratory-scale simulation for hydrate dissociation has evolved from one-dimensional to three-dimensional [30,31], and the corresponding experimental apparatus has developed from 700 mL [20,32,33] to more than 1000 L [34]. Furthermore, the parameters measured during the hydrate dissociation process have changed from single-parameter monitoring [35] to multi-parameter monitoring [36,37], which can satisfy the monitoring requirements for different dissociation methods. In the previous experimental research, the sand production and sediment deformation were ignored. The relationship between fluid flow and the forces for particles migration was reported by Mahabadi et al. [38]. However, unexpected sand production and sediment deformation are the key factors for preventing long-term gas production from a hydrate reservoir, which have been found in field testing [27]. The problem needs to be further investigated.
In addition, energy recovery from an NGH reservoir may lead to sediment deformation. During hydrate decomposition, the mechanical properties of sediment can be changed due to hydrate dissociation. The hydromechanics of fluid flow in sediment may also lead to fine migration and cause further sediment deformation. This is an important safety problem during hydrate exploitation. Gas production from a hydrate reservoir without safety control can result in geological disasters and other secondary dangerous situations. Kwon et al. [39] designed a hydrate decomposing experiment to analyze hydrate deformation before and after decomposition. In our previous work, the sediment deformation during hydrate dissociation by depressurization has been investigated. The radial shrinkage effect of hydrate decomposition was found, and smaller sediment particle sizes generated more obvious deformations following methane hydrate decomposition [40]. Therefore, sediment deformation is an important research topic for hydrate exploitation in the future, which has a significant impact on the safety of methane hydrate exploitation.
In this work, the influence of particle sizes on hydrate dissociation and sediment deformation was first investigated experimentally. A novel set-up was built to investigate sand production and sediment deformation during hydrate dissociation. Methane hydrate was formed in the sediment for the conditions of constant volume and temperature, and then it was decomposed using the hot water injection method. Gas, water, and sand production behaviors during hydrate dissociation were analyzed. Additionally, the sediment deformation during hydrate dissociation by heat stimulation was first reported.

2. Experimental Section

2.1. Experimental Apparatus

The schematic of the experimental set-up is shown in Figure 1. The key component was the high-pressure reactor, which was made of 316 stainless steel. The effective volume of the reactor (SCHS, Jiang Su Hongbo Co., Ltd., Haian, China) was 729 mL, and it could withstand a pressure as high as 30.0 MPa. The interior of the reactor was cubic. The reactor was immersed in a constant temperature water bath to control the ambient temperature during experiments. The high-pressure reactor was equipped with a quick-opening component, which involved a pair of stainless steel clamps connecting the top cover with the reactor and a rubber O-ring set on the top cover to seal the reactor. The top cover can act like a cap rock above the sediment. The outlet of the reactor was connected with the desander (Desander 1.0, Jiang Su Hongbo Co., Ltd., Haian, China) to separate solid particles that may have been brought out in the process of producing gas, and its working pressure was in the range of 0–40 MPa. There was a back-pressure valve (P6000, TESCOM company, Shanghai, China) produced by the TESCOM company behind the outlet of the desander to ensure the constant pressure in the kettle during the process of exploitation. Its pressure control range was 0–30 MPa and its accuracy was ±0.02 MPa. The outlet flow went through a gas–liquid separator (Separator 1.0, Jiang Su Hongbo Co., Ltd., Haian, China), and the liquid flow was connected to a container placed on the electronic balance. The electronic balance (BS 2202S, Santorius company, Göttingen, Gemany) was produced by the Santorius company and the model was the Santorius BS 2202S (0–2200 g, +0.01 g). The gas production was measured by a gas flow meter (D07-11CM, Seven Star Huachang Electronics Co., Ltd, Shanghai, China) that was produced by the Seven Star Huachang Electronics Co., Ltd. The model was D07-11CM (0–10 L/min, +2%). Twenty-seven monitoring points were installed inside the equipment to record the real-time temperature data during hydrate formation and decomposition. The temperature sensors were evenly distributed in the three layers of the inner space. The temperature sensors were PT100 (PT100, Jiang Su Hongbo Co., Ltd., Haian, China), with a range of 223.15–473.15 K and accuracy of ±0.1 K. The distributions of the wellhead and the temperature sensors are shown in Figure 2. As shown in the figure, the production well and the injection well were located in diagonal corners. The production well was located at the top layer. The injection well was located at the bottom of the reactor.

2.2. Sediments

In order to investigate the influence of the particle size on production behaviors and sediment deformation characteristics during hydrate dissociation using heat stimulation, three different quartz sand samples with different particle sizes were selected for the experiments. The particle sizes of runs 1, 2, and 3 were 240–350, 125–178, and 37–45 μm, respectively. Figure 3 shows the pictures of the experimental sediments. The quartz sands in this experiment were provided by the Bandao quartz sand factory. The difference among these quartz sands can be clearly observed from Figure 3.

2.3. Experimental Procedure

Three experiments of hydrate dissociation by heat stimulation were carried out in sandy sediment with different particle sizes. Table 1 shows the experimental conditions. The experimental conditions were selected according to the geological conditions at the NGH reservoir in the South China Sea [41]. The particle sizes decreased from 240–350 to 37–45 μm for runs 1–3, which is the range of sediment particle sizes of NGH reservoir in the South China Sea. The other experimental parameters were similar for runs 1–3.
Silica sand with a mass of 1000 g was first packed in the reactor to fill the reactor. Then the sediments were immersed in deionized water with a mass of 130 g. Afterwards, the top cover was closed to seal the reactor. Then the residual air was driven out by the injection and release of the methane gas. The entire system was placed in the water bath. Afterwards, the methane gas was pumped into the reactor to pressurize the reactor to 20 MPa. A gradual pressure drop was observed during the hydrate formation. When the pressure dropped to approximately 13.50 MPa, the hydrate bearing sediment samples were prepared. Because the methane saturation in the samples was higher than 50% after hydrate formation, the hydrate bearing sediment samples could be considered excess methane sample. Then, the decomposition experiments were carried out by heat stimulation. At the beginning of the experiments, the production pressure was set at 6.0 MPa by the back-pressure regulator. The outlet valve was opened to make the pressure decrease to the production pressure. During hydrate dissociation, the ambient temperature was maintained at 281.15 K. Thus, the hydrate stability pressure could be calculated to be 5.6 MPa using the fugacity model of Li et al. [42]. This pressure was lower than the production pressure. Afterwards, the heat stimulation started. The deionized water for injection was heated by the preheater to the injection temperature. The injection rate was set by the metering pump. Then, the hot water was injected into the reactor from the injection well. At the same time, gas and water were produced from the production wells. During hydrate dissociation, the pressure in the reservoir was maintained at the production pressure using a back-pressure regulator. After the hydrate in the reservoir was completely dissociated, the residual gas was entirely released until the pressure inside the reactor recovered to the atmospheric pressure. Finally, the reactor was opened with the quick-opening component in order to observe the sediment deformation. The repeatability of the scientific experiments has been reported in our previous work. The error of this experimental result was lower than 5% [43].
The saturation was calculated by the following formulas:
S G + S W + S H = 1 ,
S G = v m · n m , G V p o r e ,
S W = m W 0 N H · ( n m 0 n m , G n m , W ) · M W ρ W V p o r e ,
S H = ( n m 0 n m , G n m , W ) · M W ρ H V p o r e .
In the formulas, SG, SW, and SH represent the gas saturation, water saturation, and hydrate saturation of the hydrate in the reactor, respectively. vm is used as the specific volume of methane gas, and nm0, nm,G, and nm,W (mol) are the initial amount of injected methane, the amount of free gas, and the amount of dissolved water in the reactor. Vpore stands for the porosity volume of the sedimentary layer. As the porous medium is almost incompressible during the experiment, it is considered that Vpore is a constant value. NH is the hydrates number of the hydrates. MW and MH are the molar mass of the water and the molar mass of the hydrate, respectively, and ρW and ρH are the densities of the water and the hydrate, respectively.

3. Results and Discussion

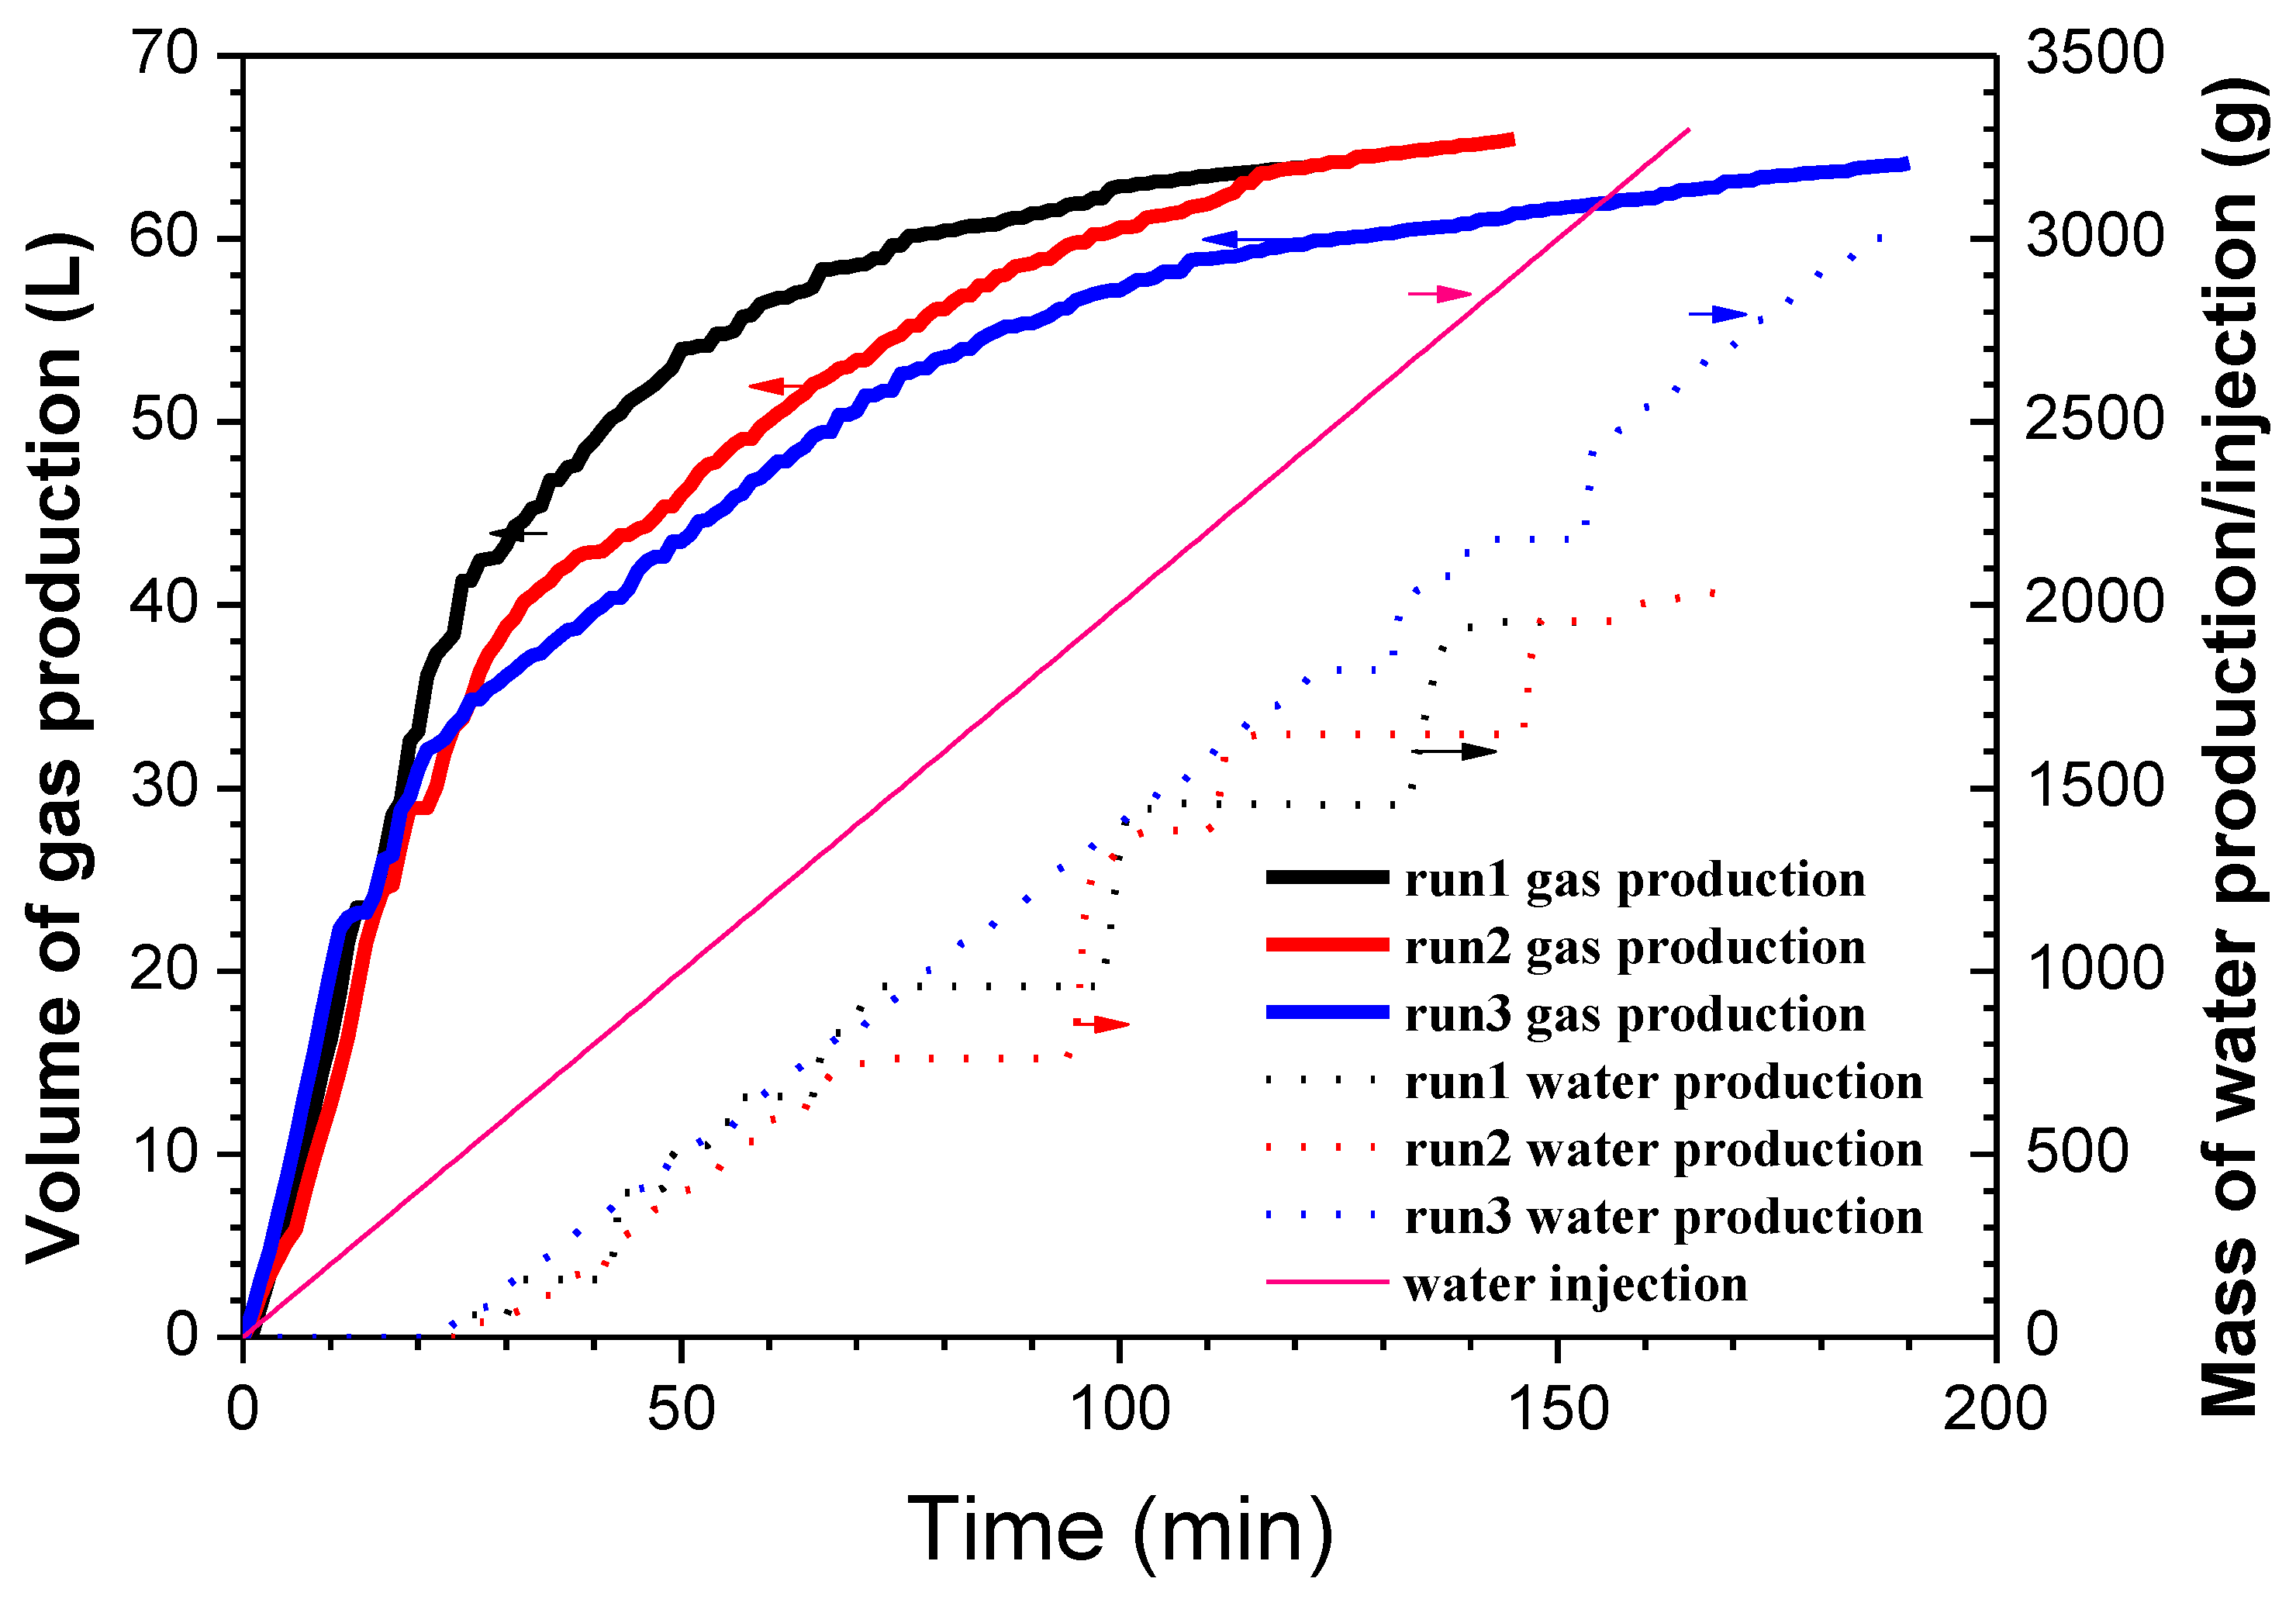
3.1. Production Behaviors

Figure 4 shows the change in volumes of gas and water production during hydrate dissociation for runs 1–3. According to the characteristics during the experiments, the entire production process could be divided into two stages, namely the pressure decreasing (PD) stage and the constant pressure heat stimulation (HS) stage. In the PD stage, the pressure in the reactor decreased from around 13.5 to 6.0 MPa. The produced gas mainly originated from the free gas in the sediment and the hydrate was not dissociated because the pore pressure in this stage was higher than the hydrate stability pressure (5.6 MPa). The durations for the PD stages of runs 1–3 were all around 15 min, and the volumes of the gas released for runs 1, 2, and 3 were 23.47, 23.10, and 23.19 L, respectively, which were similar. Additionally, there was no water production in this stage. During the HS stages, the production pressures stayed at 6.0 MPa, and hot water with the injection rate of 20 mL/min and the injection temperature of 353.15 K was injected into the sediment. The cumulative volumes of the gas production for runs 1, 2, and 3 increased to 66.85, 67.26, and 66.93 L, respectively. As shown in Figure 4, the differences in the gas production curves were obvious. The durations of the HS stages for runs 1, 2, and 3 were 106, 130, and 175 min, respectively. Therefore, the average gas production rates (v) for runs 1–3 had the relationship of vrun 1 > vrun 2 > vrun 3. This result indicates that the gas production rate during the HS stage in the sediment with the larger particle size was higher. This was because the larger particle size led to the higher permeability. When the hot water flowed from injection well to the production well, the higher permeability might lead to the larger sweep area of the fluid flow, which was beneficial for the supply of heat for hydrate dissociation. According to Figure 4, the water started to be produced about 10 min after hot water injection. The water production rates for runs 1–3 were similar, and they were close to the injection rate (20 mL/min). The sudden stop of water production in runs 2–3 may have been due to the sand production.
During hydrate dissociation, sand production phenomena were found in runs 2 and 3, but this did not happen in run 1. Figure 5 shows the sand accumulation in the desander after hydrate decomposition. The masses of the sand production for runs 1–3 were 0, 340.23, and 216.4 g, respectively. Because the sediment became loose after hydrate dissociation, small particle migration due to the hydrodynamics of the water injection could happen during the experiments. However, the sand production in the sediment with the larger particle size was more difficult, because the larger particles were harder to move due to the hydrodynamics, and the larger particles were harder to move across the holes on the production well with a diameter of 1 mm.

3.2. Temperature Characteristics

Figure 6 shows the temperature changes in the measurement points 1A, 9C, and 8B for runs 1–3. The temperature of the water injection was 80 °C and the water injection rate was 20 mL/min. According to Figure 2, point 1A is located on the production well, and point 9C is located close to the injection well. Point 8B is close to the boundary. Therefore, these temperature measurement points were selected as typical measurement points to investigate the heat transfer characteristics of the sediment. It can be seen from Figure 6 that the temperatures at 9C all rose to the maximum after the start of the heat injection, and then the temperatures became stable. The maximum temperatures of runs 1, 2, and 3 were 47, 36.81, and 34.36 °C, respectively. The experimental result indicates that the larger particle sizes of the sediment led to the higher maximum temperatures at the wellhead. This may have been because the higher permeability led to the better fluidity of the injected water, causing less heat loss in the sediment. The temperatures at 1A for runs 1 to 3 were almost the same, and the temperature came to around 11.5 °C at the end of the decomposition process. The result indicates that the hydrate in the sediment gradually decomposed from the injection well to the production well. During this process, the injected heat was consumed by the hydrate dissociation. When the temperature at the production well increased, the hydrate in the sediment could be considered completely dissociated. However, the temperatures at 8B declined from runs 1–3. This was because the influence area of the hot water in the sediment with a higher permeability was larger, causing the higher heat transfer rate to the surroundings. Therefore, the temperatures at 8B of run 1 were the highest.

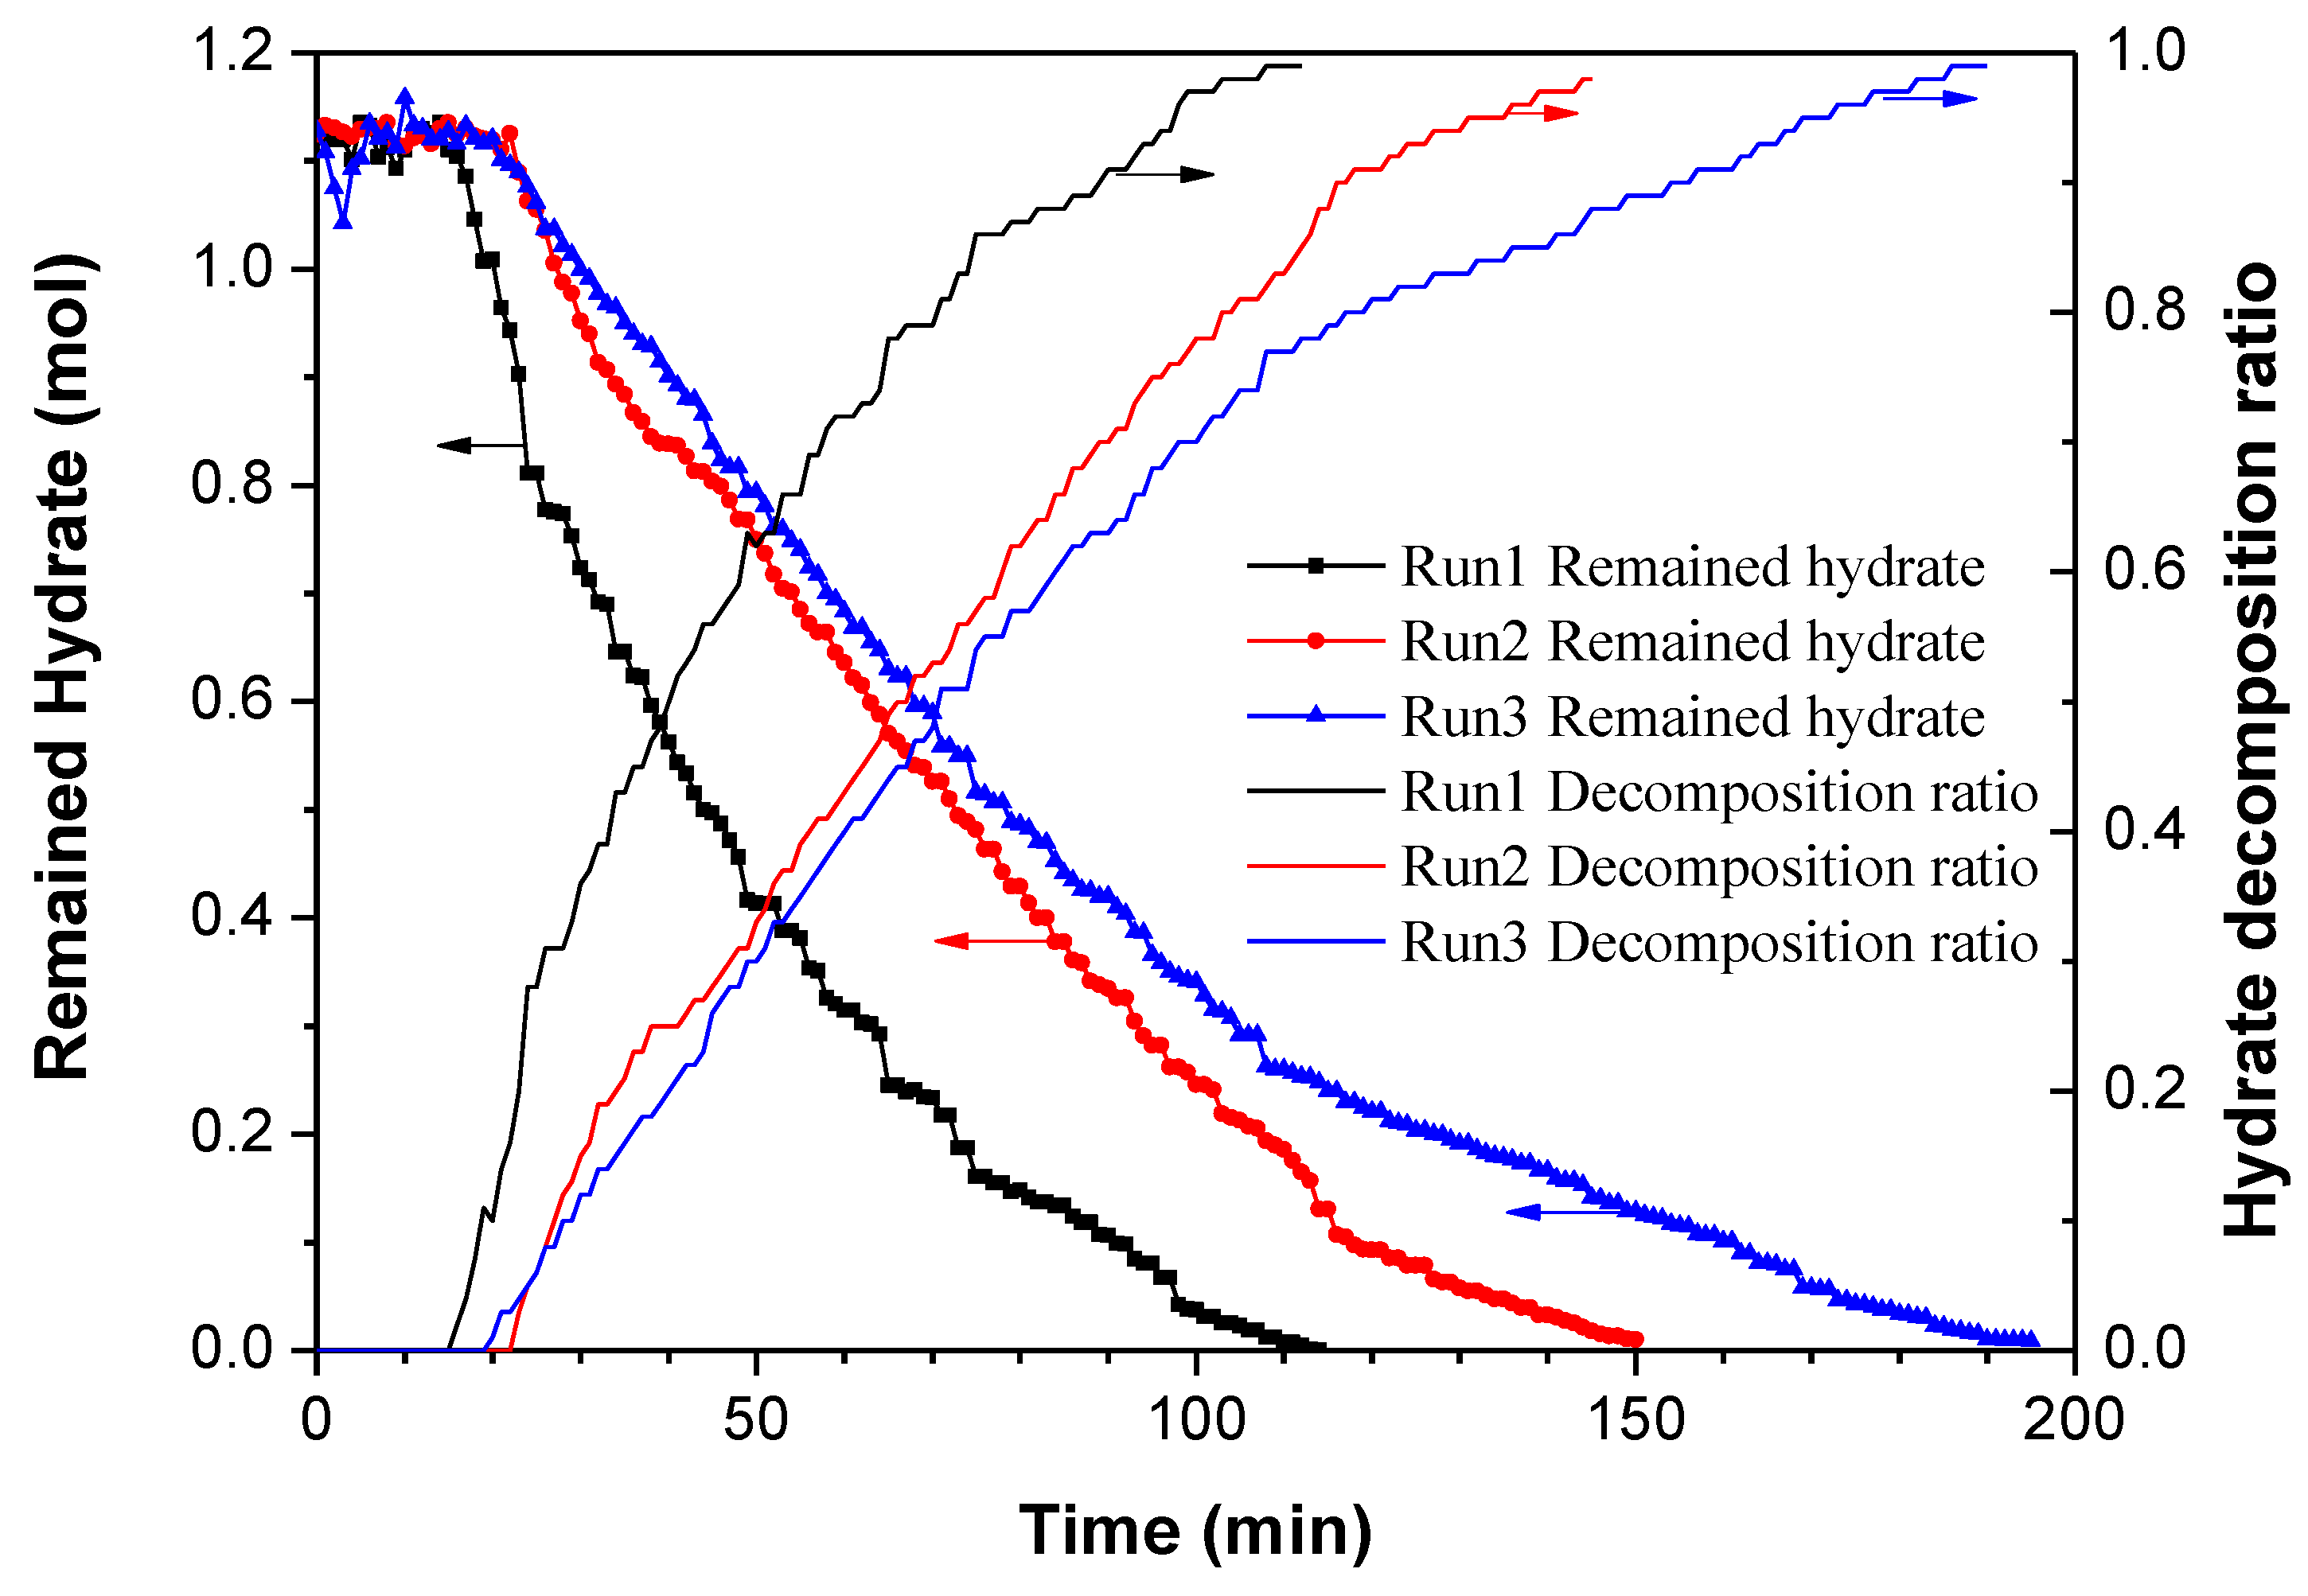
3.3. Hydrate Decomposition Characteristics

The molar quantity of the remaining hydrates during hydrate dissociation could be calculated with the following equation:
n h = V p o r e V W n m o × v m M H ρ H M W × N W ρ W v m ,
where VW is the volume of the injected deionized water, vm is the specific volume of the methane gas, and nm0 is the initial injection volume of the methane in the kettle. Vpore is the porosity volume of the sedimentary layer and NH is the hydrates number of the hydrates. MW and MH are the molar mass of the water and the molar mass of the hydrate, respectively, and ρW and ρH are the densities of water and hydrate, respectively.
The hydrate decomposition ratio could be calculated with the following equation:
φ = n h n h 0 ,
where nh is the molar quantity of the remaining hydrate in the sediments during hydrate decomposition and nh0 is the initial molar quantity of methane hydrate before hydrate decomposition.
The molar quantity of the remaining hydrate and the hydrate decomposition ratio during hydrate dissociation are shown in Figure 7. During the PD stages corresponding to the duration from 0 min to 15–20 min, the molar quantity of methane hydrate in the sediment did not change, because the hydrate stability pressure (5.6 MPa) was lower than 6.0 MPa, and the hydrates could not be decomposed during this stage. During the HS stage, the hydrate decomposed gradually. It can be seen from the figure that the curves of the remaining hydrate for runs 1 to 3 were separated gradually. Due to the decrease of the sediment permeabilities from runs 1 to 3, the area influenced by the hot water decreased from runs 1 to 3. Therefore, the higher permeability led to the higher heat transfer rate and the higher hydrate dissociation rate.

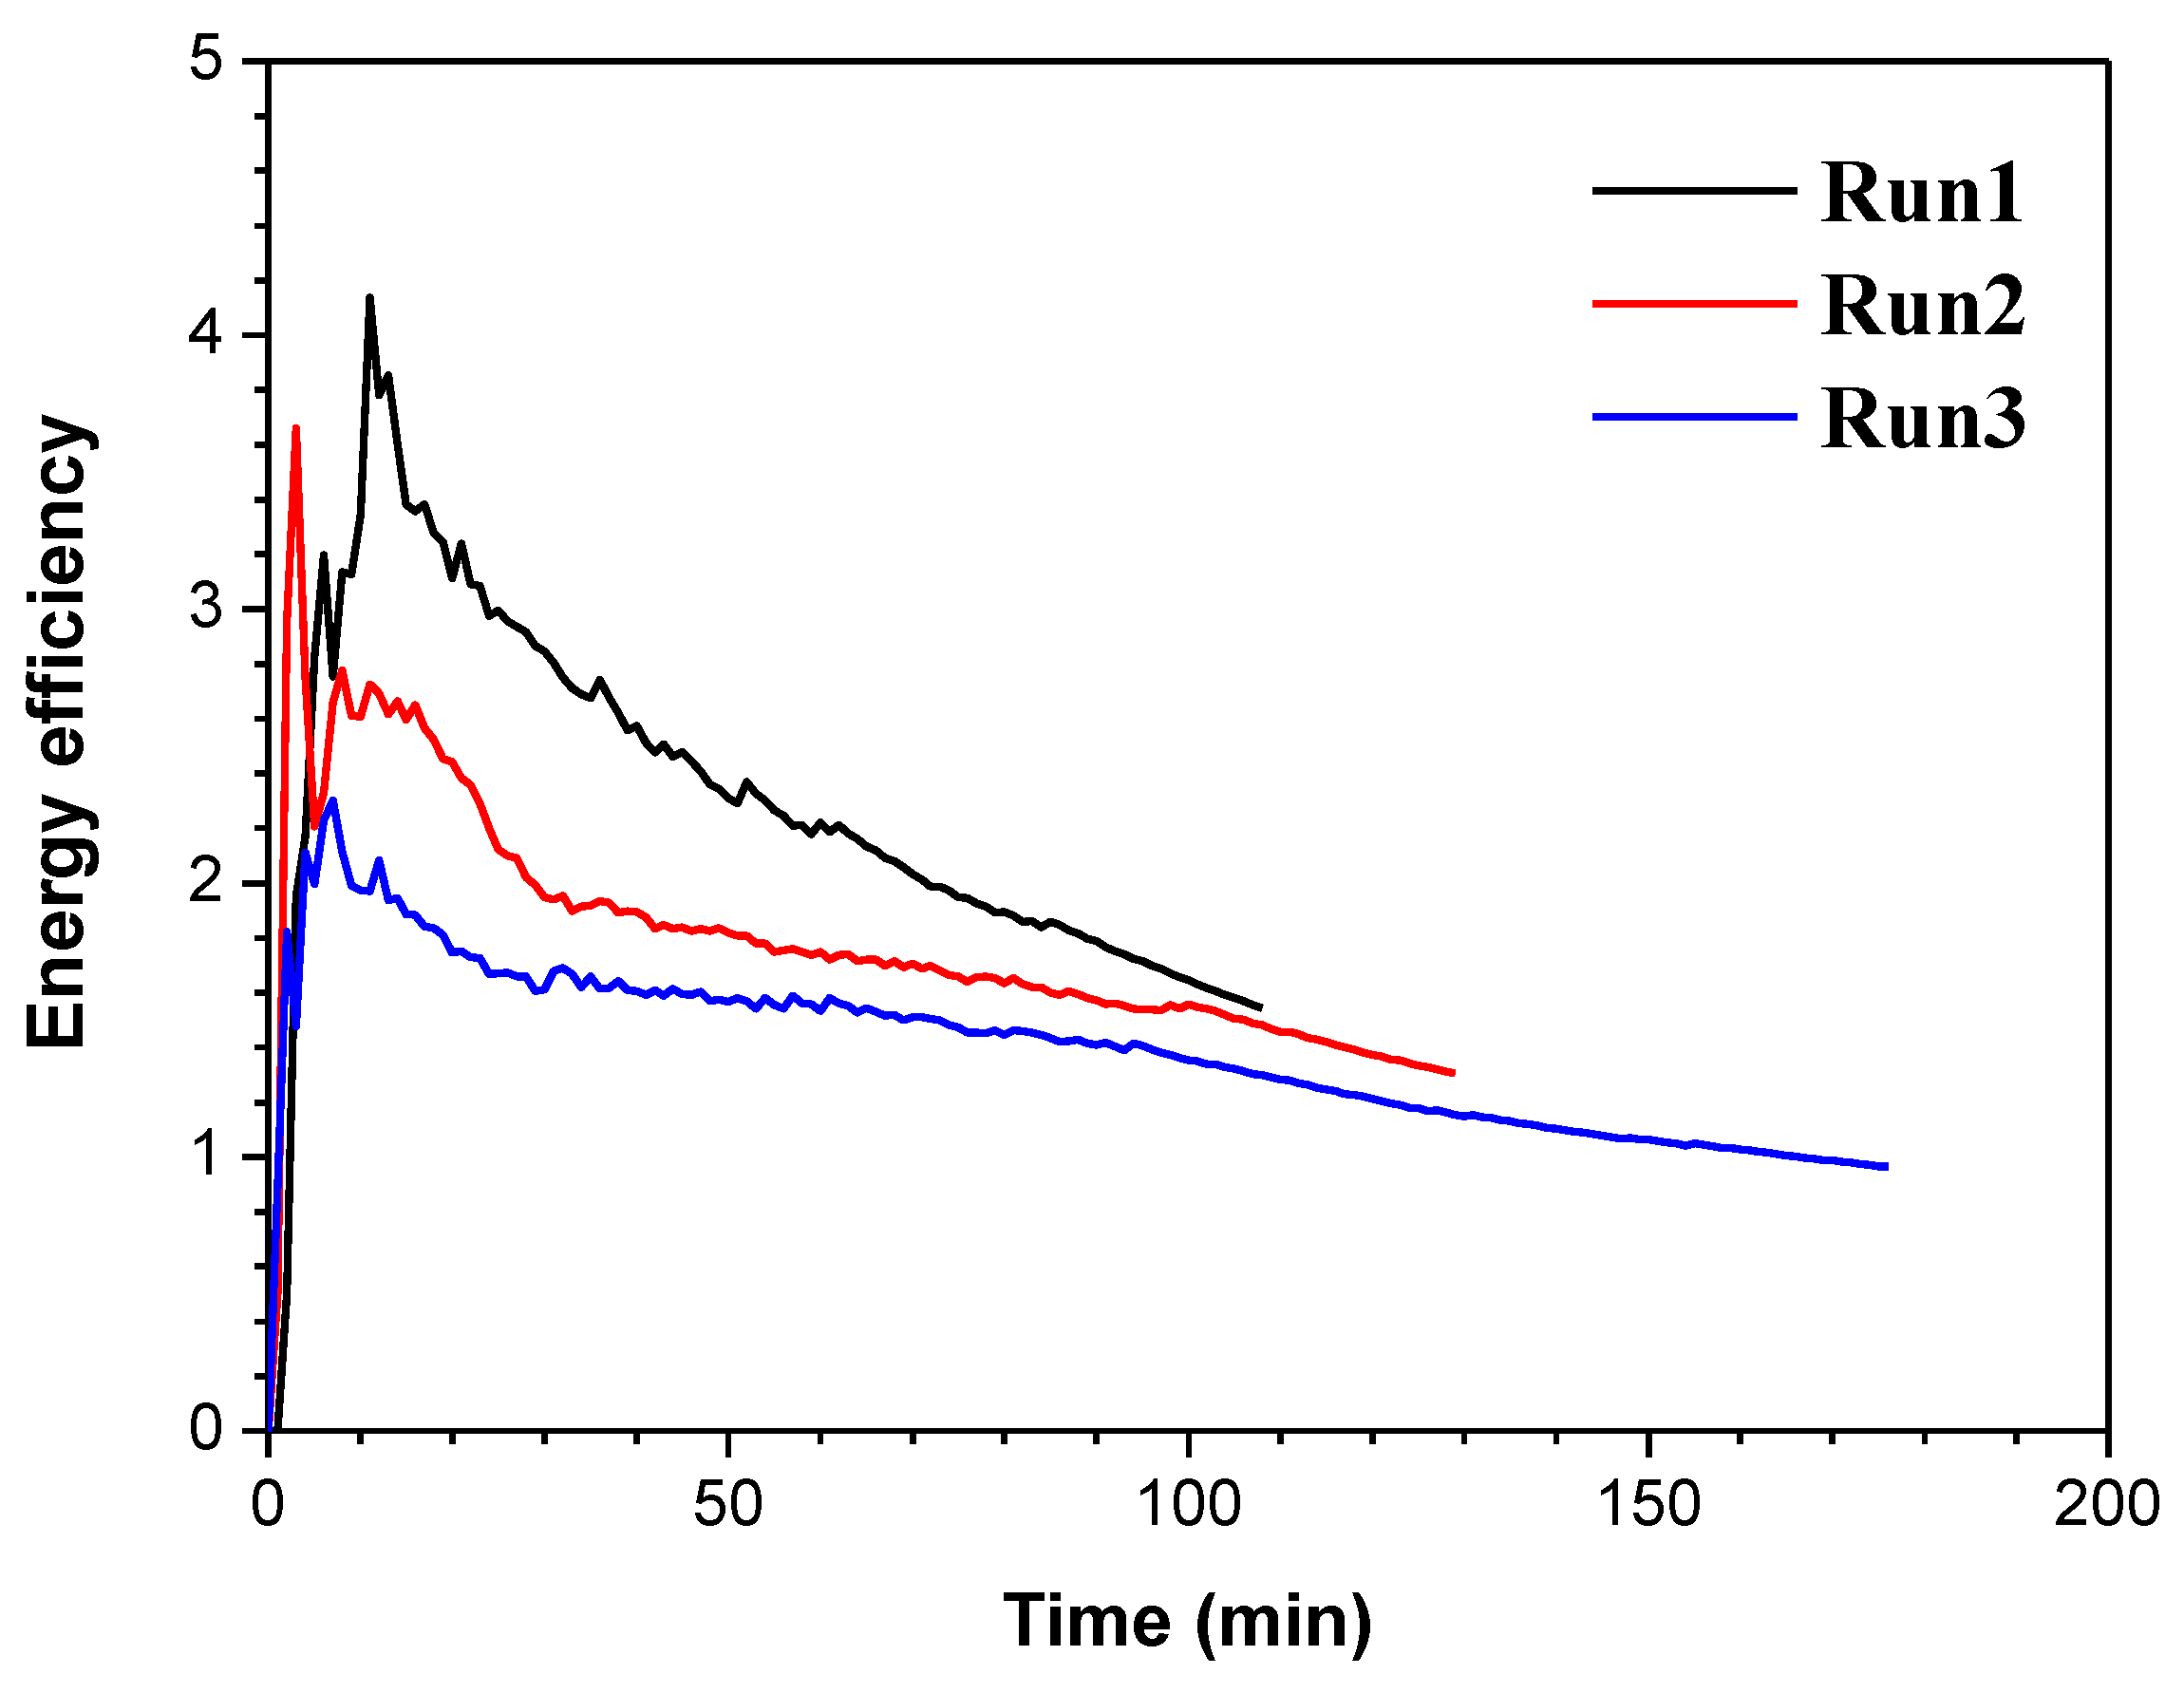
3.4. Energy Efficiency

Energy efficiency can be applied to evaluate the energy utilization during hydrate exploitation. In this work, the energy efficiency was defined as the ratio of the calorific value of the methane gas production to the total heat input to the reactor. The equation is shown as follows:
η = Q t · M g a s C w · M w · ( T 0 T ) ,
where Qt is the final gas production of the methane gas, Mgas is the calorific value of the methane gas at 8 °C, which is 37.6 MJ/m3, Cw represents the specific heat capacity of water, with a value of 4.2 × 10³ J/(kg·K), and T0 is the initial temperature of the injected hot water, where T stands for the temperature of the produced water.
Figure 8 shows the curves of the energy efficiency for runs 1–3. In this figure, the energy efficiencies for runs 1–3 reached the highest value in a short time after the injection of hot water, and the highest energy efficiencies for runs 1–3 were 4.13, 3.66, and 2.30, respectively. Afterwards, the energy efficiency gradually decreased, mainly because the remaining quantity of hydrate decreased gradually, and the heat loss increased in the later period. However, it can be also seen from the figure that the energy efficiencies of runs 1–3 maintained a significant difference during the entire process. The energy efficiency decreased successively from run 1 to run 3. This may have been because the heat transfer rates for runs 1–3 were successively weakened, which also resulted from the different permeability of the sediments.

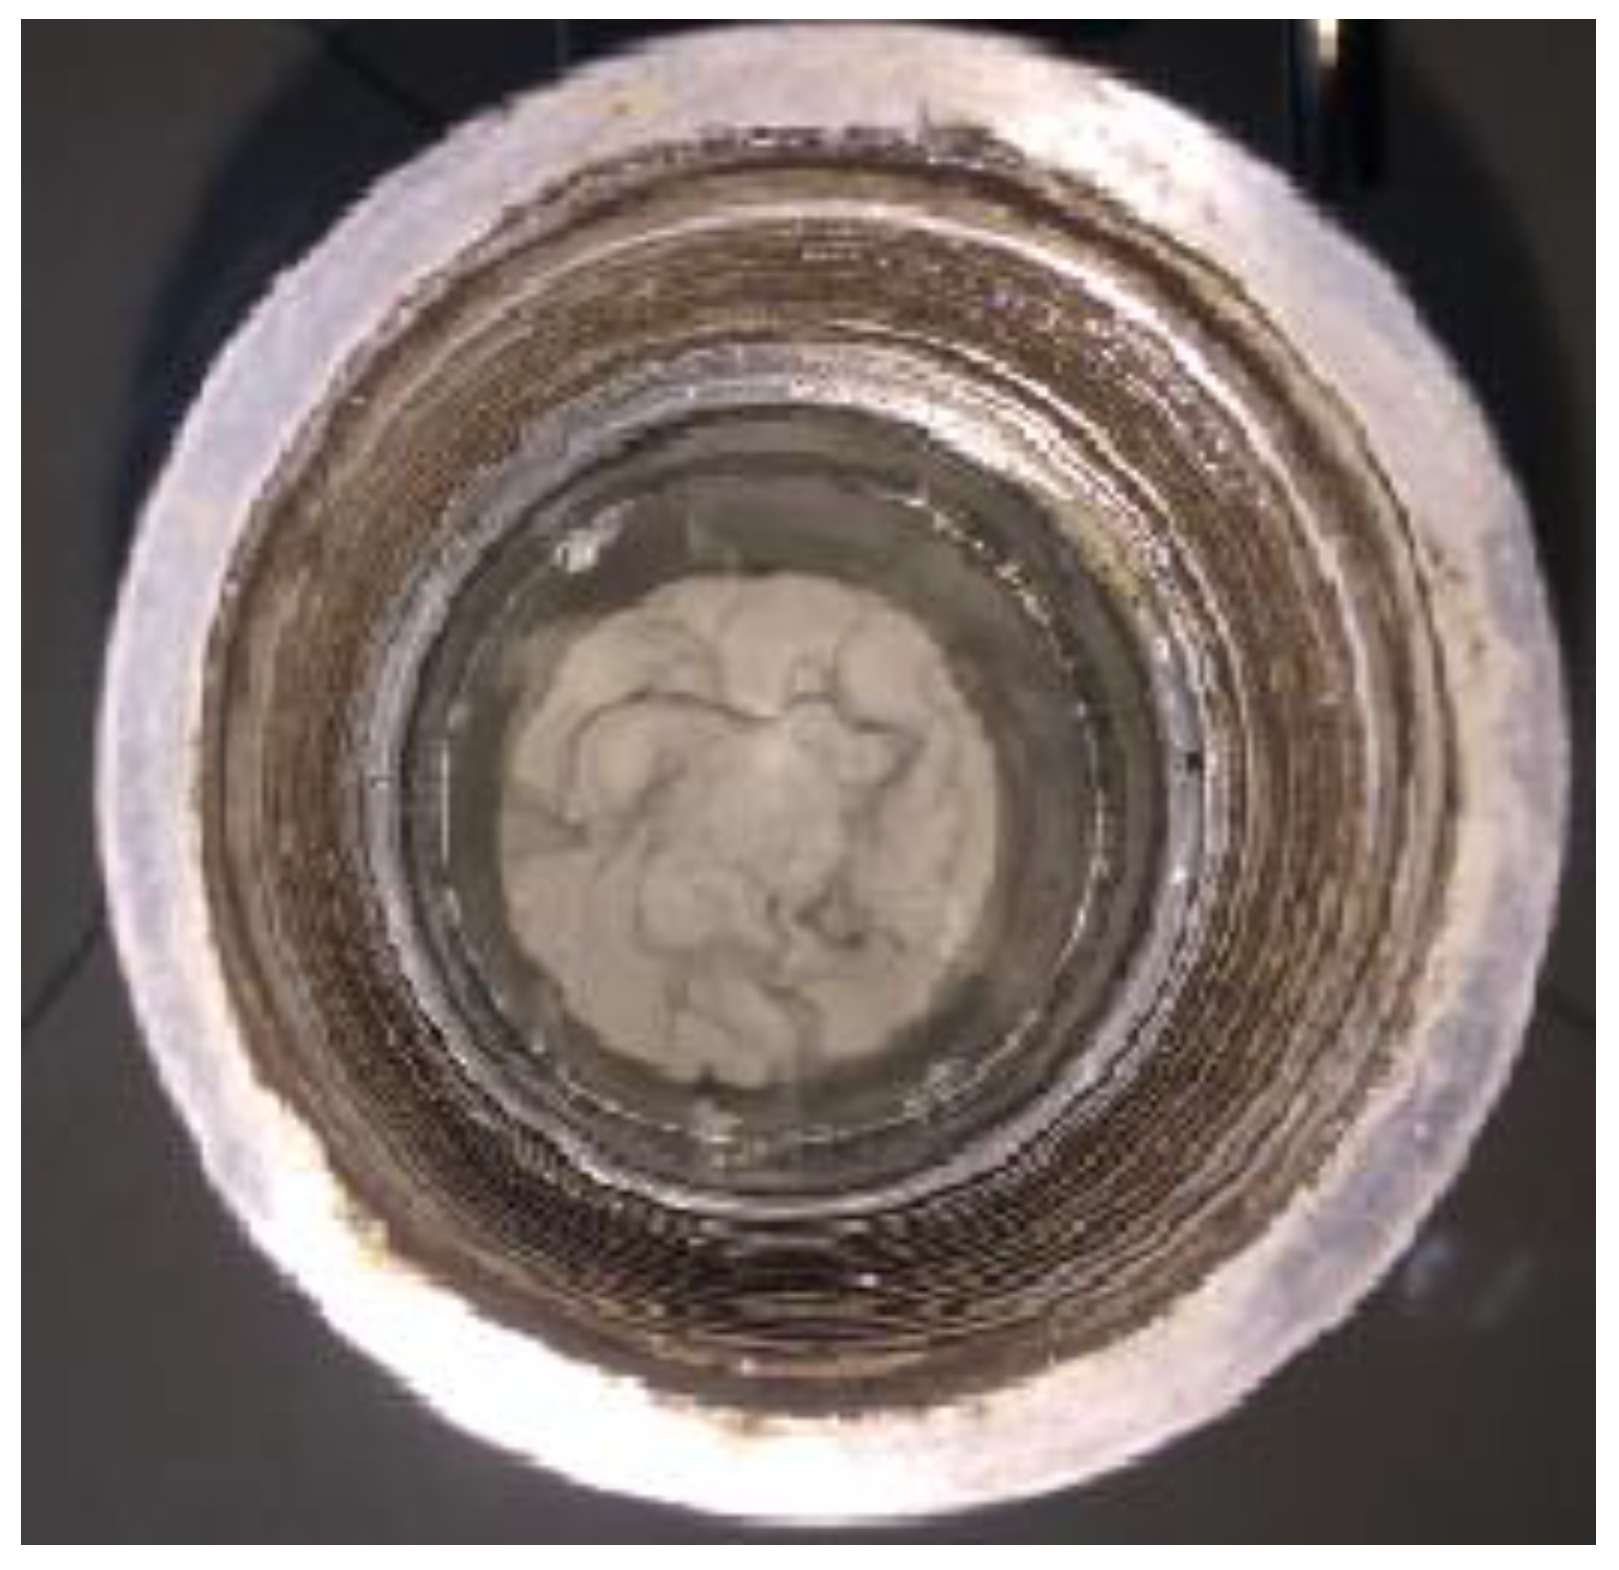
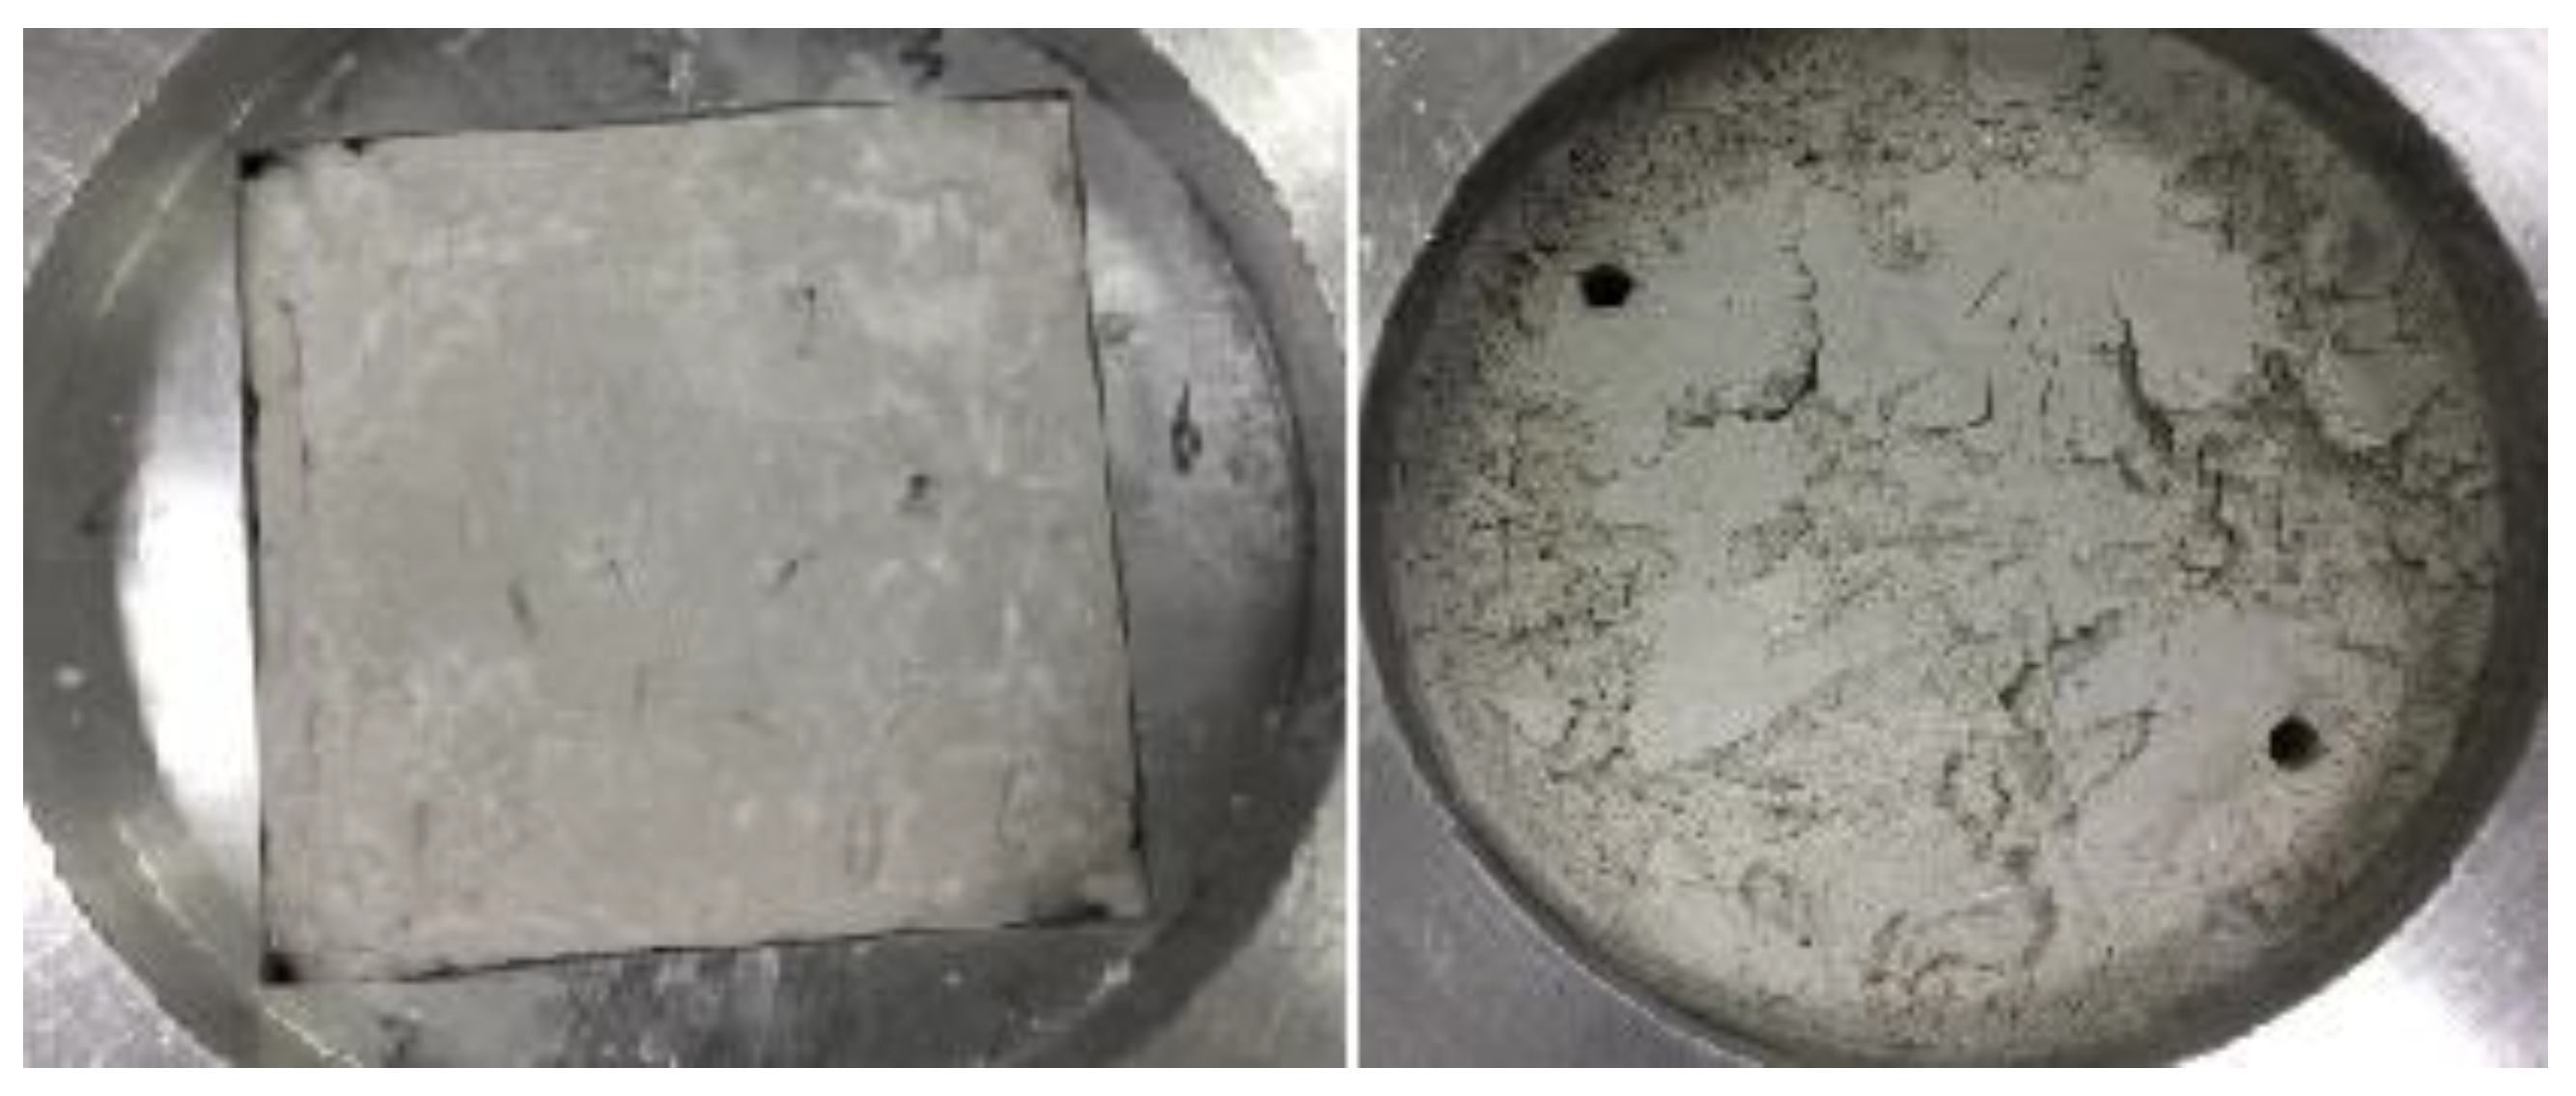
3.5. Sediment Deformation

The gas production from a hydrate reservoir may cause the structure deformation of the sedimentary layer. In this work, the equipment was very convenient to open after the decomposition process. Thus, the deformation of the porous medium could be directly observed after the experiments. Figure 9, Figure 10 and Figure 11 show the sediment morphologies for runs 1–3 before and after hydrate decomposition.
It can be seen from Figure 9, Figure 10 and Figure 11 that the sediment deformations of run 1–3 were similar, which shows the expansion and loosening of sedimentary layers. However, the deformation degree of the sediment increased from run 1–3. During hydrate decomposition, the gas and water flows in the sedimentary layer gradually strengthened, and the sand sediment expanded under the drive force from the water injection and the hydrate dissociation. Additionally, the smaller permeability led to the larger pressure difference, causing the larger sediment deformation.
When gas hydrate is exploited in a real marine or permafrost region, the scale of the sediments is very large. The confining pressure of the sedimentary layer is also very stable. A huge pressure difference may lead to the large deformation of the expansion and fracturing. In a deep-sea sedimentary layer, a complex porous medium structure is a common situation. The distribution of a sedimentary layer is also irregular. This is likely to exacerbate the sediment during the exploitation process. Therefore, the sediment deformation during hydrate dissociation using heat stimulation should not be ignored.

4. Conclusions

In this work, quartz sand with different particle sizes was used as a porous medium to mimic a deep-sea sedimentary layer. Then, methane hydrate was synthesized and decomposed with a heat injection method. The conclusions of this study are summarized as follows:
(1)
The rate of hydrate decomposition was in proportion to the particle size of the sediment. This was because the larger particle size led to the higher permeability. When the hot water flowed from injection well to the production well, the higher permeability might lead to the larger sweep area of the fluid flow, which was beneficial for the supply of heat for hydrate dissociation.
(2)
The heat transfer rate and the energy efficiency decreased with the decrease of the particle size of the sediment.
(3)
Sand production was found during hydrate dissociation by heat stimulation. Because the sediment became loose after hydrate dissociation, small particle migration due to the hydrodynamics of the water injection could happen during the experiments. However, the sand production in the sediment with the larger particle size was more difficult, because the larger particles were harder to move due to the hydrodynamics, and the larger particles were harder to move across the holes on the production well with a diameter of 1 mm.
(4)
The sand sediment expanded under the drive force from the water injection and the hydrate dissociation. In addition, the smaller permeability led to a larger pressure difference, leading to a larger sediment deformation. Therefore, the sediment deformation during hydrate dissociation by heat stimulation should not be ignored.

Author Contributions

Conceptualization, Y.W.; methodology, Y.W.; validation, J.-C.F. and X.-S.L.; formal analysis, Y.W.; investigation, Y.W.; data curation, L.Z.; writing—original draft preparation, L.Z.; writing—review and editing, Y.W.; supervision, X.-S.L.; project administration, X.-S.L; funding acquisition, X.-S.L.

Funding

This research received no external funding.

Acknowledgments

This work is supported by Key Program of National Natural Science Foundation of China (51736009), National Natural Science Foundation of China (51676190), International S&T Cooperation Program of China (2015DFA61790), Science and Technology Apparatus Development Program of the Chinese Academy of Sciences (YZ201619), Frontier Sciences Key Research Program of the Chinese Academy of Sciences (QYZDJ-SSW-JSC033), and National Key Research and Development Plan of China (2016YFC0304002, 2017YFC0307306), which are gratefully acknowledged.

Conflicts of Interest

The authors declare no conflict of interest.

References

  1. Seol, J.; Lee, H. Natural gas hydrate as a potential energy resource: From occurrence to production. Korean J. Chem. Eng. 2013, 30, 771–786. [Google Scholar] [CrossRef]
  2. Milkov, A.V. Global estimates of hydrate-bound gas in marine sediments: How much is really out there? Earth Sci. Rev. 2004, 66, 183–197. [Google Scholar] [CrossRef]
  3. Maddox, T.M.; Ross, C.; Ho, P.M.; Magid, D.; Rumsfeld, J.S. Impaired heart rate recovery is associated with new-onset atrial fibrillation: A prospective cohort study. BMC Cardiovasc. Disord. 2009, 9, 11. [Google Scholar] [CrossRef] [PubMed]
  4. Chong, Z.R.; Yang, S.H.B.; Babu, P.; Linga, P.; Li, X.-S. Review of natural gas hydrates as an energy resource: Prospects and challenges. Appl. Energy 2016, 162, 1633–1652. [Google Scholar] [CrossRef]
  5. Sloan, E.D., Jr.; Koh, C.A. A. Clathrate Hydrates of Natural Gases; CRC Press: Boca Raton, FL, USA, 2008. [Google Scholar]
  6. Moridis, G.J.; Collett, T.S.; Boswell, R.; Kurihara, M.; Reagan, M.T.; Koh, C.; Sloan, E.D. Toward Production from Gas Hydrates: Current Status, Assessment of Resources, and Simulation-Based Evaluation of Technology and Potential. SPE Reserv. Eval. Eng. 2009, 12, 745–771. [Google Scholar] [CrossRef]
  7. Boswell, R. Is Gas Hydrate Energy Within Reach? Science 2009, 325, 957–958. [Google Scholar] [CrossRef]
  8. Mahajan, D.; Taylor, C.E.; Mansoori, G.A. An introduction to natural gas hydrate/clathrate: The major organic carbon reserve of the Earth. J. Pet. Sci. Eng. 2007, 56, 1–8. [Google Scholar] [CrossRef]
  9. Sloan, E.D. Fundamental principles and applications of natural gas hydrates. Nature 2003, 426, 353–359. [Google Scholar] [CrossRef]
  10. Haligva, C.; Linga, P.; Ripmeester, J.A.; Englezos, P. Recovery of Methane from a Variable-Volume Bed of Silica Sand/Hydrate by Depressurization. Energy Fuels 2010, 24, 2947–2955. [Google Scholar] [CrossRef] [Green Version]
  11. Konno, Y.; Masuda, Y.; Hariguchi, Y.; Kurihara, M.; Ouchi, H. Key Factors for Depressurization-Induced Gas Production from Oceanic Methane Hydrates. Energy Fuels 2010, 24, 1736–1744. [Google Scholar] [CrossRef]
  12. Yang, M.; Fu, Z.; Jiang, L.; Song, Y. Gas recovery from depressurized methane hydrate deposits with different water saturations. Appl. Energy 2017, 187, 180–188. [Google Scholar] [CrossRef]
  13. Chong, Z.R.; Yin, Z.; Linga, P. Production Behavior from Hydrate Bearing Marine Sediments using Depressurization Approach. Energy Procedia 2017, 105, 4963–4969. [Google Scholar] [CrossRef]
  14. Wang, Y.; Li, X.-S.; Li, G.; Huang, N.-S.; Feng, J.-C. Experimental study on the hydrate dissociation in porous media by five-spot thermal huff and puff method. Fuel 2014, 117, 688–696. [Google Scholar] [CrossRef]
  15. Fitzgerald, G.C.; Castaldi, M.J.; Zhou, Y. Large scale reactor details and results for the formation and decomposition of methane hydrates via thermal stimulation dissociation. J. Pet. Sci. Eng. 2012, 94, 19–27. [Google Scholar] [CrossRef]
  16. Feng, J.-C.; Wang, Y.; Li, X.-S. Hydrate dissociation induced by depressurization in conjunction with warm brine stimulation in cubic hydrate simulator with silica sand. Appl. Energy 2016, 174, 181–191. [Google Scholar] [CrossRef]
  17. Schicks, J.M.; Spangenberg, E.; Giese, R.; Steinhauer, B.; Klump, J.; Luzi, M. New Approaches for the Production of Hydrocarbons from Hydrate Bearing Sediments. Energies 2011, 4, 151–172. [Google Scholar] [CrossRef] [Green Version]
  18. Feng, J.-C.; Wang, Y.; Li, X.-S.; Li, G.; Chen, Z.-Y. Production behaviors and heat transfer characteristics of methane hydrate dissociation by depressurization in conjunction with warm water stimulation with dual horizontal wells. Energy 2015, 79, 315–324. [Google Scholar] [CrossRef]
  19. Zhang, L.; Yang, L.; Wang, J.; Zhao, J.; Dong, H.; Yang, M.; Liu, Y.; Song, Y. Enhanced CH4 recovery and CO2 storage via thermal stimulation in the CH4/CO2 replacement of methane hydrate. Chem. Eng. J. 2017, 308, 40–49. [Google Scholar] [CrossRef]
  20. Wang, Y.; Feng, J.-C.; Li, X.-S.; Zhang, Y. Experimental and modeling analyses of scaling criteria for methane hydrate dissociation in sediment by depressurization. Appl. Energy 2016, 181, 299–309. [Google Scholar] [CrossRef]
  21. Wang, Y.; Feng, J.-C.; Li, X.-S.; Zhang, Y.; Li, G. Analytic modeling and large-scale experimental study of mass and heat transfer during hydrate dissociation in sediment with different dissociation methods. Energy 2015, 90, 1931–1948. [Google Scholar] [CrossRef]
  22. Makogon, Y.F. Natural gas hydrates—A promising source of energy. J. Nat. Gas Sci. Eng. 2010, 2, 49–59. [Google Scholar] [CrossRef]
  23. Schoderbek, D.; Farrell, H.; Hester, K.; Raterman, K. ConocoPhillips Gas Hydrate Production Test; Final Technical Report; United States Department of Energy: Watson, DC, USA, 2013.
  24. Hunter, R.B.; Collett, T.S.; Boswell, R.; Anderson, B.J.; Digert, S.A.; Pospisil, G.; Baker, R.; Weeks, M. Mount Elbert Gas Hydrate Stratigraphic Test Well, Alaska North Slope: Overview of scientific and technical program. Mar. Pet. Geol. 2011, 28, 295–310. [Google Scholar] [CrossRef]
  25. Tomaru, H.; Fehn, U.; Lu, Z.; Matsumoto, R. Halogen systematics in the Mallik 5L-38 gas hydrate production research well, Northwest Territories, Canada: Implications for the origin of gas hydrates under terrestrial permafrost conditions. Appl. Geochem. 2007, 22, 656–675. [Google Scholar] [CrossRef]
  26. Henninges, J.; Huenges, E.; Burkhardt, H. In situ thermal conductivity of gas-hydrate-bearing sediments of the Mallik 5L-38 well. J. Geophys. Res. Space Phys. 2005, 110. [Google Scholar] [CrossRef] [Green Version]
  27. Konno, Y.; Fujii, T.; Sato, A.; Akamine, K.; Naiki, M.; Masuda, Y.; Yamamoto, K.; Nagao, J. Key Findings of the World’s First Offshore Methane Hydrate Production Test off the Coast of Japan: Toward Future Commercial Production. Energy Fuels 2017, 31, 2607–2616. [Google Scholar] [CrossRef]
  28. Wu, X.S.; Huang, W.B.; Liu, W.C.; Xue, F.; Wang, M.H.; Lv, P. World-wide progress of resource potential assessment, exploration and production test of natural gas hydrate. Mar. Geol. Front. 2017, 33, 63–78. [Google Scholar]
  29. Liu, C.L.; Li, Y.L.; Sun, J.Y.; Wu, N.Y. Gas hydrate production test: From experimental simulation to field practice. Mar. Geol. Quat. Geol. 2017, 37, 12–26. [Google Scholar] [CrossRef]
  30. Zhao, J.; Song, Y.; Lim, X.-L.; Lam, W.-H. Opportunities and challenges of gas hydrate policies with consideration of environmental impacts. Renew. Sustain. Energy Rev. 2017, 70, 875–885. [Google Scholar] [CrossRef]
  31. Li, X.-S.; Xu, C.-G.; Zhang, Y.; Ruan, X.-K.; Li, G.; Wang, Y. Investigation into gas production from natural gas hydrate: A review. Appl. Energy 2016, 172, 286–322. [Google Scholar] [CrossRef] [Green Version]
  32. Yang, M.; Chong, Z.R.; Zheng, J.; Song, Y.; Linga, P. Advances in nuclear magnetic resonance (NMR) techniques for the investigation of clathrate hydrates. Renew. Sustain. Energy Rev. 2017, 74, 1346–1360. [Google Scholar] [CrossRef]
  33. Linga, P.; Clarke, M.A. A Review of Reactor Designs and Materials Employed for Increasing the Rate of Gas Hydrate Formation. Energ Fuel 2017, 31, 1–13. [Google Scholar] [CrossRef]
  34. Shinjou, K.; Konno, Y.; Jin, Y.; Nagao, J. Experimental evaluation of the gas recovery factor of methane hydrate in sandy sediment. RSC Adv. 2014, 4, 51666–51675. [Google Scholar]
  35. Linga, P.; Haligva, C.; Nam, S.C.; Ripmeester, J.A.; Englezos, P. Recovery of Methane from Hydrate Formed in a Variable Volume Bed of Silica Sand Particles. Energy Fuels 2009, 23, 5508–5516. [Google Scholar] [CrossRef]
  36. Heeschen, K.U.; Abendroth, S.; Priegnitz, M.; Spangenberg, E.; Thaler, J.; Schicks, J.M. Gas Production from Methane Hydrate: A Laboratory Simulation of the Multistage Depressurization Test in Mallik, Northwest Territories, Canada. Energy Fuels 2016, 30, 6210–6219. [Google Scholar] [CrossRef]
  37. Spangenberg, E.; Priegnitz, M.; Heeschen, K.; Schicks, J.M. Are Laboratory-Formed Hydrate-Bearing Systems Analogous to Those in Nature? J. Chem. Eng. Data 2015, 60, 258–268. [Google Scholar] [CrossRef]
  38. Mahabadi, N.; Jang, J. The impact of fluid flow on force chains in granular media. Appl. Phys. Lett. 2017, 110, 041907. [Google Scholar] [CrossRef]
  39. Kwon, T.-H.; Oh, T.-M.; Choo, Y.W.; Lee, C.; Lee, K.-R.; Cho, G.-C. Geomechanical and Thermal Responses of Hydrate-Bearing Sediments Subjected to Thermal Stimulation: Physical Modeling Using a Geotechnical Centrifuge. Energy Fuels 2013, 27, 4507–4522. [Google Scholar] [CrossRef]
  40. Zhan, L.; Wang, Y.; Li, X.-S. Experimental study on characteristics of methane hydrate formation and dissociation in porous medium with different particle sizes using depressurization. Fuel 2018, 230, 37–44. [Google Scholar] [CrossRef]
  41. Wang, Y.; Feng, J.-C.; Li, X.-S.; Zhang, Y.; Li, G. Evaluation of Gas Production from Marine Hydrate Deposits at the GMGS2-Site 8, Pearl River Mouth Basin, South China Sea. Energies 2016, 9, 222. [Google Scholar] [CrossRef]
  42. Li, X.-S.; Zhang, Y.; Li, G.; Chen, Z.-Y.; Yan, K.-F.; Li, Q.-P. Gas hydrate equilibrium dissociation conditions in porous media using two thermodynamic approaches. J. Chem. Thermodyn. 2008, 40, 1464–1474. [Google Scholar] [CrossRef]
  43. Han, H.; Wang, Y.; Li, X.-S.; Yu, J.-X.; Feng, J.-C.; Zhang, Y. Experimental study on sediment deformation during methane hydrate decomposition in sandy and silty clay sediments with a novel experimental apparatus. Fuel 2016, 182, 446–453. [Google Scholar] [CrossRef]
Figure 1. Experimental apparatus.
Energies 12 04227 g001
Figure 2. Temperature measuring points and wellhead distribution.
Energies 12 04227 g002
Figure 3. Experimental sediment.
Energies 12 04227 g003
Figure 4. Changes in the volumes of gas production and water injection/production during hydrate dissociation in sediments with different practical sizes.
Energies 12 04227 g004
Figure 5. Sand produced in the desander.
Energies 12 04227 g005
Figure 6. Changes in the temperatures at 9C, 8B, and 1A during hydrate dissociation in sediments with different practical sizes.
Energies 12 04227 g006
Figure 7. Changes of the remaining hydrate in the sediment and the hydrate decomposition ratio for runs 1–3.
Energies 12 04227 g007
Figure 8. Changes of the energy efficiencies for runs 1–3.
Energies 12 04227 g008
Figure 9. Sediment morphology before and after hydrate dissociation for run 1.
Energies 12 04227 g009
Figure 10. Sediment morphology before and after hydrate dissociation for run 2.
Energies 12 04227 g010
Figure 11. Sediment morphology before and after hydrate dissociation for run 3.
Energies 12 04227 g011
Table 1. Conditions of the experiments.
ExperimentsRun 1Run 2Run 3
Sedimentsilica sandsilica sandsilica sand
Particle size (μm)240–350125–18037–45
Water bath temperature (K)281.15281.15281.15
Initial pressure (MPa)13.6713.5713.61
Initial water volume for hydrate formation (mL)130130130
Production pressure6.0 (±0.05)6.0 (±0.05)6.0 (±0.05)
Sediment mass (g)100010001000
Hydrate saturation36.94%36.92%36.97%
Porosity52.18%52.12%52.23%
Temperature of water injection (K)353.15353.15353.15
Water injection rate (mL/min)202020

