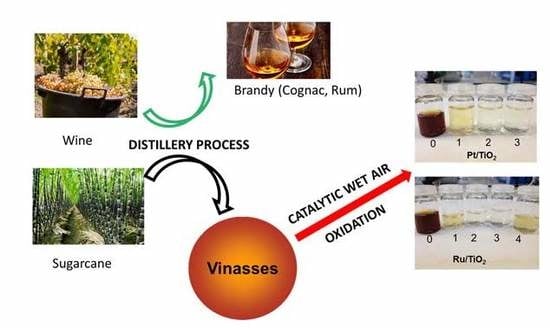
Catalytic Wet Air Oxidation Using Supported Pt and Ru Catalysts for Treatment of Distillery Wastewater (Cognac and Sugarcane Vinasses)


1
Univ Lyon, Univ Claude Bernard, CNRS, IRCELYON, Institut de recherches sur la catalyse et l’environnement de Lyon, UMR5256 2 Avenue Albert Einstein, 69626 Villeurbanne, France
2
University of Science and Technology of Hanoi, USTH, Vietnam-France University, 18 Hoang Quoc Viet, Cau Giay, Hanoi, Vietnam
*
Author to whom correspondence should be addressed.
Energies 2019, 12(20), 3974; https://doi.org/10.3390/en12203974
Submission received: 16 September 2019
/
Revised: 14 October 2019
/
Accepted: 16 October 2019
/
Published: 18 October 2019
(This article belongs to the Special Issue Advanced Technologies of Lignocellulosic Biomass Conversion)
Abstract
:The production of brandy from wine and bioethanol from sugarcane in distilleries generates vinasses, which are effluents that are rich in organic matter. Since they have a high pollution load characterized by high chemical and biological oxygen demands and a dark color, the depollution of these effluents is inevitable. Pt and Ru catalysts supported on titania and zirconia were explored in the catalytic wet air oxidation (CWAO) processing of cognac and sugarcane wastewaters, in batch mode and in a trickle-bed reactor, at a temperature condition of 190 °C and a pressure condition of 70 bar air. The addition of a catalyst promoted total organic carbon (TOC) abatement and the oxidation of ammonium ions formed from organic nitrogen in the effluents to dinitrogen or nitrates. The best results in terms of selectivity to N2 were obtained by using Pt catalysts; a selectivity of 92% to N2 and a TOC removal of 90% were observed in continuous oxidation of the sugarcane vinasse.
1. Introduction
Manufacturing of brandy (rum, cognac, armagnac, mezcal, etc.) from the distillation of wines [1] and the production of ethanol from sugarcane bagasse [2] are among the most important agricultural industries in many countries all over the world, and their development is steadily increasing. However, these distilleries produce a large amount of effluents, mainly vinasses, spent wash, or stillage. These aqueous wastes are considered to be some of the most polluting wastewaters produced by industries, which can cause serious environmental problems. An ethanol distillery may produce on average over 10 L of spent wash for every liter of alcohol produced [3]. These industrial effluents are characterized by high chemical oxygen demand (COD) and biological oxygen demand (BOD), acidic pH, and dark brown color, and have phyto- and genotoxicity effects on plants and animals [4].
The industry of cognac, a traditional luxury spirit, occupies an important place in the French economy, with over 97% of the produced cognac exported to over 150 countries, mainly the United States and China [5,6]. Roughly, cognac is obtained through a traditional double distillation in copper pot stills of white wines harvested in the controlled Cognac region. A first milky distillate is obtained that is known as “brouillis,” with an alcohol content of ~30% of its volume, and an effluent called wine vinasse is generated. The brouillis is then returned to the boiler for a second distillation, giving it “bonne chauffe” or “good heating” to produce a highly alcoholic liquid (68–72% alcohol titer). The spirit (heart) from this second distillation is then put in oak casks for at least three years of aging to produce cognac. In this work, the treatment of still wash remaining after the second distillation is studied.
Large amounts of sugarcane vinasses are also generated in Asian and South American distilleries using sugarcane molasses as a raw material. After the fermentation and subsequent distillation of cane molasses, ethanol is recovered, and what is left is vinasse. Vinasse is a viscous liquid waste containing non-fermented sugars, alcohols, organic acids, polyphenols, detergents from the cleaning operations, nitrogen substances, and inorganics, and it has a strong, unpleasant odor. The high nitrogen content of vinasses is due to the presence of residual yeast cells after the fermentation process. The presence of polyphenolic compounds, caramels from overheated sugars, furfural derivatives from acid hydrolysis, and melanoidins issued from the Maillard reaction between sugars and proteins is responsible for the dark color of vinasse and makes vinasse a complex and difficult wastewater for treatment. Vinasses typically have a high chemical oxygen demand value (COD 80–160 g L−1) and a high biological oxygen demand value (BOD 25–50 g L−1). It is also characterized by a low pH value (below 5) [7,8].
Although the vinasses of wine and sugarcane generated during the distillation step may have variable compositions (mainly depending on the raw biomass and fermentation process), vinasses typically contain different constituents and are always characterized by a high organic content, high acidity, and a brown color. Though they are still used with regulation as liquid fertilizers in agriculture, distillery wastewaters can no more be released into the aquatic system since they can have negative effects in the long run [9]. Some of these negative effects include the reduced penetration of sunlight in rivers and lakes, and thus wastewater can lead to a decrease in the photosynthetic activity of the flora in aquatic bodies [10]. Disposal onto agricultural lands may cause a reduction in soil alkalinity, which may lead to the inhibition of seed germination potential, as well as a reduction in manganese availability [11]. The concentration of inorganics such as nitrogen, potassium, phosphates, and sulfates in agricultural lands may also increase.
To avoid negative impacts of vinasses on the environment, a number of biological and physico-chemical treatment technologies can be employed before their discharge that are considered to be successful options [4,12,13,14,15], either singly or in combination. Conventional biological processes using activated sludge are not efficient enough to depollute these wastewaters, and some compounds with antioxidant properties are toxic to many microorganisms, such as those typically found in the aerobic biological treatment process [16,17]. From an energy point of view, the high organic content makes the vinasses well-suitable for the anaerobic fermentation (biomethanation) [18,19]. Methanation is, for instance, the common process for the treatment of the cognac vinasses [20]. However, the presence of compounds resistant to treatment (phenols, melanoidins, sugar decomposition products) can be toxic or inhibitory to anaerobic microorganisms. Physical processes (adsorption, nanofiltration, reverse osmosis) [21,22], chemical treatments such as coagulation–flocculation [23,24], and oxidation (such as Fenton oxidation [24,25], ozonation [26,27,28] photocatalysis [29,30], electrochemical oxidation [31], ultrasound [32,33], and certain combinations of these technologies) have been applied for the treatment of the distillery effluents. These processes may be employed after a primary aerobic or anaerobic treatment in order to further reduce the COD or eliminate color [34,35].
Among the various treatment processes suggested, catalytic wet air oxidation (CWAO) has proven to be a feasible technology for the removal of organic compounds from wastewater streams [36,37,38]. However, its application to distillery wastewaters has been scarcely studied. WAO [39] and homogeneous (ferrous sulfate) CWAO [40] pretreatments have resulted in enhanced biodegradability or biogas generation. In the treatment of a winery wastewater, catalytic wet peroxide oxidation (CWPO—using hydrogen peroxide as the oxidant and Fe-bearing graphite as the catalyst—has led to higher COD and total organic carbon (TOC) reductions at 80 °C than CWAO at 160 °C when using carbon materials as catalysts [41]. On the other hand, Belkacemi et al. demonstrated the efficiency of Pt/alumina, Mn-Ce oxides, and Cu-exchanged zeolites for the CWAO of distillery liquors [42]. The catalytic sub- and supercritical water treatment of a vinasse (COD 10–26 g L−1) conducted under hydrothermal conditions (250–400 °C, 250 bar) achieved a high COD reduction and a high level of the color removal [43].
In our previous work [44], the CWAO over Pt and Ru supported on oxides was demonstrated to be an effective method for removing the total organic carbon and total nitrogen contained in a dark brown synthetic melanoidin. The aim of this work is to evaluate the effectiveness of the CWAO process when applied to the more complex and real effluents of cognac vinasse and sugarcane vinasse. Given the operating conditions required (a high temperature 190 °C at a high pressure of 70 bar of air), the stability of the catalysts is of significant concern and will be investigated.
2. Materials and Methods
2.1. Materials
The cognac vinasse is a vinasse “de bonne chauffe” (VBC) kindly provided by Revico, a French society that treats about 3 million hectoliters of cognac vinasses per year over a period of five months during the distillation season. The wastewater used in this study was sourced from the second distillation step, the vinasse “de bonne chauffe”. The average characteristics of such a vinasse are given in Table 1. The data change a little during the season and the fermentation.
The crude untreated sugarcane distillery wastewater comes from rum production, and was provided by eRcane from the French department La Réunion Island in the Indian Ocean [45]. It was collected in plastic containers from a single batch of wastewater issued from the second distillation column of sugar melasses. After the collection, the effluent was rapidly transported to the laboratory, and filtered with Whatman folded cellulose filter paper (30 μm particle retention) to remove the suspended solids. After that, it was transferred into polyethylene bottles and frozen at −20 °C to prevent an evolution. Table 1 shows the characteristics of this distillery wastewater, which contained high BOD and high COD (with average values of 35 and 70 g L−1, respectively) and showed a dark color. Initial feedstocks (received wastewaters) were diluted with deionized water.
2.2. Catalysts
For the batch experiments, commercial mesoporous TiO2 DT51 (anatase, 92 m2 g−1) from Cristal and ZrO2 XZO 632/18 (mainly monoclinic, 90 m2 g−1) from Mel Chemicals were used as powder supports for the catalysts. For the trickle-bed reactor experiments, prior to use, TiO2-G extrudates (3 mm diameter) from St Gobain were ground and sieved to a 0.8–1.2 mm fraction. The characteristics of the commercial supports are shown in Table 2. The supported Pt and Ru catalysts were prepared according to the protocol described in [44]. They were prepared by the incipient-wetness impregnation of the supports using an aqueous solution of H2PtCl6 or Ru(NO)(NO3)3 to get a 3 wt% Pt or Ru content. The solid material was dried overnight (around 15 h) at 110 °C in an oven and then reduced in flowing H2 (1.8 L h−1) at 1 °C min−1 to a temperature of 300 °C for a duration of 2 h. After cooling under H2 and purging the reduction cell with argon, the catalysts were passivated in a flow of 1% O2/N2, and the solid was stored in a flask under argon.
The metal loading on the catalysts was measured using an inductively coupled plasma optical emission spectrometry (ICP-OES, Activa Horiba Jobin Yvon). Before the analysis, the samples were mineralized by soaking with a mixture of sulfuric and nitric acids, then heating to 150 °C for evaporation. They were further soaked with a 20% HCl solution. The ICP-OES spectrometer was also used to measure a leaching of metals from the catalysts by analyzing the samples withdrawn from the reaction medium. The values are reported with an absolute precision of 0.3%.
X-ray diffraction (XRD) patterns were recorded on a Bruker D8 Advance A25 diffractometer using the Cu Kα radiation (1.541 Å).
Transmission electron microscopy (TEM) of the catalysts was performed using a JEOL 2010 electron microscope operated at an accelerating voltage of 200 kV. Samples were prepared by the extractive replica procedure. A drop of a suspension of the catalyst in ethanol was deposited on freshly cleaved mica. After drying, the dispersed powder was covered by a carbon film. The support was dissolved by plunging the mica into a mixture of water, acetone, and hydrofluoric acid. The metal particles remained stuck to the film, which was deposited on a copper grid.
2.3. Apparatus and Procedure
2.3.1. Reactors
a-Batchwise. The CWAO experiments were carried out using a 300-mL high-pressure batch C22 Hastelloy autoclave equipped with a magnetically driven stirrer, a liquid sampling system, and an electric heating mantle with a temperature controller. The effluent was diluted with deionized water to obtain an initial total organic carbon (TOC) with a value of approximately 1.5–3.3 g L−1. Typically, 150 mL of the diluted effluent and 500 mg of catalyst were introduced into the reactor. After sealing and heating up to 190 °C under gentle stirring (400 rpm), the pressure was adjusted with air up to 70 bar and stirring was set at 1200 rpm. This was taken as time zero of the reaction. Samples were collected periodically and analyzed.
After the pressurization of the reactor, the oxygen amount should be at least equal to the COD of the effluent to allow a total mineralization of carbon and nitrogen. Taking into account the partial pressure of water as a function of the temperature and the gaseous volume of the reactor, the oxygen amount was introduced at 190 °C under 70 bar, with total pressure around 1.4 g. With a COD/TOC of around 3 to3.2, the maximum COD of the effluent that can be treated is 1.4 g (i.e., COD and TOC concentrations of 9.5 and 3.2 g L−1, respectively).
b-Trickle-bed reactor. Experiments were also performed in a high-pressure fixed-bed reactor in the trickle-bed mode with co-current downflow of liquid and air. The system consisted of a tube made of Hastelloy C (1 cm inner diameter and 15 cm length) and two sintered stainless-steel filters at the inlet and outlet of the reactor [46]. The catalyst prepared over pellets sieved between 0.8 and 1.2 mm was immobilized between two beds of inert SiC in the isothermal zone of the reactor. The reactor was fed with the effluent via a high-performance liquid chromatography (HPLC) Shimadzu pump and air flow at a pressure of 70 bar, and was heated at a temperature of 190 °C. The pressure and flow rate of air were controlled with a back-pressure controller. The system was equipped with a heat exchanger and a high-pressure gas–liquid separator, and the liquid was collected in a flask using a liquid level control device. Liquid samples were taken regularly for the analysis.
2.3.2. Analyses
The liquid samples withdrawn from the reactor were filtered using 0.45-μm Millipore Durapore hydrophilic filters (HVLP).
Total organic carbon (TOC) and total nitrogen (TN) content were analyzed using a TOC-VCSH analyzer coupled with a TNM-1 unit from Shimadzu and an autosampler. TN corresponds to the total nitrogen content from organic compounds, ammonium, nitrites, and nitrates. The TOC values are reported with an absolute precision of 2%, and TN values are reported with a precision of 5%.
The amounts of ammonium, nitrite, and nitrate ions in liquid samples were measured by ion chromatography (Metrohm Compact CI 881 Pro, 863 Compact Autosampler). A cationic column (Metrosep C4, 150 × 4 mm) and an anionic column (Metrosep A Supp 5, 150 × 4 mmm) were used. The mobile phase for the cations was HNO3 (1.7 mmol L−1)/dipicolinic acid (0.7 mmol L−1) at a flow rate of 0.9 mL min−1; the mobile phase for the anions was Na2CO3 (3.2 mmol L−1)/NaHCO3 (1 mmol L−1) at a flow rate of 0.7 mL min−1. Ammonium acetate (>98%), sodium nitrate (>99%), and sodium nitrite (>97%) from Sigma Aldrich were used for the calibration. The values are reported with an absolute precision of 5%.
Samples were also analyzed for (di)carboxylic acids using Shimadzu high-performance liquid chromatography (HPLC) with refractive index (RI) and UV detections in series. The column was a CarboSep Coregel 107H column, and the mobile phase was 0.005 N H2SO4 at a flow rate of 0.5 mL min−1.
The pH value of the sample was measured at room temperature using a pH M240 Radiometer pHmeter.
3. Results and Discussion
3.1. Characterization of Catalysts
The supported Pt and Ru powder catalysts were the same as those previously used for melanoidin degradation [44]. The particles in Ru catalysts on TiO2 or ZrO2 were homogeneously distributed on the support and displayed mean particle sizes of 1.7 and 2.0 nm, respectively. The average particle sizes of Pt/TiO2 and Pt/ZrO2 were ~5 nm and ~6.2 nm, respectively.
The Pt and Ru catalysts in grains used for the continuous experiments were crushed to a powder and analyzed by ICP-OES (Pt) and XRD (Figure 1). The analysis by ICP-OES showed an actual loading of 3.0 wt% equal to the nominal loading. The diffraction patterns of Pt/TiO2-G displayed only the peaks of the anatase phase of titania (PDF-Powder Diffraction File-01070-73-48), and no peak assignable to Ru (PDF 00-006-0663) could be detected, suggesting a very good dispersion of Ru nanoparticles. The Pt catalysts showed a small large peak of Pt(111) (PDF 00-004-0802) with a crystallite size of 4 nm.
3.2. Oxidation of vVinasse “de Bonne Chauffe” (VBC)
The defrosted VBC was filtrated over a Whatman-folded cellulose filter paper (30 μm particle retention) to eliminate solids formed during the storage. The filtered vinasse containing a TOC concentration of 7.2 g L−1 and a TN concentration of 7.6 mmol L−1 was diluted. The experiments were conducted using the diluted vinasses containing [TOC]0 ≈ 1500 mg L−1, [TN]0 ≈ 1.7 mM.
The treatment of 150 mL of VBC was performed at a temperature of 190 °C and at a total pressure of 70 bar in a closed batch reactor, without air flow. Air pressure was readjusted after sampling.
3.2.1. Blank Experiment without Catalyst
Blank oxidation experiments of diluted VBC were first performed in the absence of a catalyst at a temperature of 190 °C and at a pressure of 70 bar. Figure 2 shows the evolution of TOC and N-species concentrations (TN as measured by a TOC-TN meter and nitrogen species by ionic chromatography) during this reaction. The differences between the amount of TOC and TN initially introduced in the reactor and the concentrations of carbon and nitrogen measured in the aqueous phase were converted to CO2 and N2, respectively.
At time zero, after introduction of air at the reaction temperature, TOC concentration was, as expected, around 1500 mg L−1 (Figure 2a). Some organic compounds in VBC were then mineralized to attain 60% TOC conversion after 7 h at 190 °C.
Figure 2b details the concentrations of the different nitrogen species during oxidation at 190 °C. The TN concentration representing all nitrogenous compounds under an organic or inorganic form remained roughly constant during the reaction. The concentrations measured by ionic chromatography were rather small, and were given with noticeable errors. In the initial effluent, inorganic species such as ammonium (<0.3 mM) and nitrates and nitrites (<0.1 mM) were in very low concentrations, in agreement with the literature describing that nitrogen is essentially present in the organic compounds. In the absence of a catalyst, this nitrogen was quickly oxidized to ammonium ions, whose concentrations remained nearly constant during the reaction. Traces of nitrites and some amount of nitrates were also formed.
3.2.2. Oxidation Over the Supported Ru Catalysts
Figure 3 shows the results of TOC in the presence of the Ru/TiO2 catalyst at a temperature of 190 °C and a pressure of 70 bar. The results for Ru/ZrO2 were very similar and are shown in Figure S1. No effect of the support is noted.
Compared to the blank experiment (Figure 2), TOC conversion in the presence of Ru/TiO2 or Ru/ZrO2 was rapid from the beginning of the reaction and was as high as 50–60% after 20 min at 190 °C, compared to 60% after 7 h in the absence of catalyst. Reaction then slowed and TOC conversions rose to 97% and 99% after 24 h, respectively.
Conversely, the TN value remained constant within the experimental errors (Figure 4), and no dinitrogen gas was produced. Furthermore, the analysis of the nitrogen species by ionic chromatography (Figure 4) showed similar concentration profiles for Ru/TiO2 and Ru/ZrO2.
Over both catalysts, organic N was rapidly transformed to ammonium that attained a maximum concentration after 30 min. The ammonium was then totally oxidized to nitrates while forming traces of nitrites intermittently. The sums of concentrations of all N-species analyzed by ionic chromatography were close to the TN values measured by the TOC-TN apparatus. Only nitrate ions were present in solution after 3 h at 190 °C. This means there was a total selectivity to nitrates.
In our previous work [44], the CWAO of aqueous solutions of melanoidin (TN0 = 20 mmol L−1) under similar reaction conditions yielded a selectivity to N2 over 80% over the same Ru/TiO2 catalyst. The differences in the selectivity observed can be explained in part by the high oxygen coverage at the catalyst surface that was the crucial factor for the selectivity, as demonstrated for ammonia oxidation [47]. A high amount of catalyst (500 mg 3% Ru/TiO2) and a low concentration of ammonium (<1.7 mmol L−1) are unfavorable conditions for a good selectivity to N2.
The aqueous solutions were also analyzed by HPLC for the determination of intermediate compounds formed during the treatment at 190 °C over Ru/TiO2 and Ru/ZrO2 (Figure S2). After the 2-h reaction, the aqueous solution contained only acetic acid (~900 mg L−1) and traces of acrylic acid (<1 mg L−1) (Figure S2a,c). Both acids were converted during the reaction time over Ru/TiO2 and Ru/ZrO2. Figure S2b compares the evolution of TOC calculated from HPLC analysis and TOC measured for Ru/TiO2 as an example. After the 24-h reaction, only 80 mg L−1 acetic acid was analyzed and was responsible for the 3% TOC remaining in the solution.
The stability of the catalysts was checked in recycling experiments. After each run, the catalyst was recovered by filtration over a 0.45-μm filter, washed with deionized water, and dried in an oven at 100n °C overnight (~15 h). Since some solid materials were lost after each run, and to be able to compare the different runs under the same conditions (500 mg catalyst), the initial experiments were performed a few times and the recovered catalysts were mixed before the next recycling. The evolution of TOC and TN concentrations showed a very good reproducibility, as illustrated in Figure S3 for three runs with the fresh catalyst and the three recycling runs over recovered Ru/TiO2.
Finally, the results of TOC and TN concentrations during recycling experiments are shown in Figure 3 (Ru/TiO2) and Figure S1 (Ru/ZrO2). Since both catalysts behaved similarly, only Figure 3 will be discussed. In the first recycling (run 2), TOC conversion was still very rapid, at 68% after 7 h, before the rate of reaction slowed down to attain 76% TOC conversion after 24 h. Conversions over the fresh catalyst were 90% and 97% after 7 h and 24 h, respectively, showing a significant decrease in the activity of the catalyst.
In parallel, TN did not change, as shown in Figure 5a, which also shows the evolution of the N-species during the first recycling, while Figure 5b illustrates the concentrations of carboxylic acids analyzed.
During the first oxidation, organic nitrogen was transformed to ammonium in the course of the first hour; then, the ammonium was totally converted to the nitrates within 6 h in the presence of the fresh catalyst (Figure 4a). Moreover, after 2 h of the reaction, some acids such as acetic (693 mg L−1), acrylic (10 mg L−1), succinic (178 mg L−1), and formic (107 mg L−1) were identified by HPLC, and some other non-identified oxygenated compounds were present. These intermediates were oxidized to acetic acid within the first hours of reaction with a maximum concentration of 1025 mg L−1; finally after 24 h, only acetic acid was still present (750 mg L−1) in very good agreement with the TOC measured (not shown).
The first recycling results indicated a decrease in the activity of the catalyst. The reasons may have been solubilization of the metallic phase, agglomeration of Ru particles, surface oxidation of Ru nanoparticles under the reaction conditions, or adsorption of the organic compounds on the catalyst surface [48]. Leaching of catalysts was excluded, since the analysis of Ru in the samples withdrawn from the autoclave by ICP-OES was below the detection limit (<0.1 mg L−1). XRD of the used catalyst did not show any modification in the pattern; in particular, no diffraction peak was observed that could be attributed to Ru.
Both catalysts behaved in the second recycling (run 3) exactly as in the first recycling (run 2) experiments, as shown in Figure 3 and Figure S2. Moreover, HPLC analysis showed exactly the same products and evolution of carboxylic acids concentration as the reaction progressed (not shown). These results clearly indicate that catalysts recovered from the first and second run and run had the same activity, which suggests that deactivation upon the first recycling was mainly due to over-oxidation, as shown in the recycling of the same catalysts in the oxidation of p-hydroxybenzoic acid [46]. To verify this assumption, the Ru/TiO2 and Ru/ZrO2 catalysts recovered after the second recyclings were reactivated by reduction under H2 at a temperature of 300 °C for a duration of 2 h. The catalysts recovered a part of their activity: TOC conversion was 76% after 7 h and 86% after 24 h over the Ru/TiO2 catalyst (compared to 90% and 97% over the fresh one, respectively). Over Ru/ZrO2, TOC conversion was 65% after 7 h and 88% after 24 h (Figure 3 and Figure S1).
To summarize, both supported Ru catalysts were efficient in oxidation of VBC, with no Ru leaching detected. The surface oxidation of Ru that occurred during the first run led to some decrease in activity, but catalysts were stable after the first recycling. The activity of the catalysts could be recovered in part by the reduction under H2 at a temperature of 300 °C for a duration of 2 h. The ammonium formed during the reaction was converted to nitrates, which were stable under these reaction conditions.
3.2.3. Oxidation Over Supported Pt Catalysts
The Pt catalysts were evaluated under the same reaction conditions (190 °C, 70 bar total air pressure, 500 mg catalyst). The catalysts after the reaction were recovered by filtration, washed with water, then dried before recycling. Results for Pt/TiO2 and Pt/ZrO2 are shown in Figure 6 for the first and second runs.
In the presence of both fresh catalysts Pt/TiO2 and Pt/ZrO2, TOC conversion attained rapidly after 30 min (~60%), then slightly progressed to 70% and 73% conversion after 7 h, respectively. However, further conversion was negligible (only 3% supplementary conversion). Moreover, in contrast with the observations of the Ru catalysts, the profiles of TOC concentrations in the presence of used catalysts were very similar to those of the fresh catalysts.
The TN concentrations and the transformations of the N-species are shown in Figure 7 for the first run and the recycling test over Pt/TiO2 catalyst. The results were very similar to Pt/ZrO2 (Figure S4). The important decrease in TN concentration showed a large formation of dinitrogen in the gas phase. TN conversions after 24 h were 47–48% in the presence of the fresh catalysts, and 40–45% for the recycled catalysts. The small differences observed between the fresh and used catalysts are within the experimental errors of the analytical method.
The Pt catalysts were very active in converting the ammonium. Indeed, the concentration of the formed ammonium was very low, since it rapidly transformed into dinitrogen and nitrate. The selectivity to N2 was around 50% in the presence of Pt, and the remainder was nitrates. The high selectivity of Pt catalysts to dinitrogen is consistent with previous data on the oxidation of ammonium acetate solutions [49].
After 2 h of reaction, some acids such as acetic, succinic, and acrylic acids were detected by HPLC, as well as traces of formic acid (Figure S5). All acids, except acetic acid, were totally degraded after 7 h over the fresh catalysts, or at longer times over the used catalysts. It is known from the literature that the mineralization of acetic acid is difficult over Pt catalysts compared to Ru catalysts [50,51,52].
Leaching of Pt was determined at different times of the reaction for the fresh and used catalysts. Traces of Pt were detected after 7 h (~0.2 mg L−1) over Pt/TiO2; however, Pt concentration in the final solution was always below the detection limit (<0.1 mg L−1) at the end of the reactions.
3.2.4. Summary of the VBC Treatment
Ru and Pt catalysts were efficient for the organic carbon mineralization of diluted VBC effluent. The low TN amount was converted to around 50% dinitrogen over Pt catalysts, the rest being nitrates, while the selectivity to nitrates was total over Ru catalysts. No effect of the nature of the support (TiO2 or ZrO2) was observed.
Recycling experiments suggest a superficial oxidation of Ru nanoparticles that decreases their activity; Ru catalysts were reactivated by the reduction under H2 at a temperature of 300 °C for a duration of 2 h. Pt catalysts kept their performance upon recycling. Leaching of metal was not detected at the end of the reactions.
3.3. Treatment of the Sugarcane Effluent
After defrosting, the sugarcane contained ~50 g L−1 TOC and 90 mM TN. It was diluted 15-fold to give an effluent containing [TOC]0 of ~3330 mg L−1 and [TN]0 of ~5.7 mM. It also contained very small amounts of the ammonium (0.25 mM), nitrates (0.16 mM), and salts (9.3 mM chlorides and 3 mM sulfates), as determined by ionic chromatography. Nitrogen was already present in organic components. The reactions were performed at the temperature condition of 190 °C and at a pressure condition of 70 bar air.
3.3.1. Oxidation in the Batch Reactor
In the non-catalyzed reaction, the samples withdrawn from the reaction medium during the first hour contained black polymeric material. The samples were filtered before the analysis so that these solids could be retained on the filter paper. Figure 8 shows the TOC concentration during reactions in the absence or presence of a catalyst (Ru or Pt). In the non-catalyzed reaction, TOC conversion of the filtered solution was around 60% after 24 h. TN concentration was constant, while two-thirds of the initial organic nitrogen were rapidly converted to ammonium, whose concentration attained a constant value of 3.7 mM after a few hours of the reaction.
In the presence of the catalysts, no polymeric material was detected in the liquid samples withdrawn from the reactor. The presence of the catalysts greatly improved the TOC conversion, which was higher for Ru catalysts than for Pt catalysts. HPLC of the samples after 24 h indicated larger concentrations of acetic acid and very low concentrations of succinic acid in the presence of Pt catalysts (not shown).
The evolutions of the N-species are shown in Figure 9 for the Pt catalysts; the results for the Ru catalysts are shown in Figure S6. Some runs were repeated so that the reproducibility could be observed.
It must be remembered that the diluted sugarcane effluent contained 5.7 mM TN and only very low amounts of ammonium and nitrates.
In the presence of the catalysts, a rapid transformation of the organic nitrogen to ammonium occurred at the beginning of the reaction. The ammonium was then converted to dinitrogen gas and nitrates. Nitrite intermediates were only analyzed in very small amounts.
In the case of Pt catalysts, the maximum concentration of ammonium was 1.4 mM after only 10 min, and TN evolutions suggest that the ammonium formed was converted first to dinitrogen with very high selectivity; in fact, when the concentration of ammonium is too low and oxidizing conditions are too strong, the ammonia is oxidized to nitrates quasi-exclusively, as reported for the VBC effluent (Figure 9). As mentioned above, this was also demonstrated in aqueous ammonia solutions [47]. The final selectivities to N2 were 57% and 54% over Pt/TiO2 and Pt/ZrO2, respectively. In contrast, over the Ru catalysts, ammonium reached a maximum concentration of 3.2–3.4 mM after −4 h, and afterwards it mainly oxidized to nitrates. After the total conversion, the selectivities to N2 were 50% and 43%, respectively (Figure S6).
The oxidation of the N-containing organic compounds followed the same trend as in the vinasse VBC that was presented supra, as well as in the solutions of melanoidin [44].
The chemical stability of the catalysts was checked by analyzing Pt and Ru in the samples withdrawn during the reactions. Significant losses of Ru and Pt were noticed after 4 h of the reaction (8.3% and 5% Ru for Ru/TiO2 and Ru/ZrO2, respectively; 11.4% for Pt/ZrO2). As the reaction progressed towards the end, metal content in the final solution decreased to below the limit of detection.
The data for the 2.36% Pt/ZrO2 catalyst are gathered in Table 3 and analyzed as a function of the N-species in solution.
The results clearly show that leaching was observed as long as N-organic compounds were present (the difference between TN and inorganic N), which can be explained by some complexation of the metals with some N-containing compounds in the vinasse. These results are totally in line with the observations in the case of the melanoidin degradation by CWAO [44], or even with those of dimethylformamide oxidation [53] on the same catalysts (i.e., amine functionalities complex the metals) [54,55]. Pt and Ru species free from nitrogen ligands were re-immobilized onto the solid once organic nitrogen has been oxidized into inorganic nitrogen species. The pH value, which is dependent on the amounts of ammonium ions and carboxylic acids, was in the range of 3.7–4.7 for the different reactions, which may be favorable for the deposition of Ru or Pt hydroxides, as shown by Pourbaix diagrams [56].
The Ru/TiO2 and Pt/ZrO2 catalysts used were analyzed by XRD (Figure 10) and TEM (Figure 11) and compared to the fresh catalyst.
No modification of the crystallographic phase of supports was noticed in the used catalysts. However, the main diffraction peak of Ru (101) at 2θ = 40° and Pt (111) at 2θ = 39.8° were discernible. This suggests some agglomeration of metallic particles, as illustrated by the modification of the histograms of particle size distributions of the fresh and used catalysts (Figure 11). Larger Ru nanoparticles were observed, and the mean particle size was 3 nm, compared to 1.7 nm for the fresh catalyst. A double distribution of Pt nanoparticles (3 nm on the one hand, 4–9 nm on the other) was observed.
3.3.2. Oxidation of Sugarcane Vinasse in a Trickle-Bed Reactor
The continuous reaction allows the stability of the catalyst to be studied over long reaction periods of time. It can also confirm or invalidate leaching due to N-containing organic compounds observed in batch mode.
The vinasse was diluted to [TOC]0 of 2024 mg L−1 and [TN]0 of 3.3 mM, the catalysts were 3% Ru/TiO2-G and 3% Pt/TiO2-G with grains sieved between 0.8 and 1.2 mm. The initial conditions were as follows: mass of catalyst 2 g, liquid flow rate 30 mL h−1, air flow rate 5 NL h−1, temperature 190 °C, and pressure 70 bar. These conditions correspond to a contact time (tc) of 0.99 h gcata gTOC−1.
After heating the catalyst in pure water, the solution of vinasse was introduced into the reactor and sampling at the outlet of the reactor was periodically performed (Period (1)). The treated solution was collected and re-treated in a second oxidation (tc of 1.98 h gcata gTOC−1, Period (2)), then the solution recovered from Period 2 was treated in a third oxidation (2.97 h gcata gTOC−1, Period (3)). The reactor was then operated again under the initial conditions (Period (4)).
Figure 12 shows the evolution of the concentrations of TOC and the different N-species, as well as the leaching of Ru during these different periods in the presence of the Ru/TiO2-G catalyst.
After the replacement of water by the vinasse ([TOC]0 = 2024 mg L−1), a period of 48 h was necessary to reach a steady state. TOC conversion was 61% and decreased slightly to 55% in a period of 250 h (Figure 12a). During this first oxidation reaction, the TN value decreased from the initial concentration of 3.3 mM to a constant concentration of 2.7 mM, indicating an 18% conversion to dinitrogen (Figure 12b). The gap between the total amount of inorganic N-species measured by IC and TN analyzed by TOC-TN equipment shows that organic nitrogen was still present in the treated effluent. The detailed analysis of the inorganic N species formed (Figure 12c) shows an important conversion of the organic nitrogen to ammonium and nitrates. While the sum of NH4+ and NO3− remained constant and of equal concentrations in this first period, they evolved as a function of time on stream. The concentration in ammonium increased progressively to the detriment of nitrates. This indicates a decrease in the oxidizing ability of the Ru catalyst for the formed ammonium. Due to the presence of N-containing organic compounds, and as observed above in batch experiments, ruthenium was leached and present in all samples at 0.2 mg L−1. Taking into account that a mass of 2 g of 3% Ru/TiO2-G catalyst (60 mg Ru) and a volume of 9.2 L of vinasse passed over the catalyst during the 310-h period with 0.2 mg L−1 Ru leaching, the total amount of Ru leached was ~1.84 mg of Ru, which represents only 3% of the loaded Ru.
The second oxidation of the vinasse recovered from run 1 and reinjected under the same reaction conditions (contact time multiplied by two) increased TOC conversion to 78%, which remained stable for 70 h (Figure 12a). At 390 h, the reaction was stopped because of a leak in the liquid pump, and the catalyst was kept in contact with the effluent. After washing with water, the reaction was resumed. An increase to a constant TOC conversion of 85% was then noted, probably due to the washing of the catalyst. A very good agreement was noted between TN and inorganic N ions (Figure 12b) in the form of nitrates only (Figure 12c). During this second period, no Ru leaching was quantified (<0.1 mg L−1), which was expected since the effluent contained no more organic nitrogen (Figure 12d).
During the third oxidation, TOC conversion increased to 90%, and nitrogen in the aqueous phase was only analyzed as nitrates. No leaching occurred in the presence of only nitrates.
In the last period, after 750 h on stream, the reactor was put back under the initial conditions. TOC conversion was 50–41% instead of 61%, showing only a slight deactivation after one month. The TN value was close to the initial value, and conversion to dinitrogen was only 6%. The only N-species analyzed by ionic chromatography was ammonium (1.7 mM), and there were no more nitrates. Compared to the first period, this observation shows a lower oxidation ability of the catalyst. Ru leaching was again observed.
The oxidation of the sugarcane vinasse was performed similarly in the presence of the Pt/TiO2-G catalyst; Figure 13 shows the results.
After the stabilization period of 48 h, TOC conversion during the first run was 68%, before decreasing slightly to 62% after 239 h on stream. The TN concentration decreased significantly in this case from 3.3 to 0.73 mM, demonstrating a very high conversion of 78% to dinitrogen gas during this period. The concentrations in ammonium were negligible and those in nitrites (0.13 mM) and nitrates (0.4 mM) were low. The difference between TN measured by the TOC-TN instrument and the total inorganic nitrogen calculated from concentrations in nitrites and nitrates shows that some organic nitrogen remained in the treated effluent. Consequently, the high leaching of Pt was measured (0.7–0.9 mg L−1). This corresponds to the leaching of ~8% Pt from the catalyst.
The activity of Pt catalyst for TOC conversion was stable in the second oxidation of the treated solution (containing 560 mg L−1 TOC) with a conversion of 82%. This conversion did not increase significantly, and was 84% in the third run. It is likely that only acetic acid, which cannot be mineralized in the presence of Pt catalyst, was present after the first reaction. The selectivity to N2 increased to 89% and 92% upon the second and third runs, respectively. The organic nitrogen was still present in the second run, and was totally oxidized in the third run. This very low content of organic nitrogeneous compounds caused a low leaching (0.3 mg L−1) and unquantifiable leaching (<0.1 mg L−1) of Pt, respectively. The content of ammonium was always very low. However, compared to the Ru catalyst, higher amounts of the intermediate nitrites were formed that could be further converted to nitrates.
4. Conclusions
Very large volumes of vinasses are generated in the distilleries. These effluents contain high loads of organic resistant materials and therefore require the application of an effective, economical, and sustainable treatment.
The current research explored the treatment by CWAO of two vinasses, a vinasse “de bonne chauffe” of cognac ([TOC]0 = 1.5 g L−1 and [TN]0 = 1.7 mmol L−1) and a sugarcane vinasse ([TOC]0= 3.3 g L−1 and [TN]0= 5.7 mmol L−1). Supported Pt and Ru catalysts were demonstrated to be efficient in batch and continuous CWAO at a temperature of 190 °C and a pressure of 70 bar of air. Though Pt was less effective than Ru in the mineralization of acetic acid (biodegradable organic acid), Pt was more selective toward N2 under similar reaction conditions (50% to N2 vs. total selectivity to nitrates for cognac effluent; 54–57% to N2 vs. 43–50% for the sugarcane vinasse in the batch reactor). The selectivity to N2 was as high as 92% versus 35% at a contact time of 2.97 h gcat gTOC−1 in the continuous experiments using sugarcane vinasse.
Among the several effective treatment options available for vinasses, CWAO using Pt or Ru catalysts may be the relevant chemical oxidation technology. Significant reduction in the concentration of the organic fraction was achieved, and the conversion of organic nitrogen led mainly to gaseous N2. Compared to other potential effective oxidation treatments that use costly oxidants while operating under milder conditions, such as hydrogen peroxide oxidation or ozonation, CWAO has the advantage of using air. However, the identified disadvantages are the financial requirement for the initial set-up (reactors operating at high pressure and temperature, cost of catalysts), the expertise to manage such units, and the operational costs. There are significant costs involved in all treatment technologies, and although intensive research has been carried out in the field, there is no general consensus on the most suitable treatment methods. The selection of a process depends on the economics and on volumes of vinasses to be treated. An investment in a CWAO unit at a large scale may be suitable for the very large wineries.
Supplementary Materials
The following are available online at https://www.mdpi.com/1996-1073/12/20/3974/s1. Figure S1: Evolution of concentrations of TOC during oxidation of diluted VBC at 190 °C under 70 bar in the presence of 500 mg of 3% Ru/ZrO2; Figure S2: CWAO of diluted VBC at 190 °C under 70 bar: (a) concentration of (di)carboxylic acids and (b) comparison between TOC measured and TOC calculated over Ru/TiO2; (c) concentration of (di)carboxylic acids over Ru/ZrO2; Figure S3: Reproducibility in three oxidation reactions over Ru/TiO2: (a,c) TOC and (b,d) TN concentrations in the initial runs (a,b) and first recycling runs (c,d); Figure S4: Concentrations of the different N-species in the presence of Pt/ZrO2: (a) fresh catalyst, (b) used catalyst; Figure S5: Carboxylic (di)acids formed during treatment of diluted VBC over (a) fresh and (b) used Pt/TiO2; Figure S6: Transformation of organic nitrogen in the sugarcane effluent in the presence of (a) Ru/TiO2 and (b) Ru/ZrO2.
Author Contributions
Formal analysis, L.P.T.; Investigation, L.P.T.; Project administration, M.B.; Supervision, M.B.; Writing—original draft, M.B. and L.P.T.; Writing—review & editing, M.B.
Funding
This research was funded by the University of Science and Technology of Hanoi (Vietnam–France University) in the form of a PhD grant to LPT.
Acknowledgments
Authors are thankful for the samples provided by Reveco and eRCane. The support and assistance of Guillaume Aubert was appreciated in the analyses with TOC-TN, HPLC and ionic chromatography.
Conflicts of Interest
The authors declare no conflict of interest. The funders had no role in the design of the study; in the collection, analyzes, or interpretation of data; in the writing of the manuscript, or in the decision to publish the results.
Nomenclature
| BOD | biological oxygen demand |
| COD | chemcal oxygen demand |
| CWAO | catalytic wet air oxidation |
| HPLC | High Performance Liquid Chromatography |
| ICP-OES | inductively coupled plasma optical emission spectroscopy |
| TEM | transmission electron microscopy |
| TN | Total Nitrogen |
| TOC | total organic carbon |
| XRD | X-ray diffraction |
| VBC | vinasse “bonne chauffe” |
References
- Tsakiris, A.; Kallithraka, S.; Kourkoutas, Y. Grape brandy production, composition and sensory evaluation. J. Sci. Food Agric. 2013, 94, 404–414. [Google Scholar] [CrossRef] [PubMed]
- Tyagi, S.; Lee, K.J.; Mulla, S.I.; Garg, N.; Chae, J.C. Chapter 2–Production of bioethanol from sugarcane bagasse: Current approaches and perspectives. In Applied Microbiology and Bioengineering; Academic Press: Cambridge, MA, USA, 2019; pp. 21–42. [Google Scholar] [CrossRef]
- Ravikumar, R.; Saravanan, R.; Vasanthi, N.S.; Swetha, J.; Akshaya, N.; Rajthilak, M.; Kanna, K.P. Biodegradation and decolorization of biomethanated distillery spent wash. Indian J. Sci. Technol. 2007, 1, 1–6. [Google Scholar]
- Patel, S. Jamaluddin, Treatment of distillery waste water: A review. Int. J. Theor. Appl. Sci. 2018, 10, 117–139. [Google Scholar]
- Available online: http://www.cognac.fr/cognac/_en/2_cognac/index.aspx (accessed on 9 September 2019).
- Song, L.; Wei, Y.; Bergiel, B.J. Cognac consumption: A comparative study on American and Chinese consumers. Wine Econ. Policy 2018, 7, 24–34. [Google Scholar] [CrossRef]
- Chandra, R.; Bharagava, R.N.; Rai, V. Melanoidins as major colourant in sugarcane molasses based distillery effluent and its degradation. Biores. Technol. 2008, 99, 4648–4660. [Google Scholar] [CrossRef] [PubMed]
- Wedzicha, B.L.; Kaputo, M.T. Melanoidins from glucose and glycine: Composition, characteristics, and reactivity towards sulphite ion. Food Chem. 1992, 43, 359–367. [Google Scholar] [CrossRef]
- Christofoletti, C.A.; Escher, J.P.; Correia, J.E.; Marinho, J.F.U.; Fontanetti, C.S. Sugarcane vinasse: Environmental implications of its use. Waste Manag. 2013, 33, 2752–2761. [Google Scholar] [CrossRef]
- Kumar, V.; Wati, L.; FitzGibbon, F.J.; Nigam, P.; Banat, I.M.; Singh, D.; Marchant, R. Bioremediation and decolourisation of anaerobically digested distillery spent wash. Biotechnol. Lett. 1997, 19, 311–313. [Google Scholar] [CrossRef]
- Agarwal, C.S.; Pandey, G.S. Soil pollution by spent wash discharge: Depletion of manganese (II) and impairment of its oxidation. J. Environ. Biol. 1994, 15, 49–53. [Google Scholar]
- Hoareau, J.; Caro, Y.; Grondin, I.; Petit, T. Sugarcane vinasse processing: Towards a status shift from waste to valuable resource. A review. J. Water Process. Eng. 2018, 24, 11–25. [Google Scholar] [CrossRef]
- Chowdhary, P.; Raj, A.; Bharagava, R.N. Environmental pollution and health hazards from distillery wastewater and treatment approaches to combat the environmental threats: A review. Chemosphere 2018, 194, 229–246. [Google Scholar] [CrossRef] [PubMed]
- Gosh Ray, S.; Ghangrekar, M.M. Comprehensive review on treatment of high-strength distillery wastewater in advanced physico-chemical and biological degradation pathways. Int. J. Environm. Sci. Technol. 2019, 16, 527–546. [Google Scholar] [CrossRef]
- Ioannou, L.A.; Li Puma, G.; Fatta-Kassinos, D. Treatment of winery wastewater by physicochemical, biological and advanced processes: A review. J. Hazard. Mater. 2015, 286, 343–368. [Google Scholar] [CrossRef] [PubMed]
- Pant, D.; Adholeya, A. Biological approaches for treatment of distillery wastewater: A review. Biores. Technol. 2007, 98, 2321–2334. [Google Scholar] [CrossRef] [PubMed]
- Bolzonella, D.; Papa, M.; Da Ros, C.; Muthukumar, L.A.; Rosso, D. Winery wastewater treatment: A critical overview of advanced biological processes. Critical Rev. Biotech. 2019, 39, 489–507. [Google Scholar] [CrossRef]
- Melamane, X.L.; Strong, P.J.; Burgess, J.E. Treatment of wine distillery wastewater: A review on anaerobic membrane reactors. S. Afr. J. Enol. Vitic. 2007, 28, 25–36. [Google Scholar] [CrossRef]
- Moraes, B.S.; Zaiat, M.; Bonomi, A. Anaerobic digestion of vinasse from sugarcane ethanol production. Renew. Sustain. Energy Rev. 2015, 44, 888–903. [Google Scholar] [CrossRef]
- Moletta, R. Winery and distillery wstewater treatment by anaerobic digestion. Water Sci. Technol. 2005, 51, 137–144. [Google Scholar] [CrossRef]
- Magalhaes, N.C.; Silva, A.L.D.; Amaral, M.C.S.; Lange, L.C.; Neta, L.F. Treatment of vinasse employing ultrafiltration combined with the aerobic bioreactor with membrane and post-treatment with nanofiltration allowing its reuse. Procedia Eng. 2012, 44, 1923–1924. [Google Scholar] [CrossRef]
- Singh, N.; Petrinic, I.; Helix-Nielsen, C.; Basu, S.; Balakrishnan, M. Concentrating molasses distillery wastewater using biomimetic forward osmosis (FO) membranes. Water Res. 2018, 130, 271–280. [Google Scholar] [CrossRef] [Green Version]
- Prazeres, A.R.; Lelis, J.; Alves-Ferreira, J.; Carvalho, F. Treatment of vinasse from sugarcane ethanol industry: H2SO4, NaOH and Ca(OH)2 precipitations, FeCl3 coagulation-flocculation and atmospheric CO2 carbonation. J. Environ. Chem. Eng. 2019, 7, 103203. [Google Scholar] [CrossRef]
- Martins, R.C.; Pinto, F.L.; Castro-Silva, S.; Quinta-Ferreira, R.M. Flocculation, ozonation and Fenton’s process in the treatment of distillery effluents. J. Environ. Eng. 2013, 139, 110–116. [Google Scholar] [CrossRef]
- Hadavifar, M.; Zinatizadeh, A.A.; Younesi, H.; Galehdar, M. Fenton and photo-Fenton treatment of distillery effluent and optimization of treatment conditions with response surface methodology. Asia-Pacific J. Chem. Eng. 2009, 5, 454–464. [Google Scholar] [CrossRef]
- Sangave, P.C.; Gogate, P.R.; Pandit, A.B. Combination of ozonation with conventional aerobic oxidation for distillery wastewater treatment. Chemosphere 2007, 68, 32–41. [Google Scholar] [CrossRef] [PubMed]
- Benitez, F.J.; Real, F.J.; Acero, J.L.; Garcia, J.; Sanchez, M. Kinetics of the ozonation and aerobic biodegradation of wine vinasses in discontinuous and continuous processes. J. Hazard. Mater. 2003, 101, 203–218. [Google Scholar] [CrossRef]
- Lucas, M.S.; Peres, J.A.; Li Puma, G. Treatment of winery wastewater by ozone-based advanced oxidaion processes (O3, O3/UV and O3/UV/H2O2) in a pilot-scale bubble column reactor and process economics. Sep. Purif. Technol. 2010, 72, 235–241. [Google Scholar] [CrossRef]
- De Souza, R.P.; Ferrari-Lima, A.M.; Pezoti, O.; Slusarski-Santana, V.; Luiz-Gimenez, M.; Fernandes-Machado, N.R.C. Photodegradation of sugarcane vinasse: Evaluation of the effect of vinasse pre-treatment and the crystalline phase of TiO2. Acta Sci. Technol. 2016, 38, 217–226. [Google Scholar] [CrossRef]
- Santana, V.S.; Machado, N.R.C.F. Photocatalytic degradation of the vinasse under solar radiation. Catal. Today 2008, 133, 606–610. [Google Scholar] [CrossRef]
- Manisankar, P.; Viswanathan, S.; Rani, S. Electrochemical treatment of distillery effluent using catalytic anodes. Green Chem. 2003, 5, 270–274. [Google Scholar] [CrossRef]
- Sangave, P.C.; Pandit, A.B. Ultrasound pretreatment for enhanced biodegradability of the distillery wastewater. Ultrason. Sonochem. 2004, 11, 197–203. [Google Scholar] [CrossRef]
- Sangave, P.C.; Gogate, P.R.; Pandit, A.B. Ultrasound and ozone assisted biological degradation of thermally pretreated and anaerobically pretreated distillery wstewater. Chemosphere 2007, 68, 42–50. [Google Scholar] [CrossRef] [PubMed]
- Robles-Gonzales, V.; Galindez-Mayer, J.; Rinderknecht-Seijas, N.; Poggi-Varaldo, H.M. Treatment of mezscal vinasses: A review. J. Biotech. 2012, 157, 524–546. [Google Scholar] [CrossRef] [PubMed]
- Reis, C.E.R.; Bento, H.B.S.; Alves, T.M.; Carvalho, A.K.F.; De Castro, H.F. Vinasse treatment within the sugarcane-ethnaol industry using ozone combined with anaerobic and aerobic microbial processes. Environments 2019, 6, 5. [Google Scholar] [CrossRef]
- Luck, F. A review of industrial catalytic wet air oxidation processes. Catal. Today 1996, 27, 195–202. [Google Scholar] [CrossRef]
- Levec, J.; Pintar, A. Catalytic wet-air oxidation processes: A review. Catal. Today 2007, 124, 172–184. [Google Scholar] [CrossRef]
- Kim, K.H.; Ihm, S.K. Heterogeneous catalytic wet air oxidation of refractory organic pollutants in industrial wastewaters: A review. J. Hazard. Mater. 2011, 186, 16–34. [Google Scholar] [CrossRef]
- Malik, S.N.; Saratchandra, T.; Tembhekar, P.D.; Padolev, K.V.; Mudliar, S.L.; Mudliar, S.N. Wet air oxidation induced enhanced biodegradability of distillery effluent. J. Environ. Manag. 2014, 136, 132–138. [Google Scholar] [CrossRef]
- Bhoite, G.M.; Vaidhya, P.D. Improved biogas generation from biomethanated distillery wastewater by pretreatment with catalytic wet air oxidation. Ind. Eng. Chem. Res. 2018, 57, 2698–2704. [Google Scholar] [CrossRef]
- Domínguez, C.M.; Quintanilla, A.; Casas, J.A.; Rodriguez, J.J. Treatment of real winery wastewater by wet oxidation at mild temperature. Sep. Purif. Technol. 2014, 129, 121–128. [Google Scholar] [CrossRef]
- Belkacemi, K.; Hamoudi, S.; Larachi, F.; Sayari, A. Catalytic wet oxidation of high-strength alcohol-distillery liquors. Appl. Catal. A General 2000, 199, 199–209. [Google Scholar] [CrossRef]
- Kazemi, N.; Tavakoli, O.; Nahangi, M. High-strength distillery wastewater treatment using catalytic sub- and supercritical water. J. Supercrit. Fluids 2015, 97, 74–80. [Google Scholar] [CrossRef]
- Le, P.T.; Besson, M. Carbon and nitrogen removal from glucose-glycine melanoidins solution as a model of distillery wastewater by catalytic wet air oxidation. J. Hazard. Mat. 2016, 310, 108–116. [Google Scholar] [CrossRef]
- Available online: https://www.ercane.re/index.php?lang=en (accessed on 9 September 2019).
- Minh, D.P.; Gallezot, P.; Besson, M. Treatment of olive oil mill wastewater by catalytic wet air oxidation. 3. Stability of supported ruthenium catalysts during oxidation of model pollutant p-hydroxybenzoic acid in batch and continuous reactors. Appl. Catal. A Environ. 2007, 75, 71–77. [Google Scholar] [CrossRef]
- Lousteau, C.; Besson, M.; Descorme, C. Catalytic wet air oxidation of ammonia over supported noble metals. Catal. Today 2015, 241, 80–85. [Google Scholar] [CrossRef]
- Besson, M.; Gallezot, P. Deactivation of metal catalysts in liquid phase organic reactions. Catal. Today 2003, 81, 547–559. [Google Scholar] [CrossRef]
- Bernardi, M.; Le Du, M.; Dodouche, I.; Descorme, C.; Deleris, S.; Blanchet, E.; Besson, M. Selective removal of the ammonium-nitrogen in ammonium acetate aqueous solutions by catalytic wet air oxidation over supported Pt catalysts. Appl. Catal. B Environ. 2012, 128, 64–71. [Google Scholar] [CrossRef]
- Barbier, J., Jr.; Delanoe, F.; Jabouille, F.; Duprez, D.; Blanchard, G.; Isnard, P. Total oxidation of acetic acid in aqueous solutions over noble metal catalysts. J. Catal. 1998, 177, 378–385. [Google Scholar] [CrossRef]
- Perkas, N.; Minh, D.P.; Gallezot, P.; Gedanken, A.; Besson, M. Platinum and ruthenium catalysts on mesoporous titanium and zirconium oxides for the catalytic wet air oxidation of model compounds. Appl. Catal. B Environ. 2005, 59, 121–130. [Google Scholar] [CrossRef]
- Mikulova, J.; Barbier, J., Jr.; Rossignol, S.; Mesnard, D.; Duprez, D.; Kappenstein, C. Wet air oxidation of acetic acid over platinum catalysts supported on cerium-based materials: Influence of metal and oxide crystallite size. J. Catal. 2007, 251, 172–181. [Google Scholar] [CrossRef]
- Grosjean, N.; Descorme, C.; Besson, M. Catalytic wet air oxidation of N,N-dimethylformamide aqueous solutions: Deactivation of TiO2 and ZrO2-supported noble metal catalysts. Appl. Catal. B Environ. 2010, 97, 276–283. [Google Scholar] [CrossRef]
- Migo, V.P.; Del Rosario, E.J.; Matsumura, M. Floculation of melanoidins induced by inorganic ions. J. Ferment. Bioeng. 1997, 83, 287–291. [Google Scholar] [CrossRef]
- Plavsic, M.; Cosovic, B.; Lee, C. Copper complexing propeties of melanoidins and marine humic material. Sci. Total Environ. 2006, 366, 310–319. [Google Scholar] [CrossRef] [PubMed]
- Pourbaix, M. Atlas of Electrochemical Equilibria in Aqueous Solutions; Pergamon Press: Oxford, UK, 1966. [Google Scholar]
Figure 1.
XRD patterns of Pt/TiO2-G and Ru/TiO2-G catalysts used for continuous experiments.

Figure 2.
Evolution of: (a) Total Organic Carbon (TOC) and (b) concentrations of Total Nitrogen (TN) (measured by TOC-TN apparatus) and different N-species (analyzed by ionic chromatography) during oxidation of diluted VBC in the absence of a catalyst: TN (■), NH4+ (●), NO3− ( ![Energies 12 03974 i001]() ), and NO2− (▲).
), and NO2− (▲).
 ), and NO2− (▲).
Figure 2.
Evolution of: (a) Total Organic Carbon (TOC) and (b) concentrations of Total Nitrogen (TN) (measured by TOC-TN apparatus) and different N-species (analyzed by ionic chromatography) during oxidation of diluted VBC in the absence of a catalyst: TN (■), NH4+ (●), NO3− ( ![Energies 12 03974 i001]() ), and NO2− (▲).
), and NO2− (▲).
), and NO2− (▲).
Figure 3.
Evolution of TOC concentrations during the oxidation of diluted VBC at a temperature of 190 °C under 70 bar in the presence of 500 mg of 3wt% Ru/TiO2. First reaction (▲ (1)), first recycling (■ (2)), second recycling (● (3)), third recycling after re-activation under H2 ( ![Energies 12 03974 i002]() (4)).
(4)).
 (4)).
(4)).
Figure 3.
Evolution of TOC concentrations during the oxidation of diluted VBC at a temperature of 190 °C under 70 bar in the presence of 500 mg of 3wt% Ru/TiO2. First reaction (▲ (1)), first recycling (■ (2)), second recycling (● (3)), third recycling after re-activation under H2 ( ![Energies 12 03974 i002]() (4)).
(4)).
(4)).
Figure 4.
Concentrations of TN (measured by TOC-TN apparatus) and different N-species (analyzed by ionic chromatography) during oxidation of diluted VBC at 190 °C under 70 bar total air pressure in the presence of Ru catalysts: (a) Ru/TiO2, (b) Ru/ZrO2. TN (■), NH4+ (●), NO3− ( ![Energies 12 03974 i001]() ), and NO2− (▲).
), and NO2− (▲).
), and NO2− (▲).
Figure 5.
First recycling of Ru/TiO2 catalyst in the Catalytic Wet Air Oxidation (CWAO) of diluted VBC at 190 °C under 70 bar: (a) concentrations of N-species; TN (■), NH4+ (●), NO3− ( ![Energies 12 03974 i001]() ) and NO2− (▲); and (b) concentrations of carboxylic (di)acids.
) and NO2− (▲); and (b) concentrations of carboxylic (di)acids.
) and NO2− (▲); and (b) concentrations of carboxylic (di)acids.
Figure 6.
Evolution of TOC and TN in the presence of (a,b) Pt/TiO2 or (c,d) Pt/ZrO2. Fresh catalysts (■), used catalysts (●).
Figure 6.
Evolution of TOC and TN in the presence of (a,b) Pt/TiO2 or (c,d) Pt/ZrO2. Fresh catalysts (■), used catalysts (●).

Figure 7.
Concentrations of the different N-species in the presence of Pt/TiO2: (a) fresh catalyst, (b) used catalyst. TN (■), ammonium (●), nitrite (▲), nitrate ( ![Energies 12 03974 i001]() ).
).
).
Figure 7.
Concentrations of the different N-species in the presence of Pt/TiO2: (a) fresh catalyst, (b) used catalyst. TN (■), ammonium (●), nitrite (▲), nitrate ( ![Energies 12 03974 i001]() ).
).
).
Figure 8.
TOC conversion in the absence (☐) or presence of Ru/TiO2 (●), Ru/ZrO2 (▲), Pt/TiO2 ( ![Energies 12 03974 i003]() ), and Pt/ZrO2 (
), and Pt/ZrO2 ( ![Energies 12 03974 i001]() ).
).
 ), and Pt/ZrO2 ( ).
Figure 8.
TOC conversion in the absence (☐) or presence of Ru/TiO2 (●), Ru/ZrO2 (▲), Pt/TiO2 ( ![Energies 12 03974 i003]() ), and Pt/ZrO2 (
), and Pt/ZrO2 ( ![Energies 12 03974 i001]() ).
).
), and Pt/ZrO2 ( ).
Figure 9.
Transformation of organic nitrogen in the sugarcane effluent in the presence of (a) Pt/TiO2 and (b) Pt/ZrO2. TN (■), NH4+ (●), NO3− ( ![Energies 12 03974 i001]() ) NO2− (▲). Empty symbols show the results of duplicate experiments.
) NO2− (▲). Empty symbols show the results of duplicate experiments.
) NO2− (▲). Empty symbols show the results of duplicate experiments.
Figure 10.
DRX patterns of support (1) for Ru/TiO2 (a) and Pt/ZrO2 (b) before (2) and after (3) oxidation of sugarcane vinasse.
Figure 10.
DRX patterns of support (1) for Ru/TiO2 (a) and Pt/ZrO2 (b) before (2) and after (3) oxidation of sugarcane vinasse.

Figure 11.
TEM images of the catalysts used and a comparison of the size distributions of the fresh and used catalysts: (a) Ru/TiO2 and (b) Pt/ZrO2 catalysts.
Figure 11.
TEM images of the catalysts used and a comparison of the size distributions of the fresh and used catalysts: (a) Ru/TiO2 and (b) Pt/ZrO2 catalysts.

Figure 12.
Oxidation of sugarcane vinasse in the continuous reactor over the Ru/TiO2-G catalyst. (a) TOC, (b) total nitrogen (■ measured with a TN meter, and ● calculated from ionic chromatography), (c) different N-species (●, ammonium; ![Energies 12 03974 i001]() , nitrate) and (d) the leaching of Ru during these different periods with contact times (tcs) of (1) 0.99 h gcata gTOC−1, (2) 1.98 h gcata gTOC−1, (3) 2.97 h gcata gTOC−1, and (4) the initial conditions of period (1). X: reaction was stopped because of a leak in the liquid pump.
, nitrate) and (d) the leaching of Ru during these different periods with contact times (tcs) of (1) 0.99 h gcata gTOC−1, (2) 1.98 h gcata gTOC−1, (3) 2.97 h gcata gTOC−1, and (4) the initial conditions of period (1). X: reaction was stopped because of a leak in the liquid pump.
, nitrate) and (d) the leaching of Ru during these different periods with contact times (tcs) of (1) 0.99 h gcata gTOC−1, (2) 1.98 h gcata gTOC−1, (3) 2.97 h gcata gTOC−1, and (4) the initial conditions of period (1). X: reaction was stopped because of a leak in the liquid pump.
Figure 13.
Oxidation of sugarcane vinasse in the continuous reactor over Pt/TiO2-G catalyst: (a) TOC, (b) total nitrogen (●,●,●) measured; (○,○,○) calculated from IC), (c) the different N-species (●, ammonium; ![Energies 12 03974 i001]() , nitrate; ▲, nitrite), and (d) leaching of Pt during these different periods; contact time (tc) of (1) 0.99 h gcata gTOC−1, (2) 1.98 h gcata gTOC−1, (3) 2.97 h gcata gTOC−1.
, nitrate; ▲, nitrite), and (d) leaching of Pt during these different periods; contact time (tc) of (1) 0.99 h gcata gTOC−1, (2) 1.98 h gcata gTOC−1, (3) 2.97 h gcata gTOC−1.
, nitrate; ▲, nitrite), and (d) leaching of Pt during these different periods; contact time (tc) of (1) 0.99 h gcata gTOC−1, (2) 1.98 h gcata gTOC−1, (3) 2.97 h gcata gTOC−1.

Table 1.
Average characteristics of a vinasse “de bonne chauffe” of cognac (data provided by Revico) and of raw sugarcane vinasse before the experiment. a Chemical Oxygen Demand, b Biological Oxygen Demand.
Table 1.
Average characteristics of a vinasse “de bonne chauffe” of cognac (data provided by Revico) and of raw sugarcane vinasse before the experiment. a Chemical Oxygen Demand, b Biological Oxygen Demand.
| Parameter | Unit | Vinasse Bonne Chauffe (VBC) | Sugarcane Vinasse |
|---|---|---|---|
| pH | 3.15 ± 0.2 | 4.6 ± 0.4 | |
| COD a | g O2 L−1 | 23.5 ± 10 | 70 ± 10 |
| BOD b | g O2 L−1 | 35 ± 5 | |
| Total Nitrogen | mg L−1 | 235 ± 12 | 1260 ± 65 |
| Color | brown | dark brown |
Table 2.
Characteristics of commercial supports.
| Support | Supplier | Nature | Surface Area (m2 g−1) | Crystalline Phase | Wetting Volume (mL g−1) a | pHPZC b | Av. Pore Diameter (nm) |
|---|---|---|---|---|---|---|---|
| TiO2 DT51 | Cristal | powder | 92 | anatase | 0.87 | 4.4 | 9 |
| ZrO2 XZO632/18 | Mel Chemicals | powder | 90 | monoclinic | 0.45 | 6.1 | 9 |
| TiO2 G | St Gobain | extrudates | 41 | anatase | 0.40 | nm | 21.5 |
a appropriate volume of water to match the pore volume of the support and impregnate the support; b point of zero charge.
Table 3.
Pt loss from the catalyst; concentrations of N-species during the reaction over 2.36% Pt/ZrO2.
Table 3.
Pt loss from the catalyst; concentrations of N-species during the reaction over 2.36% Pt/ZrO2.
| Time (h) | Pt Leached (%) | TN (mM) | NH4+ (mM) | NO2− (mM) | NO3− (mM) | Inorganic N (mM) |
|---|---|---|---|---|---|---|
| 2 | 10 | 2.6 | 1.4 | 0 | 0 | 1.4 |
| 4 | 11.4 | 2.3 | 0 | 0.1 | 1.2 | 1.3 |
| 7 | 7.6 | 2.3 | 0 | 0.1 | 1.5 | 1.6 |
| 24 | 1.3 | 2.5 | 0 | 0 | 2.1 | 2.1 |
| 32 | 0.2 | 2.2 | 0 | 0 | 2.0 | 2.0 |
| 32 | 0.3 | 2.2 | 0 | 0 | 2.0 | 2.0 |
© 2019 by the authors. Licensee MDPI, Basel, Switzerland. This article is an open access article distributed under the terms and conditions of the Creative Commons Attribution (CC BY) license (http://creativecommons.org/licenses/by/4.0/).
Share and Cite
MDPI and ACS Style
Le Phuong, T.; Besson, M. Catalytic Wet Air Oxidation Using Supported Pt and Ru Catalysts for Treatment of Distillery Wastewater (Cognac and Sugarcane Vinasses). Energies 2019, 12, 3974. https://doi.org/10.3390/en12203974
AMA Style
Le Phuong T, Besson M. Catalytic Wet Air Oxidation Using Supported Pt and Ru Catalysts for Treatment of Distillery Wastewater (Cognac and Sugarcane Vinasses). Energies. 2019; 12(20):3974. https://doi.org/10.3390/en12203974
Chicago/Turabian StyleLe Phuong, Thu, and Michèle Besson. 2019. "Catalytic Wet Air Oxidation Using Supported Pt and Ru Catalysts for Treatment of Distillery Wastewater (Cognac and Sugarcane Vinasses)" Energies 12, no. 20: 3974. https://doi.org/10.3390/en12203974
Note that from the first issue of 2016, this journal uses article numbers instead of page numbers. See further details here.