An Application of the New Environmental Paradigm (NEP) Scale in a Greek Context
by
 , , ,
, , ,
Stamatios Ntanos
1,* ,
,
Grigorios Kyriakopoulos
2 ,
,
Michalis Skordoulis
3,
Miltiadis Chalikias
4 and
Garyfallos Arabatzis
3 1
Department of Business Administration, School of Business, Economics and Social Sciences, University of West Attica, 12244 Egaleo, Greece
2
School of Electrical and Computer Engineering, National Technical University of Athens, 15780 Zografou, Greece
3
Department of Forestry and Management of the Environment and Natural Resources, School of Agricultural and Forestry Sciences, Democritus University of Thrace, 68200 Orestiada, Greece
4
Department of Tourism Management, School of Business, Economics and Social Sciences, University of West Attica, 12244 Egaleo, Greece
*
Author to whom correspondence should be addressed.
Energies 2019, 12(2), 239; https://doi.org/10.3390/en12020239
Submission received: 26 November 2018
/
Revised: 6 January 2019
/
Accepted: 8 January 2019
/
Published: 14 January 2019
Abstract
:Measuring and analyzing public perceptions of the environment are becoming core elements in promoting environmental sustainability, which is a key goal to be achieved. The New Ecological Paradigm Scale (NEP) is used as a unidimensional measure of environmental attitudes as it is developed in order to measure the overall relationship between humans and the environment. A high NEP score is associated with high ecocentric orientation. This research aims to measure and analyze citizens’ NEP score in a Greek area. Overall, the statistical analysis verified the existence of the NEP subscales, indicated increased environmental awareness among the respondents and revealed that the respondents’ NEP score is correlated with the area of residence. Furthermore, the NEP score is correlated at a statistically significant level with respondents’ willingness to pay for renewable energy expansion.
1. Introduction
With respect to a historical viewpoint of the New Ecological Paradigm (NEP) conceptualization and applicability, only a few research works were devoted to the adjustment of the NEP scaling to strictly environmental issues between the years 1980–1990. Nevertheless, by the end of 1980s, handling of the out-of-border environmental issues of aquifer pollution, land desertification, protection of endangered ecosystems and atmospheric degradation necessitates the adaptation of NEP scaling towards recognizing and confronting the reality of global environmental change [1].
In response to this environmental transition from the local to global level of manipulation, a measurable tool of 3 revisions of the original NEP Scale was developed by Dunlap [1], with the latest revision rapidly replacing the 1978 version in most studies. Under the original NEP Scale, the questions rotate around three aspects of environmental beliefs (these are the sub-scales which frame the psychological tendency to evaluate the favoring or disfavoring of the natural environment): “(1) a belief in humans’ ability to upset the balance of nature, (2) the existence of limits to growth, and, (3) humans’ right to rule over the rest of nature” [2]. Consequently, the uni-dimensionality of NEP scaling towards environmental attitudes reflects an ecologically oriented point of view (a high NEP score reflects positiveness for the preservation of natural sources) or an anthropogenic (a low NEP score reflects positiveness for the exploitation of natural sources) approach, accordingly.
Dunlap [1] reviewed the current (at the time of publication) application of the several formats of the NEP Scale and examined the criticism of them. The original NEP Scale was created during this study, as the authors concluded that 12 items offer good reliability (alpha = 0.81) and are sufficiently correlated to be treated as a single rating scale. Although Dunlap [1] included questions to capture three different aspects (or what the author later termed “facets of the NEP Scale”), he argued that since they constituted a coherent worldview, all the items should hang together.
Under the context of NEP (new ecological paradigm scale), the authors specifically designed a revised NEP scaling where the original scale was elaborated by two new aspects of ecological orientation, having the following revised performance, compared to the former one:
- The introduction of items dealing with the likelihood of eco-crises was made, in alignment with the growing awareness of global ecological problems.
- The inclusion of three items per each one of the formulated subscales was implemented. Therefore, the development of 8 pro-NEP and 7 anti-NEP items consists of the arrangement of the 15-item NEP scaling; thus, no subscale is measured with items located in only one (positively or negatively expressed) direction.
- The author removed outdated expressions like «mankind». Furthermore, the author subsumed the NEP into the relevant social-psychological theory, by indicating that the NEP questions capture the primitive inner-beliefs about the relationship between humans and their environment.
Under the revised NEP Scale, Dunlap [1] modified the original NEP scaling towards psychometrically robust and contemporarily structured terminology. Indeed, the original NEP scaling contained an uneven ratio of pro-trait to con-trait items and gender-oriented items (“mankind” was interchangeably mentioned as “humans”). Hawcroft and Milfont [2] methodologically followed, by using specific versions of the NEP scaling. Specifically, the authors revealed the comparability between the 12- and 15- item formulations. Nevertheless, the validity of the scoring and the comparability were prominent while selecting fewer items out of the whole NEP Scale.
Considering the previous theoretical background, this study aims to measure and analyze citizens’ perceptions based on the NEP Scale in a Greek area in order to evaluate their environmental awareness and locate the most important facets of the NEP Scale. The analysis includes hypothesis tests between the sample demographics and the NEP Scale’s mean score. Furthermore, based on the above results, the relationship between respondents’ NEP Scale score and their willingness to pay (WTP) for an expansion of renewables into the current energy mix will be examined. Relevant research concerning the applicability and evaluation of the NEP Scale is presented in the review section.
2. Literature Review
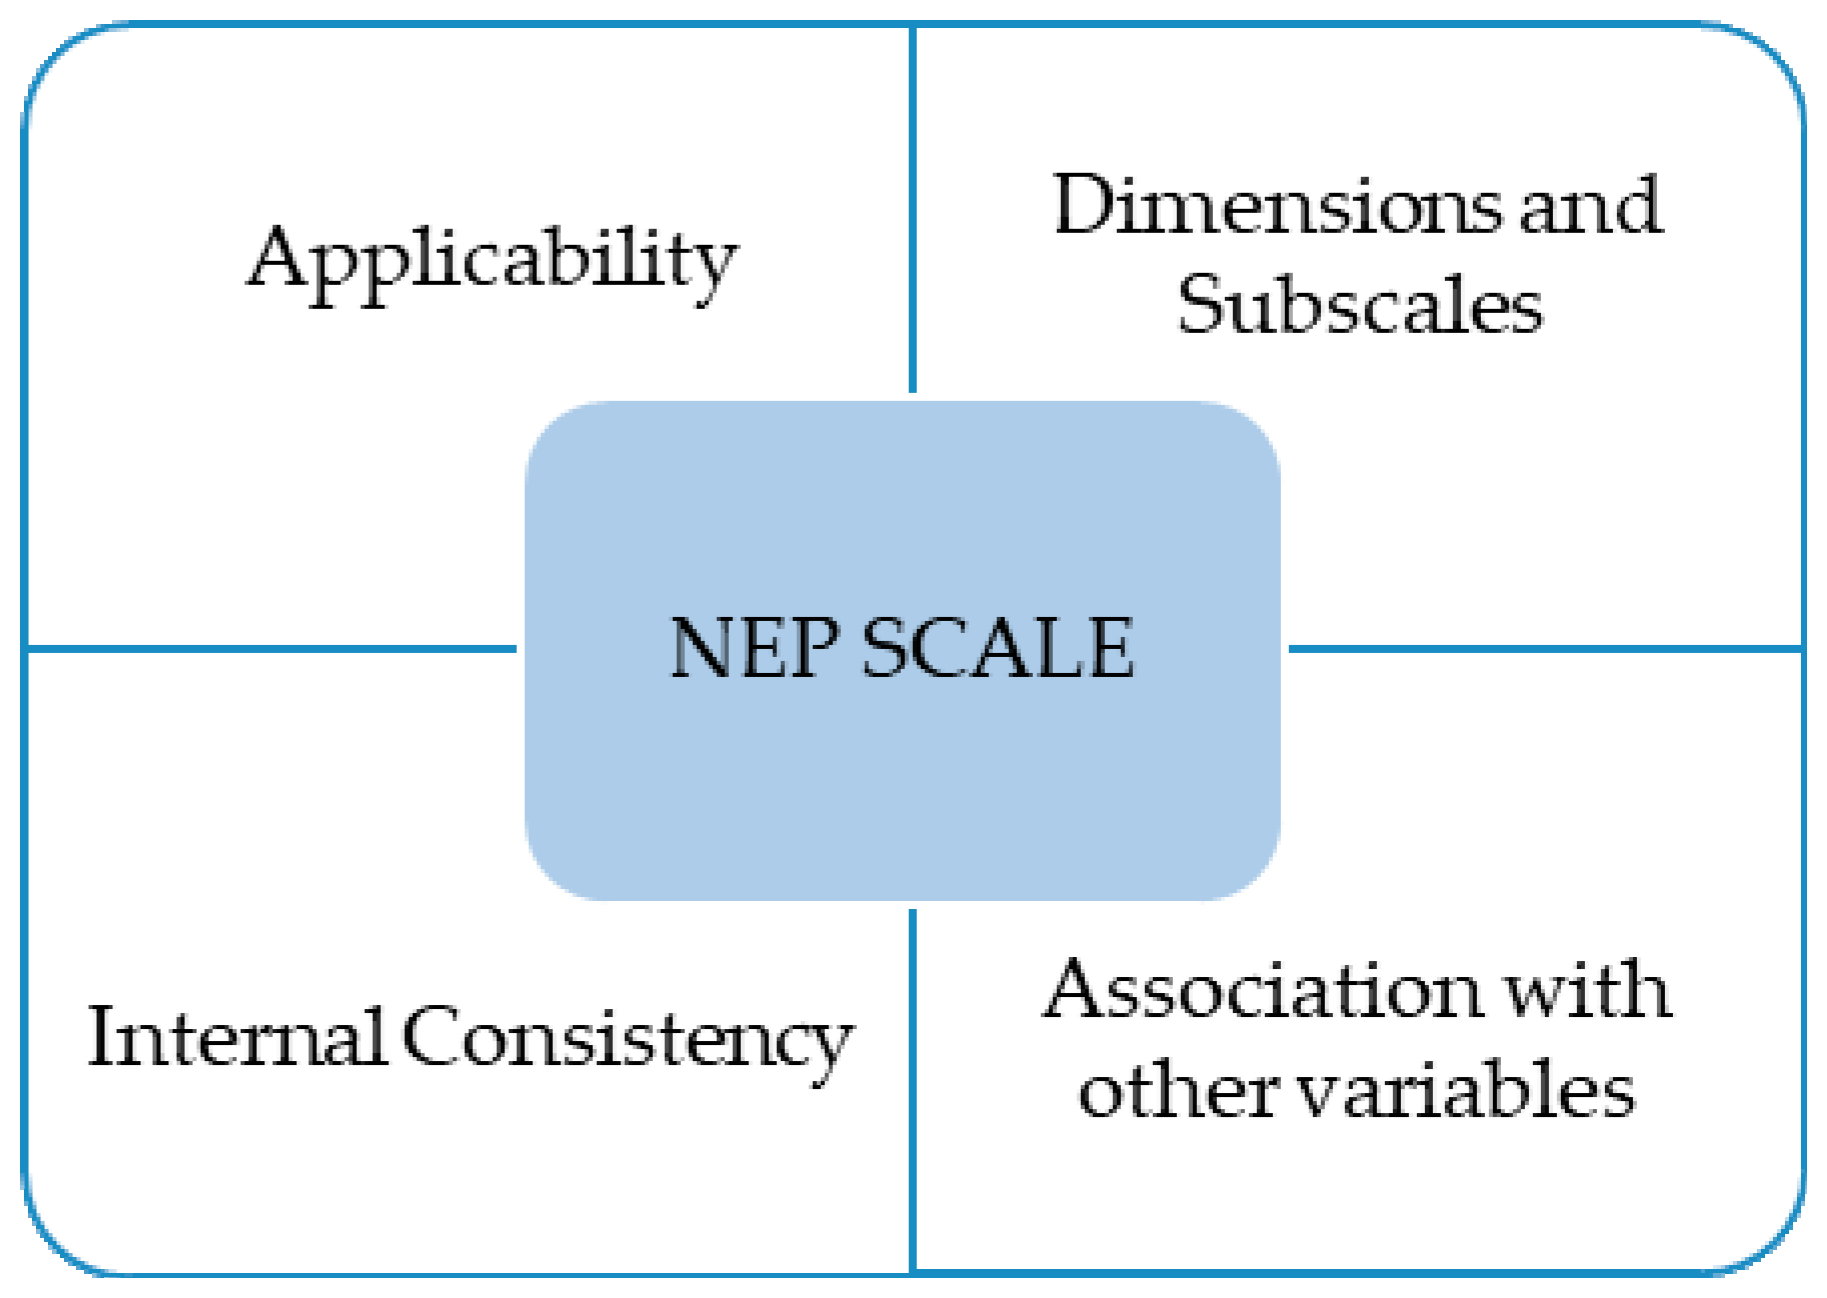
The main aspects of the following literature review section concerning the various aspects of the New Environmental Paradigm (NEP) Scale are presented in Figure 1.
2.1. Literature Background of the NEP Conceptualization and Functionality
Xiao and Buhrmann [3] framed a multifaceted viewpoint of NEP conceptualization under the aspects of consistency and dimensionality. Notably, the authors signified the fact that the NEP represents the belief of certain economic constraints to growth and the ecological balance predomination over humans’ power relative to nature. Therefore, NEP scaling aims at unveiling the broad spectrum of ecological viewpoints and environmental items to verify environmental concerns measured worldwide. These authors further signified the determining role of internal consistency and multidimensionality of the NEP scaling against sample-focused and conflict-suffered appreciation of environmental values [3].
Besides the conceptualization of consistency and dimensionality, Lopez-Bonilla et al. [4] unveiled the determining role of ecocentrism and anthropocentrism under the NEP context. Indeed, these authors valued NEP scaling as an advanced and novel tool to foster the aforementioned conceptualization in a Likert-like format of prompt responses, without a need for reflection or comparison. Therefore, the original NEP scaling composition is grounded on the following three collections of items: balancing the nature, the constraints of growth as well as the humanitarian prevalence over nature. Subsequently, the revised NEP scaling is grounded on the following five items, created by a total of 15 questions: limiting variables of growth (1, 6, and 11), anti-anthropocentrism (2, 7, and 12), vulnerability of natural balancing (3, 8, and 13), rejection of exemptionalism (4, 9, and 14), as well as the instances of an eco-crisis episode (5, 10, and 15).
In a methodological context, Lopez-Bonilla et al. [4] emphasized that the NEP Scale is composed of two main directions: ecocentric and anthropocentric views. An ecocentric view of the environment assumes that individuals understand the value of nature as a common good and the need for protection because of its intrinsic value. The anthropocentric view refers to the idea that humans can handle nature and counterbalance the adverse effects that development has over it. Methodologically, all items were measured on a five-point Likert-type scale in the study of Lopez-Bonilla et al. [4] where the reliability was valued by Cronbach’s alpha, the internal scale consistency was attributed to the measure of the same-highly interrelated- construction of items, and the validity of this NEP scaling was criticized under the non-unidimensionality among all its various versions released.
Indeed, it has been noted in the literature that the NEP Scale is somewhat unstable in various contexts, and has been found to vary, in alignment with respondents’ socio-demographic variables [5]. Another criticism of NEP Scale validity is that of its consistency, both internally (alpha) and over time. In contrast to the perception of the long duration of NEP Scale utility, it would be expected as a credible and consistent measure of the pre-cursors that relate to environmental behavior change; however, this implication is not always verified [5]. Other contentious features of the NEP Scale are its dimensionality and its variability regarding the respondents’ socio-economic reported status [5]. In the context of utility of alternative forms to assess the NEP, indicative studies have reported: a) the 6-, 12- and 15-item versions were treated as interchangeable scales, despite the arousing criticism [5], b) In a multidimensional study on environmental attitudes including 14 countries, the revised NEP Scale was used and it was found that average reliability varied among these countries based upon environmental attitudes, showing the alpha coefficient to be between 0.47–0.81 with an average reliability of 0.70 [6]. In this study the average NEP Scale score was reported to range between 3.67 (United States) and 4.11 (Canada), showing that personal values like universalism and tradition influence environmental attitudes [6], c) whereas it was reported that by testing the NEP Scale reliability, Cronbach’s alpha value of 0.61 was obtained, and the boundaries between an anthropocentric and a pro-ecological worldview were implied. The widespread utility of various NEP scaling formats –including a 5-point scale, 7-point, 10-point, or 12-point versions–has not been done systematically but in varying ways [6]. At the end of this introductory viewpoint it is also noteworthy to recall that:
- The NEP Scale is one of the most widely used scales to capture the degree of an ecological worldview of the respondents. It should consist of five subscales, according to its creator [7].
- The NEP Scale can be considered a credible decision-making tool for renewable energy projects, being associated with a positive attitude towards renewable energy investment [6].
2.2. Pro-Environmental and Socio-Cultural Viewpoints of the NEP Concept
Park et al. [8] developed a joint theoretical framework of “Value-Belief-Norm” and the “Modified-Norm-Activation-Model” in order to evaluate the behavioral control, the personal norms, and the pro-environmental behavioral intention in the process of decision-making in the tourism sector (tourists were interviewed). This study unveiled the fact that the attributes of proactiveness, responsibility, social norms, personal norms, and environmental precaution, are all determining aspects which foster environmental behaviors based upon the NEP theory. In parallel, the item valuation based on a five-point Likert scale formulated an integrative model of high predictive power upon tourists’ pro-environmental intention. This kind of intention is solidified under the development of strong biospheric and altruistic values based on ecological consciousness, over the egoistically attributed benefits of social power and wealth.
In another socio-environmental applicability of the NEP principles, Luo and Deng [9] focused their research on how environmental attitude according to the NEP Scale is associated with tourism motivation for the case of China. A tight relationship between the respondents’ demographics and the NEP was found. Under the humanitarian alarm with respect to environmental aspects, the authors indicated that those respondents who support the idea of limits to development and who are more concerned about a potential eco-crisis tend to be close to nature, to learn about nature, and to escape from routine and issues associated with cities. Findings of Luo and Deng [9] regarding the NEP are generally consistent with relevant studies in that gender, age, and education tend to be consistent predictors, as evidenced in previous studies. Under this context, future research should be conducted to examine more complex relationships among environmental values, attitudes, motivations, participation, satisfaction, and environmentally friendly behaviors.
The pro-environmental attitudes and the most widely used measures of environmental beliefs were analyzed by Grunova et al. [10], who argued that the New Environmental Paradigm (NEP) Scale could be valid across cultures and continents. Nevertheless, the authors argued that adult respondents in Western countries had shown no universal applicability of the NEP scaling outside these developed communities, since pro-environmental behavior is attributed to altruistic values, whereas in Asian communities, pro-environmental behavior in caring for the environment is a traditional anthropogenic concern, having no necessarily eco-centric motives. Therefore, differentiated subscales are attributed to environmental aspects, where the consistency of the scale was examined by the applicability of Cronbach’s alpha confirmatory factor analysis. The study of Grunova et al. [10] reported variance of responses to specific items, caused by variations based on cultural features, religious viewpoints, perceptions of the place of humankind in nature, and weak awareness of human impact over natural sources. This multifaceted variability revealed different latent dimensions of the sample surveyed and low internal consistency of the overall NEP scaling [10].
The environmental attitudes based on the NEP conceptualization and operability were investigated [2,11]. Taskin [11] investigated the environmental attitudes (EA) of senior high school students in Turkey. The author investigated the determining factors of EAs, concluding specific proposals of curricular reforms. Interestingly, such an environmental NEP-driven educational model can offer a new generation of more non-materialistic point of views, while including environmental concerns. The authors conclude that the use of the NEP Scale can help in understanding environmental attitude even at early stages.
In parallel, the universal frame of beliefs that is measured by NEP scaling is reasoning by the broad study of environmental attitudes [1]. In this research context, Hawcroft and Milfont [2] defined the functionality of such environmental attitudes (EA) as the evaluation of the nature under favors or disfavors, being the crucial aspects of environmental psychology.
In a similar study, Putrawan [12] argued that when environmental attitudes are recorded, there are two types of attitudes followed by humans, the Dominance Social Paradigm (DSP) and New Environmental Paradigm (NEP). DSP states that in human thought, the environment can be exploited because it has the potential to recover by itself. Therefore, natural resources are infinite, so they can be widely used to cover human needs (anthropocentric approach). In contrast, NEP sustains characteristics opposite to DSP. NEP assumes that a human being is an inseparable component of the ecosystem and natural resources are very limited to be utilized without control. According to the author, the components of the ecosystems including humans and other living creatures and also nature are interrelated, so the destruction of a component can lead to the deterioration of the whole ecosystem. Therefore, as humans gain knowledge of the ecosystems, this can lead to a change in their attitude towards the natural environment.
Putrawan [12] also signified the instrumental composition of NEP under five dimensions, all composed of an arrangement of items. This author signified that while decreasing the DSP-driven conception in favor of incremental positively attributed NEP-driven conception, the goal of “sustainable development” is soundly accomplished.
Under this social orientation of accomplishing “sustainable development”, in this study, authors adopted the administrative tool of willingness to pay (WTP). Specifically, WTP reflects the public appreciation regarding renewables, as well as it involves the conceptualization of social acceptance and humans’ readiness to accept investment into renewable energy technologies in their residential areas. Therefore, WTP is a measurable tool to monitor the public attitudes towards renewable energy sources, in general, as well as in favor of a socio-economic appreciation of greener expansion of RES into national/regional energy mixes, in particular [13].
Besides, at the end of this introductory section, it is noteworthy mentioning the devotion of the NEP scaling as a valuable tool for decision making. In this respect, Putrawan [12] stressed that NEP could stand for "new ecological paradigm”, instead of “new environmental paradigm”, due to the improvement of peoples’ global environmental attitudes toward the Earth-shared living place moving from anti-ecological to mid-ecological and finally to pro-ecological. It is noteworthy that the “New Ecological Paradigm” is the socio-evolving term of the initially introduced “New Environmental Paradigm” [12].
The main variables that support the decision-making perspectives of NEP scaling can be collectively presented as (a) the manipulation of eco-crises, in association with the growing awareness of global ecological problems, (b) the development of strong biospheric and altruistic values, over the egoistically attributed benefits of social power and wealth, (c) the functionality of environmental attitudes as psychological motives to evaluate the natural environment, under favors or disfavors that comply with the principles of environmental psychology, (d) the validity of scoring, the comparability among alternative decision plans, and the vulnerability implied while purposefully selecting few items out of the whole range of NEP items/dimensions available, as well as, (e) the wide spectrum of ecological viewpoints and environmental values to verify environmental decision plans, based on NEP scaling worldwide.
3. Materials and Methods
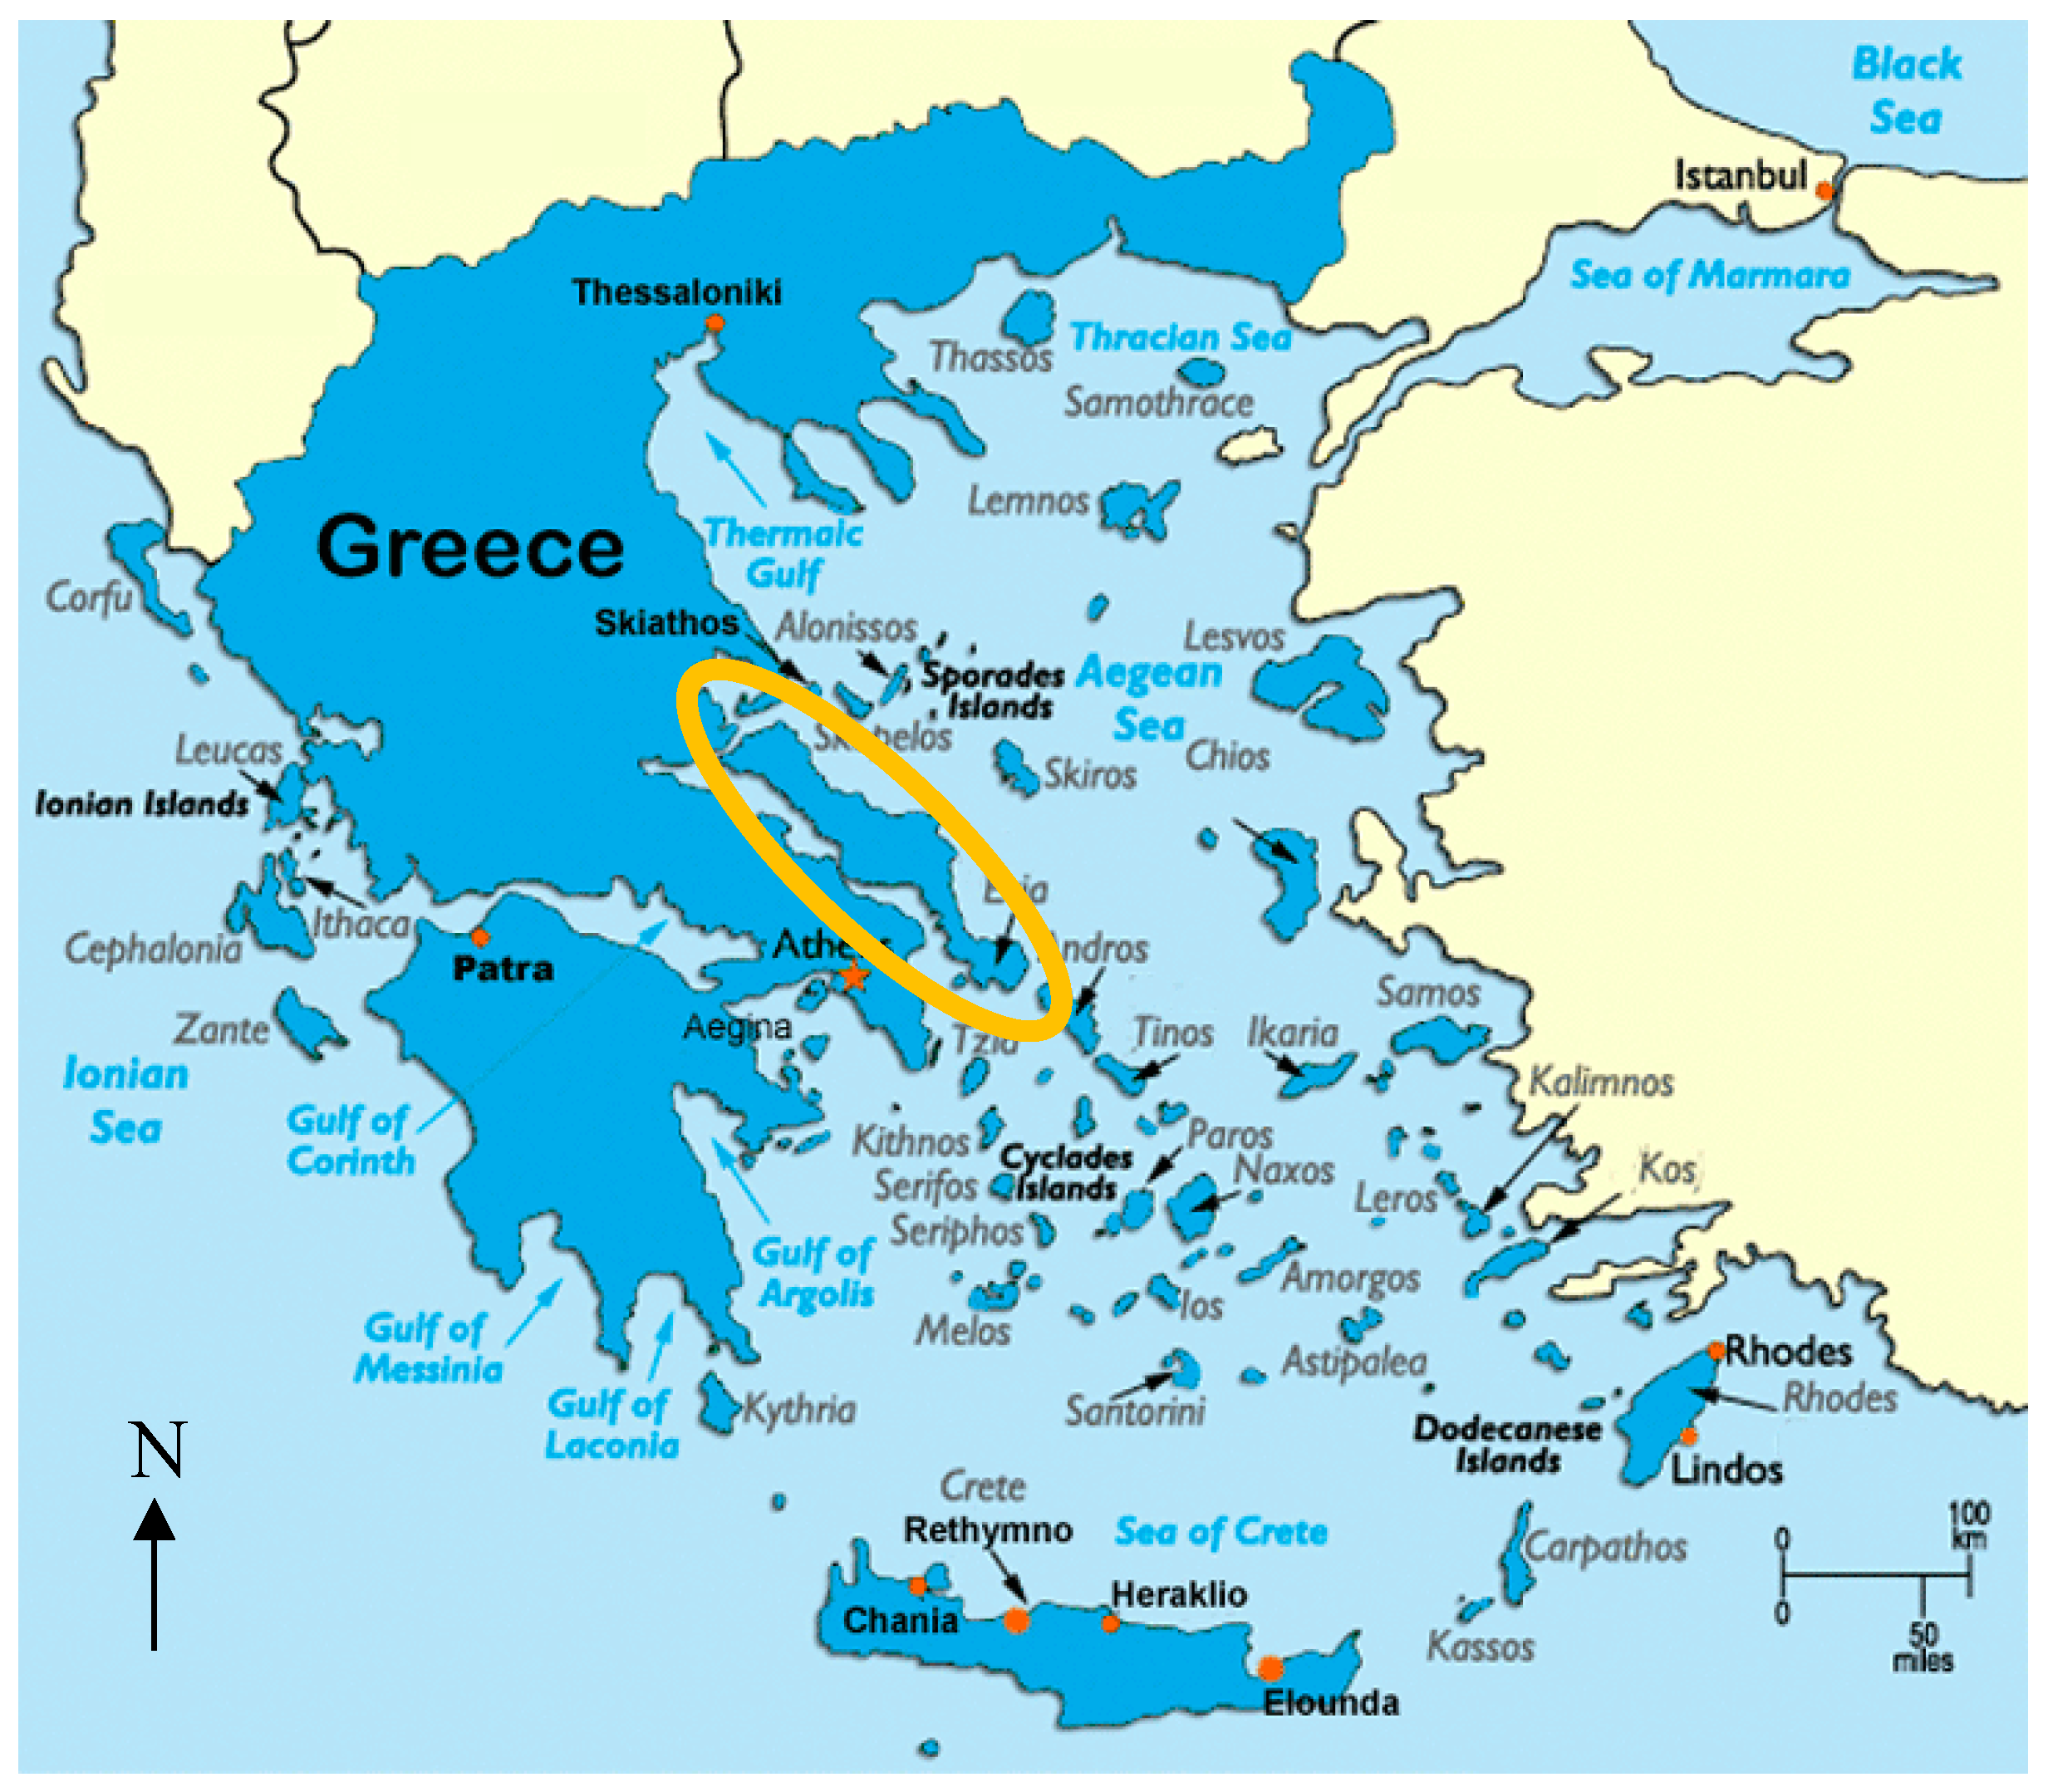
The research area is the prefecture of Evia, which belongs to the region of Central Greece. This research expands on similar research, for the area of Evia [6]. The region of Central Greece occupies an area of 15,449 km2, representing 11.8% of the country. Evia is one of the largest islands of Greece, with an area of 4167 km2. The ground is mainly mountainous and semi-mountainous, while the plains occupy only 20% of the total area. Its eastern part is islanded and includes the island of Skyros and other islets. The sea borders of Evia are defined by the northern part of the island, which is covered by the Pagasetic Gulf, on the eastern side of the island, which extends into the Aegean Sea and the western side of the island, which is washed by the Evia Gulf (Figure 2). The island of Evia has a length of 180 km, and its width ranges from 8 to 50 km, while its coastline is about 680 km long. The capital of the prefecture is Chalkida. The territory of the island consists of 44% of pastures, 30% of forest land and 26% of arable land. Regarding the population of the Prefecture of Evia, according to the last two censuses carried out by the Statistical Service, in 2001 it amounted to 207.305 inhabitants while in 2011 it increased to 210,815 inhabitants [14].
The per capita GDP of Evia for 2013 was 13,315 euros, well below the corresponding size of the prefecture of Viotia (21,159 Euros), but very close to the average price of the Region of Central Greece (14,858 Euros). The decline in the per capita GDP of the Prefecture of Evia in the year 2013 compared to 2011 is of the order of 10%, while for the whole Greece and the prefecture of Attica this decrease was almost 12%.
Our research was selected to take place in this specific area due to its high wind and solar potential. Southern Evia has already attracted investment interest in wind energy investment. According to Baltas and Dervos [16], three wind priority areas are distinguished in Greece. Evia belongs to the 2nd area, while the total installed capacity of wind farms in South Evia is about 212 MW. Consequently, due to the numerous wind farms in the area, the issue of social acceptance of the local community for further expansion of investment is of great importance.
Concerning sample size, the estimation was done by using the equation of simple random sampling with substitution [13]. For our calculations, the confidence level is set at 95%, meaning that a 5% significance level is set. According to Eng [17], when the examined variable measures proportions, the equation for sample size in per cent sampling is expressed in Equation (1):
where n is the total sample size, p is the pre-study estimate of the proportion to be measured, e is the accepted error (in our case 5%) and, Z1−a/2 is the standard normal deviate which takes a standard value based on the significance level set [17]. Thus, for the calculation of the proper sample size from the proportional variables, calculated from the preliminary survey, we use respondents’ willingness to pay (WTP) for renewable energy (61% replied “Yes”), for 95% confidence level and an accepted error term of 5%, presented in Equation (2):
The data for this research were collected through questionnaires which were completed between September 2017 and October 2017. The database was analyzed with SPSS v.20.
Sample’s demographics are provided in Table 1.
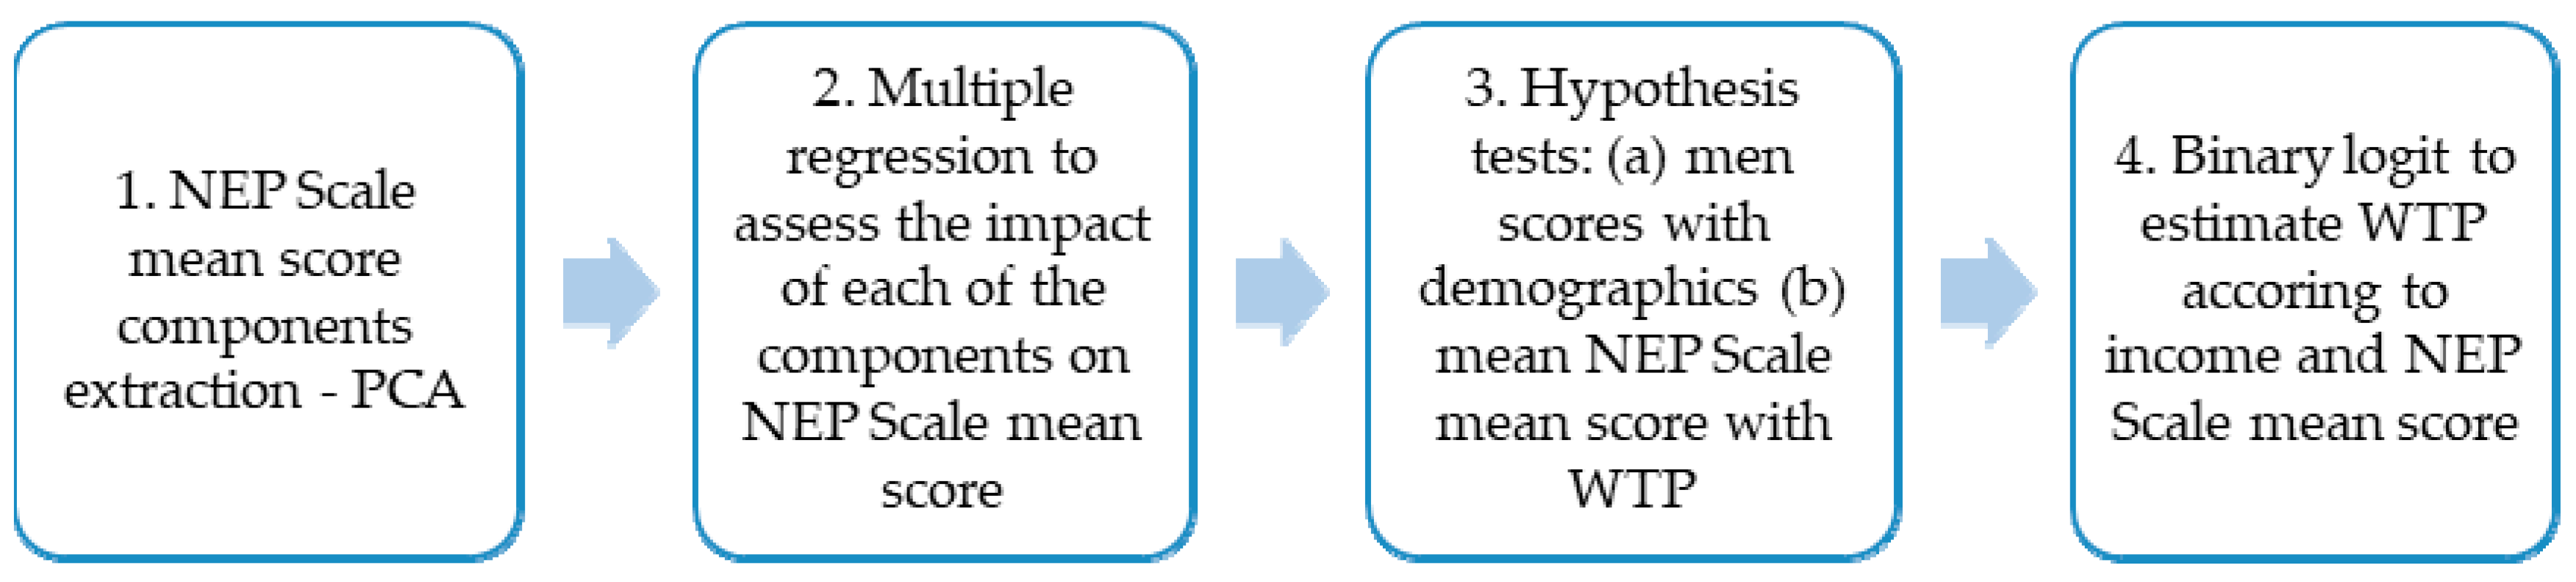
The analytical composition of the research was undertaken in compliance with the following steps shown in Figure 3:
4. Results
Initially, a reliability test was run in order to measure the NEP Scale’s internal consistency in the current research. A Cronbach’s a value equal to 0.714 was obtained, which shows an acceptable level of reliability.
Based on methods used by researchers deploying similar data [18], principal component analysis (PCA) was carried out in order to verify the existence of NEP Scale’s facets and the relationship between them [18]. According to this method, each component interprets a proportion of the variance that has not been interpreted by the other created components [13]. The results of Κaizer-Meyer-Olkin’s Measure of Sampling Adequacy (KMO = 0.785) and Bartlett’s test of sphericity (p-value = 0.000) indicated that the data were suitable for PCA. The PCA was carried out using varimax rotation, a method which minimizes the number of large weight variables and makes them more interpretable. Table 2 confirms the existence of the NEP Scale’s five components in the context of the current research, based on the number of components with eigenvalues greater than 1.
The following Table 3 shows how the NEP Scale’s Items are grouped into the five extracted components, based on their loadings.
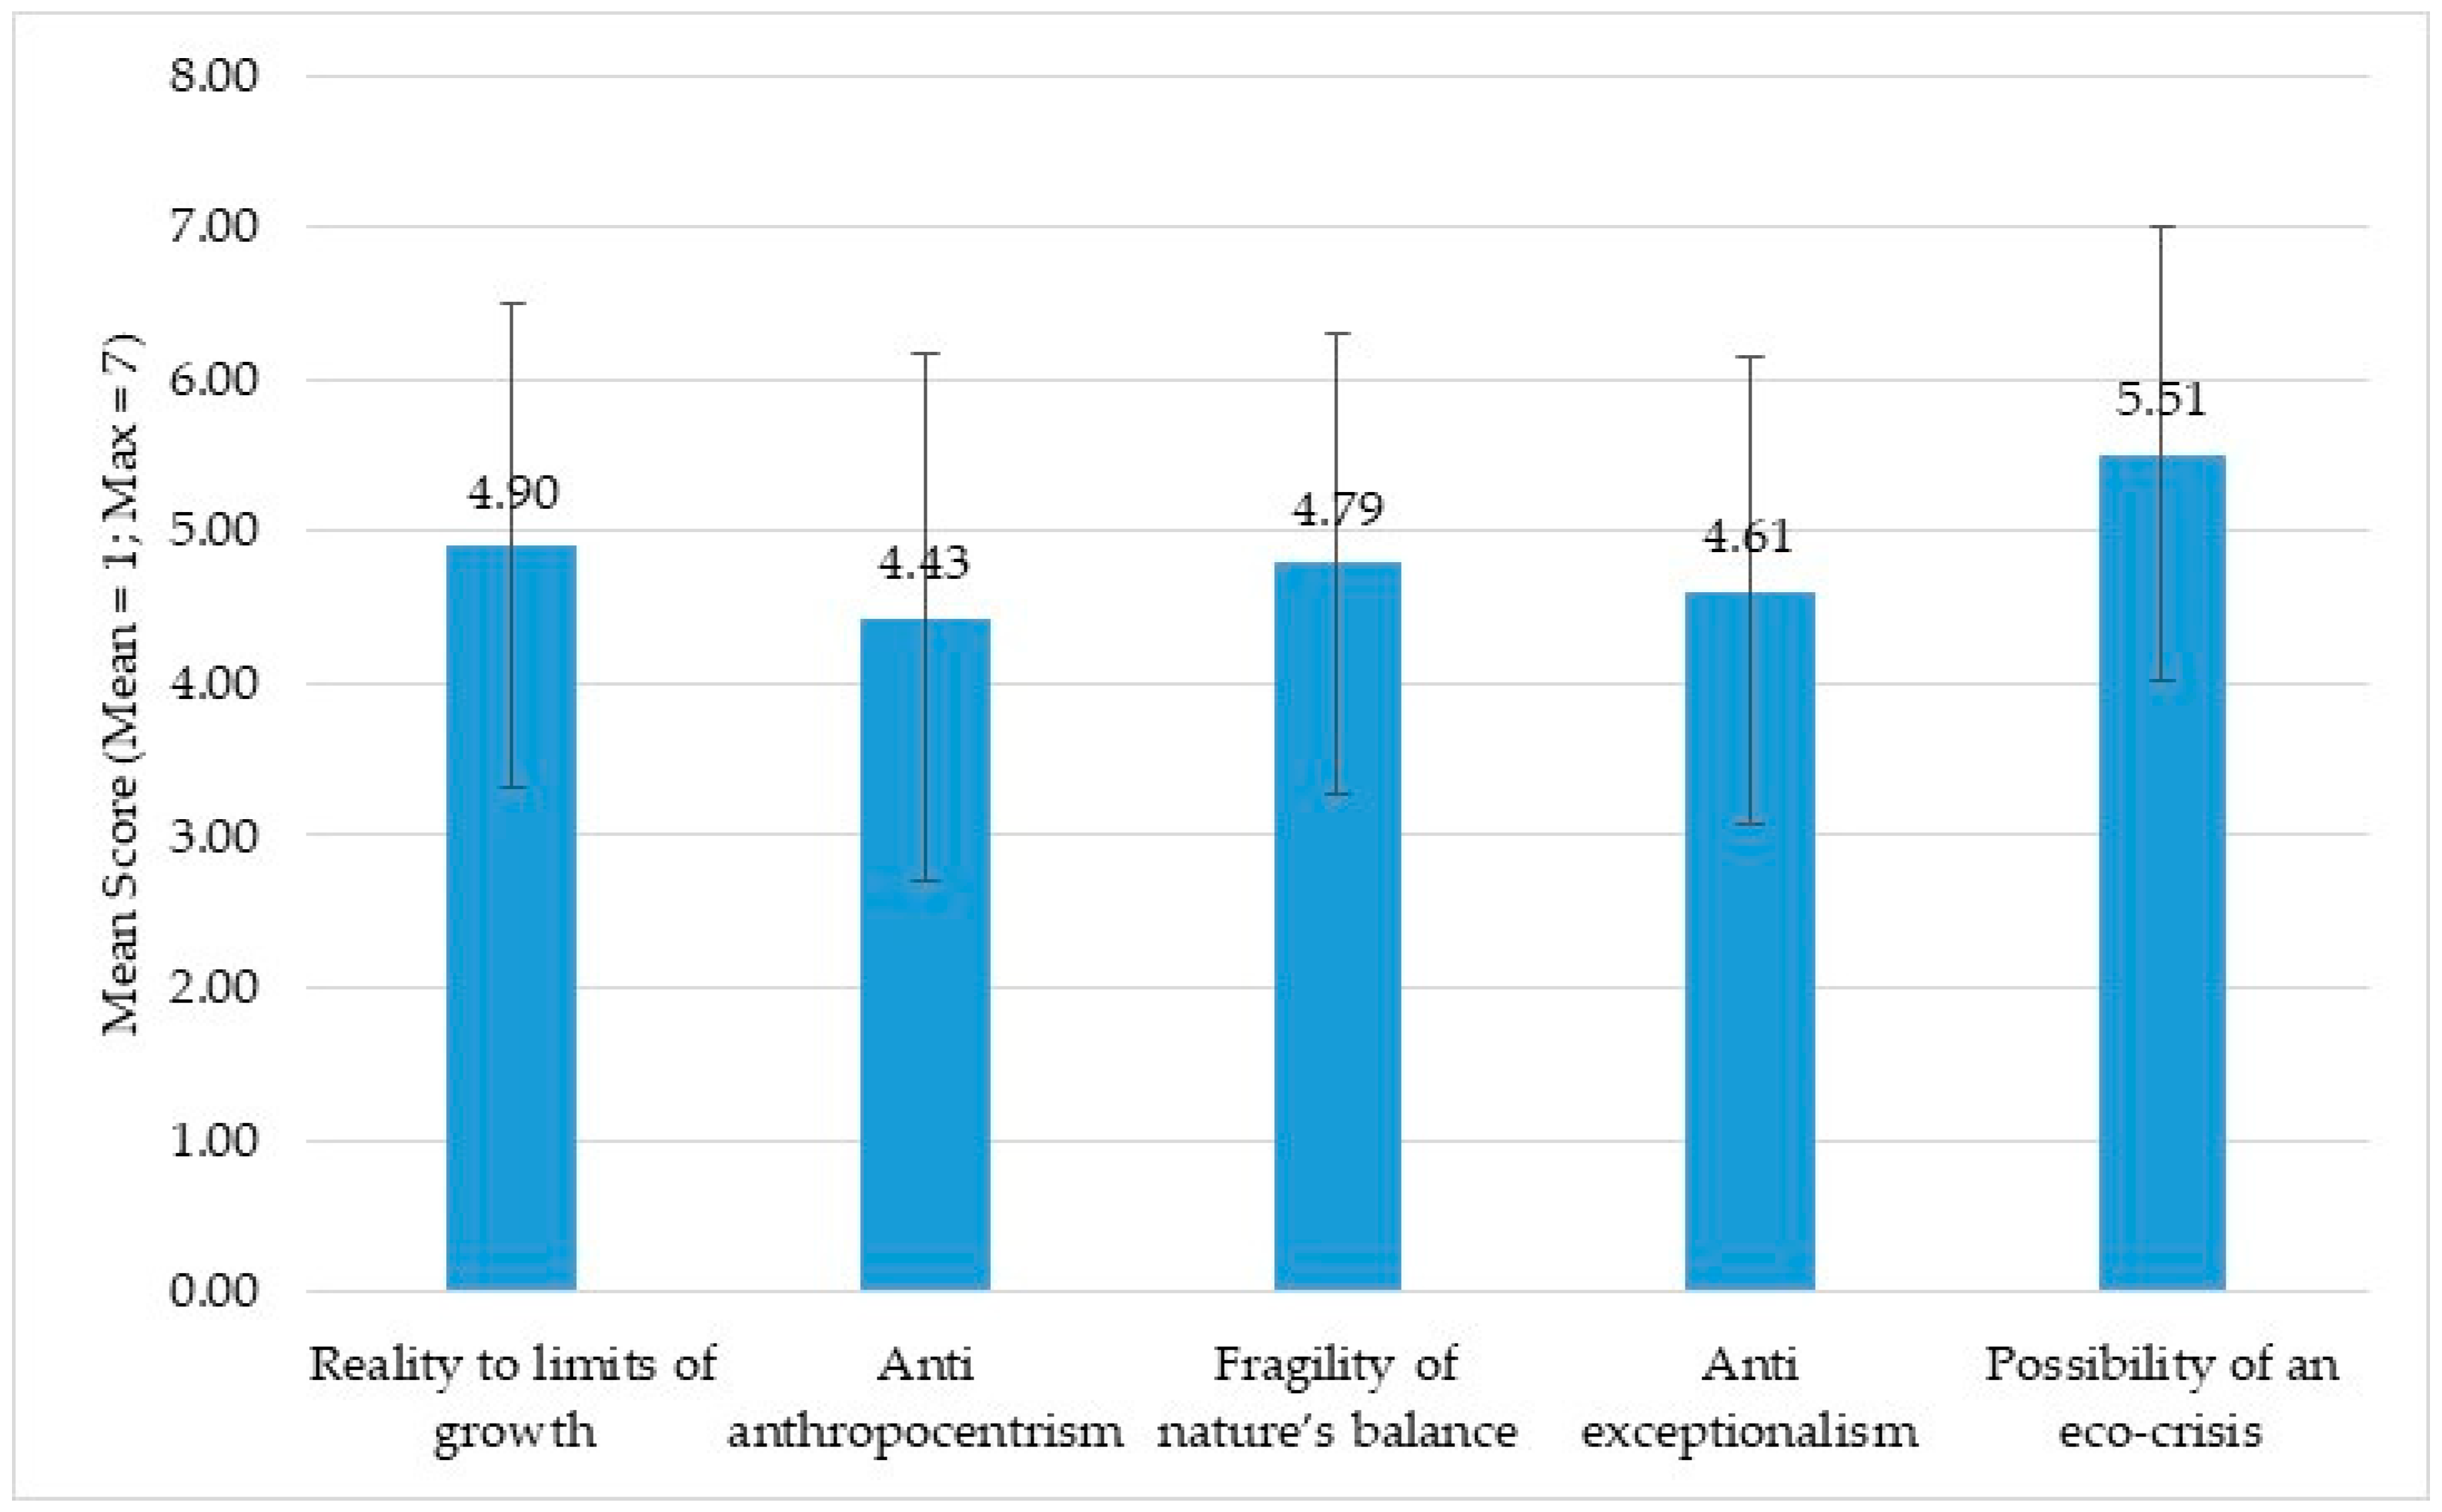
Examining the NEP Scale’s variables scores enabled the measurement and evaluation of the environmental concern of the respondents. NEP Scale variables are measured using a 7-point Likert scale. The scale items are coded from 1 = “strongly disagree” to 7 = “strongly agree”, while 4 is “neutral”. The following Table 4 sums up the agreement and disagreement statements’ cumulative percent, as well as the undecided statement’s percent. This modification improves result interpretation [18]. Negative phrases are reverse-coded. Mean scores for the five facets of the NEP Scale are presented in Figure 4.
Based on the following Figure 4, we conclude that the dominant social paradigm does not characterize the respondents, meaning that they do not believe that humans are superior to other all other species, the Earth provides unlimited resources, and that progress is an inherent part of human history [19]; thus, they are preferably characterized by a pro-NEP attitude and seem environmentally sensitive. Furthermore, standard deviations are relatively low (anti-anthropocentrism has the lowest one), which means that the respondents’ views are somewhat similar.
Figure 4 depicts the respondents’ mean scores according to the five NEP subscales (components), as they are obtained from the PCA and presented in the literature review section.
In the aftermath of the analysis, we test the possible differences between environmental awareness as captured by NEP Scale mean scores and respondents’ demographics. According to comparable studies [18,20], respondents’ demographics are statistically related to the mean NEP score index. Furthermore, in a recent study, income and area of residence were found to be related to respondents’ positive view towards renewable energy sources [21]. Using a one-sample Kolmogorv-Smirnov test [22], it was concluded that the NEP mean score is normally distributed (p-value = 0.196); thus, one-way Analysis of Variance (ANOVA) will be applied to test the significance of the difference between the means of demographics and NEP Scale mean score.
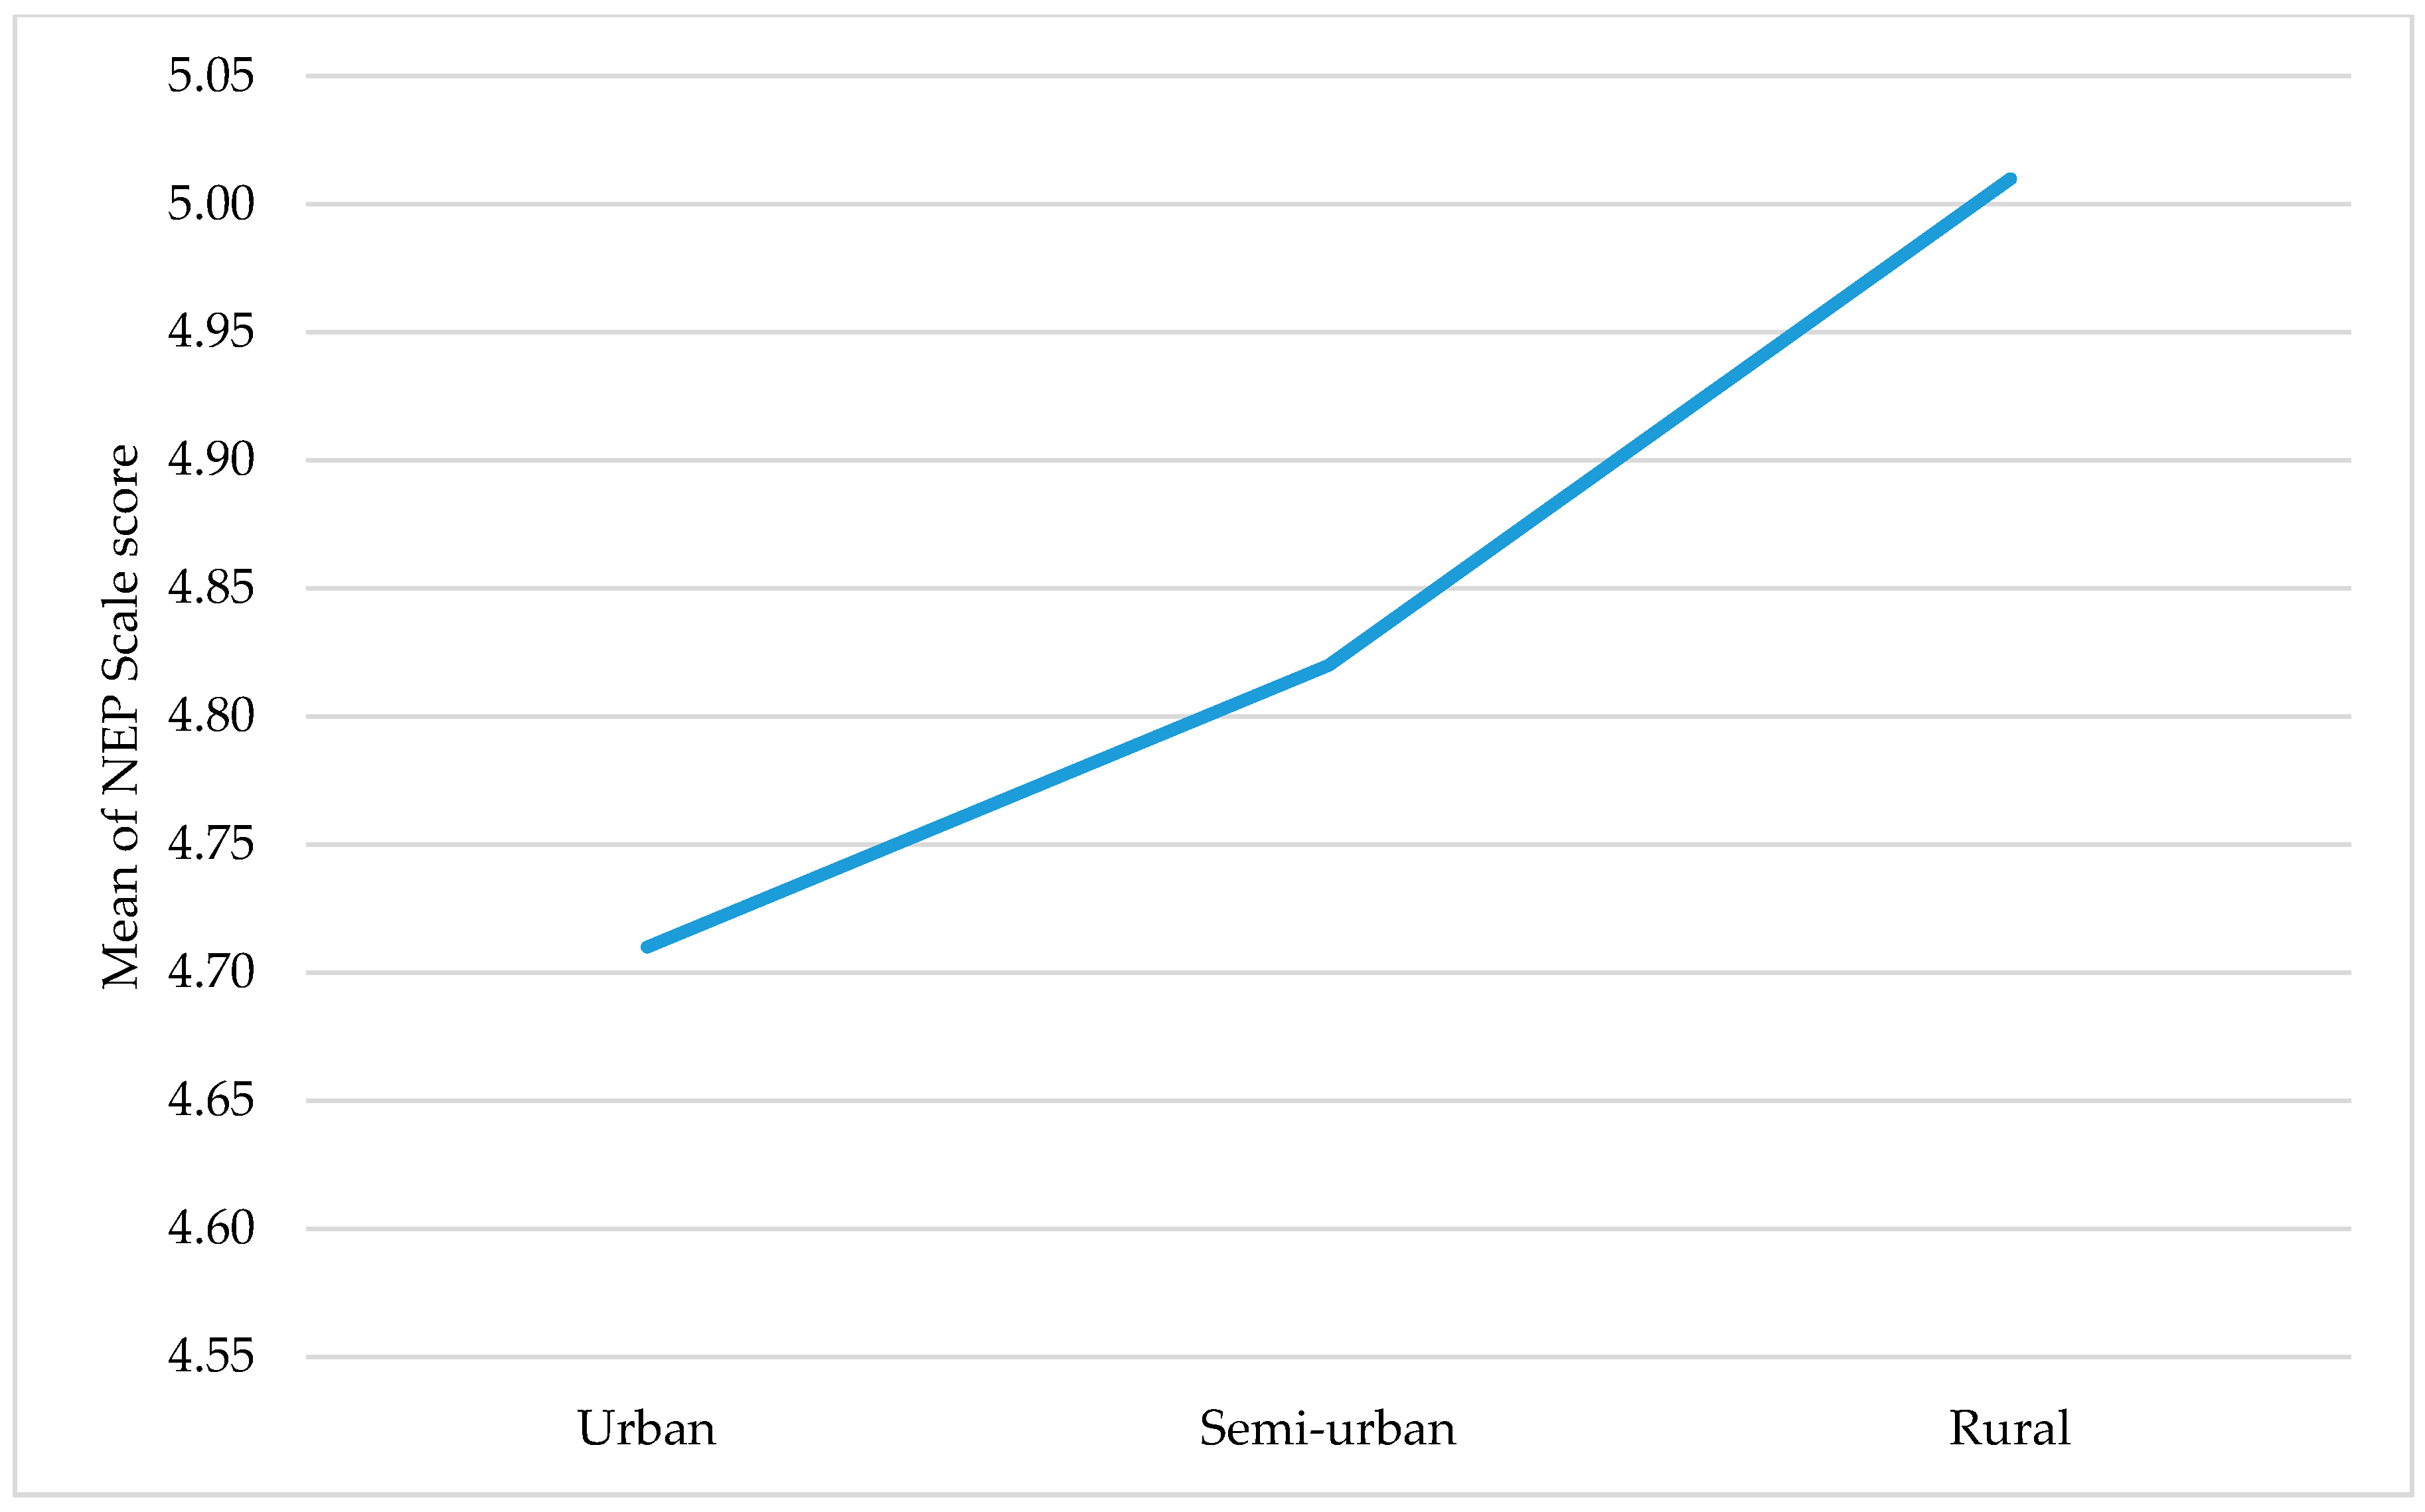
The one-way ANOVA results presented in Figure 5 reveal that there is no statistically significant difference between the means of the NEP score and respondents’ gender (p-value = 0.264), education (p-value = 0.938), occupation (p-value = 0.171) and income (p-value = 0.163); on the contrary, the test revealed a statistically significant difference between the NEP Scale score and respondents’ place of residence (p-value = 0.000). By looking at Figure 5, we see that the mean score on the NEP Scale is higher in rural than in the semi-urban and urban areas of residence. This is an important finding, since people in rural and agricultural areas who live close to the natural environment seem to appreciate it more as they are in direct contact with it. As the distance between the place of residence and nature increases, it seems that the inner ecological beliefs become weaker. Post Hoc tests show a statistically significant difference between rural and urban areas of residence (p-value = 0.000) and rural and semi-urban areas of residence (p-value = 0.030), while there is no statistically significant difference between the urban and semi-urban areas of residence (p-value = 0.263).
In order to further examine the NEP Scale score and the impact of the five facets, a multiple regression model is constructed. The NEP Scale score is set as the dependent variable, while NEP Scale components (Table 3) as derived from the PCA are the independent ones. All the variables are normally distributed (p-value > 0.05). Based on the following Table 4, we present Equation (3), which describes the relationship between NEP Scale scores and its subscales:
According to the adjusted R-squared index, Equation (3) explains 96.3% of NEP Scale score variance, but there is no autocorrelation in the residuals as proved by Durbin-Watson’s test value which is equal to 2.01. According to the coefficient values in Table 5, the subscale “reality to limits of growth (COMP_1)” is the most important subscale in explaining NEP Scale score conformation, while, the least important one is “anti-exceptionalism (COMP_4)”.
At this point, we annotate that the highly adjusted R squared index can be explained since all the PCA’s components are added in the regression model. The purpose is to have the highest adjusted R squared with the least number of variables. In fact, in a regression model where only COMP_1 and COMP_2 are used, an adjusted R squared index equal to 0.727 is obtained, showing that these two are the variables with the most significant contribution. However, we used all the PCA’s components as our intention to see the effect of all the extracted components. Thus, in order to further test the significance of the models, the Akaike Information Criterion (AIC) will be used [23]. Comparing the AIC’s value for Equation (3) model which is equal to 15.11 and this of the model including only COMP_1 and COMP_2 where the AIC’s value is equal to 16.68, we conclude that the model of Equation (3) has the most parsimonious fit, outperforming the other.
According to several studies, the NEP Scale score can affect willingness to pay (WTP) for renewable energy expansion [24,25]. A first indication is obtained by using the independent samples t-test. More specifically, the binary variable “WTP”, which represents respondents’ willingness to pay for a further expansion of green energy into the energy mix, will be the grouping variable for an independent samples t-test concerning the New Environmental Paradigm Scale (NEP) mean scores, as presented in Table 6.
According to Levene’s test for equality of variances result, p-value = 0.001 is used for the t-test for equality of means. Based on this, a statistically significant difference for the NEP score mean is recorded; the NEP score mean is higher in the group of respondents who declare a positive willingness to pay for renewable energy. To further examine the above-recorded tendency, a binary logistic regression model was constructed. In this model, willingness to pay is the dependent variable, while NEP score and respondents’ demographics are the independent ones. The model’s initial category concerning respondents’ willingness to pay is the negative one, Table 6.
Based on the following Table 6, Equation (4) is presented, describing the relationship between willingness to pay for green energy and the independent variables that are statistically significant:
The optimal solution is found after three iterations, where R2 = 14.9%. The Hosmer and Lemeshow test [26] indicates that the total model is statistically significant (p-value > 0.05). Based on the binary logistic regression equation, two of the independent variables are correlated with WTP. These variables are the mean NEP score and respondents’ income.
From the interpretation of the coefficients, we notice that by keeping income unchanged, an increase of one unit for the NEP score reduces the likelihood that a person will not accept additional payment for WTP expansion (WTP = no) by 1 − Exp(B) = 1 − 0.617 = 0.383 = 38.3%. Furthermore, by keeping the NEP score unchanged, the probability of a person staying in the null category of “no”, concerning the additional payment, is 1 − Exp(B) = 1 − 0.829 = 0.171 = 17.1%. This means that environmental sensitivity as expressed by the NEP Scale affects respondents’ WTP more than their income.
As it is already argued, a statistically significant relationship exists between the NEP score and income. We expand on this finding in Table 7, by examining the impact of the additional amount of money respondents are willing to pay for the expansion of renewable energy. For this reason, the 5-point Likert scale capturing the additional payment intention (“Amount”) is set as the dependent variable in an ordinal regression model, while NEP score and demographics are the independent ones.
Based on the results of the above Table 7, it can be stressed that both the NEP score and income are statistically significant variables. However, it is noted that income is partially statistically significant in the low category and high categories.
According to the estimates, it is noteworthy that people with lower income are less likely to spend an additional amount of money than people with annual income higher than 30000 Euros (Income = 7). Furthermore, the NEP Scale is positively correlated with respondents’ willingness to pay for further expansion of green energy into the energy mix energy. This model explains 32.5% of the dependent variable’s variance as indicated by the Nagelkerke Pseudo R-Square [27].
To assess model validity, it is of the utmost importance to point out that the regression coefficients are the same for all the categories, as provided by the test of parallelism, provided in Table 8; thus, the ordinal regression model is appropriately selected for this case. Furthermore, all the model’s predictors are necessary, as the final model fitting shows. Finally, by using Pearson’s and deviance goodness of fit tests, it is perceived that the model fits well with the data, according to the significance level p-values.
5. Discussion
Based on the conducted analysis, it is noteworthy that the broader context of NEP-driven conceptualization and development are oriented to treat the NEP as a measure of ecological beliefs or commonly shared worldviews, through research works of theoretical modelling, environmental attitudes, and valued behaviors through the following [1]:
- Implementation of the NEP Scale can be considered via sophisticated social-psychological models of environmental concern and behavior, or via risk perception and a growing tendency for economists to predict willingness to pay in contingent valuation studies. In addition, research attempts to develop NEP scaling into children teaching, by using a standard Likert-type format with wording changes to make it suitable for use with children at school age. This NEP scaling approach for children learning is appreciated as a novel tool that can be adapted to games appropriate for first- and second-grade children, which should stimulate investigations of ecological worldviews among them [1,11].
- Environmental education-both formal and informal education ranged from the elementary to university levels- has continued to help instill an ecological worldview among younger generations. In fact, evidence suggests that even short tutorial programs may stimulate an increase in NEP scores among children and college students. Also, adults born in the 60s and 70s retain an environmental sensibility and highly developed environmental consciousness. Again, it is apparent that environmental skepticism has become widespread, as publicly debated issues are promoting the anti-environmental message of conservative elites, such as upon the contentious issue of the significance of global warming [1].
- Re-establishing momentum towards societal adoption of an NEP (ecological paradigm) in the short-term will depend on a broad spectrum of socio-economic and institutional reforms including: political changes and institutionalization of leadership types that promote scientific understanding of ecological conditions over environmental skepticism. Long-term perspectives of NEP scaling should rely upon the ability of scientists, citizens, and policymakers in acknowledging the reality of ecological deterioration while considering highly divergent interpretations of ecological realities. Focusing on worldview changes seems to be particularly crucial relative to the usefulness and prosperity of the NEP scaling, and this is one of the most challenging issues of the NEP scaling in this regard [1].
Furthermore, it was reported that upon using alpha index to determine a single global construct and its reliability it seems to be considered a questionable practice to congregate items across what were meant to be multiple distinctive dimensions. Besides, psychometric theories of scale development and measurement can provide advice upon validity and reliability in measuring attitudes. Under the context of a psychometric theory, formative validity and construct validity have been proven, which can be straightforward to the readers [5]. Therefore, a replicable process of constructing items and/or measures is of utmost importance. Upon measuring reliability, the scale items and measures should be reliable, thus measuring the same thing and getting the same result, regardless the many times you measure it. Moreover, reliability is a necessary precursor of predictability, whereas validity (face, content, semantic, and construct) is a necessary precursor to reliability. It is axiomatically possible for someone to obtain very reliable measures that are not valid; consistent scales that are not commensurate concerning what they measure are of little value [5].
- However, the authors’ research [5] suggested that for a scale to be externally valid and internally consistent, there are several benchmarks for ‘performance’. Among others, these benchmarks ensure formative validity of research, that is, that the necessary steps taken to ensure that face, semantic and content validity are considered in the research design process. Without these formative steps, any construct validation using alpha or some other measure of reliability is valued as baseless [5].
- Cronbach’s alpha tool should be valued as the only means to establish reliability of the measure rather than applying more complex psychometric testing using exploratory factor analysis and confirmatory factor analysis. In only using alpha to determine the reliability, researchers must sum items to generate a single measure. Nevertheless, this approach sustains two drawbacks: a) Cronbach’s alpha is sensitive to the number of items in the scale and will converge after about 12 items; and b) to use Cronbach’s alpha, it is assumed that there is validity of the items which, as identified earlier, may be problematic [5].
- Somewhat inconsistent data identify the criticism over NEP scaling and concerns regarding its application. Two significant issues relate to the dimensionality of the NEP Scale and the internal consistency (alpha) of the NEP dimensions. Different NEP approaches can have different alpha levels, both overall, and item specific. This is due to the sample characteristics (such as the variance in the standard deviations indicating differences between samples), as well as due to differences in the scale itself [5]. Cronbach’s alpha is sensitive to the number of items included in a scale. Therefore, the higher the number of items, the larger the coefficient recorded. It is noteworthy that more than about 12 items in the scale will increase the coefficient [5]. Deployment of the revised NEP and the original NEP Scales support several commonalities, but the revised NEP has reported sustaining an alpha in the range which would be considered acceptable, that is, greater than 0.7 [5]. It is implied that some of this may be an artefact of the size of the scale, not merely because it is unidimensional.
- Besides the uni-dimensionality caution regarding items, the homogeneity is also a somewhat suspicious aspect, since it is advised that homogeneity (a single common factor) is one goal of classical test theory on which alpha is based. Therefore, it was argued that internal consistency is evident when there is a high degree of inter-relatedness between items. Thus, a longer scale can have a high alpha but not a commensurately high level of homogeneity [5]. In such a NEP Scale-based study, it was reported that there is a high alpha for the revised NEP but not the original NEP analysis, both having low levels of homogeneity. This fact implied that there are multiple dimensions; however, they are not the dimensions suggested in the original conceptualization of the scale. Under this literature framework, the NEP Scale applicability can be conceptualized as follows:
- There are few studies devoted to the application of the NEP Scale in the Greek context, while no study for the association between NEP and willingness to pay for a further expansion of RES was reported, as far as the authors are concerned.
- The mean value of the NEP Scale can be feasibly associated with various variables concerning general environmental attitudes, such as those examining willingness to pay for green electricity [13].
- It can be helpful for Greek citizens to promote ecological awareness and self-motivated environmentally responsible attitudes as initially captured by tools such as the NEP Scale and further embedded in the context of “smart cities” and information technologies that promote sustainability [28,29,30].
6. Conclusions
This study revealed that the respondents in the area of Evia-Greece are NEP inspired, meaning that they adopt an ecological worldview. The possibility of an eco-crisis has the highest score amongst the components of the NEP Scale while the understanding that growth must be controlled has the second highest score, reveling that respondents are ecologically sensitive. Particularly, concerning respondents’ beliefs about the depletion of natural resources on Earth (NEP Scale’s component 1) these are the utmost important components in shaping their total NEP score, as shown by the regression analysis.
The mean NEP score was found to be statistically different between respondents who live in urban and rural areas. Respondents in rural areas have a higher mean NEP score and thus increased ecological sensitivity compared to those with a permanent residence in urban areas. This finding suggests that an important variable that could be used to further study the degree of ecological sensitivity is the proximity and access frequency to elements of the natural environment.
The NEP score also was found to be correlated with respondents’ willingness to pay for an expansion of renewables into the Greek energy mix. The most remarkable component of this correlation was that the NEP score was more important in shaping WTP for renewable energy than respondents’ income. This is a significant outcome, as in relevant studies, WTP for renewable energy was found to be correlated with environmental sustainability which is one of the principal outstanding goals to be achieved by humanity [13,31]. Thus, promoting the principles of NEP among people will have a significant contribution in shaping the ecological consciousness to motivate them towards the notion of environmental sustainability.
The study confirmed the importance of promoting peoples’ ecological consciousness as in this way, environmental sustainability would be a feasibly accomplished goal. Based on this analysis, there are opening new avenues for future research. The first one concerns the ways of increasing Greek peoples’ NEP score by raising their environmental awareness through actions such as educational reformation and activities (at municipal and city levels) for bringing people closer to the natural environment. Furthermore, an issue of further analysis is how the NEP score is applied in different populations [7] and how it is affected by variables such as the area of residence and income. Lastly, future research works should be oriented to examine the possible effects of NEP score in shaping modern economic development as there is already evidence for the correlation between renewable energy usage, environmental sustainability, and broader socio-economic development [31,32,33,34,35].
Author Contributions
S.N., M.S., and M.C. collected the data, carried out the implementation and performed the calculations and the computer programming. G.K., and G.A., gathered and implemented all the theoretical background of the paper, and having input from the experimental development, they reviewed and discussed the results of the study as well. S.N., M.S. and G.K. performed the overall grammar check based on the narrative and its amendment throughout the text content.
Funding
This research received no external funding.
Conflicts of Interest
The authors declare no conflict of interest.
References
- Dunlap, R. The new environmental paradigm scale: From marginality to worldwide use. J. Environ. Educ. 2008, 40, 3–18. [Google Scholar] [CrossRef]
- Hawcroft, L.J.; Milfont, T.L. The use (and abuse) of the new environmental paradigm scale over the last 30 years: A meta-analysis. J. Environ. Psychol. 2010, 30, 143–158. [Google Scholar] [CrossRef]
- Xiao, C.; Buhrmann, J. The structure and coherence of the new environmental paradigm: Reconceptualizing the dimensionality debate. Hum. Ecol. Rev. 2017, 23, 179–199. [Google Scholar] [CrossRef]
- López-Bonilla, L.M.; López-Bonilla, J.M. From the new environmental paradigm to the brief ecological paradigm: A revised scale in golf tourism. Anatolia 2016, 27, 227–236. [Google Scholar] [CrossRef]
- Brennan, L.; Binney, W.; Aleti, T.; Parker, L. Why validation is important: An example using the NEP Scales. Mark. Soc. Res. 2014, 22, 15–31. [Google Scholar]
- Ntanos, S.; Arabatzis, G.; Tsiantikoudis, S. Investigation of the relationship between ecological sensitivity and renewable energy investment acceptance by using the NEP Scale. In Proceedings of the CEUR Workshop Proceedings, Chania, Greece, 21–24 September 2017; Volume 2030, pp. 561–570. [Google Scholar]
- Dunlap, R.E.; Van Liere, K.D.; Mertig, A.G.; Jones, R.E. New trends in measuring environmental attitudes: Measuring endorsement of the new ecological paradigm: A revised NEP Scale. J. Soc. Issues 2000, 56, 425–442. [Google Scholar] [CrossRef]
- Park, E.; Lee, S.-J.; Lee, C.-K.; Kim, J.-S.; Kim, N.-J. An integrated model of travelers’ pro-environmental decision-making process: The role of the New Environmental Paradigm. Asia Pac. J. Tour. Res. 2018, 23, 935–948. [Google Scholar] [CrossRef]
- Luo, Y.; Deng, J. The new environmental paradigm and nature-based tourism motivation. J. Travel Res. 2008, 46, 392–402. [Google Scholar] [CrossRef]
- Grúňová, M.; Sanéa, M.; Cincera, J.; Kroufek, R.; Hejcmanová, P. Reliability of the new environmental paradigm for analysing the environmental attitudes of Senegalese pupils in the context of conservation education projects. Environ. Educ. Res. 2018. [Google Scholar] [CrossRef]
- Taskin, O. The environmental attitudes of Turkish senior high school students in the context of postmaterialism and the new environmental paradigm. Int. J. Sci. Educ. 2009, 31, 481–502. [Google Scholar] [CrossRef]
- Putrawan, I.M. Measuring new environmental paradigm based on students’ knowledge about ecosystem and locus of control. Eurasia J. Math. Sci. Technol. Educ. 2015, 11, 325–333. [Google Scholar] [CrossRef]
- Ntanos, S.; Kyriakopoulos, G.; Chalikias, M.; Arabatzis, G.; Skordoulis, M. Public perceptions and willingness to pay for renewable energy: A case study from Greece. Sustainability 2018, 10, 687. [Google Scholar] [CrossRef]
- Hellenic Statistical Authority. B04, Greek Population Census 2011 by Gender and Marital Status by Regional Units and Municipalities. Available online: http://www.statistics.gr/el/statistics/-/publication/SAM03/2011 (accessed on 3 March 2017). (In Greek).
- Griekenland Vakantie. Map of Greece Depicting the Study Area, Island of Evia. Available online: http://www.unesco.org/education/information/pdf/333_52.pdf (accessed on 27 December 2018).
- Baltas, A.E.; Dervos, A.N. Special framework for the spatial planning & the sustainable development of renewable energy sources. Renew. Energy 2012, 48, 358–363. [Google Scholar]
- Eng, J. Sample Size Estimation: How Many Individuals Should Be Studied? Radiology 2003, 227, 309–313. [Google Scholar] [CrossRef] [PubMed]
- Ogunbode, C.A. The NEP Scale: Measuring ecological attitudes/worldviews in an African context. Environ. Dev. Sustain. 2013, 15, 1477–1494. [Google Scholar] [CrossRef]
- Kilbourne, W.E.; Beckmann, S.C.; Thelen, E. The role of the dominant social paradigm in environmental attitudes: A multinational examination. J. Bus. Res. 2002, 55, 193–204. [Google Scholar] [CrossRef]
- Uysal, M.; Jurowski, C.; Noe, F.P.; McDonald, C.D. Environmental attitude by trip and visitor characteristics: US Virgin Islands National Park. Tour. Manag. 1994, 15, 284–294. [Google Scholar] [CrossRef]
- Ntanos, S.; Ntanos, A.; Salmon, I.; Ziatas, T. Public awareness on Renewable Energy Sources: A case study for the Piraeus University of Applied Sciences. In Proceedings of the 5th International Symposium and 27th National Conference on Operational Research, Athens, Greece, 9–11 June 2016; pp. 18–23. Available online: http://eeee2016.teipir.gr/ConferenceBookHELORS2016.pdf#page=18 (accessed on 9 October 2018).
- Lilliefors, H.W. On the Kolmogorov-Smirnov test for normality with mean and variance unknown. J. Am. Stat. Assoc. 1967, 62, 399–402. [Google Scholar] [CrossRef]
- Sakamoto, Y.; Ishiguro, M.; Kitagawa, G. Akaike Information Criterion Statistics; D. Reidel: Dordrecht, The Netherlands, 1986; p. 81. [Google Scholar]
- Kotchen, M.J.; Reiling, S.D. Environmental attitudes, motivations, and contingent valuation of nonuse values: A case study involving endangered species. Ecol. Econ. 2000, 32, 93–107. [Google Scholar] [CrossRef]
- Cooper, P.; Poe, G.L.; Bateman, I.J. The structure of motivation for contingent values: A case study of lake water quality improvement. Ecol. Econ. 2004, 50, 69–82. [Google Scholar] [CrossRef]
- Hosmer, D.W.; Hosmer, T.; Le Cessie, S.; Lemeshow, S. A comparison of goodness-of-fit tests for the logistic regression model. Stat. Med. 1997, 16, 965–980. [Google Scholar] [CrossRef]
- Menard, S. Applied Logistic Regression Analysis; Sage: Thousand Oaks, CA, USA, 2002. [Google Scholar]
- Lytras, M.D.; Visvizi, A. Who Uses Smart City Services and What to Make of It: Toward Interdisciplinary Smart Cities Research. Sustainability 2018, 10, 1998. [Google Scholar] [CrossRef]
- Lytras, M.D.; Visvizi, A. Rescaling and refocusing smart cities research: From mega cities to smart villages. J. Sci. Technol. Policy Manag. 2018, 9, 134–145. [Google Scholar]
- Visvizi, A.; Lytras, M.D.; Damiani, E.; Mathkour, H. Policy making for smart cities: Innovation and social inclusive economic growth for sustainability. J. Sci. Technol. Policy Manag. 2018, 9, 126–133. [Google Scholar] [CrossRef]
- Ntanos, S.; Skordoulis, M.; Kyriakopoulos, G.; Arabatzis, G.; Chalikias, M.; Galatsidas, S.; Batzaios, A.; Katsarou, A. Renewable Energy and Economic Growth: Evidence from European Countries. Sustainability 2018, 10, 2626. [Google Scholar] [CrossRef]
- Koçak, E.; Şarkgüneşi, A. The renewable energy and economic growth nexus in Black Sea and Balkan countries. Energy Policy 2017, 100, 51–57. [Google Scholar] [CrossRef]
- Azam, M.; Khan, A.Q.; Zafeiriou, E.; Arabatzis, G. Socio-economic determinants of energy consumption: An empirical survey for Greece. Renew. Sustain. Energy Rev. 2016, 57, 1556–1567. [Google Scholar] [CrossRef]
- Ntanos, S.; Kyriakopoulos, G.; Chalikias, M.; Arabatzis, G.; Skordoulis, M. A Social Assessment of the Usage of Renewable Energy Sources and Its Contribution to Life Quality: The Case of an Attica Urban Area in Greece. Sustainability 2018, 10, 1414. [Google Scholar] [CrossRef]
- Papageorgiou, A.; Skordoulis, M.; Trichias, C.; Georgakellos, D.; Koniordos, M. Emissions trading scheme: Evidence from the European Union countries. In Communications in Computer and Information Science; Kravets, A., Shcherbakov, M., Kultsova, M., Shabalina, O., Eds.; Springer International Publishing: Cham, Switzerland, 2015; pp. 222–233. [Google Scholar]
Figure 1.
Main aspects of the literature review section concerning the New Environmental Paradigm (NEP) Scale.
Figure 1.
Main aspects of the literature review section concerning the New Environmental Paradigm (NEP) Scale.

Figure 2.
Map of Greece showing the area of study, Evia prefecture [15].
Figure 2.
Map of Greece showing the area of study, Evia prefecture [15].

Figure 3.
Presentation of the steps included in the results section.

Figure 4.
Mean scores and standard deviation for the five New Environmental Paradigm (NEP) subscales.
Figure 4.
Mean scores and standard deviation for the five New Environmental Paradigm (NEP) subscales.

Figure 5.
Means plot for the one-way ANOVA between the New Environmental Paradigm scale (NEP) mean score and the area of residence.
Figure 5.
Means plot for the one-way ANOVA between the New Environmental Paradigm scale (NEP) mean score and the area of residence.


Table 1.
Sample demographics.
| Demographics | Frequency | % Percent | |
|---|---|---|---|
| Gender | Male | 195 | 53.3 |
| Female | 171 | 46.7 | |
| Age | 18–30 | 104 | 28.4 |
| 31–40 | 114 | 31.1 | |
| 41–55 | 102 | 27.9 | |
| 56–65 | 39 | 10.7 | |
| 65+ | 7 | 1.9 | |
| Area of residence | Urban | 119 | 32.5 |
| Semi-Urban | 140 | 38.3 | |
| Rural | 107 | 29.7 | |
| Education | Primary school | 25 | 6.9 |
| High school | 214 | 58.5 | |
| Vocational Training | 24 | 6.6 | |
| University | 77 | 21.0 | |
| MSc/PhD | 26 | 7.1 | |
| Income | Less than 5000€ | 86 | 23.5 |
| 5001–10,000 € | 101 | 27.6 | |
| 10,001–15,000 € | 81 | 22.1 | |
| 15,001–20,000 € | 48 | 13.1 | |
| 20,001–25,000 € | 31 | 8.5 | |
| 25,001–30,000 € | 12 | 3.3 | |
| More than 30,000 € | 7 | 1.9 | |
| Occupation | Farmer | 28 | 7.7 |
| Housekeeper | 26 | 7.1 | |
| Private employee | 114 | 31.1 | |
| State employee | 78 | 21.3 | |
| Freelancer | 59 | 16.1 | |
| Trader | 10 | 2.7 | |
| Student | 24 | 6.6 | |
| Unemployed | 27 | 7.4 |
Table 2.
Total variance explained by components.
| Component | Initial Eigenvalues | ||
|---|---|---|---|
| Total | % of Variance | Cumulative % | |
| 1 | 2.484 | 16.559 | 16.559 |
| 2 | 2.313 | 15.423 | 31.982 |
| 3 | 1.440 | 9.599 | 41.581 |
| 4 | 1.161 | 7.739 | 49.320 |
| 5 | 1.063 | 6.417 | 55.737 |
| 6 | 0.932 | 6.214 | 61.951 |
| 7 | 0.903 | 6.020 | 67.971 |
| 8 | 0.781 | 5.207 | 73.178 |
| 9 | 0.701 | 4.672 | 77.849 |
| 10 | 0.662 | 4.416 | 82.265 |
| 11 | 0.615 | 4.103 | 86.368 |
| 12 | 0.585 | 3.899 | 90.268 |
| 13 | 0.546 | 3.638 | 93.906 |
| 14 | 0.505 | 3.369 | 97.274 |
| 15 | 0.409 | 2.726 | 100.000 |
Table 3.
Principal component analysis for the 15 items of the New Environmental Paradigm Scale (NEP).
Table 3.
Principal component analysis for the 15 items of the New Environmental Paradigm Scale (NEP).
| NEP Scale Items (as Reported by Dunlap [1]) | Components | ||||
|---|---|---|---|---|---|
| 1 | 2 | 3 | 4 | 5 | |
| 1: “We are approaching the limit of the number of people the earth can support.” | 0.810 | ||||
| 2: “Humans have the right to modify the natural environment to suit their needs.” | 0.673 | ||||
| 3: “When humans interfere with nature it often produces disastrous consequences.” | 0.760 | ||||
| 4: “Human ingenuity will ensure that we do not make the earth unlivable.” | 0.660 | ||||
| 5: “Humans are severely abusing the environment.” | 0.766 | ||||
| 6: “The Earth has plenty of natural resources if we just learn how to develop them.” | 0.433 | ||||
| 7: “Plants and animals have as much right as humans to exist.” | 0.708 | ||||
| 8: “The balance of nature is strong enough to cope with the impacts of modern industrial nations.” | 0.516 | ||||
| 9: “Despite our special abilities, humans are still subject to the laws of nature.” | 0.477 | ||||
| 10: “The so-called ‘‘ecological crisis’’ facing humankind has been greatly exaggerated.” | 0.407 | ||||
| 11: “The Earth is like a spaceship with very limited room and resources.” | 0.824 | ||||
| 12: “Humans were meant to rule over the rest of nature.” | 0.477 | ||||
| 13: “The balance of nature is very delicate and easily upset.” | 0.716 | ||||
| 14: “Humans will eventually learn enough about how nature works to be able to control it.” | 0.691 | ||||
| 15: ”If things continue on their present course, we will soon experience a major ecological catastrophe.” | 0.556 | ||||
Table 4.
Responses concerning New Environmental Paradigm Scale (NEP) items.
| NEP Scale’s Dimensions | NEP Scale’s Items | Cumulative Percent 1 | Mean | S.D. | ||
|---|---|---|---|---|---|---|
| A | D | N | ||||
| COMP_1: Reality to limits of growth | 1 | 59.84 | 18.58 | 21.58 | 4.77 | 1.60 |
| 6 | 78.14 | 11.20 | 10.66 | 5.62 | 1.51 | |
| 11 | 48.36 | 32.79 | 18.85 | 4.30 | 1.67 | |
| COMP _2: Anti-anthropocentrism | 2 | 34.15 | 54.37 | 11.48 | 3.55 | 1.92 |
| 7 | 77.32 | 9.56 | 13.11 | 5.62 | 1.49 | |
| 12 | 45.36 | 34.15 | 20.49 | 4.13 | 1.78 | |
| COMP _3: Fragility of nature’s balance | 3 | 83.33 | 8.47 | 8.20 | 5.73 | 1.47 |
| 8 | 25.14 | 53.55 | 21.31 | 3.44 | 1.57 | |
| 13 | 69.67 | 14.75 | 15.57 | 5.19 | 1.50 | |
| COMP _4: Anti-exceptionalism | 4 | 43.99 | 28.96 | 27.05 | 4.28 | 1.54 |
| 9 | 71.04 | 11.48 | 17.49 | 5.26 | 1.42 | |
| 14 | 47.54 | 32.24 | 20.22 | 4.28 | 1.65 | |
| COMP _5: Possibility of an eco-crisis | 5 | 85.25 | 7.10 | 7.65 | 5.93 | 1.35 |
| 10 | 60.93 | 25.68 | 13.39 | 4.73 | 1.79 | |
| 15 | 84.97 | 5.46 | 9.56 | 5.87 | 1.33 | |
| Mean total NEP score | 4.85 | 1.57 | ||||
1 A refers to “agree, D refers to “disagree” and, U refers to “neutral” statements.
Table 5.
Multiple linear regression model for the New Environmental Paradigm Scale (NEP) mean score, coefficients and diagnostic tests.
Table 5.
Multiple linear regression model for the New Environmental Paradigm Scale (NEP) mean score, coefficients and diagnostic tests.
| NEP–Regression Model | Unstandardized Coefficients (B) | Pearson’s Correlation Coefficient Values | p-Values |
| (Constant) | 4.846 | 0.000 | |
| COMP _1 | 0.425 | 0.695 | 0.000 |
| COMP _2 | 0.303 | 0.495 | 0.000 |
| COMP _3 | 0.174 | 0.285 | 0.000 |
| COMP _4 | 0.113 | 0.185 | 0.000 |
| COMP _5 | 0.236 | 0.387 | 0.000 |
| Diagnostic Tests | Tests Values | p-Values | |
| Adjusted R-squared | 0.963 | ||
| Durbin-Watson | 2.010 | ||
| ANOVA | 0.000 |
Table 6.
Independent sample t-test between Willingness to Pay for green energy expansion (WTP) and mean New Environmental Paradigm Scale score (NEP) with diagnostic tests.
Table 6.
Independent sample t-test between Willingness to Pay for green energy expansion (WTP) and mean New Environmental Paradigm Scale score (NEP) with diagnostic tests.
| Levene’s Test for Equality of Variances | T-test for Equality of Means | ||||
| NEP Score | F | p-Value | p-Value | Mean Difference | Std. Error Difference |
| Equal variances assumed | 1.837 | 0.176 | 0.001 | 0.210 | 0.066 |
| Equal variances not assumed | 0.002 | 0.210 | 0.067 | ||
| Group Statistics | |||||
| WTP | Mean of NEP Score | Std. Deviation | Std. Error Mean | ||
| Yes | 4.98 | 0.632 | 0.055 | ||
| No | 4.77 | 0.586 | 0.038 | ||
Table 7.
Binary logistic regression model examining willingness to pay for green energy expansion (WTP), coefficients and diagnostic tests.
Table 7.
Binary logistic regression model examining willingness to pay for green energy expansion (WTP), coefficients and diagnostic tests.
| WTP–Logit Regression Model Variables | Coefficients (B) | Std. Error of (B) | p-Value (sig) | Odds Ratio (Exp(B)) |
| Income | −0.187 | 0.084 | 0.025 | 0.829 |
| NEP | −0.483 | 0.209 | 0.021 | 0.617 |
| (Constant) | 3.156 | 1.064 | 0.003 | 23.478 |
| Diagnostic Tests | Tests Values | p-Values | ||
| Step 3 | Cox & Snell R Square | 0.111 | ||
| Nagelkerke R Square | 0.149 | |||
| Hosmer and Lemeshow | 0.482 | |||
| Overall predicted percentage correct | 61.0 |
Table 8.
Ordinal regression model for the Additional payment “Amount”, parameter estimates and diagnostic tests.
Table 8.
Ordinal regression model for the Additional payment “Amount”, parameter estimates and diagnostic tests.
| Estimate 1 | Wald | df | p-Values | ||
| Threshold | Amount = 1 | −0.152 | 0.004 | 1 | 0.000 |
| Amount = 2 | 1.145 | 0.253 | 1 | 0.000 | |
| Amount = 3 | 2.793 | 1.491 | 1 | 0.000 | |
| Amount = 4 | 3.401 | 2.204 | 1 | 0.000 | |
| Amount = 5 | 5.442 | 5.397 | 1 | 0.000 | |
| Location | NEP | 0.595 | 4.503 | 1 | 0.034 |
| Income = 1 | −2.933 | 3.844 | 1 | 0.004 | |
| Income = 2 | −2.600 | 1.993 | 1 | 0.158 | |
| Income = 3 | −2.325 | 2.127 | 1 | 0.145 | |
| Income = 4 | −2.028 | 1.860 | 1 | 0.000 | |
| Income = 5 | −1.651 | 1.298 | 1 | 0.005 | |
| Income = 6 | −1.143 | 0.560 | 1 | 0.017 | |
| Income = 7 | 0 2 | 0 | |||
| Diagnostic tests | Tests values | p-values | |||
| Pearson goodness of fit | 0.753 | ||||
| Deviance goodness of fit | 0.989 | ||||
| Final model fitting | 0.006 | ||||
| General test of parallelism 3 | 0.567 | ||||
| Nagelkerke Pseudo R-Square | 0.325 | ||||
1 Only the statistically significant variables are included. 2 This parameter is set to zero because it is redundant. 3 The H0 states that the location parameters are the same across response categories.
© 2019 by the authors. Licensee MDPI, Basel, Switzerland. This article is an open access article distributed under the terms and conditions of the Creative Commons Attribution (CC BY) license (http://creativecommons.org/licenses/by/4.0/).
Share and Cite
MDPI and ACS Style
Ntanos, S.; Kyriakopoulos, G.; Skordoulis, M.; Chalikias, M.; Arabatzis, G. An Application of the New Environmental Paradigm (NEP) Scale in a Greek Context. Energies 2019, 12, 239. https://doi.org/10.3390/en12020239
AMA Style
Ntanos S, Kyriakopoulos G, Skordoulis M, Chalikias M, Arabatzis G. An Application of the New Environmental Paradigm (NEP) Scale in a Greek Context. Energies. 2019; 12(2):239. https://doi.org/10.3390/en12020239
Chicago/Turabian StyleNtanos, Stamatios, Grigorios Kyriakopoulos, Michalis Skordoulis, Miltiadis Chalikias, and Garyfallos Arabatzis. 2019. "An Application of the New Environmental Paradigm (NEP) Scale in a Greek Context" Energies 12, no. 2: 239. https://doi.org/10.3390/en12020239
Note that from the first issue of 2016, this journal uses article numbers instead of page numbers. See further details here.