Article

The Potential of Advanced Scatterometer (ASCAT) 12.5 km Coastal Observations for Offshore Wind Farm Site Selection in Irish Waters

1
MaREI Centre for Marine and Renewable Energy, Beaufort Building, Environmental Research Institute, University College Cork, Ringaskiddy, P43 C573, Ireland
2
Department of Geography, University College Cork, College Road, Cork, T12 ND89, Ireland
3
Odermatt & Brockmann GmbH, CH-8006 Zürich, Switzerland
*
Author to whom correspondence should be addressed.
Energies 2019, 12(2), 206; https://doi.org/10.3390/en12020206
Submission received: 16 November 2018 / Revised: 21 December 2018 / Accepted: 29 December 2018 / Published: 9 January 2019
(This article belongs to the Section A: Sustainable Energy)

Abstract

:
The offshore wind industry has seen unprecedented growth over the last few years. In line with this growth, there has been a push towards more exposed sites, farther from shore, in deeper water with consequent increased investor risk. There is therefore a growing need for accurate, reliable, met-ocean data to identify suitable sites, and from which to base preliminary design and investment decisions. This study investigates the potential of hyper-temporal satellite remote sensing Advanced Scatterometer (ASCAT) data in generating information necessary for the optimal site selection of offshore renewable energy infrastructure, and hence providing a cost-effective alternative to traditional techniques, such as in situ data from public or private entities and modelled data. Five years of the ASCAT 12.5 km wind product were validated against in situ weather buoys and showed a strong correlation with a Pearson coefficient of 0.95, when the in situ measurements were extrapolated with the log law. Temporal variations depicted by the ASCAT wind data followed the same inter-seasonal and intra-annual variations as the in situ measurements. A small diurnal bias of 0.12 m s−1 was observed between the descending swath (10:00 to 12:00) and the ascending swath (20:30 to 22:30), indicating that Ireland’s offshore wind speeds are slightly stronger in the daytime, especially in the nearshore areas. Seasonal maps showed that the highest spatial variability in offshore wind speeds are exhibited in winter and summer. The mean wind speed extrapolated at 80 m above sea level showed that Ireland’s mean offshore wind speeds at hub height ranged between 9.6 m s−1 and 12.3 m s−1. To best represent the offshore wind resource and its spatial distribution, an operational frequency map and a maximum yield frequency map were produced based on the ASCAT wind product in an offshore zone between 20 km and 200 km from the coast. The operational frequency indicates the percentage of time during which the observed local wind speed is between cut-in (3 m/s) and cut-out (25 m/s) for a standard turbine. The operational frequency map shows that the frequency of the wind speed within the cut-in and cut-off range of wind turbines was between 92.4% and 97.2%, while the maximum yield frequency map showed that between 40.6% and 59.5% of the wind speed frequency was included in the wind turbine rated power range. The results showed that the hyper-temporal ASCAT 12.5 km wind speed product (five consecutive years, two observations daily per satellite, two satellites) is representative of wind speeds measured by in situ measurements in Irish waters, and that its ability to depict temporal and spatial variability can assist in the decision-making process for offshore wind farm site selection in Ireland.

1. Introduction

In recent years, there has been growing interest in renewable energy technologies, due to the combined need of providing energy security for the future and reaching current greenhouse gas (GHG) emission reduction targets. According to the European Environment Agency (EEA), the potential offshore wind energy of Europe was seven times the European energy demand in 2009 [1], which means there was, and still is, much unrealised potential for further offshore renewable energy development. Following investment in renewable energy, 90% of the global offshore wind farms operating in 2014 were located in Northern Europe [2] and, by 2016, the European coasts were host to more than 3500 offshore wind turbines distributed across 81 wind farms, delivering a cumulative total of 12.6 GW of power [3]. It has been predicted that further development will lead to a European production of offshore wind power between 20–50 GW by 2050 [4].
Offshore wind energy has multiple advantages over land-based wind farms. For example, the offshore winds are normally stronger, steadier, and more abundant [2,5,6], which generally leads to lower wind variations and therefore reduces the periods of no electricity generation [2]. Additionally, the offshore annual capacity factor of wind energy can be between 20% and 40% higher than land-based sites [7]. In Europe, the average offshore wind turbine has the capacity to power 3300 average households, in comparison with 1500 for its land-based counterpart [5]. Moreover, inland renewable energy projects can have reduced site availability due to multiple stakeholder interactions, environmental constraints, as well as aesthetic factors, while offshore sites may be more easily situated near coastal population centres [2,4,5,8]. Consequently, the offshore wind energy market grew by 34% in the European Union in 2013, in comparison with 12% for its land-based counterpart [9]. Furthermore, the offshore wind industry has undergone important development during the past ten years to increase energy capacity, as well as to develop structures that can be sited further offshore. Constraints such as water depth and distance to shore are becoming less binding due to the development of new technologies derived from the growing interest in Offshore Renewable Energy (ORE) markets [7]. Additionally, offshore wind power costs are expected to be reduced by about 45% by 2050 according to the Global Wind Energy Council [10].
Despite its advantages over land-based wind farms, certain technical, environmental, and economic constraints of ORE are still of relatively higher magnitude by comparison [6,7]. For example, the harsher conditions from the marine environment such as waves, salt water, storms, and ocean currents create challenges that must be considered in wind turbine technology and design, support structures, electrical infrastructure, and logistics of installation and maintenance. In addition, environmental impacts such as noise and vibration, toxic effects from lubricant and oil spills, electromagnetic fields from cables, and impacts on avian species are yet to be fully understood [7]. As a result of these issues, and because ORE is currently considerably more expensive to build than its land-based counterpart, ORE site development must rely heavily on accurate estimates and reliable assessments of the energy resource available. This is also critical for planning the location and Expected Annual energy Production (EAP) of ORE farms. Accurate knowledge of diurnal, seasonal, and intra-annual wind variability is extremely important to improve wind farm efficiency and calculate productivity scenarios to evaluate revenue risks [2].
Located on the periphery of Europe, and having the calm and shallow Irish Sea to the east and the strong and powerful Atlantic Ocean to the west, Ireland has enormous potential to generate wind power [11]. Ireland contributed 25 MW of Europe’s offshore wind power in 2016, which is predicted to increase to 4.5 GW by 2030, according to the 2014 Irish Offshore Renewable Energy Development Plan (OREDP) [12]. In other words, Ireland’s offshore wind energy would have the potential of powering 4.5 million homes per annum by 2030 [13]. However, the majority of Ireland’s ORE potential still remains unexploited, as reflected in the large investment in support for ORE research recently, and emerging market opportunities in the ORE sector [14]. Due to Ireland’s extensive marine territory, reliable ORE site selection approaches are required for integration into national and international Marine Spatial Planning strategies; however, to the best of the authors’ knowledge, only one publically available ORE site selection study has been conducted in Ireland thus far. This study, conducted by the European Union FP7 “Off-shore Renewable Energy Conversion platforms—Coordination Action” project (ORECCA), used geospatial multicriteria analysis to investigate the best location for hybrid offshore wind and wave energy system development in Irish and other European waters. ORECCA identified multiple exclusion zones dictated by other users such as aquaculture, navigation routes, marine archaeology sites, underwater cables, areas with environmental restrictions, seascape degradation or other pre-existing ORE sites, and showed that the west coast of Ireland hosts the best potential location for combined floating wind and wave energy projects compared to other Western European countries [15].
Studies like the ORECCA project usually calculate Wind Power Density (WPD) as a first step in determining suitable locations for wind farm development plans [2]. Traditionally, offshore in situ meteorological measurements derived from wind masts or offshore buoys are used to build energy density maps. Unfortunately, due to their elevated costs, these data are limited in number and sparsely located which limit their efficiency to provide detailed wind climate characteristics. Alternatively, offshore wind fields may be obtained from numerical prediction models, and also from satellite remote sensing [2,6]. With the advantage of being able to retrieve ocean surface winds under all weather conditions during both day- and night-time, passive microwave radiometers are typically used to provide wind speeds, while active microwave scatterometers have been providing both wind speed and wind direction data for the last three decades. Even though scatterometers tend to overestimate low wind speeds (<5 m s−1) due to low signal-to-noise ratio issues [16,17,18] and underestimate high wind speeds (>13 m s−1) [6], most satellite derived products perform well at moderate wind speeds (5–13 m s−1). The wind speed at which offshore wind turbines reach maximum energy yield (rated power) is usually around 10–12 m s−1 [8,19], which means that satellite remote sensing has great potential for accurately estimating rated power needed in site selection studies.
Scatterometers show varying levels of accuracy and, apart from wind speed, rain and land contamination may also affect the reliability of wind speed retrievals. However, the MetOp Advanced Scatterometer (ASCAT) instruments have been shown to provide robust estimates of wind speed even in rainy conditions due to their use of the C-band, which is less sensitive to the effect of rain on the backscatter signal than Ku-band instruments [16,17,18]. In addition, the ASCAT instruments have been shown to provide reliable wind data relatively closer to the coast than other instruments affected by land contamination, when utilising the Land Contribution Ratio formula (LCR) approach, making it possible to acquire wind vectors a few kilometres away from the shore [16]. This agrees with findings by Verhoef et al. [20], who showed that the ASCAT 12.5 km wind product was valid within 12–20 km from the coastline. With a global coverage of approximately twice daily at Ireland mean latitude, a spatial resolution of 12.5–25 km, an accuracy of ±2 m s−1 [2,21], and wind retrievals which have shown very good agreement to in situ wind measurements (e.g., [6,22,23,24,25,26,27]) across the MetOp platforms [23] at global and regional scales, the Metop ASCAT-A and -B instruments seem to be ideal candidates to showcase the potential of satellite remote sensing in ORE site selection studies. Despite the interest, an optimal ORE site selection study incorporating satellite-derived wind information has not been conducted for Irish waters yet.
Recognising Ireland’s much unrealised potential for ORE development, this study aims to exploit ASCAT-derived wind information to assess the potential of remote sensing in ORE optimal site selection and showcase this potential by retrieving wind power density, operational frequency, and maximum yield maps for Ireland, solely based on hyper-temporal (i.e., hundreds of images) satellite scatterometry. Based on this aim, the objectives of this study are to:
(1)
Validate wind speed time series derived from MetOp ASCAT-A and -B using in situ weather buoys to assess the ability of the ASCAT wind product to represent offshore wind speeds in Irish waters;
(2)
Use ASCAT wind speed time series to investigate inter- and intra-annual offshore wind speed variation, as well as diurnal variation, in order to assess the ability of the ASCAT wind product to depict temporal variability, essential to better prediction of power production scenarios from offshore winds in Ireland;
(3)
Investigate the seasonality of the spatial variation of ASCAT-derived wind speeds in Irish waters, and, thus, examine spatial patterns in offshore wind speed;
(4)
To the best of the authors’ knowledge, generate the first satellite-based wind power density, operational frequency and maximum yield frequency maps for Ireland to evaluate offshore wind power potential and available wind resource, and demonstrate the applicability of remote sensing data for use in wind ORE optimal site selection studies. This analysis will also serve to validate the multi-criteria site assessment methodologies being utilised in the Interreg project ARCWIND project to assess the offshore wind energy potential of the entire Atlantic Area Region. Whilst this validation will be specific to the Irish national waters, it will be possible to extrapolate to other regions.

2. Data and Methodology

2.1. ASCAT Scatterometer and Satellite Wind Product

ASCAT-A and -B are real aperture radars hosted on the MetOp-A and -B satellites, launched by the European Organisation for the Exploitation of Meteorological Satellites (EUMETSAT) in October 2006 and September 2012, respectively [28]. These remote sensing instruments record surface roughness (σo) at C-band frequency of 5.255 GHz. Two sets of beams, one on each side of the satellites, each covering 550 km-wide swaths, are used to determine wind speed and direction at 10 m (above sea level) a.s.l. at neutral conditions [15,25]. The MetOp satellites complete near global coverage in five days, observing 65% of the Earth daily [16] and follow similar orbits with a 48.93 min delay, with MetOp-A preceding MetOp-B. In Ireland, ASCAT observations are taken between 10:00 and 12:00 by descending day-time swaths, and 20:30 and 22:30 during the ascending night-time swaths. ASCAT data are available at 12.5 and 25 km resolutions. The higher spatial resolution data have performed better in previous studies, when validated with in situ measurements; for example, in the Iberian Peninsula [6], and in the tropical oceans and near Europe and North America [26]. As a result, the KNMI Global Wind Level-3 ASCAT 12.5 km coastal wind product was selected for this study and was downloaded from the Copernicus Marine Environment Monitoring Service (CMEMS) website (http://marine.copernicus.eu/services-portfolio/access-to-products/?option=comcsw&view= details&productid=WIND_GLO_WIND_L3_NRT_OBSERVATIONS_012_002). In total, 7300 images from ASCAT-A and ASCAT-B daily observations, both ascending and descending swaths, were downloaded for the period of 1 January 2012 to 31 May 2017 and 29 October 2012 to 31 May 2017, respectively. Apart from its spatial resolution, other advantages of the KNMI Global Wind Level-3 ASCAT 12.5 km coastal wind product include its temporal range covering five consecutive years from both ASCAT-A and -B instruments, its temporal resolution of two observations daily due to ascending and descending swaths, its C-band frequency which makes it mostly insensitive to rain compared to Ku-band instruments, as well as being easily accessible and free. In addition, the processed Level-3 product, which consists of pre-calibrated and georeferenced data mapped on a uniform space–time grid scale, allowed for direct use without preliminary manipulation [29].

2.2. Study Area and In Situ Wind Speed Data

The study area includes Ireland’s offshore waters defined by the Irish designated continental shelf (Figure 1) [30]. The in situ wind measurements were downloaded from the Marine Institute website (http://data.marine.ie/Dataset/Details/20972) for the period of 1 January 2012 to 31 May 2017, during which the following buoys were in operation: M2, M3, M4, M5, and M6 [31]. The offshore weather buoy hourly product corresponds to the mean wind speed recorded for a period of 10 min at 3 m a.s.l. [31].

2.3. Validation of ASCAT Wind Product

The ASCAT wind product was compared to in situ measurements from five weather buoys located around Ireland in order to validate the accuracy of the remotely sensed data. A total of 14,157 data match-ups were used to calculate Pearson’s Correlation Coefficient (r), the R-square value, the bias, the Root Mean Square Error (RMSE), the two-sided t-test p-values at 0.05 confidence level, and the 99% confidence interval.
The ASCAT wind product represents 10 m a.s.l. equivalent neutral wind speeds, in contrast with in situ weather buoy measurements, which are 3 m a.s.l. stability-dependent wind speeds, or actual wind. The log law (Equation (1)) was used to extrapolate the in situ measurements to 10 m a.s.l. to match the remotely sensed observations:
u = ln ( z z 0 ) ln ( z r z 0 ) × u r
where u is the wind speed (m s−1) at height z (m), ur is the known wind speed at reference height zr and is z0 the roughness length taken as 0.0002 m. In accordance with the methodology used by Carvalho et al. [6], the log law was chosen following the rationale that the average atmospheric stability would be close to neutral due to the high temporal coverage of this study.

2.4. Temporal and Spatial Variation of Ireland’s Offshore Wind

The data used for the ASCAT 12.5 km coastal product validation were also used to investigate Ireland’s offshore wind change in time and space. Inter-annual variation graphs and seasonal and diurnal maps were produced to investigate offshore wind speed spatial and temporal variations.

2.5. Ireland’s Offshore Wind Resource Assessment

2.5.1. Wind Extrapolation and Ireland’s Wind Energy Density Map

Following validation, the power law was used to extrapolate the Irish offshore mean wind speed derived from satellite data to a hub height of 80 m a.s.l. (cf. [9]). The wind power density formula [8] (Equation (2)) was then applied to the mean wind speed in order to produce an estimate of the wind energy available in Ireland’s offshore waters.
W = 1 2 ρ V 3
where W is wind power density (W m−2), V is wind speed (m s−1), and ρ is air density (kg m−3) which is taken as a constant value of 1.225 kg m−3.
Multiple studies have produced maps categorising the wind speed and power density into seven power classes [8,9,32]. Following the method used by Salvação and Soares [9] and Balog et al. [32], each raster cell was reclassified into a wind power class ranging from 1 to 7 (Table 1). This generated an annual mean power density map over a period of five years for Irish waters.

2.5.2. Operational Frequency and Maximum Yield Frequency Offshore Maps

Based on the turbine’s cut-in speed (2–3 m s−1), cut-off speed (25–30 m s−1) and rated power wind speed (10–12 m s−1) [8,19], it was possible to investigate the frequency at which power is generated and the frequency of the maximum energy yield for an area of 20 km to 200 km from the coast of Ireland. The operational frequency and maximum yield maps were produced using measurements ranging from 3 m s−1 to 25 m s−1 and from 10 m s−1 to 25 m s−1, respectively.

3. Results and Discussion

3.1. Remote Sensing Data Validation and Limitation

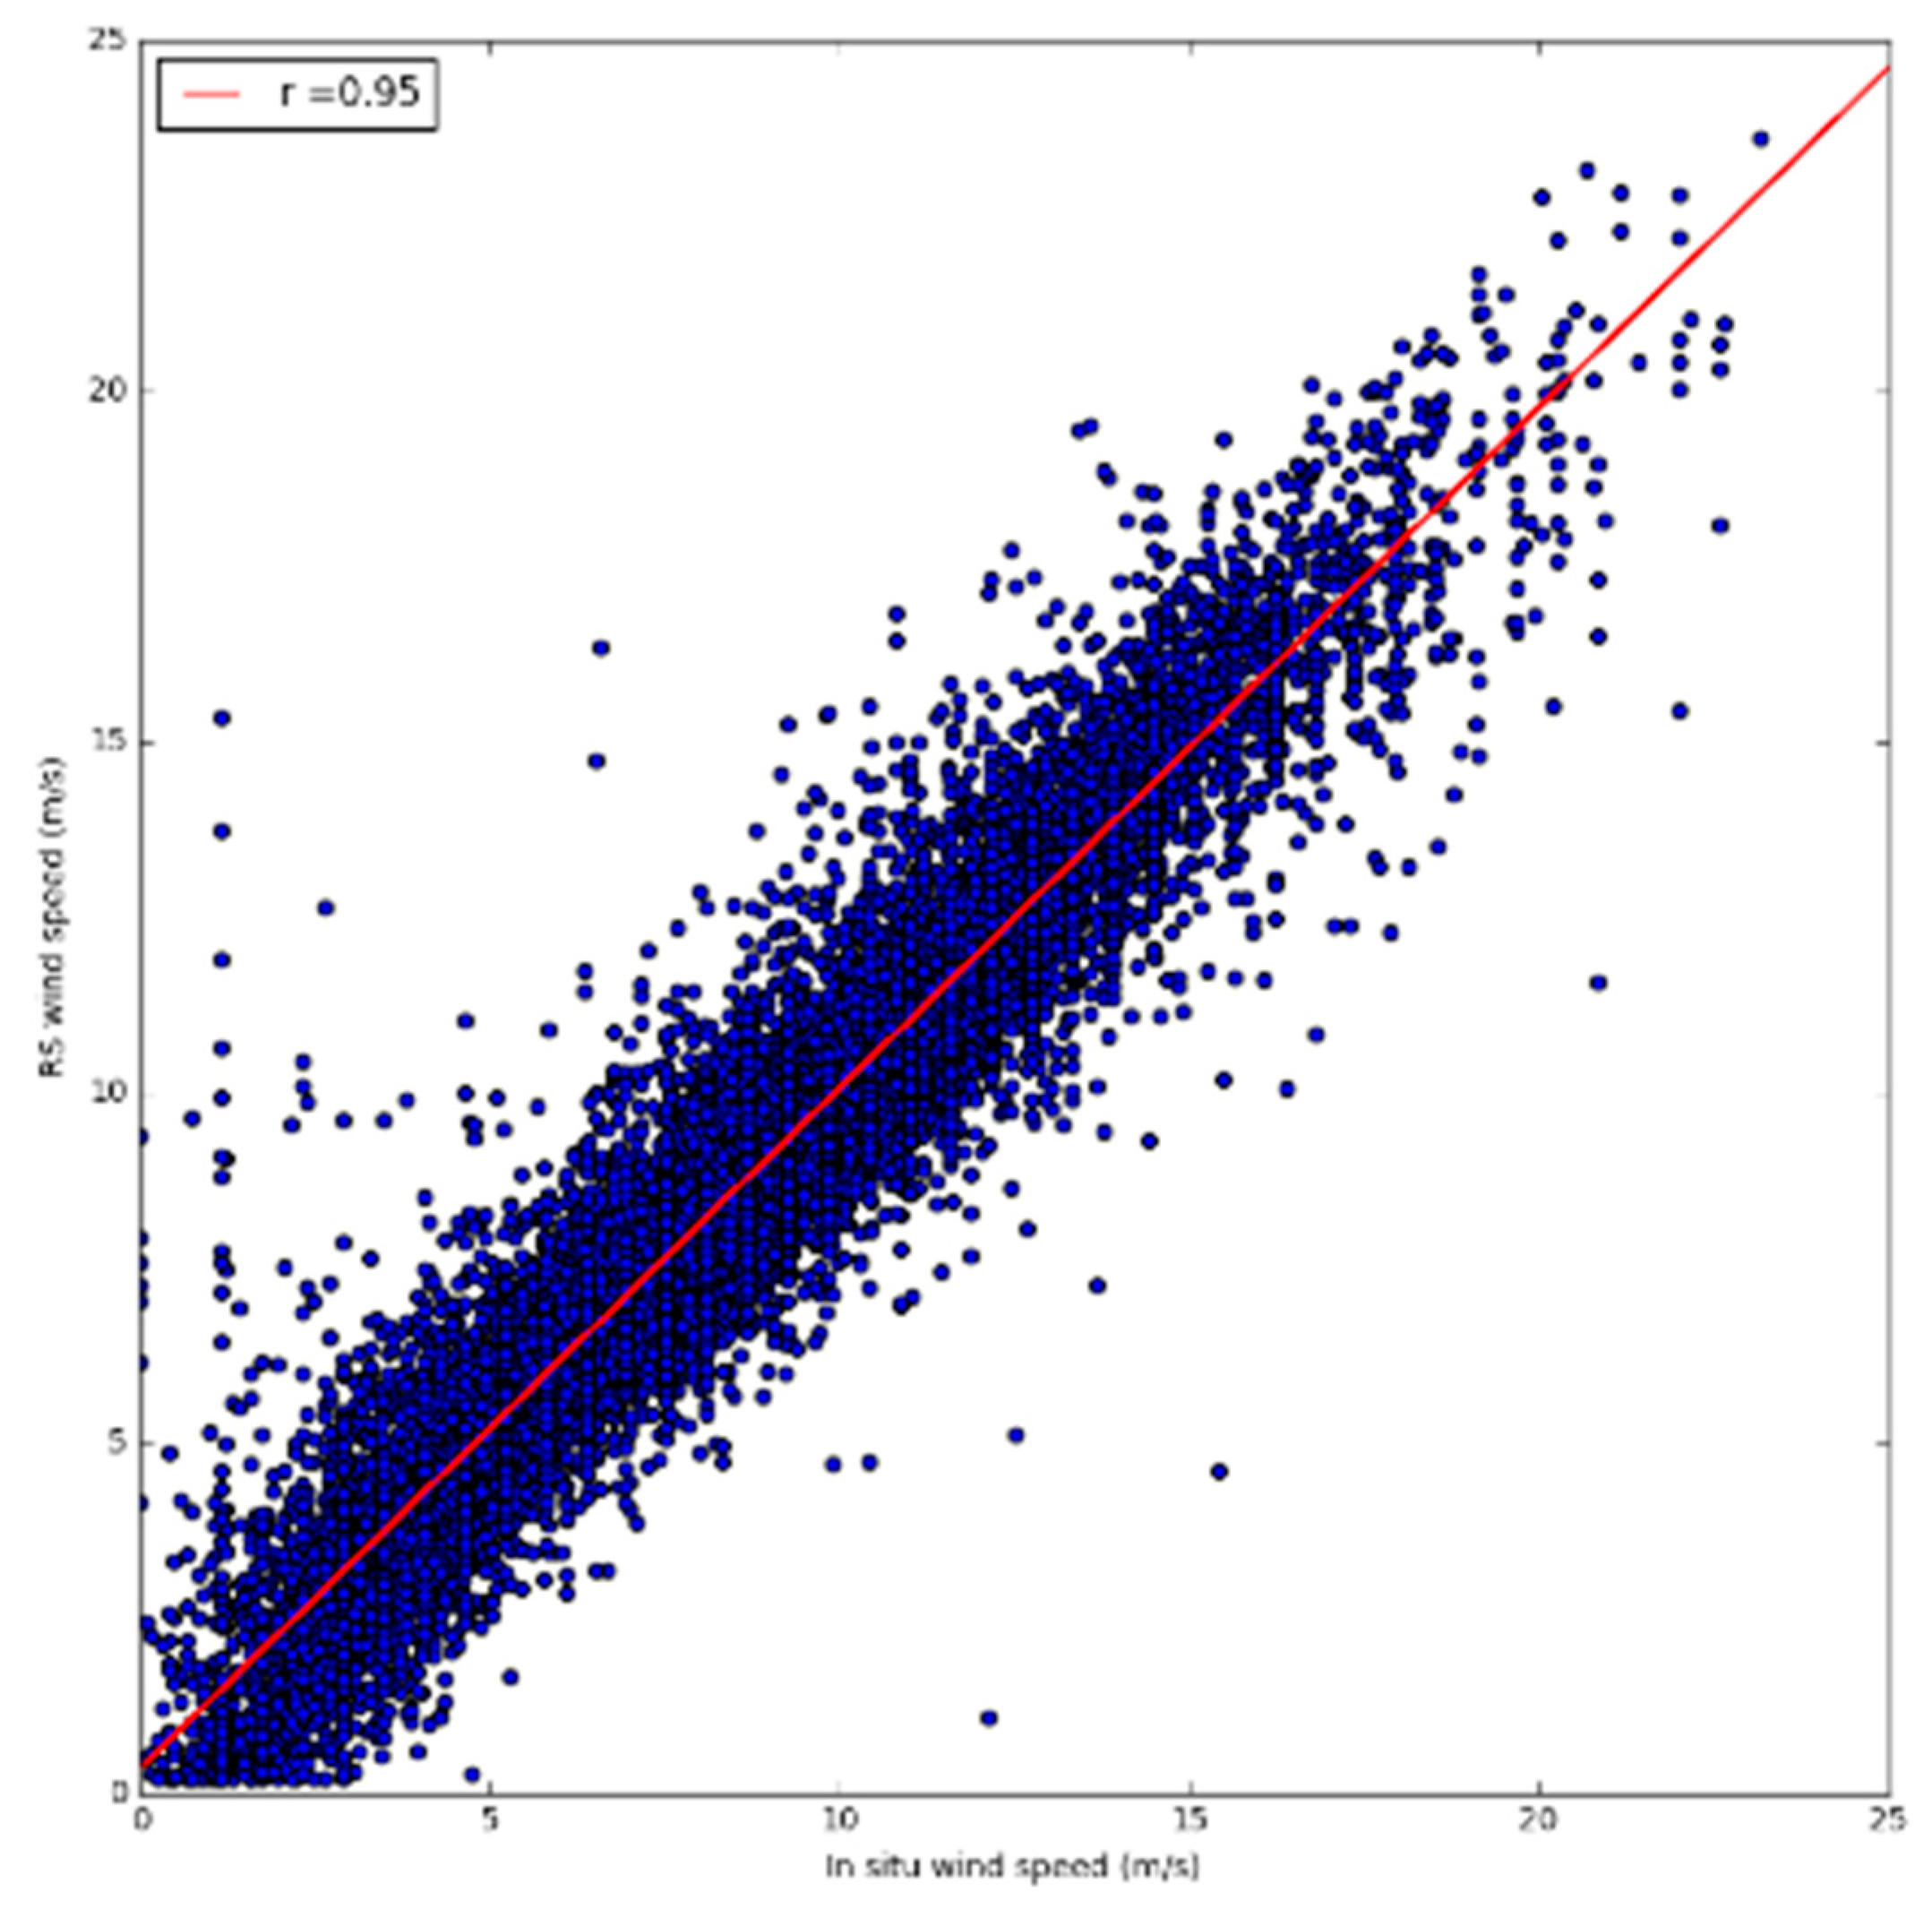
3.1.1. Remote Sensing Validation

A very strong positive linear relationship was observed between the ASCAT data and the in situ measurements. The Pearson coefficient (r) for the data collected at all sites (n = 14,157) had a value of 0.95 (Figure 2). The R-squared value 0.904, indicates that 90.4% of the remotely sensed data variability was explained by variations in the in situ dataset. In addition, the data indicated that the true slope of the regression line between the in situ measurements and the RS data lay between 0.962 and 0.978 at a 99% confidence level (Table 2). The two-sided t-test, with a degree of freedom of infinity (∞), resulted in p-values of 0.06. Since the p-value > 0.05, the null hypothesis (Ho) was accepted, indicating no significant differences between the RS data and the in situ measurements at a 5% significance level. The bias showed that the ASCAT data slightly overestimated the in situ wind speed by 0.09 m s−1. The RMSE of 0.904, which described a small spread of the measurements about the regression line, showed a good prediction of the RS data. The mean wind speed for the RS data was 8.68 m s−1, in comparison with 8.60 m s−1 for the in situ measurements. The RS data and the in situ measurements both followed a similar distribution (Figure 3). The skew and kurtosis analysis produced respective values of 0.31 and −0.091 for the RS data and 0.30 and −0.134 for the in situ measurements when combining the data from all the offshore buoys. Overall the results showed that the ASCAT 12.5 km coastal product was in very good agreement with the in situ measurements in Irish waters.

3.1.2. Wind Speed Dependent Bias

A wind speed dependent bias was observed when the wind speed was categorised in the following wind speed ranges: <4 m s−1, 4–8 m s−1, 8.01–12 m s−1 and >12 m s−1. The highest positive bias of 0.296 m s−1 corresponded with the lowest wind speed range, while the highest negative bias of −0.012 m s−1 was associated with the highest wind speed range. The smallest wind speed bias was 0.017 m s−1 which was found for the wind speed ranging between 8.01 m s−1 and 12 m s−1, while a bias of 0.139 m s−1 was observed for the wind speed ranging between 4 m s−1 and 8 m s−1. The prevalence of this bias at various wind speeds can be observed in Figure 3.
By examining the wind distribution histograms (Figure 3), it is possible to observe that the bias regarding different wind speeds will have bigger consequences for low wind speeds than for the high wind speeds. This will impact the wind power estimates for the development of offshore wind farms in Irish waters due to overestimation of the frequency of the wind above the cut-in speed of 2–3 m s−1, especially once the wind speed is extrapolated to 80 m a.s.l., caused by the wind speed increasing with elevation. However, Figure 3 also illustrates that the overestimation of the low wind speeds was higher for values below 2 m s−1, which is below the cut-in speed.
Equally, since the frequency of wind speeds exceeding 25 m s−1 was only 0.12% of the total wind when extrapolated at 80 m a.s.l. (Figure 3), this will have a minimal effect on the frequency of events exceeding the cut-off speed of 25–30 m s−1.
The cause of this bias is unclear; however, it is suspected that it may be due to the prevalence of non-neutral atmospheric stability and which would render the neutral form of the log law (Equation (1)) used for shearing the wind speed non-applicable. This matter, and the possibility of using ASCAT and other stability measures and metrics, such as those outlined in [33], to quantify the occurrence of non-neutral events, will be subject of a follow-up paper.

3.1.3. Land Contamination

The maps produced in this research showed that the biggest spatial variations were associated with the pixels closest to the coast. This can be attributed to land contamination, which has previously been observed to affect wind retrieval within 12–20 km (i.e., 1–2 pixel widths) from the coast line for the ASCAT 12.5 km product [6,20]. The data from this study were in agreement with these previous studies, as the cells showing the biggest spatial variation fell within 15 km from the Irish coast. However, Murphy et al. [15] estimated the best location for ORE developments to be between 20 and 50 km from the coast due to aesthetic effects on the seascape. This implies that coastal contamination on wind speed retrieval has little impact with respect to the use of remote sensing for offshore wind farm site selection.

3.2. Spatio-Temporal Variations

3.2.1. Inter-Annual Variation

The wind variations were consistent inter-annually between the RS data and the in situ measurements, showing monthly variation between the different years (Figure 4). The year 2013 showed the biggest annual range with mean wind speeds of 11.68 m s−1 and 11.11 m s−1 in December, and 5.74 m s−1 and 6.40 m s−1 in July for the satellite data and the in situ measurements, respectively. On the contrary, 2016 had the smallest range in mean annual wind speeds, from 6.90 m s−1 to 10.62 m s−1 for the RS data, and from 7.13m s−1 to 9.92 m s−1 for the in situ measurements. To set these inter-annual and inter-seasonal variations in context, hourly ensemble data at the buoy locations sheared to 10 m a.s.l. have been included in Figure 4 for comparison. Data are provided for a high wind (average wind speed of 11.29 m s−1) and a low wind speed (average wind speed of 8.18 m s−1) week.
The inter-annual bias shown by the RS data compared to the in situ values was negative for the summer months (May, June, July, and August), characterised by a lower wind speed mean (<7.82 m s−1), and positive with higher wind speed means in other months. The highest negative bias of −0.66 m s−1 was observed in July 2013 (the RS mean being 5.74 m s−1 compared to the in situ mean of 6.40 m s−1), and the highest positive bias of 0.57 m s−1 was observed in December 2013 (the RS mean being 11.68 m s−1 and in situ mean 11.11 m s−1).
Even though the mean and standard deviation showed very little discrepancy between the two sources of measurement, a clear pattern was evident where a negative bias wind speed occurred during the summer and a positive bias during the winter. This pattern correlated with Thomas et al.’s [34] observations that changes of atmospheric stability affect the relationship between stability-based and neutral wind speed measurements. In agreement with these authors, the hyper-temporal data from this research showed that during the summer, when stable atmospheric conditions occur, the stability dependent in situ measurements were higher than the neutral wind speeds derived from the RS data. However, during unstable atmospheric conditions predominant in the winter, the in situ measurements were lower than the satellite based observations. Therefore, the bias trend showed by the data from this research can be attributed to atmospheric stability, which changes depending on air–sea temperature fluxes.
For the purposes of using remotely senses observations for renewable energy site selection, this trend related to atmospheric stability is important to understand as winter observations will be more likely to overestimate the offshore wind speed, while the summer observations would be more prone to offshore wind speed underestimation. However, the data from this study highlighted that the bias across the five in situ locations ranged from −0.66 m s−1 in July 2013 to 0.56 m s−1 in December 2012, when looking at individual years. The bias was significantly lower when computing the mean of all the years studied, with a range of −0.29 m s−1 in July to 0.37 m s−1 in December. This demonstrates that increasing the number of observations (i.e., using a multi-temporal dataset) reduces the statistical uncertainty linked to the atmospheric stability changes.

3.2.2. Diurnal Variation

The diurnal variation was investigated by comparing the observations from the ascending (am) swaths to the descending (pm) swaths. Even though the mean ascending and descending maps showed a similar spatial distribution, the mean descending maps showed slightly stronger offshore winds at the southern and eastern parts of Ireland’s territorial waters than its ascending counterpart. This was further observed by a −0.12 m s−1 bias between the daytime and night-time observations, indicating that the ascending swaths recorded a weaker wind speed then the descending swaths. The mean descending swaths had a mean wind speed ranging between approximately 8.0 m s−1 and 10.4 m s−1, while the mean ascending overpasses ranged from approximately 7.8 m s−1 to 10.4 m s−1. The biggest difference between the two maps was located in the nearshore area of the country, with a wind speed higher by approximately 0.2 m s−1 in the evening.
Information on diurnal variation can also help site selection and development planning of offshore wind farms, as the power production must match the energy demand which increases in the evening. Increasing the amount of daily observations would help describe the diurnal variations of offshore wind speed in more detail, and increase the potential of RS data for ORE development applications.

3.2.3. Seasonal Variations

The seasonal offshore wind speed for Ireland’s territorial waters derived from ASCAT observations resulted in a mean wind speed of 11.76 m s−1 in winter (DJF), 9.17 m s−1 in spring (MAM), 7.31m s−1 in summer (JJA) and 9.31 m s−1 in autumn (SON). The standard deviation of the wind speed across the seasonal maps was indicative of the variation in the spatial distribution, which corresponded to 0.71 m s−1 in winter, 0.77 m s−1 in spring, 0.45 m s−1 in summer and 0.65 m s−1 in autumn.
The seasonal offshore wind speed distributions for Ireland are illustrated by seasonal maps in Figure 5. The biggest seasonal contrast was observed between the winter and summer maps. Offshore winds ranged from approximately 9.5 m s−1 to 12.5 m s−1 for the former, and from 6 m s−1 to 8 m s−1 for the latter (Figure 5). Even though the seasonal maps for spring and autumn looked similar, stronger winds near the southern and eastern coast of Ireland were observed in the autumn map. The wind speed ranged between approximately 8 m s−1 and 10.5 m s−1 for the autumn in comparison with a range of 7 m s−1 to 10.5 m s−1 in spring.
Mapping the seasonal wind speeds allowed the spatial variability in Irish waters to be discerned in more temporal detail. In addition, by extracting the cell values, it was possible to conduct statistical tests which provided valuable information on local variability. This tool can be of great interest for ORE site planning as it demonstrates the capability of remote sensing to identify changes in spatial pattern depending on seasonality. Product users may be able to select a sub-area and retrieve important information describing wind speed spatial statistics such as minimum and maximum, mean, standard deviation, and frequency of the wind speed over temporal ranges. Therefore, RS hyper-temporal data may have the potential to contribute to the prediction of seasonal energy production scenarios.

3.3. Ireland’s Offshore Wind Resource Assessment

3.3.1. Ireland’s Mean Offshore Wind and Power Density Maps

The mean offshore winds during 2012–2016 derived from ASCAT observations and extrapolated to 80 m a.s.l. had a mean of 11.25 m s−1 and a standard deviation of 9.44 m s−1. The 80 m offshore mean wind speed map (Figure 6) illustrated the stronger winds along the west coast of Ireland had than the east and south coast, with wind speeds ranging between 10.2 and 11.2 m s−1. The westerly extremity of Ireland’s designated continental shelf experienced the strongest winds, displaying values of 11.5 m s−1 to 12.3 m s−1, while the southern and eastern areas had the lowest mean wind speeds with values ranging between 9.6 m s−1 and 10.3 m s−1.
When investigating the most suitable location for offshore wind development, the mean wind speed can be useful to demonstrate wind speed spatial distribution and seasonal patterns, but may not adequately represent the wind speed frequency relevant for renewable energy devices. The energy density map (Figure 7) showed the majority of Ireland’s offshore wind falls within power class seven [9], producing on average over 400 W m−2 of energy annually at 10 m a.s.l. Most of the coastal areas fell in the sixth power class, producing 300–400 W m−2 annually, which was also the case for the southern area of Ireland’s continental shelf. A small area in the center of the Irish sea had a power density class five, producing an annual average wind power density ranging between 205 W m−2 and 300 W m−2 at 10 m a.s.l.
Similar studies which have investigated the offshore wind power density have divided the wind power into seven classes [8,9,32]. Under this classification system, a power class of four, indicates a wind speed range of 5.6–6.0 m s−1, and was considered by the authors to be the threshold of economic viability for offshore wind farm development. Research conducted in the Mediterranean area [32] showed that this region is dominated by the wind power class five and six. In [9], it was shown that the wind resource of the Iberian Peninsula is characterized by power classes ranging from four to six. In [8], the authors focused on the waters surrounding Brazil and were able to identify two locations where the wind was most suitable for offshore wind development with power classes ranging between four and six. In [8,9] and [32], all the seven wind power classes were present on the power density maps produced. However, this was not the case for Ireland where, as can be seen in Figure 7, only the top three power classes were represented within the offshore area on the power density map. Therefore, this level of classification is inadequate to spatially describe the high wind power densities available in Irish waters.

3.3.2. Operational and Maximum Yield Frequency

The mean offshore wind speed and energy density maps are a good indication of the wind resource, but may not be sufficiently descriptive of the potential power available and its spatial distribution. Reclassifying the wind speed depending on the cut-in, cut-off, and rated power thresholds can indicate the frequency of power generation (operational frequency) and maximum yield, providing significant information regarding energy yield predictions. The operational frequency map (Figure 8) showed that the frequency of the wind speed being between the cut-in and cut-off range of wind turbines was between 92.4% and 97.2% in a 20 to 200 km buffer zone around Ireland. Similarly, the maximum yield frequency map illustrated that the wind speed frequency, falling in the rated power range of wind turbines, was between 40.6% and 59.5% in the 20 to 200 km buffer area around Ireland (Figure 9).
The mean wind speed maps can be useful in preliminary investigation of the wind resources, but the operational frequency and maximum yield frequency can be more informative of the power available at specific locations and should be considered when comparing locations of interest. These maps can be used together to identify the location where both maximum yield and operational frequency are highest. Moreover, they could be used in a geo-spatial multi-criteria analysis including other deciding factors such as bathymetry, seabed substrate, marine mammals’ distribution, boat traffic, distance from shore, and electricity grid, in order to select the optimal location of offshore wind farm development in Irish waters.
The availability of such geo-spatial multi-criteria analysis tools is particularly pertinent in the Irish context where planning guidelines for the development of offshore wind are currently absent and are the subject of an ongoing consultation process [35]. It is expected that this process will culminate in the production of robust planning guidelines, including visibility of turbines in the near shore, thus addressing a significant governance barrier to the development of offshore wind in Ireland [36].

4. Conclusions

Ireland currently has a limited offshore wind industry with only one operational offshore wind farm, the 25 MW Arklow Wind Park located off the east coast. However, Ireland hosts a number of very suitable sites with a significant resource in often less-challenging ground conditions than many recently developed European sites. There is a growing interest for future expansion within Irish territorial waters once the right supports are in place, one of which being the provision of reliable resource data. Satellite remote sensing is an opportunity to meet this industry need by combining hyper-temporal datasets at a higher temporal resolution than previously considered. Aiming to assess the potential use of remote sensing in the site selection of offshore wind farms in Ireland, the twice-daily KNMI Global Wind Level-3 ASCAT 12.5 km coastal wind product was used in this study.
The satellite-derived wind speed data were comprehensively validated against in situ weather buoys for inter- and intra-annual variation and diurnal temporal variability, showing a very strong positive linear relationship with the in situ measurements. The ASCAT wind product was able to depict local spatial and temporal variability, which are paramount for optimising the site selection process and understanding wind resource availability scenarios for offshore wind farm development.
The wind speed maps showed that the highest spatial variations were associated with near-shore areas, which was in agreement with other studies, however these reduced beyond 15 km from the coastline. Due to typical planning restrictions regarding the visibility of turbines in near-shore areas, it is unlikely that this will impede the viability of remotely sensed approaches for offshore wind farm site selection.
The statistical analysis showed bias in winter and summer variations due to the stability of the atmospheric conditions with air–sea temperature fluctuations. However, this bias was most evident in annual analysis, and was significantly lower when using a multi-annual dataset. Therefore, in the practical or commercial application of this study, it is important to increase the number of observations to reduce the statistical uncertainty linked to the atmospheric stability changes, and ensure that winter resource is not overestimated and summer resource underestimated when determining energy yield.
The energy density map for Ireland illustrated the significant resource offered by Irish waters, but was unable to adequately reflect the spatiotemporal variability of wind speeds, and hence a new classification scheme should be devised reflecting the stronger wind speeds in this part of the Atlantic Ocean. Nevertheless, the majority of the Irish offshore wind resource is estimated to be producing on average over 400 W m−2 annually at 10 m a.s.l., and for most coastal locations and the southern area of Ireland’s continental shelf to be producing an annual wind power average of 300–400 W m−2. By comparison, the resource maps for wind power density, operational frequency, and maximum yield that were produced solely based on hyper-temporal satellite scatterometry were descriptive of the potential power available in Irish waters and its spatial distribution. These resource maps could be used in a geo-spatial multi-criteria analysis in conjunction with other critical infrastructure and site factors such as bathymetry, protected areas, shipping lanes, port infrastructure, and electrical grid, in order to select the optimal location of offshore wind farm development in Ireland.
Further research using more complex extrapolation formulae, such as the Liu–Katsaros–Businger (LKB) algorithm, would be beneficial for the validation process of the ASCAT 12.5 km coastal wind product, especially in the occurrence of changing atmospheric conditions and variations of surface roughness [17,18]. In addition, the Irish offshore wind resource assessment would benefit from the synergistic use of additional satellite platforms, such as OSCAT [6], WindSat [37], and RapidScat [38], to increase the temporal resolution, which may enable more detailed observation of variations within a 24 h period, as well as reducing statistical uncertainties. Such analysis would be particularly beneficial as it would allow investigation of the wind direction and the diurnal changes in the nearshore area (sea breeze and land breeze). This could highly influence the site selection process of offshore wind farms in the near shore area as variation in wind direction can be detrimental to wind turbines in terms of fatigue loading and energy capture [39].
To the best of the authors’ knowledge, these are the first satellite-based wind power density, operational frequency, and maximum yield frequency maps generated for Irish waters, which illustrate the available offshore wind resource potential, and validate applicability of a remote sensing approach for use in wind ORE optimal site selection studies such as those being undertaken in the ARWIND project. Although this research highlighted the ability of the KNMI Global Wind Level-3 ASCAT 12.5 km coastal wind product to represent offshore wind speeds and provide useful information for the development of wind farms in Irish waters, remote sensing data can be useful for preliminary site selection only. Due to its relatively low temporal resolution and lack of atmospheric stability classification, RS cannot replace essential in situ hourly measurements needed for detailed site variations and precise resource estimates. Decision-makers can therefore use RS data as a filtering technique, separating potentially suitable sites from unsuitable sites, as well as identifying areas where additional in situ buoys are required for more detailed analysis. Finally, the methodology applied in this study could also be used for other parameters retrieved by satellites, such as wave height and wind direction, which are also important for a better assessment of the ORE in Ireland.

Author Contributions

Validation, T.R.; Formal Analysis, T.R.; Investigation, T.R.; Conceptualization, E.P. and F.C.; Methodology, C.D. and E.P.; Resources, J.M.; Writing-Original Draft Preparation, T.R.; Writing-Review & Editing, T.R. and C.D.; Supervision, F.C.; Funding Acquisition, J.M.

Funding

This research and the APC were funded by the EU H2020 project Co-ReSyF grant number [687289] and the European Regional Development Funded (ERDF) INTERREG Atlantic Area Project ARCWIND.

Conflicts of Interest

The authors declare no conflict of interest.

References

  1. Hasager, C.B.; Mouche, A.; Badger, M.; Bingöl, F.; Karagali, I.; Driesenaar, T.; Stoffelen, A.D.; Peña, A.; Longépé, N. Offshore wind climatology based on synergetic use of Envisat ASAR, ASCAT and QuikSCAT. Remote Sens. Environ. 2015, 156, 247–263. [Google Scholar] [CrossRef] [Green Version]
  2. Salvação, F.N.; Soares, C.G. Resource assessment methods in the offshore wind energy sector. In Floating Offshore Wind Farms; Chapter 7; Laura, C.-S., Vicente, D.-C., Eds.; Springer International Publishing: Cham, Switzerland, 2016; pp. 121–141. [Google Scholar]
  3. Wind Europe. The European Offshore Wind Industry, Key Trends and Statistics 2016. 2017. Available online: https://windeurope.org/about-wind/statistics/offshore/european-offshore-wind-industry-key-trends-and-statistics-2016/ (accessed on 8 January 2019).
  4. Ferreño González, S.; Diaz-Casas, V. Present and future of floating offshore wind. In Floating Offshore Wind Farms; Chapter 1; Laura, C.-S., Vicente, D.-C., Eds.; Springer International Publishing: Cham, Switzerland, 2016; pp. 1–22. [Google Scholar]
  5. Environmental and Energy Study Institute (EESI). Offshore Wind: Can the United States Catch up with Europe? 2016. Available online: http://www.eesi.org/files/FactSheet_OffshoreWind_01.04.pdf (accessed on 8 January 2019).
  6. Carvalho, D.; Rocha, A.; Gomez-Gesteira, M.; Silva Santos, C. Offshore winds and wind energy production estimates derived from ASCAT, OSCAT, numerical weather prediction models and buoys—A comparative study for the Iberian Peninsula Atlantic coast. Renew. Energy 2017, 102, 433–444. [Google Scholar] [CrossRef]
  7. Kaldellis, K.J.; Apostolou, D.; Kapsali, M.; Kondili, E. Environmental and social footprint of offshore wind energy. Comparison with onshore counterpart. Renew. Energy 2016, 92, 543–556. [Google Scholar] [CrossRef]
  8. Pimenta, F.; Kempton, W.; Garvine, R. Combining meteorological stations and satellite data to evaluate the offshore wind power resource of southeastern Brazil. Renew. Energy 2008, 33, 2375–2387. [Google Scholar] [CrossRef]
  9. Salvação, N.; Soares, C.G. Offshore wind energy assessment for the Iberian coasts using remotely sensed data. In Renewable Energies Offshore; Soares, C.G., Ed.; Taylor & Francis Group: Didecott, UK, 2015; pp. 237–244. [Google Scholar]
  10. Global Wind Energy Council (GWEC). Global Wind Statistics 2014. 2015. Available online: http://www.gwec.net/wp-content/uploads/2015/02/GWEC_GlobalWindStats2014_FINAL_10.2.2015.pdf (accessed on 8 January 2019).
  11. Carton, J.G.; Olabi, A.G. Wind/hydrogen hybrid systems: Opportunity for Ireland’s wind resource to provide consistent sustainable energy supply. Energy 2010, 35, 4536–4544. [Google Scholar] [CrossRef] [Green Version]
  12. Department of Communication, Energy and Natural Resources (DCCAE). Offshore Renewable Energy Development Plan—A Framework for the Sustainable Development of Ireland’s Offshore Renewable Energy Resource. 2014. Available online: https://www.dccae.gov.ie/documents/20140204%20DCENR%20-%20Offshore%20Renewable%20Energy%20Development%20Plan.pdf (accessed on 8 January 2019).
  13. Sustainable Energy Authorities of Ireland (SEAI). Offshore Wind. 2017. Available online: http://www.seai.ie/Renewables/Ocean-Energy/Ocean-Energy-Explained/Offshore-Wind.html (accessed on 16 June 2017).
  14. Harnessing Our Ocean Wealth. An Integrated Marine Plan for Ireland, Review of Progress 2016; Irish Government: Dublin, Irish, 2017.
  15. Murphy, J.; Lynch, K.; Serri, L.; Airdoldi, D.; Lopes, M. ORECCA Site Selection Analysis for Offshore Combined Resource Projects in Europe. Results of the FP7 ORECCA Project Work Package 2; Document Version: B.; Hydraulic and Maritime Research Centre (HMRC): Cork, Ireland, 2011. [Google Scholar]
  16. Lindsley, R.D.; Blodgett, J.R.; Long, D.G. Analysis and validation of high-resolution wind from ASCAT. IEEE Trans. Geosci. Remote Sens. 2016, 54, 5699–5711. [Google Scholar] [CrossRef]
  17. Ruti, P.M.; Marullo, S.; D’Ortenzio, F.; Tremant, M. Comparison of analyzed and measured wind speeds in the perspective of oceanic simulations over the Mediterranean basin: Analyses, QuikSCAT and buoy data. J. Mar. Syst. 2008, 70, 33–48. [Google Scholar] [CrossRef]
  18. Xing, J.; Shi, J.; Lei, Y.; Huang, X.-Y.; Liu, Z. Evaluation of HY-2A Scatterometer Wind Vectors Using Data from Buoys, ERA-Interim and ASCAT during 2012–2014. Remote Sens. 2016, 8, 390. [Google Scholar] [CrossRef]
  19. Desmond, C.J.; Murphy, J.; Blonk, L.; Haans, W. Description of an 8MW Reference Wind Turbine. J. Phys. Conf. Ser. 2016, 753, 092013. [Google Scholar] [CrossRef]
  20. Verhoef, A.; Portabella, M.; Stoffelen, A. High resolution ASCAT scatterometer winds near the coast. IEEE Trans. Geosci. Remote Sens. 2012, 50, 2481–248. [Google Scholar] [CrossRef]
  21. Hasager, C.B. Offshore winds mapped from satellite remote sensing. WIREs Energy Environ. 2014, 3, 594–603. [Google Scholar] [CrossRef] [Green Version]
  22. The Royal Netherlands Meteorological Institute (KNMI). ASCAT Wind Product User Manual; Version 1.14; KNMI: De Bilt, The Netherlands, 2016; Available online: http://projects.knmi.nl/scatterometer/publications/pdf/ASCAT_Product_Manual.pdf (accessed on 8 January 2019).
  23. Wang, Z.; Zhao, C. Assessment of wind products obtained from multiple microwave scatterometers over the China Seas. Chin. J. Oceanol. Limnol. 2015, 33, 1210–1218. [Google Scholar] [CrossRef]
  24. Kako, S.; Okuro, A.; Kubota, M. Effectiveness of using multisatellite wind speed estimates to construct hourly wind speed datasets with diurnal variations. J. Atmos. Ocean. Technol. 2017, 34, 631–642. [Google Scholar] [CrossRef]
  25. Verspeek, J.; Verhoef, A.; Stoffelen, A. ASCAT-B NWP Ocean Calibration and Validation, OSI SAF Technical Report, SAF/OSI/CDOP2/KNMI/TEC/RP/199. 2013. Available online: http://projects.knmi.nl/publications/fulltexts/ascat_b_nwp_ocean_calibration_and_validation.pdf (accessed on 8 January 2019).
  26. Verhoef, A.; Stoffelen, A. Validation of ASCAT 12.5-km Winds; The Royal Netherlands Meteorological Institute (KNMI): De Bilt, The Netherlands, 2013. [Google Scholar]
  27. Vogelzang, J.; Stoffelen, A.; Verhoef, A.; Figa-Saldaña, J. On the quality of high-resolution scatterometer winds. J. Geophys. Res. 2011, 116, C10033. [Google Scholar] [CrossRef]
  28. European Organization for the Exploitation of Meteorological Satellites (EUMETSAT). 2017. Available online: http://www.eumetsat.int/website/home/Satellites/CurrentSatellites/Metop/MetopDesign/ASCAT/index.html (accessed on 8 January 2019).
  29. National Aeronautics and Space Administration (NASA). 2017. Available online: https://science.nasa.gov/ earth-science/earth-science-data/data-processing-levels-for-eosdis-data-products (accessed on 6 September 2017).
  30. Infomar. 2017. Available online: http://www.infomar.ie/data/RealMaps.php (accessed on 11 September 2017).
  31. Marine Institute. 2017. Available online: http://data.marine.ie/Dataset/Details/20972 (accessed on 29 June 2017).
  32. Balog, I.; Ruti, P.M.; Tobin, I.; Armenio, V.; Vautard, R. A numerical approach for planning offshore wind farms from regional to local scales over the Mediterranean. Renew. Energy 2016, 85, 395–405. [Google Scholar] [CrossRef]
  33. Desmond, C.J.; Watson, S. A study of stability effects in forested terrain. J. Phys. Conf. Ser. 2014, 555, 012027. [Google Scholar] [CrossRef] [Green Version]
  34. Thomas, N.; Seim, H.; Haines, S. An observational, spatially explicit, stability-based estimate of the wind resource off the shore of North Carolina. J. Appl. Meteorol. Climatol. 2015, 54, 2407–2425. [Google Scholar] [CrossRef]
  35. Government of Ireland. National Marine Planning Framework, Baseline Report; Government of Ireland: Dublin, Irish, 2018.
  36. Lange, M.; O’Hagan, A.; Devoy, R.; Cummins, V. Governance Barriers to Sustainable Energy Transitions—Assessing Ireland’s Capacity towards Marine Energy Futures. Energy Policy 2018, 113, 623–632. [Google Scholar] [CrossRef]
  37. Gaiser, P.W.; Poe, G.A.; Linwood, W.J. The WindSat spaceborn polarimetric microwave radiometer: Sensor description and early orbit performance. IEEE Trans. Geosci. Remote Sens. 2004, 42, 2347–2361. [Google Scholar] [CrossRef]
  38. National Aeronautics and Space Administration (NASA). 2017. Available online: https://winds.jpl.nasa.gov/missions/RapidScat/. (accessed on 8 January 2019).
  39. Porté-Agel, F.; Wu, Y.; Chen, C. A Numerical Study of the Effects of Wind Direction on Turbine. Wakes and Power Losses in a Large Wind Farm. Energies 2013, 6, 5297–5313. [Google Scholar] [CrossRef]
Figure 1. The study area, which was defined by Ireland’s designated continental shelf and location of the M2, M3, M4, M5, and M6 weather buoys.
Energies 12 00206 g001
Figure 2. Scatter plot and regression line of the in situ and remotely sensed wind speed (m s−1) from all the weather buoy locations (n = 14,157).
Energies 12 00206 g002
Figure 3. Wind speed histogram of the in situ measurements and the ASCAT RS data recorded at every weather buoy location (n = 14,157).
Energies 12 00206 g003
Figure 4. Inter-annual offshore wind variability (m s−1) based on RS ASCAT data and in situ measurements at the M2, M3, M4, M5, and M6 buoys for the years 2012 to 2016 (left). Mean hourly wind speed variation for a high wind and low wind speed week derived from the wind speed measured at all buoys (right).
Energies 12 00206 g004
Figure 5. Seasonal offshore wind speed maps (m s−1) from ASCAT-A and ASCAT-B retrieved between January 2012 and May 2017.
Energies 12 00206 g005
Figure 6. Ireland’s mean offshore wind speed at 80 m above sea level extrapolated with the log law from ASCAT-A and -B observations for the years 2013 to 2016 and ASCAT-A in 2012.
Energies 12 00206 g006
Figure 7. Energy density map (W m−2) of Ireland’s offshore wind at 10 m above sea level derived from ASCAT-A and -B observations for the years 2013 to 2016 and ASCAT-A 2012.
Energies 12 00206 g007
Figure 8. Operational frequency map at 80 m a.s.l. of Ireland’s waters between 20 km and 200 km from the coast derived from ASCAT-A and -B observations for the years 2013 to 2016 and ASCAT-A 2012.
Energies 12 00206 g008
Figure 9. Maximum energy yield frequency at 80 m a.s.l. of Ireland’s waters between 20 km and 200 km from the coast, derived from ASCAT-A and -B observations for the years 2013 to 2016 and ASCAT-A 2012.
Energies 12 00206 g009
Table 1. Wind power classes and equivalent wind speed at 10 m a.s.l. and 80 m a.s.l. (derived from Salvação and Soares 2015).
Power ClassAnnual Average Wind Power Density (W m−2)Equivalent Mean Wind Speed (m s−1)
10 m a.s.l.80 m a.s.l.10 m a.s.l.80 m a.s.l.
10–1000–251.30.0–4.4<5.9
2100.1–150251.4–375.14.5–5.15.9-6.9
3150.1–200375.2–490.85.2–5.67.0–7.5
4200.1–250490.7–03.65.7–6.07.6–8.1
5250.1–300603.7–732.66.1–6.48.2–8.6
6300.1–400732.7–975.16.2–7.08.7–9.4
7400.1–1000>975.17.1–9.4>9.4
Table 2. Statistical comparison of Advanced Scatterometer (ASCAT) data and in situ measurements including: number of observations (n), the mean (m s−1), and standard deviation (Stdv) (m s−1) of both ASCAT and in situ data Pearson correlation (r), R-squared value, bias (m s−1), Root Mean Square Error (RMSE), 99% confidence interval, and t-test p-value at 0.05 Confidence Level (CL).
nASCAT Mean (m s−1)ASCAT Stdv (m s−1)Mean (m s−1)In Situ Stdv (m s−1)rR-SquaredBias (m s−1)RMSE99% Confidence Intervalp-Value CL (5%)
14,1578.683.908.603.820.950.9040.090.904[0.962–0.978]0.060

