Uncovering Household Carbon Footprint Drivers in an Aging, Shrinking Society


1
Graduate School of Fisheries and Environmental Sciences, Nagasaki University, 1-14 Bunkyo-machi, Nagasaki 852-8521, Japan
2
International Institute for Carbon-Neutral Energy Research, Kyushu University, 744 Motooka, Nishi-ku, Fukuoka 819-0395, Japan
*
Authors to whom correspondence should be addressed.
Energies 2019, 12(19), 3745; https://doi.org/10.3390/en12193745
Submission received: 31 July 2019
/
Revised: 14 September 2019
/
Accepted: 28 September 2019
/
Published: 30 September 2019
(This article belongs to the Special Issue Advances in Low Carbon Technologies and Transition)
Abstract
:In order to meet climate change mitigation goals, nations such as Japan need to consider strategies to reduce the impact that lifestyles have on overall emission levels. This study analyzes carbon footprints from household consumption (i.e., lifestyles) using index and structural decomposition analysis for the time period from 1990 to 2005. The analysis identified that households in their 40s and 50s had the highest levels of both direct and indirect CO2 emissions, with decomposition identifying consumption patterns as the driving force behind these emissions and advances in CO2 reduction technology having a reducing effect on lifestyle emissions. An additional challenge addressed by this study is the aging, shrinking population phenomenon in Japan. The increase in the number of few-member and elderly households places upward pressure on emissions as the aging population and declining national birth rate continues. The analysis results offer two mitigatory policy suggestions: the focusing of carbon reduction policies on older and smaller households, and the education of consumers toward low-carbon consumption habits. As the aging, shrinking population phenomenon is not unique to Japan, the findings of this research have broad applications globally where these demographic shifts are being experienced.

1. Introduction
To meet the global climate change mitigation target of limiting global warming to just 1.5 °C [1], an extensive effort toward reducing carbon emissions throughout our lifestyles is critical. Leading this effort is particularly essential for developed nations, which are more likely to emit larger amounts of carbon dioxide (CO2) and other greenhouse gases (GHG) and who have access to cleaner technologies than developing nations. Consumption-based accounting [2,3] quantifies not only direct or territorial emissions due to fuel combustion but also indirect emissions generated through the supply chains of goods and services, allowing for the consideration of broader abatement options from both the demand and supply sides [4]. This is known as a “cradle-to-gate” (i.e., from raw material extraction to final consumption) assessment. From this point of view, our lifestyle (household consumption) has been highlighted as playing a dominant role in cradle-to-gate GHG emissions, as measured through national carbon footprints (CF) [5,6,7]. Globally, almost 65% of CF are induced by household consumption [8]. In order to achieve a low-carbon future, drastic changes are needed not only in industrial supply structures but also in our daily lifestyle structures.
Japan, selected as the target nation for this study, is among the most industrialized GHG-emitting nations [9]. In line with Japan’s Paris Agreement goals, GHG emissions need to be reduced by 26% by 2030 compared with 2013 levels. To achieve this, it is necessary to implement effective measures with respect to technological innovation and envisaged demographic shifts [10,11]. Japan’s CF structure has been analyzed, identifying that household consumption is dominant, similar to other developed nations [12]. Further, previous research has analyzed the household CF in Japan, identifying key consumption and behavior domains for effective reduction [13,14,15,16,17,18]. However, this precedential research did not examine time trends of household CF or the crucial supply and demand drivers.
This study sheds light on structural changes in Japanese household CF to elucidate levers which enable the reduction of CF and enable an understanding of how supply and demand drivers underpin these CF. In addition, this research focuses on demographic trends as a demand driver of changes in CF due to an aging, shrinking population—a serious issue faced in Japan and other nations, which may affect consumption and resultant CF values [13,18,19]. For instance, Shigetomi et al. [11] evaluated the impact of demographic trends on energy-related CO2 emissions from residents during 1990–2015 using decomposition analysis, indicating that as the number of single households increased, especially older households, a commensurate increase in emissions was observed.
In order to analyze the underpinning factors of CF, this study adopts index decomposition analysis (IDA) [20] and structural decomposition analysis (SDA) [21] on a time-series data set of both direct and indirect CO2 emissions induced by Japanese households. To date, IDA has been applied mainly to examine the driving forces of energy consumption and its relation to CO2 emissions by sector [22,23]. SDA has clarified the determinants of lifecycle emissions within CF, utilizing input–output table data [24,25]. These two approaches have been utilized to analyze key determinants of home energy-related CO2 emissions [26,27,28] and household CF [29,30,31], respectively, regarding the carbon emission intensity, supply chain structure, consumption volume and composition, and population.
Studies relevant to Japan have assessed energy-related CO2 emissions at the national level [32], specific to services [33], transport [34], manufacturing [35], and residential sectors [11], identifying the key drivers for reducing emissions by sector. For instance, related to household consumption, Shigetomi et al. [11] examined the trends in residential energy-related CO2 emissions across 47 regions in Japan during 1990–2015 using the regional energy balance tables, demographic census and consumer expenditure survey, demonstrating the importance of prioritizing national and local policy interventions of the supply and demand sides in light of the differences in the key drivers in each region. They do not consider, however, the upstream (indirect) CO2 emissions created by the overall household consumption via the supply chain. To the best of our knowledge, this study highlights the structural changes in Japanese household CF detailing both direct and indirect energy-related CO2 emissions for the first time. This novel research uncovers insights for mitigating household CF with respect to both supply and demand factors and demographics, notably an aging, shrinking society.
The research is organized as follows: Section 2 describes the methods and data employed to calculate household CF and to estimate the contribution of drivers toward structural changes. Section 3 presents the results and discussion. Finally, Section 4 concludes with detailed policy implications and a future outlook based on the obtained results.
2. Materials and Methods
Here, the materials and methodology are defined, including the quantification and decomposition approaches, data utilized, and the methodological and data limitations.
2.1. Quantification of Carbon Footprint by Household Consumption
Household CF is defined as the sum of direct carbon emissions induced by driving a passenger motor car, cooking and household heating (D), and indirect (embodied) carbon emissions generated through the supply chain due to household consumption (S). D is calculated using Equation (1).
where represents the direct CO2 emissions per consumption expenditure for energy item k. denotes the household’s final consumption by attribute b for energy item k. Next, S is quantified by Equations (2) and (3).
where represents the upstream CO2 emissions per consumption expenditure (embodied CO2 emission intensity) for commodity i ∍ k. j denotes the commodity sector. It is estimated by using qi and which denote the vector containing the direct CO2 emissions per unit production output for commodity i and upstream requirements per unit production, respectively. Lij is an element of the Leontief inverse matrix [36] obtained from the input–output table.
2.2. Index Decomposition Analysis and Structural Decomposition Analysis
To comprehend the contribution of various indicators to the changes in household CF by using IDA and SDA, we decomposed both the direct CO2 emissions derived from home energy and the indirect CO2 emissions generated through the supply chain of goods and services (commodities) purchased by households, as shown in Equations (4) and (5).
where H and p represent the total number of households and population, respectively. Both ykb and yib refer to consumption patterns (e.g., medical services are more heavily consumed by elderly households than younger households). wb and wb’ represent the average per-capita consumption volume for energy items and that for all commodities, respectively. sb represents the average number of members in each household (i.e., family size). db describes the distribution of households (i.e., the proportion of younger households to total households). Thus, Equations (4) and (5) are based on Equations (1) and (2), with household final consumption decomposed into the five factors in line with consumption pattern, consumption volume, family size, household distribution, and number of households. Overall, six drivers are considered for direct CO2 emissions, and seven drivers for indirect CO2 emissions.
When D and S shift from year t to year t + 1, there are no unique solutions for how the decomposition should be solved. To quantify the contributions of each factor, this study used the Shapley–Sun decomposition approach (S-S method) [37] for D, and the Dietzenbacher and Los decomposition approach (D-L method) [38] for S, cognizant of identical decomposition without any residues and the commonality of results [24]. For example, the total difference of Equation (4) can be represented by Equation (6).
where ∆ indicates the difference operator. Equation (6) converts six multiplicative terms in the first term of Equation (4) into six additive terms. Each additive term in Equation (6) denotes the contribution to changes in D induced by a targeted factor while all other factors are constant. For instance, the first term in Equation (6) refers to the effect on direct CO2 emissions of changes in direct emission intensity, while consumption patterns, consumption volume, family size, household distribution, and total number of households are constant between t and t + 1. Each of the contributions were estimated by taking the average of the 6! = 720 decomposition equations possible [37]. Here, the effects on direct CO2 emissions that are related to the first, second, third, fourth, fifth, and sixth terms in Equation (6) are referred to as the intensity effect (direct), consumption pattern effect, consumption volume effect, family size effect, household distribution effect, and household number effect, respectively.
In a similar manner, the total difference of Equation (5) can be demonstrated by Equation (7).
Finally, each of the contributions were estimated by taking the average of the 7! = 5040 decomposition equations possible [38]. Here, the effects on indirect CO2 emissions that are related to the first, second, third, fourth, fifth, sixth, and seventh terms are referred to as the intensity effect (indirect), supply chain effect, consumption pattern effect, consumption volume effect, family size effect, household distribution effect, and household number effect, respectively.
2.3. Data
This study uses the time-series Japan input–output tables (TJIO) consisting of the economic transaction (Lij) and household final demand structures () for 1990, 1995, 2000, and 2005 based on the 2005 price with 397 common commodities. Hence, the data are comparable among periods. Further, we disaggregated the commodities within petroleum products into six detailed commodities including gasoline, light oil, kerosene, liquefied petroleum gas (LPG), and other petroleum products (i.e., lubricants) by using the Comprehensive Energy Statistics [39]. To identify the relationship between household CF and demographic trends, the final household demands from the TJIO were divided into consumption expenditures for six age groups of the highest income earner in the household (29≤, 30–39, 40–49, 50–59, 60–69, ≥70) for each year using the national survey of family income and expenditure (NSFIE) [40]. Then, the consumption share by attribute, summation of each final consumption type by commodity and the difference between the producer-based price and consumer-based price were considered as detailed in a previous study [14]. was obtained based on Equation (3). qi was calculated by dividing sectoral CO2 emissions obtained from the 3EID [41] by total output utilizing the TJIO. b denotes the age of the highest income earner (1: ≤29, 2: 30–39, 3: 40–49, 4: 50–59, 5: 60–69, 6: ≥70).
2.4. Limitations
The approach used in this study has several limitations with regard to the data and methodology employed. First, to conduct SDA, it is necessary to prepare time-series data on both household consumption expenditures and environmental burden intensities that are consistent with the IO table and to deflate according to the base year price information. In this regard, this study used the TJIO covering the periods 1990–1995–2000–2005. We recognize that the latest year analyzed in this study is more than 10 years in the past; however, it is currently impossible to prepare more recent deflated data for consumption expenditure and embodied CO2 emission intensity. The latest domestic IO table describes the economic transactions accounting for household consumption expenditures in 2011, and the embodied CO2 emission intensity values for 2011 have already been published. However, it is relatively difficult to deflate consumption expenditures and intensities due to the disconnection between commodity sectors and their definitions.
3. Results and Discussion
The results and discussion are divided into the three sections of overall trends in emissions, changes within sectors and age groups, and the decomposition of the driving forces underpinning emissions.
3.1. Overall Trends of Total Direct and Indirect CO2 Emissions
CO2 emissions induced by Japanese household consumption from 1990 to 2005 are shown in Table 1. Both direct and indirect CO2 emissions showed a significant growth trend during the analyzed period. In terms of overall emissions, indirect CO2 emissions levels remain nearly four times those of direct CO2 emissions. The annual average increase of direct CO2 emissions is relatively small, and emissions in 2005 are slightly lower than those in the year 2000. However, indirect CO2 emissions continuously increased, with an annual average increase of 6.6 Mt in 1990–2005. In terms of the growth rate of emissions, that of direct emissions was higher than that of indirect emissions during the studied period (see Table 1). These characteristics will be elaborated by observing the trends in direct and indirect CO2 emissions by sector, as presented in the following section.
3.2. Changes in Direct and Indirect CO2 Emissions in Different Sectors and Age Groups
The total direct and indirect CO2 emissions are disaggregated into sectors and household age groups to evaluate their impact on CO2 emissions. Fourteen sectors are considered: “food and non-alcoholic beverages,” “alcoholic beverages and tobacco,” “clothing and footwear,” “housing,” “furnishings,” “medicals,” “private vehicles,” “public transport,” “information and communication,” “recreation and culture,” “education,” “restaurants and hotels,” “consumable goods,” and “margins, religions and other services.” These sectors are determined based on the “Classification of Individual Consumption by Purpose.”
Figure 1 presents the trends in total direct CO2 emissions by sector and average direct CO2 emissions per capita across age groups. To observe the impact of demographic factors on carbon emissions in an aging society in greater detail, we examined the per capita CO2 emissions as well as the per household emissions across different age groups. Here, we focus on the per capita emissions (Figure 1b), because the per household emissions are affected by the average family size and composition of households attributed to each age group. The results of per household direct and indirect emissions are detailed in Appendix A.
Private vehicles and housing are the only two sectors that generate direct CO2 emissions from households, as fossil fuels are used for these activities. For instance, the private vehicles sector includes gasoline and light oil, while the housing sector includes kerosene, LPG, coal products, and city gas. As shown in Figure 1a, the private vehicles sector accounts for a large proportion of direct CO2 emissions throughout the analyzed period, impacting the high growth rate of direct emissions, as referred to above. From 1990 to 2005, Japanese car ownership rose from 57.99 million to 78.28 million vehicles—an increase of approximately 35% [42]. With this increase in car ownership, the growth rate of gasoline consumption was much larger than for other fuels. Consequently, the direct emissions for the private vehicles sector increased significantly compared to those for the housing sector.
Considering different age groups, direct CO2 emissions (per capita) from the private vehicles sector are concentrated within two age groups—40s and 50s—as shown in Figure 1b. For those in their 40s, this may be due to work and family needs. With the increase of household savings in these age groups, many families tend to own their own cars and use them frequently. The 50s age group has the highest direct CO2 emissions across all age groups, possibly because the annual income in the 50s is higher than that of other age groups [40]. In addition, with the increase in family members, the household size has also expanded to a certain extent when compared to others, potentially expanding the demand for private vehicles, particularly large-sized cars. As for the direct CO2 emissions from the housing sector, these are also concentrated in the 40s and 50s age groups. This may be because more people in their 40s and 50s are married and living with their children, and they tend to live in relatively large, energy-consuming houses. Furthermore, the changes in direct CO2 emissions in different age groups also showed certain peculiarities, such as CO2 emissions gradually increasing for householders in their 20s, reaching their peak in the 50s and then subsequently declining.
The change in indirect CO2 emissions in different age groups is similar to that of direct CO2 emissions (see Figure 1b and Figure 2b). Considering the order of growth in sectoral indirect emissions, we selected food and non-alcoholic beverages, housing, and public transport sectors for discussion here, as shown in Figure 2a. First, the indirect CO2 emissions generated by the housing sector were mainly concentrated in the three age groups of the 40s, 50s, and 60s, as demonstrated by Figure 2b. The reason behind the similarity between direct and indirect CO2 emissions of those in their 40s and 50s is that residents modify their houses to meet the needs of family life and child-rearing. For the 60s age group, a consideration of the living environment and living conditions for old-age life could increase the cost of housing and lead to the production of more indirect CO2 emissions.
Indirect CO2 emissions from the food and non-alcoholic beverages sector were also concentrated in the 40s, 50s and 60s age groups. In the 40s and 50s age groups, the expansion of household size may lead to an increase in food consumption, which could increase indirect CO2 emissions. As for the 60s age group, elderly people tend to spend more money on high-quality, expensive food compared to the other age groups. In addition, although the household size is smaller than the 40s and 50s age groups, it is still larger than the age groups of the 20s, 30s, and 70s. These factors combined make the 60s age group the third-largest indirect CO2 emitter on a per capita basis.
Indirect CO2 emissions from the public transport sector were concentrated in the 20s and 50s age groups. Compared with other age groups, the proportion of private vehicle possession in the 20s age group is relatively low, leading to an increased use of public transport, which could increase indirect CO2 emissions from this sector. People in the households with in the 50s age group produced the highest CO2 emissions from both private vehicles and public transport sectors. Generally, people in the 50s age group have the highest annual income, and with the expansion of household size, families are more likely to use private vehicles alongside the children of these families using public transport for attending school.
While the overall CO2 emissions of the public transport sector are increasing, the growth rate is not as fast as that of the private vehicles sector. In addition, there are different trends in indirect emissions from the private vehicles and public transport sectors by age group. In 2005, indirect emissions for the private vehicles sector for those in their 20s decreased by 21%, while those in other age groups, particularly the 30s and 60s, increased by 13–35% compared to 1990. The reasoning for such a decline in the 20s age group is that they were more likely to purchase smaller, less expensive vehicles such as lightweight automobiles (known as kei-cars in Japan) due to financial aspects. On the other hand, because age groups from the 30s to 50s are more likely to be involved in child-raising activities, family life has led to an increased demand for private transport. Furthermore, due to the demographic shift related to an aging, shrinking population leading to a postponement of childbearing age, those in their 60s also have experienced an increase in their use of private vehicles.
For public transport, growth trends were evident across all age groups. Among them, the growth is particularly significant for those in their 20s and 40s. In the 20s age group, the reduction in the use of private vehicles led to an increase in public transport demand. The use of public transport in the 40s age group also increased, which is likely due to the expansion of travel needs for work and school as well as an increase in the use of private vehicles, although at a lower rate than for the 30s, 50s, and 60s.
On average, annual income increases from the 20s to the 50s, subsequently declining and leading to an increase in consumption and savings, creating upward pressure on CO2 emissions [40]. Meanwhile, because of the decline in income after the 50s, indirect CO2 emissions also tend to decline. Further, the household size expands from the 20s to the 50s, while post 50s, the household begins to shrink as children become independent and establish their own households, which is likely linked to the peak in CO2 emissions observed for the 50s age group.
3.3. Decomposition Results
3.3.1. Driving Forces of Total Direct and Indirect CO2 Emissions
Figure 3 shows the results of examining the factors affecting direct CO2 emissions during 1990–2005 using the IDA.
Among factors, the intensity effect was the main driver in reducing direct CO2 emissions, while the consumption pattern was the main driver which increased emissions. The negative impact of the intensity effect on direct CO2 emissions has progressed over time, indicating that Japan has made substantial progress in the carbon reduction technology used in daily life since 1990.
Figure 4 describes the direct CO2 emissions by household energy item. The consumption of gasoline increased significantly prior to 2000, which is one of the reasons for the growth of direct CO2 emissions driven by the consumption pattern during this period. After 2000, along with the slowdown of the growth of gasoline consumption, the positive impact of the consumption pattern has also weakened. In addition, the total number of households in Japan increased from 40.67 million to 49.06 million between 1990 and 2005 [11], promoting a positive impact of the number of households on direct CO2 emissions. The positive effect of consumption volume on direct CO2 emissions weakened consistently between 1990 and 2005. This is probably related to the increase of small-scale households which could reduce their energy consumption to a certain extent. Moreover, the negative impact of household size and household distribution on direct CO2 emissions is gradually increasing, which is likely due to the influence of recent demographic trends such as an increase in one-person households and a reduction in household size because of an aging society with fewer children.
Considering the effects of household size, the number of households and household distribution in 1995, 2000 and 2005, we find that the sum of these effects gradually decreased direct CO2 emissions. This suggests that if Japan maintains an aging society with a low birth rate, direct CO2 emissions generated by the household sector will gradually decrease.
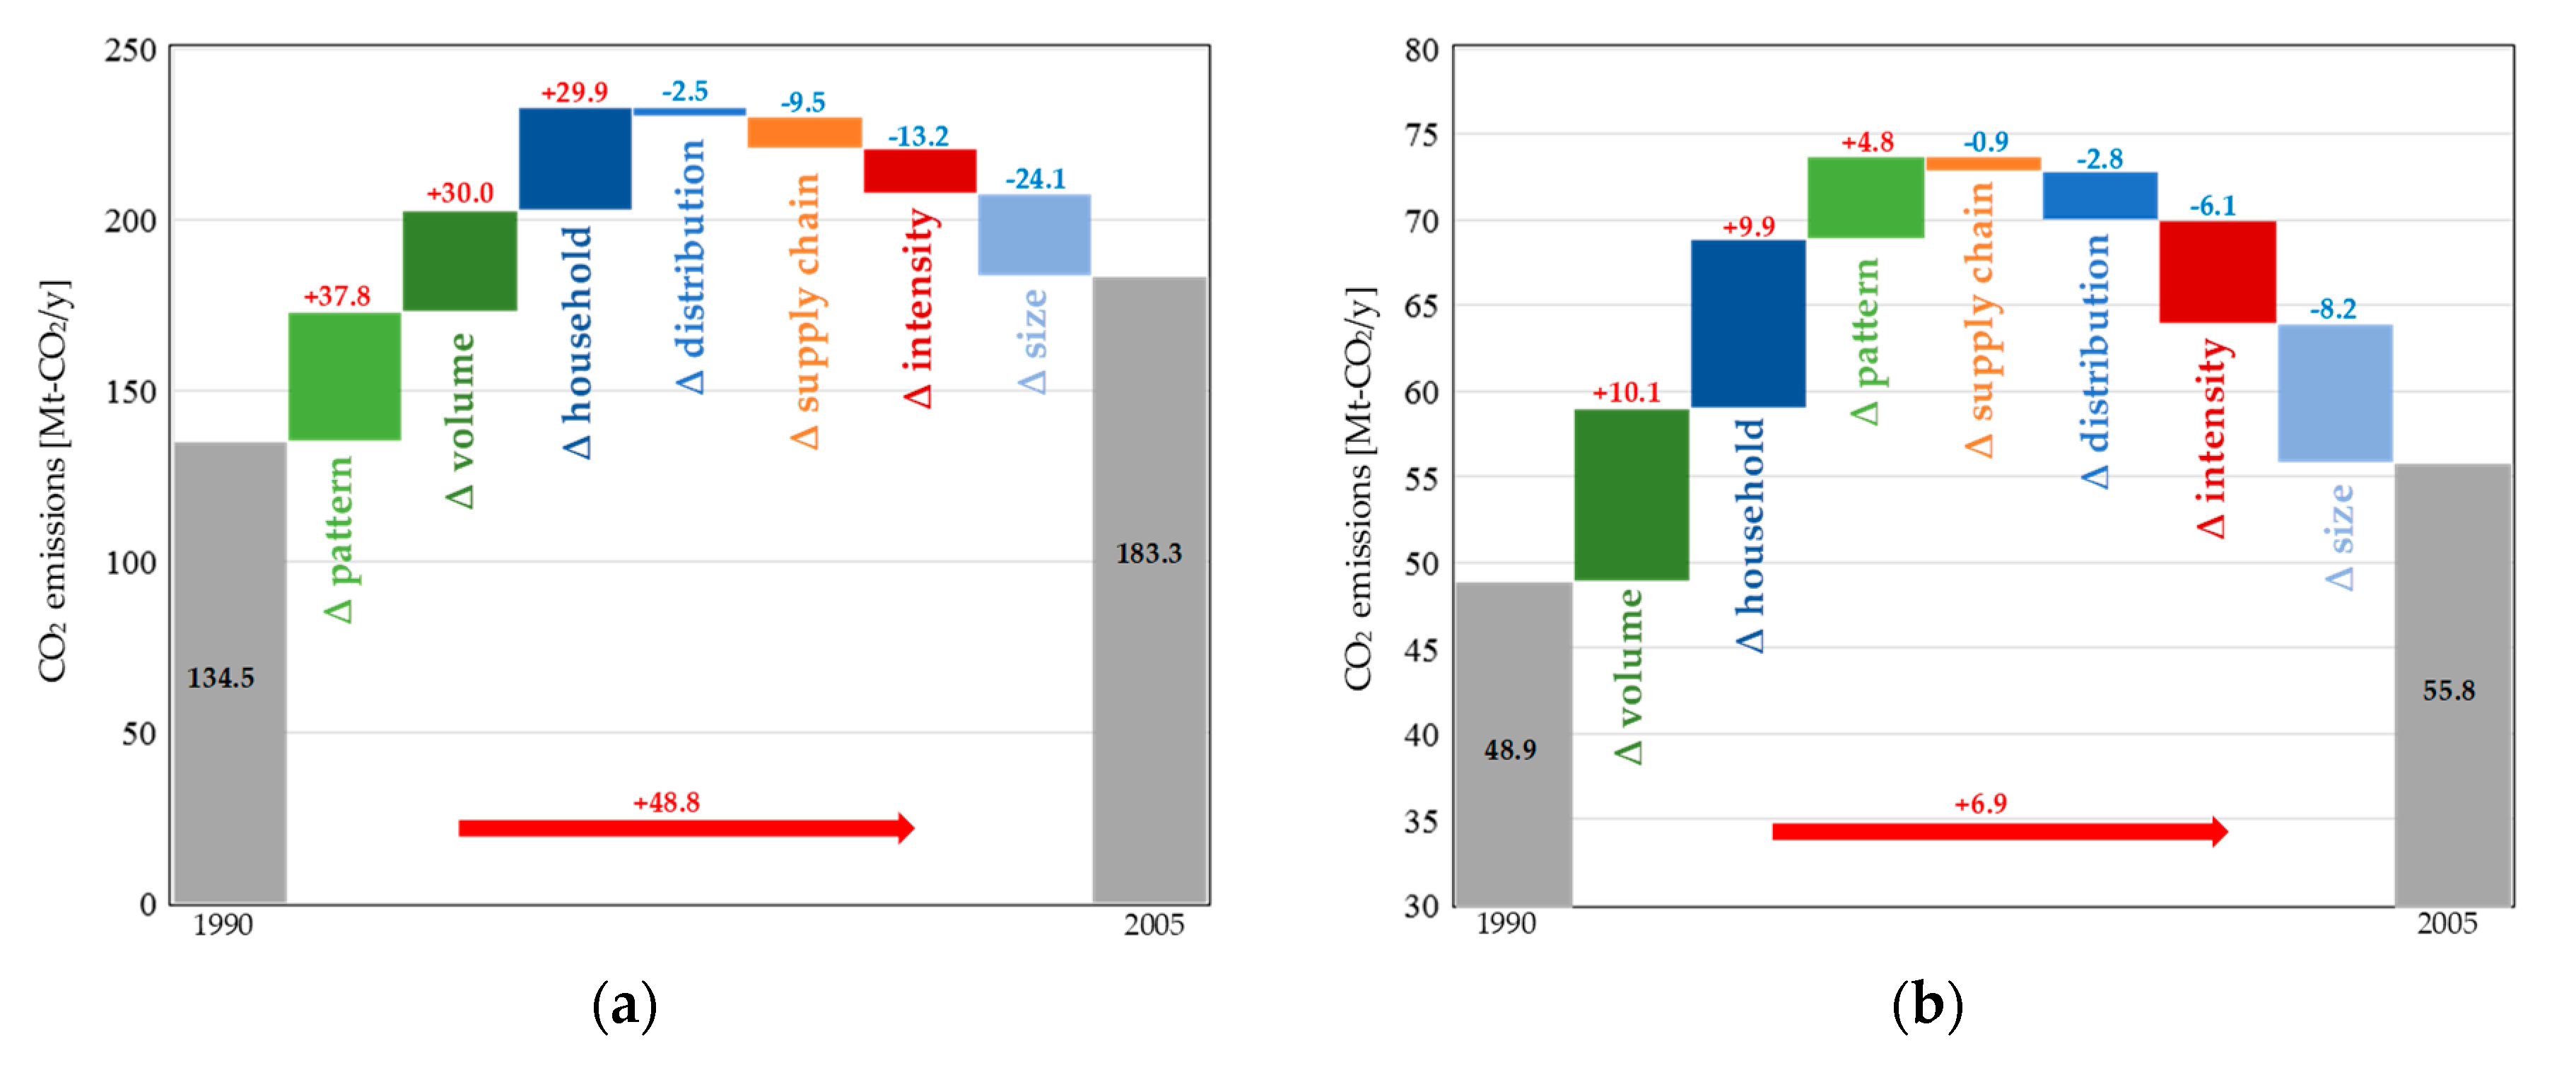
As for indirect CO2 emissions, both the total emissions and change in emission levels were higher than for direct CO2 emissions, and the sectoral composition of indirect CO2 emissions is more diverse. Further, the change in driving forces of indirect CO2 emissions are relatively complex. Figure 5 shows the SDA result for indirect CO2 emissions in 1990–2005. Indirect CO2 emissions grew rapidly from 1990 to 1995 with growth slowing down during 1995–2000 and slightly accelerating thereafter. This may be due to the post-bubble economy in which Japan adopted government intervention policies to stimulate the recovery of the economy and increase residential consumption, resulting in an increase in indirect CO2 emissions between 1990 and 1995. With the change in policy direction from economic stimulus to economic constraint (including raising the consumption tax and increasing medical expenses in 1997) [43,44], the growth rate of indirect CO2 emissions slowed down in 1995–2000. After 2000, due to the effect of the internet bubble in the United States [45], Japan was forced to introduce looser monetary policies to stimulate economic development which increased its indirect emissions to some extent. With the increase in the number of households, the positive impact of the number of households on indirect CO2 emissions has gradually increased, becoming one of the main factors promoting indirect CO2 emissions post-2000. The positive impact of the supply chain structure on indirect CO2 emissions increased slightly before 2000, shifting to a negative effect after 2000. This may be caused by the transformation and maturing of enterprise, eliminating excess employment, equipment and debt through a severe restructuring process from the late 1990s to the early 2000s. From the 1990s, along with an emphasis on environmental protection and energy saving (e.g., the Kyoto Protocol adopted in 1997), the impact of the supply chain structure toward CO2 emissions became negative, which reflects the great development of low-carbon technology in the whole supply chain. The negative impact of the intensity effect on indirect CO2 emissions increased from 1990 to 2000 and weakened thereafter. After the bubble economy, economic recovery may be an important reason for the change in intensity effect. The impact of the consumption pattern on indirect CO2 emissions changed from negative to positive from 1995 to 2000, turning to negative once more after 2000, although this impact was relatively small. Because of the economic stimulus policy post-bubble economy, the choices of consumers tended to be toward high-quality and environment-friendly consumption, causing the consumption pattern to inhibit indirect CO2 emissions. However, during the period of economic constraint policies, consumers tended to choose goods with a high performance and low price, reducing the environmental awareness of consumption, resulting in a positive consumption pattern impact.
Summarizing the effect of household size, the number of households and household distribution in 1995, 2000 and 2005 and observing the changes, it was identified that the effect is gradually changing toward the positive and increasing. This shows that if Japan maintains an aging society with a low birth rate, the indirect CO2 emissions generated by households will continue to grow.
3.3.2. Driving Forces of Indirect CO2 Emissions of Key Sectors
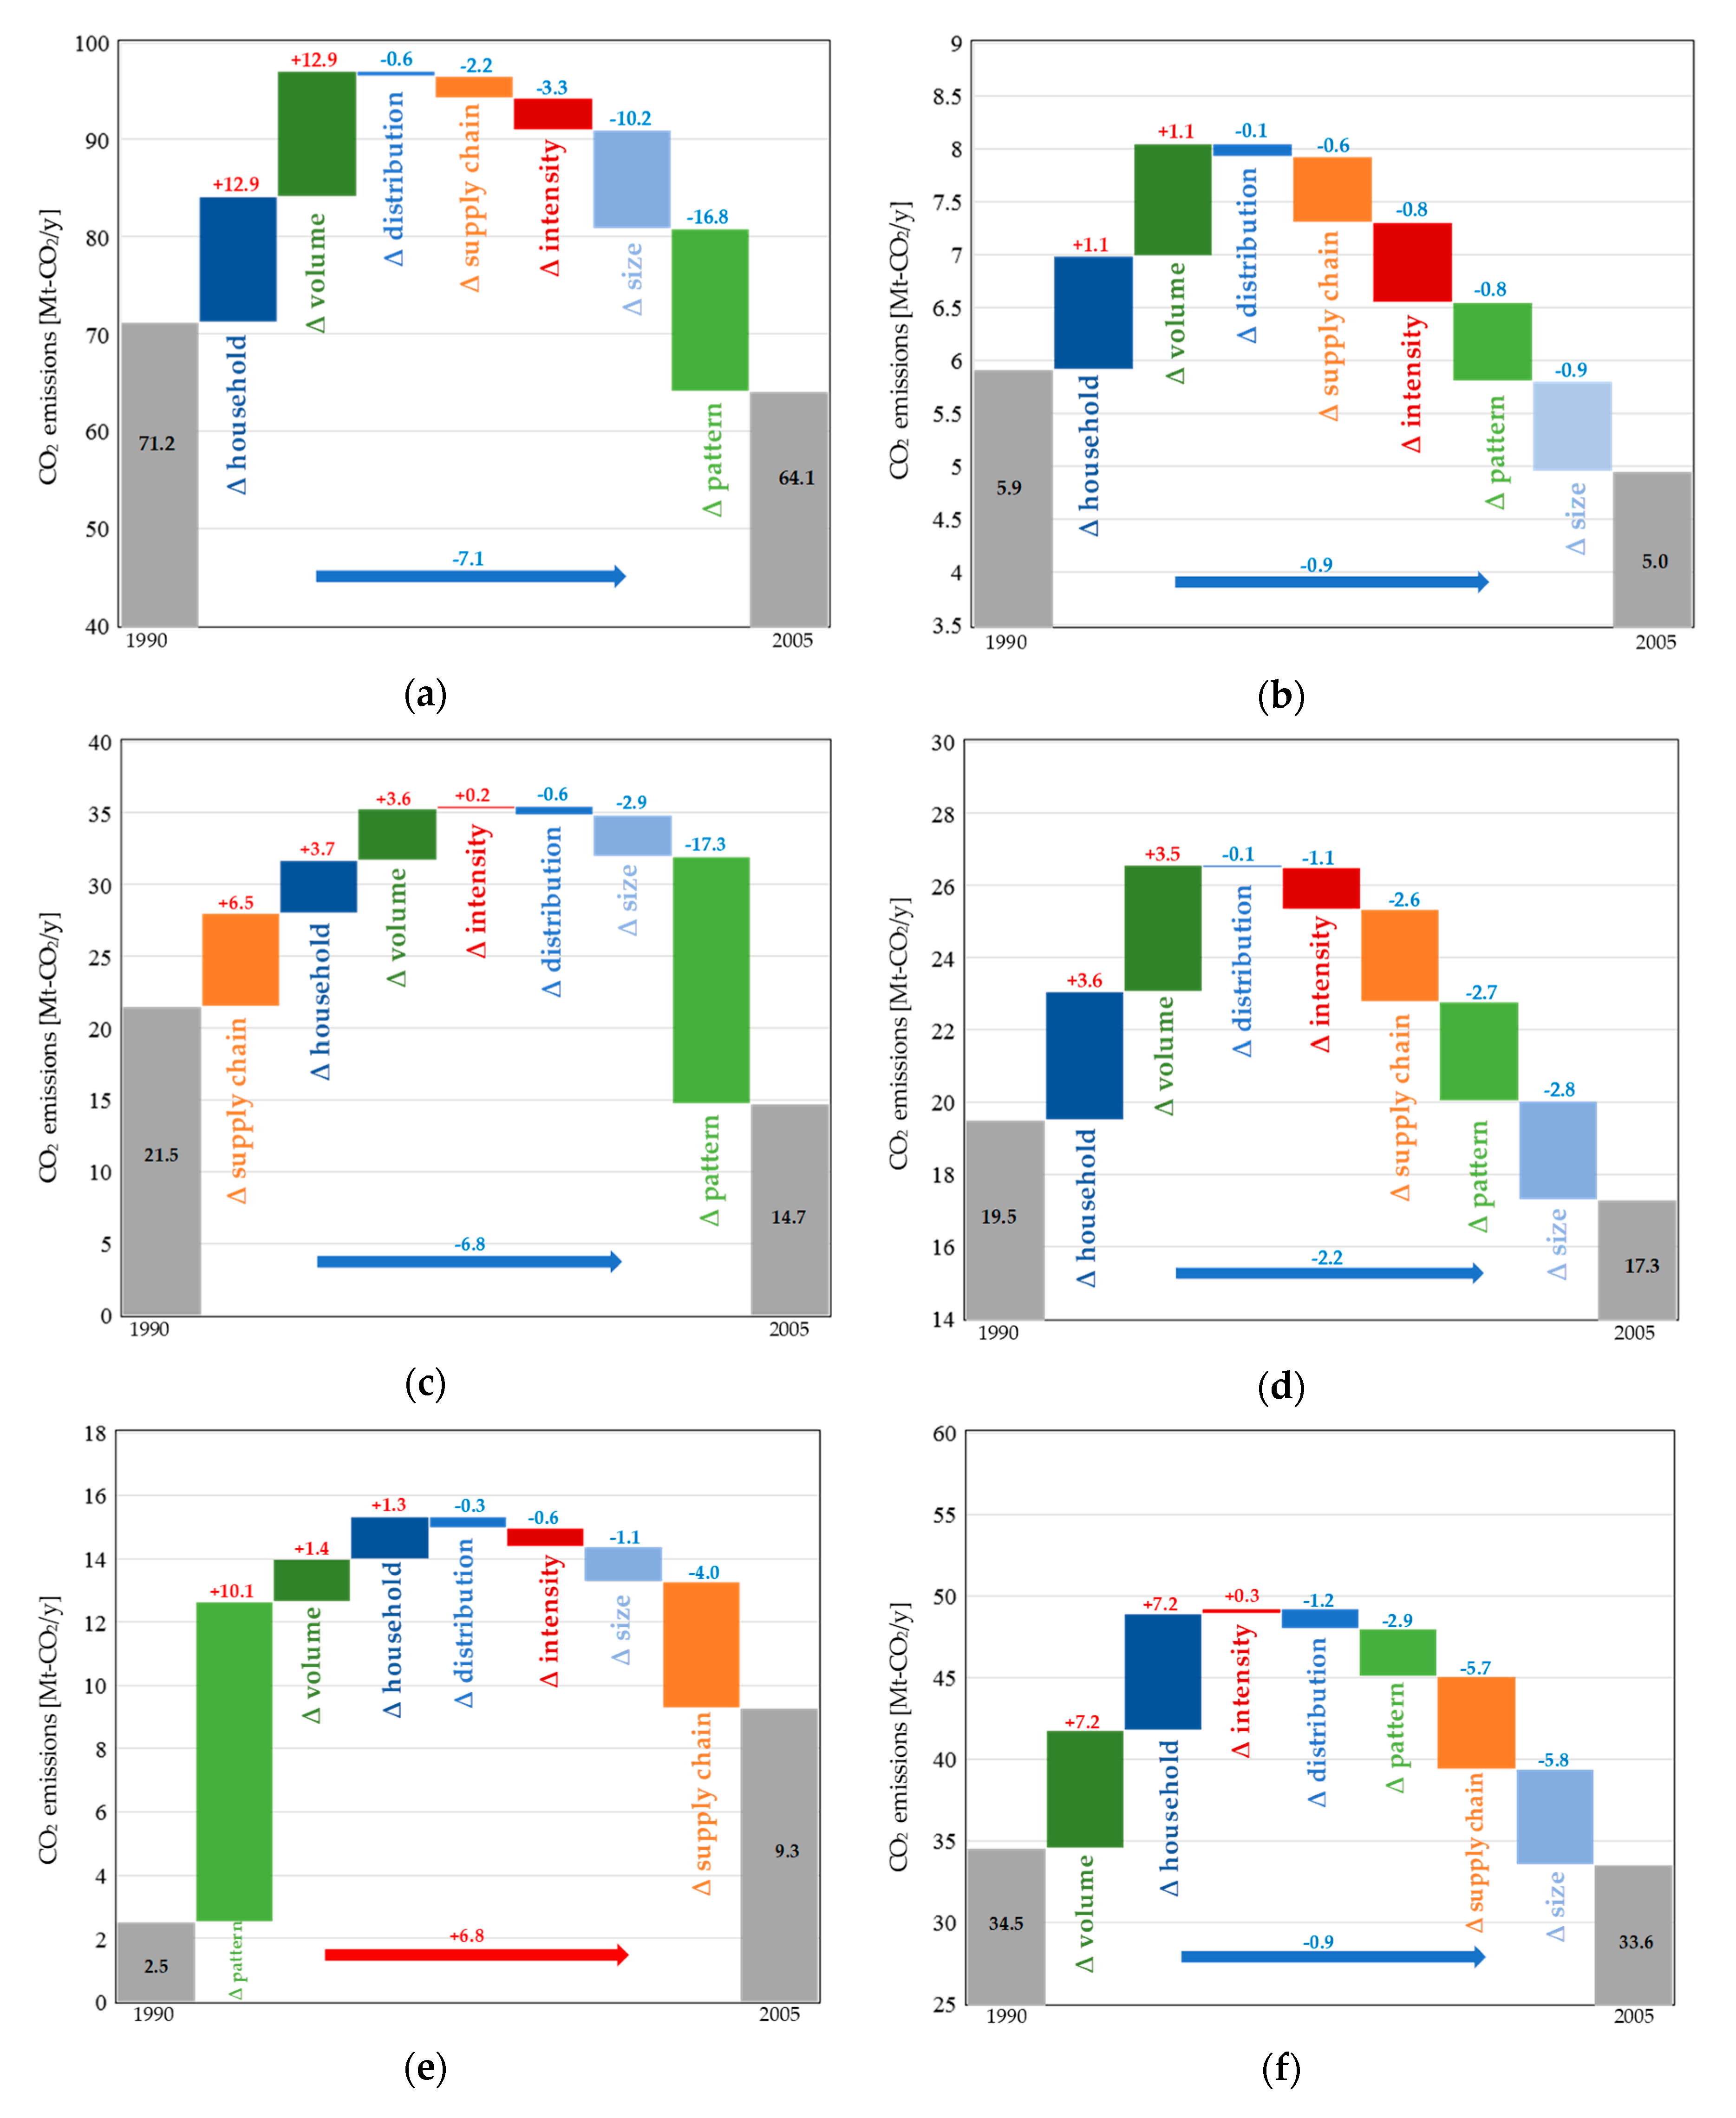
By observing the changes in indirect CO2 emissions in different sectors, this study identified four sectors with significant growth (amount) in indirect CO2 emissions from 1990–2005. These are the housing, medical, private vehicle and public transport sectors. We emphasize discussion about the decomposition results for these four sectors, as shown in Figure 6, because we consider it essential with regard to the relationship between an aging, shrinking population and increasing household CO2; those for the other 10 sectors and additional insights for the two most remarkable sectors showing the highest and lowest growth rate (i.e., the information and communication and clothes and footwear sectors, respectively) are detailed in Appendix A.
First, the housing sector (Figure 6a), which produced the largest indirect CO2 emissions at any time between 1990 and 2005, increased consistently between 1990 and 2005. The technology and size effects are the main drivers which reduce indirect CO2 emissions. The rapid development of energy-related technologies has greatly reduced the indirect CO2 emissions from housing. At the same time, with the growth of single-member families, the proportion of small-scale households has gradually increased [46]. Compared with average-sized households, small-scale households utilize a lower number of consumables and appliances (e.g., air-conditioners, etc.), leading to a lower level of indirect CO2 emissions. The number of households, consumption volume, and consumption pattern were the main drivers of CO2 emissions growth. From 1990 to 2005, the number of households in Japan expanded. At the same time, the increase in single-member households has increased the demand for housing, further expanding consumption volumes. Therefore, the positive impact of the number of households and consumption volume on indirect CO2 emissions increased. As for the consumption pattern, residents seeking a better quality of life tend to invest in quality of life outcomes, leading to an increase in indirect CO2 emissions.
The public transport sector is the second-largest indirect CO2 emitter among the four sectors. As shown in Figure 6b, changes in consumption volume and the number of households were the main drivers which promoted the growth of indirect CO2 emissions in this sector. The number of households in Japan continued to grow from 1990 to 2005, increasing the positive effect, while, due to economic situation changes, residents might choose public transport in order to reduce living costs. An increase in environmental awareness has also prompted people to use more public transport. In addition, indirect CO2 emissions have been restricted to a large extent by the household size and household distribution effects. The reason for this may be that small-scale households may prefer to travel by lower-cost public transport when compared to private transport, with the same trend shown by the elderly. Moreover, the development of low-carbon technologies has also greatly reduced the CO2 emissions associated with the public transport sector.
The private vehicle sector is one of the main sources of direct CO2 emissions from households (see Figure 1), while this sector also has a strong impact on indirect CO2 emissions. With the increasing number of households in Japan [46], the demand for private cars is also expanding [42], causing the number of households and consumption volume effects to become important drivers in promoting indirect CO2 emissions in this sector, as shown in Figure 6c. The supply chain effect has increased indirect CO2 emissions, which is likely due to economic globalization, causing the production and manufacture of automobiles to be regionally diversified, whereby technological differences in production and transport between regions may place upward pressure on indirect CO2 emissions. The consumption pattern has become the main driver restricting indirect CO2 emissions, perhaps because people have become more likely to use public transport due to the abovementioned reasons, although many households still have a need for a private vehicle. With increasing awareness of environmental protection, households are willing to consider the purchase of environmentally friendly automobile models. Meanwhile, with the development of automobile manufacturing technology, consumers are more willing to buy fuel-efficient vehicles. Household size and household distribution effects had a stable, inhibitory effect on indirect CO2 emissions, mainly because an aging society and the increase in households with less members reduced the consumption of private vehicles.
Although the medical sector has the lowest indirect CO2 emissions among the four sectors analyzed, it has the highest growth rate, at 73% (Figure 6d). Considering the current situation of Japan’s aging society, the medical sector has a great impact on the lives of elderly people. Therefore, it is of great practical significance to analyze the influencing factors of indirect CO2 emissions in the medical sector. Consumption patterns and consumption volume have strongly contributed to the increase in indirect CO2 emissions as elderly households increase. In the context of an aging society, Japan’s elderly population continues to grow, leading to the continued expansion of national medical expenditure. Furthermore, the proportion of imported drugs has been gradually increasing [42], which is also the main reason for the decreasing impact of supply chain structure on indirect CO2 emissions. Though the impact of technology on indirect CO2 emissions changed during 1990–2005, it has always been negative. This is probably due to the continuous development of medical manufacturing technologies which are more environmentally conscious. Finally, the household size also plays an important role in inhibiting indirect CO2 emissions. The decrease in household size (i.e., a relative increase in the share of small households in the total households) has greatly reduced household consumption of medicine and consequently reduced indirect CO2 emissions to a certain extent.
4. Conclusions
This study identified the driving forces of direct and indirect household CO2 emissions (i.e., household CF) both overall and at the sectoral level using IDA and SDA. In the analysis, emissions from different age groups were also considered. The main findings from our analysis are as follows:
- Among household-related CF during 1990–2005, indirect CO2 emissions kept increasing from 1990, although direct CO2 emissions slowed down between 2000 and 2005.
- Per capita CO2 emissions of direct and indirect emissions by household age group showed similar distributions during the studied period. Emissions begin to rise from the 20s and decline after peaking in the 50s. In addition, the level of both direct and indirect emissions per capita did not change radically during the analyzed 15-year period.
- The two decomposition analyses for direct and indirect CO2 emissions showed that the effects of changes in household size due to the trend away from nuclear family structures and production technology progress restrained indirect CO2 emissions to a large extent. On the other hand, the results also showed that if Japan continues to follow current consumption and demographic trajectories (i.e., the aging society becoming an ‘aged’ society), both of those emissions will increase regarding the contributions from related drivers.
- Decomposition analysis for the sectoral CF showed that the main factors leading to the increase in indirect CO2 emissions were the increase in the number of households and consumption volume. Regarding aging and a reduced birth rate, the increase in small-scale households has increased the overall number of households in Japan due to changing family structures, which has expanded household consumption volume per capita—an important driving force behind increasing household CF.
Based on these findings, the following conclusions are offered to contribute toward achieving Japan’s future carbon reduction target. It is necessary to comprehensively consider the household CF, and, considering the impact of an aging society on Japan’s overall CO2 emissions, more practical measures should be taken to reduce CO2 emissions by sector. Specifically, the following policy implications are proposed based on our findings.
First, carbon-reduction policies in an aging society should consider demographic influences. Under an aging society with an increase in the proportion of elderly people, the proportion of young people will gradually decrease. Therefore, household-related sectors need to pay more attention to the CO2 emissions from consumption by elderly people. In addition, from the perspective of factors affecting CO2 emissions within sectors, the increase in small-sized households greatly increase CO2 emissions. Thus, for further CO2 emission reductions, enterprises in household-related sectors should adjust their business orientation to meet the needs of small-scale households.
Second, consumers should be encouraged to consume responsibly; i.e., by choosing environmentally friendly products or restricting the irresponsible consumption of goods and services (e.g., less food waste). As a first step toward doing so, considering the fact that the indirect CO2 emissions of residents’ lives are higher than their direct CO2 emissions, it is imperative that householders are made aware of this fact. This educational aspect will be essential in order to reduce indirect CO2 emissions as well as promoting low-carbon production for industry. The government should expand financial support for enterprises to develop low-carbon technologies to alleviate financial pressures and stimulate enterprise to invest in related research and development. From the consumer side, the key is to develop green-consumption awareness and to encourage the purchase of environmental-friendly commodities. For example, for household products, which account for a large proportion of households’ indirect CO2 emissions, financial support should be provided when purchasing environmentally friendly products. Moreover, a healthy lifestyle is of great significance for residents to reduce potential CO2 emissions; for instance, healthy living habits can keep the body in good condition, which is likely to reduce certain medical expenses and decrease the indirect CO2 emissions from the medical sector.
In addition to policy implications from the domestic perspective, there is also an important implication from the international perspective. Although the aging society is a serious issue in Japan, this issue is also emerging in developed countries. Even for developing countries, China is also beginning to experience an aging society. Therefore, achieving the goal of CO2 mitigation under the constraints of an aging society has important practical significance for many countries. In order to reduce per household emissions, policy encouraging multi-generational households may be appropriate. A complementary policy for per capita emission amelioration may be to encourage the sharing economy, whereby individual consumption is offset by shared facilities and conveniences (i.e., car sharing, etc.). As illustrated above, such a demographic shift would gradually change toward the positive and increase indirect CO2 emissions to a level which is higher than direct emissions, which is associated with an increase in the number of households rather than population. Thus, it should be noted that efforts for recovering the population and labor force through policy measures will eventually lead to an increase in overall CO2 emissions. On the basis of clarifying influential factors toward the CF, particularly those for sectors which presented an increasing trend such as food, public transport, private transport, and the medical sector, the implementation of carbon reduction schemes are crucial. Furthermore, the government needs to formulate fit-for-purpose carbon reduction policies based on the characteristics of CF for different age groups. Finally, because the aging society issue occurs over a very long time-span, CO2 emission reduction policies should be continuously adjusted according to the evolution of demographic changes.
Author Contributions
Conceptualization, Y.S. and K.M.; methodology, Y.S.; software, Y.S.; validation, K.M; formal analysis, Y.S.; investigation, Y.H.; resources, Y.S.; data curation, Y.S.; writing—original draft preparation, Y.H. and Y.S.; writing—review and editing, A.C. and K.M.; visualization, Y.H. and Y.S.; supervision, K.M.; project administration, Y.S.; funding acquisition, Y.S. and K.M.
Funding
This research was supported by JSPS KAKENHI Grant Numbers JP18K11754, JP18K11800, and JP18K18231; and the Integrated Research Program for Advancing Climate Models (TOUGOU program) of MEXT. These organizations did not have any involvement or influence in the implementation of this study.
Conflicts of Interest
The authors declare no conflict of interest. The funding sponsors had no role in the design of the study; in the collection, analyses, or interpretation of data; in the writing of the manuscript; or in the decision to publish the results.
Appendix A
Figure A1 depicts direct and indirect CO2 emissions per household during the period 1990–2005. Among age groups, both direct and indirect CO2 emissions per household for those in their 50s were estimated to be the largest, followed by those in their 40s during all periods. This is mainly because their average household income and family size were larger than for other households (e.g., in 2005, the average household income and family size in their 50s and 40s are 7.83 and 7.25 M-JPY/y and 2.87 and 3.17 people/household, respectively). While indirect CO2 emissions for those in their 60s were the third largest for the 15 years investigated, their direct CO2 emissions were fourth—smaller than for those in their 30s from 1990 to 2000. In 2005, emissions in the 60s group increased to become larger than for the 30s. Comparing the per household results to the per capita results, as presented in Figure 1b and Figure 2b, the largest emissions were seen from those in their 50s. However, the orders of magnitude of indirect CO2 emissions for those in their 40s and 60s differs between per household and per capita results, as seen in the emissions levels for 1990 and 2005. This is also observed for direct CO2 emissions for households aged between their 20s and 70s. These differences between per household and per capita are most affected by the average family size and composition of households (as described in the body of this study).
Figure A1.
Sectoral composition of per household CO2 emissions by age group (t-CO2/y) from 1990 to 2005. (a) Direct and (b) indirect.
Figure A1.
Sectoral composition of per household CO2 emissions by age group (t-CO2/y) from 1990 to 2005. (a) Direct and (b) indirect.
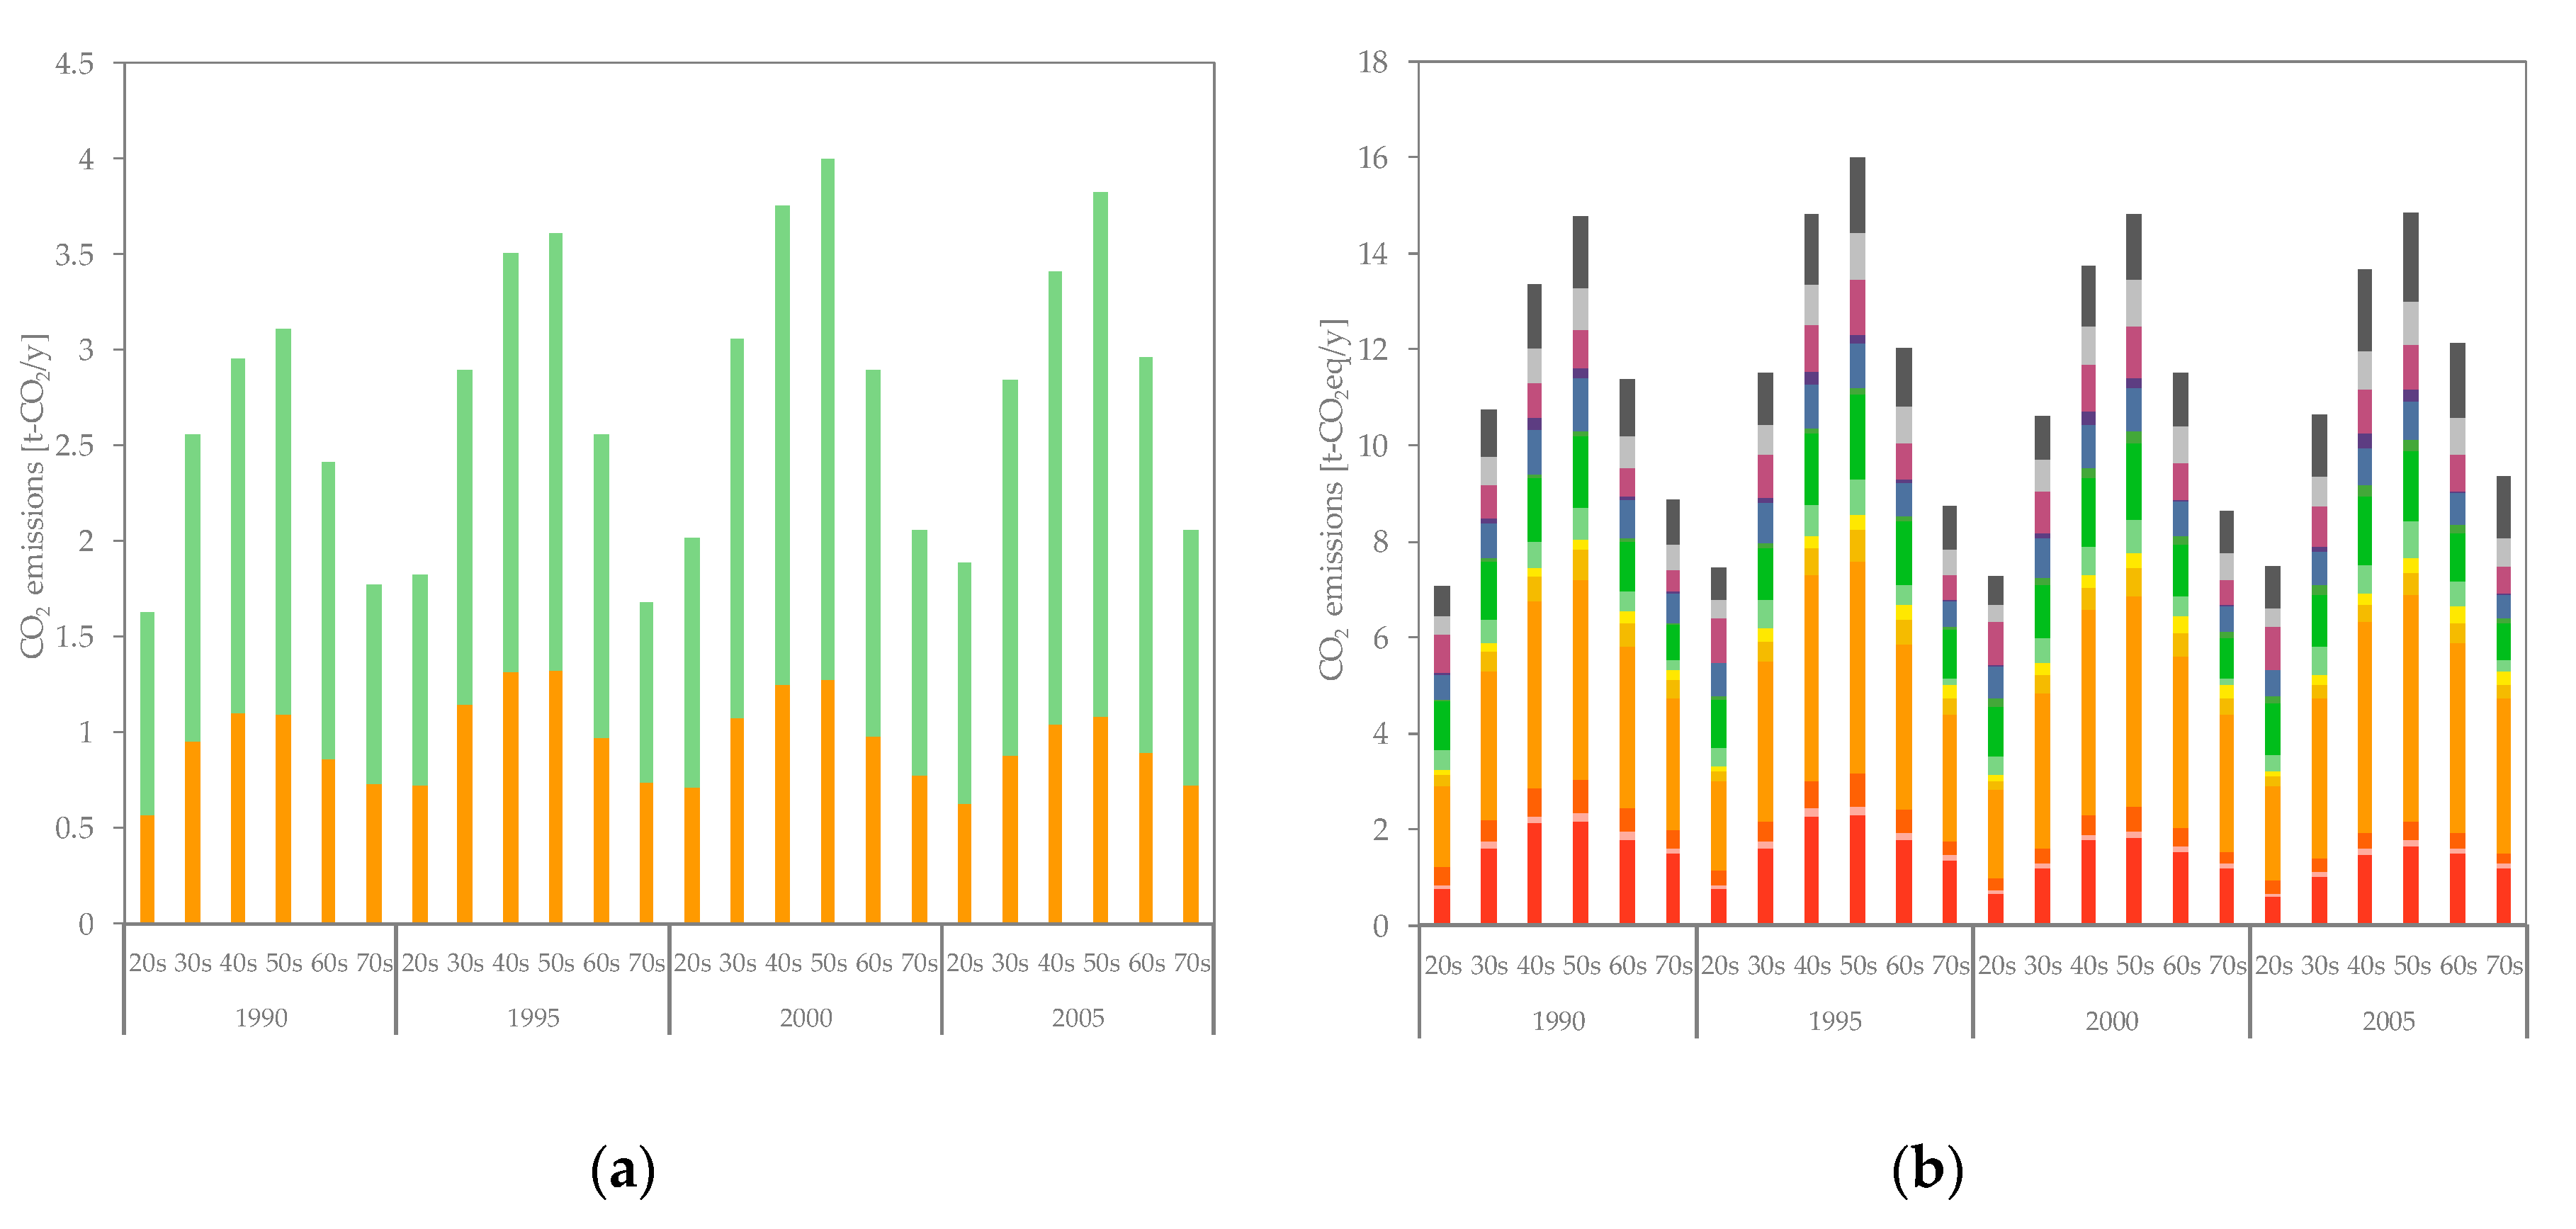
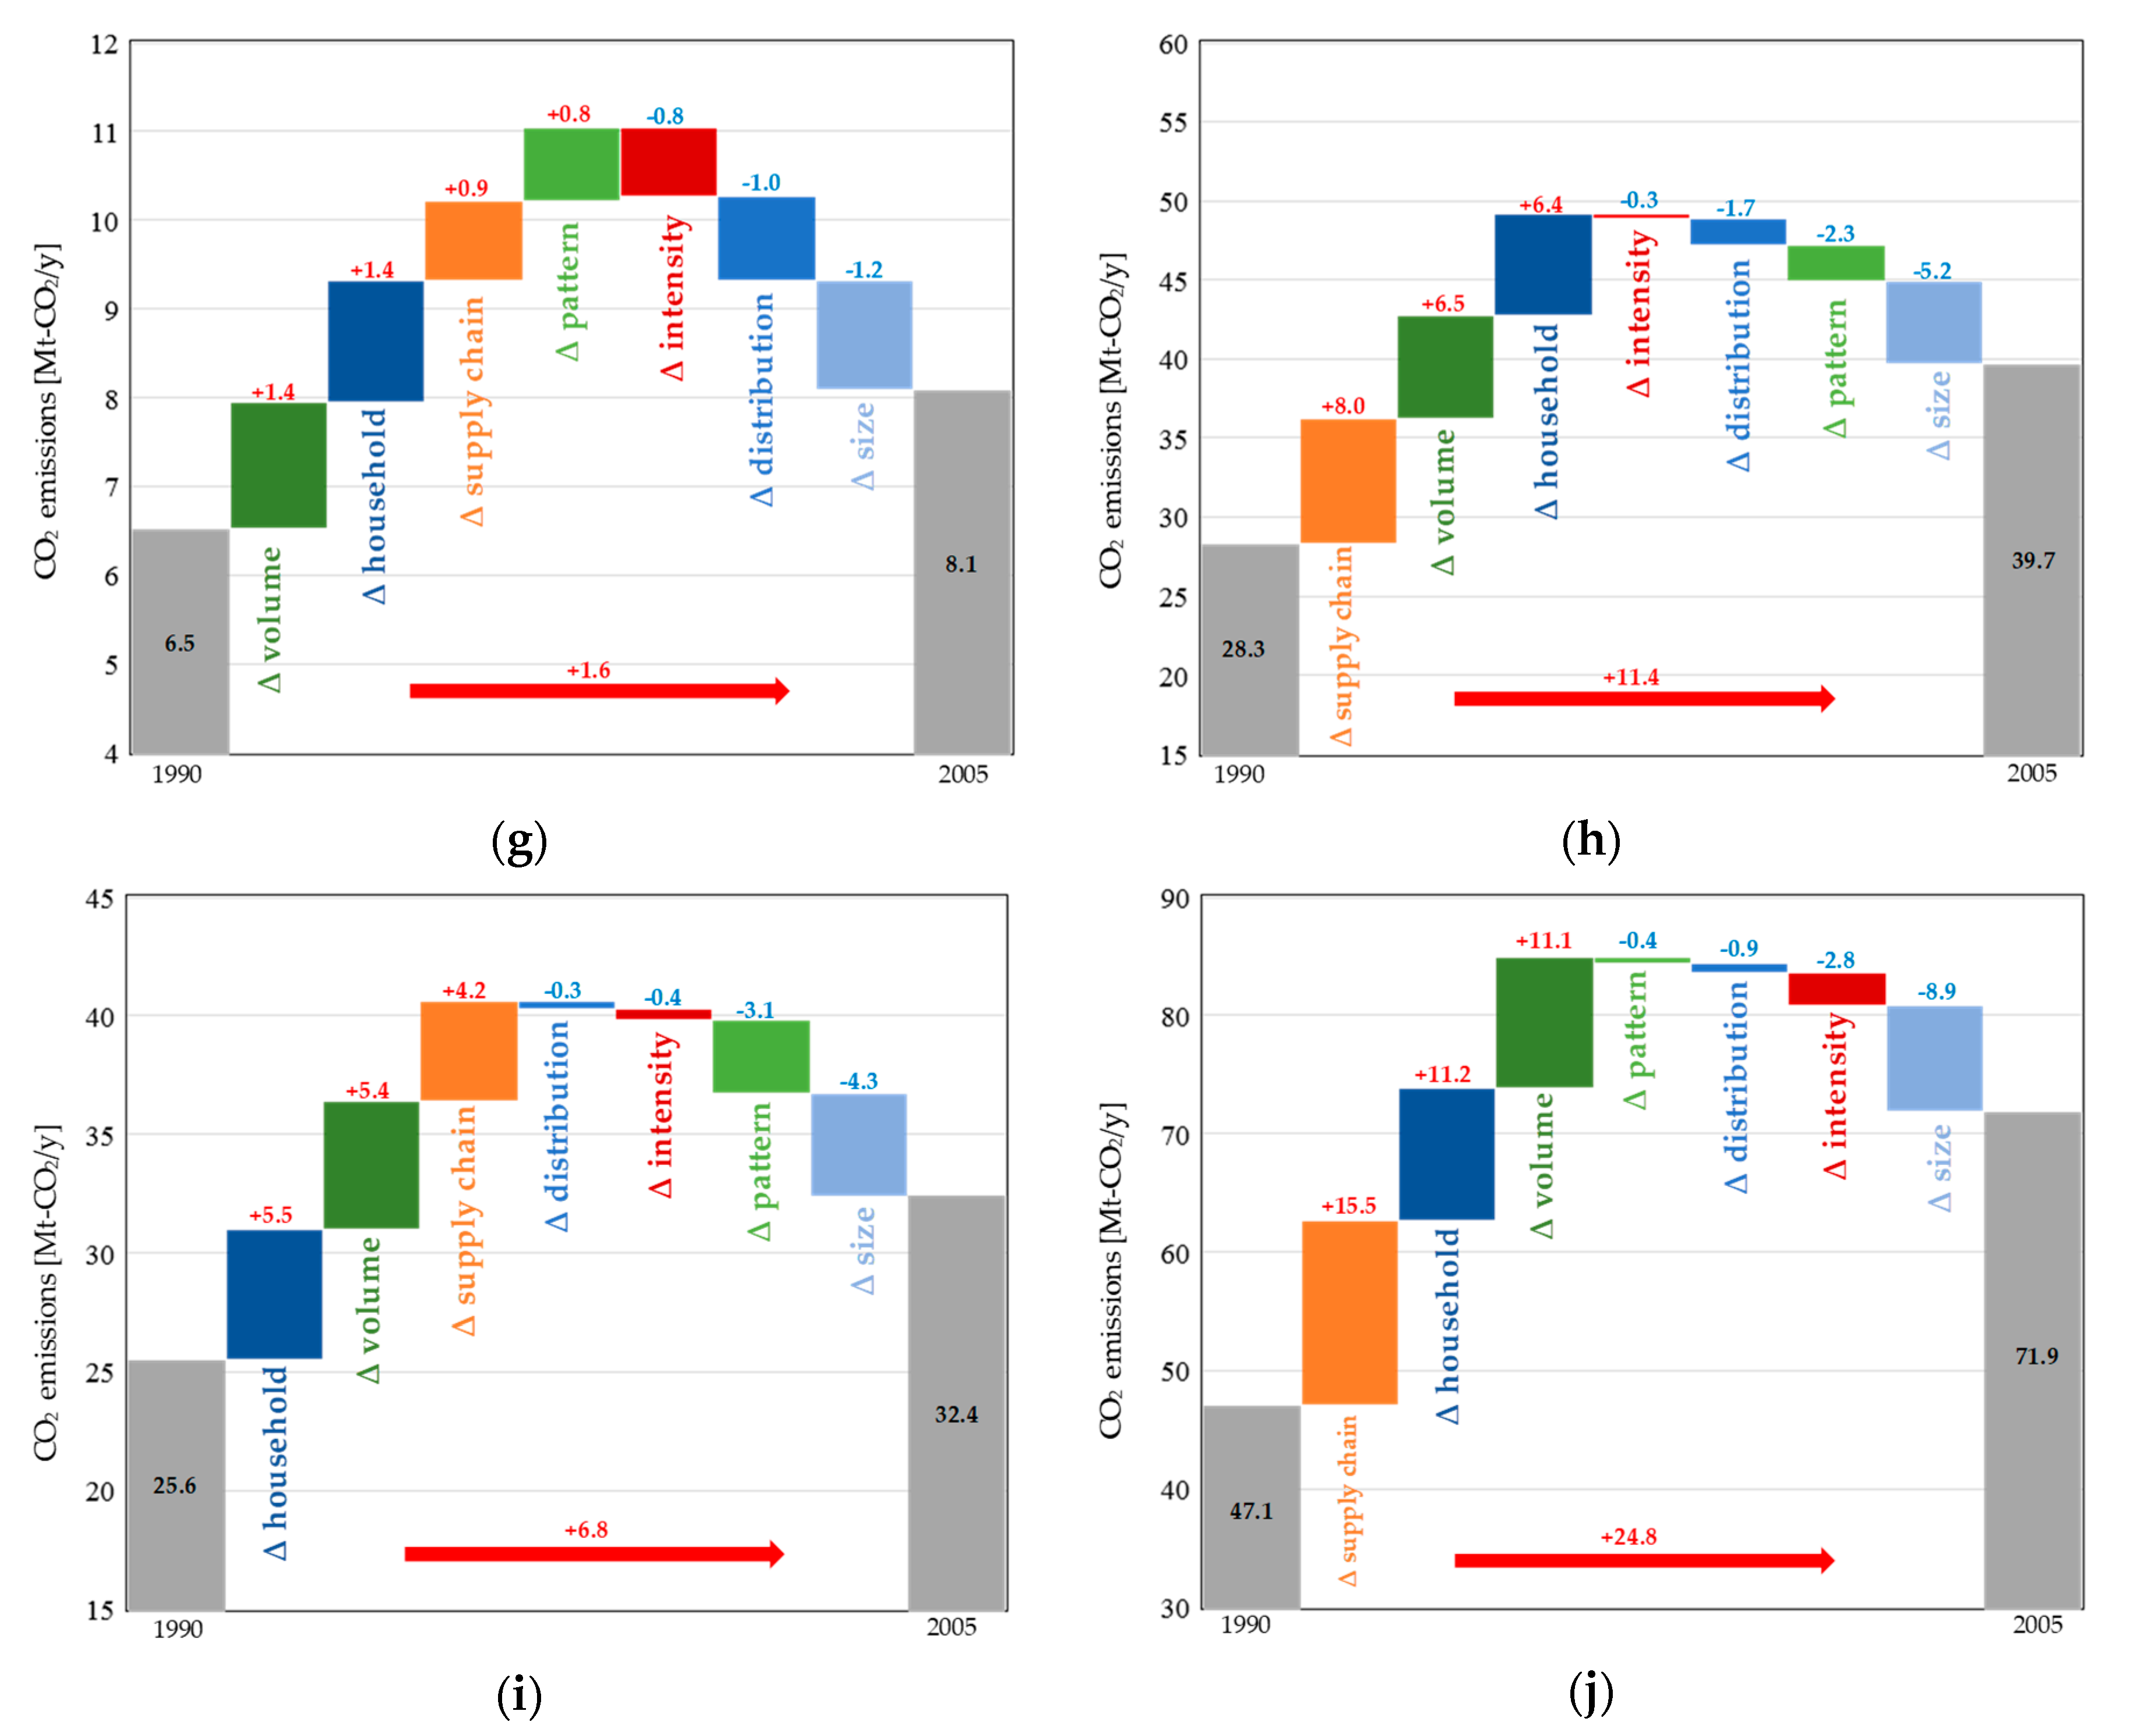
Figure A2 depicts a sectoral-level decomposition analysis for indirect CO2 emissions, except for the sectors discussed in Section 3.3.2. Note that the highest and lowest growth rates of indirect emissions were shown in the information and communication and clothing and footwear sectors, respectively. The growth rate in the information and communication sector was 267%, while that in the clothing and footwear sector was −31% during the studied period. The reasons behind these changes can be explained as follows. In the information and communication sector, the pattern effect was the major factor underpinning an increase in emissions (Figure A2e). From the end of the 20th century, the world, including Japan, began to enter into the information technology age, and computers and the internet began to spread. At the same time, mobile phones also became more common. This means that information and communication technology penetrated into daily life, and the consumption of such technologies has rapidly increased, having a commensurate effect on indirect emissions.
In the clothing and footwear sector, the pattern effect was also the main factor responsible for reducing indirect emissions (Figure A2c). During the studied period, the outsourcing of production in this sector to developing Asian countries reduced production costs (as a result, the supply chain effect became positive during this period). At the same time, fast fashion became popular (Uniqlo, etc.). These complementary phenomena resulted in a lower consumption of apparel and led to a reduction in indirect emissions.
Figure A2.
SDA results for indirect CO2 emissions between 1990 and 2005 for ten sectors not shown in Section 3.3.2. ∆intensity is intensity effect, ∆supply chain is the supply chain structure effect, ∆pattern is the consumption pattern effect, ∆volume is the consumption volume effect, ∆size is the household size effect, ∆distribution is the household distribution effect, and ∆household is the household number effect. (a) Food and non-alcoholic beverages, (b) alcoholic beverages and tobacco, (c) clothing and footwear, (d) furnishings, (e) information and communication, (f) recreation and culture, (g) education, (h) restaurants and hotels, (i) consumable goods, and (j) margins, religions and other services.
References
- IPCC Global Warming of 1.5 °C. Summary for Policymakers. Available online: https://www.ipcc.ch/sr15/ (accessed on 20 July 2019).
- Peters, G.P. From production-based to consumption-based national emission inventories. Ecol. Econ. 2008, 65, 13–23. [Google Scholar] [CrossRef]
- Davis, S.J.; Caldeira, K. Consumption-based accounting of CO2 emissions. Proc. Natl. Acad. Sci. USA 2010, 107, 5687–5692. [Google Scholar] [CrossRef] [PubMed]
- Wiedmann, T. A review of recent multi-region input-output models used for consumption-based emission and resource accounting. Ecol. Econ. 2009, 69, 211–222. [Google Scholar] [CrossRef]
- Hertwich, E.G. The Life Cycle Environmental Impacts Of Consumption. Econ. Syst. Res. 2011, 23, 27–47. [Google Scholar] [CrossRef]
- Zhang, X.; Luo, L.; Skitmore, M. Household carbon emission research: An analytical review of measurement, influencing factors and mitigation prospects. J. Clean. Prod. 2015, 103, 873–883. [Google Scholar] [CrossRef]
- Wiedenhofer, D.; Smetschka, B.; Akenji, L.; Jalas, M.; Haberl, H. Household time use, carbon footprints, and urban form: a review of the potential contributions of everyday living to the 1.5 °C climate target. Curr. Opin. Environ. Sustain. 2018, 30, 7–17. [Google Scholar] [CrossRef]
- Ivanova, D.; Stadler, K.; Steen-Olsen, K.; Wood, R.; Vita, G.; Tukker, A.; Hertwich, E.G. Environmental Impact Assessment of Household Consumption. J. Ind. Ecol. 2016, 20, 526–536. [Google Scholar] [CrossRef]
- IEA. Key World Energy Statistics 2016; IEA: Paris, France, 2016. [Google Scholar]
- Shigetomi, Y.; Nansai, K.; Kagawa, S.; Tohno, S. Fertility-rate recovery and double-income policies require solving the carbon gap under the Paris Agreement. Resour. Conserv. Recycl. 2018, 133, 385–394. [Google Scholar] [CrossRef]
- Shigetomi, Y.; Matsumoto, K.; Ogawa, Y.; Shiraki, H.; Yamamoto, Y.; Ochi, Y.; Ehara, T. Driving forces underlying sub-national carbon dioxide emissions within the household sector and implications for the Paris Agreement targets in Japan. Appl. Energy 2018, 228, 2321–2332. [Google Scholar] [CrossRef]
- Nansai, K.; Kagawa, S.; Kondo, Y.; Suh, S.; Nakajima, K.; Inaba, R.; Oshita, Y.; Morimoto, T.; Kawashima, K.; Terakawa, T.; et al. Characterization of economic requirements for a “carbon-debt-free country”. Environ. Sci. Technol. 2012, 46, 155–163. [Google Scholar] [CrossRef]
- Shigetomi, Y.; Nansai, K.; Kagawa, S.; Tohno, S. Changes in the Carbon Footprint of Japanese Households in an Aging Society. Environ. Sci. Technol. 2014, 48, 6069–6080. [Google Scholar] [CrossRef] [PubMed]
- Shigetomi, Y.; Nansai, K.; Kagawa, S.; Tohno, S. Influence of income difference on carbon and material footprints for critical metals: the case of Japanese households. J. Econ. Struct. 2016, 5, 1. [Google Scholar] [CrossRef] [Green Version]
- Takase, K.; Kondo, Y.; Washizu, A. An analysis of sustainable consumption by the waste input-output model. J. Ind. Ecol. 2005, 9, 201–219. [Google Scholar] [CrossRef]
- Kawajiri, K.; Tabata, T.; Ihara, T. Using a Rebound Matrix to Estimate Consumption Changes from Saving and its Environmental Impact in Japan. J. Ind. Ecol. 2015, 19, 564–574. [Google Scholar] [CrossRef]
- Long, Y.; Dong, L.; Yoshida, Y.; Li, Z. Evaluation of energy-related household carbon footprints in metropolitan areas of Japan. Ecol. Model. 2018, 377, 16–25. [Google Scholar] [CrossRef]
- Long, Y.; Yoshida, Y.; Meng, J.; Guan, D.; Yao, L.; Zhang, H. Unequal age-based household emission and its monthly variation embodied in energy consumption—A cases study of Tokyo, Japan. Appl. Energy 2019, 247, 350–362. [Google Scholar] [CrossRef]
- Sovacool, B.K.; Kester, J.; Noel, L.; de Rubens, G.Z. The demographics of decarbonizing transport: The influence of gender, education, occupation, age, and household size on electric mobility preferences in the Nordic region. Glob. Environ. Chang. 2018, 52, 86–100. [Google Scholar] [CrossRef]
- Ang, B.W.; Zhang, F.Q. A survey of index decomposition analysis in energy and environmental studies. Energy 2000, 25, 1149–1176. [Google Scholar] [CrossRef]
- Rose, A.; Casler, S. Input-output structural decomposition analysis: a critical appraisal. Econ. Syst. Res. 1996, 8, 33–62. [Google Scholar] [CrossRef]
- Ang, B.; Zhang, F.; Choi, K.-H. Factorizing changes in energy and environmental indicators through decomposition. Energy 1998, 23, 489–495. [Google Scholar] [CrossRef]
- Xu, X.Y.; Ang, B.W. Index decomposition analysis applied to CO2 emission studies. Ecol. Econ. 2013, 93, 313–329. [Google Scholar] [CrossRef]
- Hoekstra, R.; van den Bergh, J.C.J.M. Comparing structural decomposition analysis and index. Energy Econ. 2003, 25, 39–64. [Google Scholar] [CrossRef]
- Lenzen, M. Structural analyses of energy use and carbon emissions—An overview. Econ. Syst. Res. 2016, 28, 119–132. [Google Scholar] [CrossRef]
- Donglan, Z.; Dequn, Z.; Peng, Z. Driving forces of residential CO2 emissions in urban and rural China: An index decomposition analysis. Energy Policy 2010, 38, 3377–3383. [Google Scholar] [CrossRef]
- Zang, X.; Zhao, T.; Wang, J.; Guo, F. The effects of urbanization and household-related factors on residential direct CO2 emissions in Shanxi, China from 1995 to 2014: A decomposition analysis. Atmos. Pollut. Res. 2017, 8, 297–309. [Google Scholar] [CrossRef]
- Xu, X.Y.; Ang, B.W. Analysing residential energy consumption using index decomposition analysis. Appl. Energy 2014, 113, 342–351. [Google Scholar] [CrossRef]
- Guan, D.; Hubacek, K.; Weber, C.L.; Peters, G.P.; Reiner, D.M. The drivers of Chinese CO2 emissions from 1980 to 2030. Glob. Environ. Chang. 2008, 18, 626–634. [Google Scholar] [CrossRef]
- Feng, K.; Davis, S.J.; Sun, L.; Hubacek, K. Drivers of the US CO2 emissions 1997–2013. Nat. Commun. 2015, 6, 7714. [Google Scholar] [CrossRef]
- Yuan, B.; Ren, S.; Chen, X. The effects of urbanization, consumption ratio and consumption structure on residential indirect CO2 emissions in China: A regional comparative analysis. Appl. Energy 2015, 140, 94–106. [Google Scholar] [CrossRef]
- Chapman, A.; Fujii, H.; Managi, S. Key Drivers for Cooperation toward Sustainable Development and the Management of CO2 Emissions: Comparative Analysis of Six Northeast Asian Countries. Sustainability 2018, 10, 244. [Google Scholar] [CrossRef]
- Okamoto, S. Impacts of Growth of a Service Economy on CO2 Emissions: Japan’s Case. J. Econ. Struct. 2013, 2. [Google Scholar] [CrossRef]
- Timilsina, G.R.; Shrestha, A. Transport sector CO2 emissions growth in Asia: Underlying factors and policy options. Energy Policy 2009, 37, 4523–4539. [Google Scholar] [CrossRef]
- Matsumoto, K.; Shigetomi, Y.; Shiraki, H.; Ochi, Y.; Ogawa, Y.; Ehara, T. Addressing Key Drivers of Regional CO2 Emissions of the Manufacturing Industry in Japan. Energy J. 2019, 40, 233–258. [Google Scholar] [CrossRef]
- Miller, R.E.; Blair, P.D. Input–Output Analysis; Cambridge University Press: Cambridge, UK, 2009; ISBN 9780511626982. [Google Scholar]
- Sun, J.W. Changes in energy consumption and energy intensity: A complete decomposition model. Energy Econ. 1998, 20, 85–100. [Google Scholar] [CrossRef]
- Dietzenbacher, E.; Los, B. Structural Decomposition Techniques: Sense and Sensitivity. Econ. Syst. Res. 1998, 10, 307–324. [Google Scholar] [CrossRef]
- Agency for Natural Resources and Energy of Japan Comprehensive Energy Statistics. Available online: https://www.enecho.meti.go.jp/statistics/total_energy/ (accessed on 20 July 2019).
- MIC NSFIE; National Survey of Family Income and Expenditure. Available online: https://www.e-stat.go.jp/stat-search/database?page=1&toukei=00200564&survey=全国消費実態調査&second=1&second2=1 (accessed on 1 May 2019).
- Nansai, K.; Moriguchi, Y. Embodied Energy and Emission Intensity Data for Japan Using Input-Output Tables. Available online: http://www.cger.nies.go.jp/publications/report/d031/jpn/datafile/embodied/2005/403.htm (accessed on 20 July 2019).
- Statistics Bureau of Japan Motor Vehicles Owned by Kind (F.Y.1936-2004). Available online: https://www.stat.go.jp/english/data/chouki/12.html?fbclid=IwAR1-62rFrm6hiZ-4nidMyIqEz1KX_W4YtvP-O4utpVG9mTEx3gURNhRkJvE (accessed on 20 July 2019).
- Choi, Y.; Hirata, H.; Kim, S.H. Tax reform in Japan: Is it welfare-enhancing? Jpn. World Econ. 2017, 42, 12–22. [Google Scholar] [CrossRef]
- MHLW; Ministry of Health Labour and Welfare Overview of Medical Service Regime in Japan. Available online: https://www.mhlw.go.jp/bunya/iryouhoken/iryouhoken01/dl/01_eng.pdf (accessed on 1 May 2019).
- Chan, Y.C. How does retail sentiment affect IPO returns? Evidence from the internet bubble period. Int. Rev. Econ. Financ. 2014, 29, 235–248. [Google Scholar] [CrossRef]
- MHLW; Ministry of Health Labour and Welfare National Livelihood Survey. Available online: https://www.mhlw.go.jp/toukei/saikin/hw/k-tyosa/k-tyosa18/index.html (accessed on 20 July 2019).
Figure 1.
Sectoral composition of direct CO2 emissions from 1990–2005. (a) Total (Mt-CO2/y) and (b) per capita by age group (t-CO2/y). Inverted triangles denote the noteworthy household age groups as detailed in the main text.
Figure 1.
Sectoral composition of direct CO2 emissions from 1990–2005. (a) Total (Mt-CO2/y) and (b) per capita by age group (t-CO2/y). Inverted triangles denote the noteworthy household age groups as detailed in the main text.
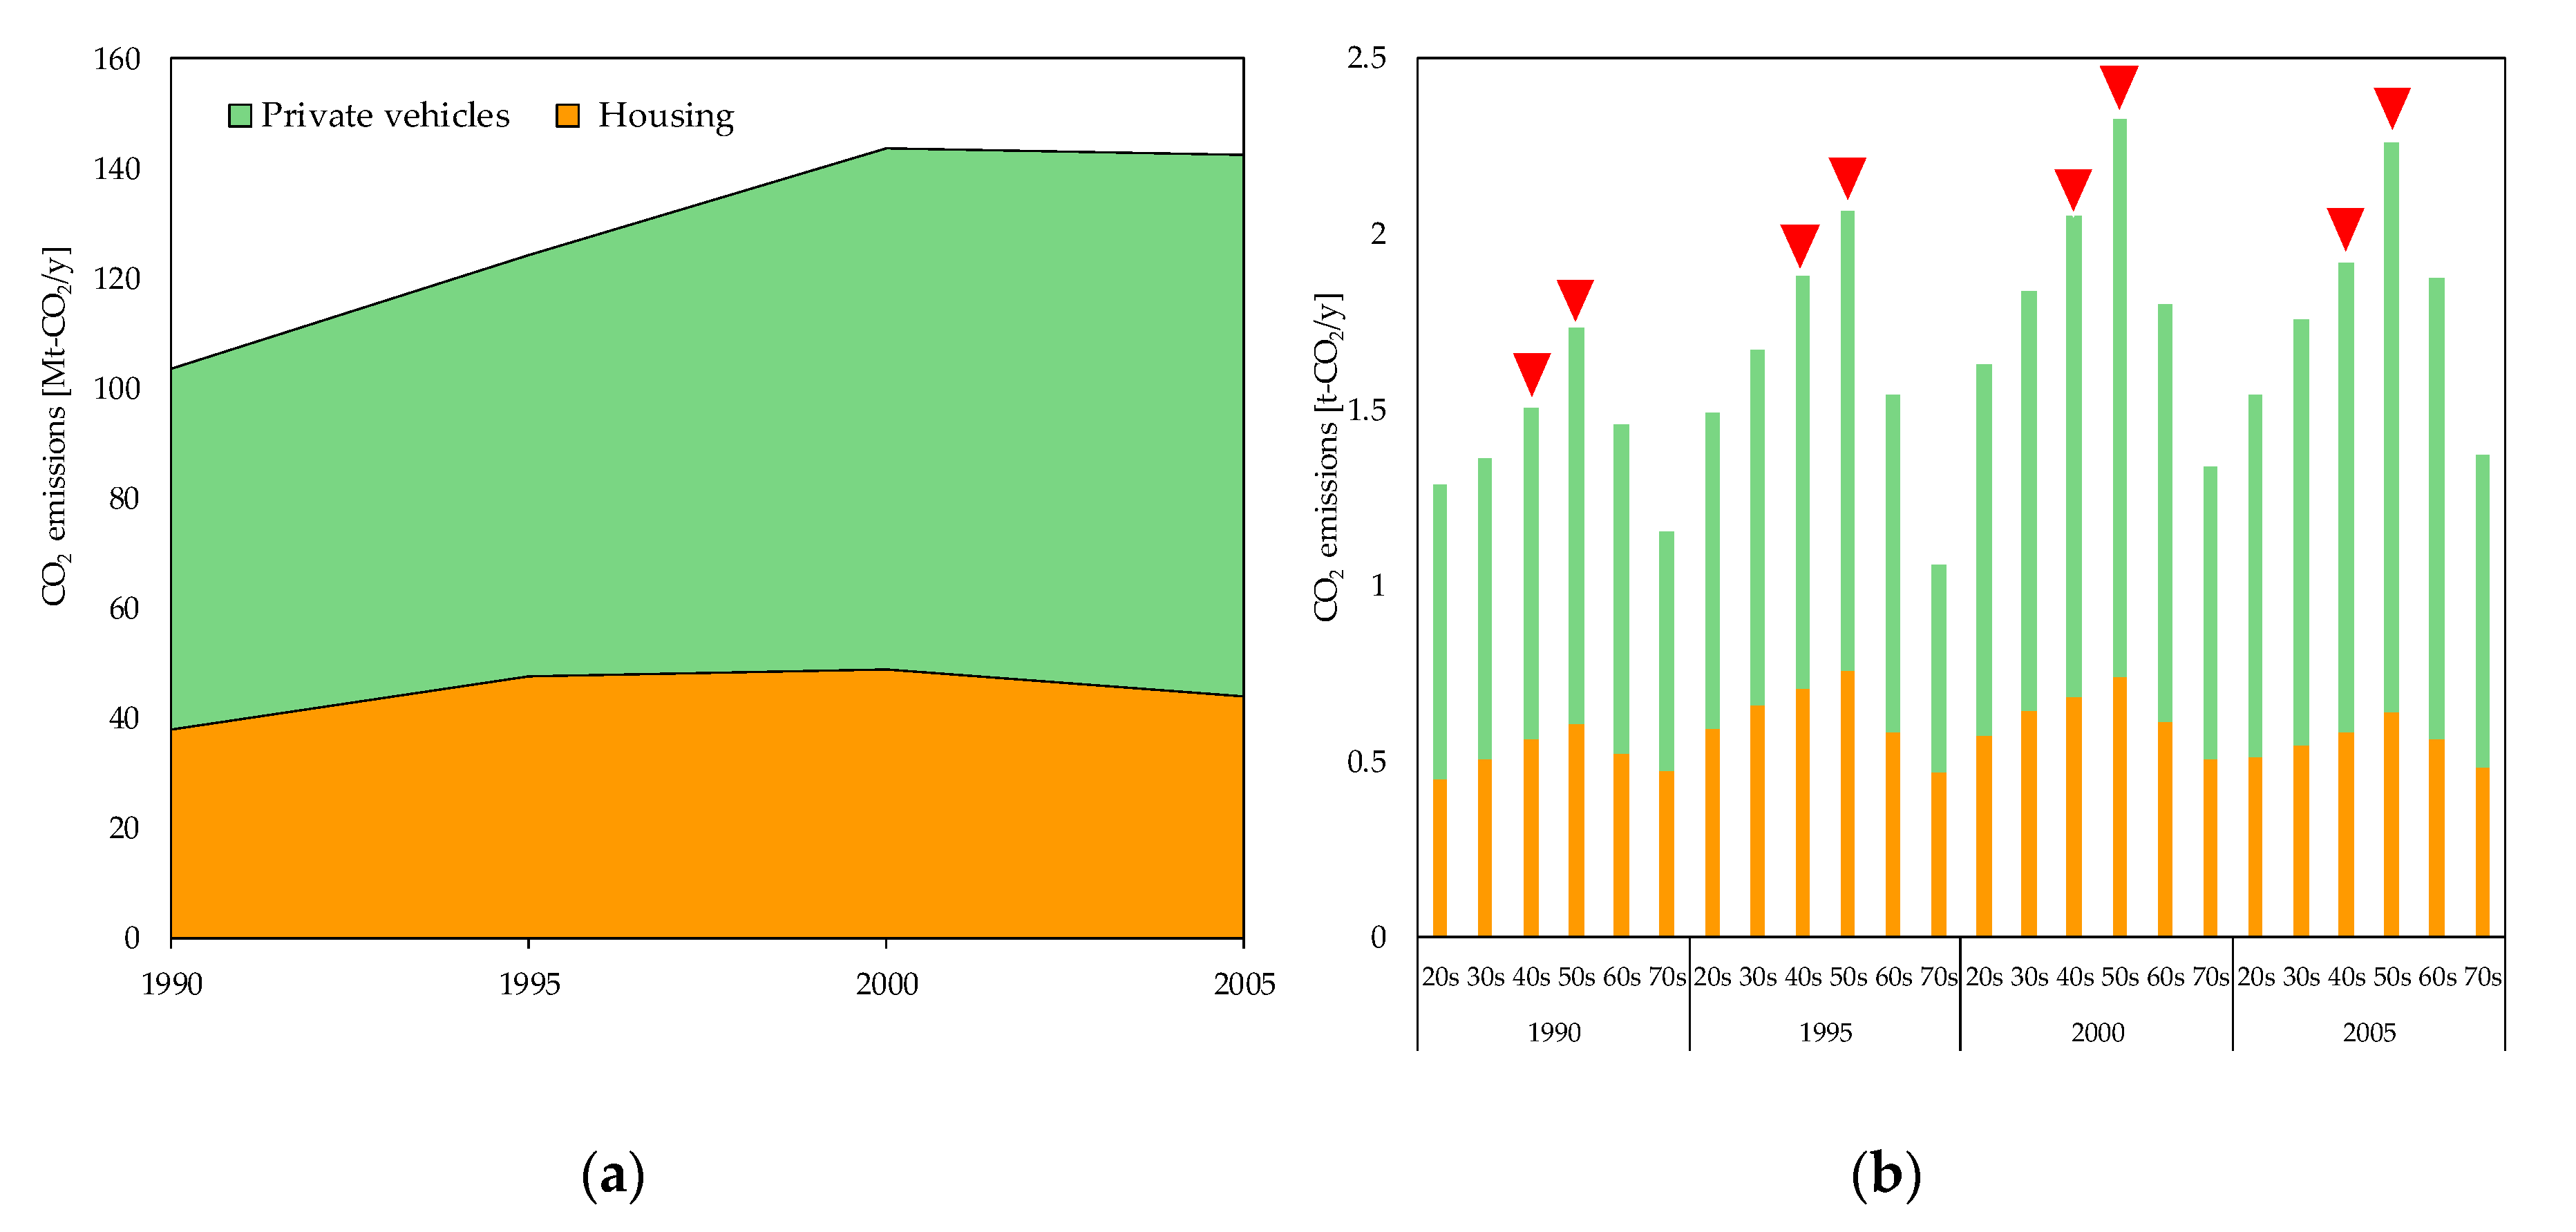
Figure 2.
Sectoral composition of indirect CO2 emissions from 1990–2005. (a) Total (Mt-CO2/y) and (b) per capita by age group (t-CO2/y). Inverted triangles denote the noteworthy household age groups as detailed in the main text.
Figure 2.
Sectoral composition of indirect CO2 emissions from 1990–2005. (a) Total (Mt-CO2/y) and (b) per capita by age group (t-CO2/y). Inverted triangles denote the noteworthy household age groups as detailed in the main text.
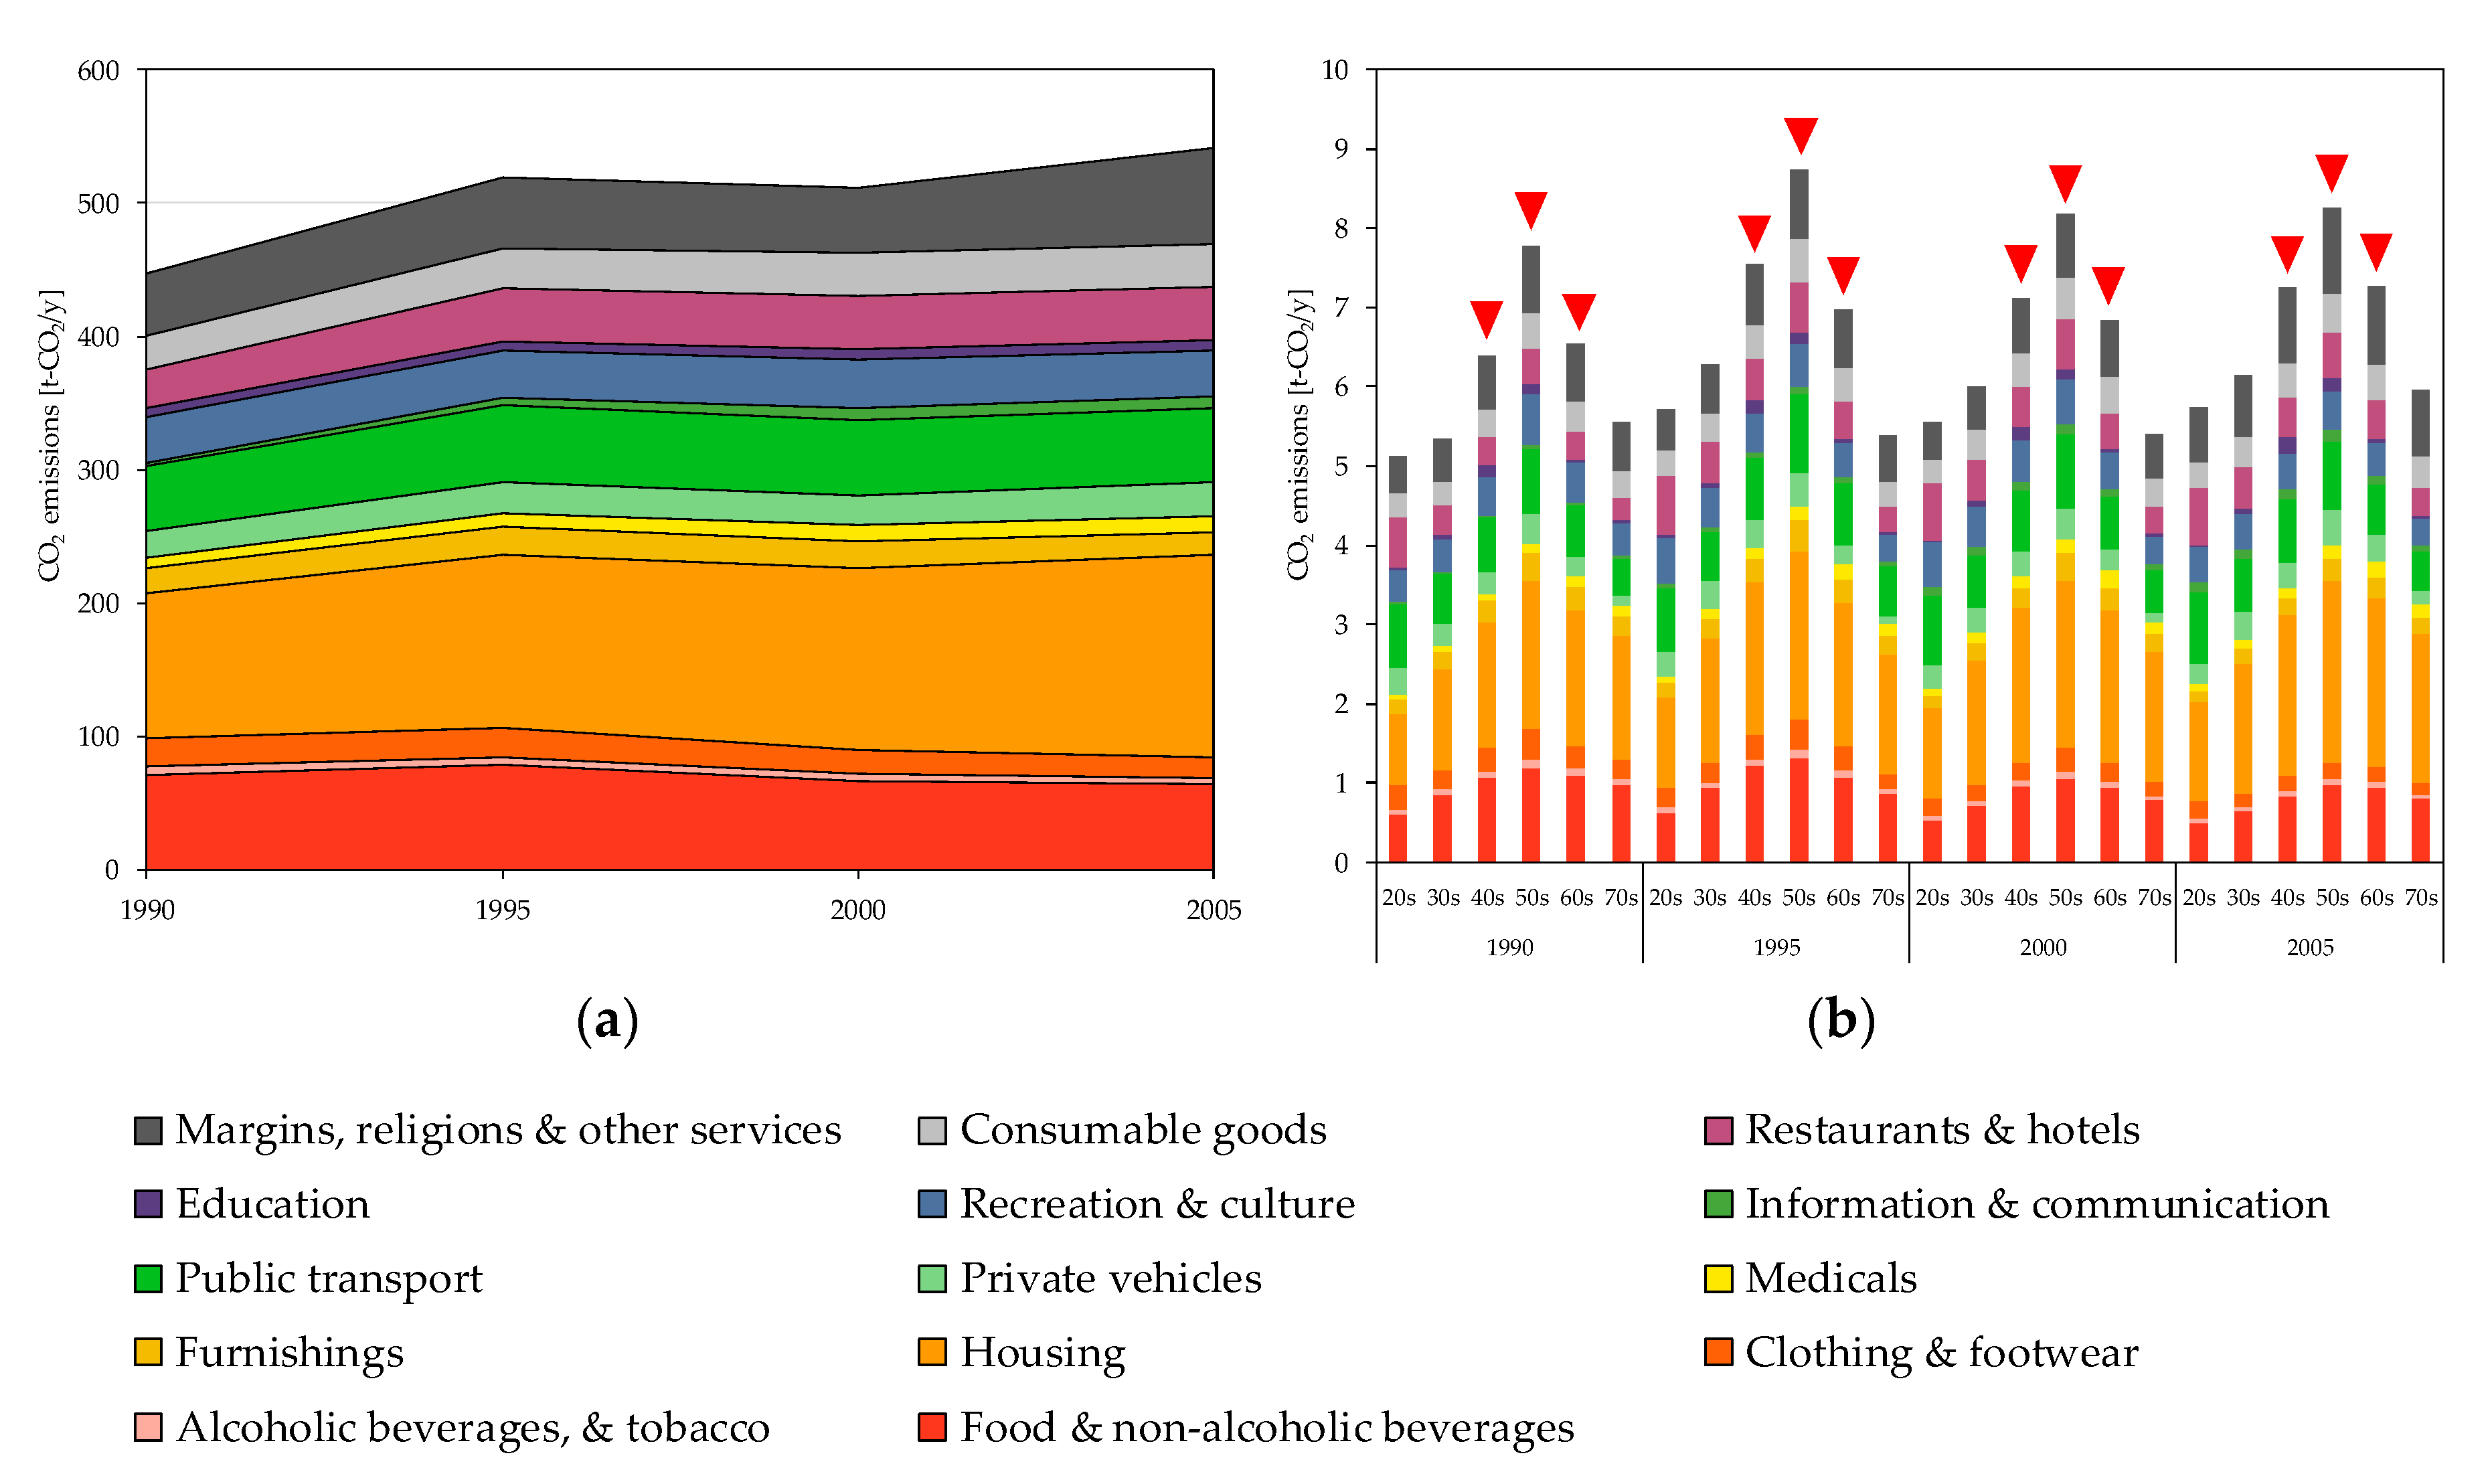
Figure 3.
Driving forces of direct household CO2 emissions in Japan during 1990-2005. ∆intensity is the intensity effect, ∆pattern is the consumption pattern effect, ∆volume is the consumption volume effect, ∆size is the household size effect, ∆distribution is the household distribution effect, and ∆household is the household number effect.
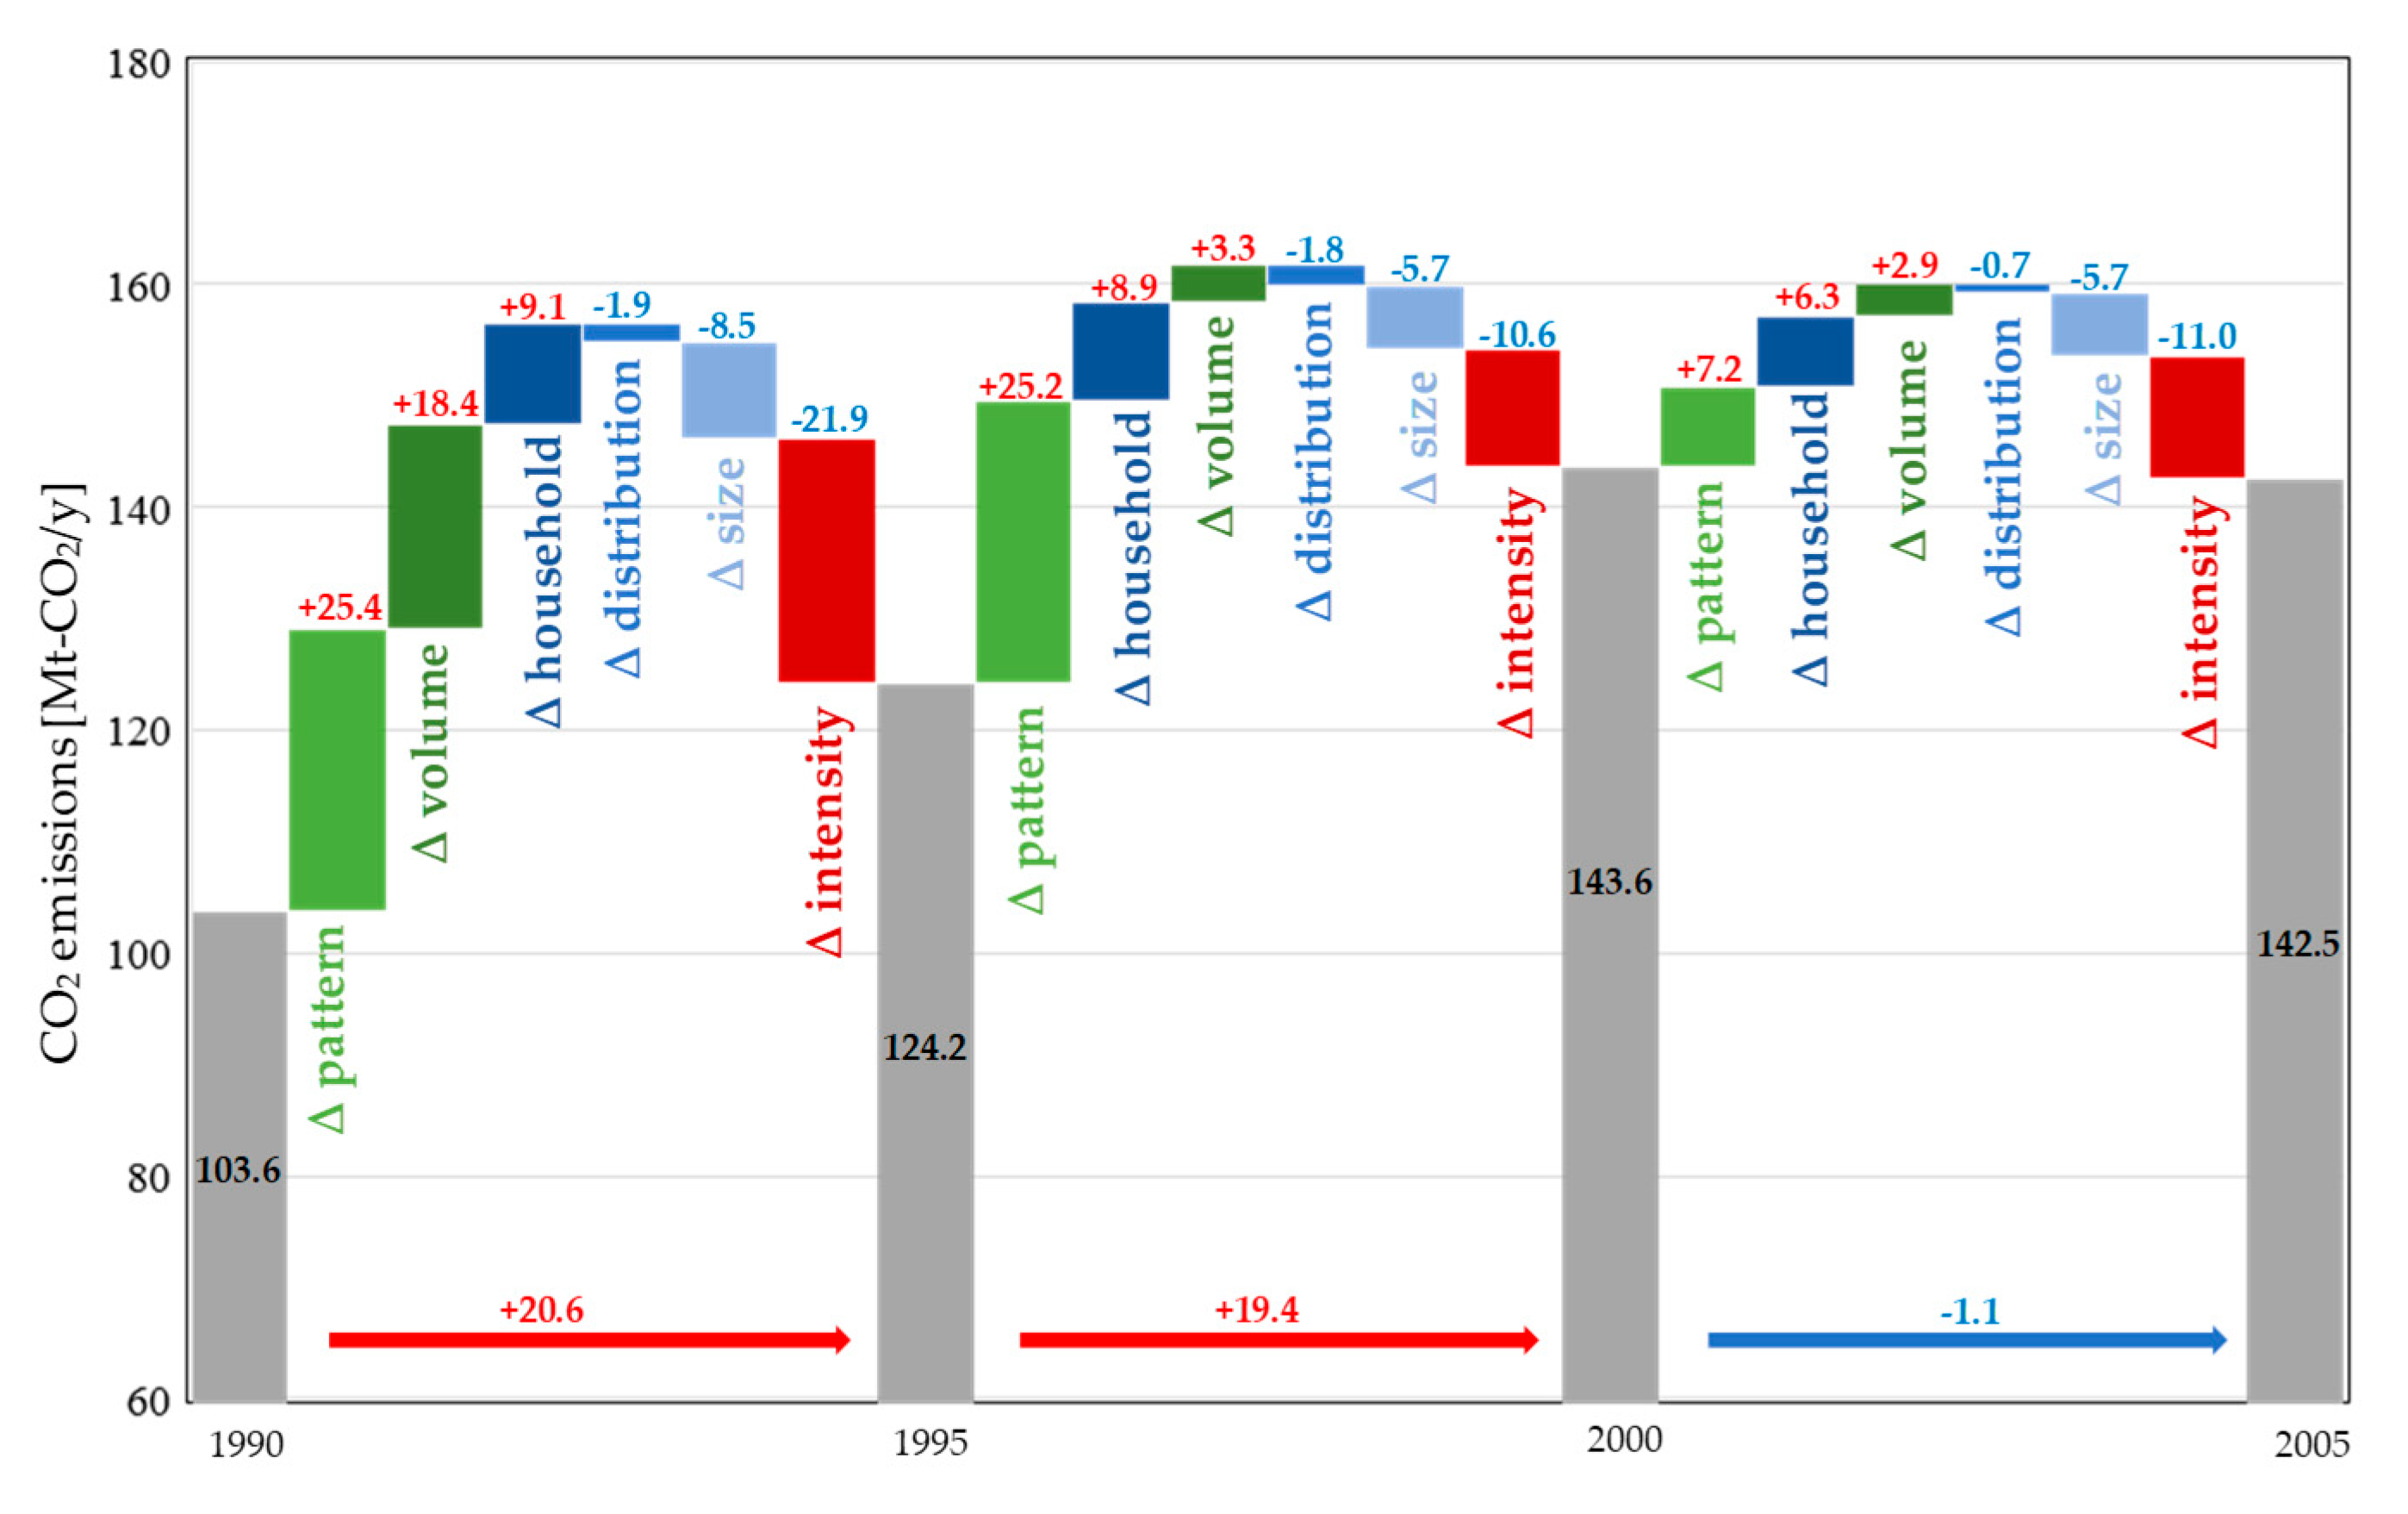
Figure 4.
Trend in the direct CO2 emissions by energy item.
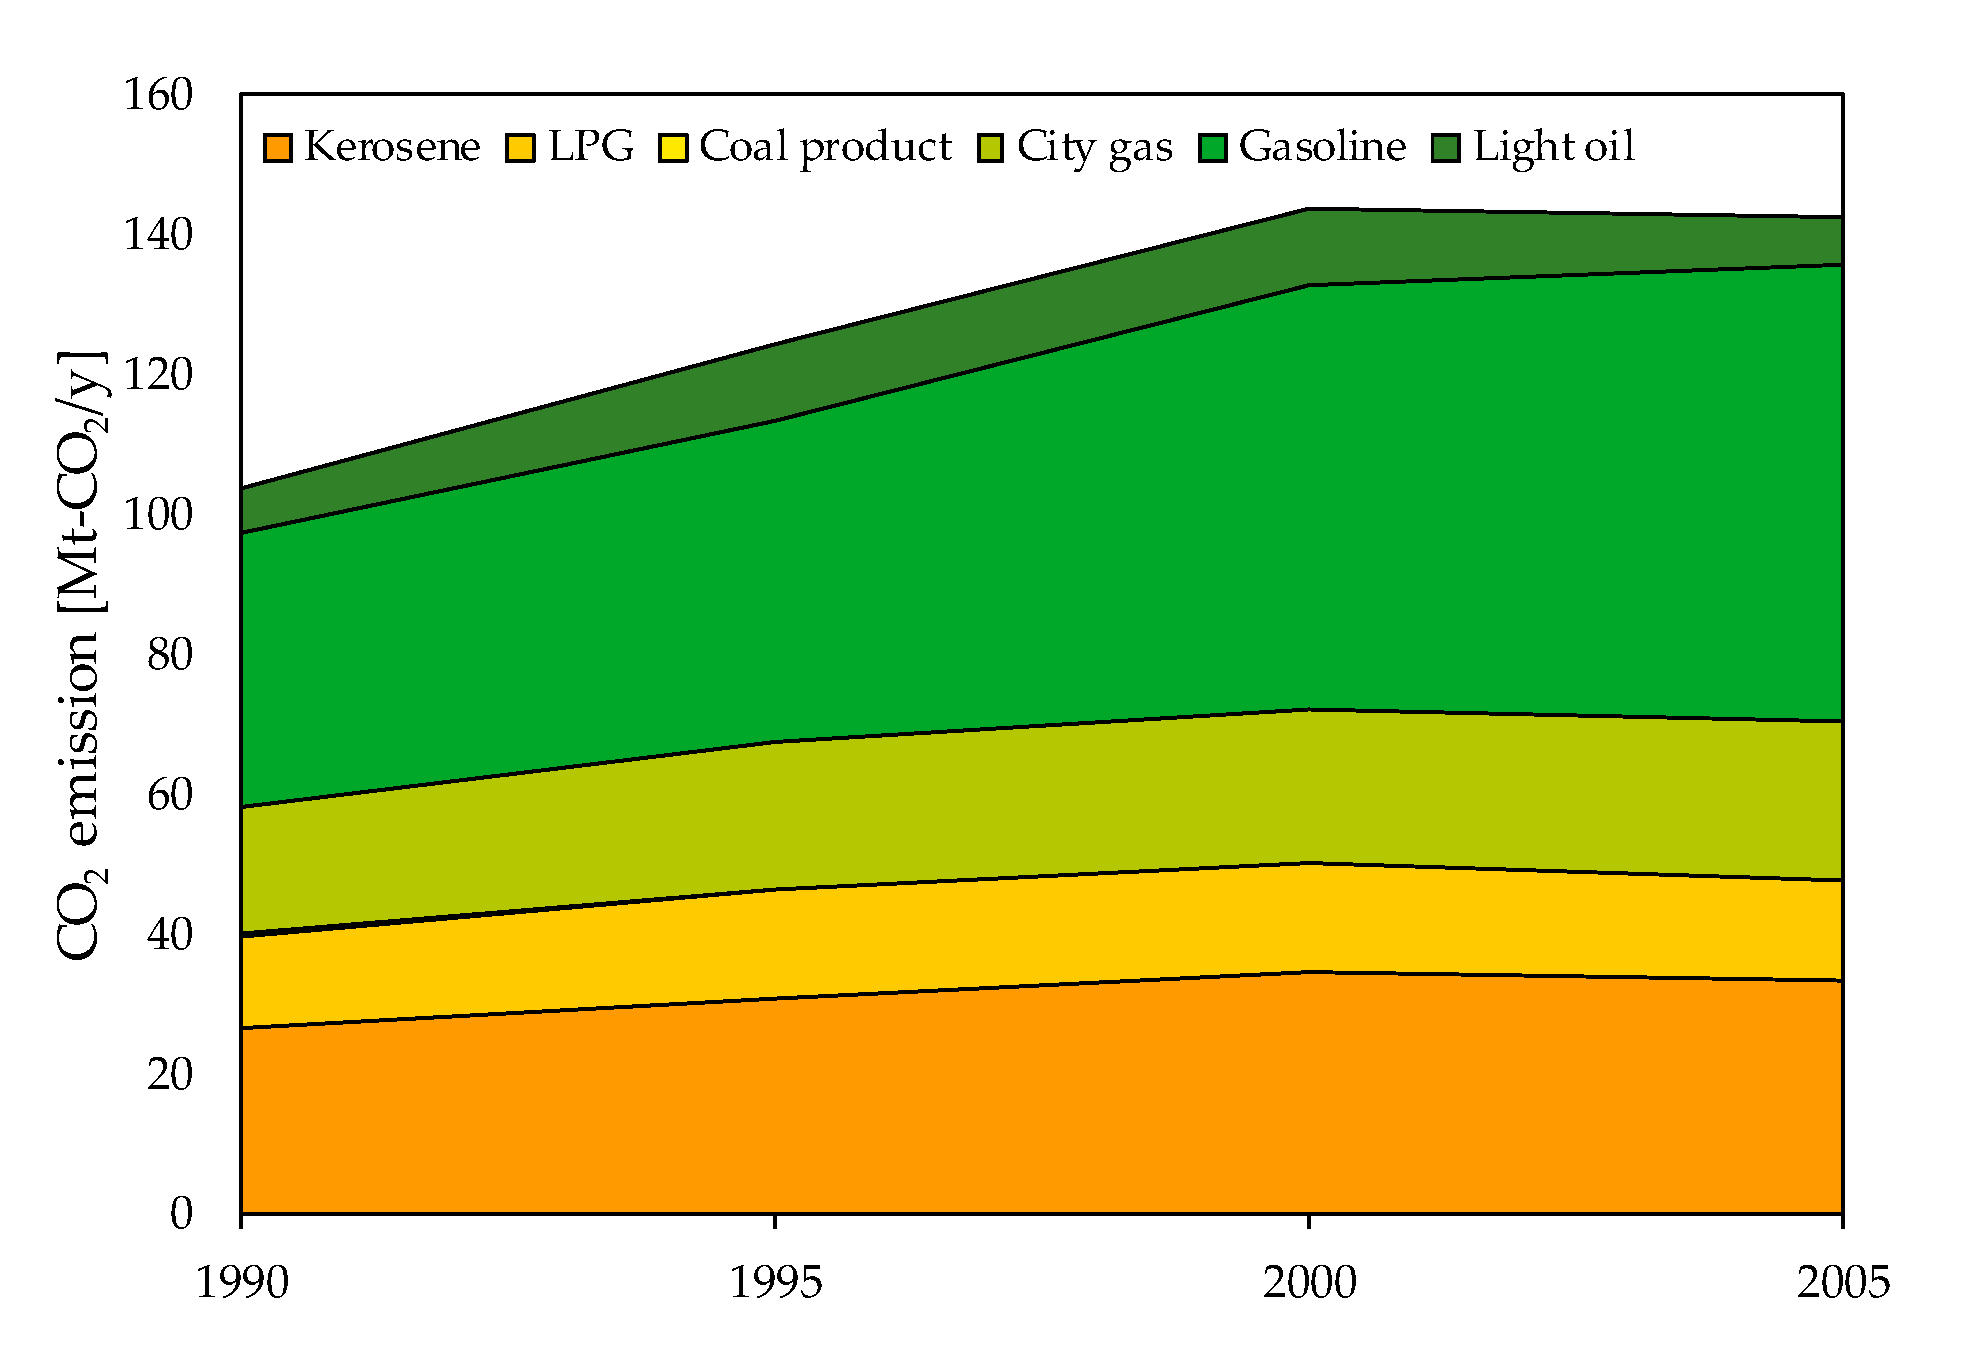
Figure 5.
Driving forces of indirect CO2 emissions during 1990–2005. ∆intensity is the intensity effect, ∆supply chain is the supply chain structure effect, ∆pattern is the consumption pattern effect, ∆volume is the consumption volume effect, ∆size is the household size effect, ∆distribution is the household distribution effect, and ∆household is the household number effect.
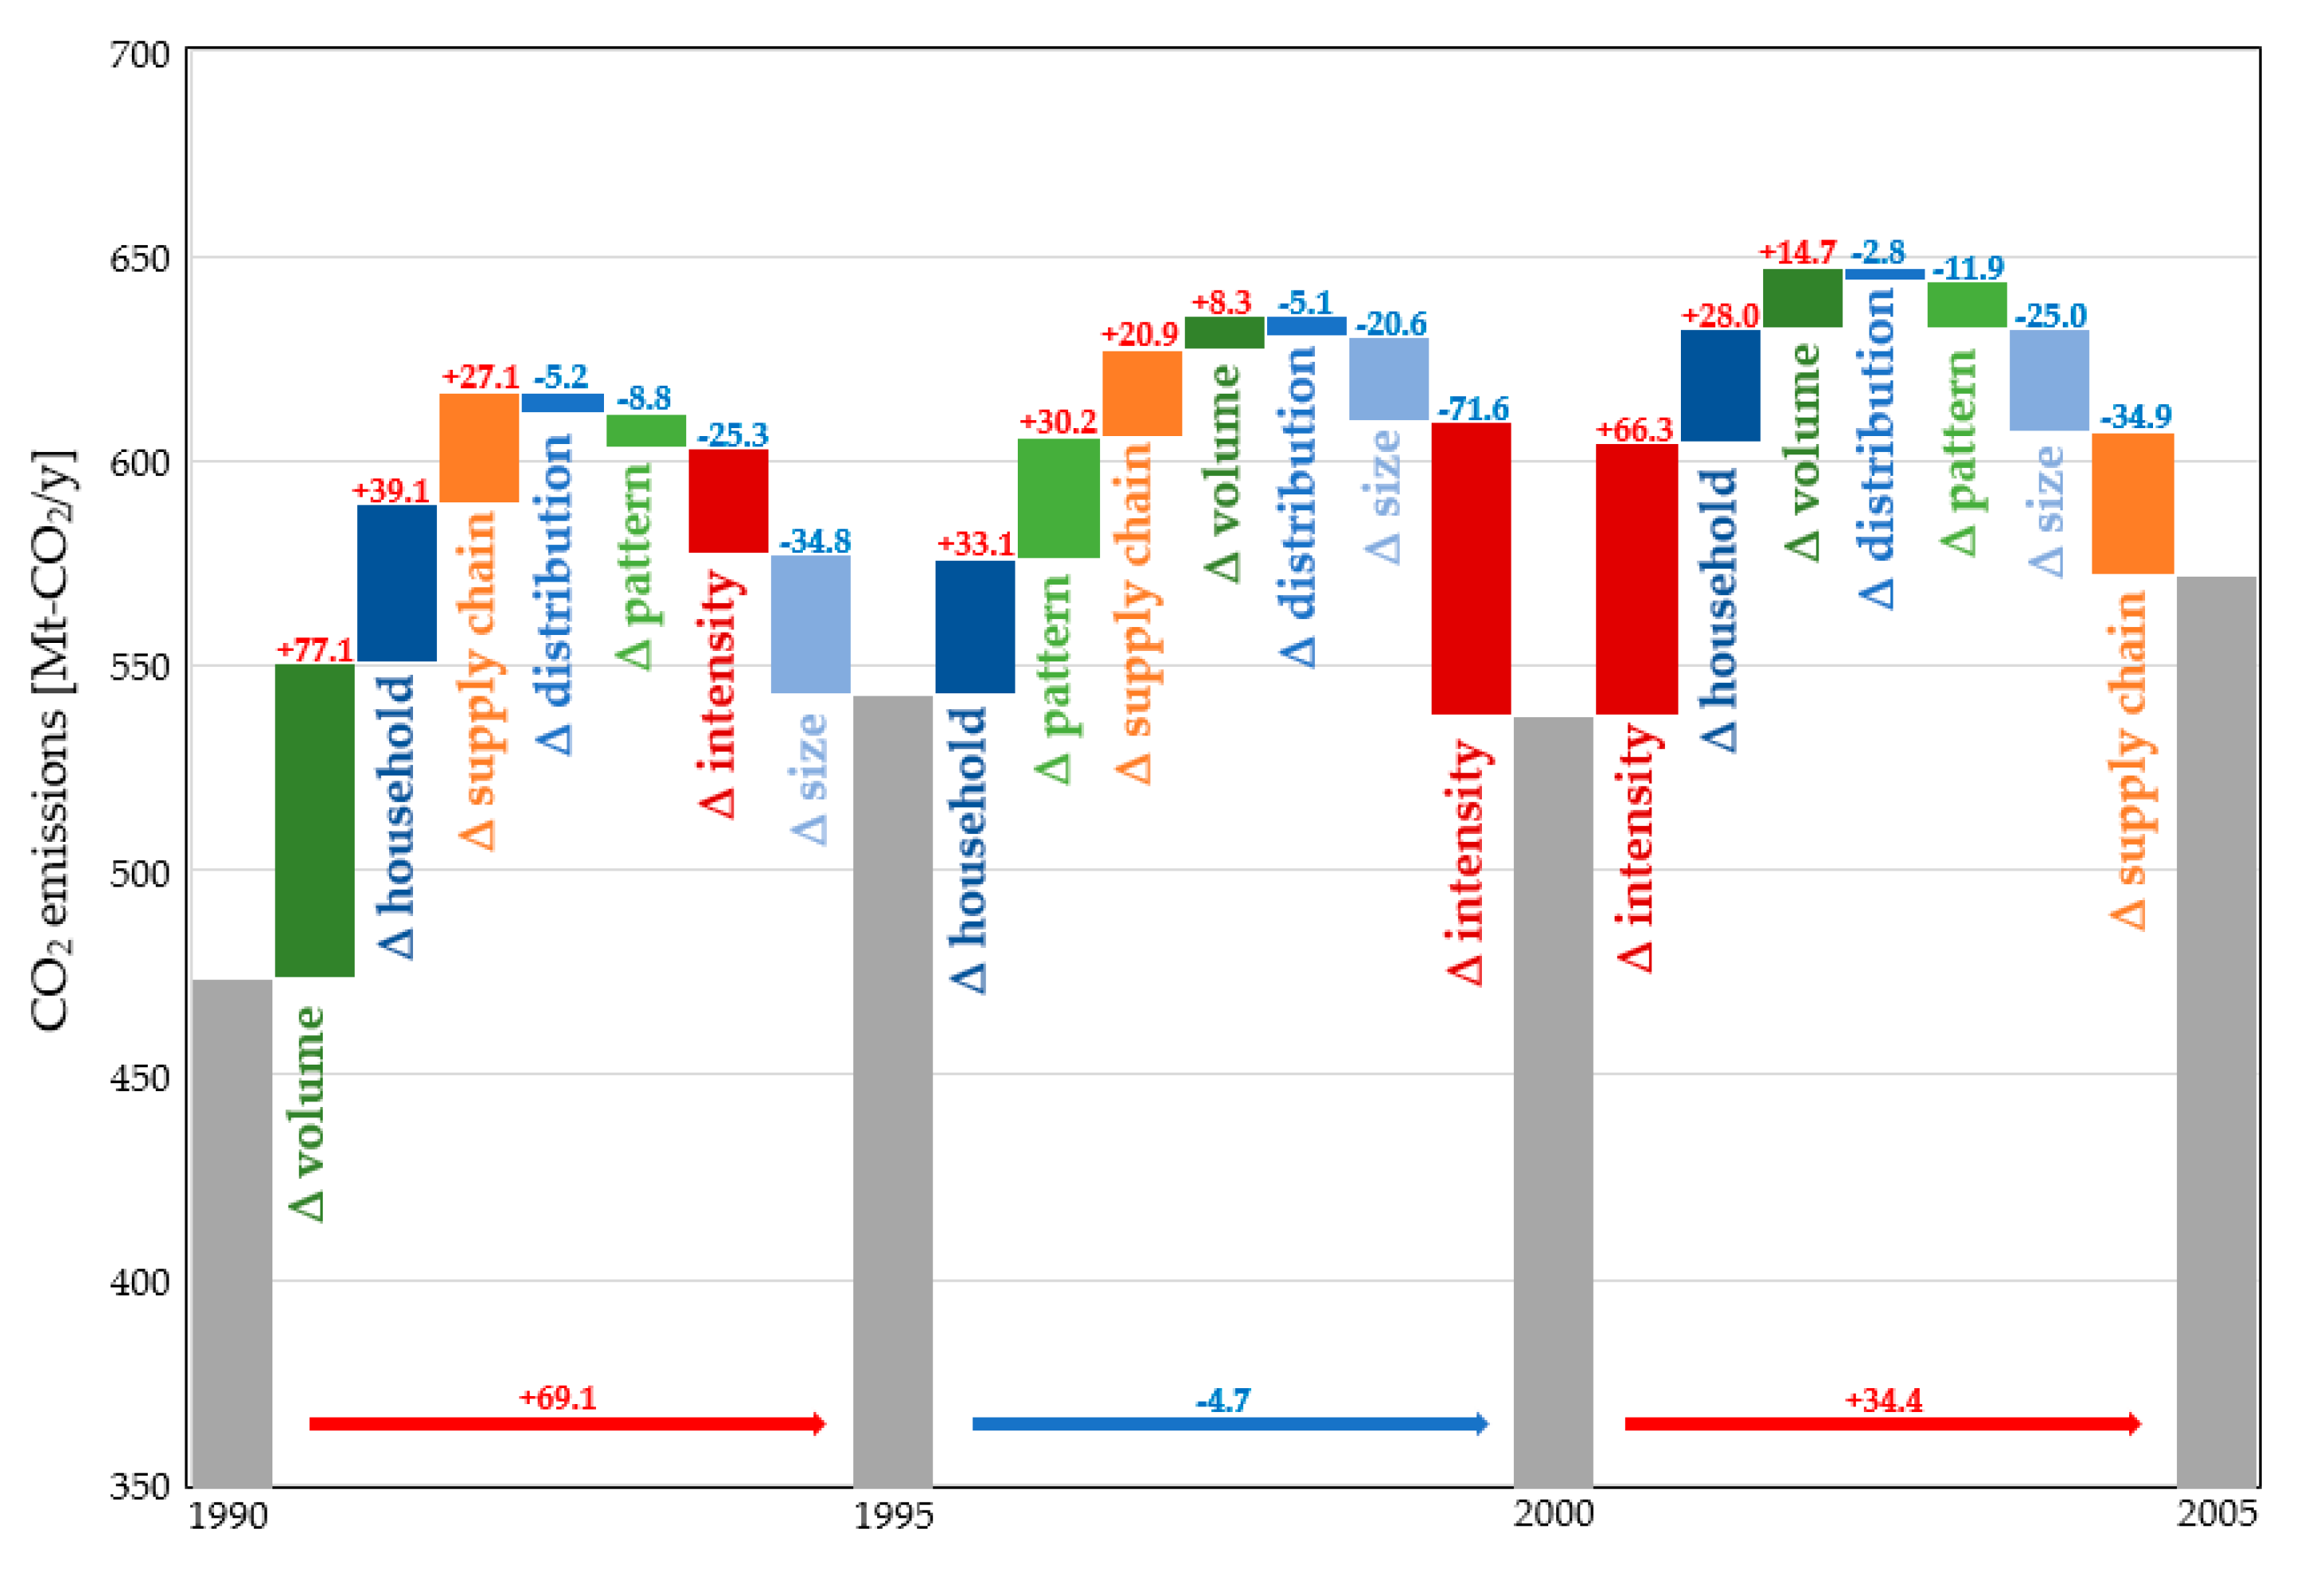
Figure 6.
Structural decomposition analysis (SDA) results for indirect CO2 emissions between 1990 and 2005 for four selected sectors. ∆intensity is the intensity effect, ∆supply chain is the supply chain structure effect, ∆pattern is the consumption pattern effect, ∆volume is the consumption volume effect, ∆size is the household size effect, ∆distribution is the household distribution effect, and ∆household is the household number effect. (a) Housing sector, (b) public transport, (c) private vehicles, and (d) medical sector.


Table 1.
Compositions of Japanese household carbon footprints (CF) in 1990–2005
| Year | Average Annualized Increase | Growth Rate (between 1990 and 2005) | ||||
|---|---|---|---|---|---|---|
| 1990 | 1995 | 2000 | 2005 | |||
| Direct CO2 emissions (Mt-CO2) | 103.6 | 124.2 | 143.6 | 142.5 | 2.6 | 37.5% |
| Indirect CO2 emissions (Mt-CO2) | 473.5 | 542.6 | 537.9 | 572.3 | 6.6 | 20.9% |
| Total CO2 emissions (Mt-CO2) | 577.2 | 666.9 | 681.5 | 714.8 | 9.2 | 23.8% |
© 2019 by the authors. Licensee MDPI, Basel, Switzerland. This article is an open access article distributed under the terms and conditions of the Creative Commons Attribution (CC BY) license (http://creativecommons.org/licenses/by/4.0/).
Share and Cite
MDPI and ACS Style
Huang, Y.; Shigetomi, Y.; Chapman, A.; Matsumoto, K. Uncovering Household Carbon Footprint Drivers in an Aging, Shrinking Society. Energies 2019, 12, 3745. https://doi.org/10.3390/en12193745
AMA Style
Huang Y, Shigetomi Y, Chapman A, Matsumoto K. Uncovering Household Carbon Footprint Drivers in an Aging, Shrinking Society. Energies. 2019; 12(19):3745. https://doi.org/10.3390/en12193745
Chicago/Turabian StyleHuang, Yuzhuo, Yosuke Shigetomi, Andrew Chapman, and Ken’ichi Matsumoto. 2019. "Uncovering Household Carbon Footprint Drivers in an Aging, Shrinking Society" Energies 12, no. 19: 3745. https://doi.org/10.3390/en12193745
Note that from the first issue of 2016, this journal uses article numbers instead of page numbers. See further details here.