Is the Dry-Band Characteristic a Function of Pollution and Insulator Design? †


School of Engineering, Cardiff University, The Parade, Cardiff CF24 3AA, UK
*
Author to whom correspondence should be addressed.
†
This paper is an extended version of our paper published in 2018 IEEE International Conference on High Voltage Engineering (ICHVE 2018), Athens, Greece, 10−13 September 2018; 0-TM5-5.
Energies 2019, 12(19), 3607; https://doi.org/10.3390/en12193607
Submission received: 22 July 2019
/
Revised: 16 September 2019
/
Accepted: 17 September 2019
/
Published: 21 September 2019
(This article belongs to the Special Issue Selected Papers from 2018 IEEE International Conference on High Voltage Engineering (ICHVE 2018))
Abstract
:This paper assesses the dry-band formation and location during artificial pollution tests performed on a 4-shed 11kV insulator with conventional and textured surface designs in a clean-fog chamber and with the application of a voltage ramp-shape source. The different designs present the same overall geometrical dimensions, but the textured ones are characterized by the application of a patented insulator surface design. Three pollution levels, extremely high, high and moderate, were considered. A newly developed MATLAB procedure is able to automatically recognize the perimeter of the insulator, the trunk and shed areas on infra-red recordings. In addition, using the vertical axis identification, all trunks are subdivided into zones and into left and right areas, significantly increasing the capability of abnormalities detection. Any temperature increase within these areas enables to detect the appearance and the extension of dry bands. The results of the analysis of the statistical location and extension development over time of the dry bands during these set of comparative tests show a clear distinction between designs and pollution levels. These results may offer interesting design guidelines for dry-band control.
1. Introduction
Pollution is a key aspect for high voltage insulator design and selection. Pollution deposition and wet conditions can initiate discharge activity and can lead to flashover and, consequently, the availability of a high-voltage transmission line is compromised. The adoption of silicone rubber insulators is justified by their improved performance under polluted environments in comparison with traditional ceramic and glass insulators, and particularly when the pollution level is severe. However, the superior performance of the composite material is compromised when discharge activity is established on the insulator area and, consequently, dry bands appear. This activity determines a hydrophobic reduction of the silicone rubber, and if it persists, no hydrophobicity recovery can be initiated. Moreover, further partial arcs can initiate localized erosion, permanently weakening the silicone rubber insulator surface, as presented in several research works [1,2,3,4,5].
Numerous works [6,7,8,9,10,11] have been published recently on dry-band formation and pollution estimation, showing the importance of this topic. The papers [6,7] propose an adaptive technique to predict the contamination level increase in order to warn the utility before reaching high levels, conditions that are favourable to extensive dry-band activities. In [8,9], dry-band formation is studied applying controlled non uniform areas of pollution on flat samples. In [10,11], the influence of multiple dry bands on flashover characteristics under various environmental and pollution conditions was investigated on rectangular silicone rubber test samples.
Previous research works [12,13] performed by the authors showed the valuable information obtained by the analysis of dry-band and infrared data. However, the dry-band location was not fully automatically detected along the full insulator, but always with user intervention requiring considerable amount of time.
In this research work, high voltage tests have been performed on 4-shed 11kV insulators with various surface designs in a clean-fog chamber test facility applying a wide range of artificial pollution levels [14]. The more common locations of the dry bands have been identified by analysing the infrared recordings. Further characteristics, such as extension and temperature profile, have been investigated during the time frame of the tests, applying a newly developed algorithm. The MATLAB procedure is able to identify the insulator physical boundaries, the vertical axis and trunk sub-areas, in order to evaluate, with good accuracy, the extension of each dry band and to monitor the variation of these hot zones continuously during the entire test. The series of clean-fog tests have been performed adopting conventional and three textured designs. In addition, after the application of the artificial pollution layer and a resting period of 24 hours, the equivalent salt deposit density (ESDD) and the Non-Soluble Deposit Density (NSDD) have been determined on all selected insulator designs. The ESDD and NSDD levels can contribute to the dry-band characteristics. These results confirm the interesting design advantage of texturing for dry-band control.
2. Experimental Set-Up
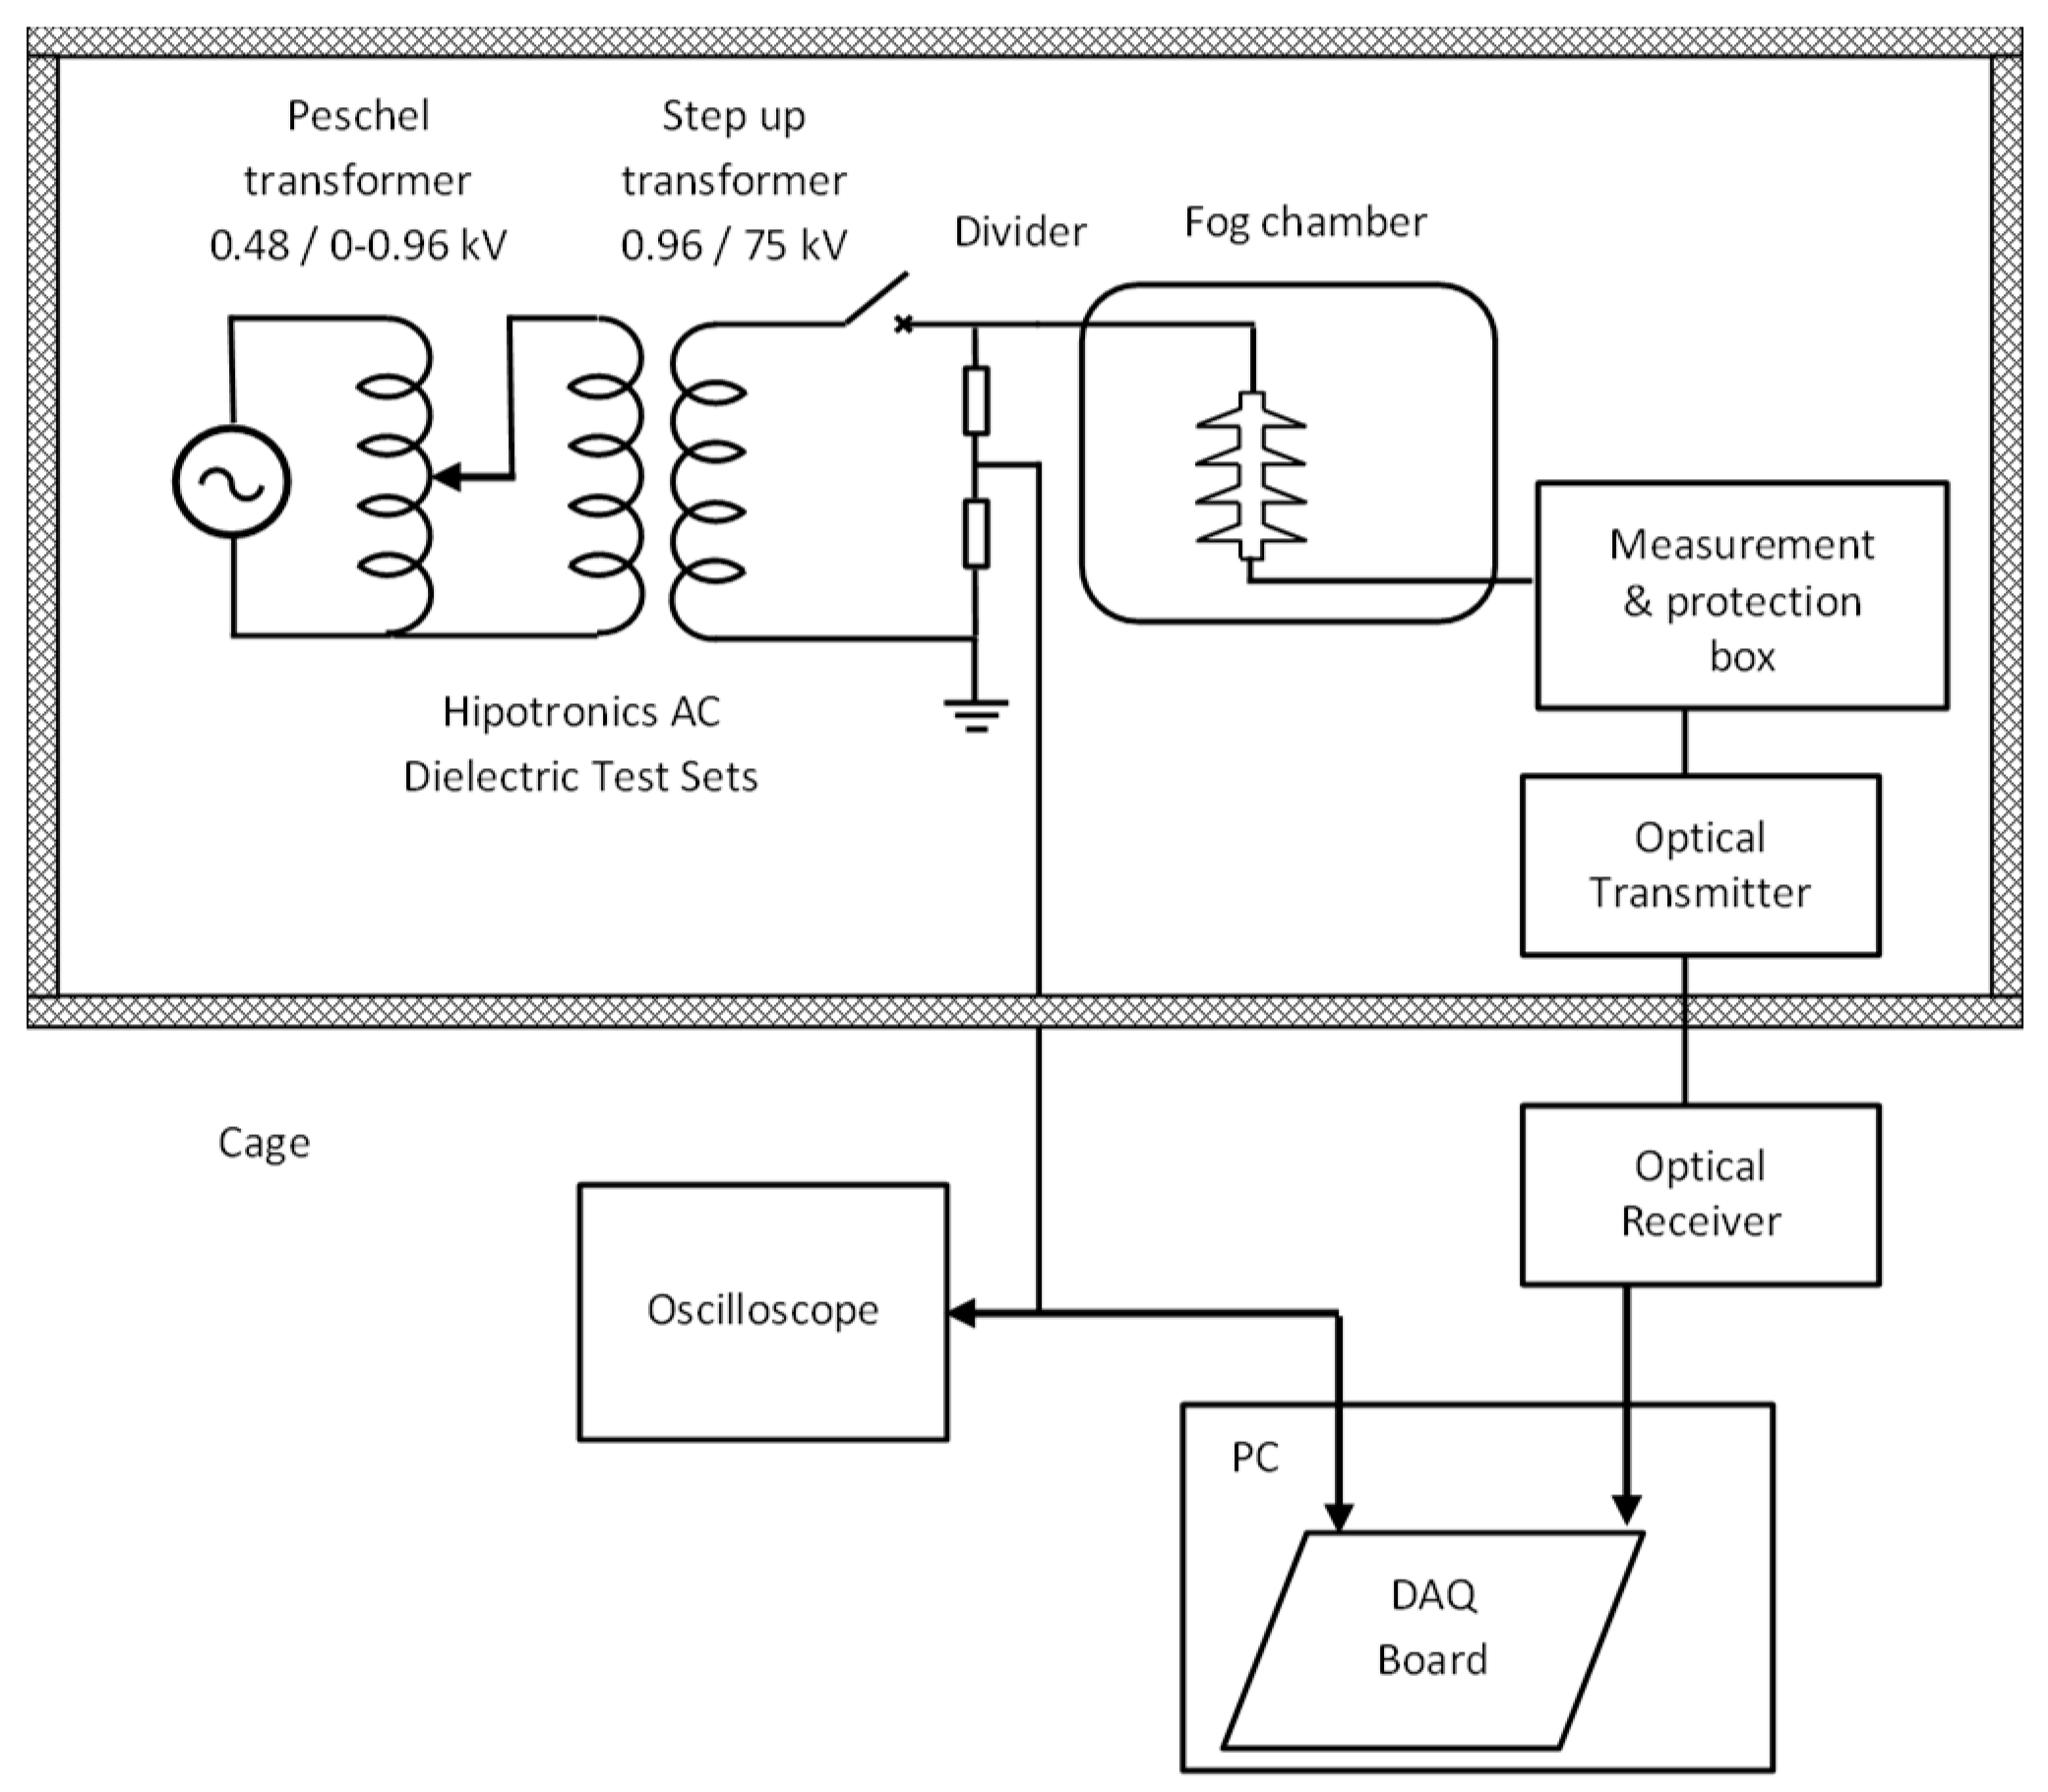
The experimental set-up adopted for this investigation was based on a clean-fog test chamber and a programmable voltage ramp-shape source to energise the insulators, previously artificially polluted. The high voltage source was provided by a Hipotronics 150 kVA transformer, and the primary circuit was fed via a Paschen transformer (0–960 V) providing a programmable voltage variation up to 75 kV. In this series of tests, the voltage control unit is set up to provide a constant rate of increase of 4 kV per minute to achieve the ramp shape until the flashover event; this permits to assess the insulator performance under increasing stress in a limited period of time. This methodology has been proposed by the Cardiff University research team, and it is described in detail in [15]. A schematic diagram of the measurement set-up used in the experiment is shown in Figure 1. Previous investigations focused on evaluating the impact of fog rate and pollution level applied as ESDD and NSDD on the insulator surface, and each test insulator was subjected to a ramp series (between 4 and 12 successive flashovers, with a 5 min interval). These comparative laboratory tests, based on voltage ramp shape and an artificially polluted insulator in a clean fog chamber, facilitated the evaluation of the impact on withstand levels of textured design compared with plain surface insulators. A clear indication of improved flashover withstand performance of textured insulators in comparison with conventional surfaces was demonstrated in the research investigation [16].
In this work, only the first ramp was selected in order to have a uniform temperature distribution over the insulator surface at the start of each test. Further tests have been performed using selected constant voltage levels to observe the stability of the dry-band extension over time and the most appropriate methodology to identify the dry-band formation.
The insulator designs selected for this investigation share an identical axial length (175 mm), trunk diameter (28 mm) and shed diameter (90 mm), as illustrated in Table 1. The increased creepage length offered by texturing the surface of the insulator (TT) is shown in the first column of Table 1. Additional increments of the creepage length is offered in the TTS design, where a logarithmic spiral double-ridge pattern is applied under the sheds. The insulator with an all plain surface is referred to in this work as the conventional design (CONV).
During the laboratory tests, video and images were recorded with a high-definition camcorder and a still camera to obtain signs of the discharge phenomena in the trunk areas. Unfortunately, the faint discharges were not clearly visible, and they could be observed only using long-time exposure techniques. Simultaneously, a FLIR A325 camera was adopted and fixed on the same tripod of the visual camera in order to achieve a close focal point between the two recordings. IR pictures were recorded using a 1 Hz frame rate to minimize memory storage requirement. The IR camera offers the capability to monitor the temperature at a frequency rate up to 60 Hz and with a precision of 0.5 °C. These capabilities are clearly not sufficient to record the instantaneous maximum temperature of the discharge. However, the IR records can show with good precision the maximum temperature of any area of the insulator. The camera does not offer any triggering signal, and only by using the time stamp associated with each IR frame recorded was it possible to synchronize the temperature with all the other data recorded during the test, such as electrical parameters and visual records, with a precision of 1 ms [14].
3. Experimental Results and Dry-Band Detection Procedure
A long series of laboratory tests were performed on the five insulator designs after the application of extremely high, high and moderate pollution levels, 1.15, 0.64 and 0.42 mg/cm2, respectively, and a constant NSDD of 0.1 mg/cm2.
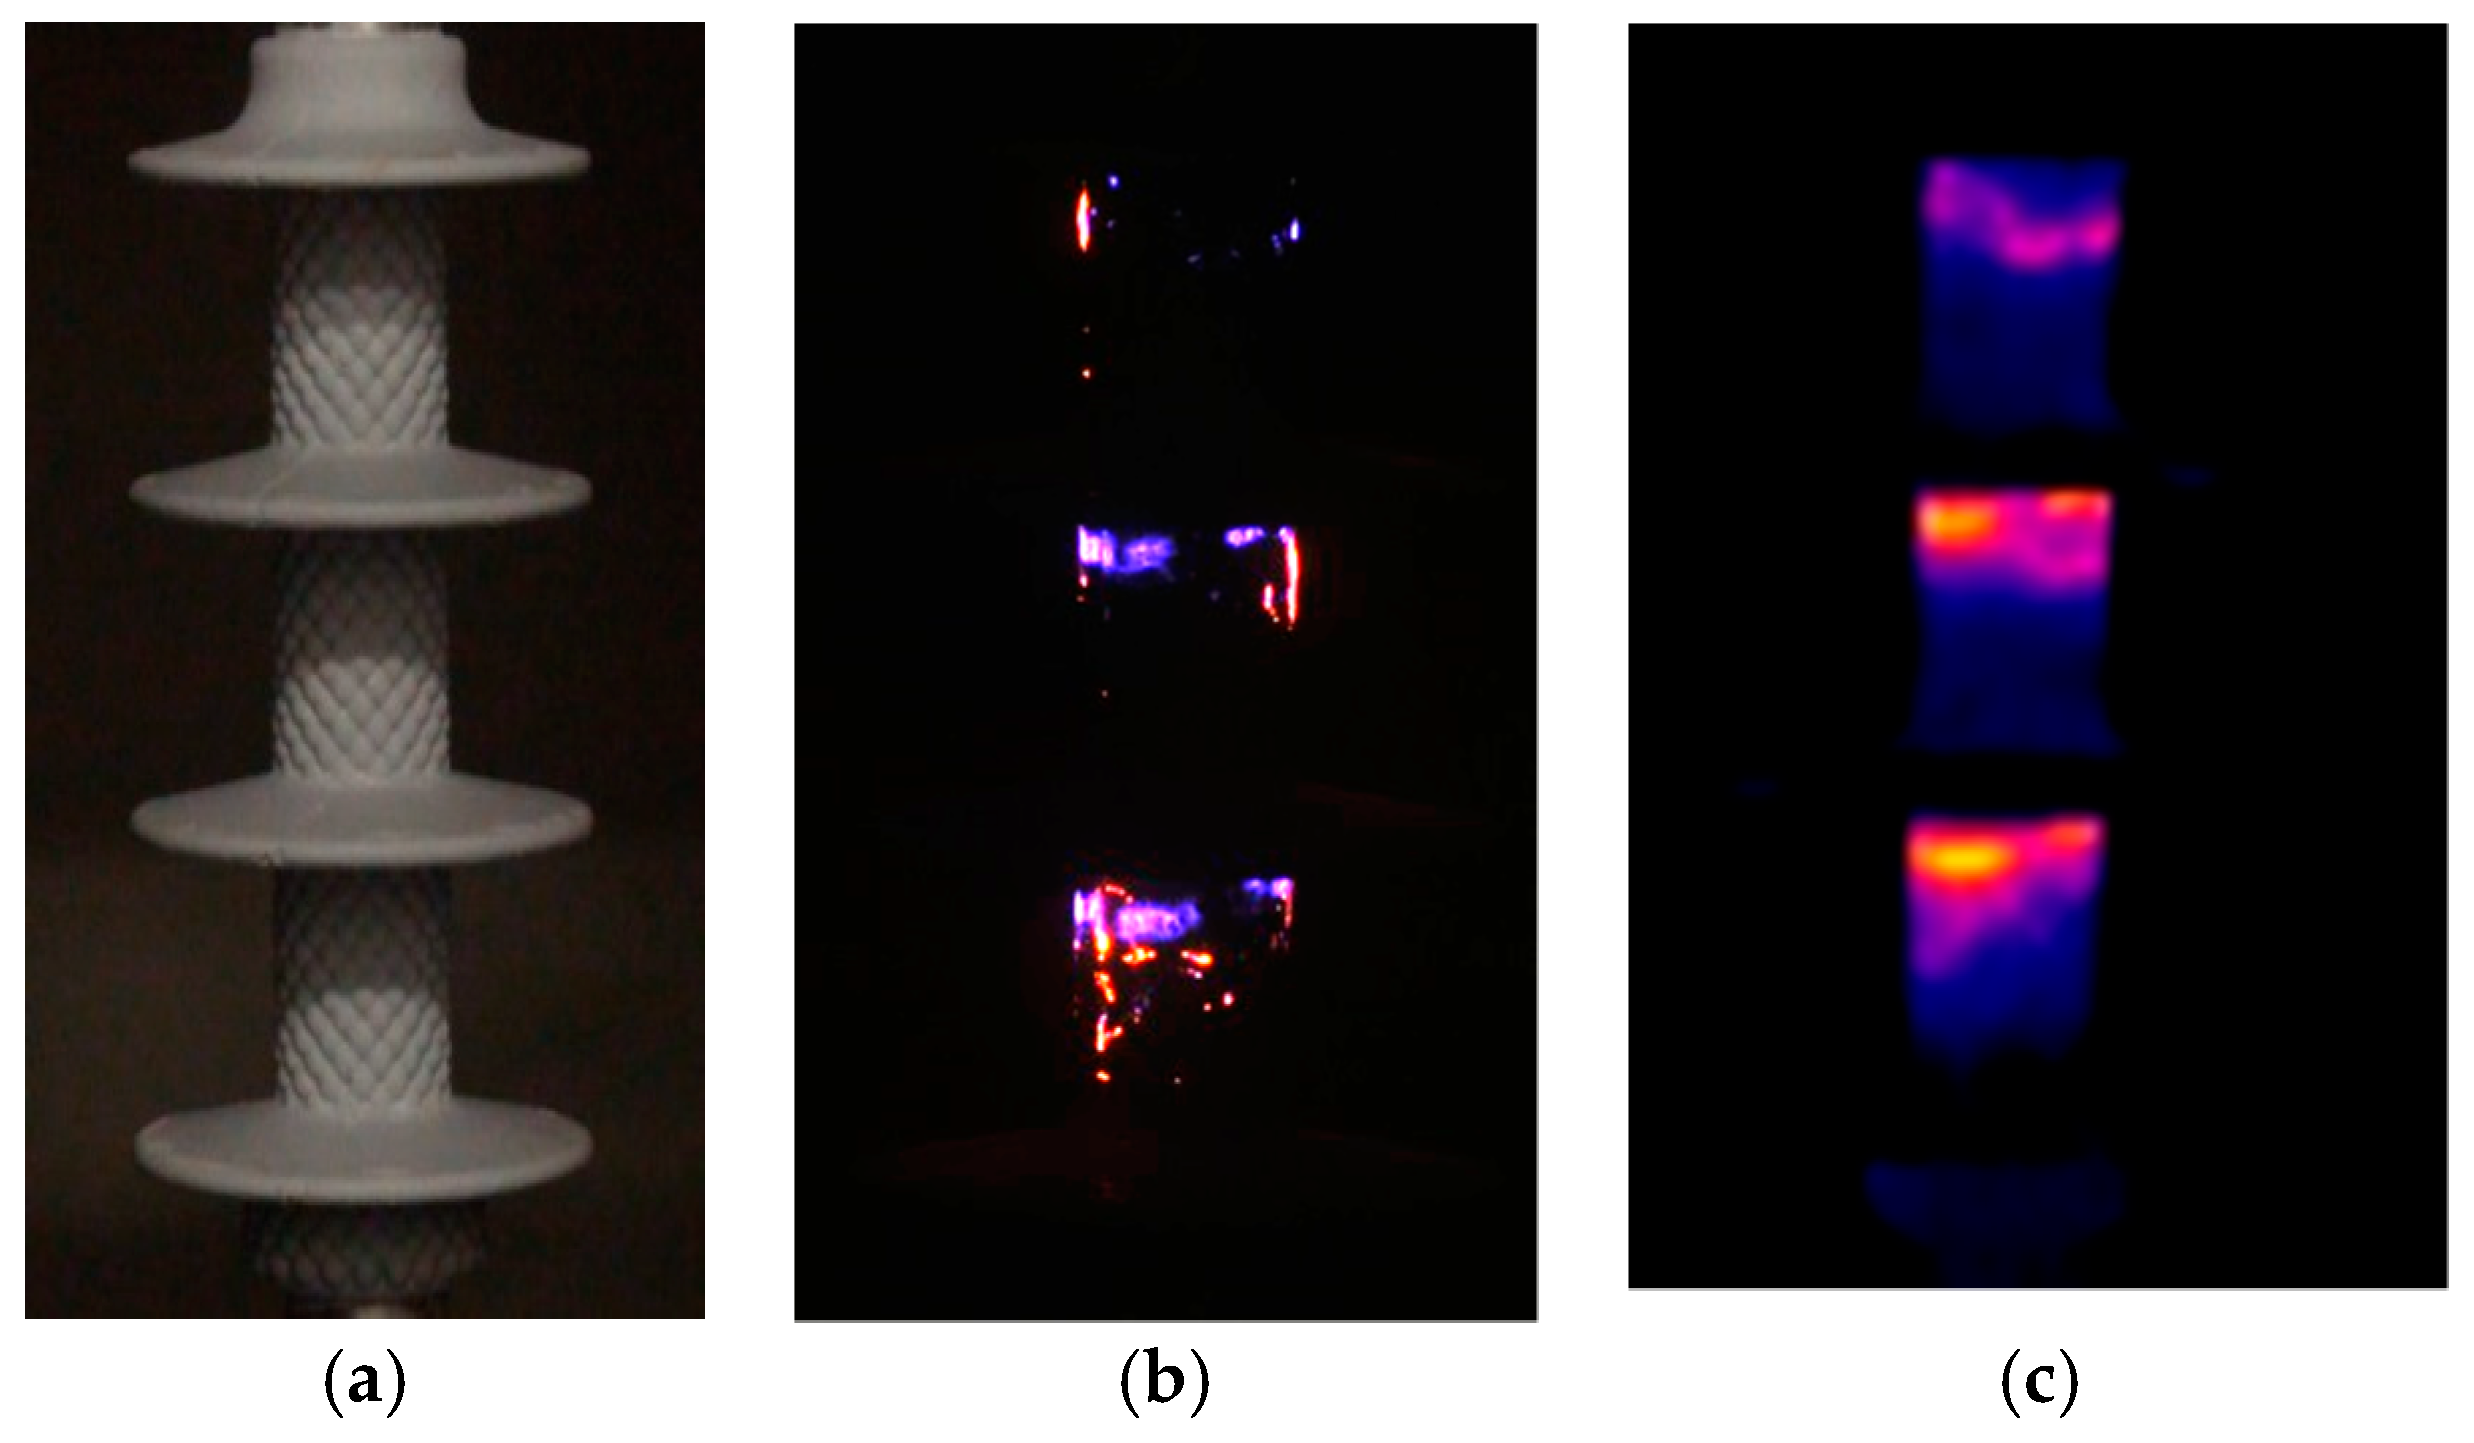
In the initial tests, selected constant voltage levels were applied and some discharge activity was identified in visual recordings only using a long-exposure digital stills camera. These small discharges were not visible in the high-definition (HD) digital video camera recordings but only in the long-exposure photo. These discharges, of the corona/streamer type, are characterized by a purple-blue colour as shown in Figure 2b. The associated dry bands were localized only with the help of the IR camera, as shown in Figure 2c. The visual photos were post-processed in order to enhance the spark visibility. A second type of discharge, the streamer discharges, are shown by a red/orange colour crossing an extended area than that of the dry band.
The synchronized IR images present areas of increased temperature (Figure 2c) where the visual images showed the presence of fully formed dry bands (Figure 2b). It is important to observe that no significant streamer activity is present in the upper trunk. However, the presence of a dry band in each trunk is confirmed by the IR photos, with a lower temperature magnitude on the upper one.
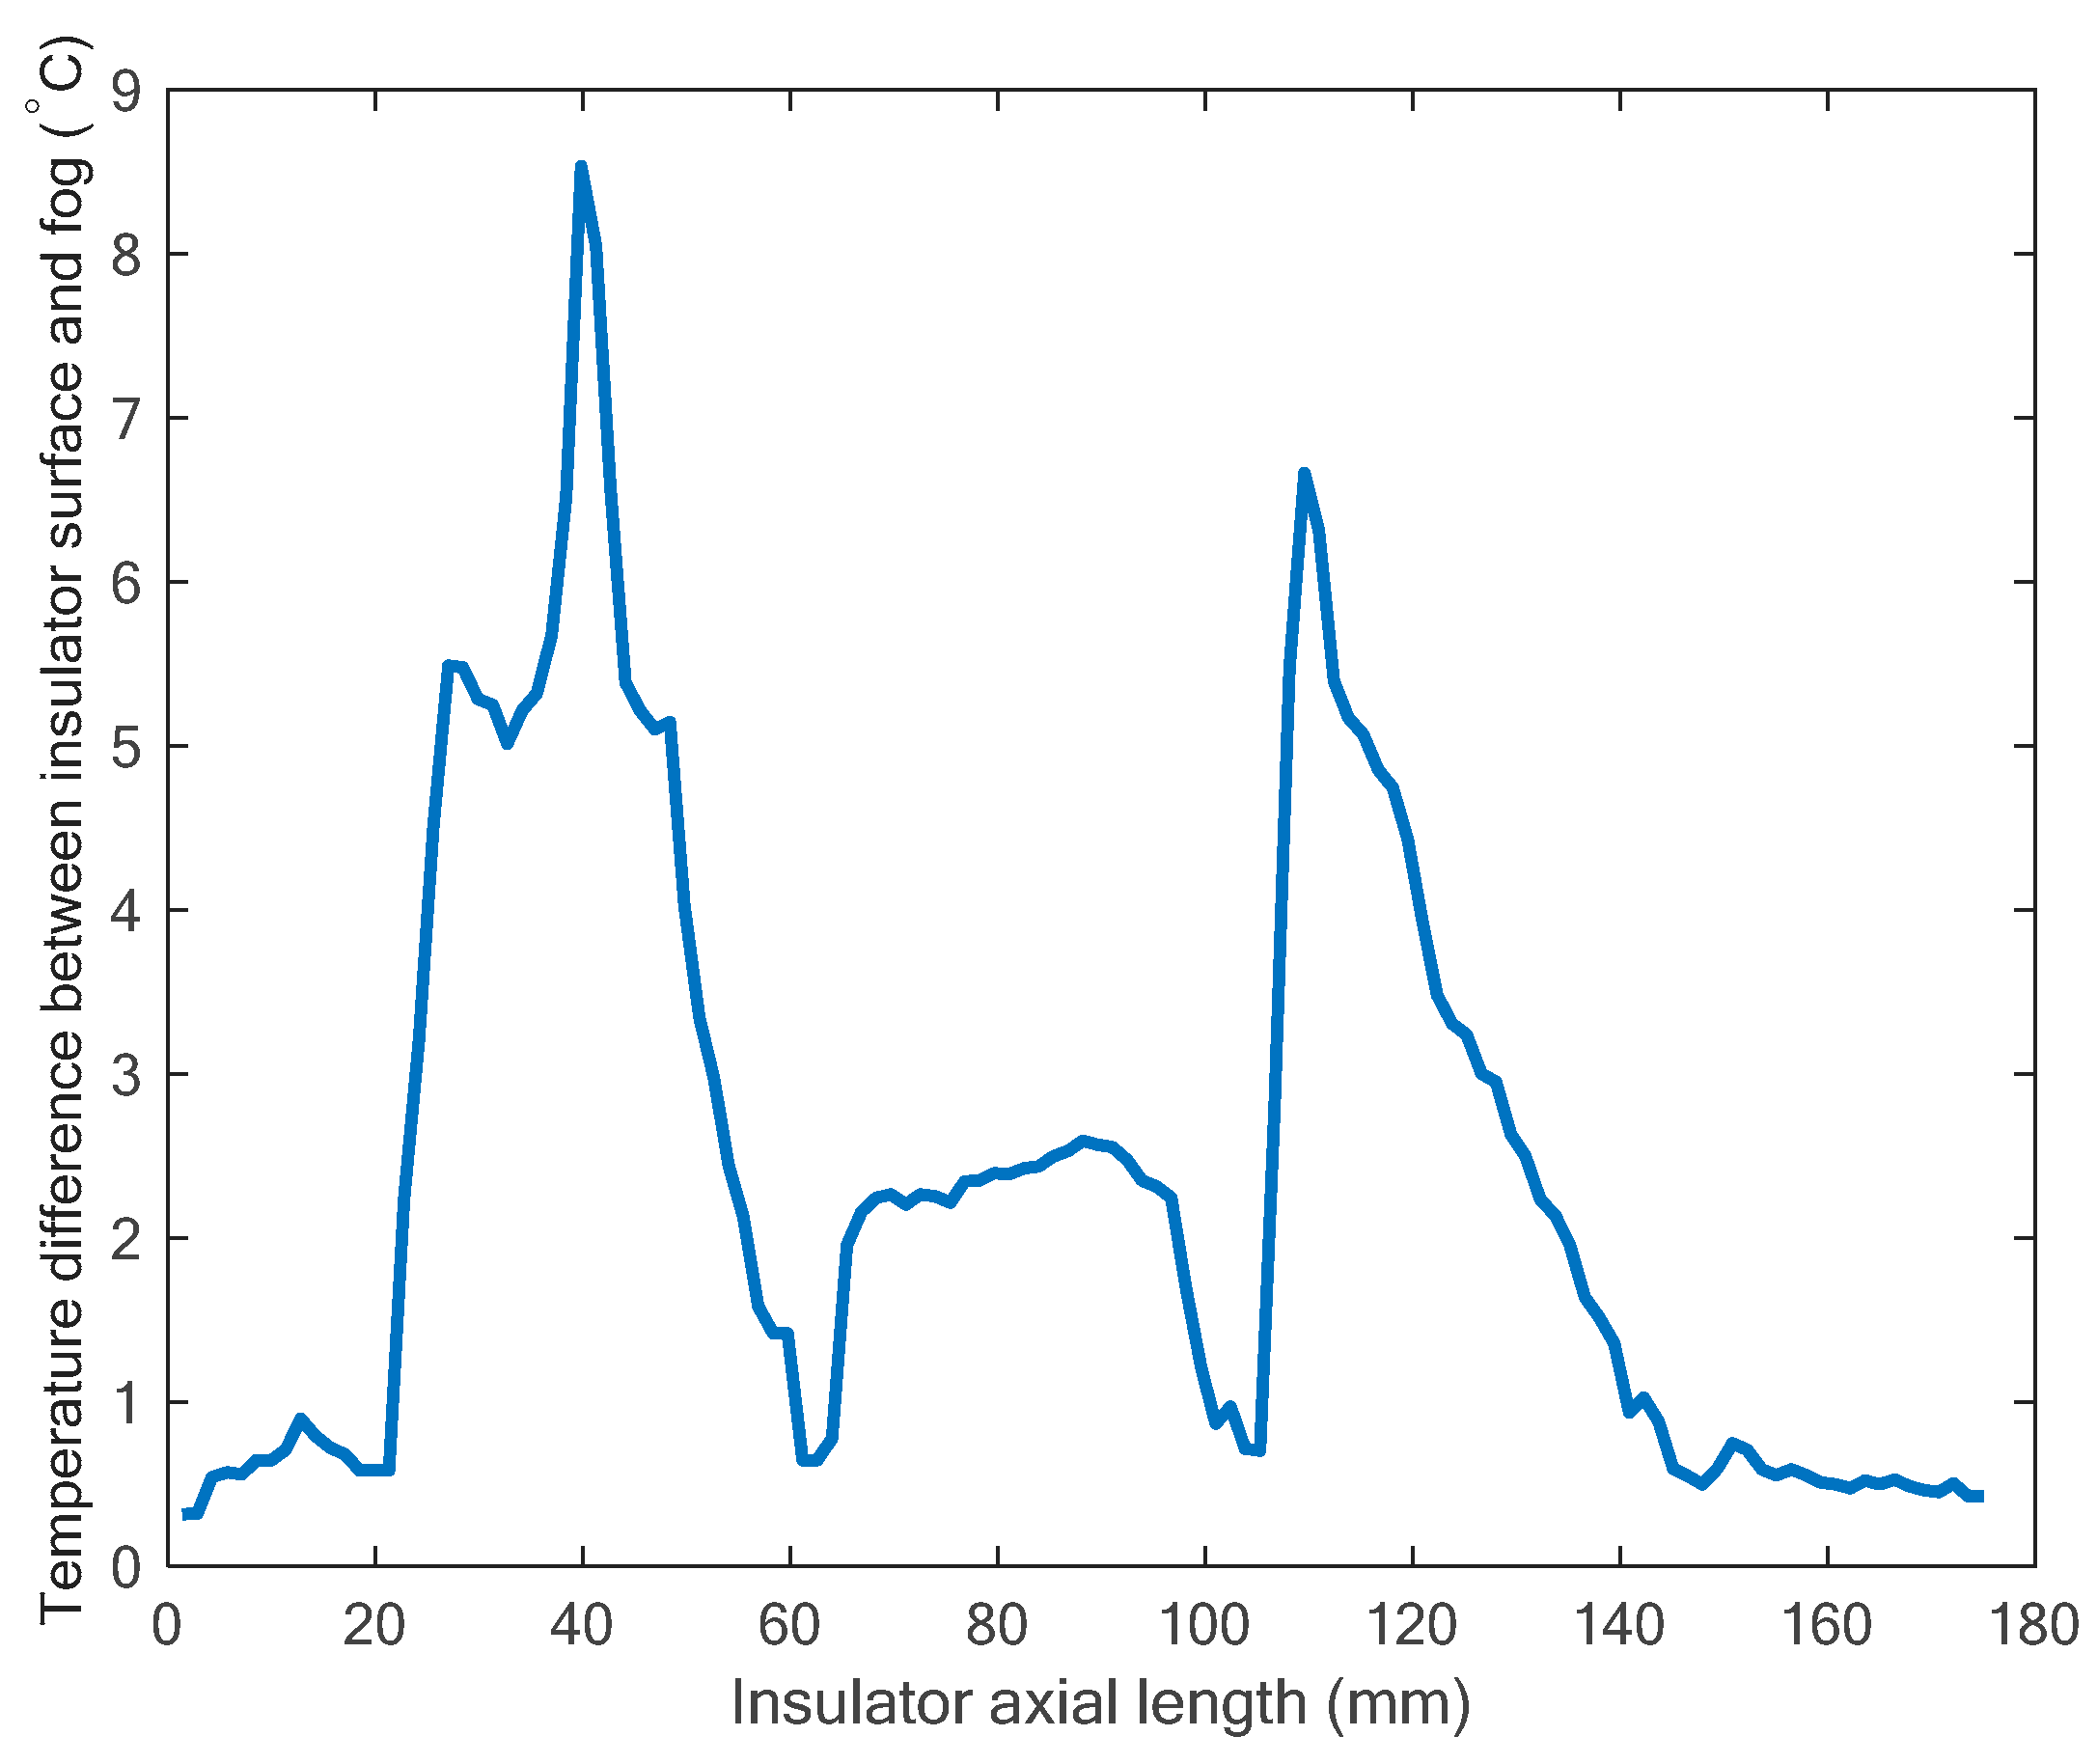
A differential temperature between the insulator surface and the surrounding fog along a vertical segment has been calculated for each test. After preliminary tests, using constant voltage, a fixed threshold of 5.5 °C appeared to be a quick identification method. However, if this methodology would be simply applied to the all extended ramp voltage tests the results would be not correct. In fact, a lower extension of dry bands would have been detected, with the temperature profile presented in Figure 3 as example. Moreover, the identification of the dry band is very time consuming if performed by the user by manually examining a significant number of frames and series of tests and this suggested the need for developing an automatic procedure.
The maximum average temperature on the whole insulator surface during the tests and the average values on identified areas can be evaluated from the thermal recordings. The extraction of the maximum temperature recorded during the test and the observation of its temporal variation can help to highlight only the timestamp of the spark/dry bands events but no information about their location, size or number. These limitations suggested the authors to develop a MATLAB computer procedure to acquire and process the temperature variation at different areas of the insulator. Preliminary investigations showed higher frequency of occurrence of dry-band and corona discharge events on the trunks in comparison with the shed areas. Consequently, increased surface temperature or spark events appeared mainly on these areas before flashover, suggesting limiting the analysis mainly on these areas.
3.1. Computer Technique for Identification of Dry-Band Boundaries
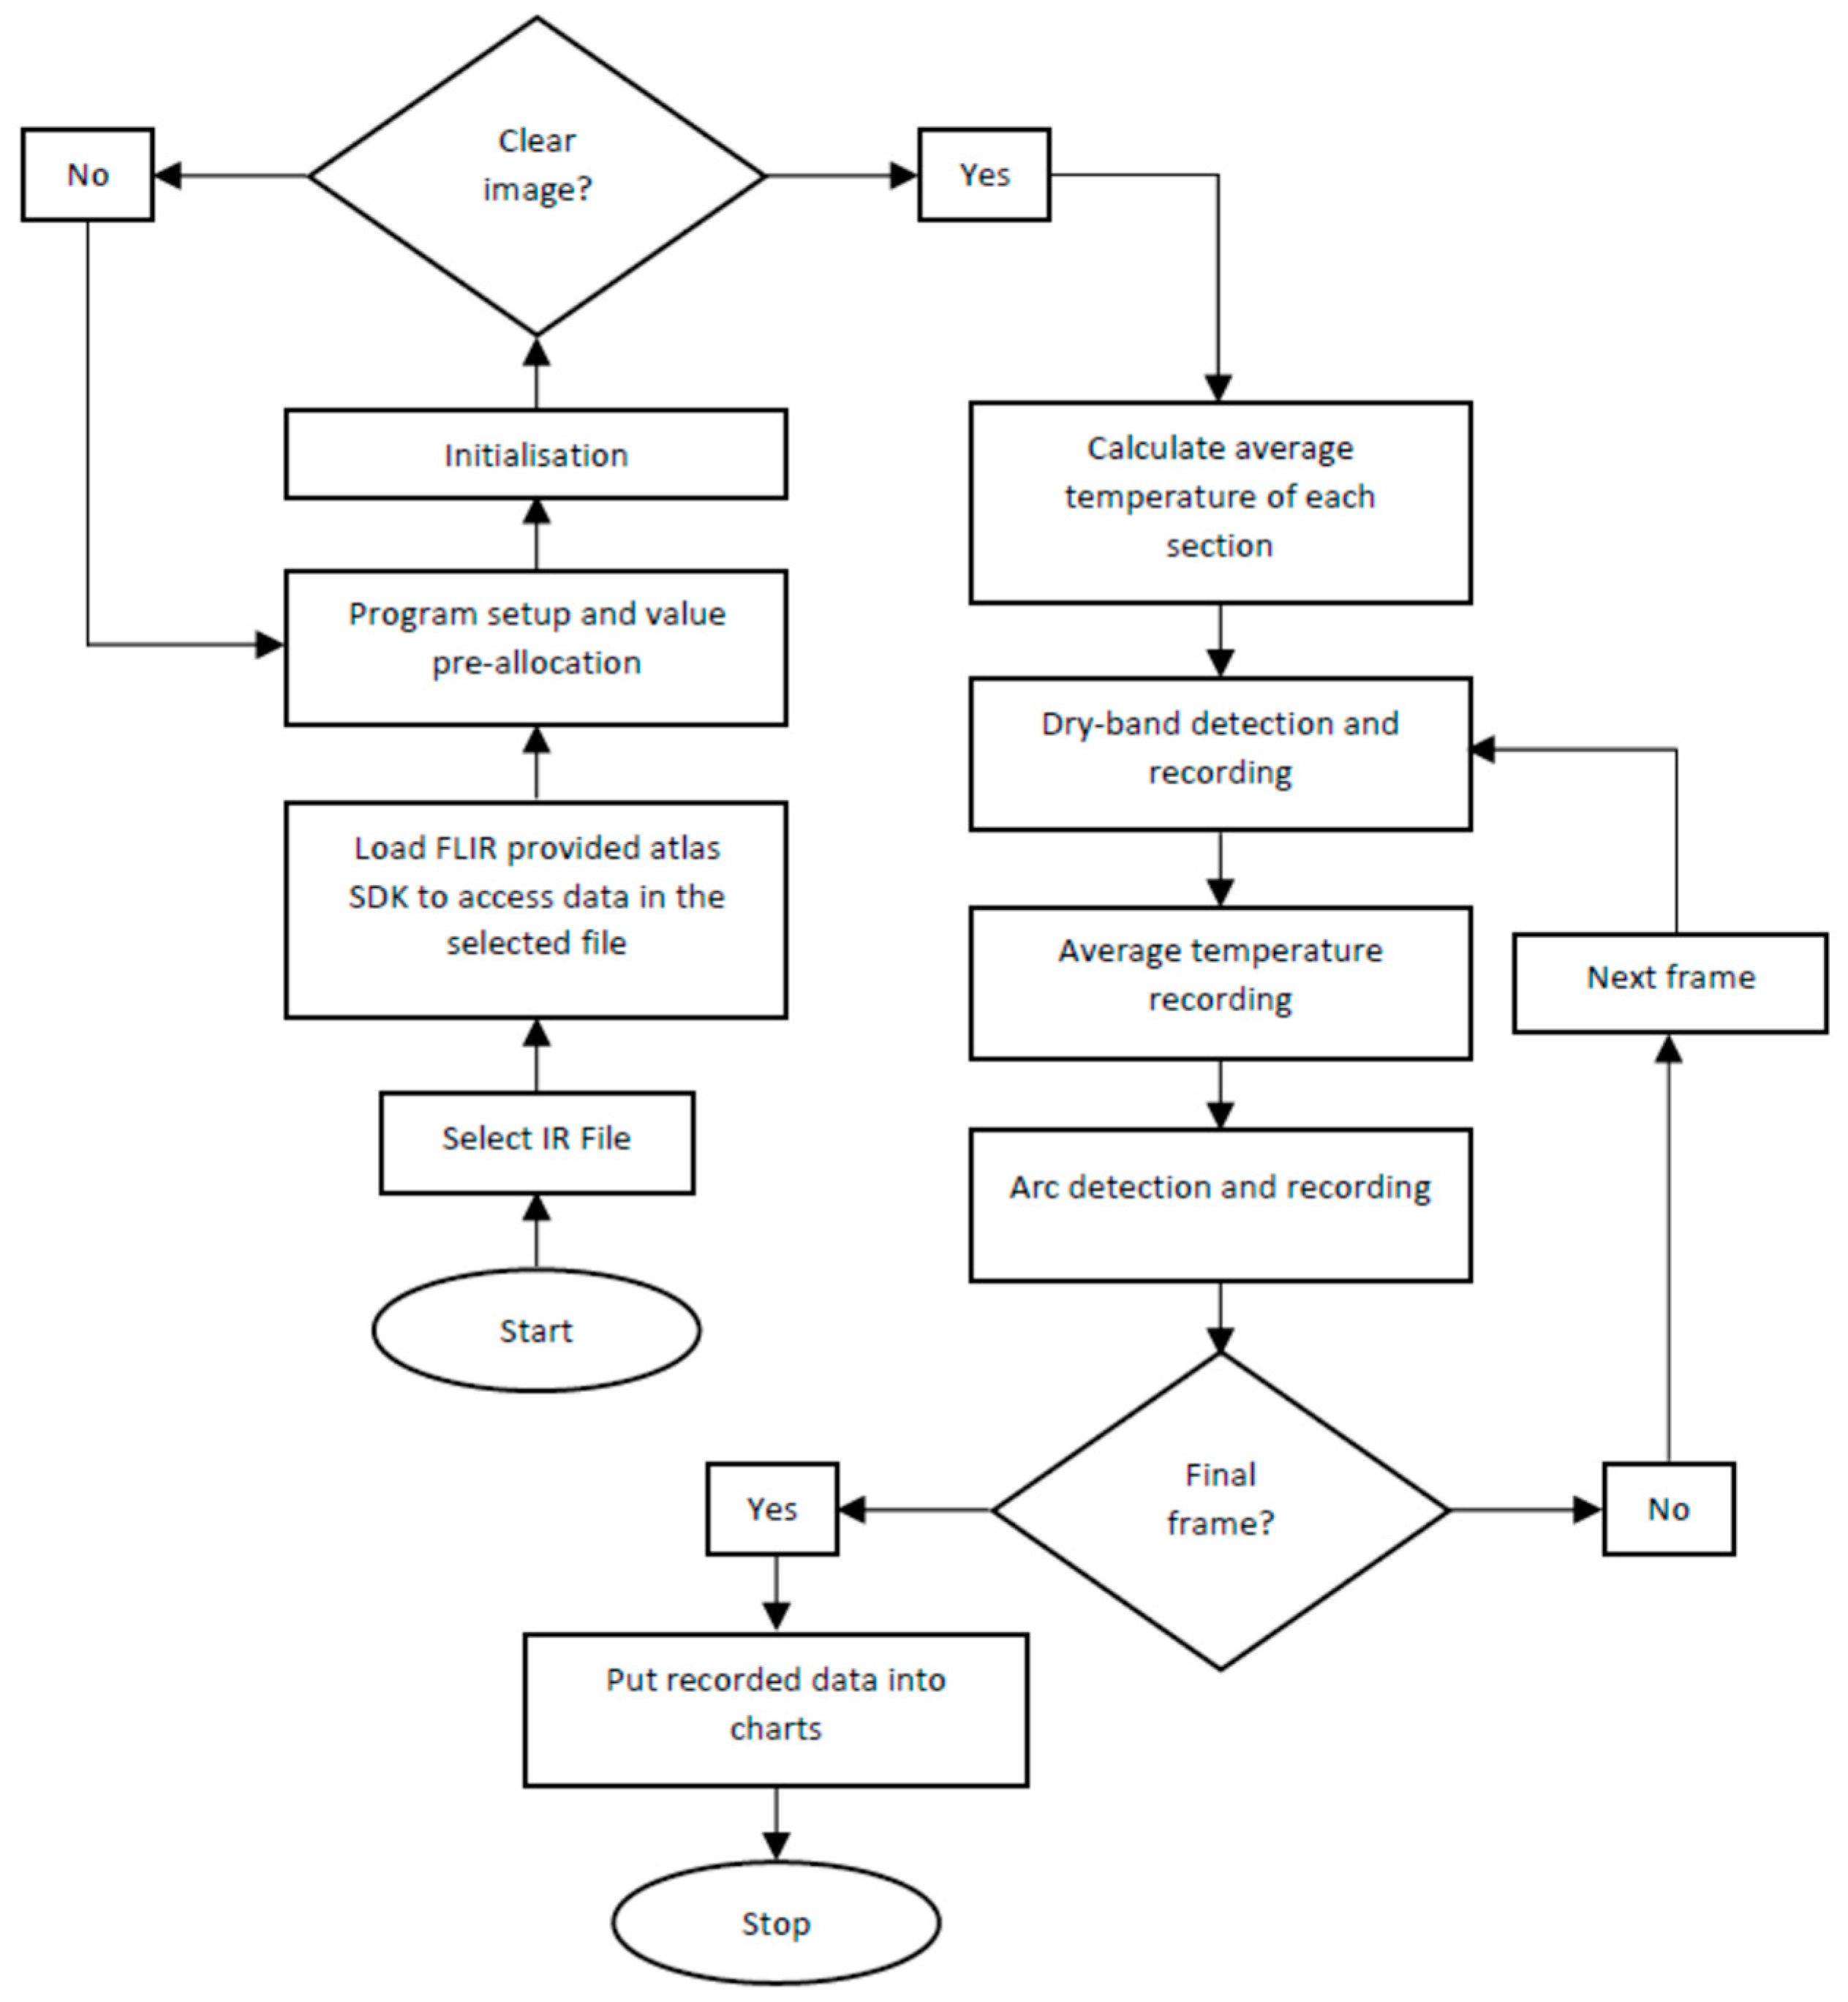
The precise identification of the insulator location and its perimeter on the thermal frame is a fundamental feature of the proposed analysis. The authors developed a MATLAB procedure to automatically detect the profile boundary of the insulator. This procedure is based on the analysis of the small variations between the ambient air surrounding the insulator and the insulator surface. Since the temperature difference between the insulator and the fog is quite small at the start of each test, the automatic identification is not a trivial task. In addition, possible reflections on the object can cause significant error in the outline identifications. A schematic diagram of the procedure adopted is shown in Figure 4.
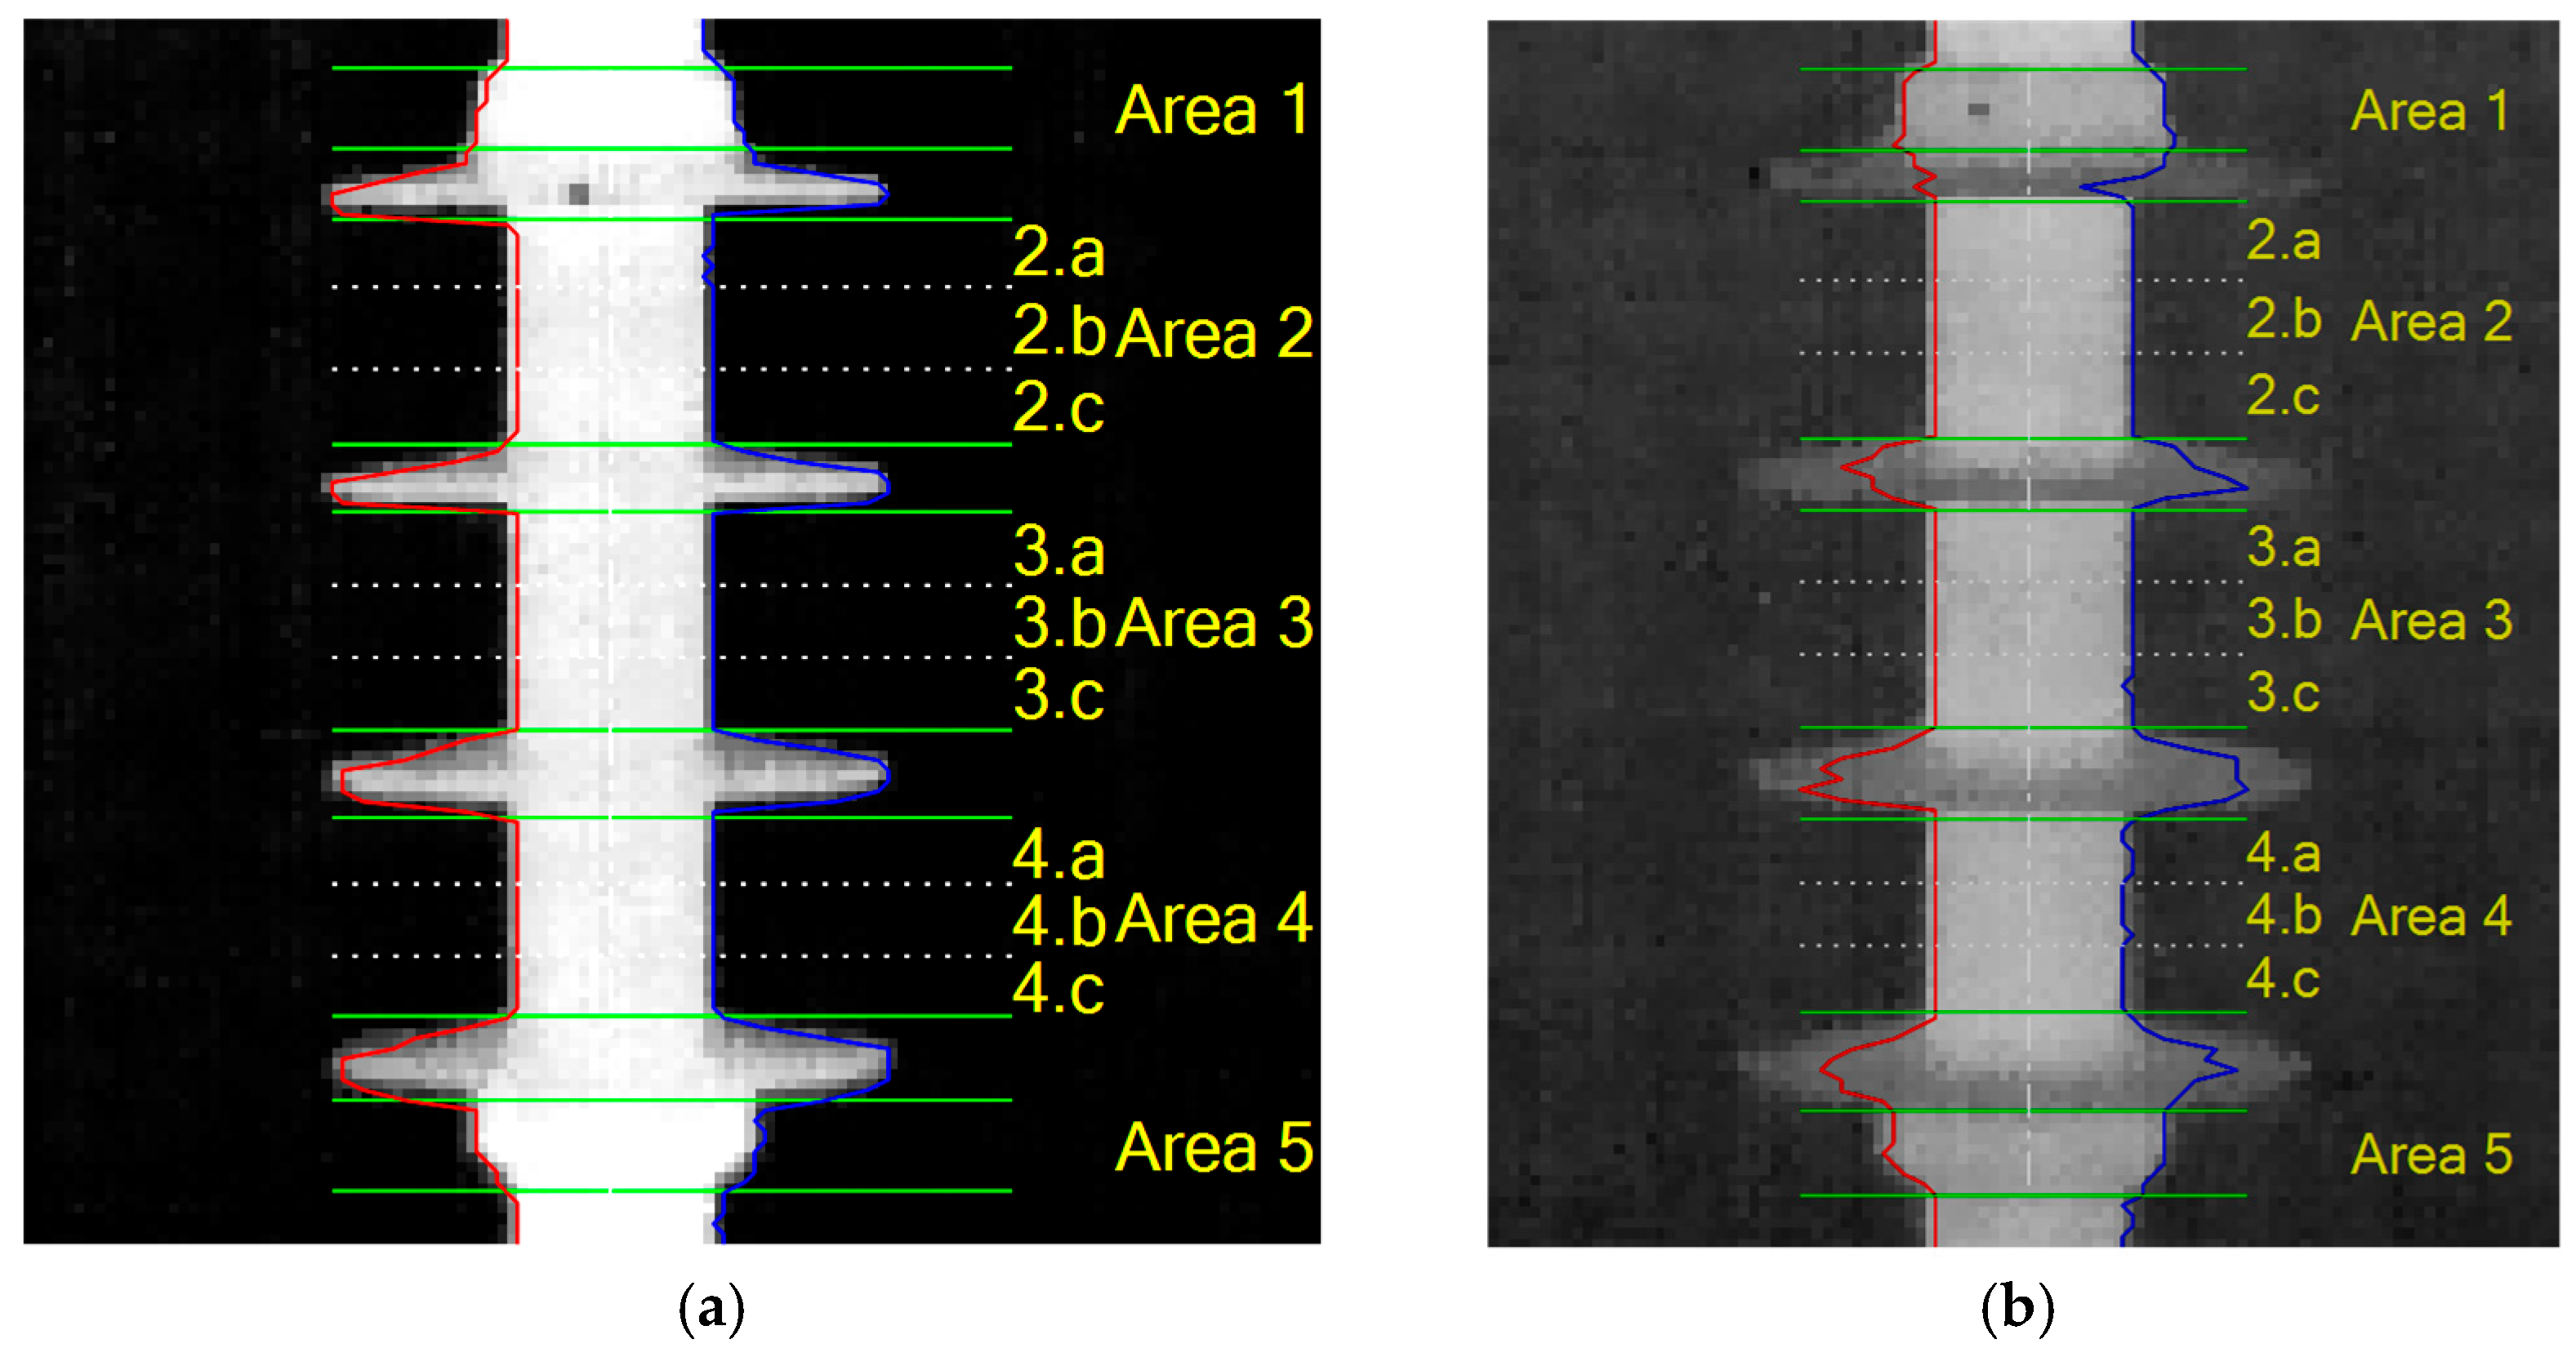
The boundary detection procedure is based on Canny Edge detection, but other algorithms, such as Sobel, Prewitt and Roberts, were also tested. The Canny algorithm showed the best accuracy when applied to this environmental condition. The two threshold levels required by the Canny algorithm are automatically selected using two key areas of the frame, assuming the left corner as representation of the fog temperature and the hotter area indicating the insulator position within the frame. Once the perimeter is extracted, it is subdivided in two sections, the left- and right-hand boundaries, as can be seen in Figure 4 with the red and blue colours, respectively. Then, they are plotted over the frame for final acceptance by the user. As shown in Figure 5b, the boundaries are not always identified completely, and the user can decide to modify the thresholds or introduce some corrections. However, despite some uncertainty on sheds areas, the areas of interest, the trunks are correctly identified in most cases.
A second step of the procedure aims to identify the shed and trunk areas, since only the trunk areas are processed on the temperature analysis. The trunk surfaces have been subdivided into three zones (a, b, c), identified by segmented white lines in Figure 5. The presence of the shed characterizes the type area a, meanwhile the type area b is located on the central area, more exposed to the fog and prone to a stronger wetting action. The remaining one, area type c, is located on the trunk near the top shed zone.
Assuming the insulator is always on an almost vertical position, the average of all the horizontal coordinates of the trunks permits to identify the position of the vertical axis of symmetry, drawn on Figure 3 as a dot–dash white line.
3.2. Average Temperature Calculation
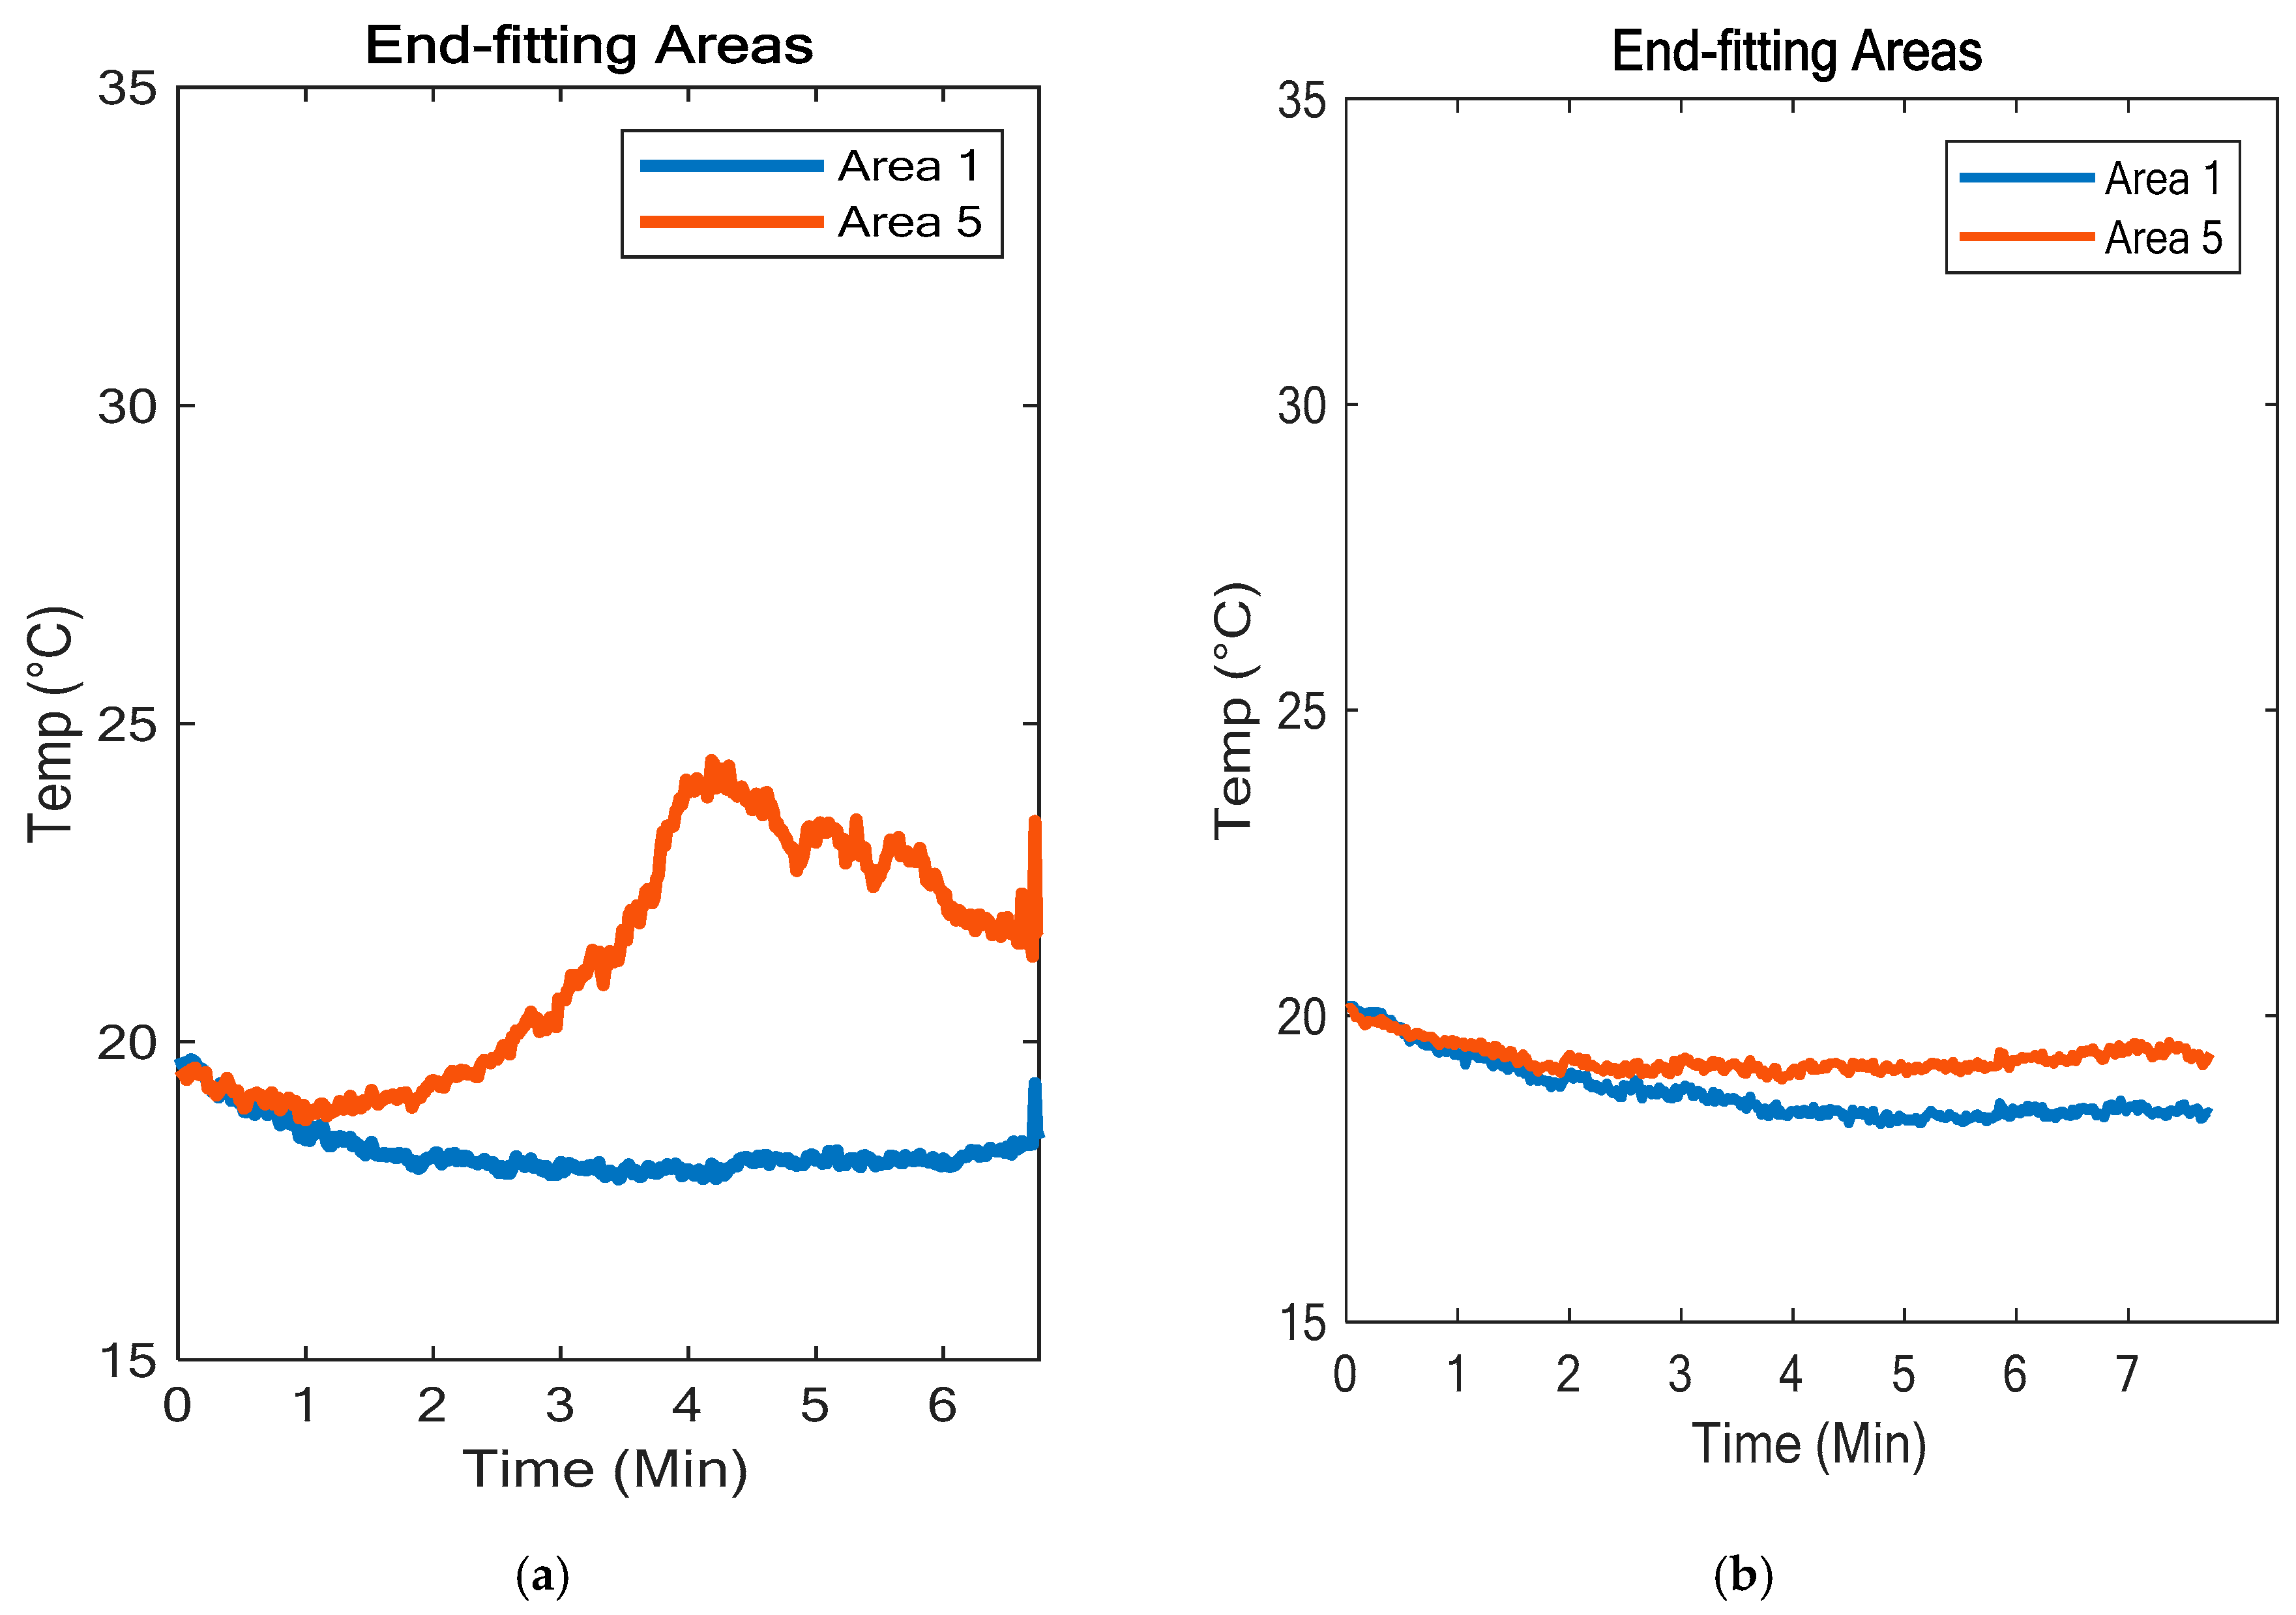
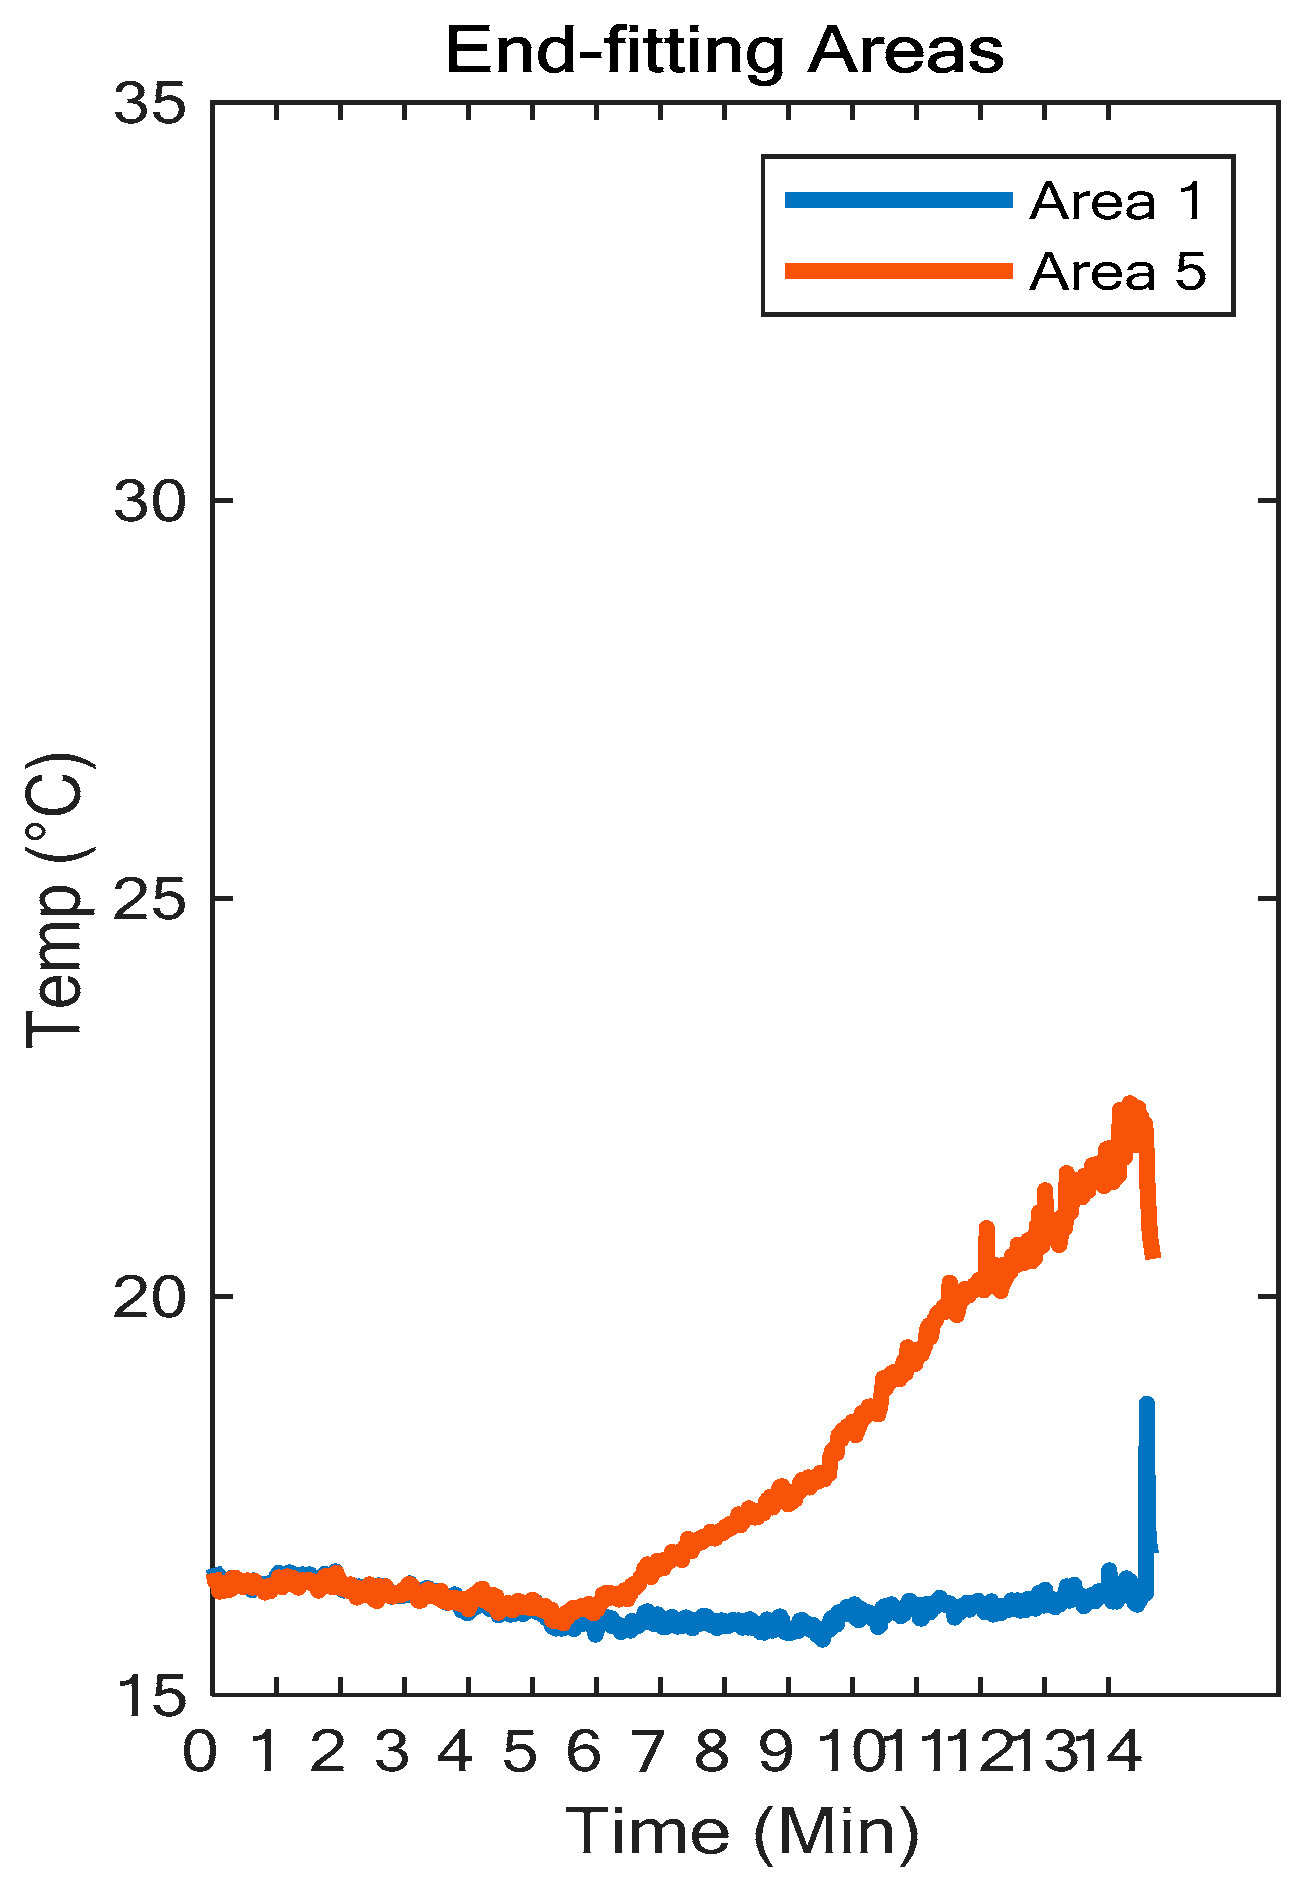
The precise identification of the boundaries of the insulator enables the extraction only of the values related to each area from the IR temperature data, neglecting any measurement related to the fog. The procedure calculates the average temperature of each area for each frame. This permits to identify different trends related to the design. Figure 6 shows the two end-fitting areas during the whole test for the conventional and textured TT4 insulators.
In the first two minutes, the fog formation determines a cooling effect on the initial period. Afterwards, a steady increase in dry-band extension is observed as the voltage and current increase. The polluted insulator previously stored at laboratory temperature is placed in the fog chamber where, as the test begins, the fog cools the insulator surface until the discharge activity heats up the surface.
In particular, the temperature of area 5, which is the trunk close to the ground termination, is observed to increase in many tests of the conventional design. The increment of temperature in the graph confirms the presence of a dry band and discharge activity. This trend is not followed for the textured design, indicating no significant activity in this area. The area 1, which is the trunk area close to the high voltage termination, shows no discharge activity for both designs.
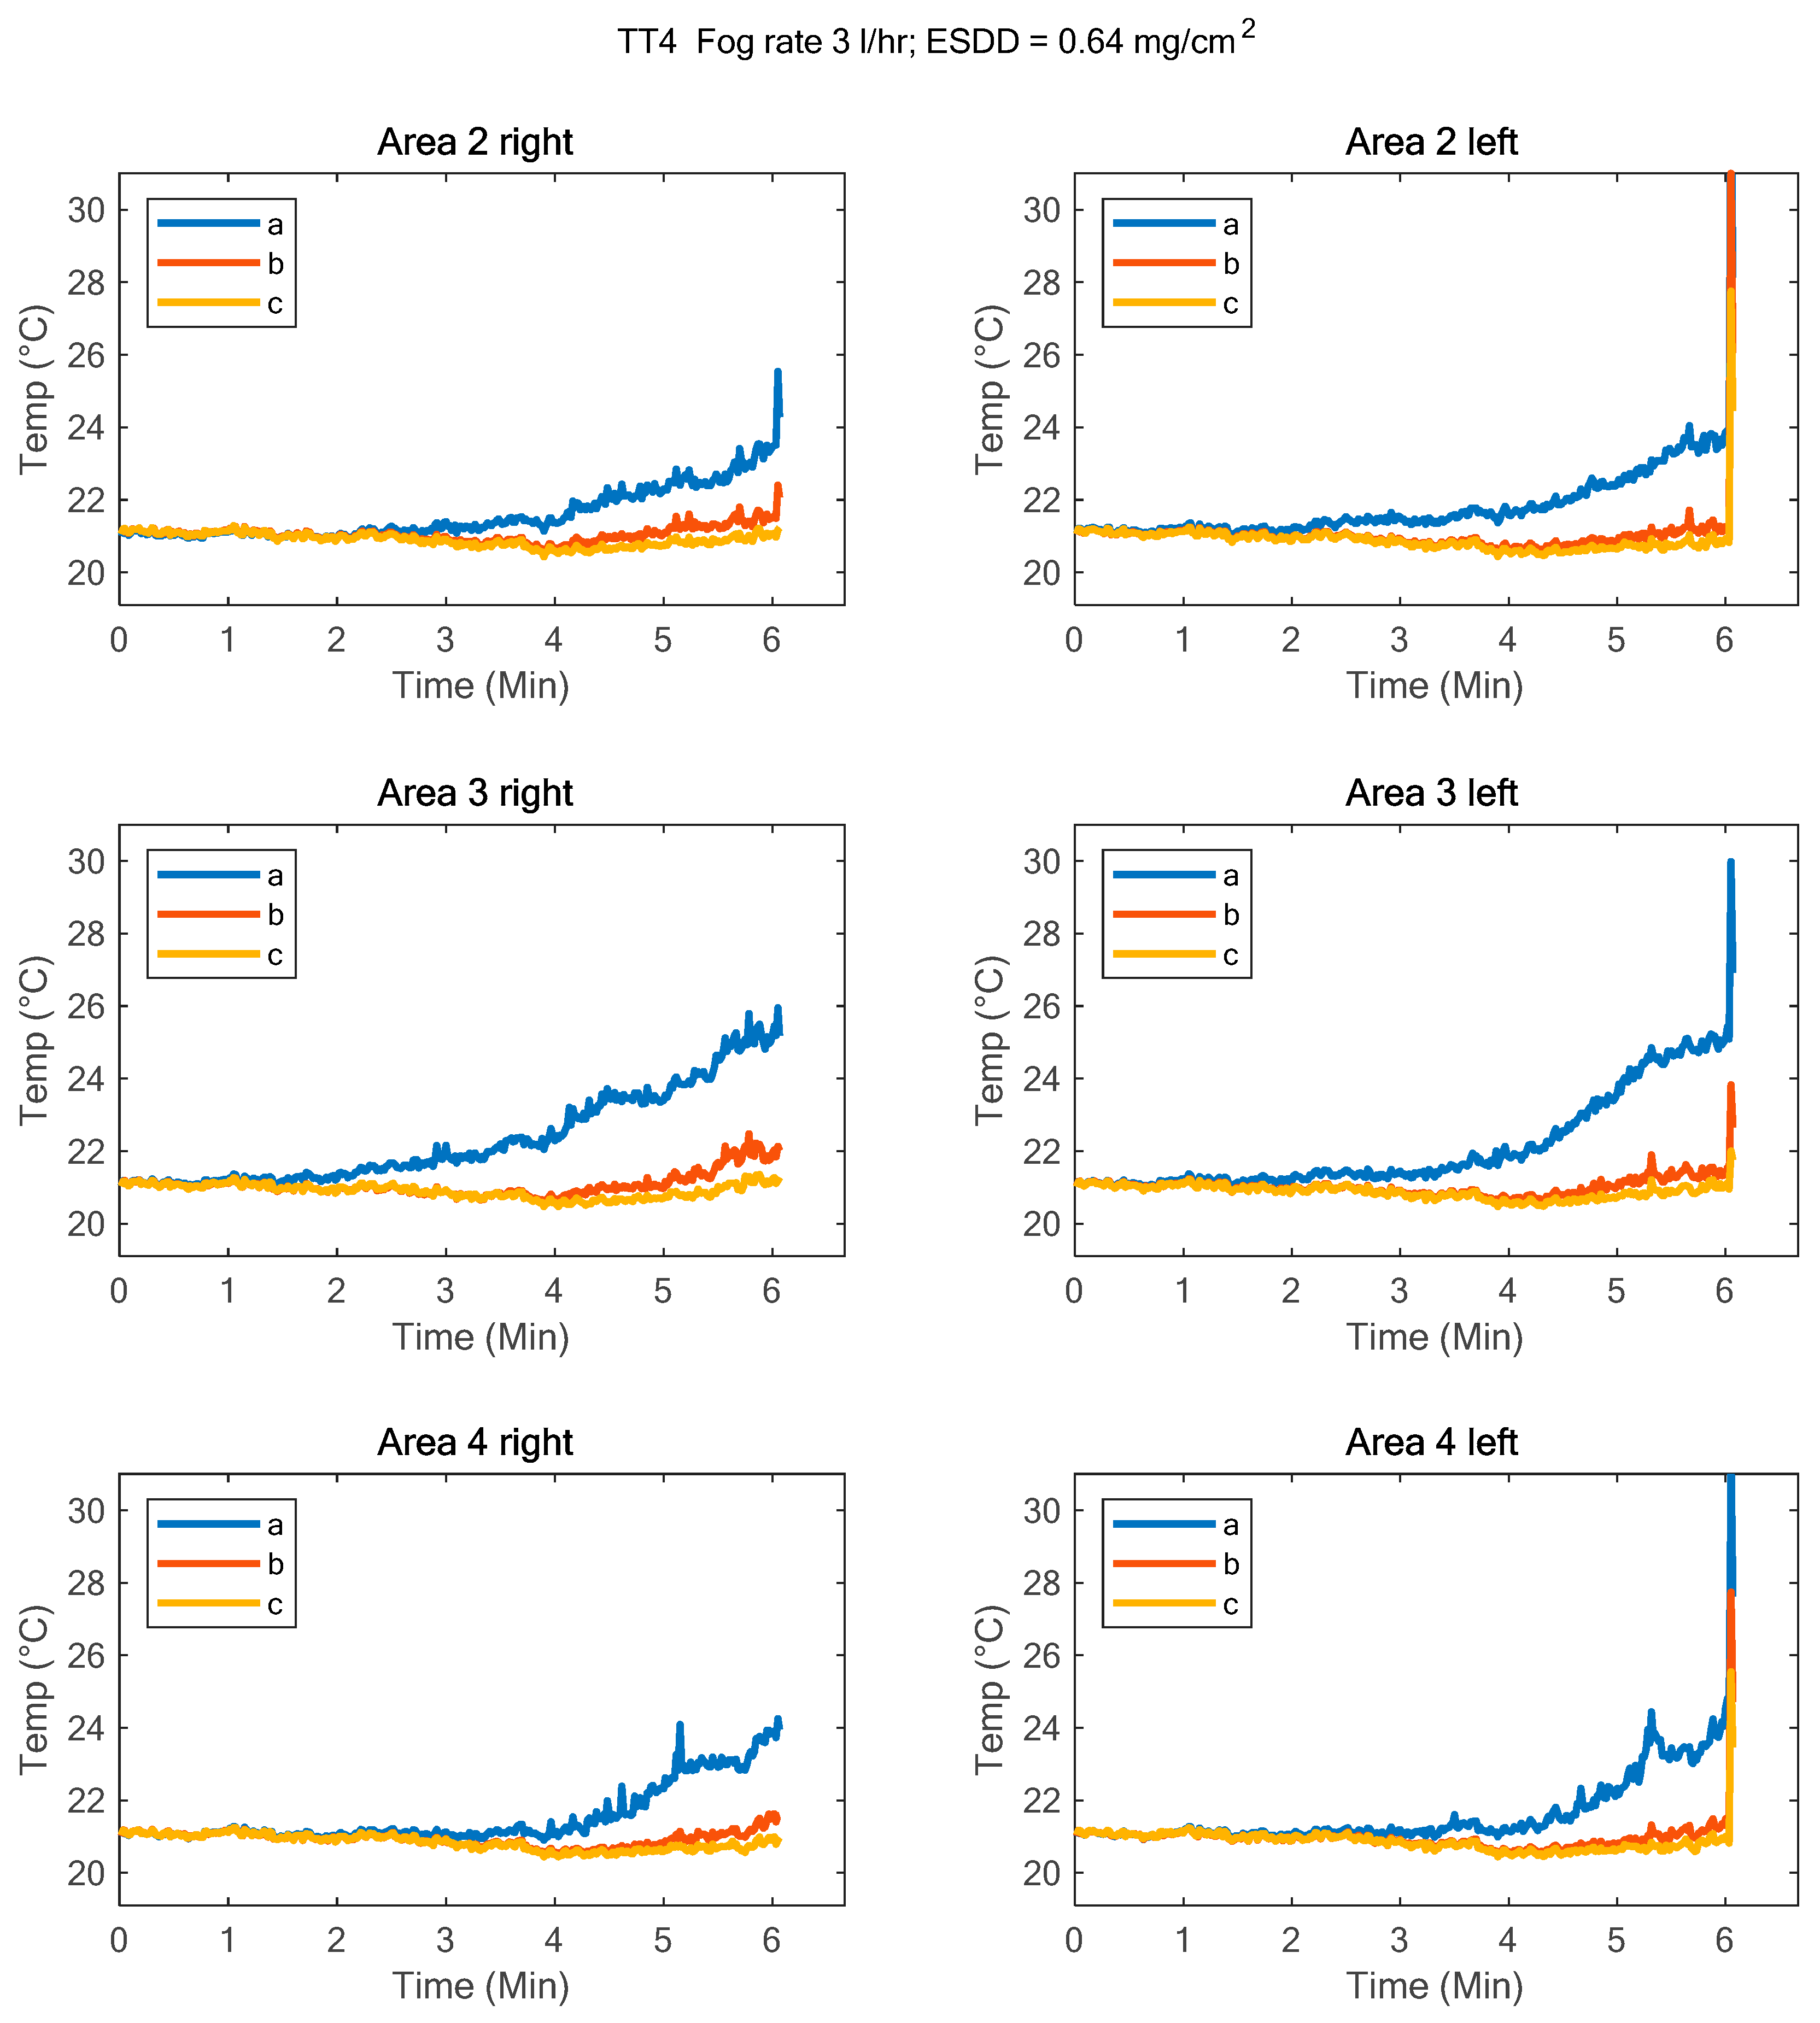
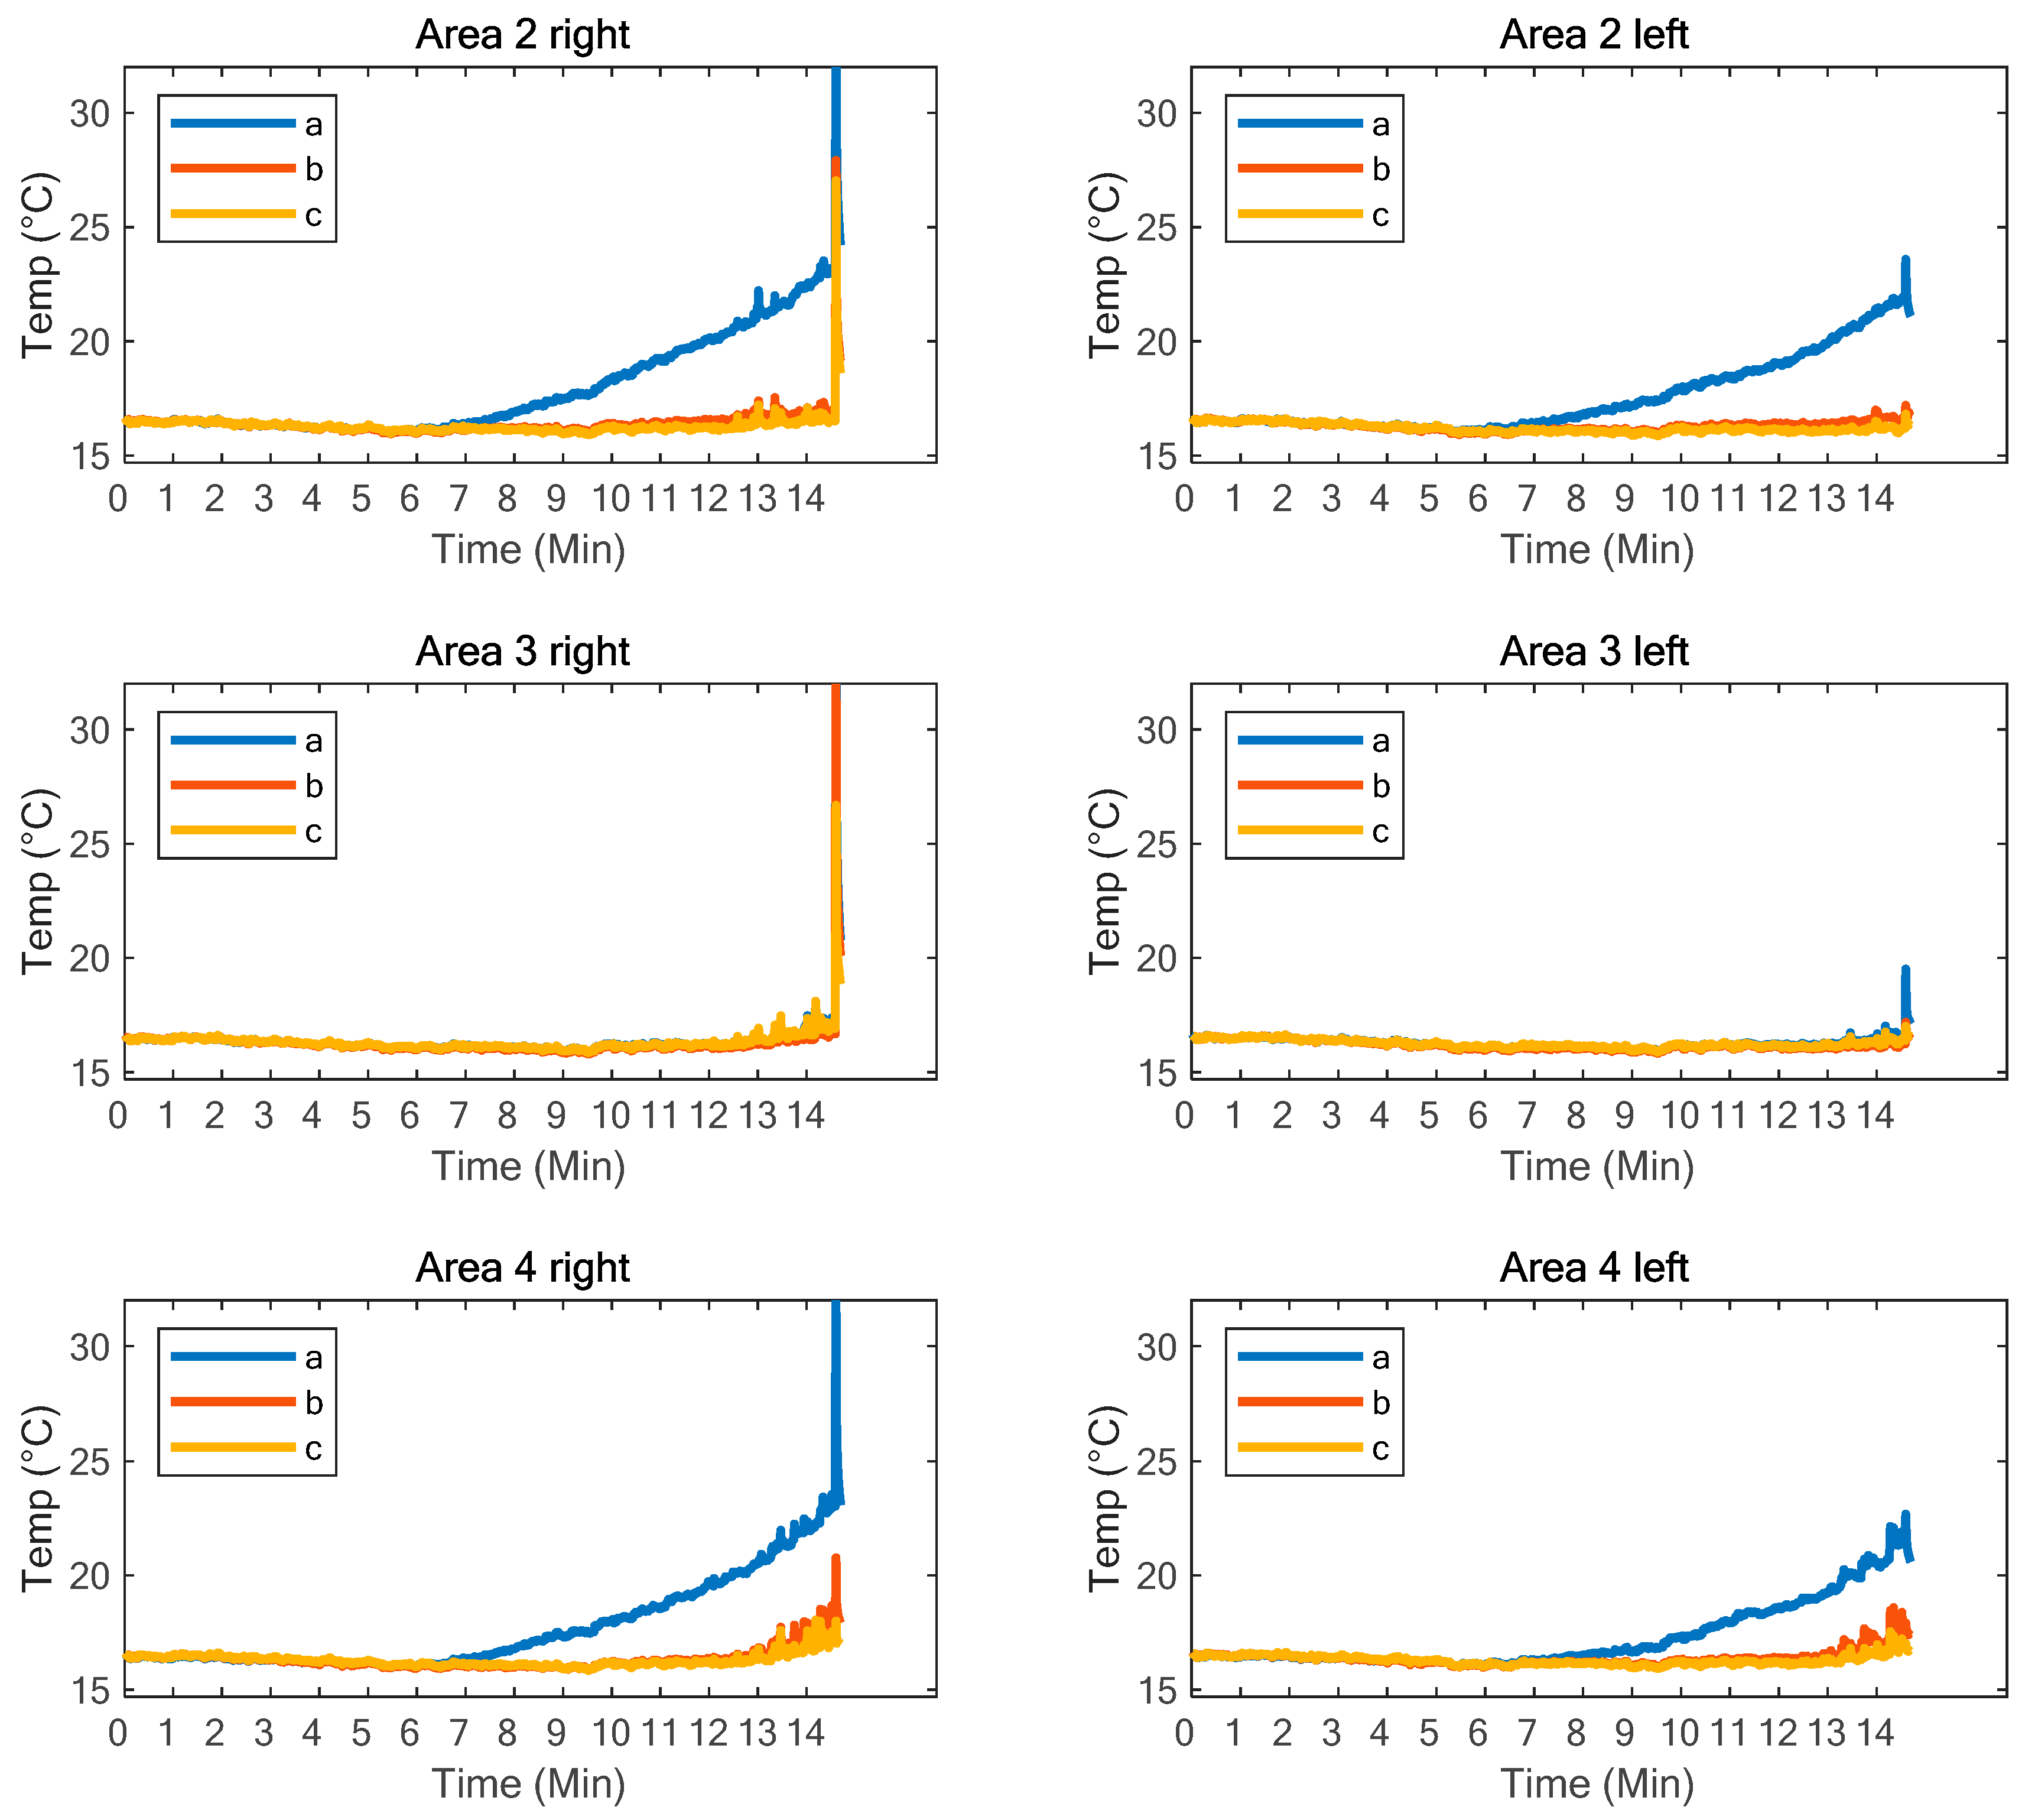
Figure 7 shows the average temperature of each zone of the three trunk areas for a TT4 design, with a pollution level of 0.64 mg/cm2. The temperature trends are aggregated in two subplots to facilitate the comparison between the left- and right-hand areas. The comparison between left and right areas confirms that the artificial pollution has been applied correctly to achieve uniform ESDD on the surface and no significant variation is observed.
From the plots, the different temperature trends are clearly visible for zone a, suggesting that the formation of dry bands is facilitated by the presence of the shed, shielding the wetting on this zone. Another clear indication from the average temperature of subareas is that subarea c always presents the lowest average temperature in each trunk. This suggests that the wetting is enhanced in the other two subareas, meanwhile in the area closer to the shed, the wetting is slightly reduced, creating better conditions for dry-band formation.
It is noted that the textured design tends to initiate dry bands on all the three areas, creating a more uniform distribution. This is not observed on the conventional design, exhibiting a more localized formation, as shown in the Appendix A in Figure A1. In fact, the middle trunk, area 3, does not show any significant increment, meanwhile the other two trunks show temperature increments in zone a. A rapid increase in temperature at around 5 to 6 min before the flashover event is observed.
3.3. Dry-Band Analysis
Another useful indication is the localization and progression of any dry band during the test. The identification of dry bands using a fixed selected threshold cannot be detected correctly, as described in the temperature profile reported in Figure 3. In addition, using a variable level function only on the first IR frame is still not always applicable because of the cooling trend by the fog, as described previously.
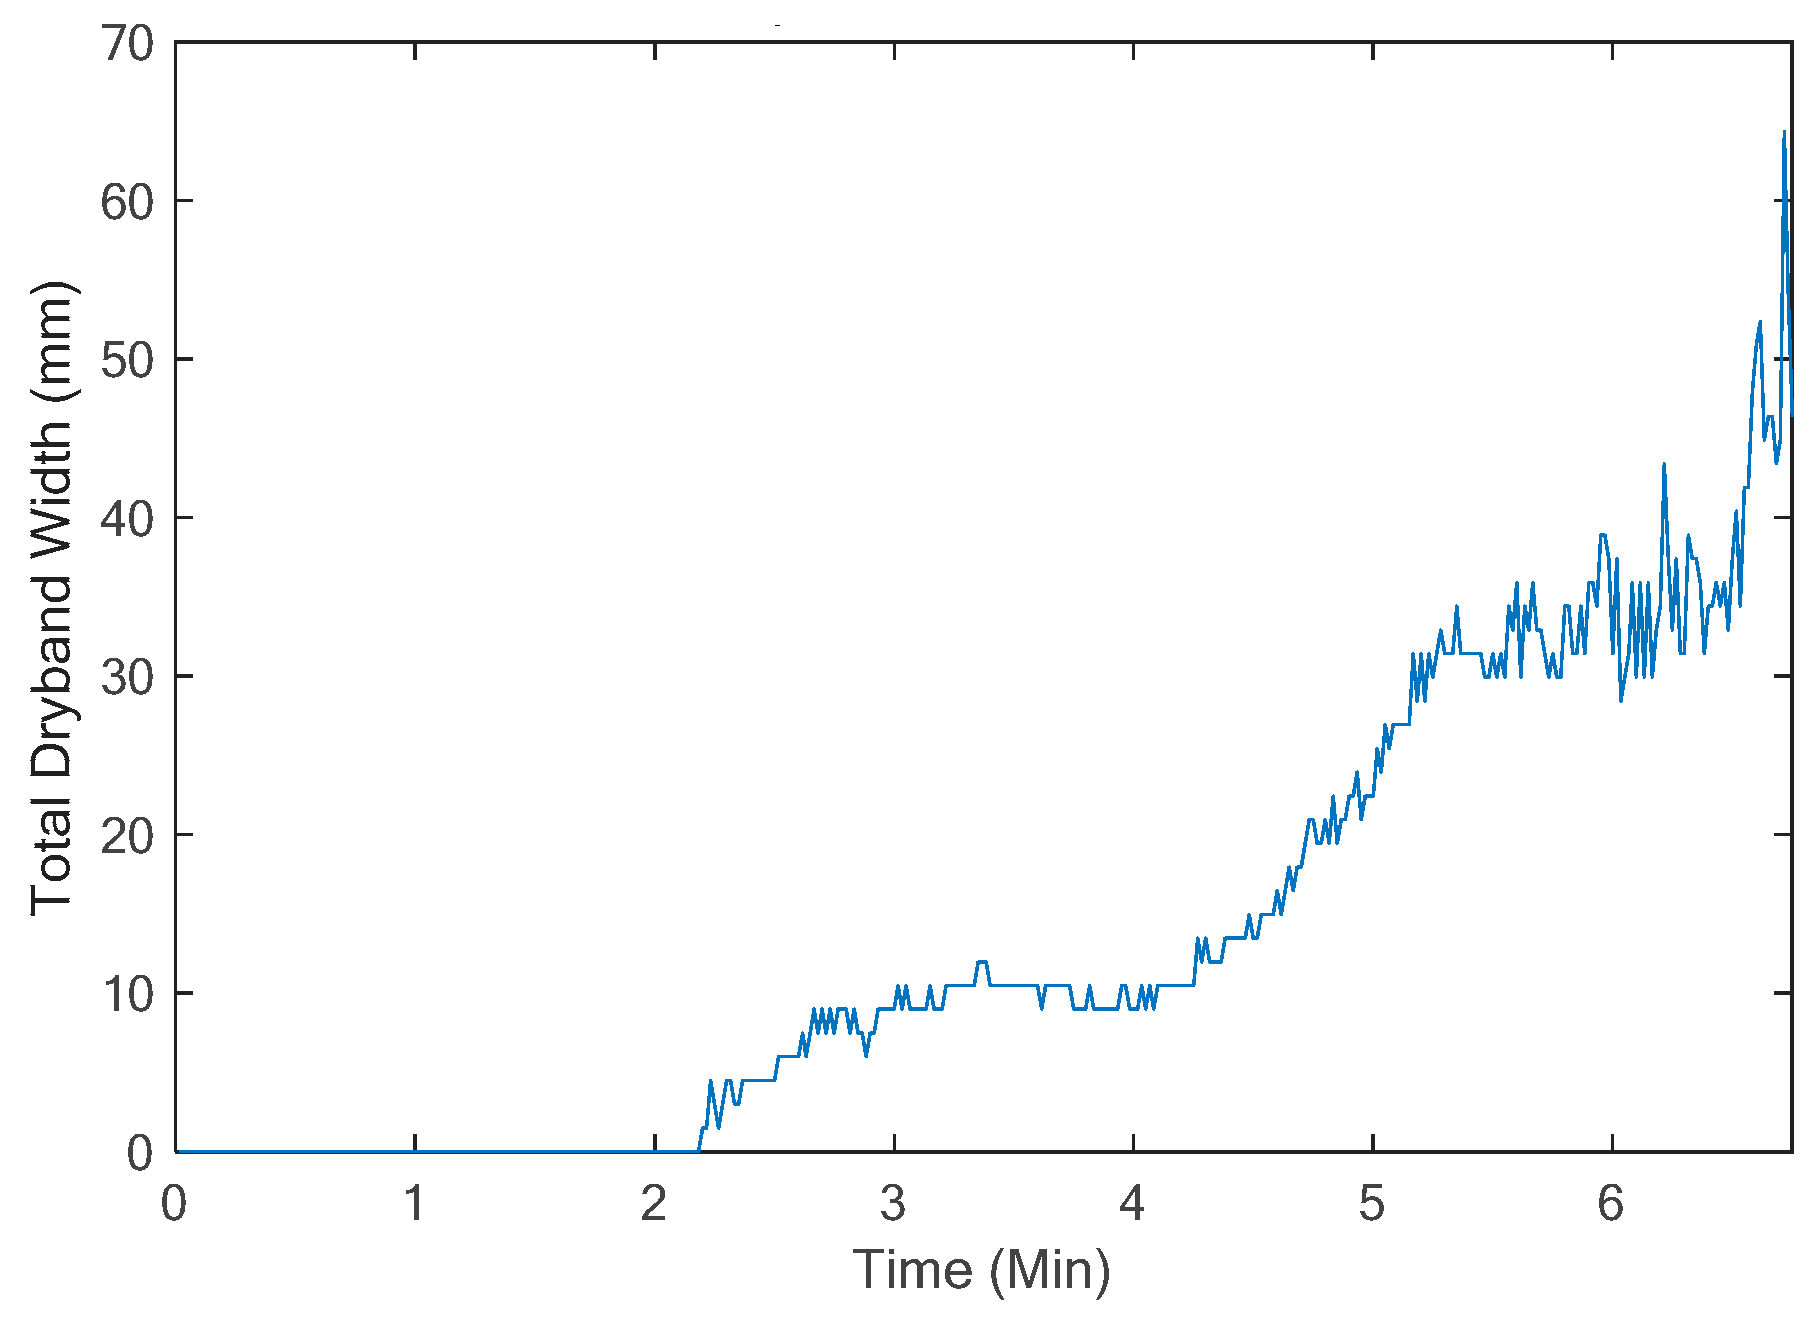
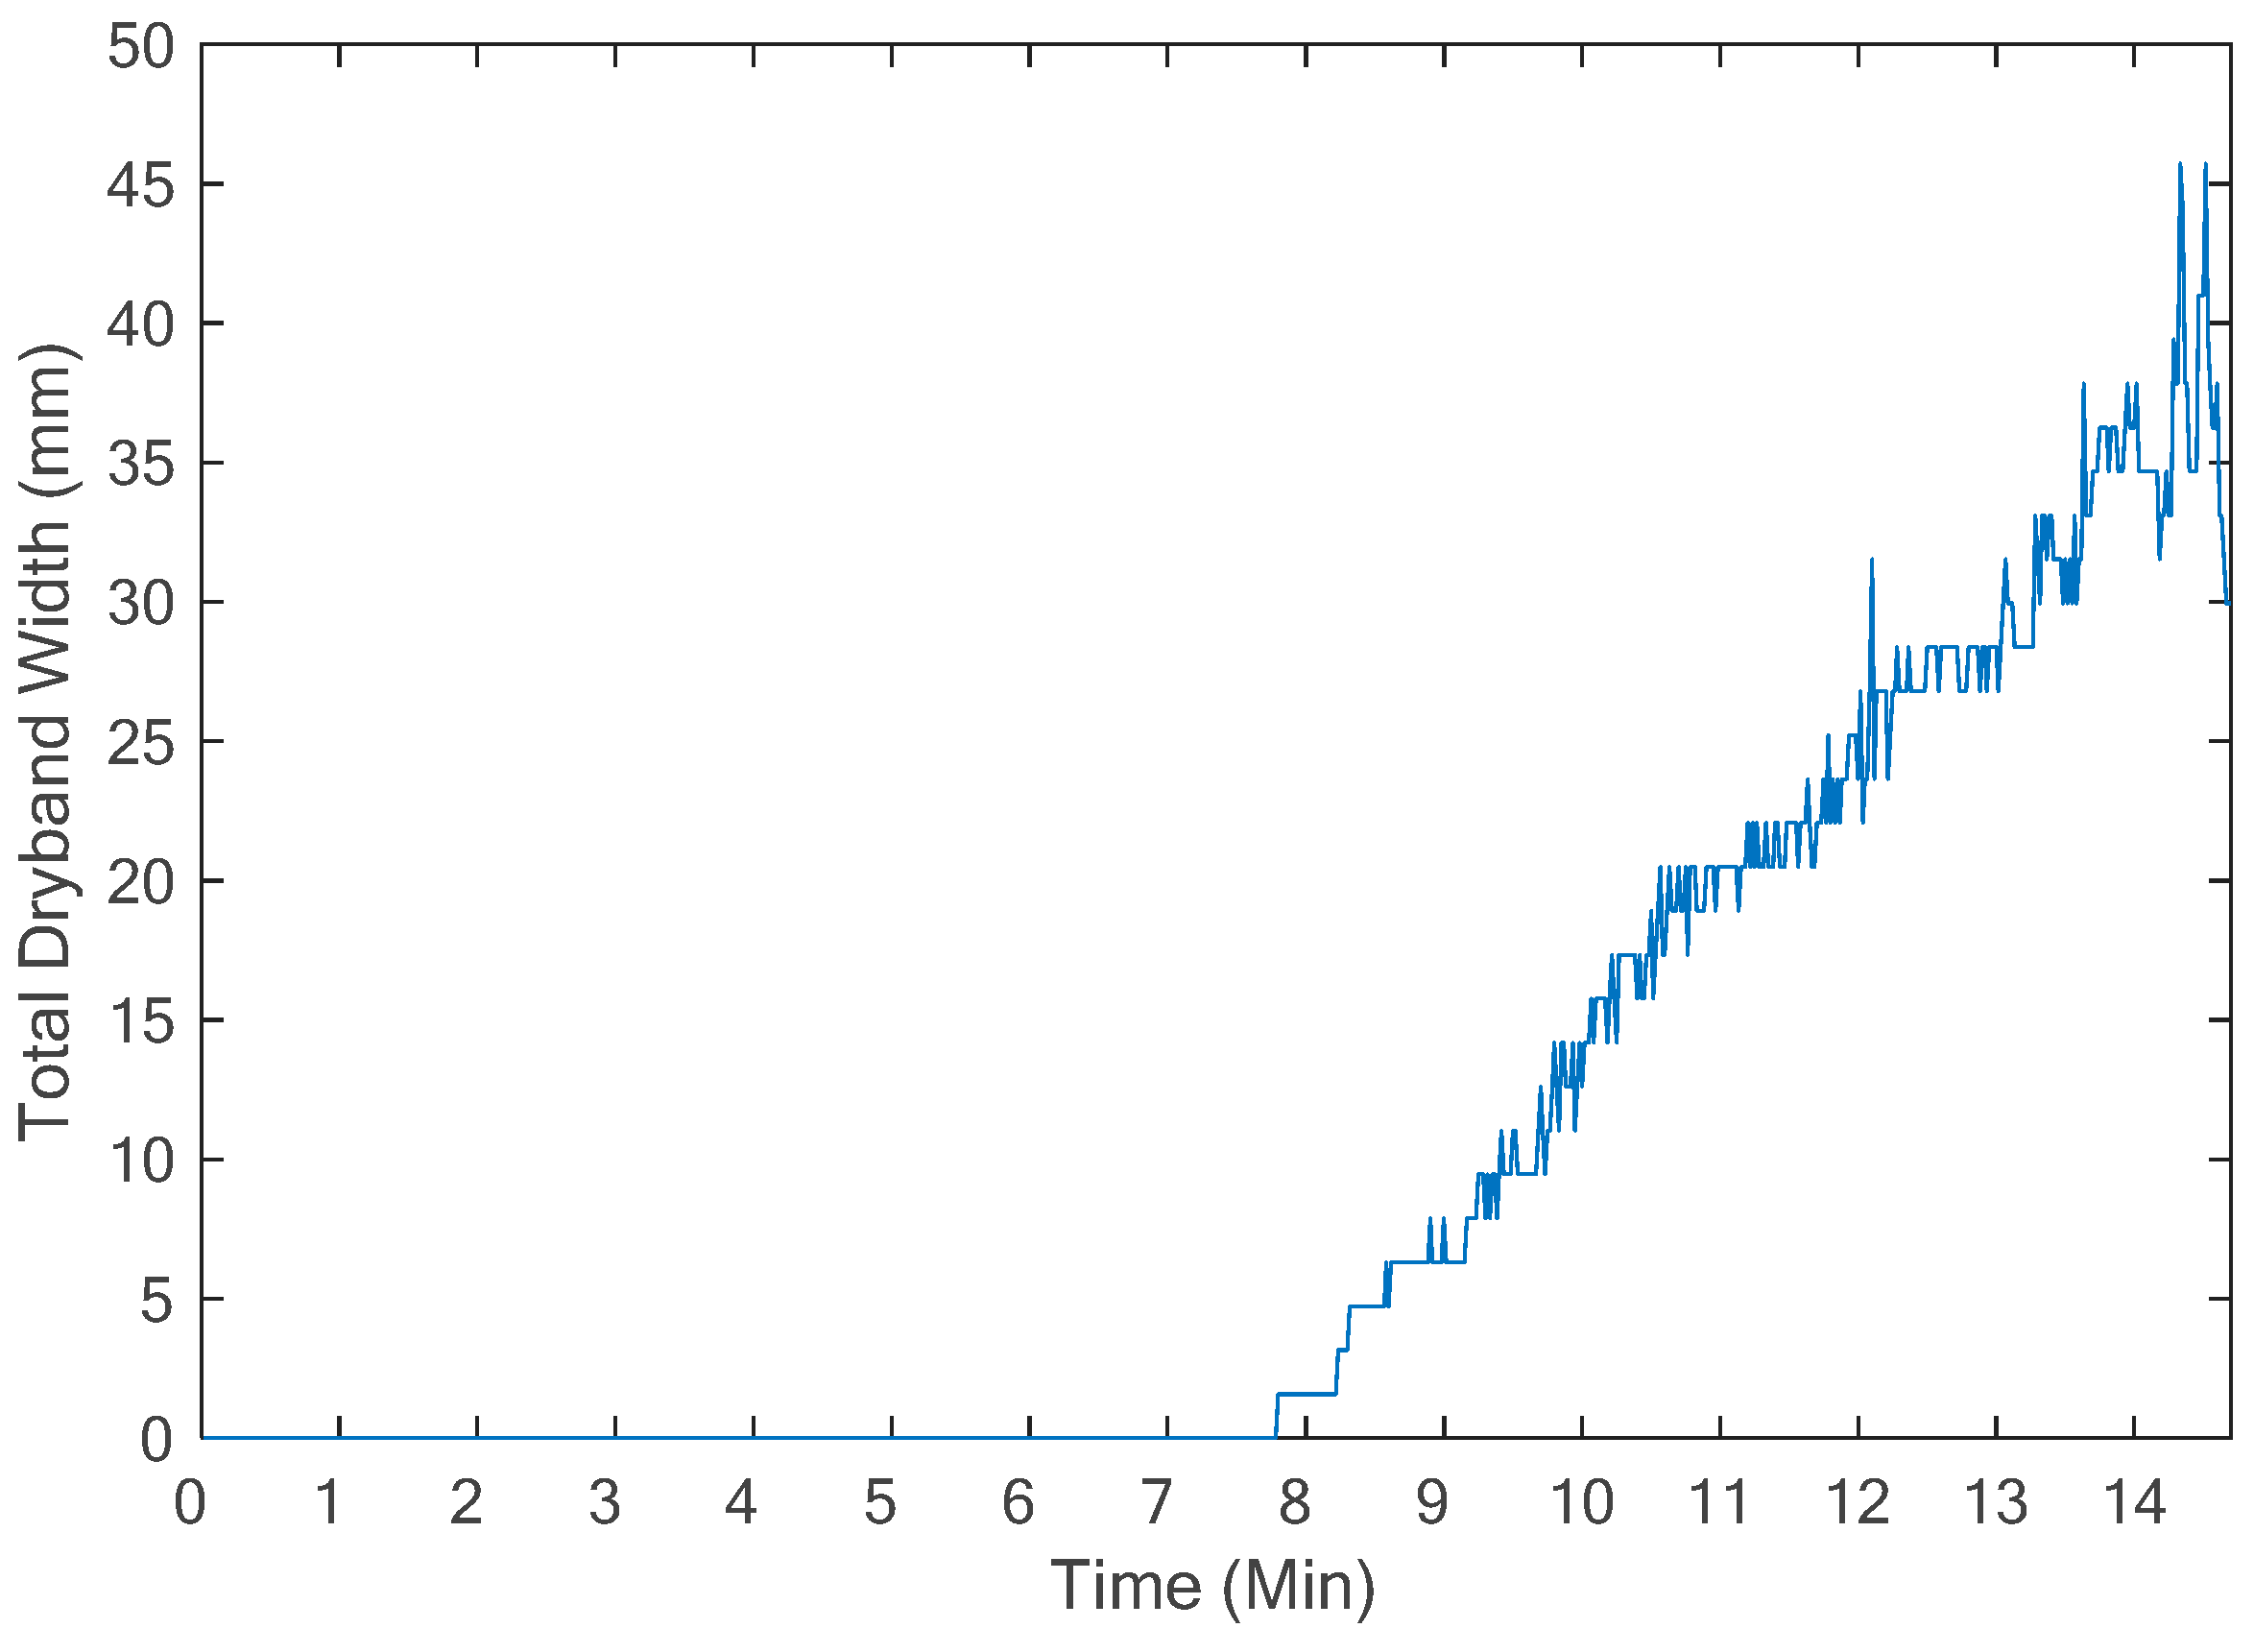
The proposed algorithm of dry-band detection is based on identifying the points/area where the minimum average value is exceeded within the trunk zone. This permits to take into account any cooling effect in the initial period or overall variation not caused by a localized event. Each dry-band width is then evaluated calculating the average temperature of each left- and right-hand horizontal row of data given by the individual IR pixels. If these values exceed the threshold, the row is flagged and counted. The total dry band extension along the vertical axis for each frame is calculated converting the number of pixels in mm, given the distance between the terminals of the insulator; and in this case, it is equal to 175 mm.
The sum of all dry-band extensions along the insulator axis for all the duration of the test (Design CONV, ESDD 0.64 mg/cm2, fog rate 3 L/hr) is presented in Figure 8. An analogue test using a lower pollution level (ESDD 0.42 mg/cm2) is shown in the Appendix A as Figure A3.
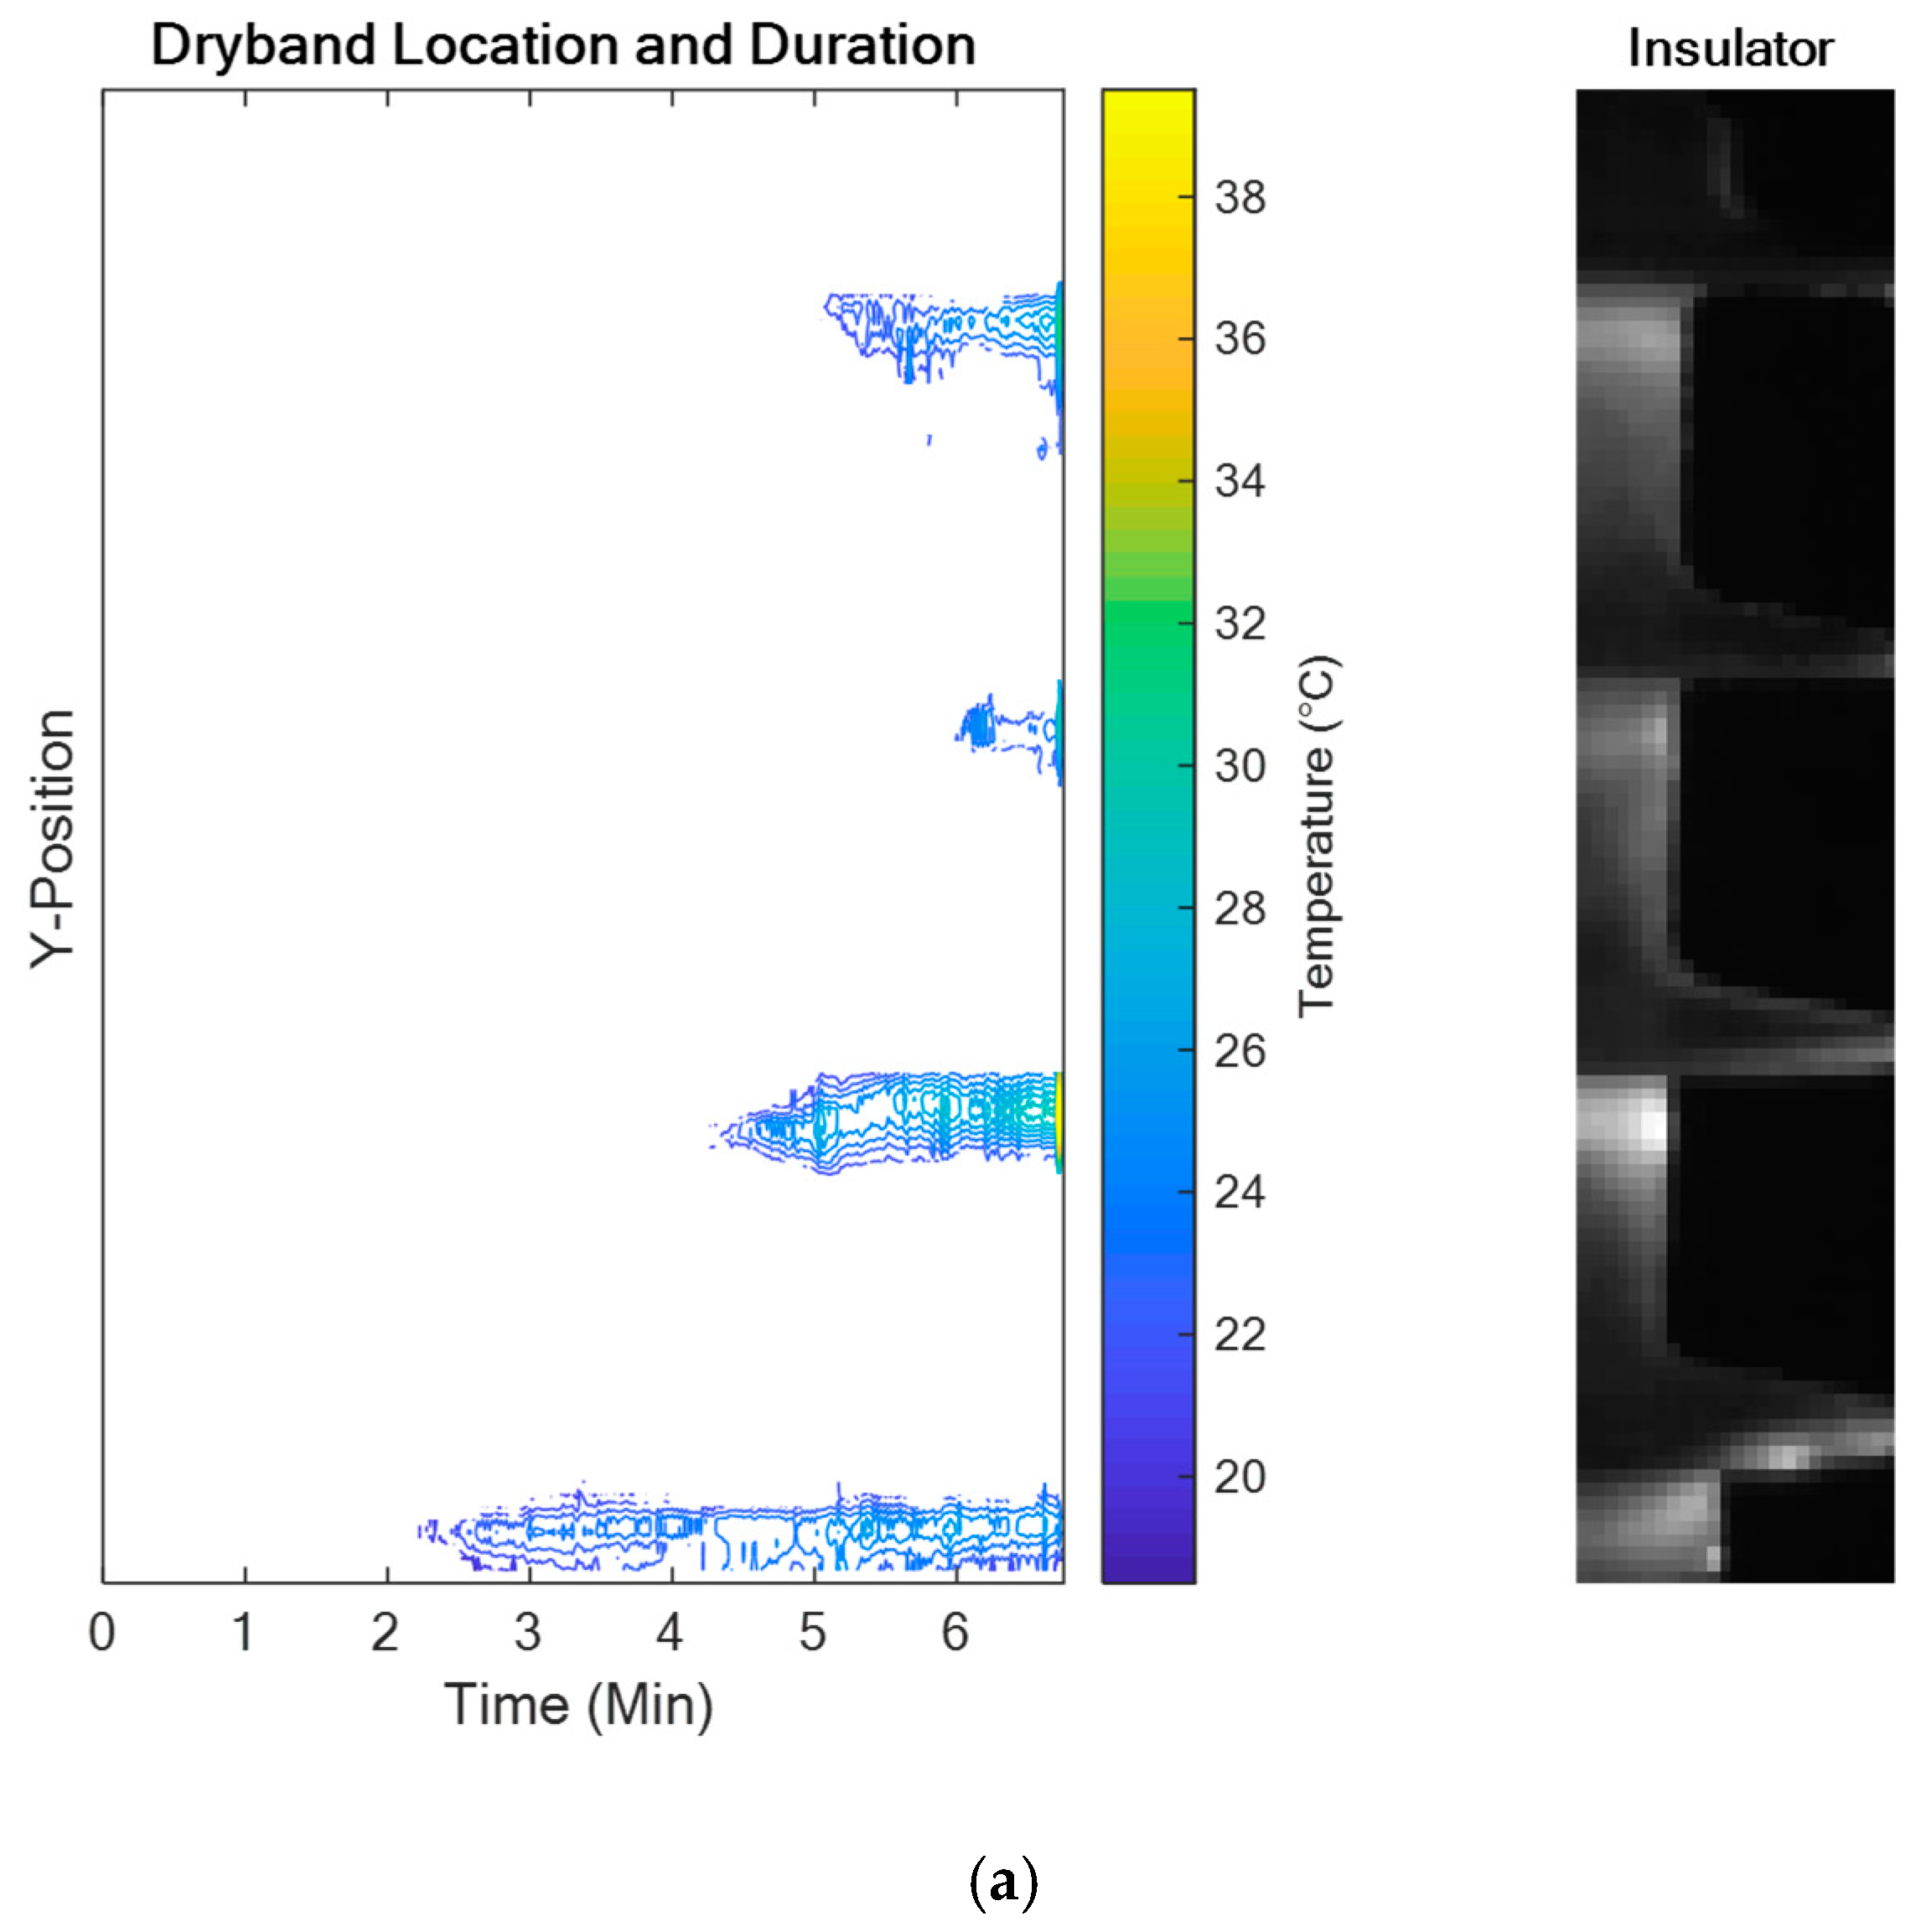
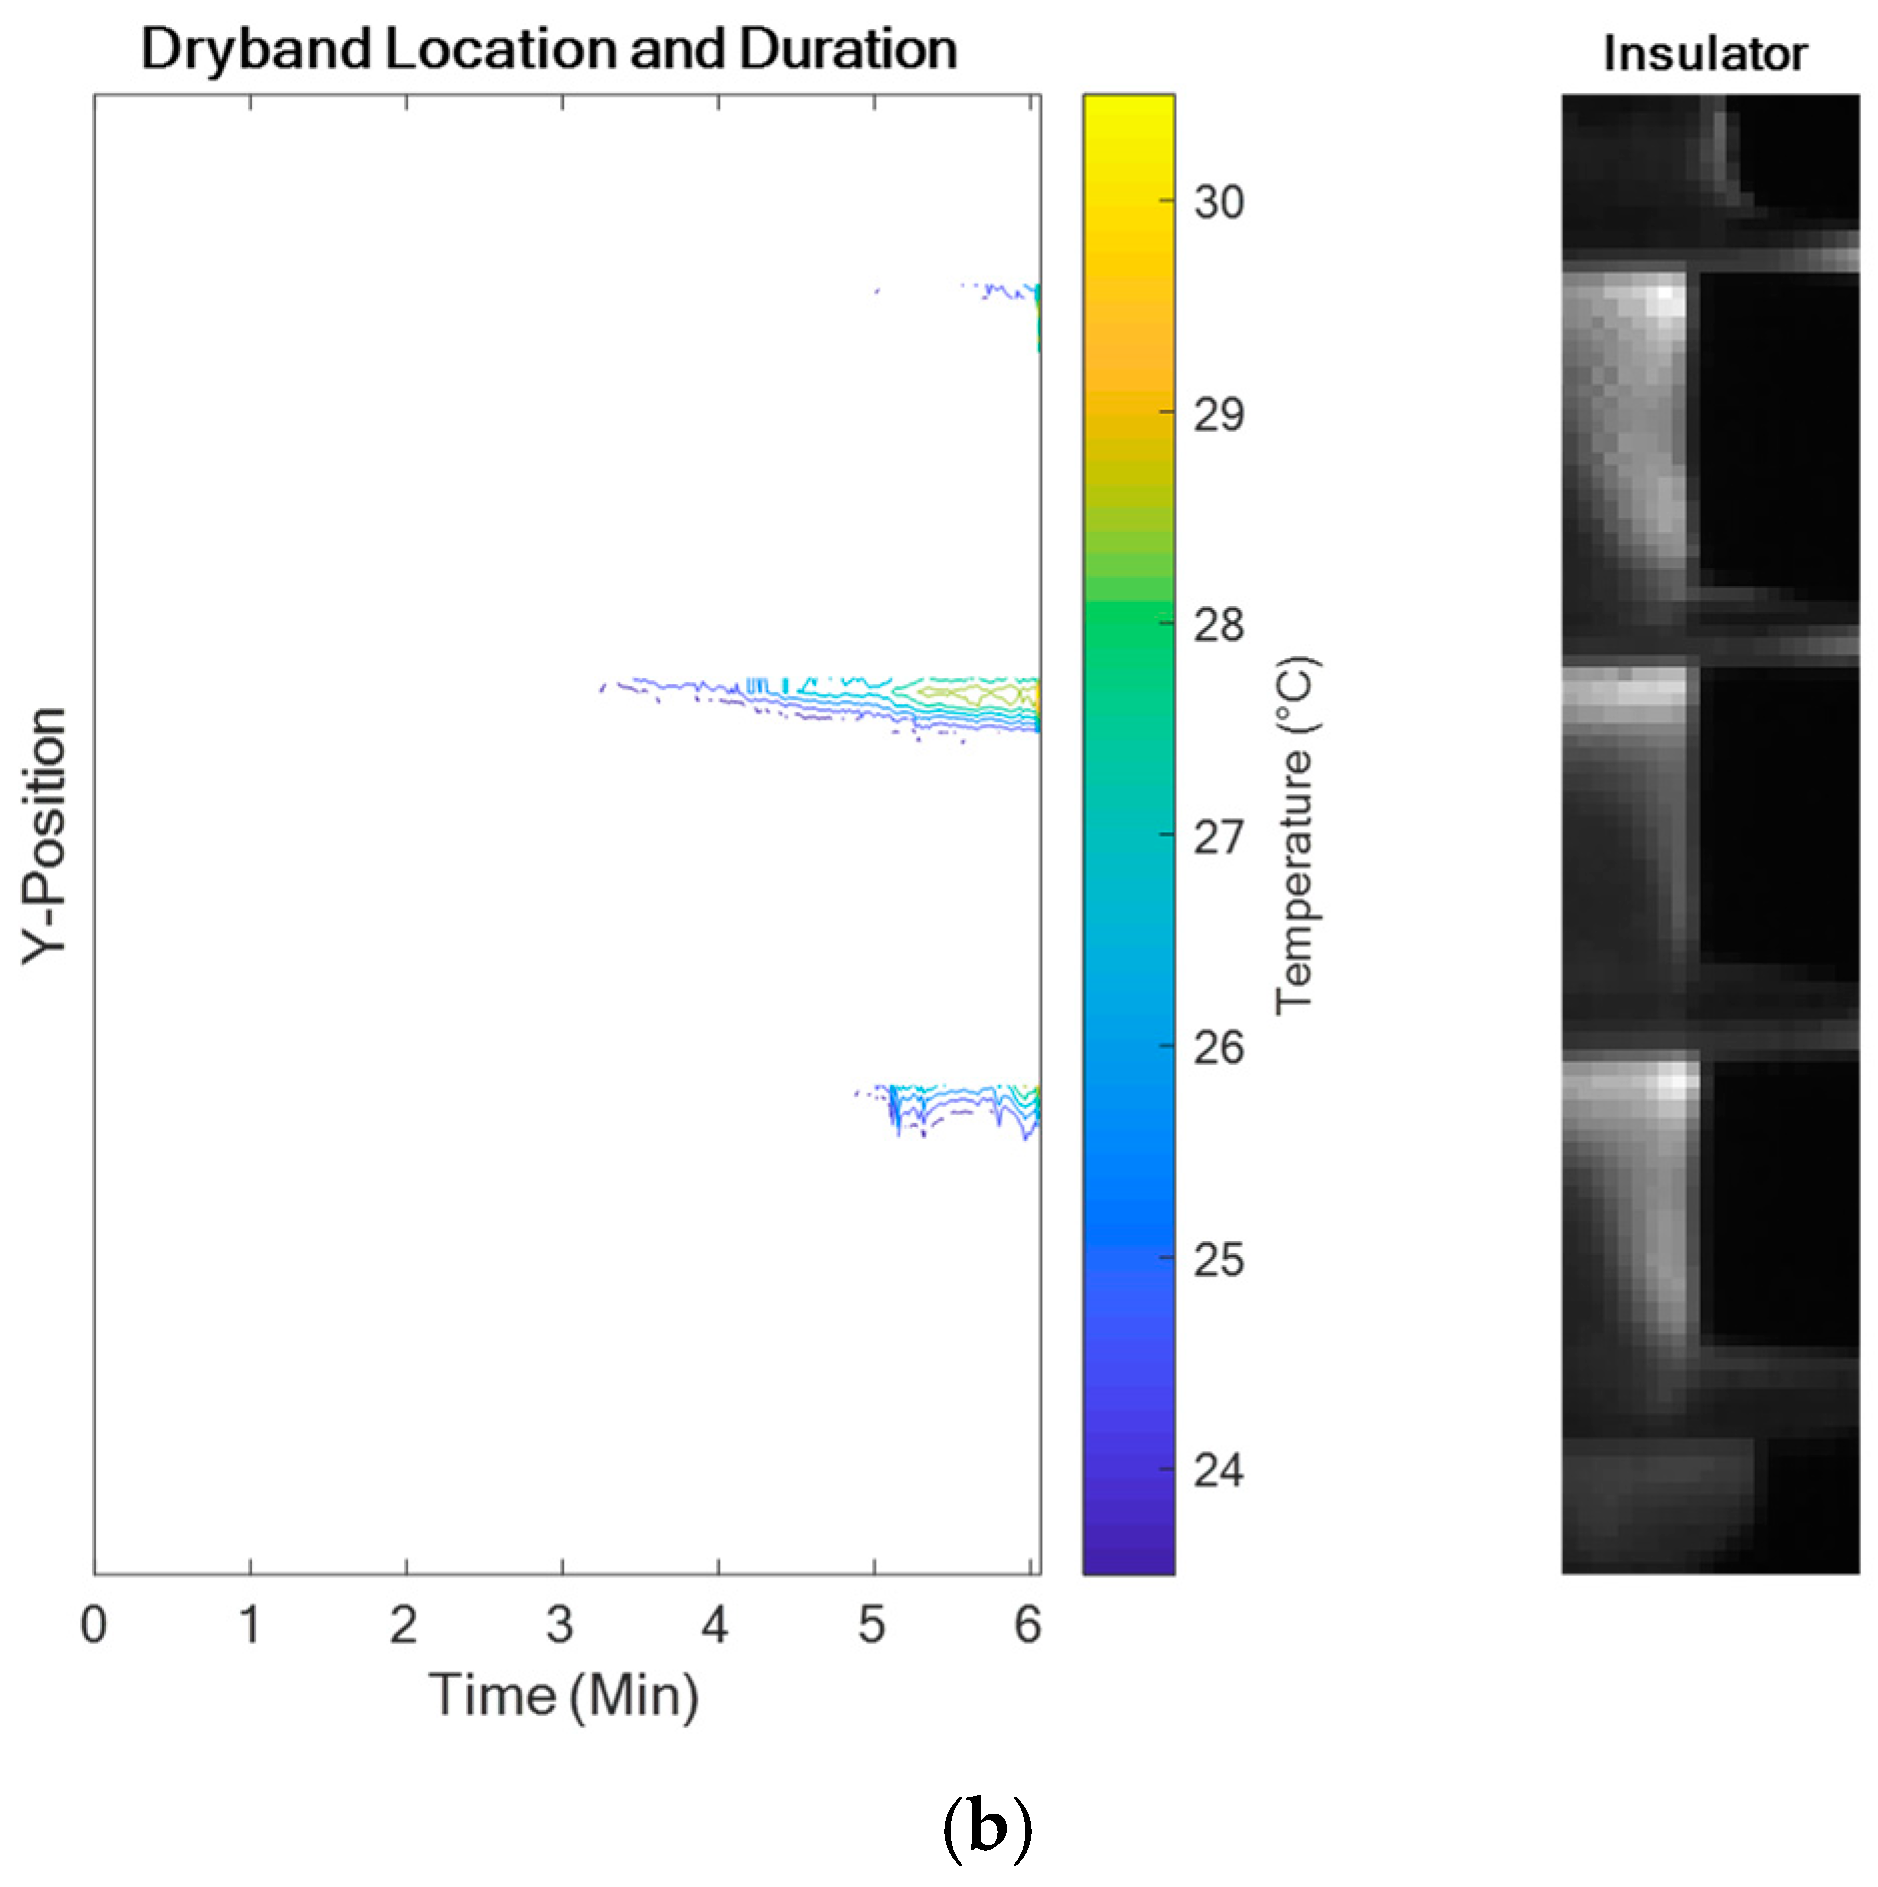
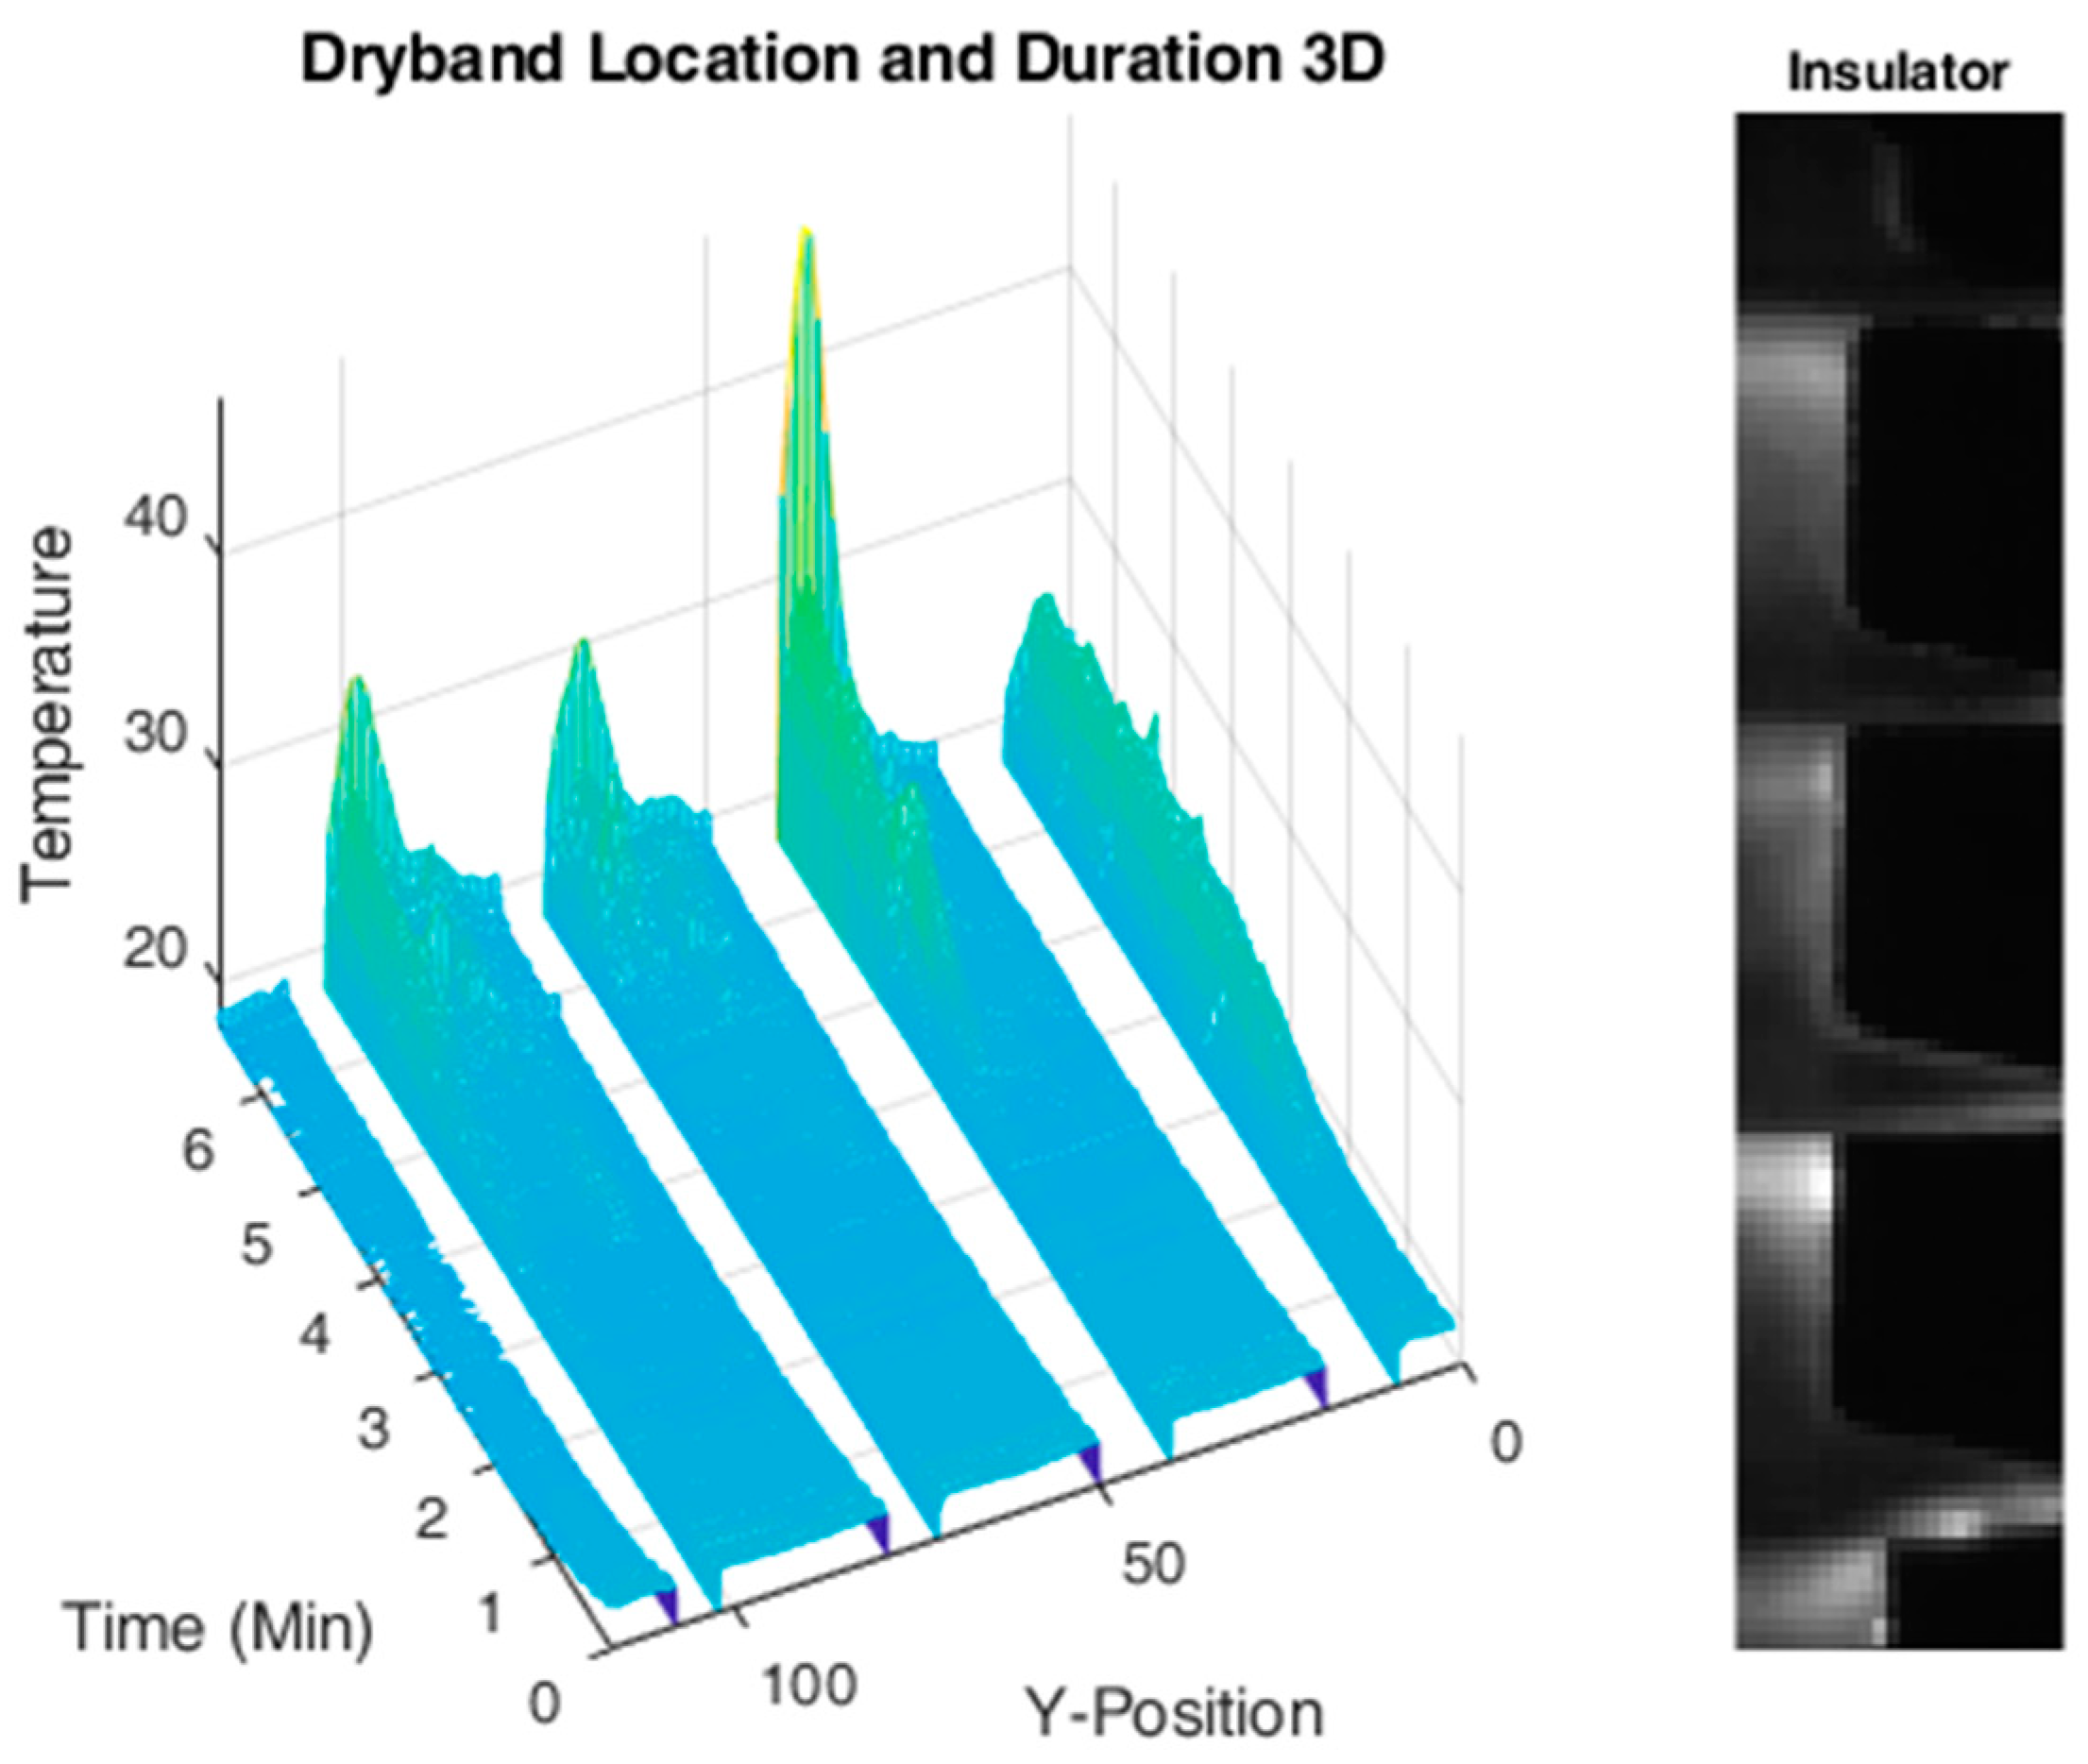
In order to gain a deeper understanding of the growth of each dry band, the calculated dry-band location and duration were plotted on a single graph taking advantage of the contour facility introducing time as the x-axis value, the vertical position as the y-axis value and the temperature of the dry band as the colour level. In addition, the last frame of the IR image is automatically cropped according to the identified boundaries and rescaled along the vertical axis of symmetry, facilitating the user to localize the dry band on the insulator. The resulting plot is shown in Figure 9. This graph offers a valuable overview of the full test since each dry-band width is presented as function of time and as its dry-band temperature range. The graph allows the comparison of the dry-band temperature distributions for a specific design very readily. The individual dry-band extension function of time and the dry-band temperature range for the conventional design (Figure 9a) and textured TT4 insulator (Figure 9b) are also presented.
4. Discussion
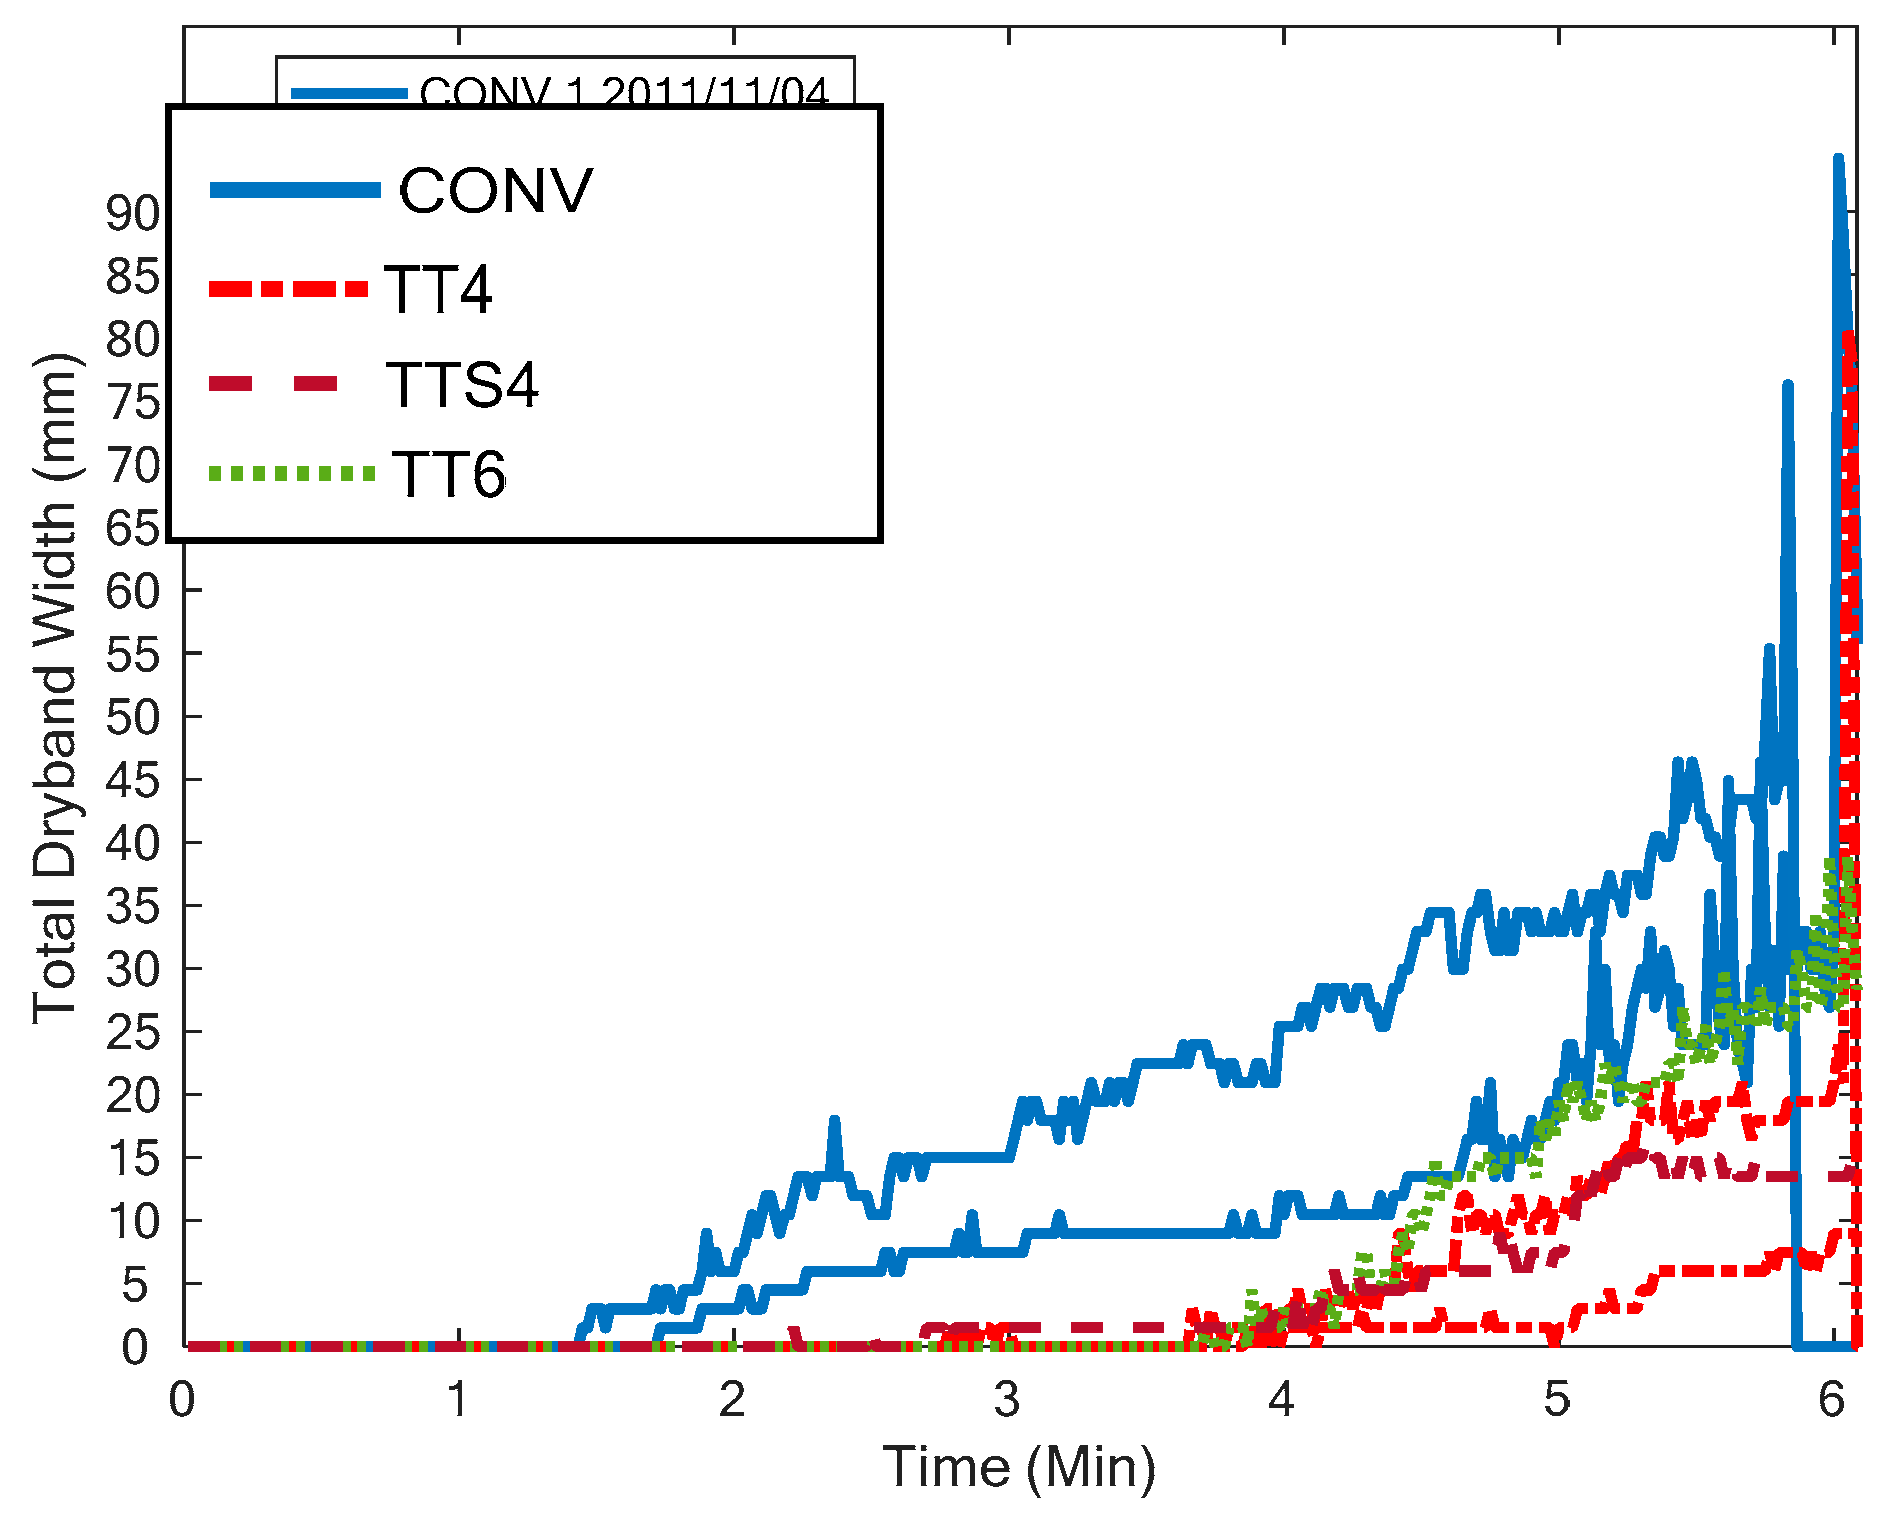
In order to estimate the effect of the design on the dry band dimensions, the total dry-band extension of the selected designs for a given ESDD and fog spray rate were plotted on the same graph, as shown in Figure 10. The graph shows a selection of calculated dry band extensions for all four insulator designs with an applied pollutant on the surface equal to ESDD 0.64 mg/cm2, and a fog spray rate equal to 3 L/h. It is clear that the conventional design exhibits dry-band formation much earlier than textured insulators. As early as after 1 min, the conventional (CONV) samples start to develop dry bands which continue to extend with increasing applied voltage. This trend is significantly delayed on textured (TT) samples, where the total dry-band length starts to be significant only after 4 min. The curves before flashover shows different trends. In fact, the dry-band dimensions on the TT6 design increases sharply, whereas for TT4 and TTS4 a delayed increase and a lower maximum width is observed before the flashover event. If the analysis was limited to only flashover voltage levels, the test results would not have highlighted any other details such as the clearly visible differences in this graph [10]. This suggests that the new procedure can offer a valuable tool to analyse and compare insulator performance under pollution.
5. Conclusions
The paper presented a novel procedure to assess the formation, and to identify the location, of dry bands based on the automatic identification of selected areas and the calculation of the associated average temperature. In particular, the division of sub zones and left and right areas increase the detection capabilities from the IR recordings.
The proposed methodology has been applied on artificially polluted insulator surfaces under a ramp-shape voltage test in clean-fog chamber and the results of the analysis show that the two features are clearly a function of the insulator surface design and the pollution level applied to the insulator surface (ESDD). The automatic identification of the insulator boundaries allows an accurate estimation of the average local temperature, disregarding any area related to the surrounding environment. In addition, the choice of selected area on the trunks permits to take into account the presence of the sheds that can perturb the wetting action of the fog. The evaluation of local average temperature on symmetrical areas along the vertical axis permits to confirm the correct uniform application of a pollution layer and to warn about possible localized defects on the surface.
Pollution level is one of the most important parameters in insulator design selection. Any increased discharge activity caused by pollution on a specific insulator design affects the life expectancy, which is a key parameter that network operators have to asses in the adoption of a new design. Since one of the major causes of degradation is caused by continuous discharges on the polymeric insulator surfaces, this proposed new procedure based on the analysis of IR video recordings and on the spatial and time characterization of dry bands may provide an indication of the selection of the most appropriate surface design to maximize insulator-life extension.
The results show it is possible to estimate the location, extension and development-over-time of dry bands, and these features offer good indications to select the appropriate design for dry-band control.
Author Contributions
Conceptualization, M.A. and A.M.H.; writing—original draft preparation, M.A.; writing—review and editing, M.A. and A.M.H.; visualization, N.B.
Funding
This research received no external funding.
Conflicts of Interest
The authors declare no conflict of interest.
Appendix A
Appendix A shows an example of ramp test performed on insulator design CONV, with applied pollution of ESDD 0.42 mg/cm2 and a fog rate 3 L/hr. Figure A1 and Figure A2 shows the average temperature of the main trunk and top and lower trunk areas during the whole test respectively. Figure A3 shows the total dry-band length computed for the same selected test. Figure A4 shows the dry-band development on each trunk as a maximum temperature profile on a 3D plot versus time and vertical axis position.
Figure A1.
Average temperature of the main trunk areas during the whole test (left and right zones). Design CONV, ESDD = 0.42 mg/cm2, and a fog rate of 3 L/hr.
Figure A1.
Average temperature of the main trunk areas during the whole test (left and right zones). Design CONV, ESDD = 0.42 mg/cm2, and a fog rate of 3 L/hr.

Figure A2.
Average temperature of top and lower trunk areas during the whole test (left and right zones). Design CONV, ESDD = 0.42 mg/cm2, and a fog rate of 3 L/hr.
Figure A2.
Average temperature of top and lower trunk areas during the whole test (left and right zones). Design CONV, ESDD = 0.42 mg/cm2, and a fog rate of 3 L/hr.

Figure A3.
Total dry-band length. Ramp-test: Design CONV, ESDD = 0.42 mg/cm2, and a fog rate of 3 L/hr.
Figure A3.
Total dry-band length. Ramp-test: Design CONV, ESDD = 0.42 mg/cm2, and a fog rate of 3 L/hr.

Figure A4.
3D representation of dry-band development on each trunk. Ramp-test: Design CONV, ESDD = 0.42 mg/cm2, and a fog rate of 3 L/hr.
Figure A4.
3D representation of dry-band development on each trunk. Ramp-test: Design CONV, ESDD = 0.42 mg/cm2, and a fog rate of 3 L/hr.

References
- Gorur, R.S.; Cherney, E.A.; Hackam, R.; Orbeck, T. The Electrical Performance of Polymeric Insulating Materials Under Accelerated Aging in a Fog Chamber. IEEE Trans. Power Deliv. 1988, 3, 1157–1163. [Google Scholar] [CrossRef]
- Moreno, V.M.; Gorur, R.S. Effect of long-term corona on non-ceramic outdoor insulator housing materials. IEEE Trans. Dielectr. Electr. Insul. 2001, 8, 117–128. [Google Scholar] [CrossRef]
- Blackmore, P.; Birtwhistle, D. Urface discharges on polymeric insulator shed surfaces. IEEE Trans Dielectr. Electr. Insul. 1997, 4, 210–217. [Google Scholar] [CrossRef]
- Moreno, V.M.; Gorur, R.S. Impact of corona on the long-term performance of nonceramic insulators. IEEE Trans. Dielectr. Electr. Insul. 2003, 10, 80–95. [Google Scholar] [CrossRef]
- Meng, D.; Zhang, B.-Y.; Chen, J.; Lee, S.-C.; Jong-Yun Lim, J.-Y. Tracking and erosion properties evaluation of polymeric insulating materials. In Proceedings of the 2016 IEEE International Conference on High Voltage Engineering and Application (ICHVE), Chengdu, China, 19–22 September 2016; pp. 1–4. [Google Scholar]
- Vita, V.; Ekonomou, L.; Chatzarakis, G.E. Design of artificial neural network models for the estimation of distribution system voltage insulators’ contamination. In Proceedings of the 12th WSEAS International Conference on Mathematical Methods, Computational Techniques and Intelligent Systems (MAMECTIS ’10), Kantaoui, Sousse, Tunisia, 3–6 May 2010; pp. 227–231. [Google Scholar]
- Pappas, S.S.; Ekonomou, L.; Heraklion, Ν. Comparison of adaptive techniques for the prediction of the equivalent salt deposit density of medium voltage insulators. WSEAS Trans. Power Syst. 2017, 12, 220–224. [Google Scholar]
- Nekahi, A.; McMeekin, S.G.; Farzaneh, M. Influence of Dry Band Width and Location on Flashover Characteristics of Silicone Rubber Insulators. In Proceedings of the 2016 Electrical Insulation Conference (EIC), Montréal, QC, Canada, 19–22 June 2016. [Google Scholar]
- Nekahi, A.; McMeekin, S.G.; Farzaneh, M. Measurement of surface resistance of silicone rubber sheets under polluted and dry band conditions. Electr. Eng. 2017. [Google Scholar] [CrossRef]
- Dhahbi-Megriche, N.; Slama, M.E.A.; Beroual, A. Influence of dry bands on polluted insulator performance. In Proceedings of the 2017 International Conference on Engineering & MIS (ICEMIS), Monastir, Tunisia, 8–10 May 2017; pp. 1–4. [Google Scholar] [CrossRef]
- Arshad; Mughal, M.; Nekahi, A.; Khan, M.; Umer, F. Influence of Single and Multiple Dry Bands on Critical Flashover Voltage of Silicone Rubber Outdoor Insulators: Simulation and Experimental Study. Energies 2018, 11, 1335. [Google Scholar] [CrossRef]
- Albano, M.; Haddad, A.; Griffiths, H.; Waters, R.T. Dry-band characterisation using visual and IR data analysis. In Proceedings of the International Conference on High Voltage Engineering and Application—ICHVE2014, Poznan, Poland, 8–10 September 2014. [Google Scholar] [CrossRef]
- Albano, M.; Waters, R.T.; Charalampidis, P.; Griffiths, H.; Haddad, A. Infrared Analysis of Dry-band Flashover of Silicone Rubber Insulators. IEEE Trans. Dielectr. Electr. Insul. 2016, 23, 304–310. [Google Scholar] [CrossRef]
- Albano, M.; Haddad, A.; Bungay, N. Is the dry-band characteristic a function of pollution and insulator design? In Proceedings of the 2018 IEEE International Conference on High Voltage Engineering and Application (ICHVE), Athens, Greece, 10–13 September 2018; pp. 1–4. [Google Scholar] [CrossRef]
- Charalampidis, P.; Albano, M.; Griffiths, H.; Haddad, A.M.; Waters, R.T. Silicone Rubber Insulators for Polluted Environments Part 1: Enhanced Artificial Pollution Tests. IEEE Trans. Dielectr. Electr. Insul. 2014, 21, 740–748. [Google Scholar] [CrossRef]
- Albano, M.; Charalampidis, P.; Griffiths, H.; Haddad, A.M.; Waters, R.T. Silicone Rubber Insulators for Polluted Environments Part 2: Textured Insulators. IEEE Trans. Dielectr. Electr. Insul. 2014, 21, 749–757. [Google Scholar] [CrossRef]
Figure 1.
Schematic diagram of the measurement set-up used in the experiment [15].
Figure 1.
Schematic diagram of the measurement set-up used in the experiment [15].

Figure 2.
Visual frame before fog application (a), visual frame using long-exposure acquisition (b) and the IR frame (c) during the constant voltage test on sample TT4; equivalent salt deposit density (ESDD) was 0.64 mg/cm2 with a fog spray rate of 3 L/h.
Figure 2.
Visual frame before fog application (a), visual frame using long-exposure acquisition (b) and the IR frame (c) during the constant voltage test on sample TT4; equivalent salt deposit density (ESDD) was 0.64 mg/cm2 with a fog spray rate of 3 L/h.

Figure 3.
Temperature difference between the insulator surface and the surrounding fog.

Figure 4.
Schematic diagram of the procedure adopted.

Figure 5.
Automatic boundaries recognition and area selection applied to (a) a conventional and (b) a textured design.
Figure 5.
Automatic boundaries recognition and area selection applied to (a) a conventional and (b) a textured design.

Figure 6.
Average temperature of end-fitting areas during the whole test, on (a) conventional and (b) textured TT4 insulators.
Figure 6.
Average temperature of end-fitting areas during the whole test, on (a) conventional and (b) textured TT4 insulators.

Figure 7.
Average temperature of right and left trunk areas during the whole test.

Figure 8.
Cumulative dry-band extension on all the trunks. Ramp-test: Design CONV, ESDD = 0.64 mg/cm2, and a fog rate of 3 L/hr.
Figure 8.
Cumulative dry-band extension on all the trunks. Ramp-test: Design CONV, ESDD = 0.64 mg/cm2, and a fog rate of 3 L/hr.

Figure 9.
Dry-band extension as function of time and dry-band temperature range for the (a) conventional design and (b) textured TT4 insulator examples.
Figure 9.
Dry-band extension as function of time and dry-band temperature range for the (a) conventional design and (b) textured TT4 insulator examples.


Figure 10.
Comparison of the dry-band extension on all the trunks for the five designs, with ESDD = 0.64 mg/cm2, and a fog spray rate of 3 L/h.
Figure 10.
Comparison of the dry-band extension on all the trunks for the five designs, with ESDD = 0.64 mg/cm2, and a fog spray rate of 3 L/h.


Table 1.
Insulator designs.
| Design | Creepage Length (mm) | Dimple Size Radius (mm) | Under Shed Profile (mm) | Axial Length (mm) | Trunk Diameter (mm) |
|---|---|---|---|---|---|
| CONV | 375 | 0 | 0 | 175 | 28 |
| TT4 | 471 | 4 | 0 | 175 | 28 |
| TTS4 | 503 | 4 | 4 | 175 | 28 |
| TT6 | 471 | 6 | 0 | 175 | 28 |
| TTS6 | 503 | 6 | 6 | 175 | 28 |
© 2019 by the authors. Licensee MDPI, Basel, Switzerland. This article is an open access article distributed under the terms and conditions of the Creative Commons Attribution (CC BY) license (http://creativecommons.org/licenses/by/4.0/).
Share and Cite
MDPI and ACS Style
Albano, M.; Haddad, A.M.; Bungay, N. Is the Dry-Band Characteristic a Function of Pollution and Insulator Design? Energies 2019, 12, 3607. https://doi.org/10.3390/en12193607
AMA Style
Albano M, Haddad AM, Bungay N. Is the Dry-Band Characteristic a Function of Pollution and Insulator Design? Energies. 2019; 12(19):3607. https://doi.org/10.3390/en12193607
Chicago/Turabian StyleAlbano, Maurizio, A. Manu Haddad, and Nathan Bungay. 2019. "Is the Dry-Band Characteristic a Function of Pollution and Insulator Design?" Energies 12, no. 19: 3607. https://doi.org/10.3390/en12193607
Note that from the first issue of 2016, this journal uses article numbers instead of page numbers. See further details here.