Optimization of Greenhouse Thermal Screens for Maximized Energy Conservation


1
Department of Agricultural Engineering, Kyungpook National University, Daegu 702-701, Korea
2
Institute of Agricultural Science & Technology, Kyungpook National University, Daegu 702-701, Korea
3
Department of Horticulture Environment System, Korea National College of Agriculture and Fisheries, 1515, Kongjwipatjwi-ro, Deokjin-gu, Jeonju-si, Jeollabuk-do 54874, Korea
4
Department of Bio-Industrial Machinery Engineering, Gyeongsang National University, (Institute of Agricultural and Life Sciences), Jinju 660-701, Korea
5
Smart Agriculture Innovation Center, Kyungpook National University, Daegu 41566, Korea
*
Author to whom correspondence should be addressed.
Energies 2019, 12(19), 3592; https://doi.org/10.3390/en12193592
Submission received: 13 August 2019
/
Revised: 6 September 2019
/
Accepted: 15 September 2019
/
Published: 20 September 2019
(This article belongs to the Section G: Energy and Buildings)
Abstract
:In this work, we proposed a Building Energy Simulation (BES) dynamic climatic model of greenhouses by utilizing Transient System Simulation (TRNSYS 18) software to study the effect of use of different thermal screen materials and control strategies of thermal screens on heat energy requirement of greenhouses. Thermal properties of the most common greenhouse thermal screens were measured and used in the BES model. Nash-Sutcliffe efficiency coefficients of 0.84 and 0.78 showed good agreement between the computed and experimental results, thus the proposed model appears to be appropriate for performing greenhouse thermal simulations. The proposed model was used to evaluate the effects of different thermal screens including; Polyester, Luxous, Tempa, and Multi-layers, as well as to evaluate control strategies of greenhouse thermal screens, subjected to Daegu city, (latitude 35.53° N, longitude 128.36° E) South Korea winter season weather conditions. Obtained results show that the heating requirement of greenhouses with multi-layer night thermal screens was 20%, 5.4%, and 13.5%, less than the Polyester, Luxous, and Tempa screens respectively. Thus, our experiments confirm that the use of multi-layered thermal screen can reduce greenhouse heat energy requirement. Furthermore, screen-control with outside solar radiation at an optimum setpoint of 60 W·m−2 significantly influences the greenhouse’s energy conservation capacity, as it exhibited 699.5 MJ·m−2, the least energy demand of all strategies tested. Moreover, the proposed model allows dynamic simulation of greenhouse systems and enables researchers and farmers to evaluate different screens and screen control strategies that suit their investment capabilities and local weather conditions.
1. Introduction
Different heating systems are typically used during winter to achieve the desired greenhouse micro-climate. Use of such systems leads to significant increase in greenhouse energy consumption [1]. Currently, Various technologies, particularly renewable energy, are being utilized globally to fulfill energy requirements in buildings in general, including in the agriculture sector. Beside applying appropriate heating systems, energy saving measures requires careful consideration [2]. In greenhouse farming, energy saving is one of the most significant challenges, as heating costs have increased to more than 40% of the total production cost [3]. Among the passive heating modes, use of thermal screens is the most influential means to reduce heating requirement. Improving energy performance of the buildings can positivity effect the energy consumption [4,5]. The use of thermal insulation in the building helps to achieve the high energy performance [6]. Night thermal screens are widely used inside the greenhouses during winter season in order to save energy by reducing the heat loss to the ambient environment. While there are different kinds of thermal screens available in the market, unfortunately, farmers and researchers have very little information about the performance of the thermal screens [7].
Previous studies have attempted to estimate performance of the thermal screens by using a variety of different methods. Ghosal and Tiwari [2] and Shukla et al. [8] developed mathematical models to study the greenhouse thermal environment by using thermal curtains and earth-to-air heat exchanger. As part of the study, researchers divided the greenhouse into sections and calculated the temperature above and below the thermal curtain. This study was conducted to check the feasibility of the earth-to-air heat exchanger without analyzing the greenhouse thermal screen qualitative effect. The studies [9,10,11,12] experimentally measured the internal temperature of the greenhouses with and without thermal screen to calculate energy saving potential of the screen used. Taki et al. [13] modeled different greenhouse shapes with thermal screen and calculated the temperature inside the greenhouse and energy consumption. Kim et al. [14] calculated overall heat transfer coefficient (U-value) of the greenhouse with and without night thermal screen. The screens’ performance was assessed by measuring heat energy utilized to maintained desired temperature at night, which was further used to calculate the U-value of the thermal screen. The studies [1,15,16,17] calculated the U-values of the different thermal screens by using experimental hotbox. The discussed literature showed valuable information about thermal screens, but these studies did the experimental work which was site specific and limited to the use of one specific screen. One report [7] detailed the measuring method of greenhouse screens’ properties, which were further used in a KASPRO model to calculate the total energy saving of different screens. The results of this study were under specific controlled and pre-defined weather conditions.
TRNSYS stands for “Transient System Simulation program”. It is a versatile component-based program that provides tools to simulate both simple and complex energy flows in buildings [18]. It was developed by University of Wisconsin’s Solar Energy Lab and has been commercially available since in 1975 for the simulation of thermal systems, but has since undergone continuous development to become a hybrid simulator by including photovoltaic, thermal solar, and other energy systems [19]. This program is being used in many applications including energy building simulation, energy system research, technology assessment, solar thermal process, solar applications, geothermal heat pumps systems, ground-coupled heat transfer, air flow modeling, system calibration, wind and photovoltaic (PV) systems, hydrogen fuel cell, and power plants [20].
For this specific study, we used TRNSYS, which is widely used for calculating energy load and energy system performance of commercial and residential buildings. In agricultural greenhouses, software demonstrates very high flexibility to improve various case studies to continue work for structure and energy analysis of greenhouse systems [21]. It has been used in many studies for greenhouse energy management and to analyze different energy systems for greenhouses. In one of our previous studies [22] we presented a detailed literature review of TRNSYS software used for greenhouse modeling. The summary of this research shows that the use of building energy simulation (BES) program TRNSYS for agricultural greenhouses is continuously increasing. The study divided the researchers work into the following four categories: solar heating, use of geothermal energy, closed greenhouse concept, and energy management of different structural and environmental parameters. After reviewing all the previous literature, the modeling thermal screens were found to be lacking. Thermal properties of commonly used screens also could not correctly model the influence of these screens on greenhouse thermal environment and energy savings.
The main objective of this study is to propose a more accurate, convenient, and reliable greenhouse BES model by utilizing TRNSYS 18 software. Furthermore, this study considers the effect of thermal screens on greenhouse dynamic micro-environment in winter season. The total energy savings of selected screens are calculated and compared to a greenhouse without thermal screen. In addition, different greenhouse screen opening-closing control strategies are examined, to find an optimal screen controlling strategy from the energy conservation point of view. This study will provide an opportunity for growers and researchers to analyze the energy saving potential of different thermal screens under their local weather conditions.
2. Materials and Methods
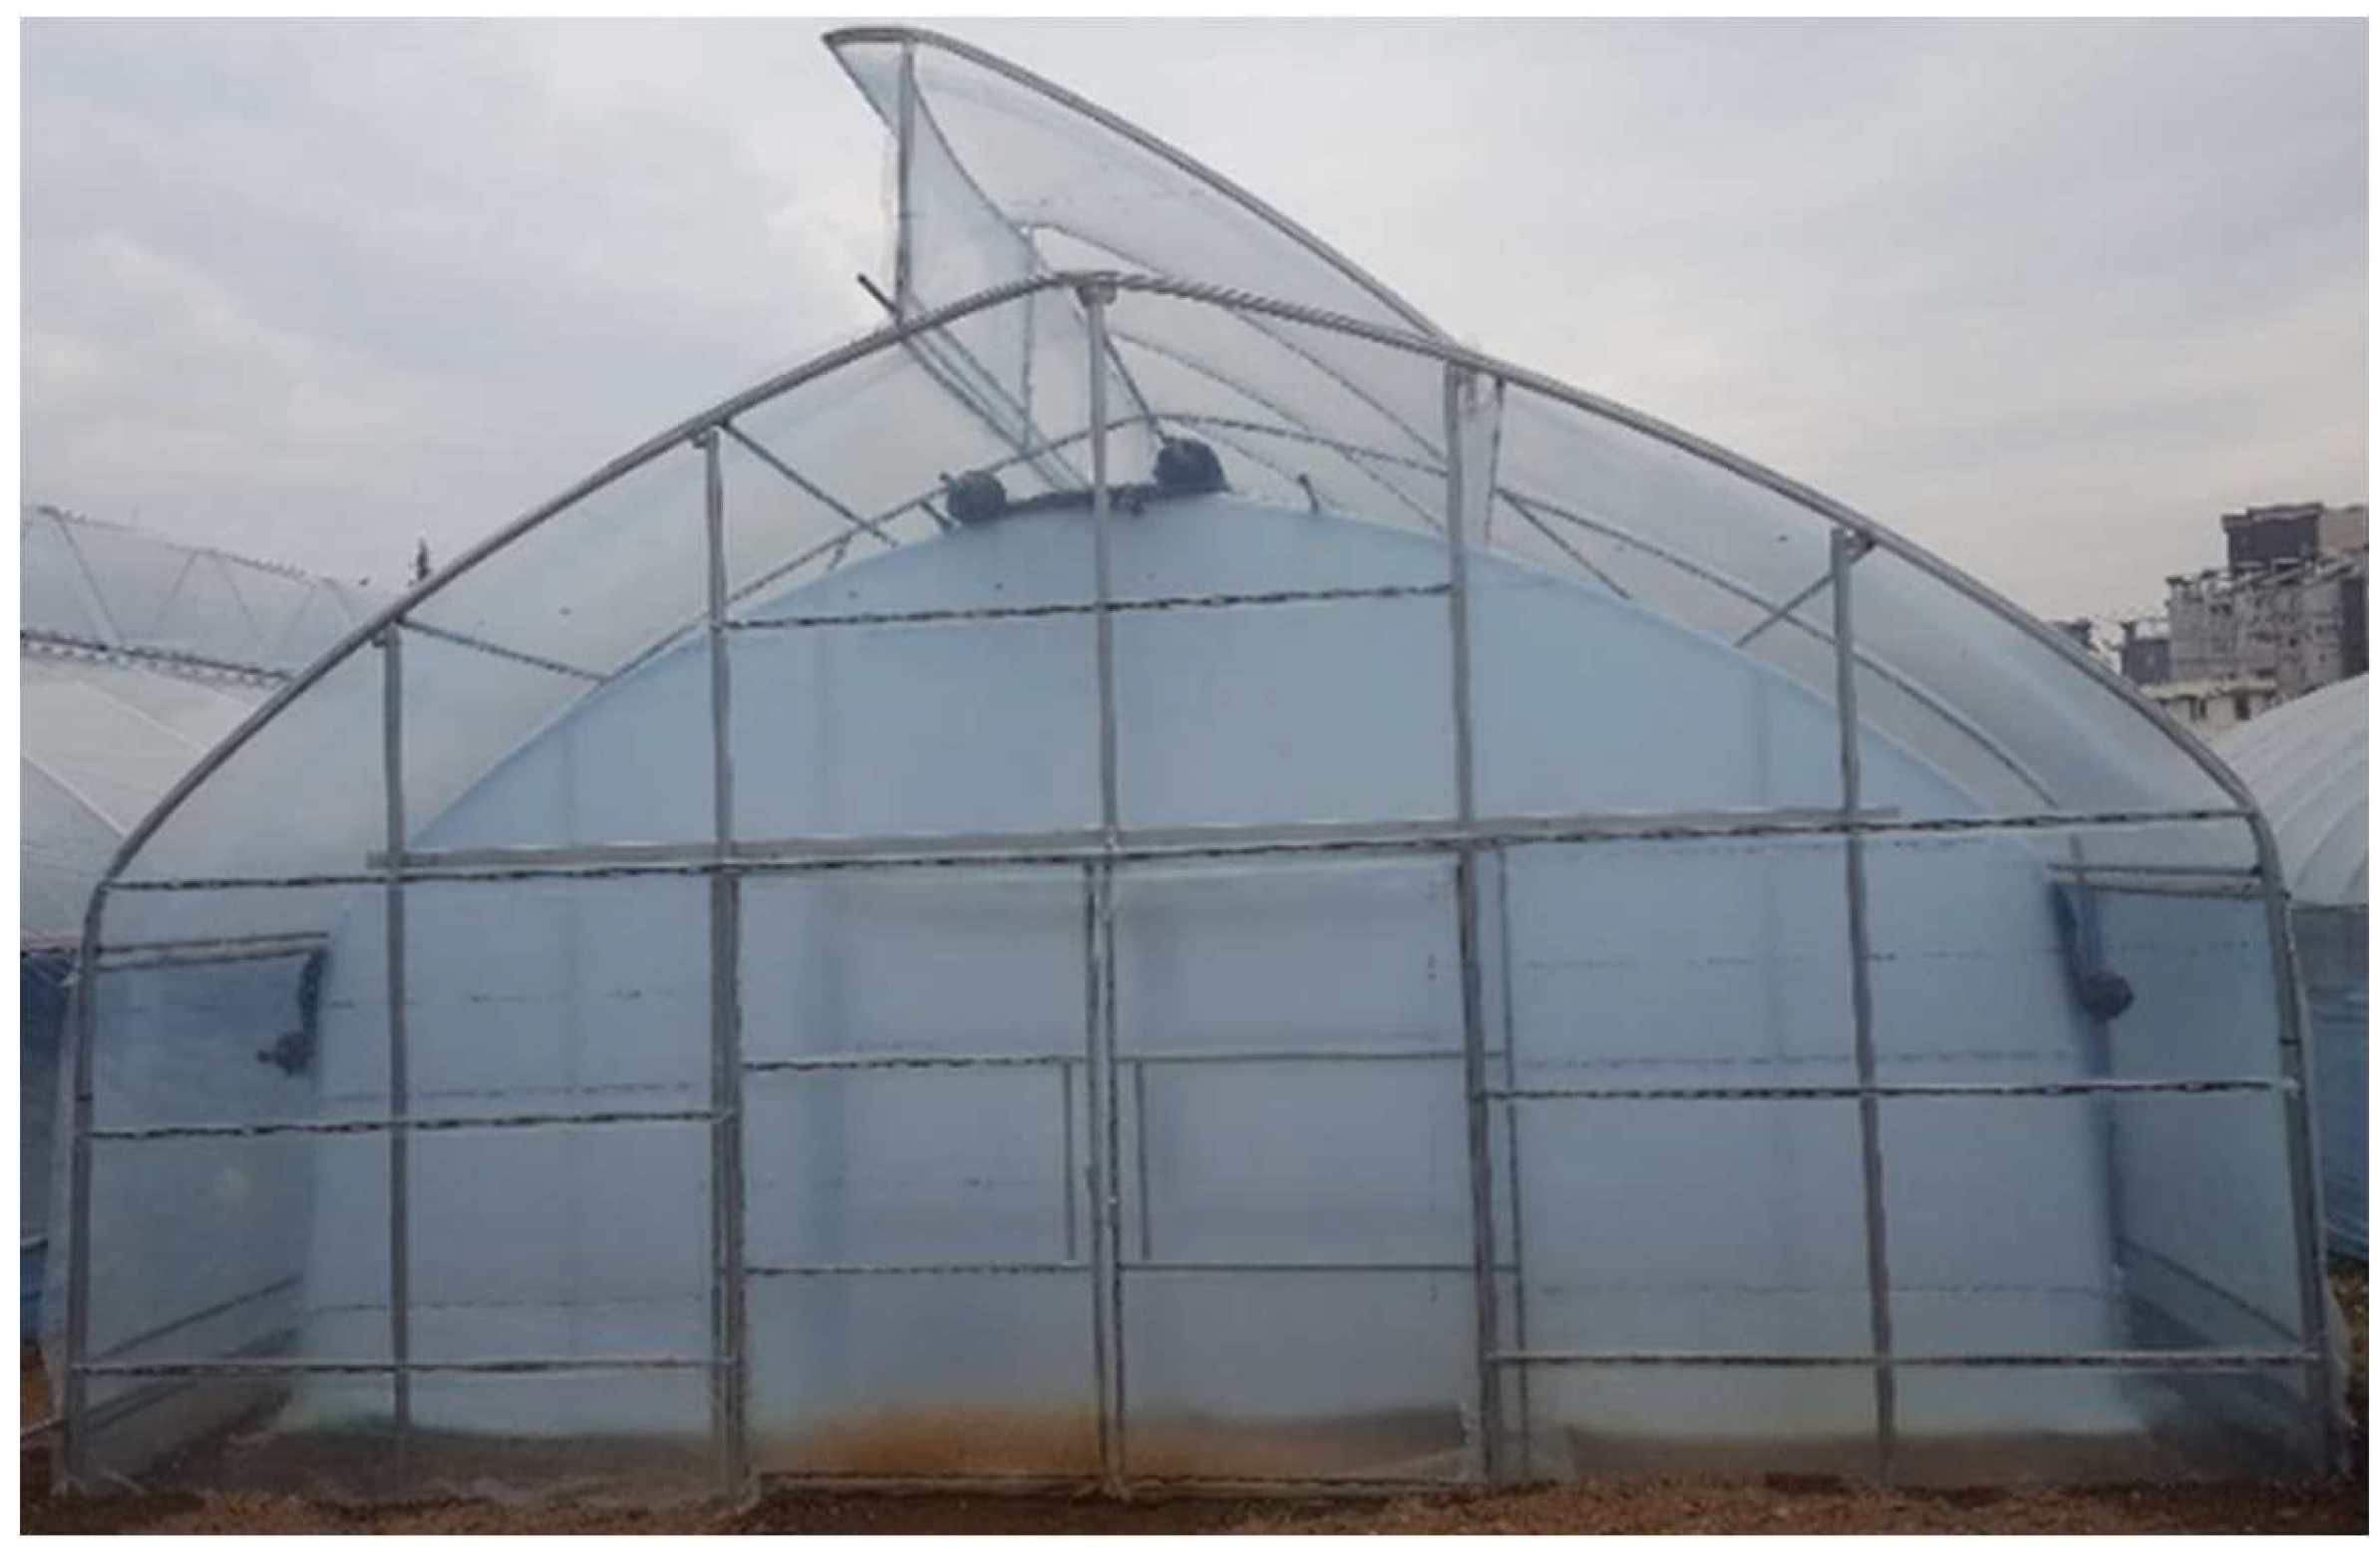
2.1. Experimental Greenhouse
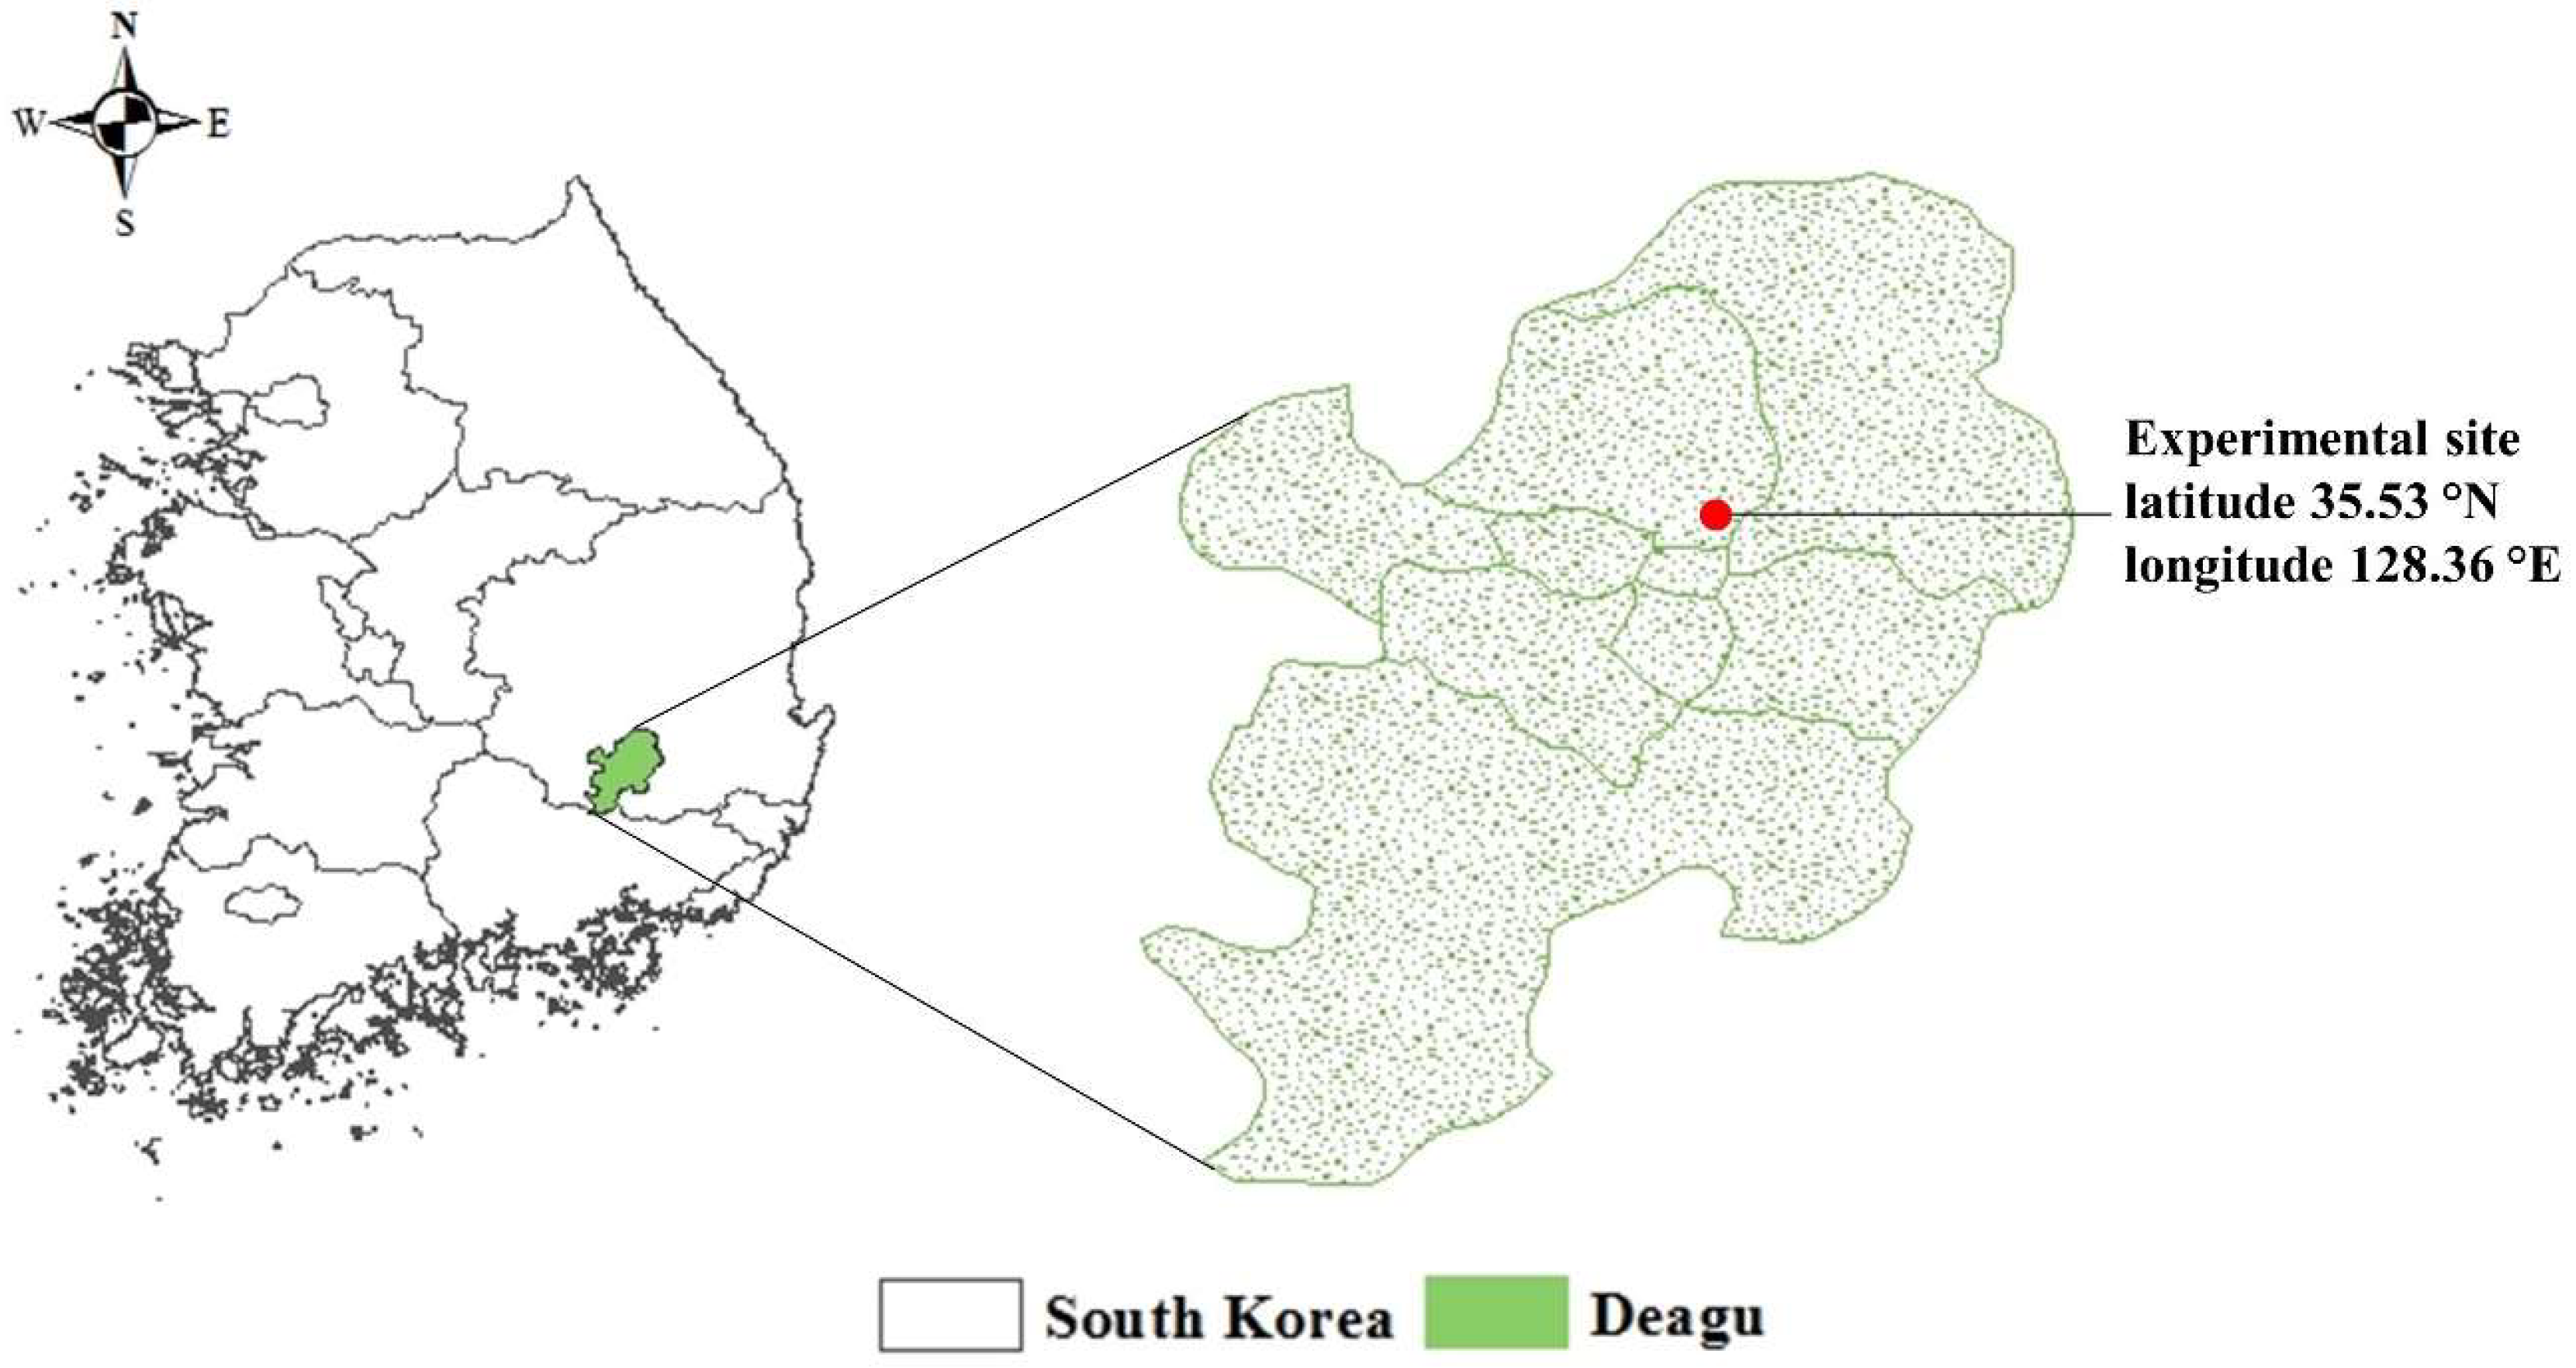
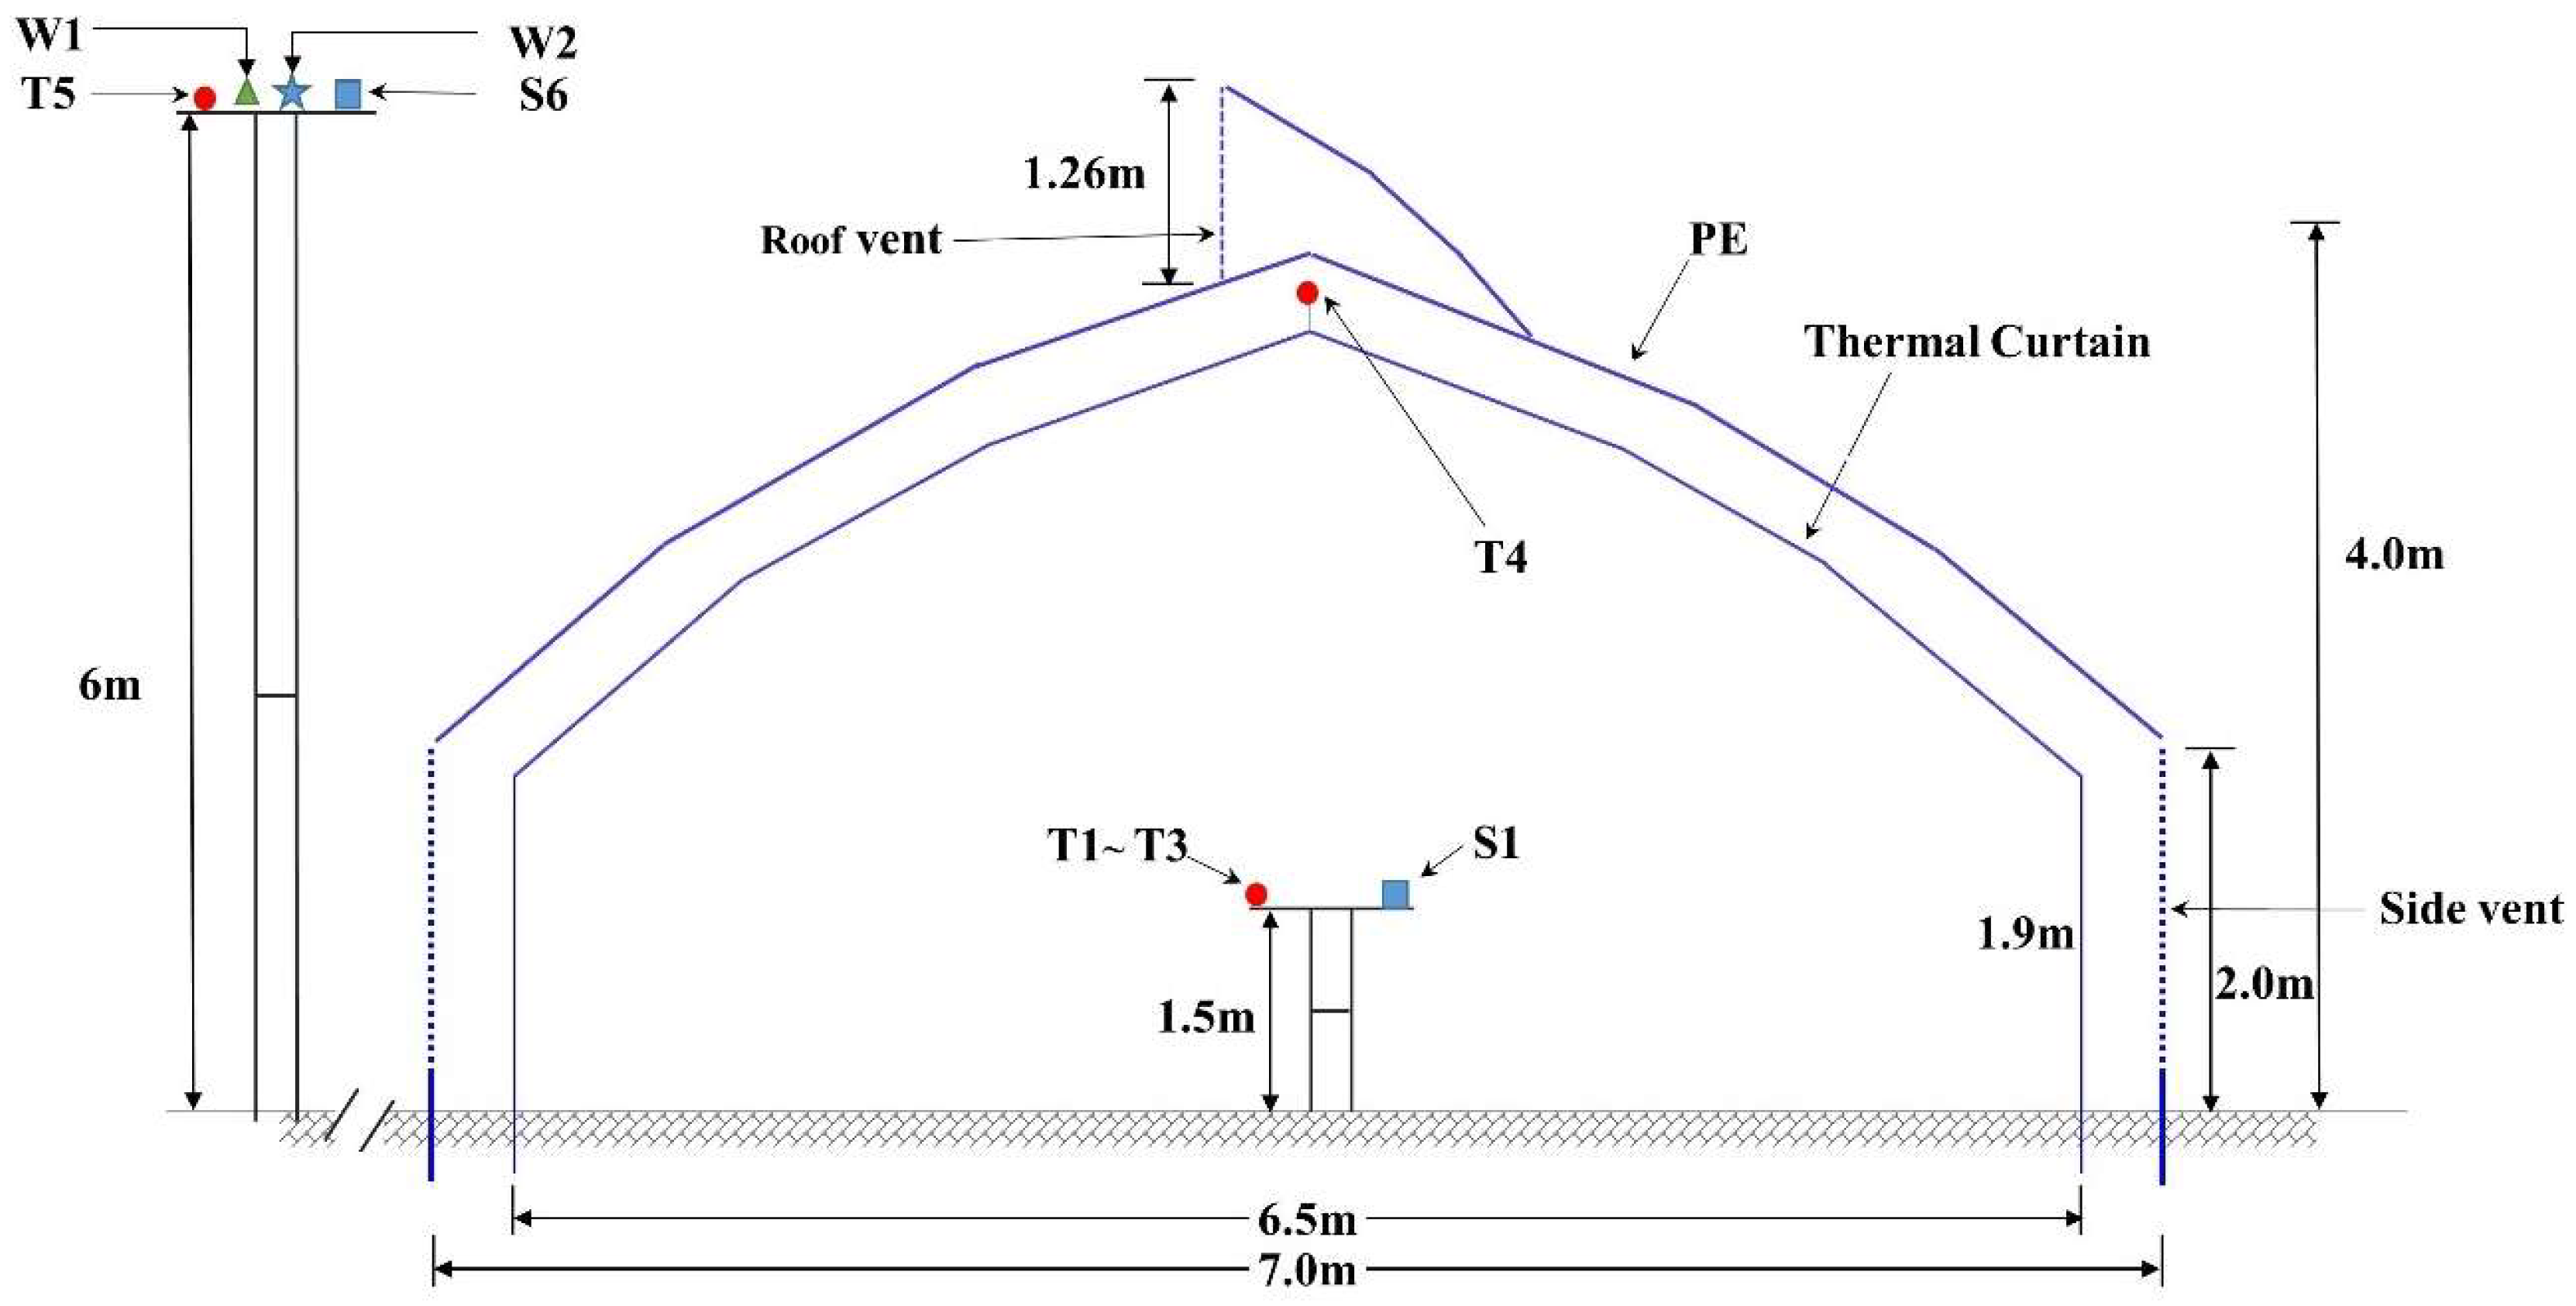
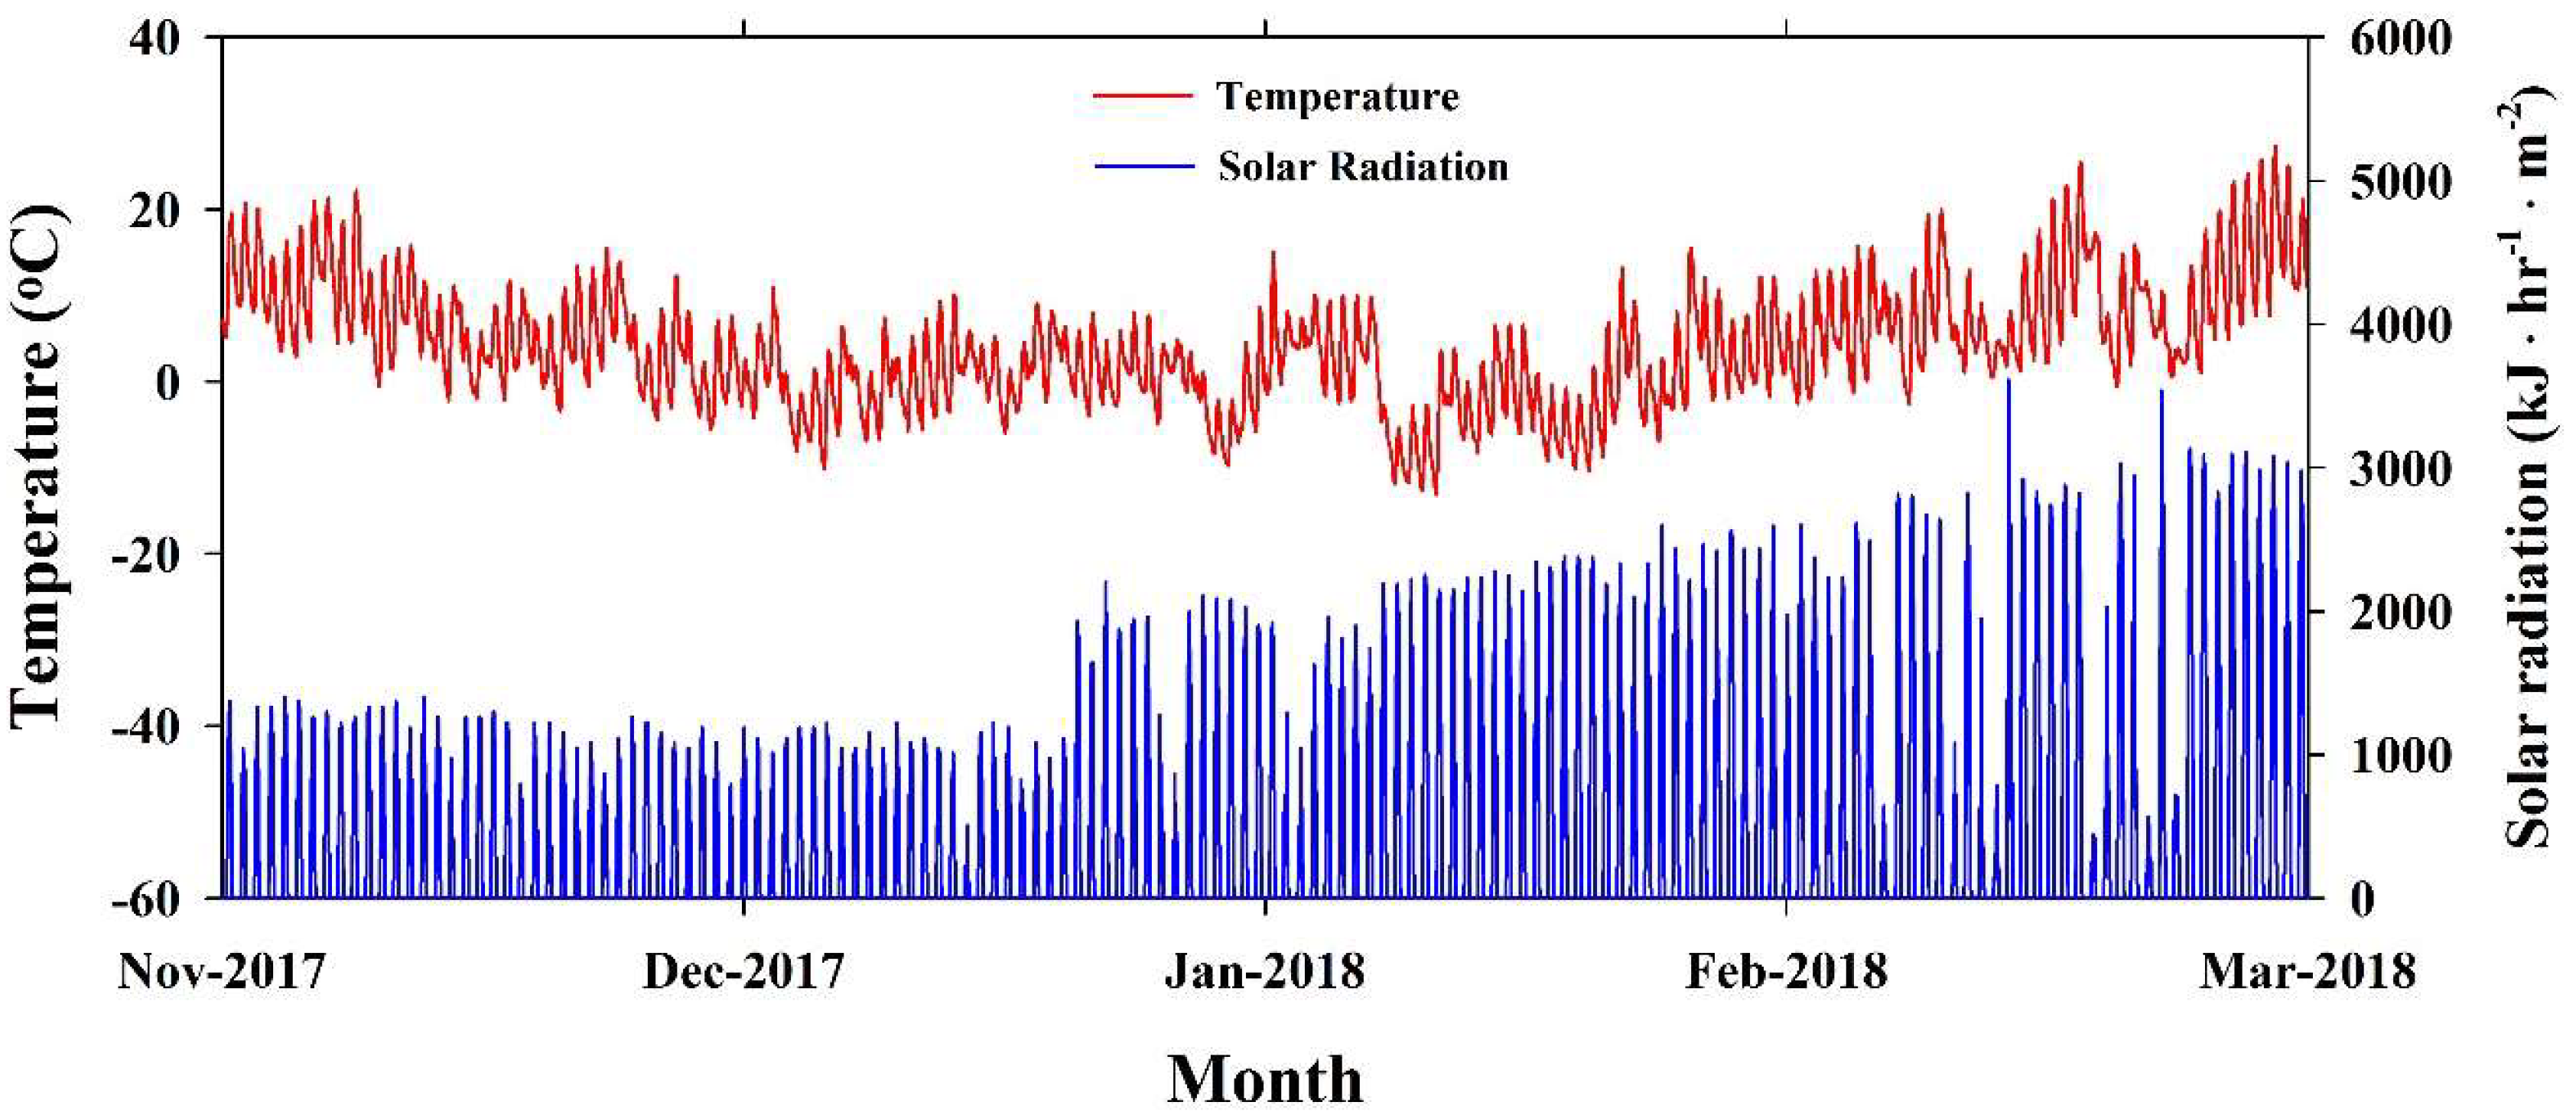
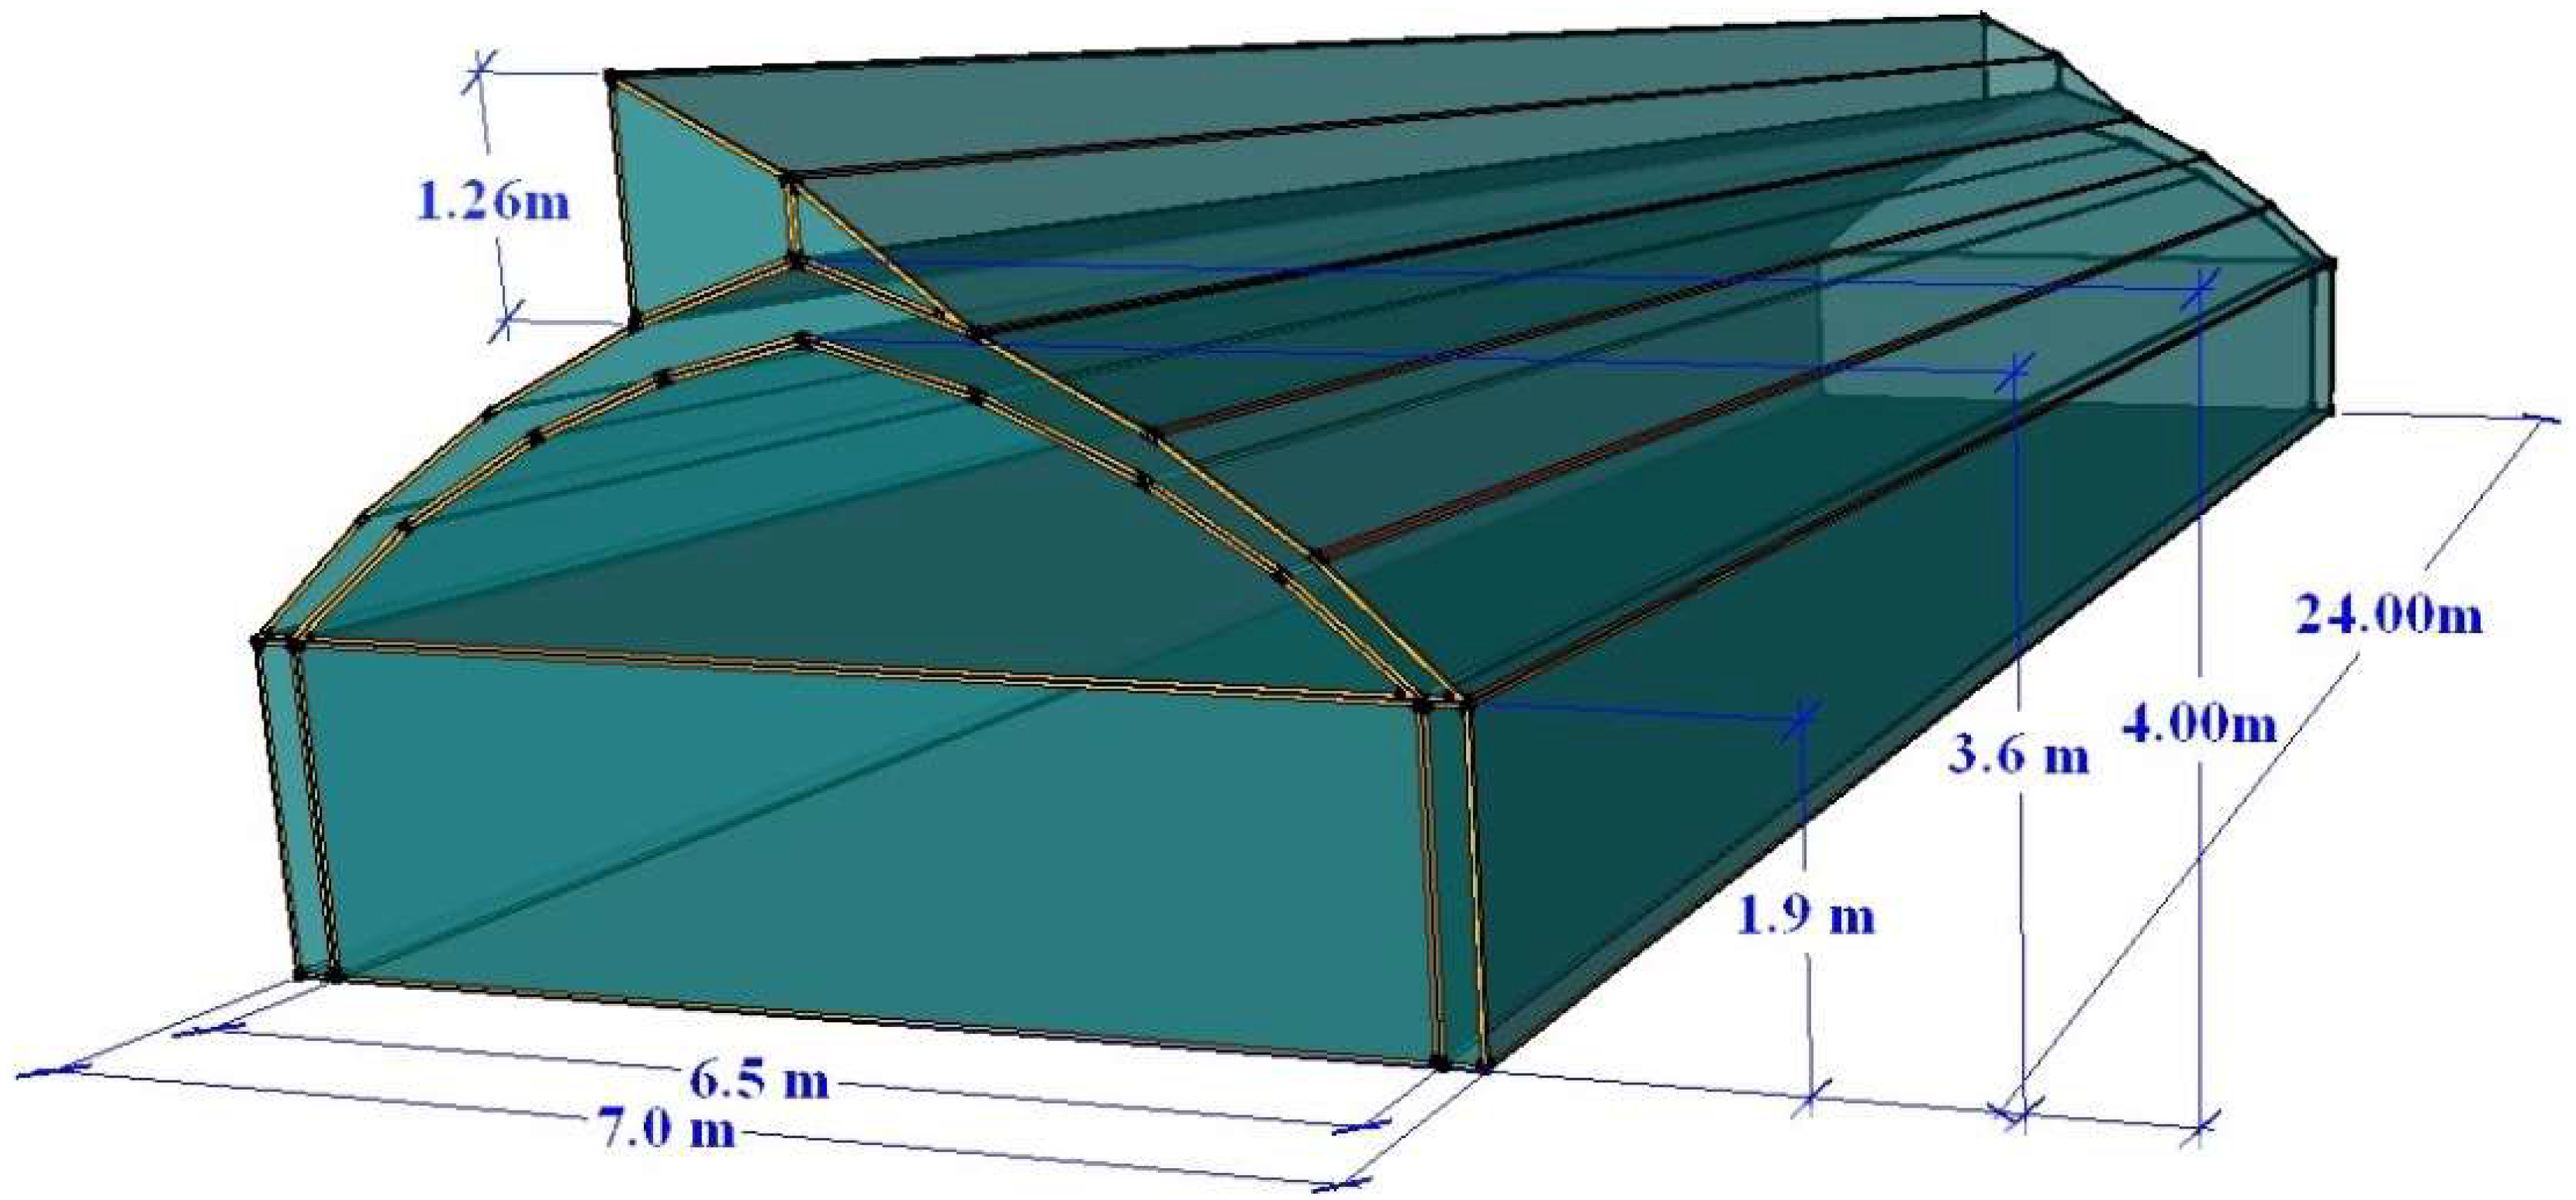
The experimental greenhouse was located in Daegu (latitude 35.53° N, longitude 128.36° E, elevation 48 m), South Korea. The geographic location of the site is shown in Figure 1. The experimental greenhouse had a single-span, gambrel type roof structure. It was covered with double-layered polyethylene (PE) material and single-layered thermal screen, as shown in Figure 2. The dimensions of the greenhouse were 24 m × 7 m × 4 m, with a total volume and floor area of 553.1 m3 and 168 m2, respectively; these specifications are shown in Figure 3. Necessary information and data from the site were collected to use as input data in the building energy simulation (BES) model. Weather data was recorded for one winter season between November 2017 and March 2018; monitored variables are presented in Table 1. The temperature inside the greenhouse was measured at different locations along the central line below and above the thermal screens. These measured temperatures were used for comparison with the BES results for validation. During the experimental period, no crops were grown inside the greenhouse. The weather parameters, air temperature, solar radiation, relative outdoor humidity, air pressure, wind speed, and wind direction, were monitored by several mounted sensors outside the greenhouse. In addition, ambient pressure data was obtained from the Korean Meteorological Administration (KMA). The hourly mean ambient temperature and solar radiation for the period of November 2017 to March 2018 is shown in Figure 4.
2.2. Thermal Conductivity Measurement
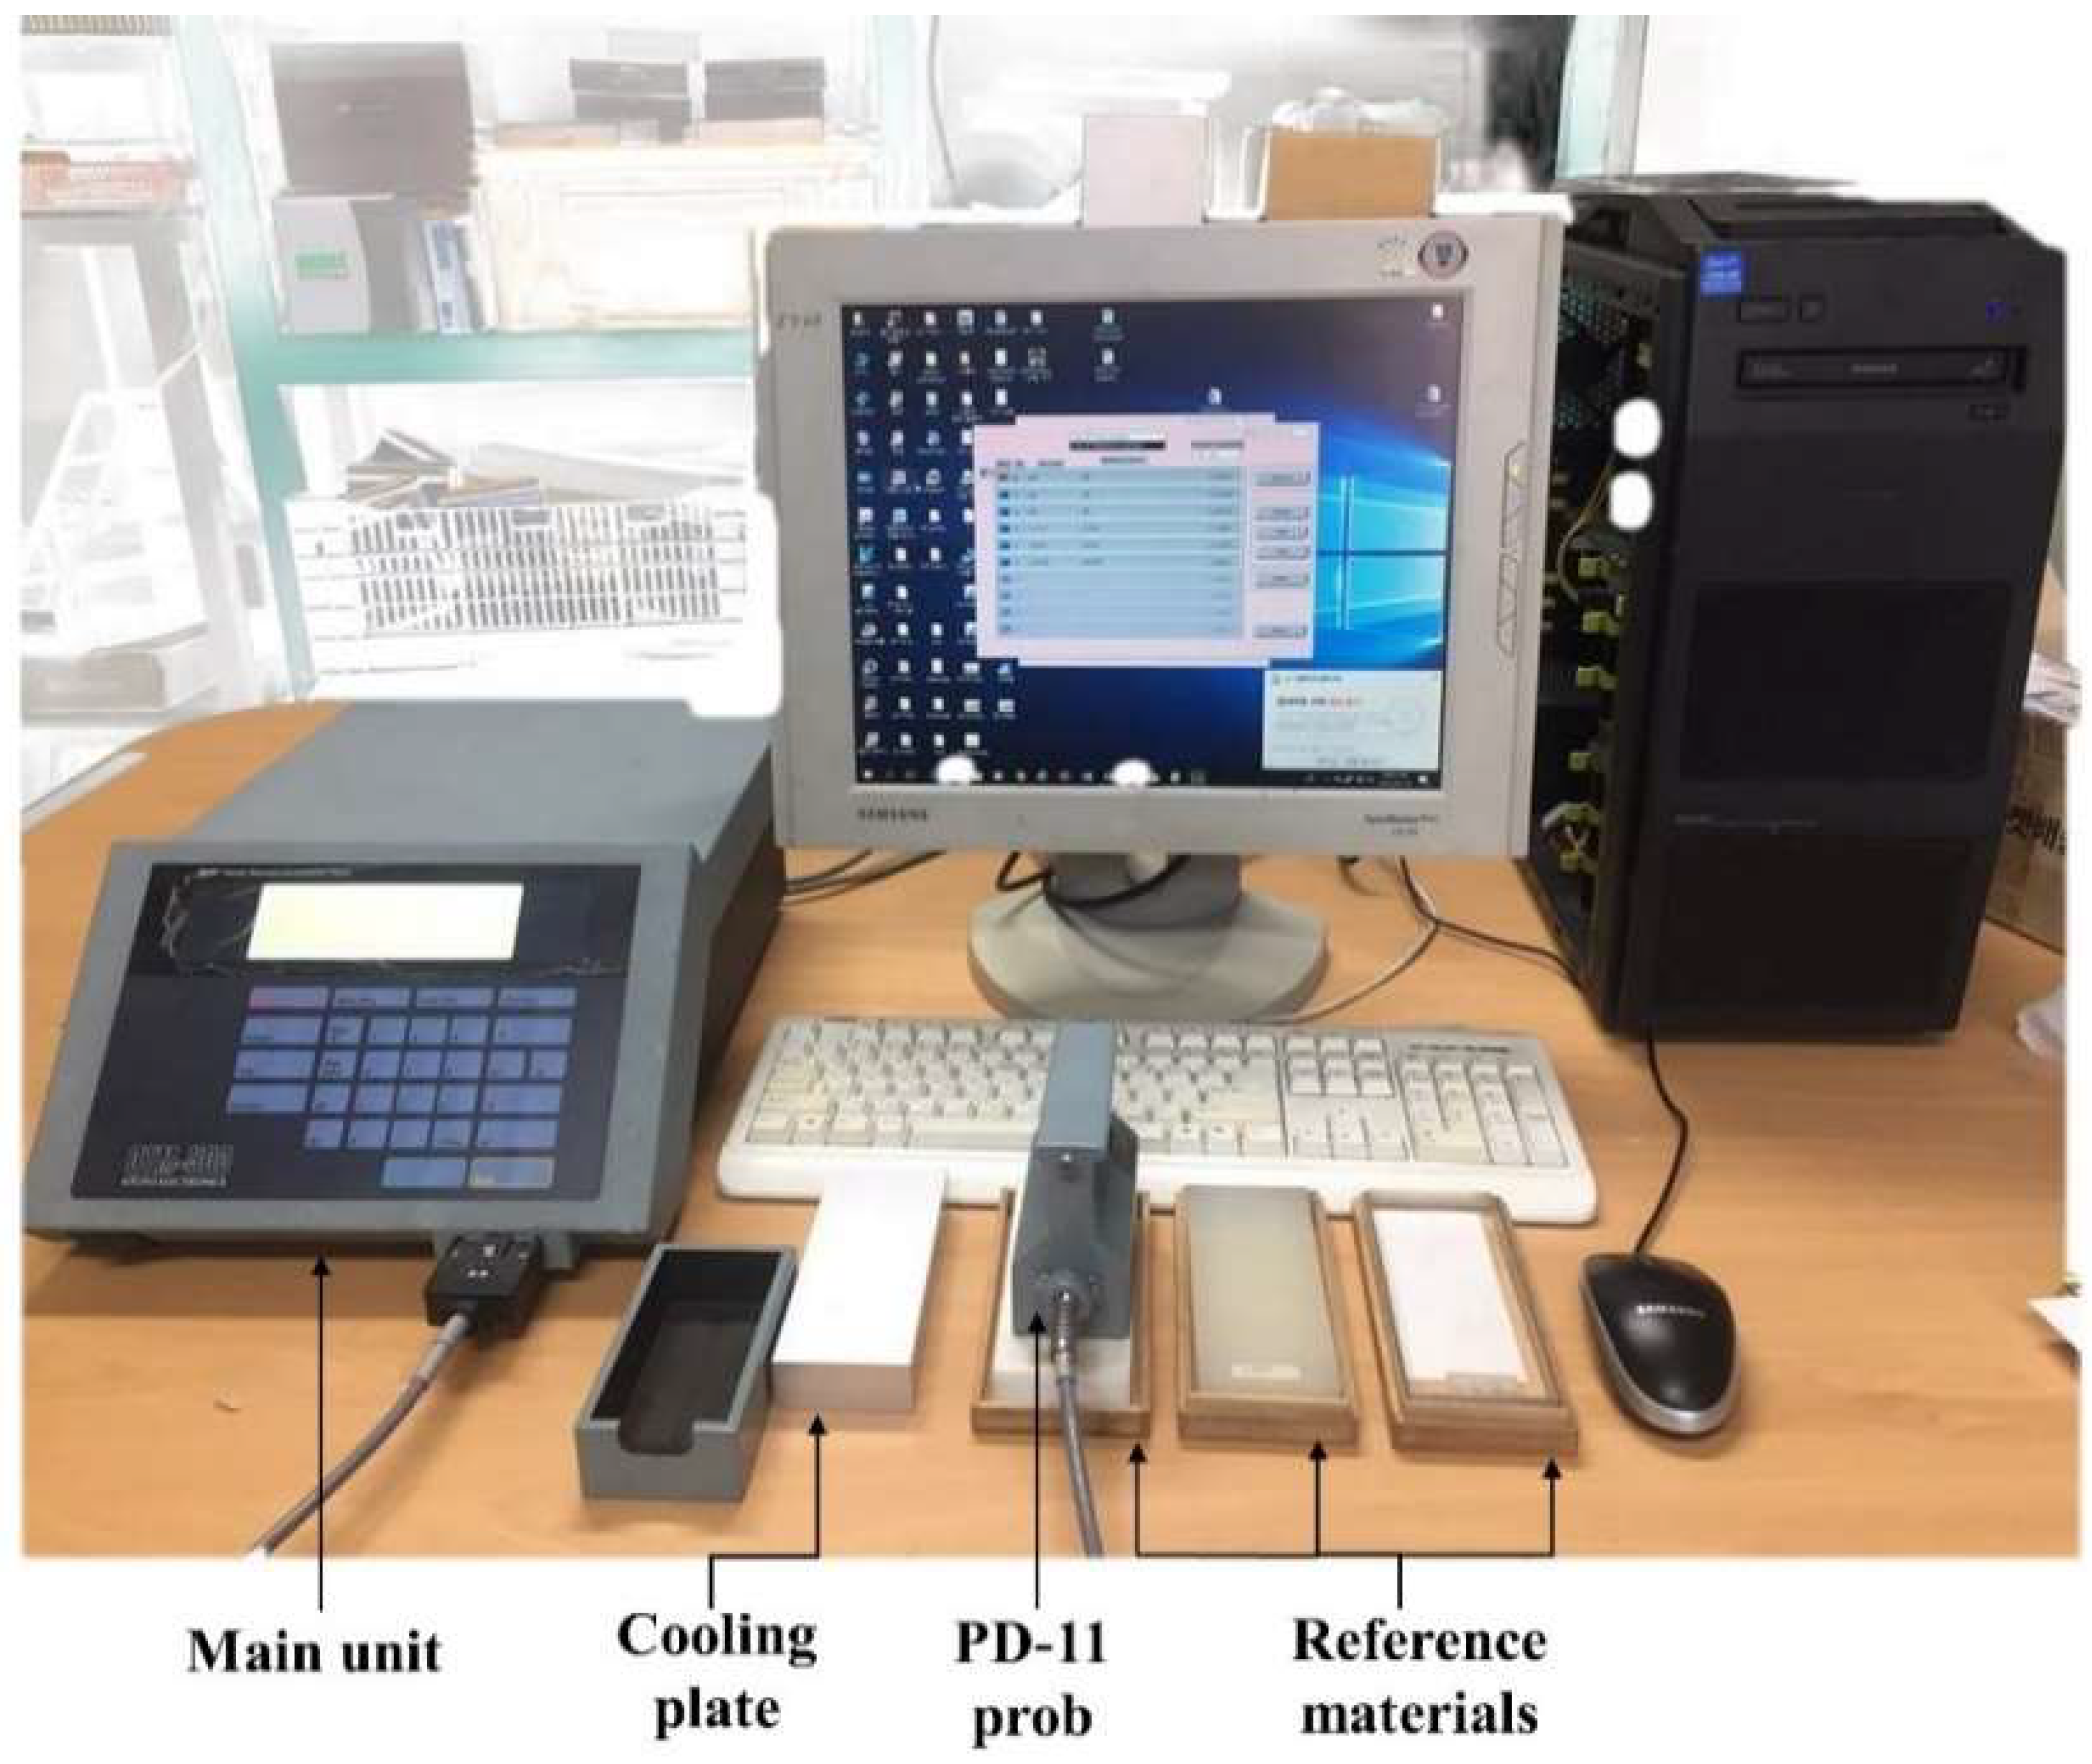
A thermal conductivity meter, Kemtherm (QTM-500), manufactured by Kyoto electronics, was used to measure the thermal conductivity value of the thermal screen materials tested in this study. Figure 5 shows the whole apparatus of thermal conductivity meter. The instrument can quickly measure the thermal conductivity of all types of sample materials limited to the range of 0.023–12 W·m−1·K−1, and has a precision and reproducibility of ±5% and ±3% respectively.
The QTM-500 measuring apparatus consists of, main unit, references plates (shown in Figure 5), cooling plate, power cord, and three different kinds of sensors for different types of materials are available. For this specific purpose of measuring the thermal conductivities of thin sheet samples, we used the following apparatus, QTM-500 with PD-11 prob sensor and an optional software Soft-QTM, which is recommend for this type of material. The specification of these prob sensors is described in Table 2. For thin materials (0.1–8mm) sample use of optional software (Soft-QTM) is recommended, whereas, the thermal conductivity of the thick material can be determined directly through apparatus. This software is specially designed for the measurement of the thin sheet sample using a computer with QTM-500 thermal conductivity meter.
2.3. BES Modeling
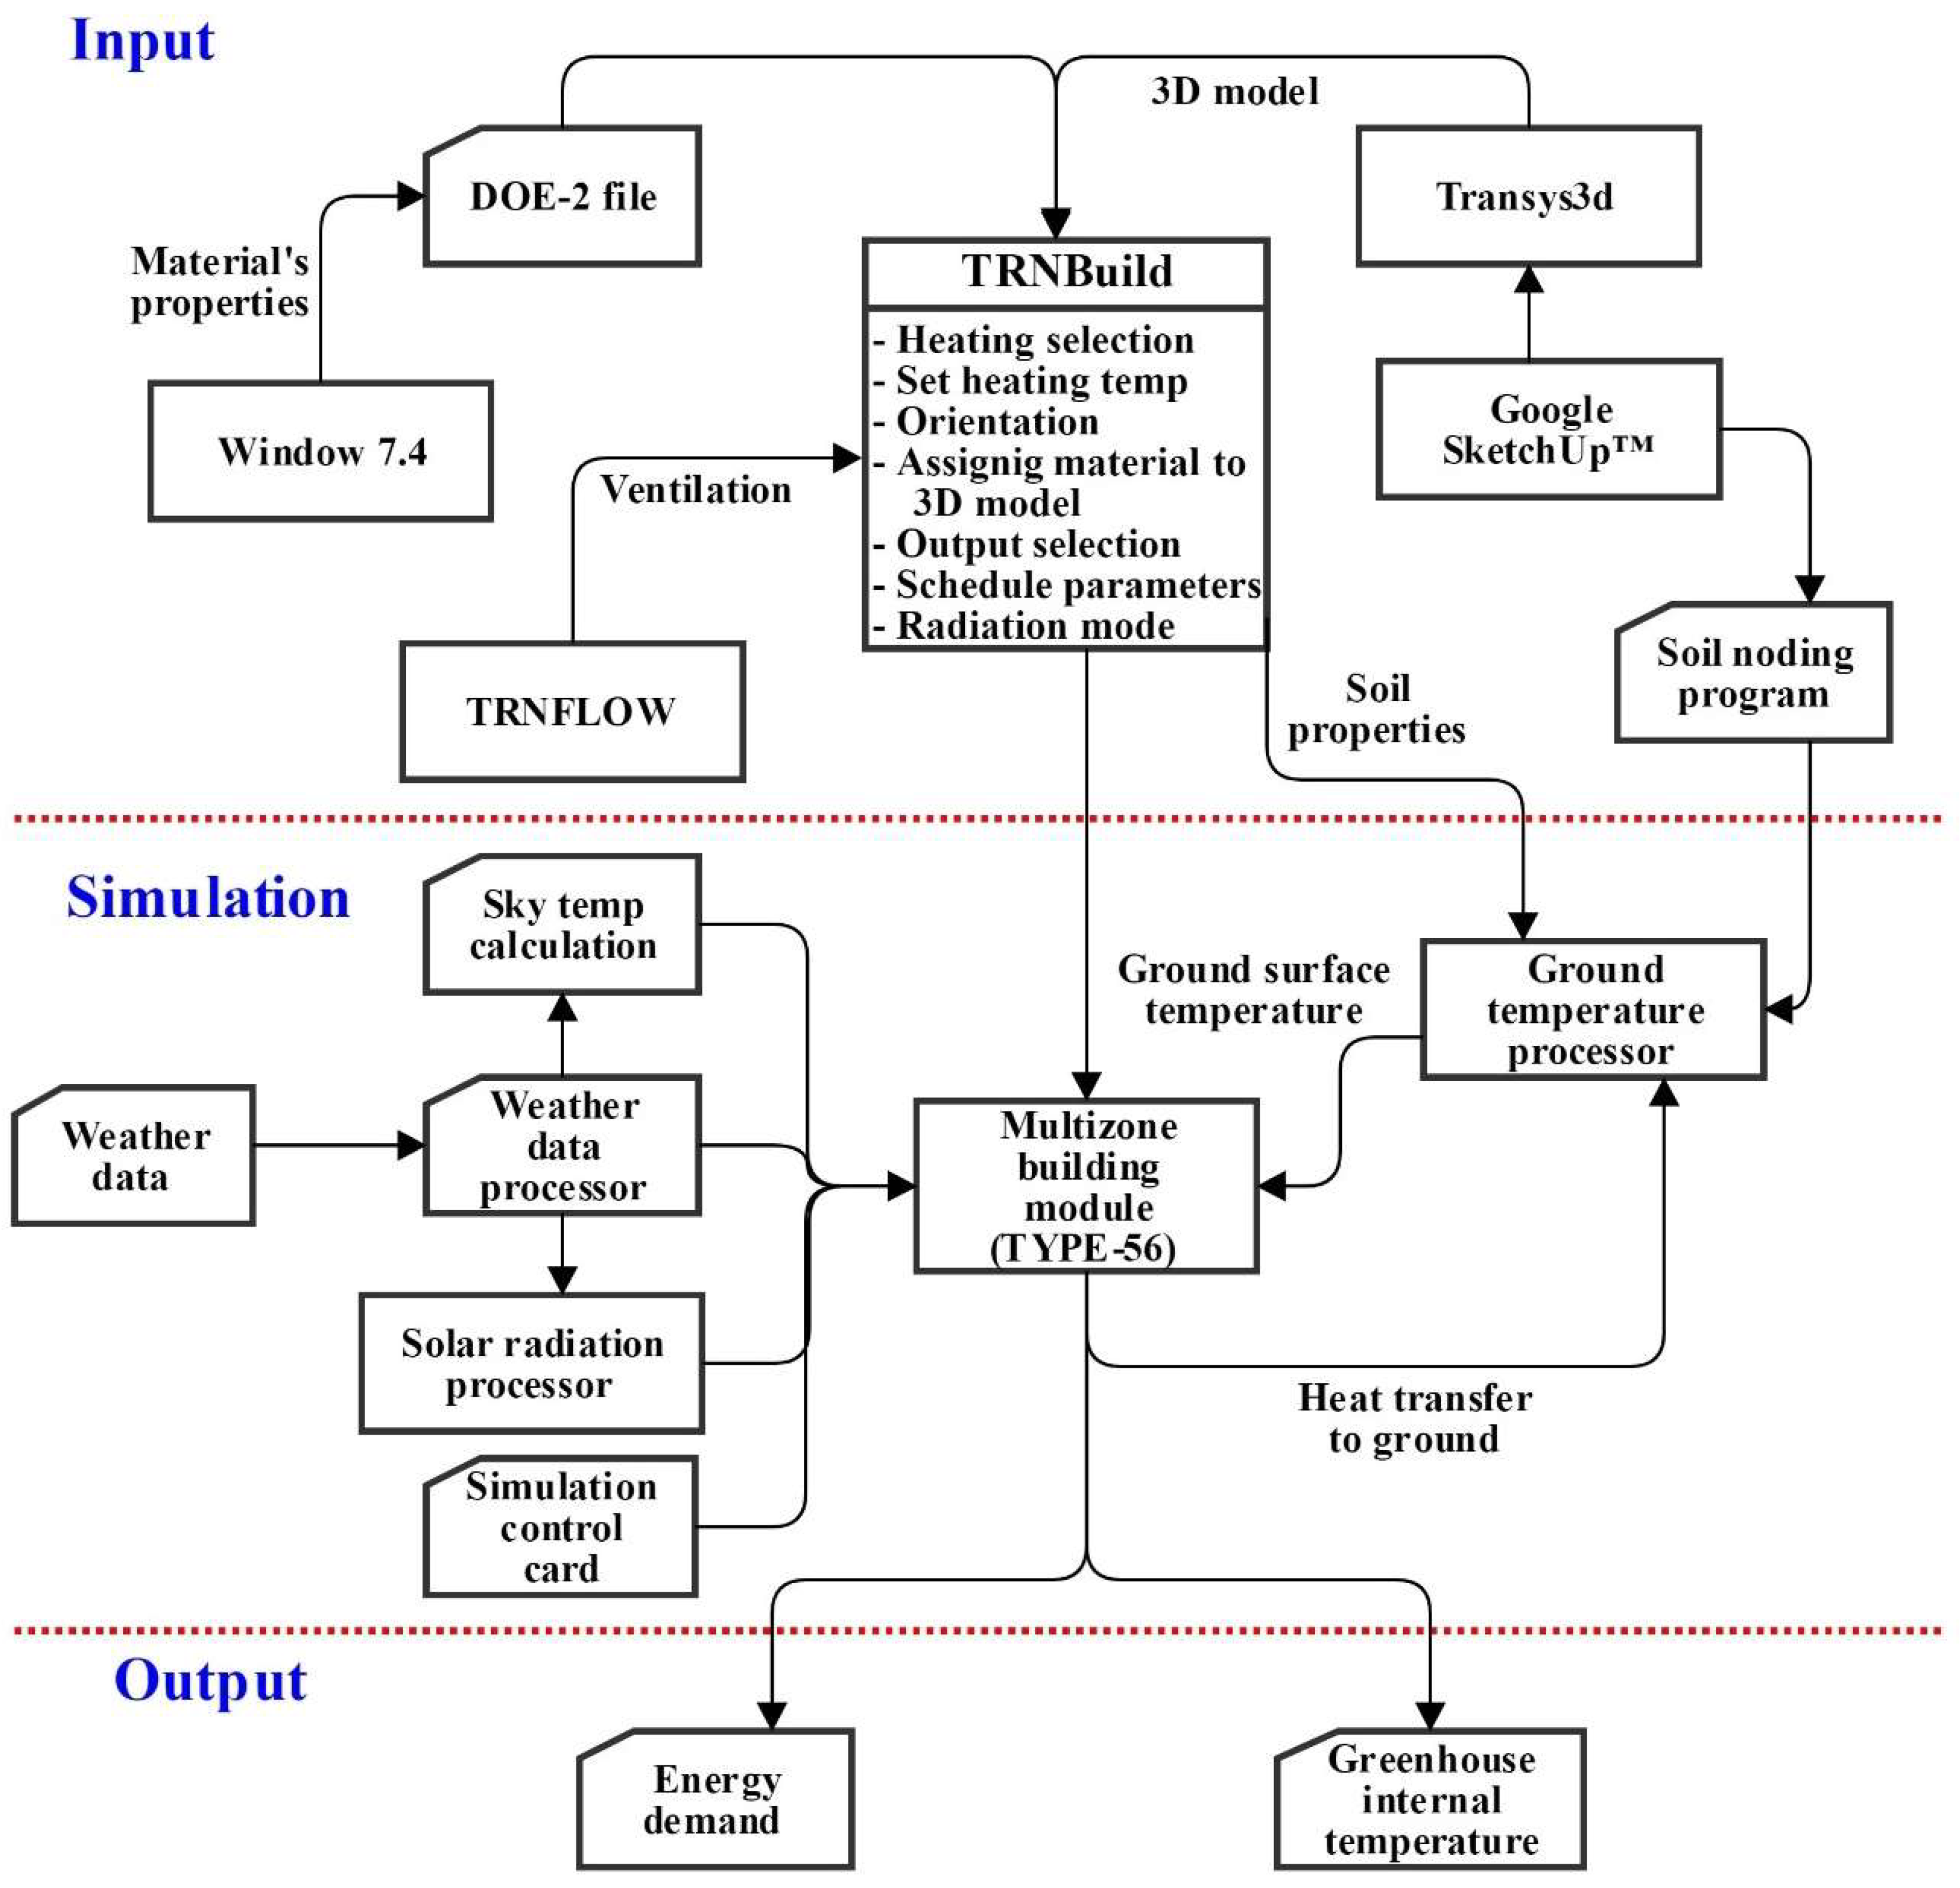
To conduct this study, TRNSYS 18 software was utilized as a BES program. Simulations were run on a desktop personal computer with an Intel core i7-5820k processor (3.30 Ghz), DDR3-RAM (32 GB), and NVIDIA GeForce GTX 960 graphics card, using 64-bit Windows 7. The modeling process was carried out in three parts: pre-processing, modeling, and simulation. The detail of each is discussed below in the corresponding sub-sections. The modeling process is detailed in the flow diagram presented in Figure 6.
2.3.1. Pre-processing
The pre-processing was performed using the following programs and add-ons: Google SketchUp™, Berkeley Lab Window 7.4 software, Transys3d, Tranflow, and SoilNoding program. Each of them was used to provide the necessary input needed to run the greenhouse simulation on TRNSYS 18. A detailed description of each employed program and add-on is described in Table 3. TRNBuild (formally known as PREBID) is a building interface module of Trnsys program, which was used to define the basic project data and output selection for the greenhouse model. It creates a .BUI file containing all the information of the building (greenhouse) including, 3D design of the greenhouse, orientation, heating, cooling, construction materials, output selection, and radiation mode. First of all, a 3D model of greenhouse was designed in Trnsys3d, which is a plugin for the Google SketchUp™ program, the program creates an .idf file (readable by TRNBuild) of 3D geometry data. A gothic shaped gambrel type roof vent greenhouse 3D model is shown in Figure 7. TRNSYS does not contain typically used greenhouse covering and thermal screen material properties. To serve this purpose, we used Berkeley Lab Windows 7.4 software to create a DOE-2 file (readable by TRNBuild) of thermal screens material by using properties of each from Table 4. This program allows to define a new material on the basis of physical and thermal properties of the corresponding material. It calculates overall heat transfer coefficient (U-value), solar heat transfer coefficient, shading coefficient, solar and visible transmittance, reflectance, for complete window system at different angles and creates DOE-2 file type. These measured physical and thermal properties of different thermal screen materials are provided in one of our studies [23]. The thermal screens selected for evaluation are typically used screens in greenhouses and are available in South Korea’s market. The physical and thermal properties of polyethylene material were taken from a study conducted by Valera et al. [24]. In order to consider the greenhouse soil, SoilNoding program, a plugin for Google SketchUp™ was used. It is a ruby scripted plugin that writes the geometry file of the floor needed by Type-49. This program was used to prepare a 2D model of the greenhouse floor, and create a .txt file of floor meshing data. This file is further used in the simulation to calculate greenhouse floor temperature. TRNBuild simulates only the thermal environment of the greenhouse, for natural ventilation, and requires air flows between the thermal zone and outside environment. To account for this situation, air coupling between the thermal model and the air flow model was done using TRNFLOW, a ventilation module of the TRNSYS 18 program. TRNFLOW coupled the internal and surrounding greenhouse environments by incorporating wind speed, direction, pressure, as well as internal and external temperatures. The airflow network in the model was defined by linking the external node (ambient environment) to the thermal node (internal greenhouse) through the open windows using the TRNFLOW interface within TRNBuild [18]. The data for the air flow model was also incorporated in the .BUI file of TRNBuild.
2.3.2. Modeling
Simulation studio is the main interface of the TRNSYS program which connects all the components together to develop the model and run the simulation. In simulation studio a variety of standard components are available for energy simulation. Each component is represented by a Type, the component’s input and outputs are connected with each other by a link tool. The simulation studio allows the basic settings to start and stop the simulation. Figure 8 shows the greenhouse model developed using simulation studio. Table 5 presents details for each component and specific type name used in the greenhouse modeling. In simulation studio, the “Multi-zone” module known as Type-56 was used to describe greenhouse. Type-56 reads the .BUI file created by TRNBuild, which contains all the inputs we prepared during pre-processing. In the next step, a weather data reader “Type-9” was used to read the .text file of user-provided weather data of the specific site. All the simulations were carried out by inputting the weather data for Daegu. The weather data was further processed with the solar radiation processor “Type-16”. This type used total solar radiation of horizontal from weather data reader and calculated total, beam, reflected, and diffused, solar radiation on tilt surface. The Psychrometric chart “Type-33” uses dry bulk temperature and humidity ration and calculates dew point temperature. A sky temperature calculator “Type 69” uses dew point temperature, beam and diffuse radiation on horizontal to calculate sky temperature. Coupling of greenhouse ground with internal thermal environment of greenhouse was carried out with a ground coupling module called “Type-49”. It uses a greenhouse floor file created by SoilNoding program and convective heat transfer coefficient by Type-56 as an input and gives greenhouse floor temperature as an output. To control opening and closing of the side and roof vents for natural ventilation, a differential controller “Type-911” was used. Finally, to display the selected outputs and get results, the online plotter “Type-65” and printer “Type-25” were used, respectively.
2.3.3. Simulation
After successful modeling of the greenhouse thermal model, two simulations were run to validate our model using the same conditions as experimental greenhouse. The detailed conditions are given in the “validation section”. After validation of our proposed model, further simulations were performed to investigate the effect of different thermal screens including: Multi-layer, Polyester, Luxous, and Tempa, on heat energy demand of the greenhouse. Furthermore, the sensitivity analysis was conducted by using the material’s different thermal conductivity and thickness values in the simulations. In addition, different greenhouse screen opening-closing control strategies were examined by running simulation for three different screen control strategies including: time dependent, outside solar radiation, and outside temperature control strategies.
2.4. Validation
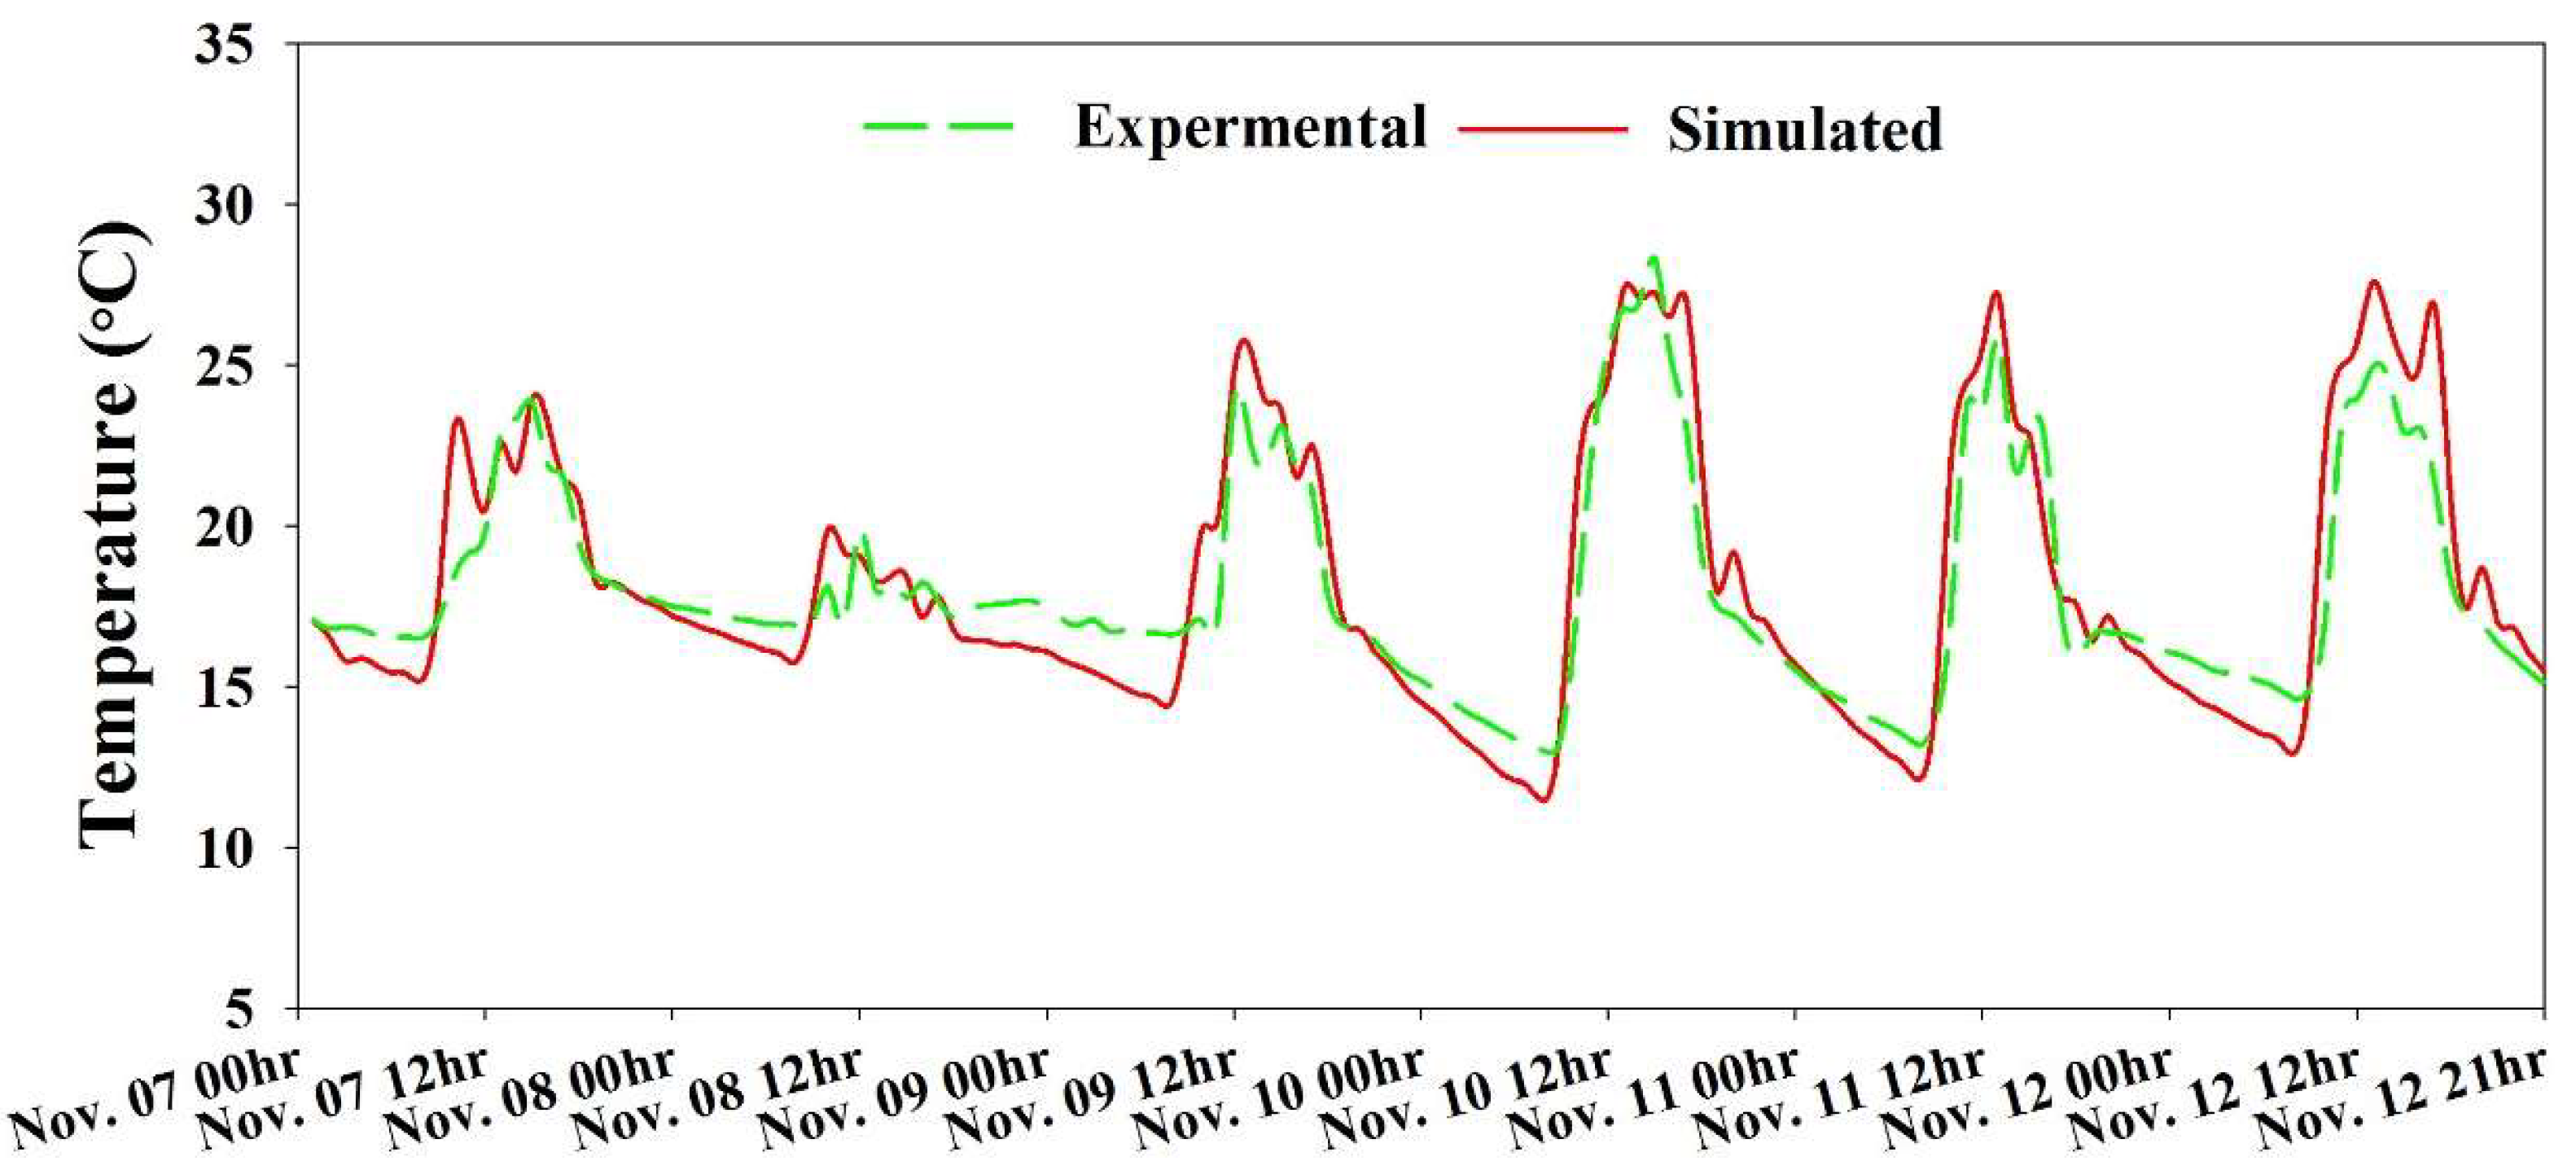
In one of our previous studies, greenhouse thermal model was calibrated—we used the same setting to develop the BES mode. The detail of the calibration process can be seen in the cited paper [18]. Further, to validate our model, the computed results, which were obtained using the same conditions as the experimental greenhouse, were compared to the greenhouse internal temperature obtained experimentally. Table 6 and Table 7 present the detail of the operating conditions of both reference greenhouses, respectively. The experiments for validation were conducted in Daegu over two different periods in 2017, from January 1 to January 13 and November 7 to November 12 respectively.
2.5. Statistical Analysis of BES Model
Statistical analyses were performed to predict the performance of the BES model by using the Nash-Sutcliffe efficiency coefficient (NSE) and to compare the experimentally observed data with the output of the BES. This coefficient quantitatively describes the accuracy of the model results—it indicates how well the plot of observed versus simulated data fits the 1:1. Its value ranges from -∞ to 1, and values closer to 1 indicate better predictive power of the model. The NSE is mathematically expressed as follows:
where is the experimentally obtained internal temperature of the greenhouse, is the simulated internal temperature of the greenhouse, is the mean of the experimental temperature, n is the total number of observations.
2.6. Sensitivity Analysis
Sensitivity analyses were performed for thermal conductance and thickness of thermal screens on energy demand of greenhouse. A sensitivity coefficient is often used in control engineering. Among different forms of sensitivity coefficients, it is most suitable for thermal systems and building energy simulation in the following form expressed in Equation (2) [25].
where ΔOP and ΔIP are change in the output and input, respectively. OP and IP are base output and input. A high value of sensitivity coefficient indicates that the model output is highly sensitive to that input, so that value must be chosen very carefully [26].
3. Results and Discussion
Validation analysis was done for the greenhouse-controlled system. The computed internal temperatures of greenhouses were compared with those experimentally obtained with temperature controlled natural ventilation, with night heating set point and with thermal curtain separately. The greenhouse operating conditions for both cases are detailed in Table 6 and Table 7, respectively. The predicted and experimentally obtained greenhouse internal temperature with the condition of temperature controlled natural ventilation and heating set point is shown in Figure 9. The second condition temperature controlled natural ventilation without heating set point only application of night thermal screen was validated and the result for which is shown in Figure 10. The NSE values, 0.84 and 0.79, for both validation results indicate the goodness-of-fit between experimental and simulation results. The agreement between the experimental and computed results under both conditions encourages adoption of the proposed BES model.
After successfully creating and validating the BES model, simulations were performed to obtain results for all the selected thermal screens. The BES greenhouse model was used to calculate the yearly heating demand of the greenhouse using selected night thermal screens. Figure 11 depicts the heat energy demand of the selected thermal screens. The results show the heating demand of greenhouse with multi-layer night thermal screens was 20%, 5.4%, and 13.5%, less than the Polyester, Luxous, Tempa, respectively; multi-layers thermal screen shows the least energy demand of the other selected thermal screens. Furthermore, Figure 12 shows monthly energy saving potential of the selected thermal screens when compared with the without thermal screens greenhouse energy demand. Some studies [8,12,14,27] also confirmed the energy saving potential of the thermal screens. In these studies, investigation was carried out by calculating overall heat transfer coefficient of thermal screen with greenhouse internal temperature. Further, comparison was made between with and without thermal screen greenhouse, without considering different kinds of screens. In our study we made a comparison between different screens by taking into account their thermal properties. As a variety of different screens are available in the market, compression of the screens was necessary to select the most suitable one according to our specific needs.
Table 8 presents the heating demand for all the tested single-layer thermal screens sorted in ascending order. The heating demand calculation considered the thickness, thermal conductivity, and emissivity of all the thermal screens. The results showed that multi-layer exhibits the lowest heating demand. Thus, it can be concluded that the thickness and thermal conductivity of the materials have a greater influence on their heating demand; higher thickness and lower thermal conductivity caused less heat loss from the material. The heating demand of Tempa is less than polyester even though its thickness is less than that of Tempa, the reason being that the thermal conductivity of Tempa is higher than that of polyester. Moreover, thermal screens Luxous and Tempa have less thickness than that of the polyester, but their heating demands are less than that of the polyester because their emissivities are less. Here, from the results in Table 8, we can conclude that emissivity of the material has a significant effect on heating demand—more emissivity causes more heat loss from the material.
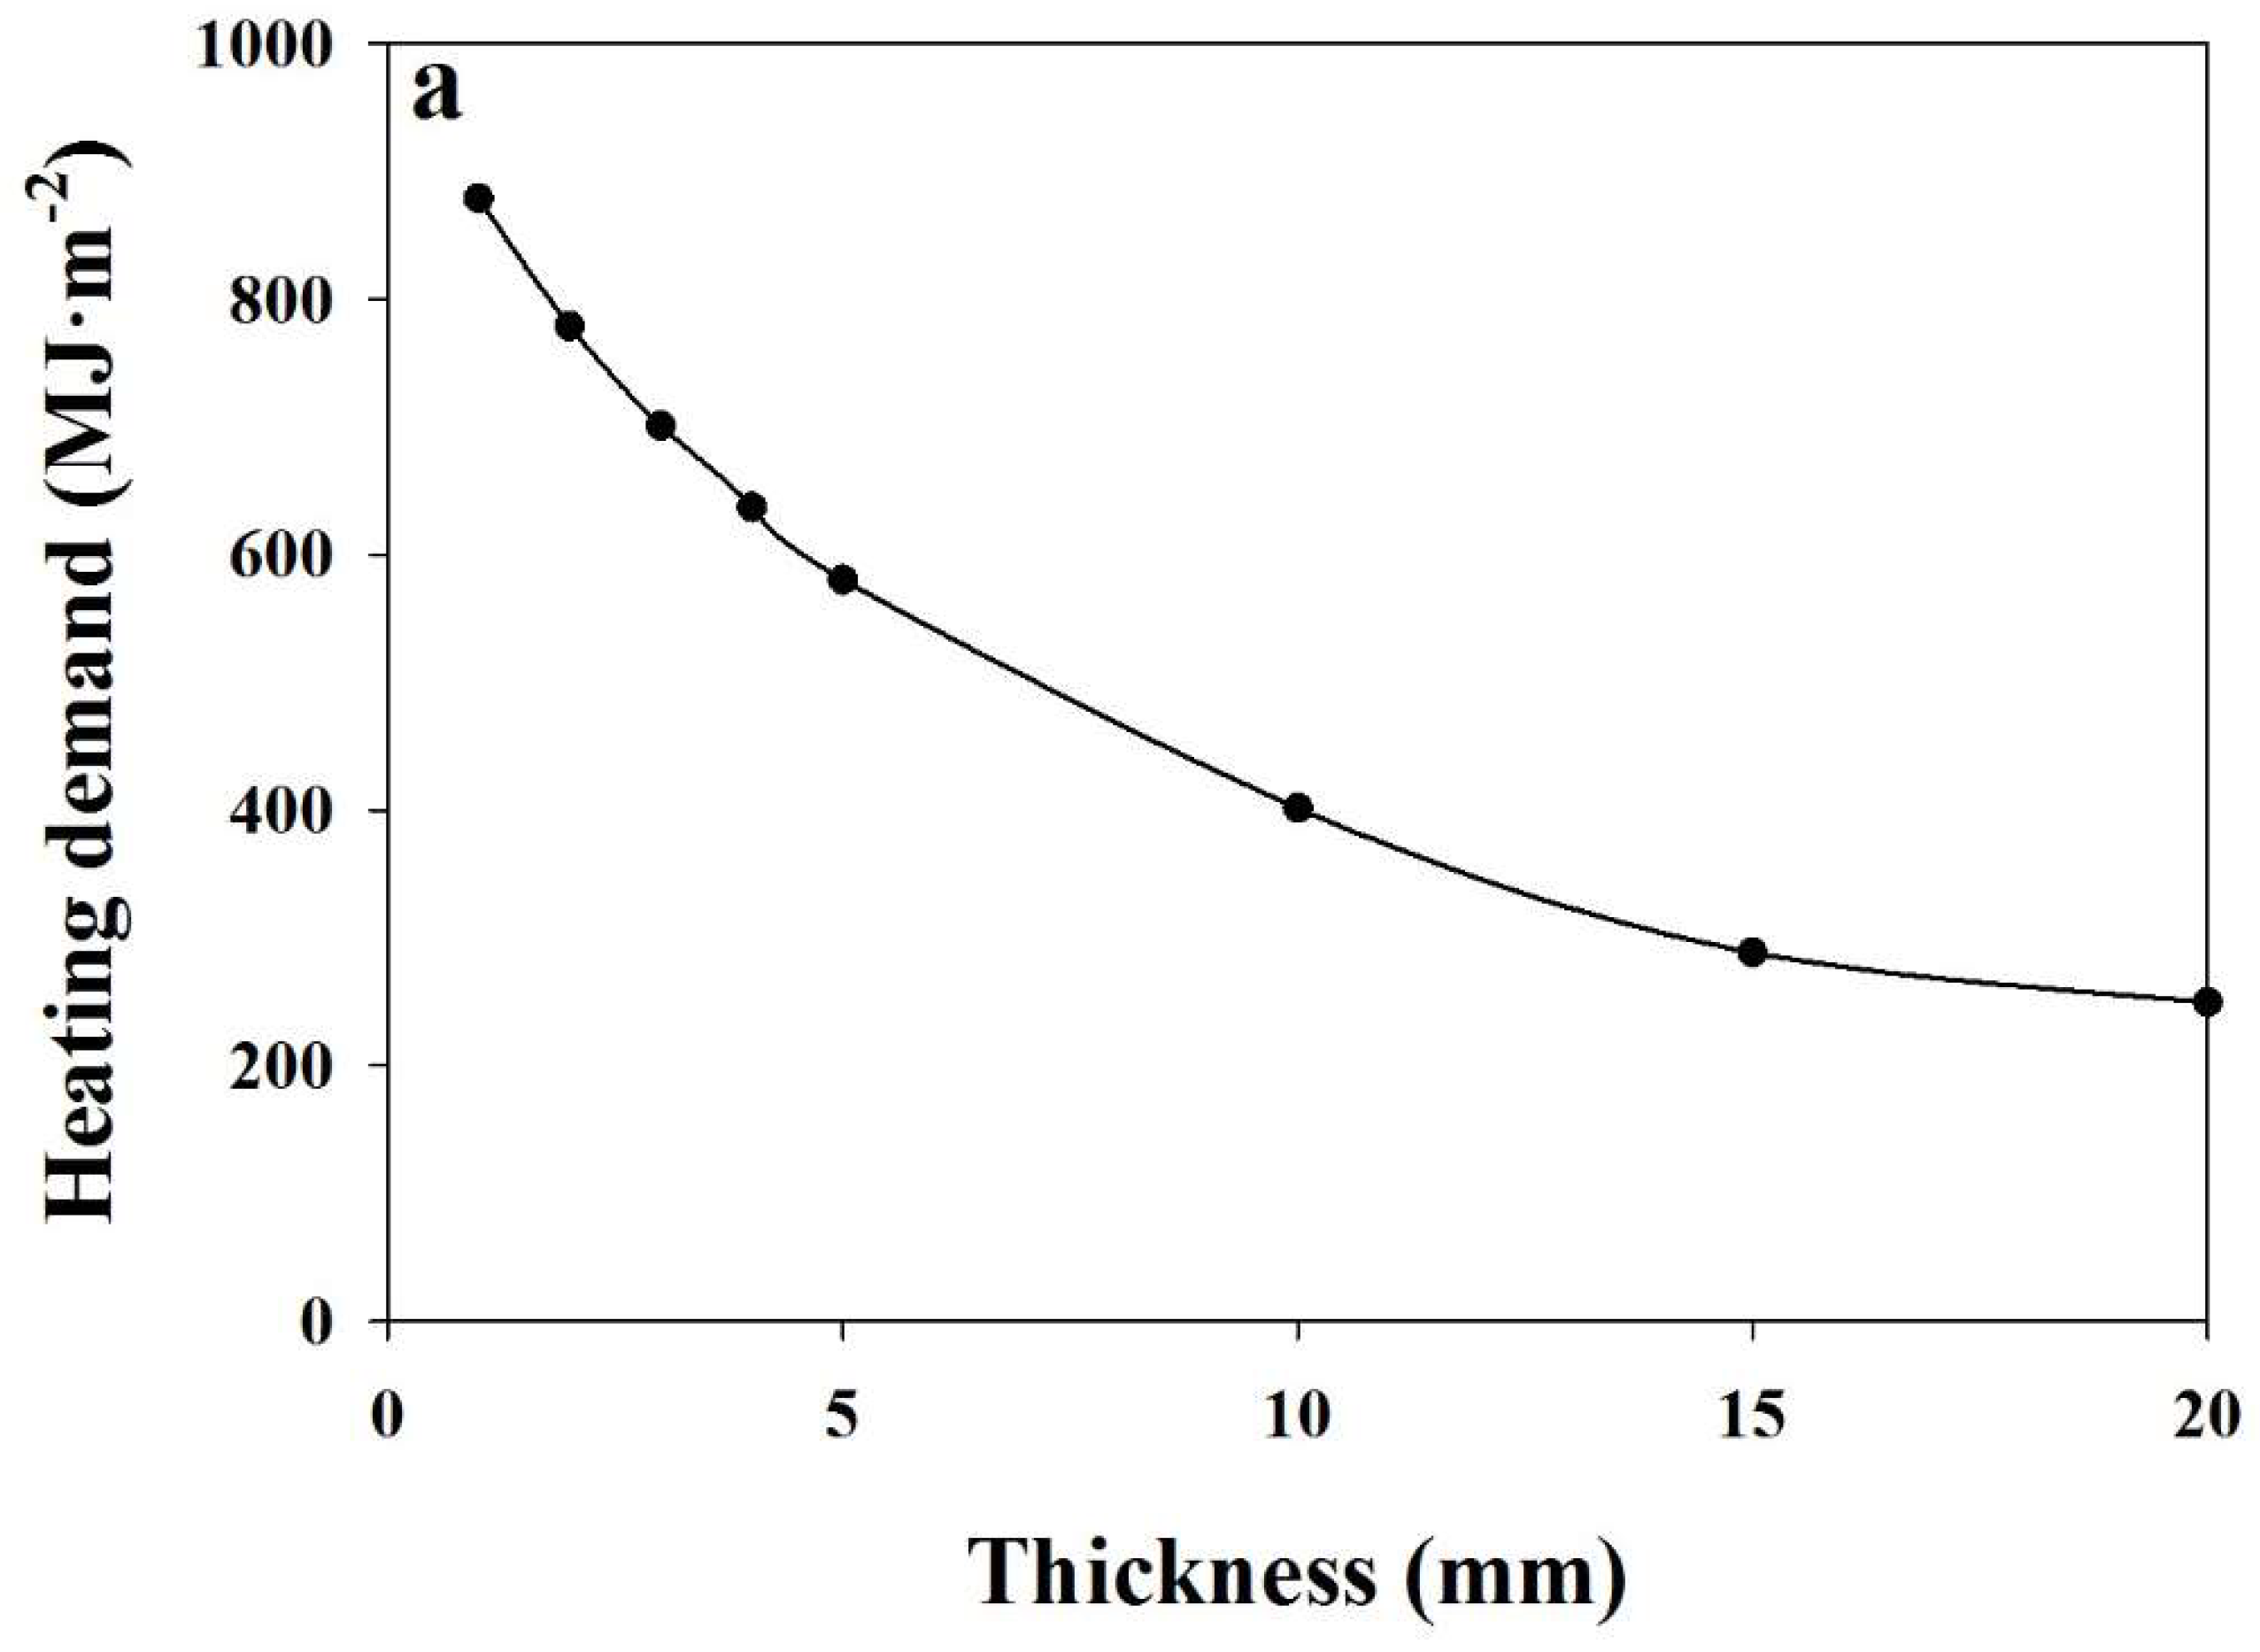
Figure 13a shows the sensitivity analysis results performed on the thermal conductance. The testing was conducted in the range of 0.01 to 0.2 W·m−2·K−1. The outcomes demonstrate that the heating demand increased when thermal conductivity was changed from 0.01 to 0.05 but then stabilized and did not show any more change in heat demand with increasing thermal conductivity. Figure 13b demonstrates that the sensitivity coefficient decreased with the increase of thermal conductivity of the screens. The results also show that the heating demand is more sensitive to the low thermal conductivity value than the higher value. The heating demand increment caused by increasing thermal conductivity was higher for thick screens, like the multi-layer, than for that of the less thick materials. Moreover, the heating demand difference after the thermal conductivity value 0.2 W·m−2·K−1 was because of different emissivity and reflectivity values. The radiative heat loss in the material is dependent on emissivity and reflectivity. Higher emissivity increases the heating demand and higher reflectivity lowers the heating demand which is in agreement with the results of the previous study conducted on energy saving screen materials [7]. Figure 14a shows that the heating demand is very sensitive to screen thickness, as screen thickness increases, heating demand continuously decreases indicating the reduction in heat loss from the screen. In Figure 14b the high values of the sensitivity coefficients demonstrate that the thickness of the thermal screen is highly sensitive to the heating demand of the greenhouse. A study [28] conducted on sensitivity of the heating requirement of the greenhouse also confirmed that the heating requirement is highly sensitive to the greenhouse material’s thermal properties. This study investigated the sensitivity of the greenhouse covers, only excluding thermal screens. The study uses only U-value of the greenhouse screens, because thermal properties of the screens were lacking in the literature.
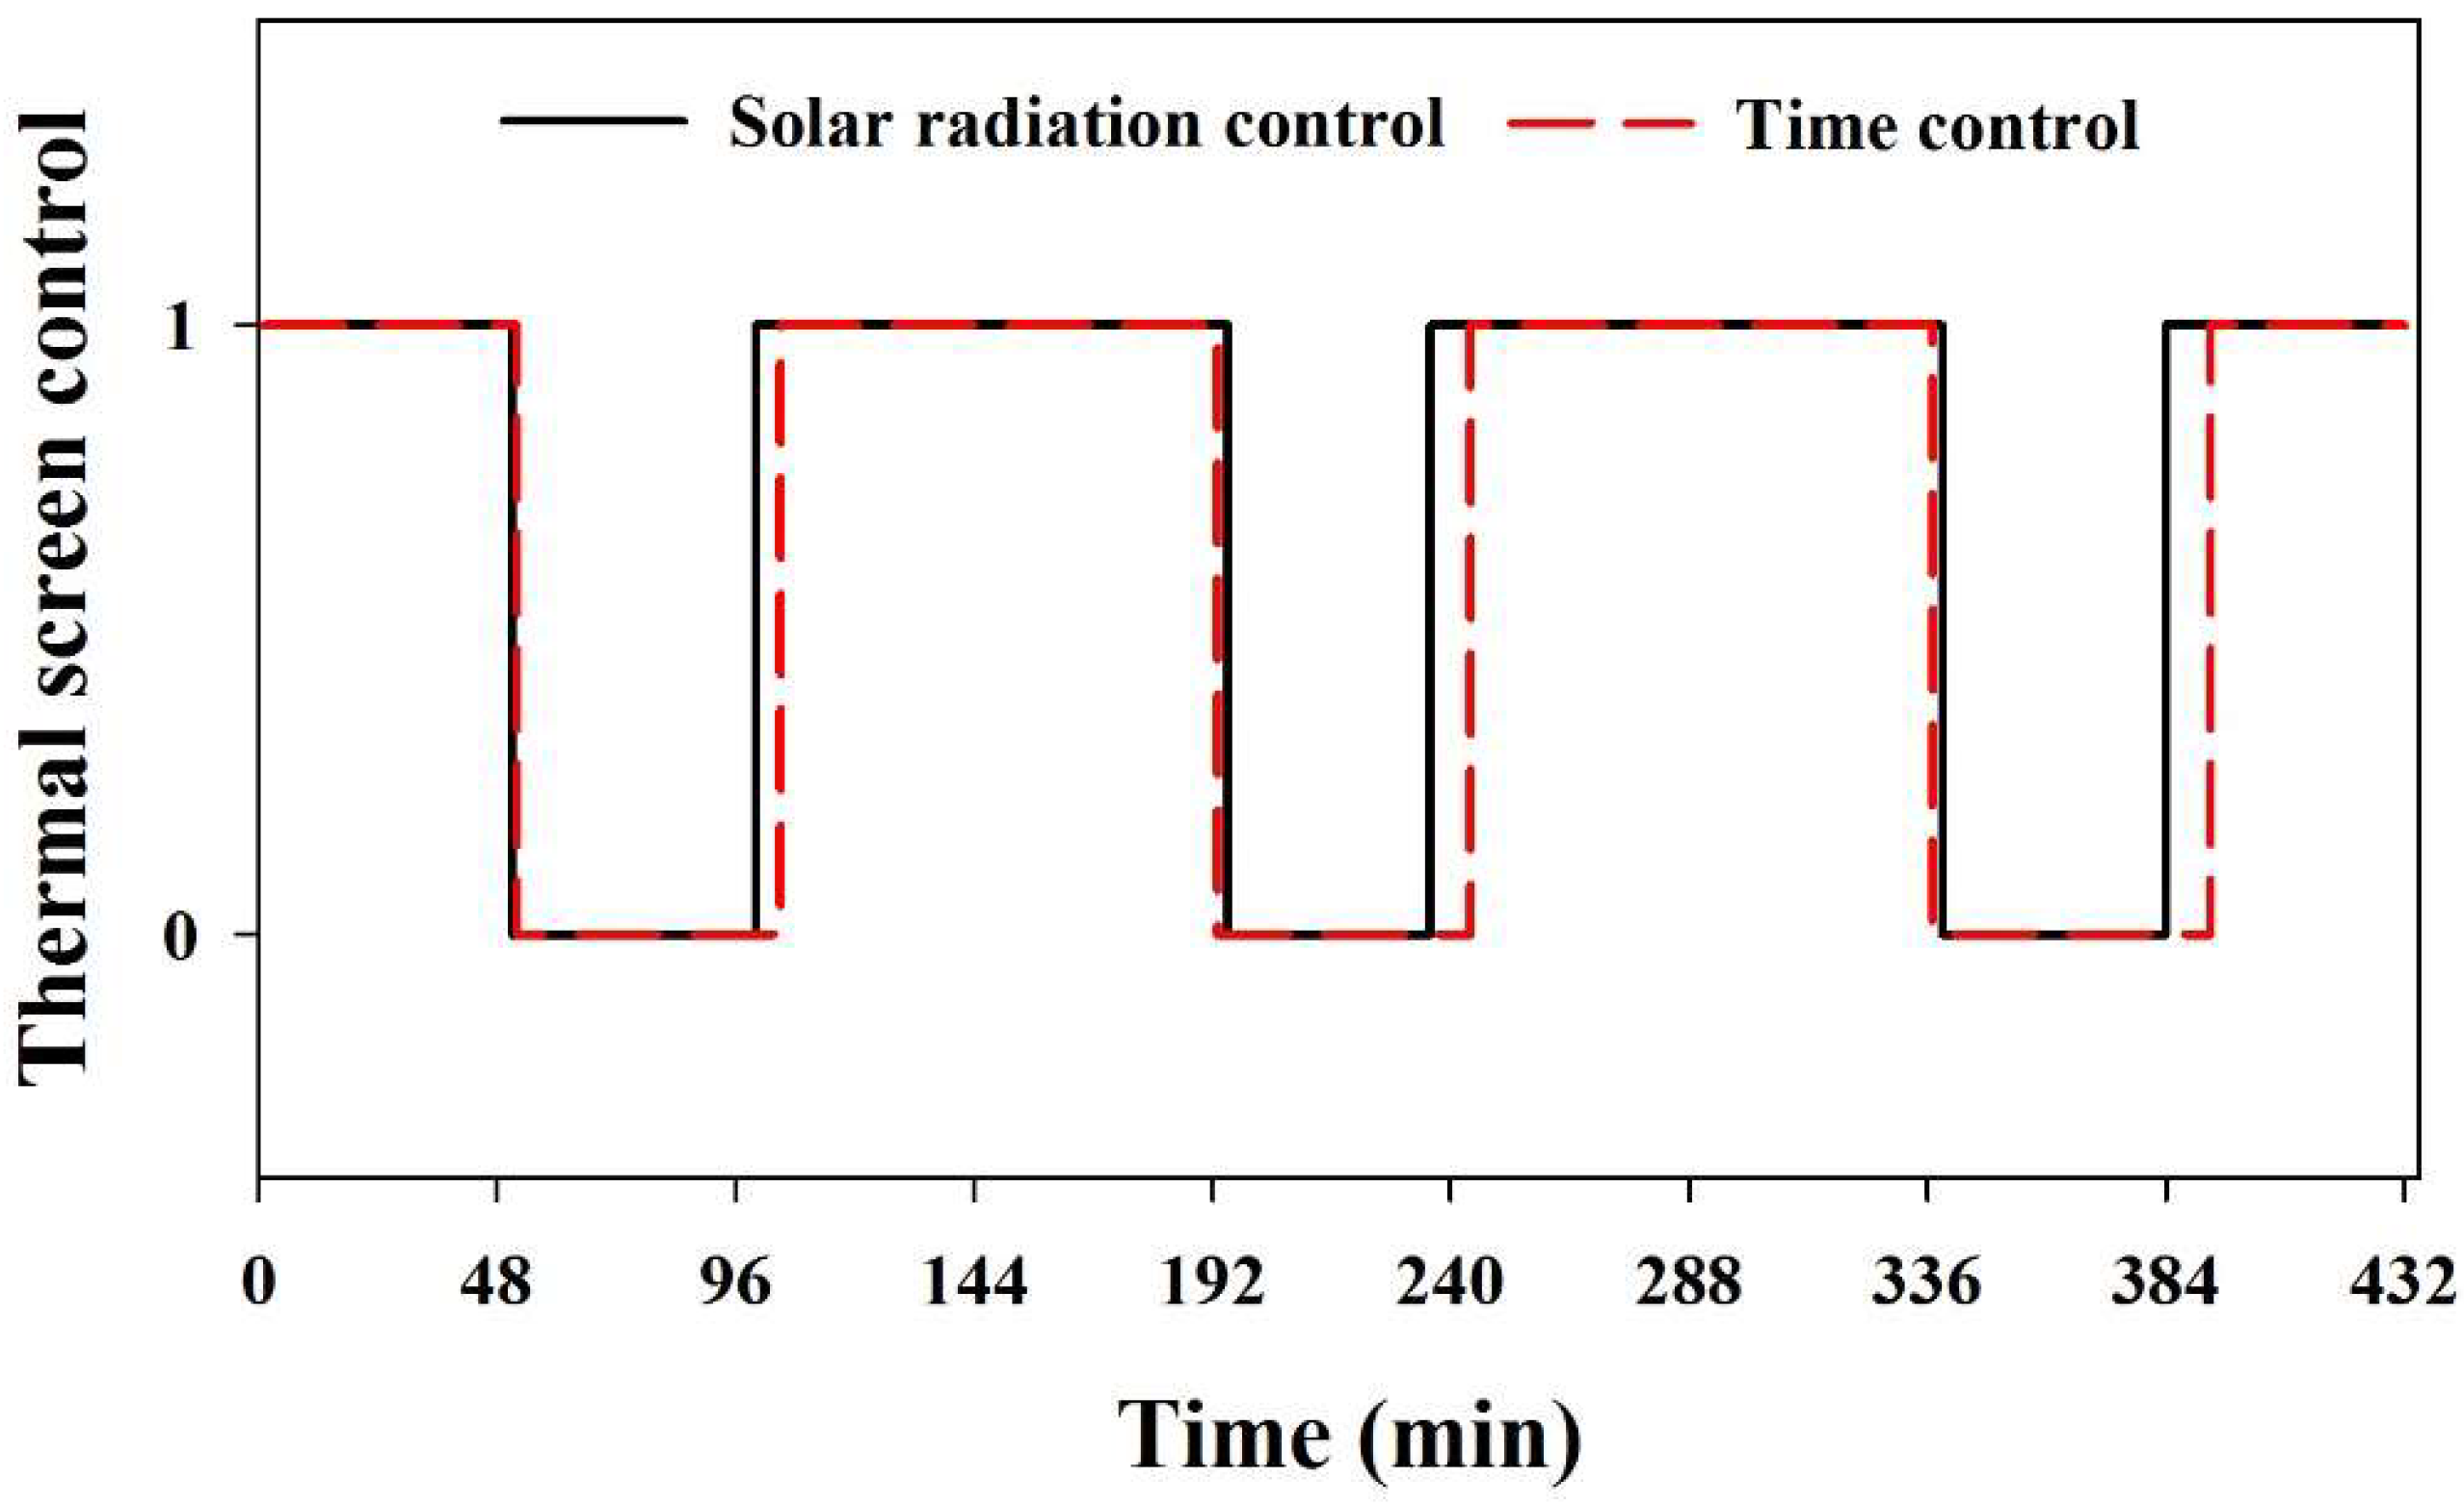
Thermal screens are used to reduce the energy requirement of the greenhouse. In winter, the screens are opened inside the greenhouse during the nighttime to reduce heat loss and closed during the daytime to get solar radiation inside the greenhouse. Table 9 shows the results of different screen control strategies for energy conservation. The results show yearly (01-Nov-2017 to 31-Mar-2018) heat energy demand of three thermal screen control strategies considering the fixed setpoint value for the whole winter season. Using the first conventional time control strategy the greenhouse heating demand was 705.5 MJ·m−2. Moreover, the heating demand for two of the proposed screen control strategies (outside global radiation and outside global radiation along with outside temperature) was 700.3 MJ·m−2. It can be seen from the results that, when the screen was opened at 1 W·m−2 heating demand was higher at 707.3 MJ·m−2, but as the solar radiation set point value increased, energy requirement started decreasing up to 60 W·m−2—the same phenomenon was seen when the screens were controlled by outside solar radiation at 60 W·m−2, and the outside temperature was −20 and −15 °C. The heating requirement was least at lower temperatures but as temperature increased heating requirement started increasing as well. Moreover, when controlling thermal screen with outside solar radiation, as setpoint value increases number of screens closed hours also increases. Figure 15 shows the thermal screens opening and closing time by using different screen opening criteria. From the outcomes of these thermal screen control strategies it can be concluded that a significant amount of heat energy can be saved by controlling thermal screen with outside solar radiation rather than using the conventional time control method. The amount of energy saved by using solar radiation control strategy was found to be 5 MJ·m−2. This energy savings translates to a conservation of more or less~ 2000 liters of fuel for 1 hectare of greenhouse during a complete winter season. Two numerical studies [29,30] conducted to investigate the best time to open and close the thermal curtain also confirm our trend of results. The studies suggested 33 W·m−2 and 40 W·m−2 of the setpoint, the specific values are different because these studies were conducted with the weather data of central New York, USA and Bedfordshire, England.
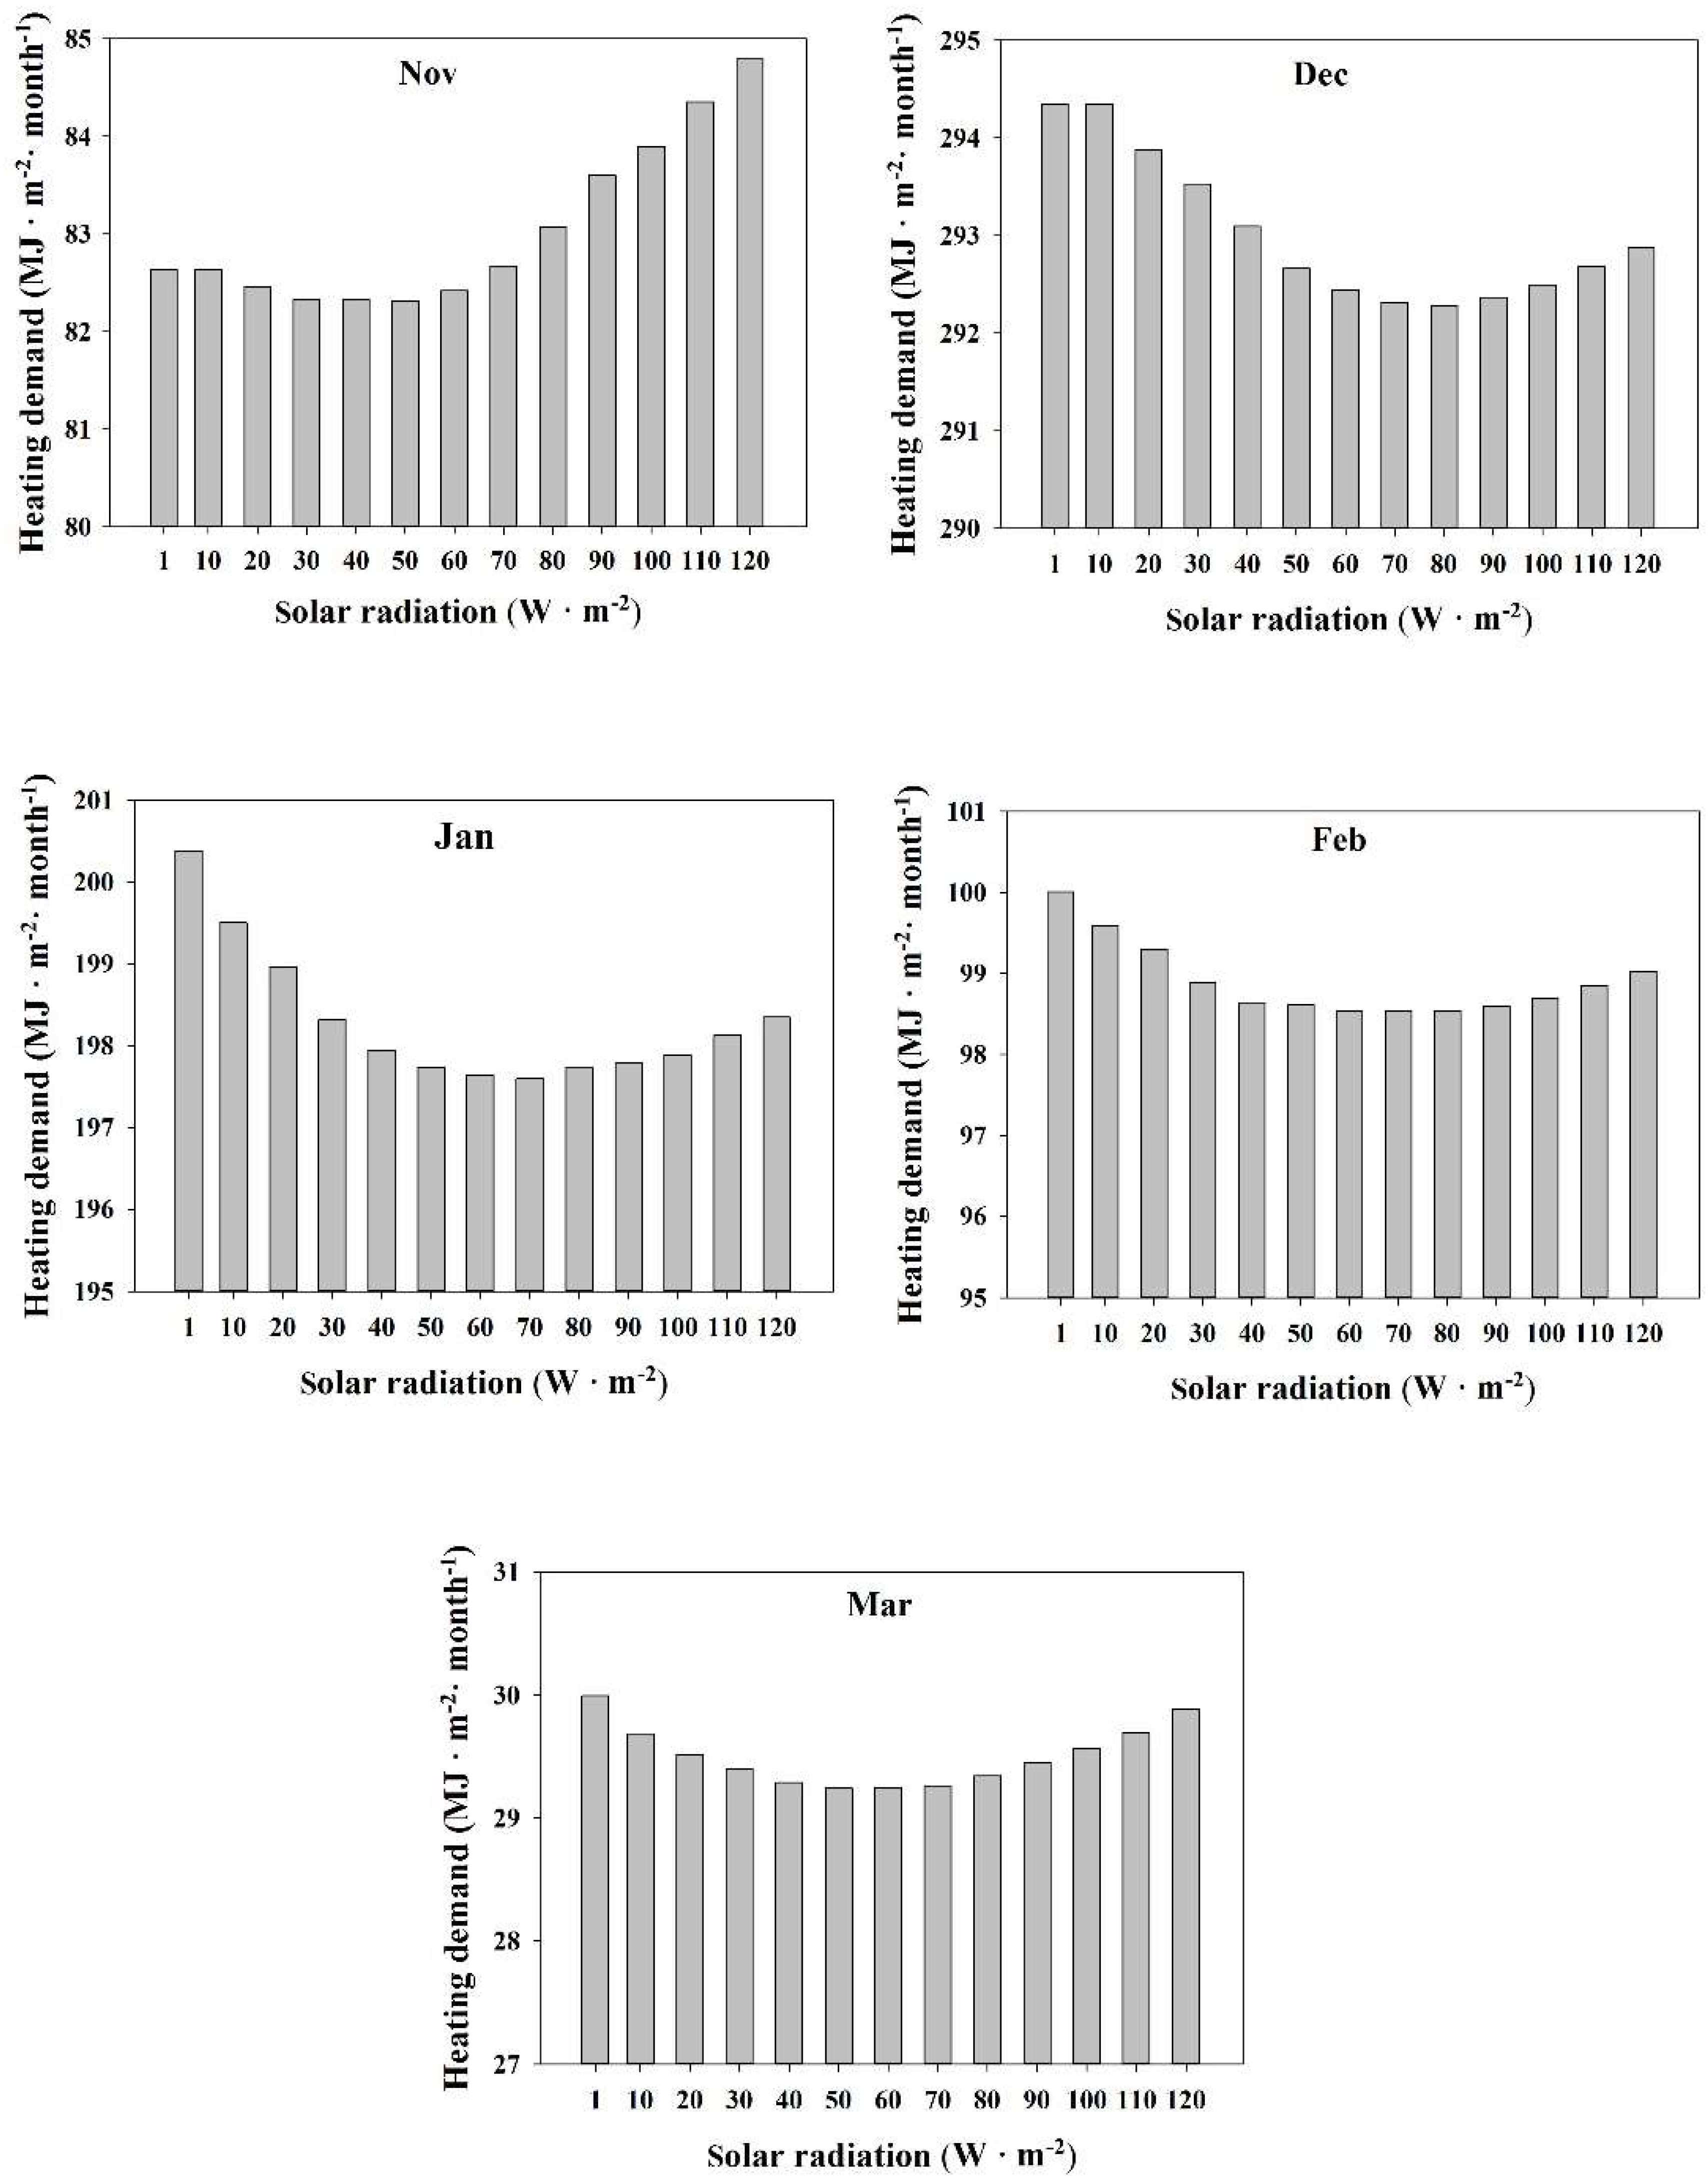
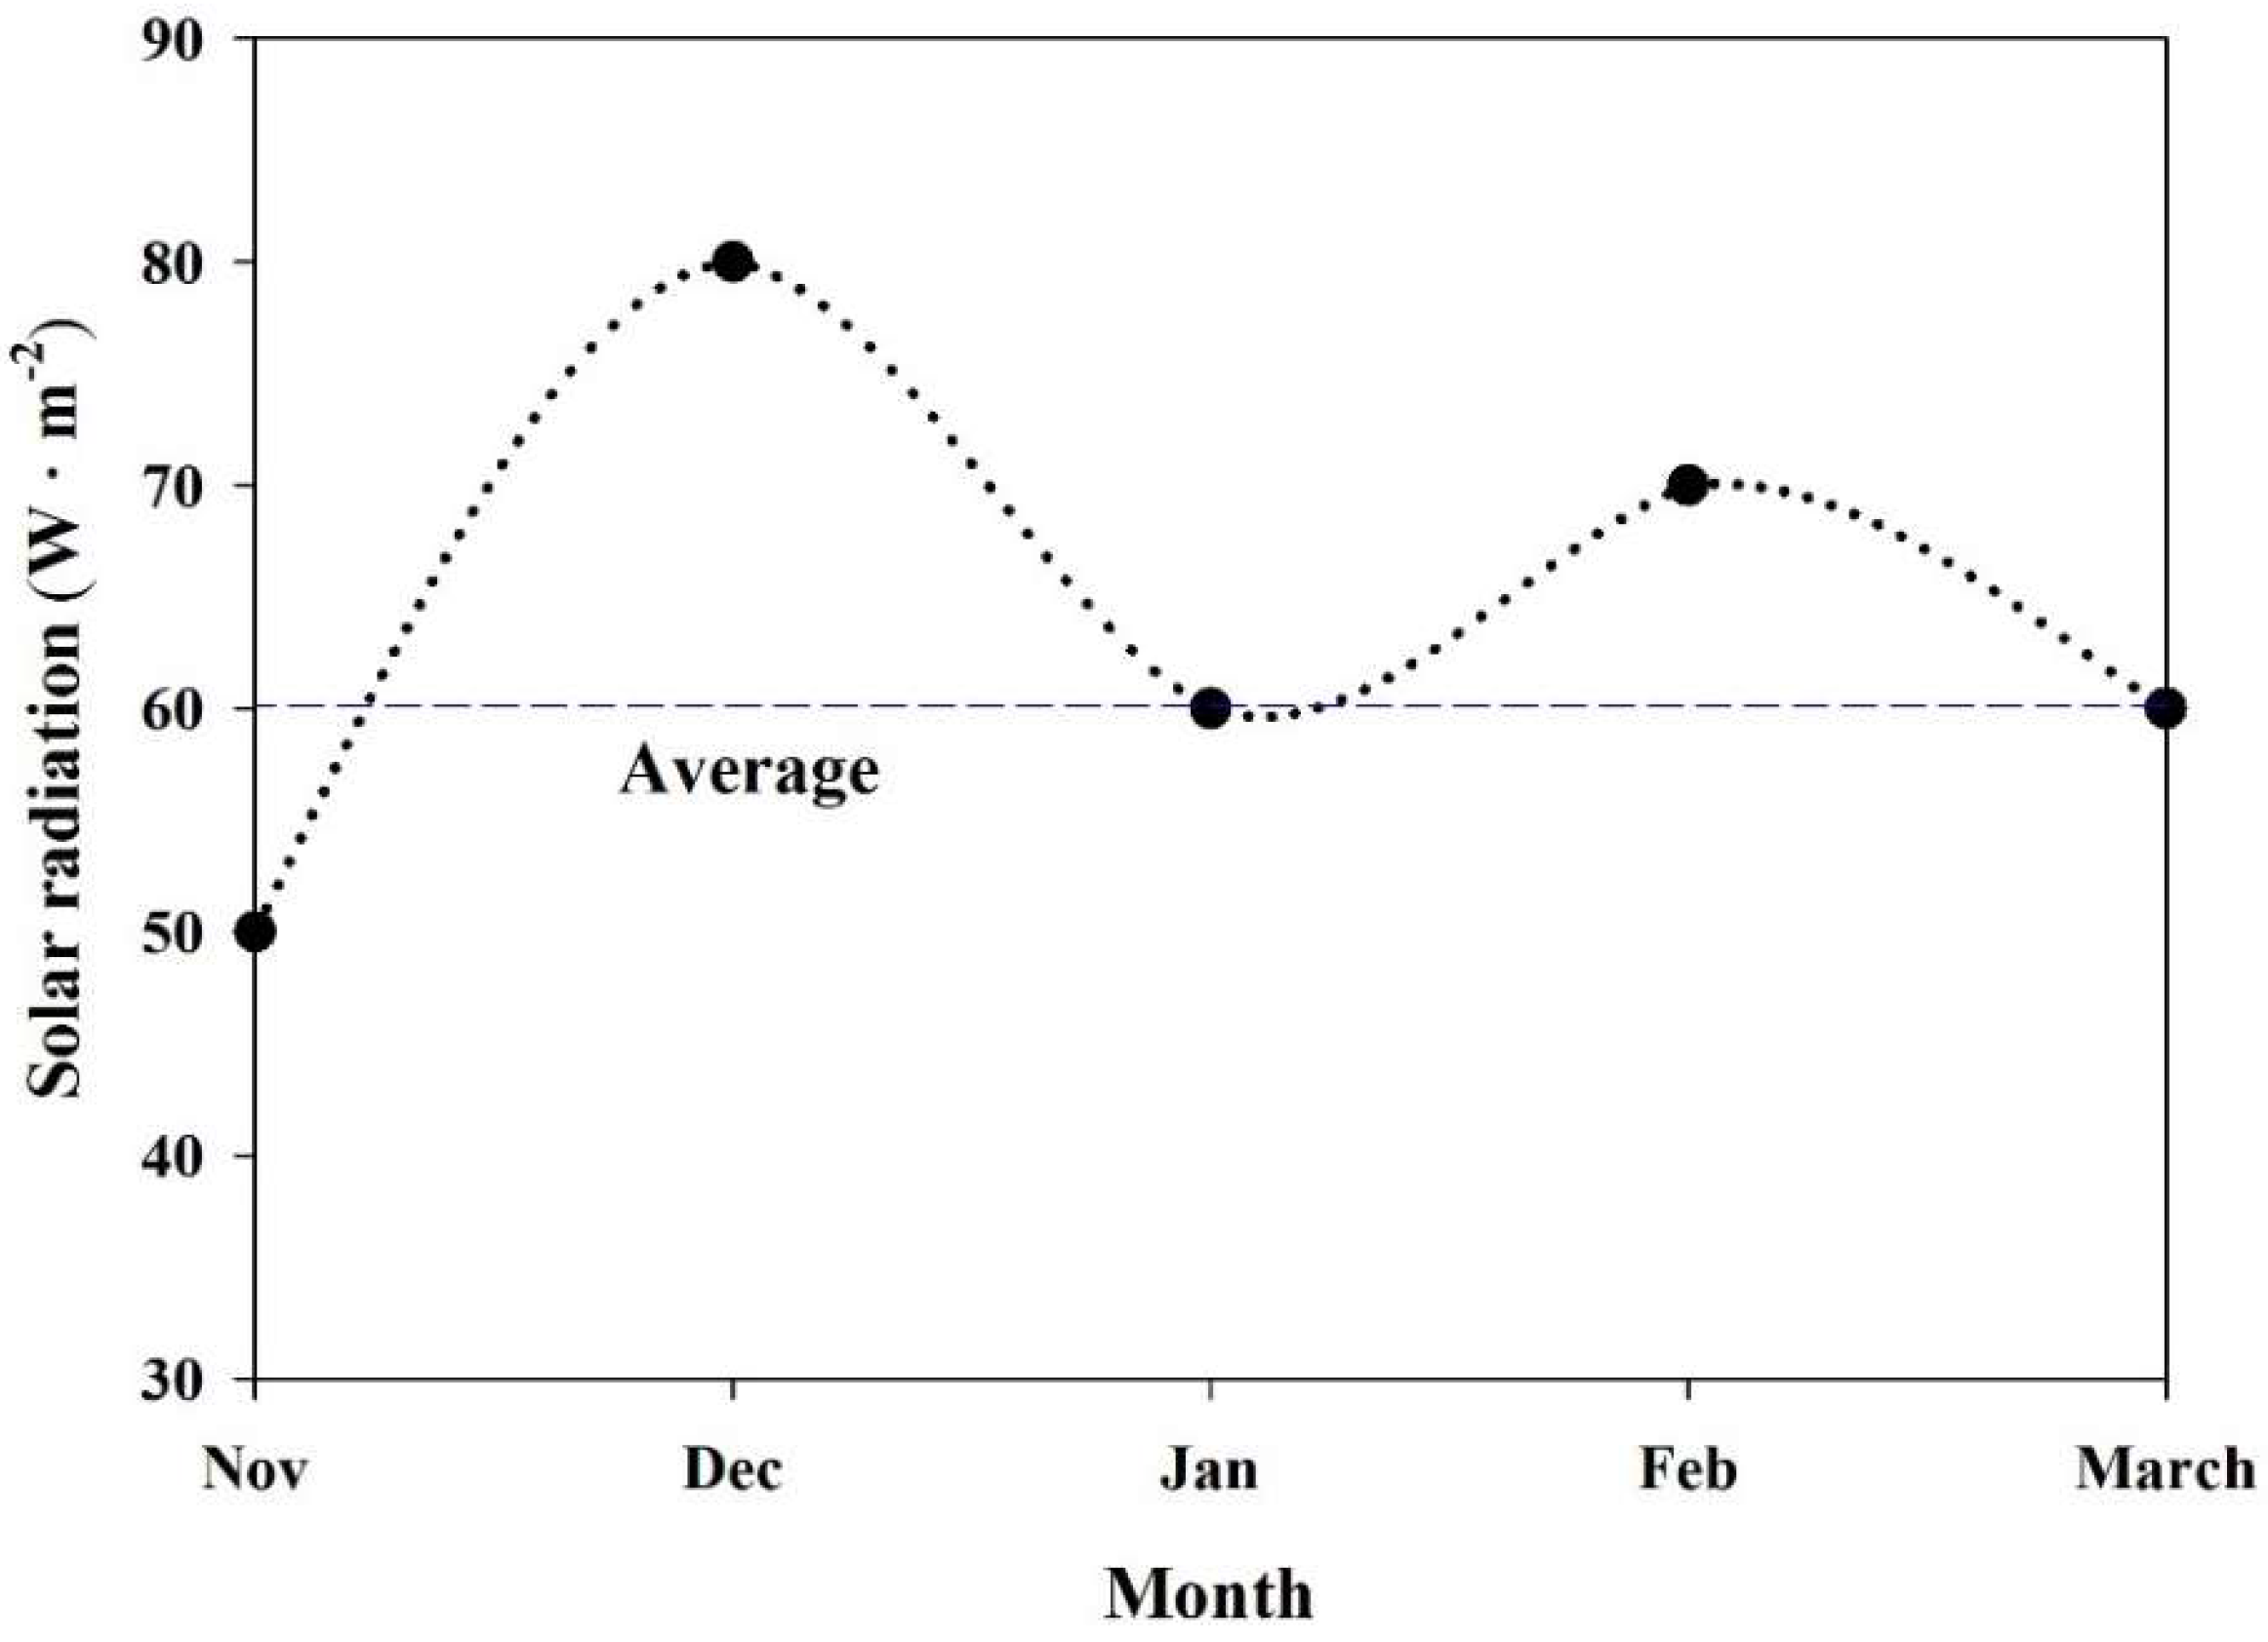
The screen controlling strategy was further optimized by calculating monthly heating demand of the greenhouse at different outside solar radiation setpoints, results for which are shown in Figure 16. The outcomes indicate that the solar radiation setpoint value was different each month. In accordance with these results, the optimum monthly outside solar radiation setpoints are shown in Figure 17; energy demand by using these setpoints is 699.5 MJ·m−2.
4. Conclusions
This study proposed a Building Energy Simulation (BES) model of greenhouse by using TRNSYS 18 program, which is capable of simulating transient thermal environment of a greenhouse. We calculated the energy requirement of the greenhouse influenced by different thermal screens and their control strategies of the greenhouse. The study also investigated different energy saving measures in the greenhouse. It was discovered that the most energy efficient night thermal screen is multi-layered. The results showed that the heating demand of greenhouses with multi-layer night thermal screens was 20%, 5.4%, and 13.5%, less than the Polyester, Luxous, Tempa, respectively. Moreover, the best strategy to control the opening and closing of thermal screen was found outside global radiation with optimum set-point of 60 W·m−2, as it showed least energy demand of 699.5 MJ·m−2.
TRNSYS 18 showed a high flexibility. The results encourage the adoption of the model when investigating greenhouse structural design with an underlying aim to reducing the energy costs of greenhouse agriculture, taking local environment and specific needs into consideration. The proposed model allows dynamic simulation of greenhouse systems as well as the ability to apply and analyze different control strategies, which can help to reduce operational cost with pre-design decisions. Growers can select the best thermal screen and controlling strategy based on the total energy saving potential. Screen producers can choose the energy efficient thermal screen on the basis of screen properties and provide information to the growers. All over the world, numerous kinds of thermal screens are available in the market; researchers can use the proposed model to analyze different thermal screens available in their local market.
Author Contributions
Conceptualization, A.R., H.W.L. and H.T.K.; Methodology, A.R., H.W.L.; Software, A.R., J.W.L.; Validation, J.W.L., W.H.N. and H.T.K.; Investigation, A.R.; Resources, W.H.L.; Writing-Original Draft Preparation, A.R.; Writing-Review & Editing, A.R., W.H.N., H.T.K. and H.W.L.; Supervision, H.W.L.
Funding
This work was supported by Korea Institute of Planning and Evaluation for Technology in Food, Agriculture, Forestry and Fisheries (IPET) through Agriculture, Food and Rural Affairs Research Center Support Program, funded by the Ministry of Agriculture, Food and Rural Affairs (MAFRA) (717001-7).
Conflicts of Interest
There is no conflict of interest regarding the publication of this research.
References
- Rasheed, A.; Lee, J.W.; Lee, H.W. Evaluation of overall heat transfer coefficient of different greenhouse thermal screens using building energy simulation. Prot. Hortic. Plant Fact. 2018, 27, 294–301. [Google Scholar] [CrossRef]
- Ghosal, M.K.; Tiwari, G.N. Mathematical modeling for greenhouse heating by using thermal curtain and geothermal energy. Sol. Energy 2004, 76, 603–613. [Google Scholar] [CrossRef]
- Rasheed, A.; Lee, J.W.; Lee, H.W. Development of a model to calculate the overall heat transfer coefficient of greenhouse covers. Span. J. Agric. Res. 2017, 15, 1–11. [Google Scholar] [CrossRef]
- Kassai, M. Experimental investigation of carbon dioxide cross-contamination in sorption energy recovery wheel in ventilation system. Build. Serv. Eng. Res. Technol. 2018, 39, 463–474. [Google Scholar] [CrossRef]
- Kassai, M.; Simonson, C.J. Performance investigation of liquid-to-air membrane energy exchanger under low solution/air heat capacity rates ratio conditions. Build. Serv. Eng. Res. Technol. 2014, 36, 535–545. [Google Scholar] [CrossRef]
- Kassai, M.; Al-Hyari, L. Investigation of ventilation energy recovery with polymer membrane material-based counter-flow energy exchanger for nearly zero-energy buildings. Energies 2019, 12, 1727. [Google Scholar] [CrossRef]
- Hemming, S.; Romero, E.B.; Mohammadkhani, V.; van Breugel, B. Energy Saving Screen Materials: Measurement Method of Radiation Exchange, Air Permeability and Humidity Transport and a Calculation Method for Energy Saving; Wageningen University & Research, BU Greenhouse Horticulture: Bleiswijk, The Netherlands, 2017. [Google Scholar]
- Shukla, A.; Tiwari, G.N.; Sodha, M.S. Thermal modeling for greenhouse heating by using thermal curtain and an earth–air heat exchanger. Build. Environ. 2006, 41, 843–850. [Google Scholar] [CrossRef]
- Shakir, S.M.; Farhan, A.A. Movable thermal screen for saving energy inside the greenhouse. Assoc. Arab Univ. J. Eng. Sci. 2019, 26, 106–112. [Google Scholar] [CrossRef]
- Kittas, C.; Katsoulas, N.; Baille, A. Influence of an aluminized thermal screen on greenhouse microclimate and canopy energy balance. Trans. ASAE 2003, 46, 1653–1663. [Google Scholar] [CrossRef]
- Teitel, M.; Barak, M.; Antler, A. Effect of cyclic heating and a thermal screen on the nocturnal heat loss and microclimate of a greenhouse. Biosyst. Eng. 2009, 102, 162–170. [Google Scholar] [CrossRef]
- Park, B.S.; Kang, T.H.; Han, C.S. Analysis of heating characteristics using aluminum multi-layer curtain for protected horticulture greenhouses. J. Biosyst. Eng. 2015, 40, 193–200. [Google Scholar] [CrossRef]
- Taki, M.; Ajabshirchi, Y.; Ranjbar, S.F.; Rohani, A.; Matloobi, M. Modeling and experimental validation of heat transfer and energy consumption in an innovative greenhouse structure. Inf. Process. Agric. 2016, 3, 157–174. [Google Scholar] [CrossRef] [Green Version]
- Kim, H.-K.; Kang, G.-C.; Moon, J.-P.; Lee, T.-S.; Oh, S.-S.J.E. Estimation of thermal performance and heat loss in plastic greenhouses with and without thermal curtains. Energies 2018, 11, 578. [Google Scholar] [CrossRef]
- Diop, S.; Lee, J.W.; Na, W.H.; Lee, H.W. Overall heat transfer coefficient measurement of covering materials with thermal screens for greenhouse using the hot box method. J. Korean Soc. Agric. Eng. 2012, 54, 1–7. [Google Scholar]
- Diop, S.; Lee, J.W.; Lee, H.W. Measurement and comparison of overall heat transfer coefficients for greenhouse covering materials with thermal screens. J. Korean Soc. Agric. Eng. 2014, 56, 41–51. [Google Scholar]
- Lee, J.W.; Kim, D.K.; Lee, H.W. A numerical study for calculation of overall heat transfer coefficient of double layers covering and insulation material for greenhouse. Curr. Res. Agric. Life Sci. 2015, 33, 41–47. [Google Scholar]
- Rasheed, A.; Lee, J.; Lee, H. Development and optimization of a building energy simulation model to study the effect of greenhouse design parameters. Energies 2018, 11, 2001. [Google Scholar] [CrossRef]
- Chargui, R.; Sammouda, H.; Farhat, A. Geothermal heat pump in heating mode: Modeling and simulation on trnsys. Int. J. Refrig. 2012, 35, 1824–1832. [Google Scholar] [CrossRef]
- Klein, S.A. Trnsys, a Transient System Simulation Program; Solar Energy Laborataory, University of Wisconsin-Madison: Madison, WI, USA, 2012. [Google Scholar]
- Carlini, M.; Monarca, D.; Biondi, P.; Honorati, T.; Castellucci, S. A simulation model for the exploitation of geothermal energy for a greenhouse in the viterbo province. In Work Safety and Risk Prevention in Agro-Food and Forest Systems, Proceedings of the International Conference Ragusa SHWA, Ragusa, Italy, 16–18 September 2010; SHWA: Ragusa, Italy, 2010; pp. 16–18. [Google Scholar]
- Rasheed, A.; Lee, J.W.; Lee, H.W. A review of greenhouse energy management by using building energy simulation. Prot. Hortic. Plant Fact. 2015, 24, 317–325. [Google Scholar] [CrossRef]
- Rafiq, A.; Na, W.H.; Rasheed, A.; Lee, J.W.; Lee, H.W. Measurement of long-wave radiometric properties of shading nets and thermal screens. Pak. J. Agric. Sci. 2019. (In process) [Google Scholar]
- Valera, M.D.; Molina, A.F.; Alvarez, M.A. Protocolo de Auditoría Energética en Invernaderos. Auditoría Energética de un Invernadero para Cultivo de Flor Cortada en Mendigorría; Instituto para la diversificacion y ahorro de la energia: Madrid, Spain, 2008. [Google Scholar]
- Lam, J.C.; Hui, S.C.M. Sensitivity analysis of energy performance of office buildings. Build. Environ. 1996, 31, 27–39. [Google Scholar] [CrossRef]
- Yang, S.-H.; Son, J.-E.; Lee, S.-D.; Cho, S.-I.; Araghi, A.A.; Rhee, J.-Y. Surplus thermal energy model of greenhouses and coefficient analysis for effective utilization. Span. J. Agric. Res. 2016, 14, 4. [Google Scholar] [CrossRef] [Green Version]
- Shukla, A.; Tiwari, G.; Sodha, M. Energy conservation potential of inner thermal curtain in an even span greenhouse. Trends Appl. Sci. Res. 2006, 1, 542–552. [Google Scholar]
- Ahamed, M.S.; Guo, H.; Tanino, K. Sensitivity analysis of csgheat model for estimation of heating consumption in a chinese-style solar greenhouse. Comput. Electron. Agric. 2018, 154, 99–111. [Google Scholar] [CrossRef]
- Seginer, I.; Albright, L.D. Rational operation of greenhouse thermal-curtains. Trans. ASAE 1980, 23, 1240–1245. [Google Scholar] [CrossRef]
- Bailey, B.J. Control strategies to enhance the performance of greenhouse thermal screens. J. Agric. Eng. Res. 1988, 40, 187–198. [Google Scholar] [CrossRef]
Figure 1.
Geographic location of experimental greenhouse site.

Figure 2.
Experimental greenhouse at Daegu (latitude 35.53° N, longitude 128.36° E).

Figure 3.
Greenhouse dimensions and positions of sensors [S (solar radiation), T (temperature & humidity), W1 (Wind speed), and W2 (Wind direction)] in the experimental greenhouse.
Figure 3.
Greenhouse dimensions and positions of sensors [S (solar radiation), T (temperature & humidity), W1 (Wind speed), and W2 (Wind direction)] in the experimental greenhouse.

Figure 4.
Temperature and solar radiation outside the greenhouse during the winter season of November 2017 to March 2018.
Figure 4.
Temperature and solar radiation outside the greenhouse during the winter season of November 2017 to March 2018.

Figure 5.
QTM-500 complete measurement setup.

Figure 6.
Building Energy Simulation (BES) modeling flow chart using TRNSYS18.

Figure 7.
3-D model of field greenhouse using Transys3d.

Figure 8.
TRNSYS Simulation Studio greenhouse model.
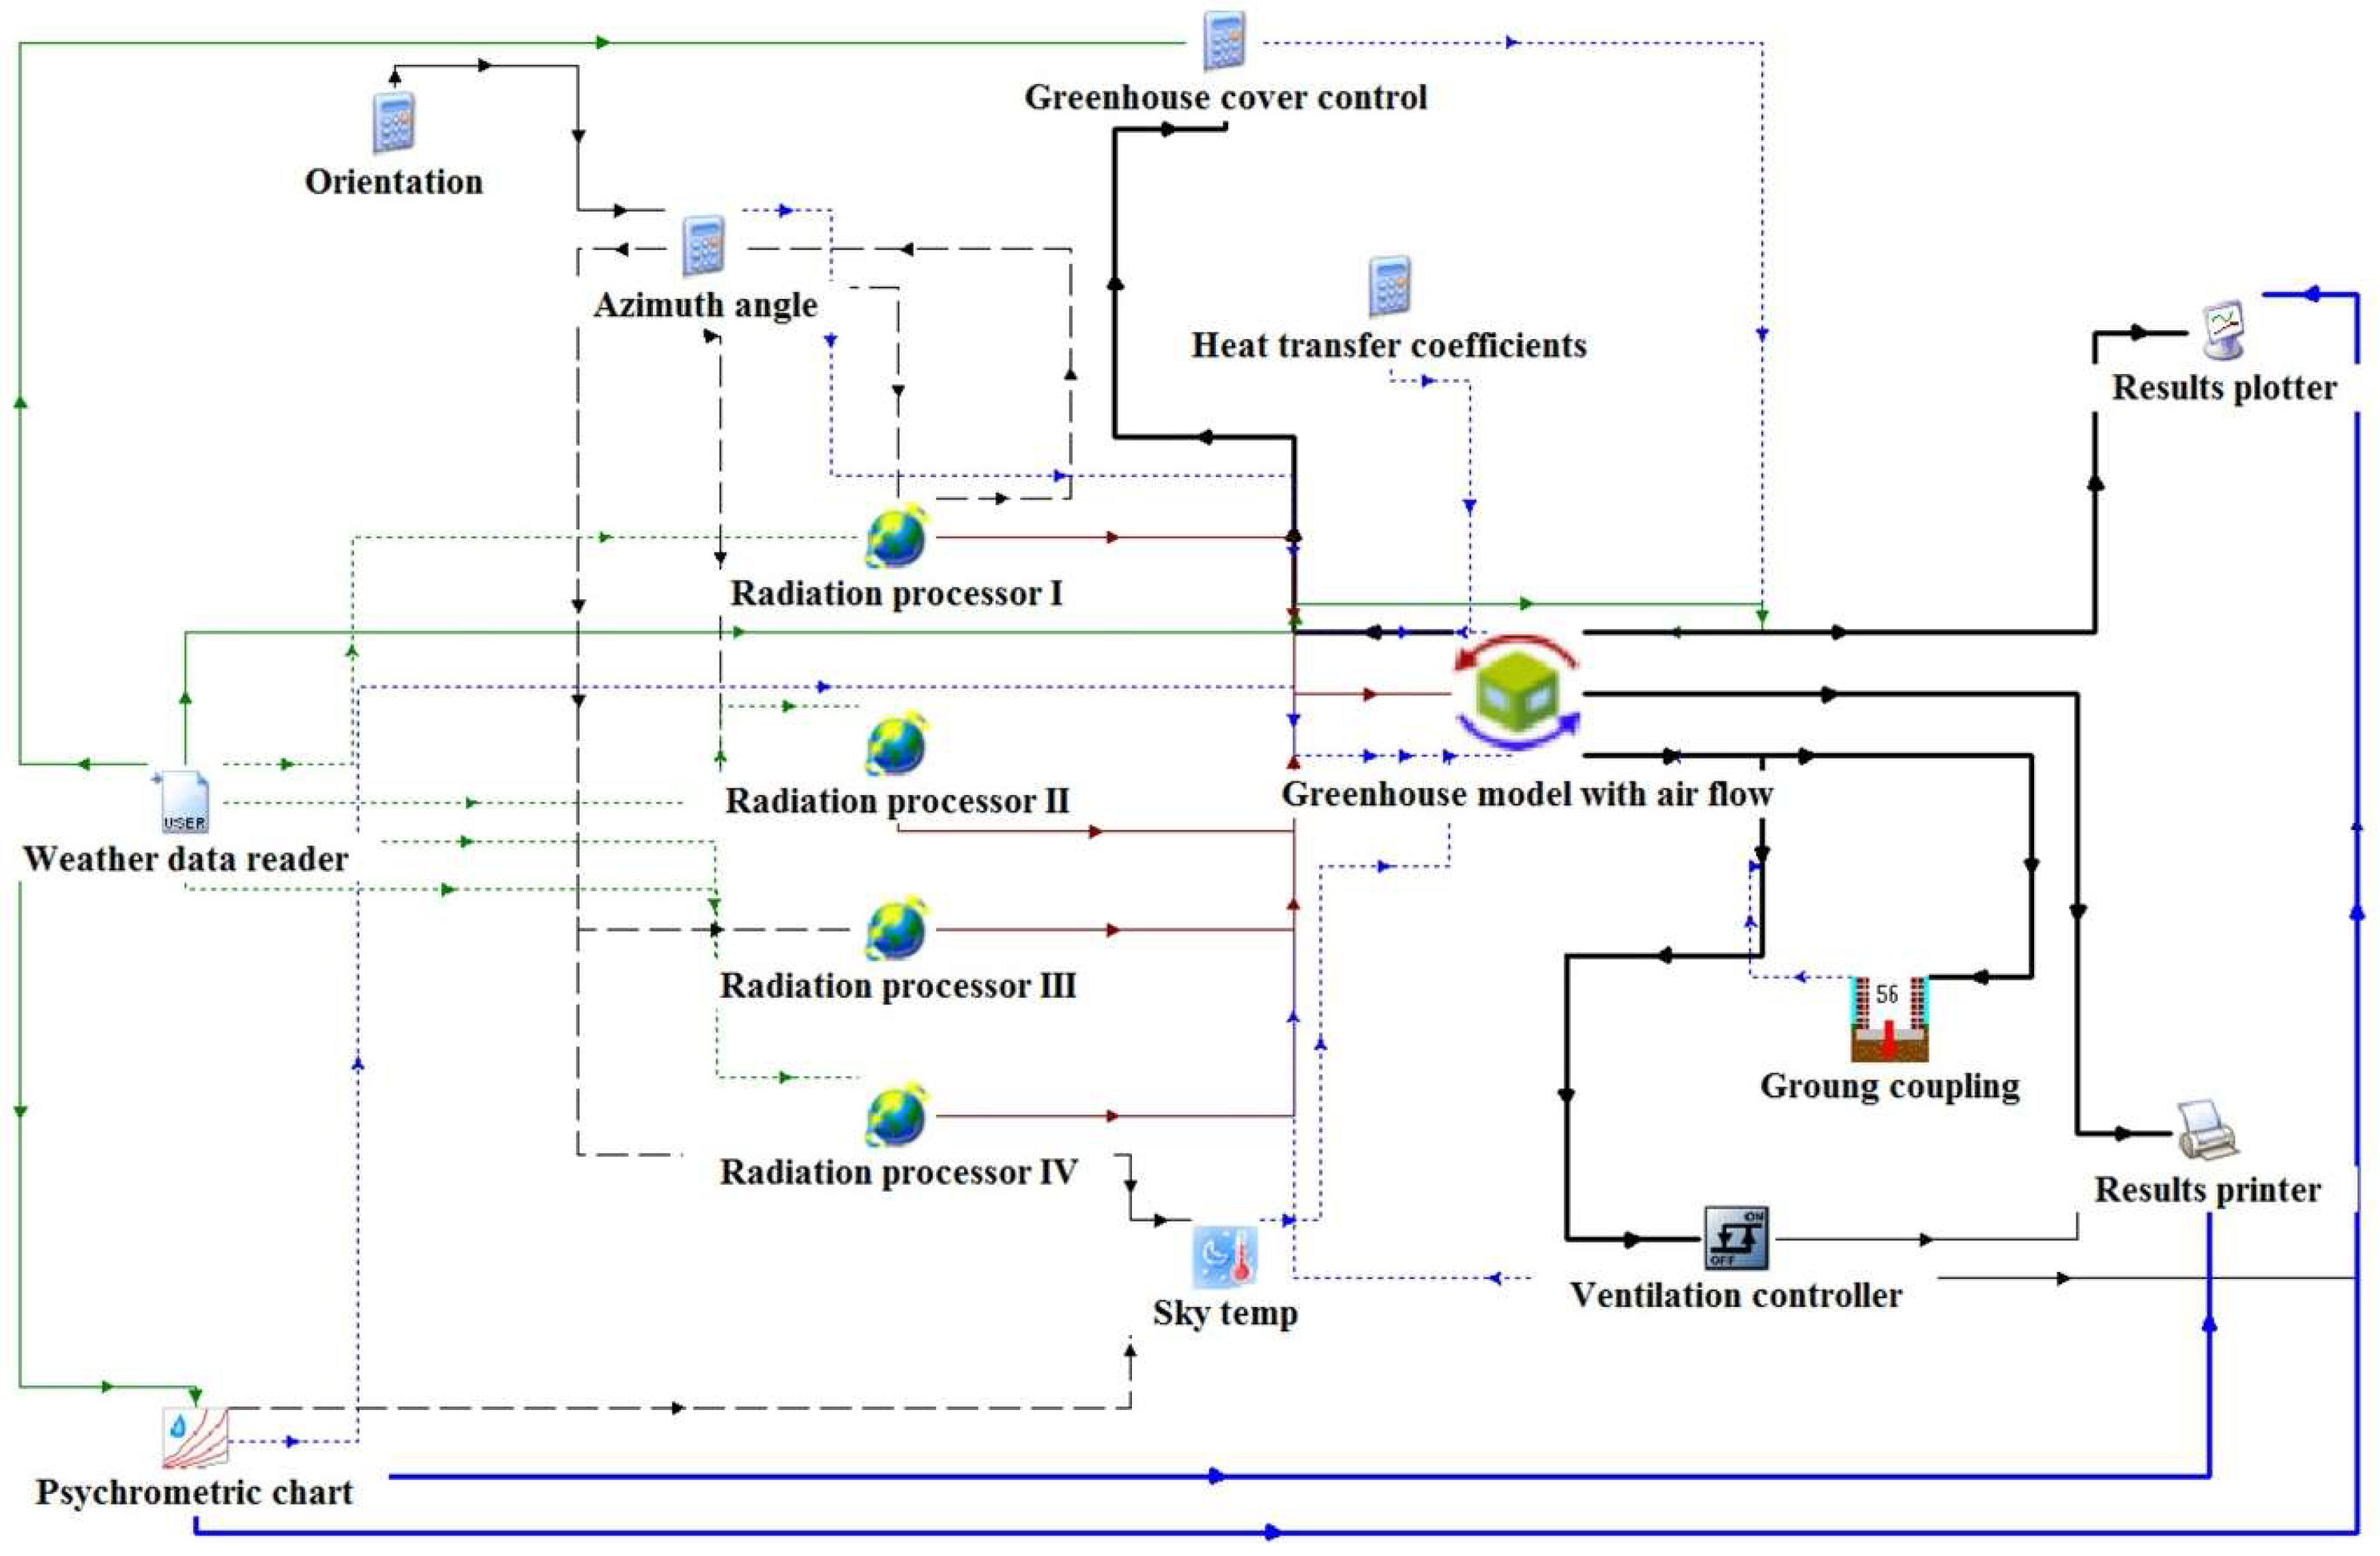
Figure 9.
Computed versus. measured internal air temperature of greenhouse with temperature-controlled vents and heating setpoint.
Figure 9.
Computed versus. measured internal air temperature of greenhouse with temperature-controlled vents and heating setpoint.
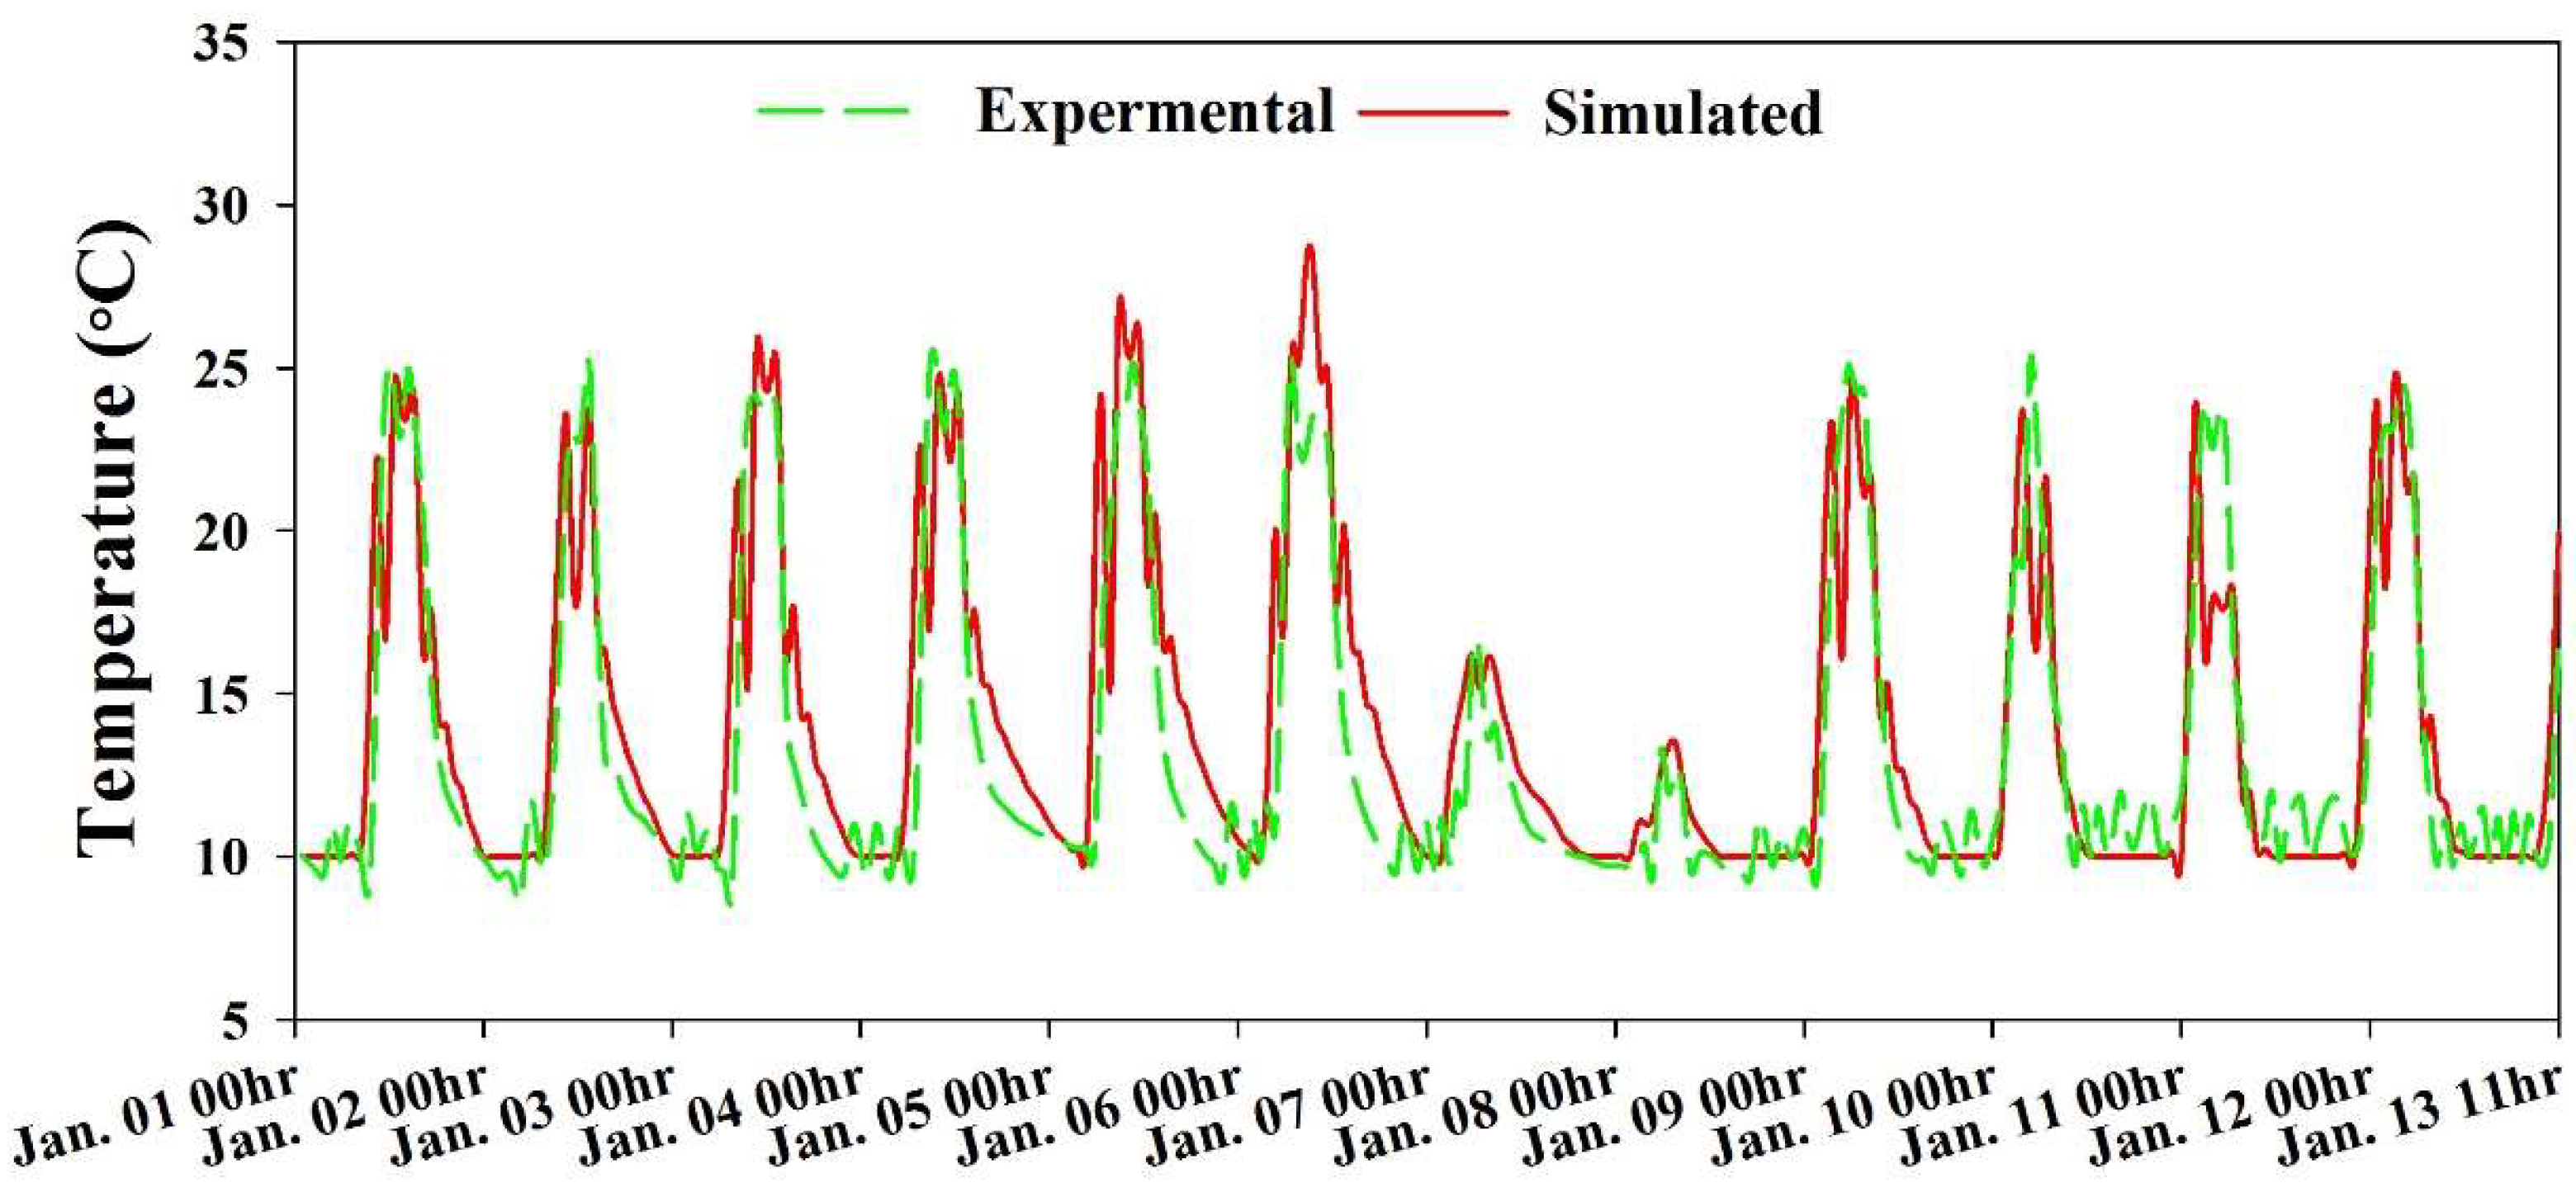
Figure 10.
Computed versus. measured internal air temperature of greenhouse with temperature controlled naturally ventilation and thermal screen.
Figure 10.
Computed versus. measured internal air temperature of greenhouse with temperature controlled naturally ventilation and thermal screen.

Figure 11.
Annual heating demand of different thermal screens.
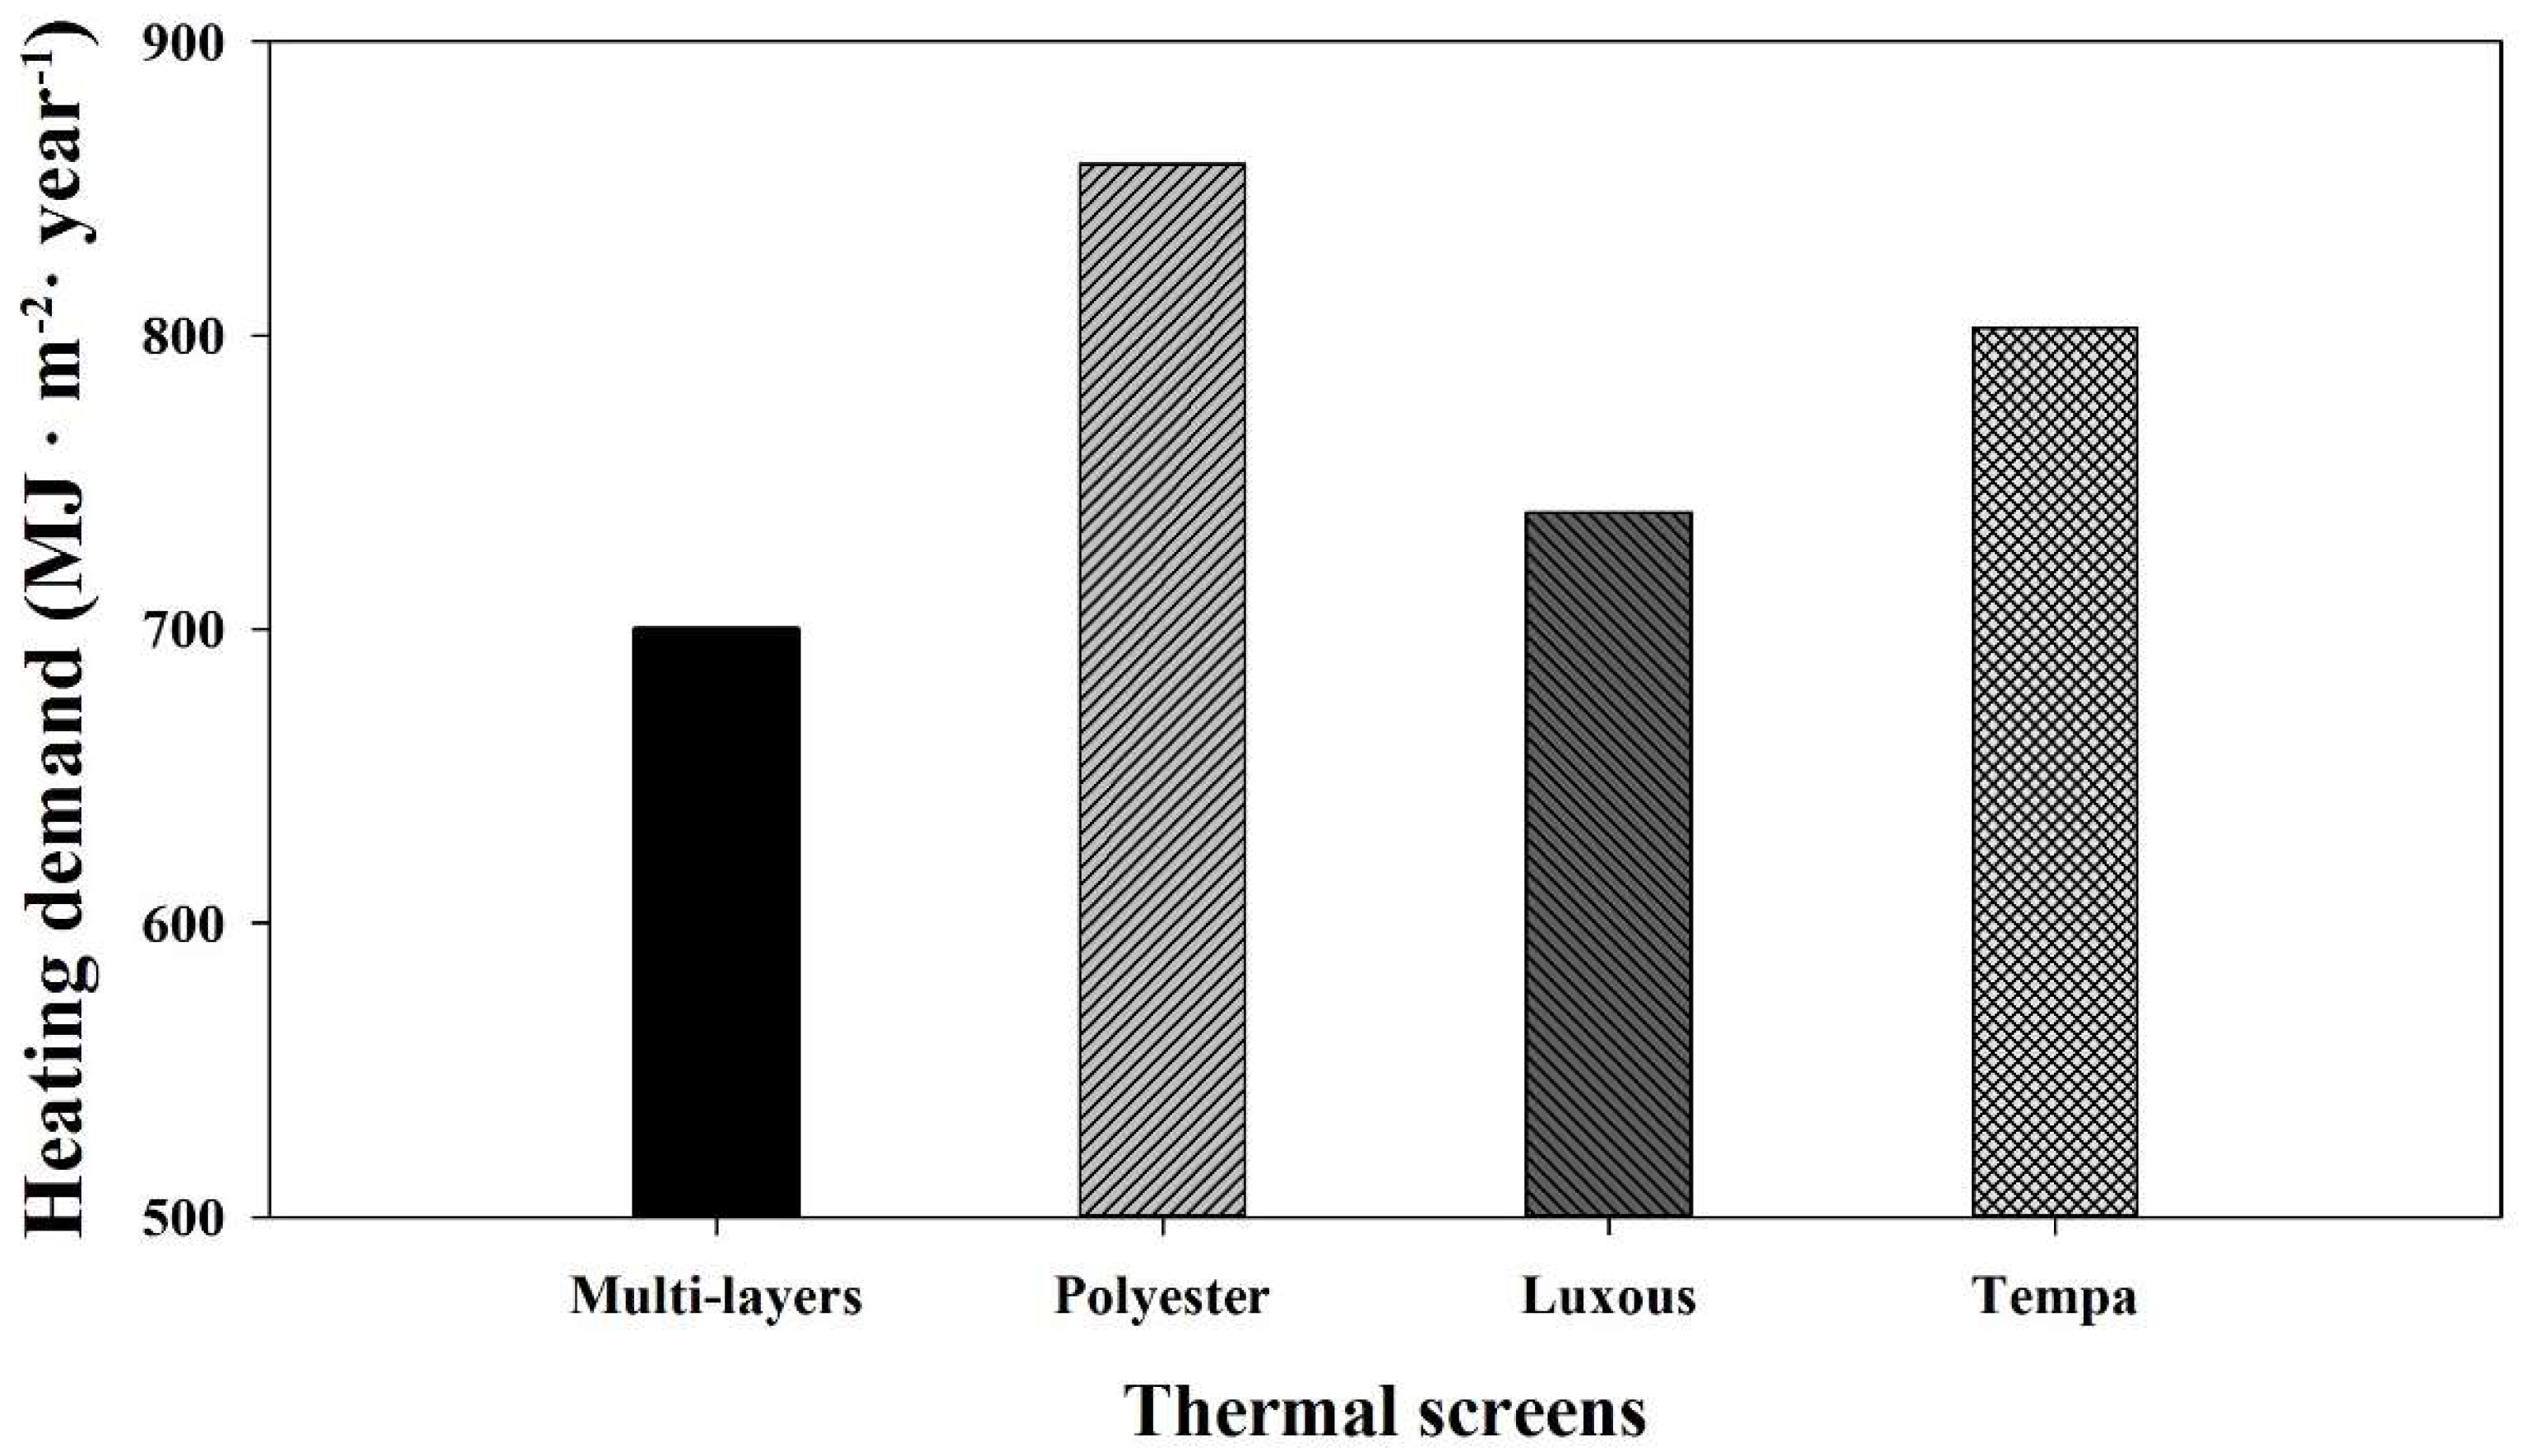
Figure 12.
Energy saving potential of different thermal screens.
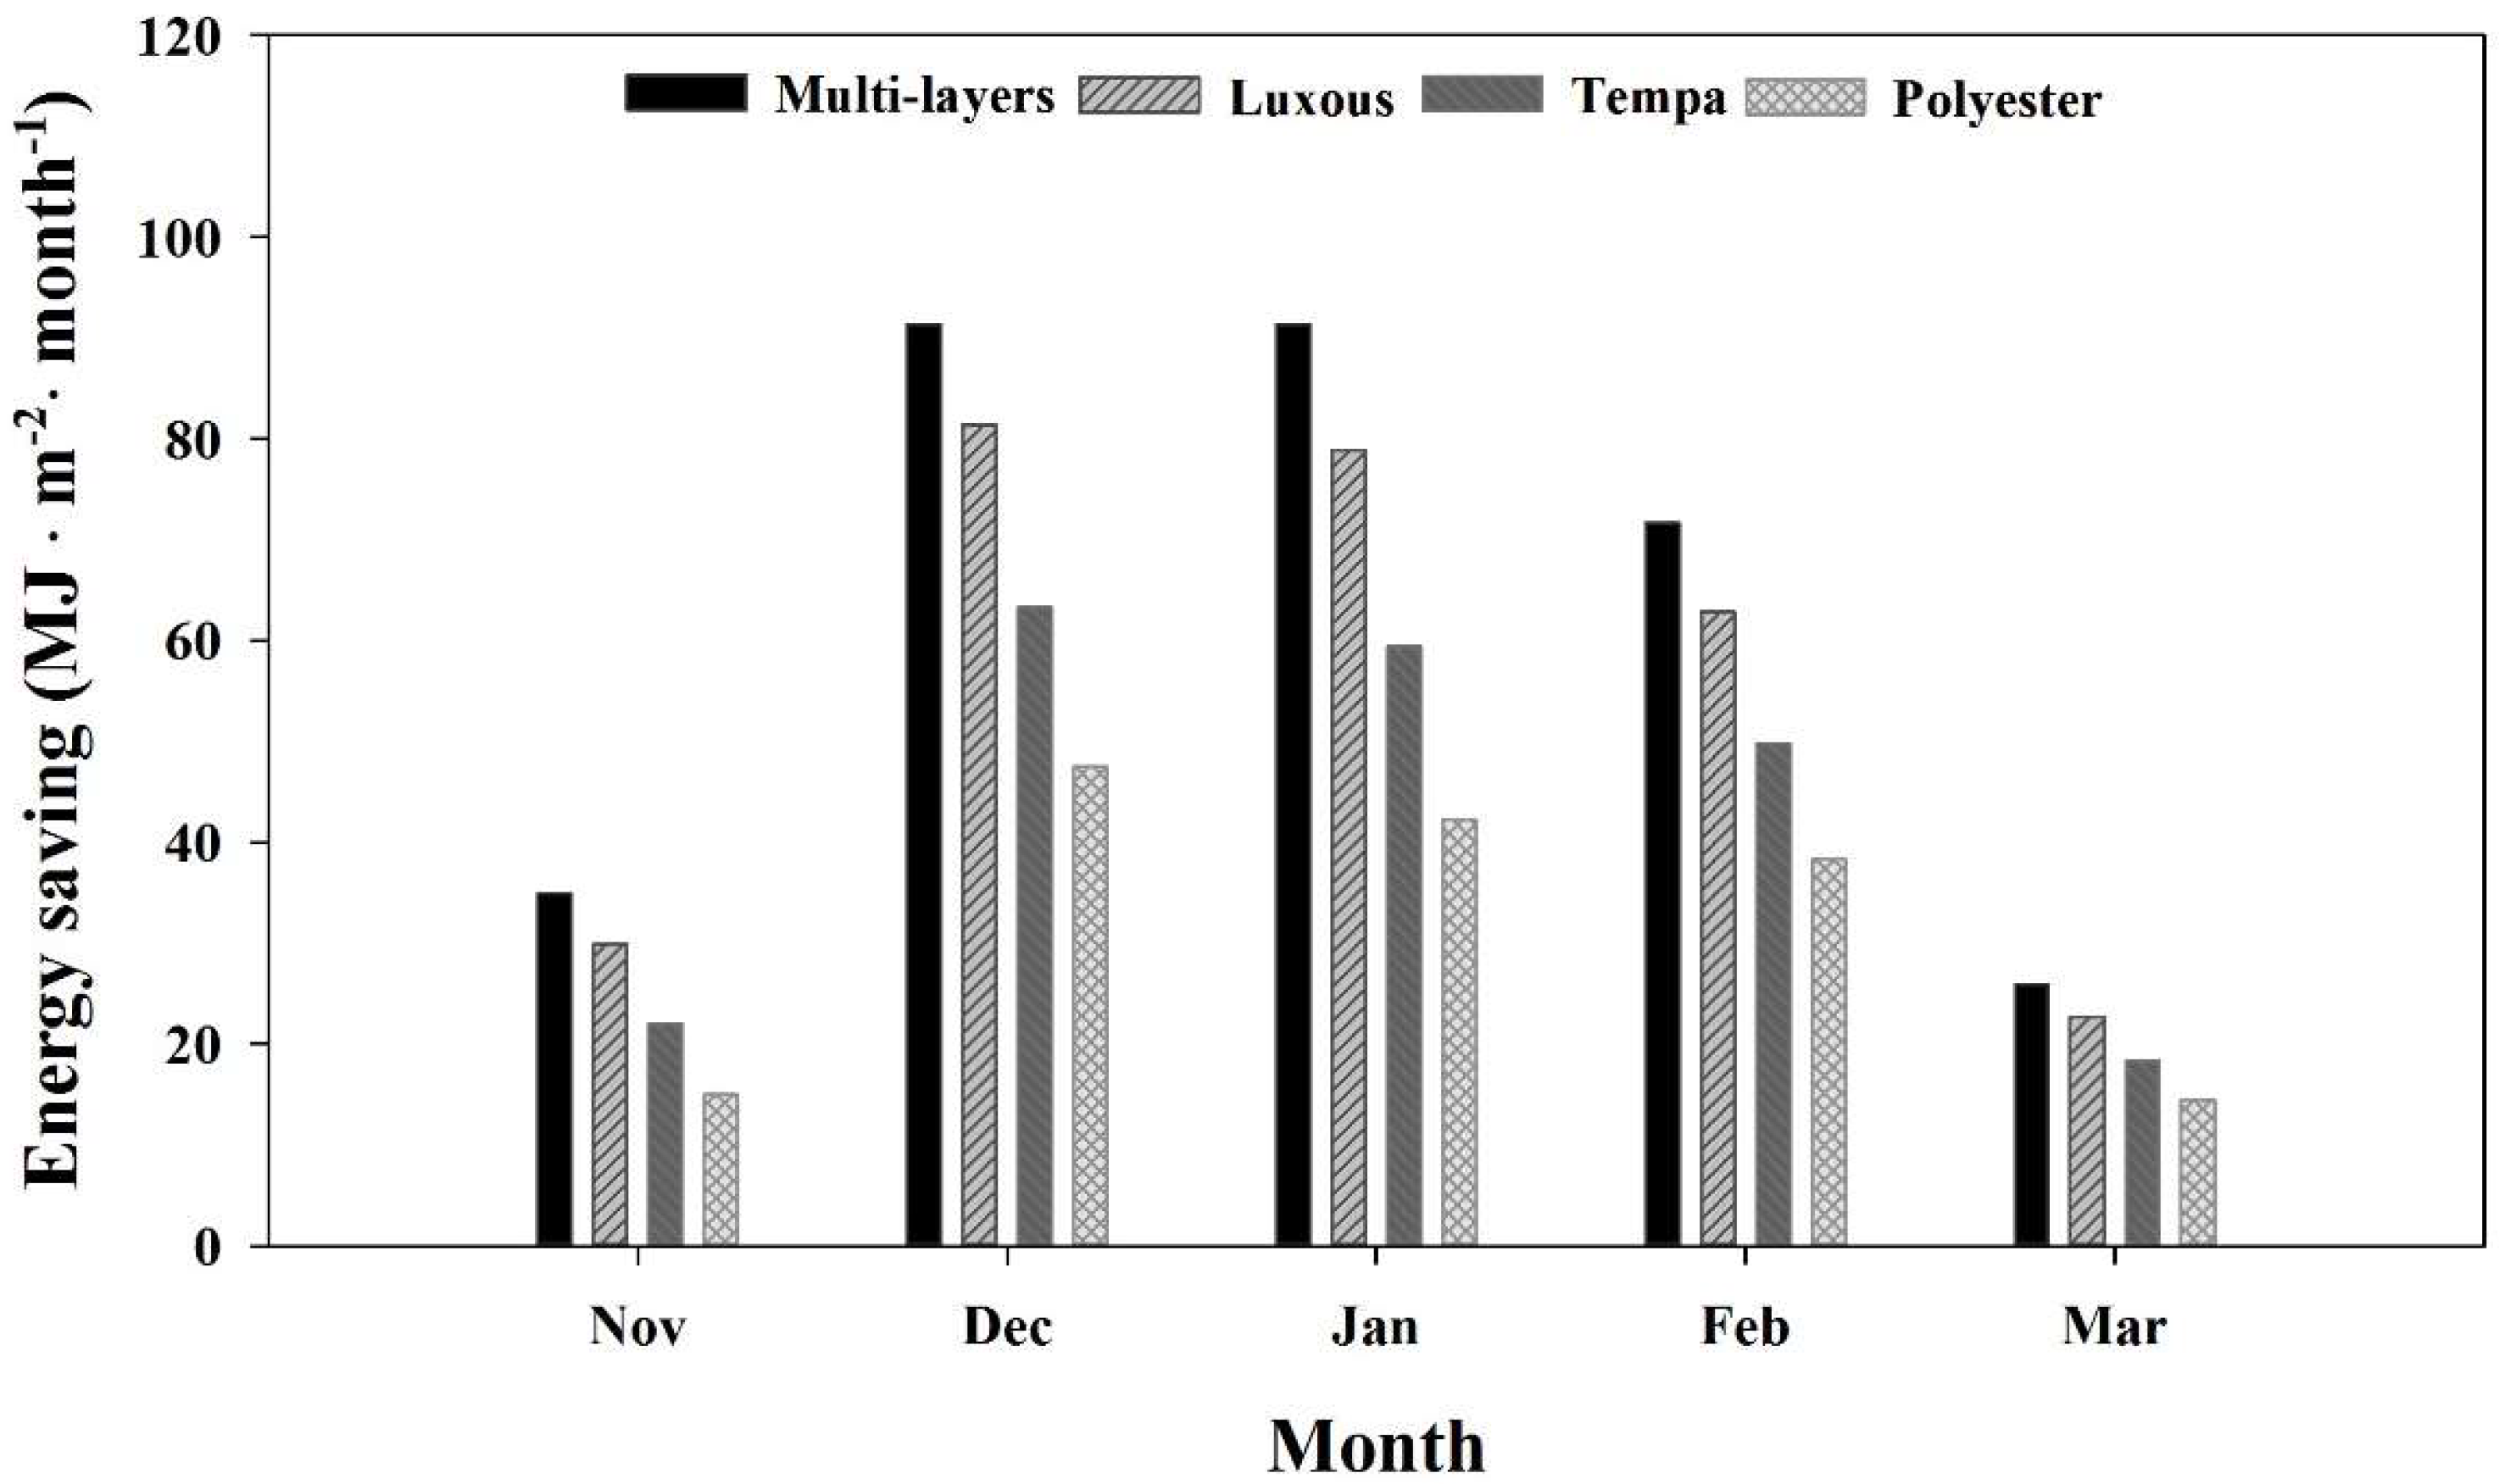
Figure 13.
Sensitivity analysis of thermal conductance of thermal screens (a) heating demand (b) sensitivity coefficient.
Figure 13.
Sensitivity analysis of thermal conductance of thermal screens (a) heating demand (b) sensitivity coefficient.
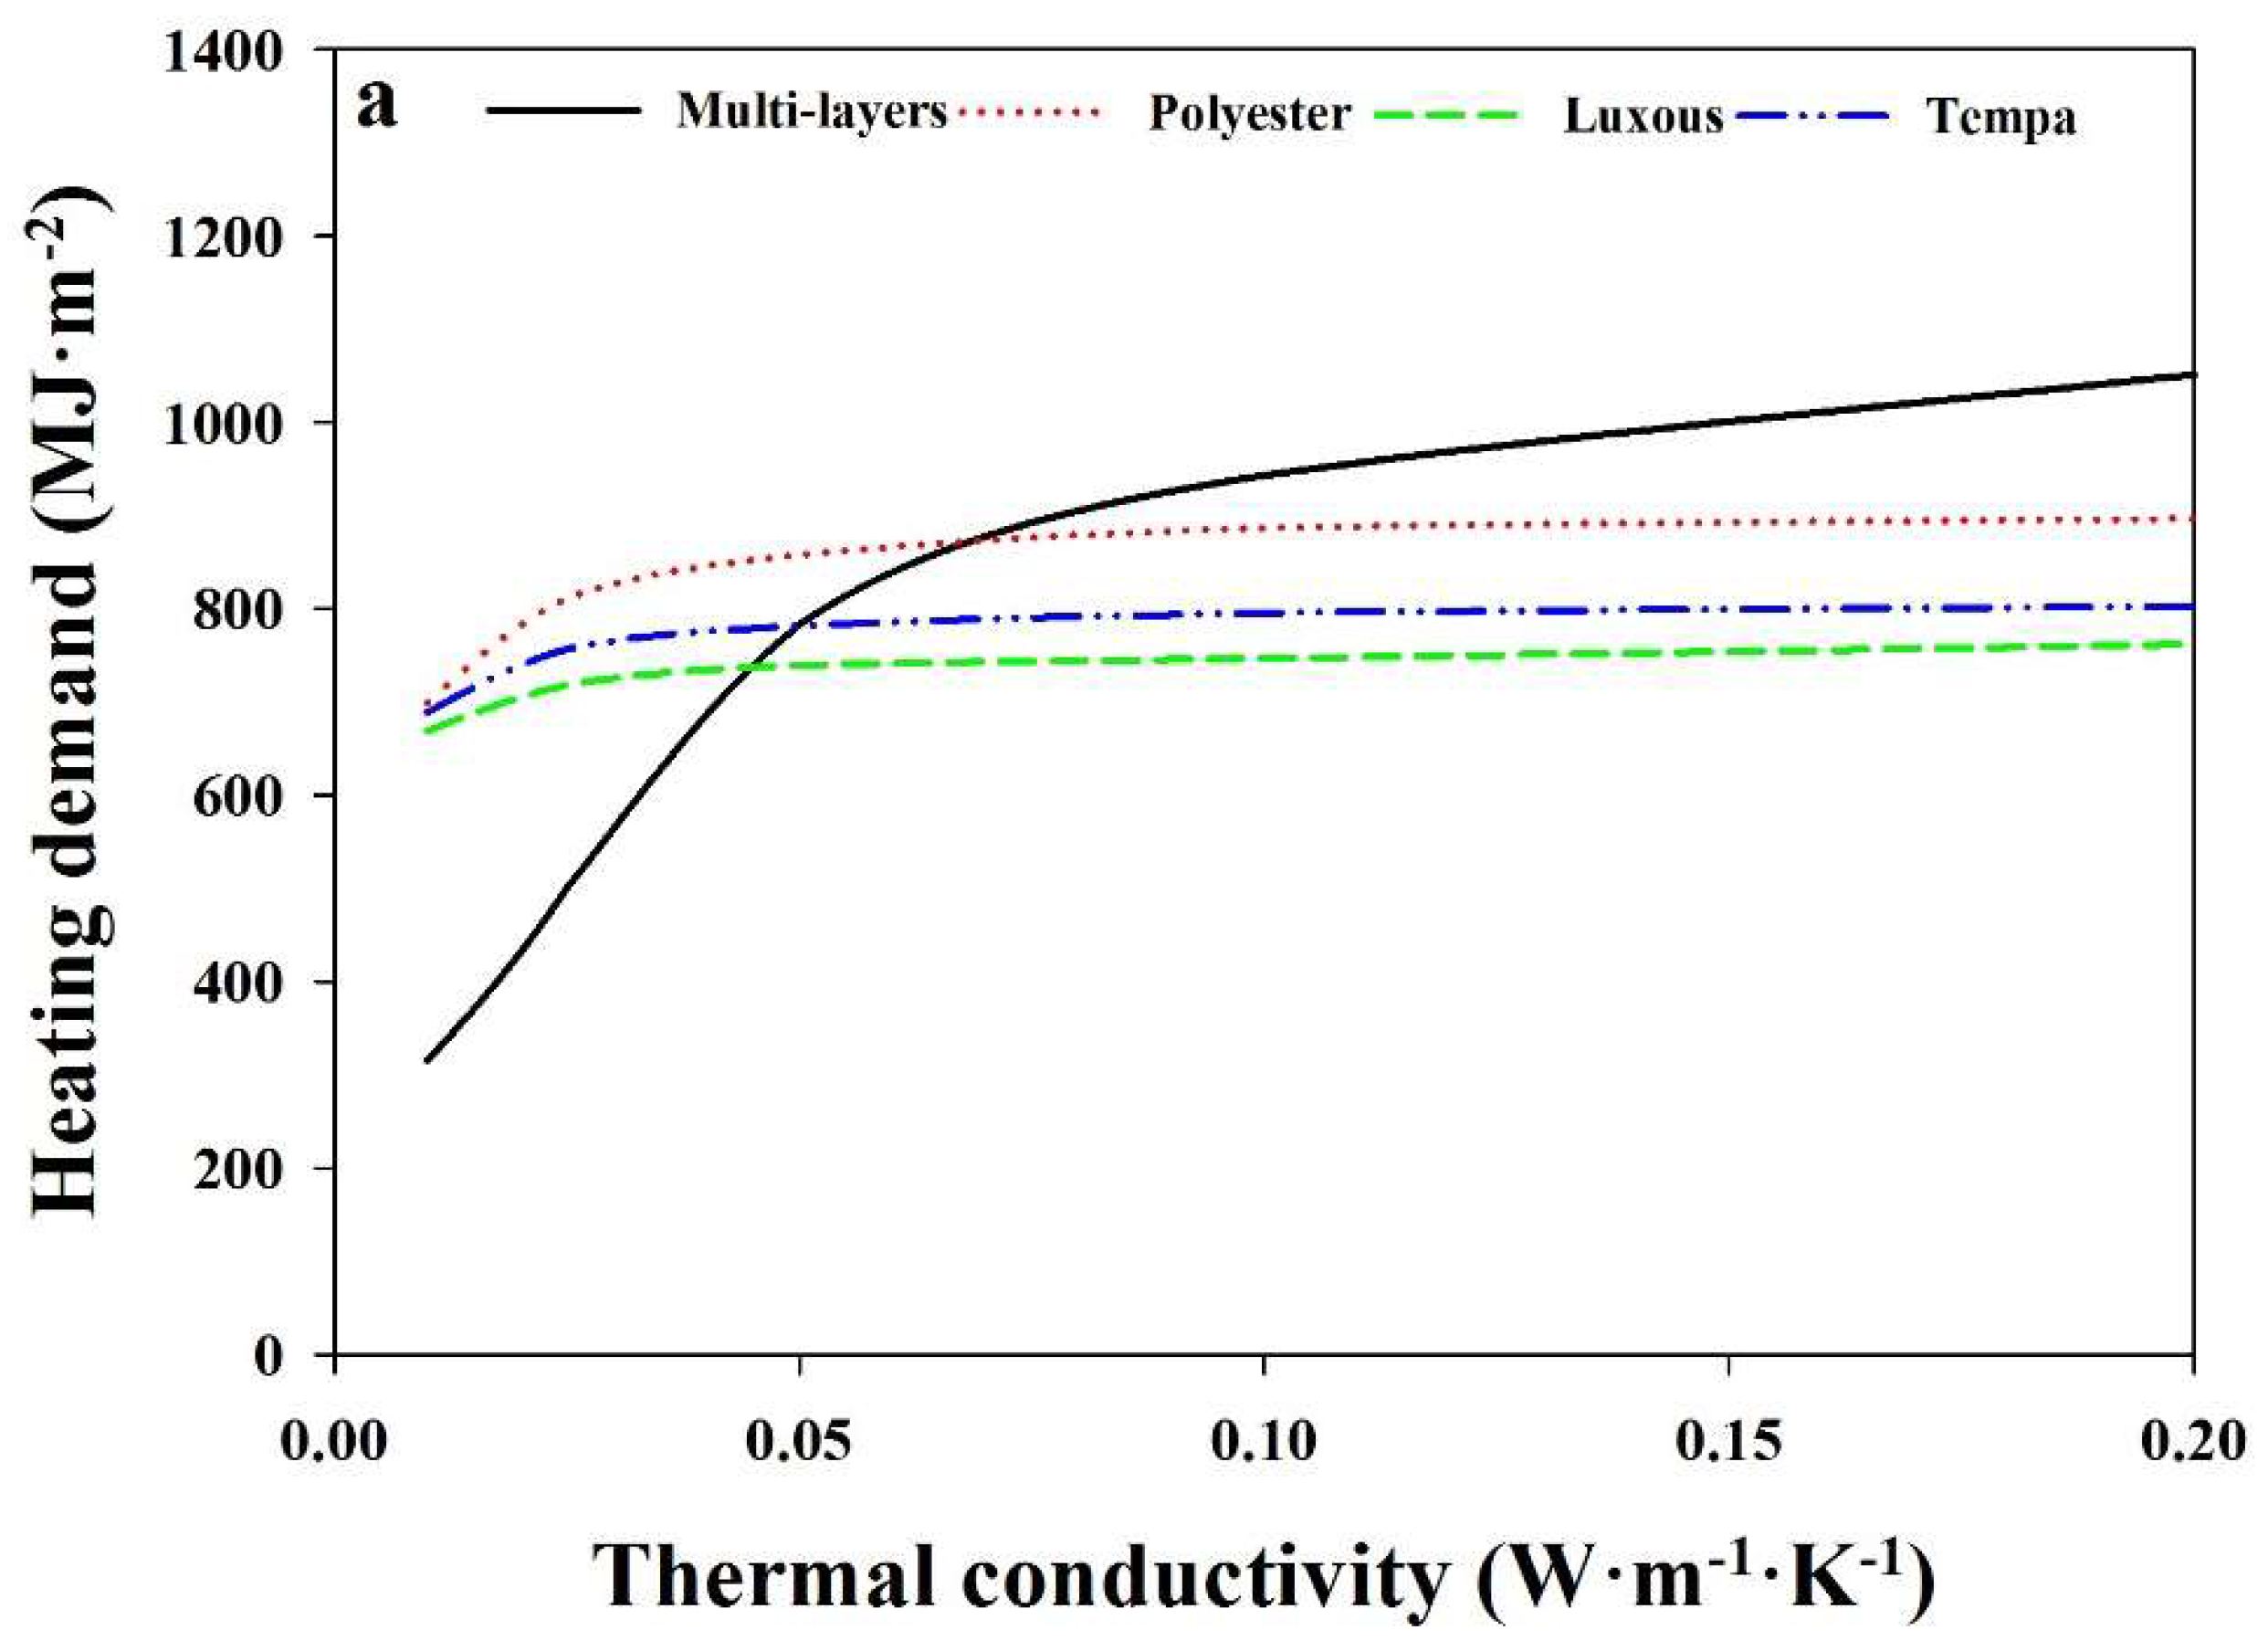
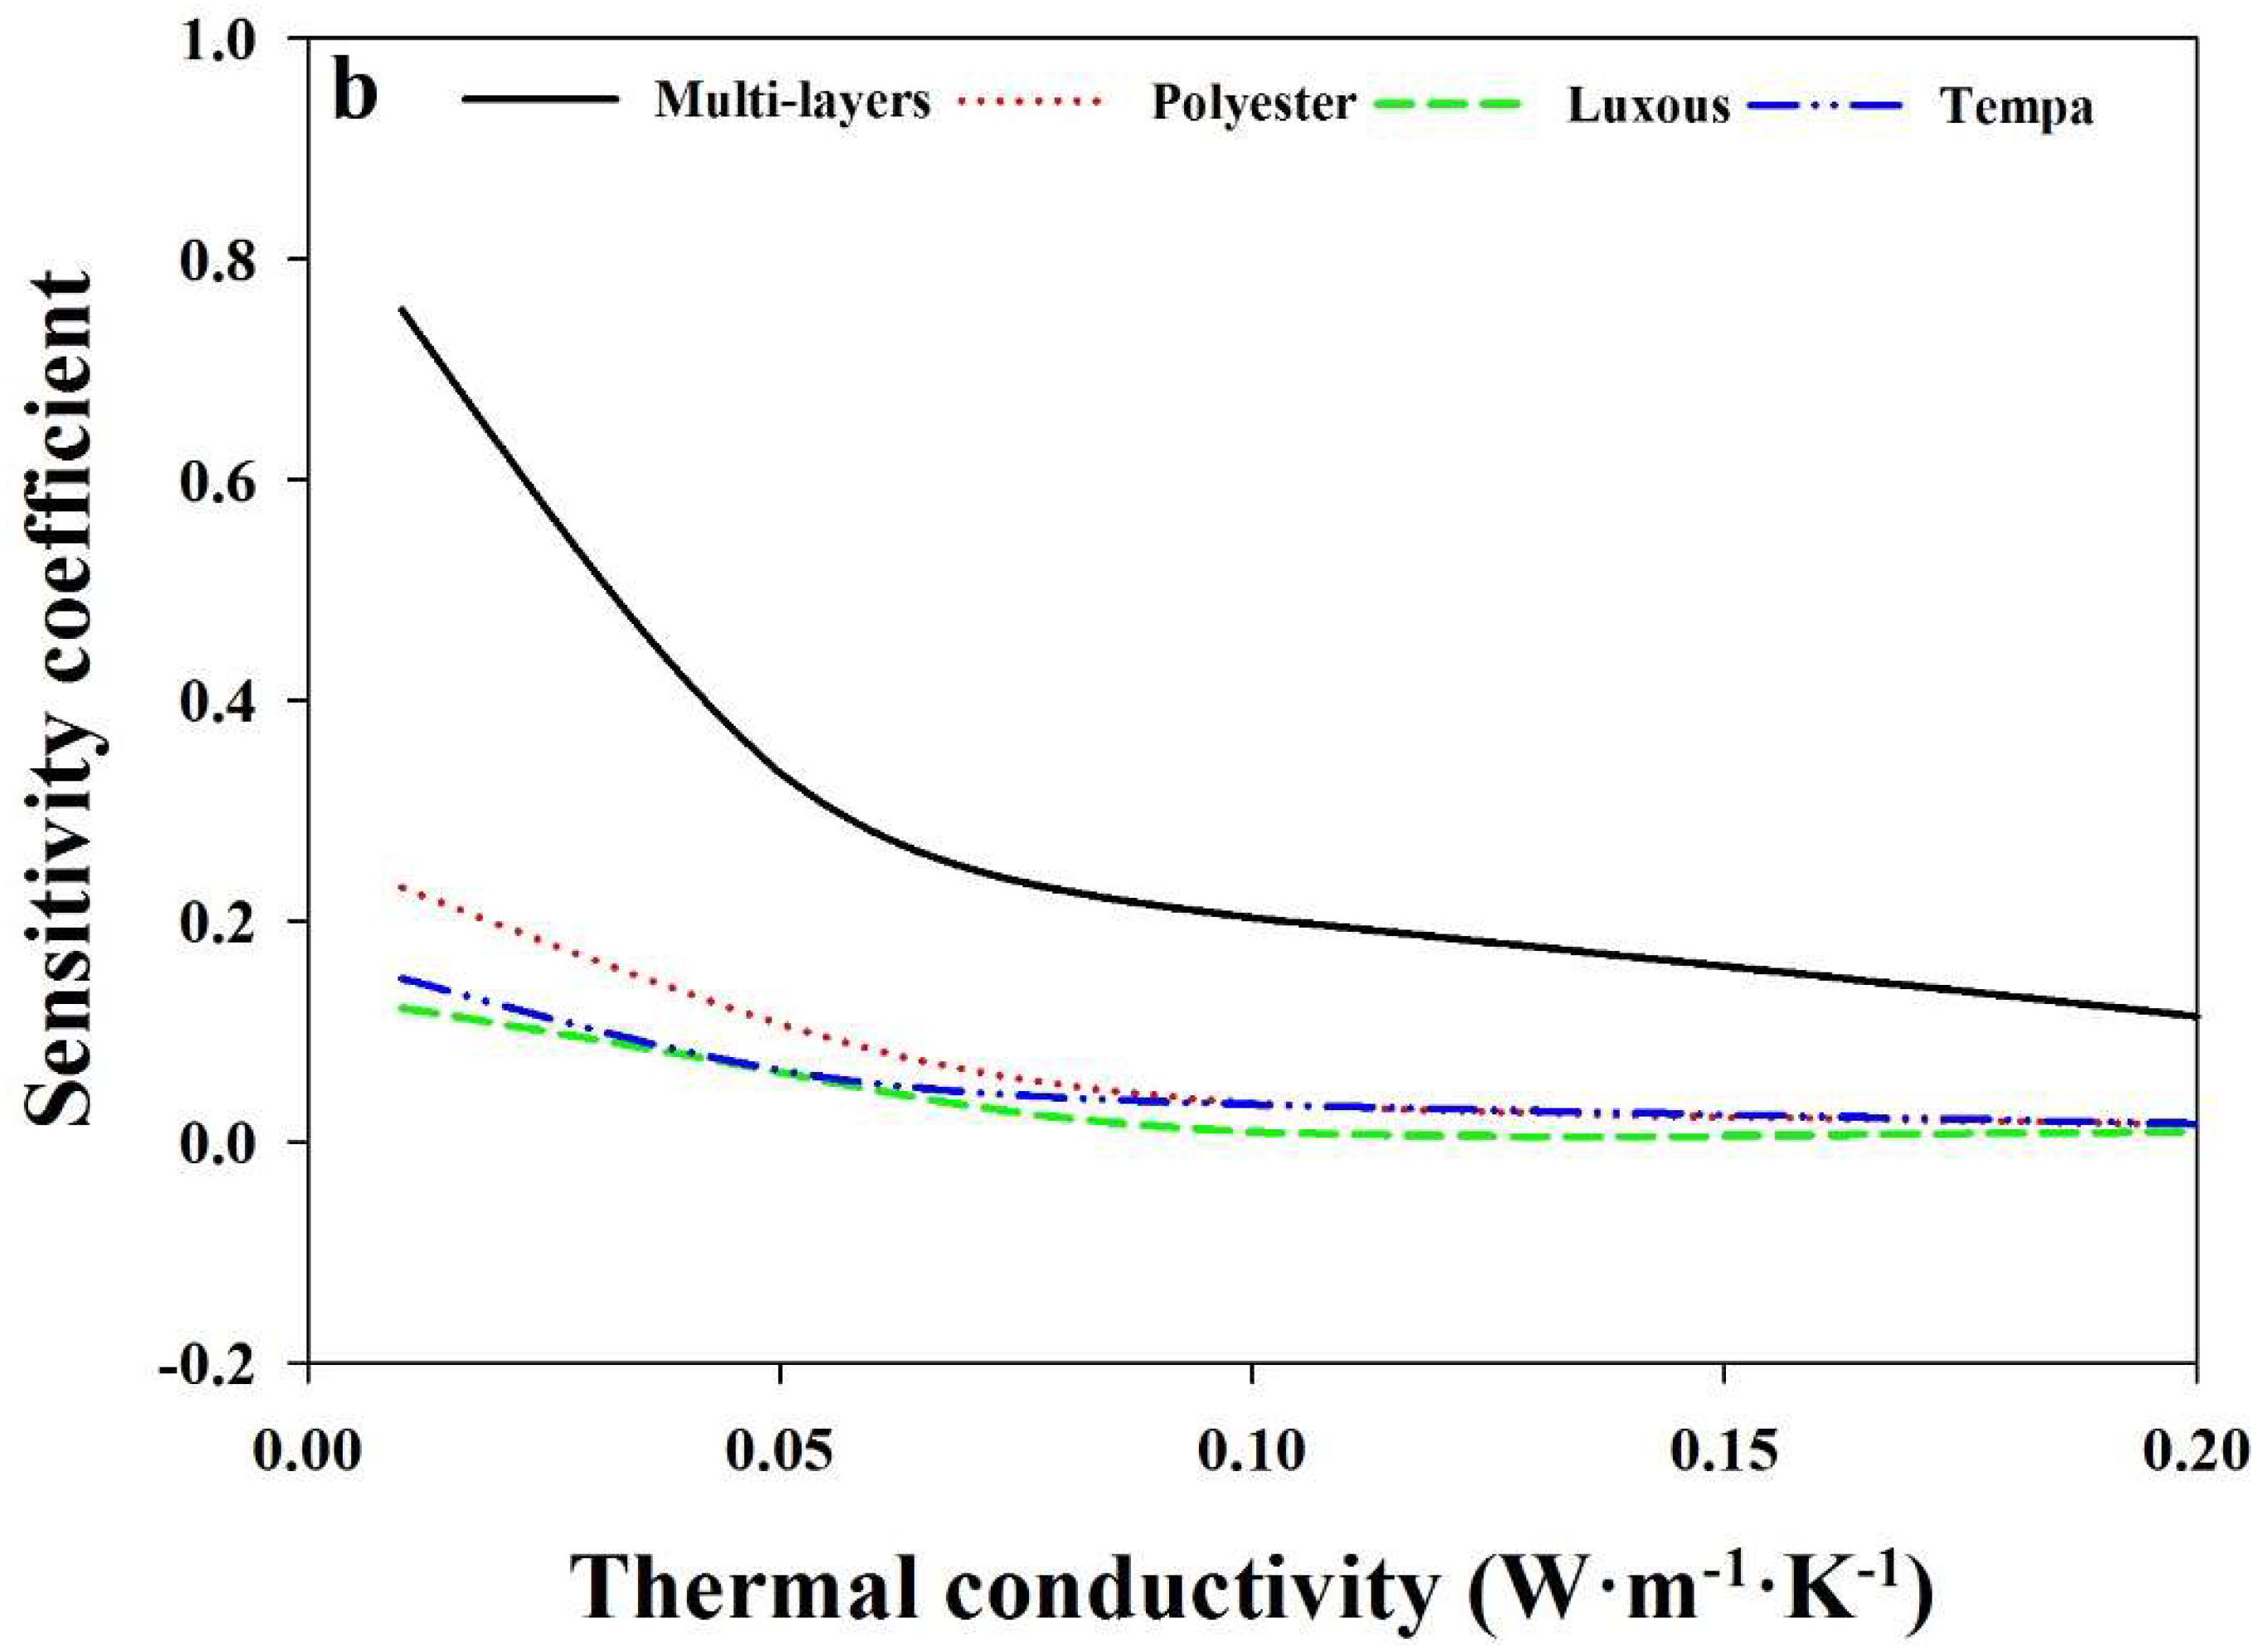
Figure 14.
Sensitivity analysis of thickness of thermal screens (a) heating demand (b) sensitivity coefficient.
Figure 14.
Sensitivity analysis of thickness of thermal screens (a) heating demand (b) sensitivity coefficient.

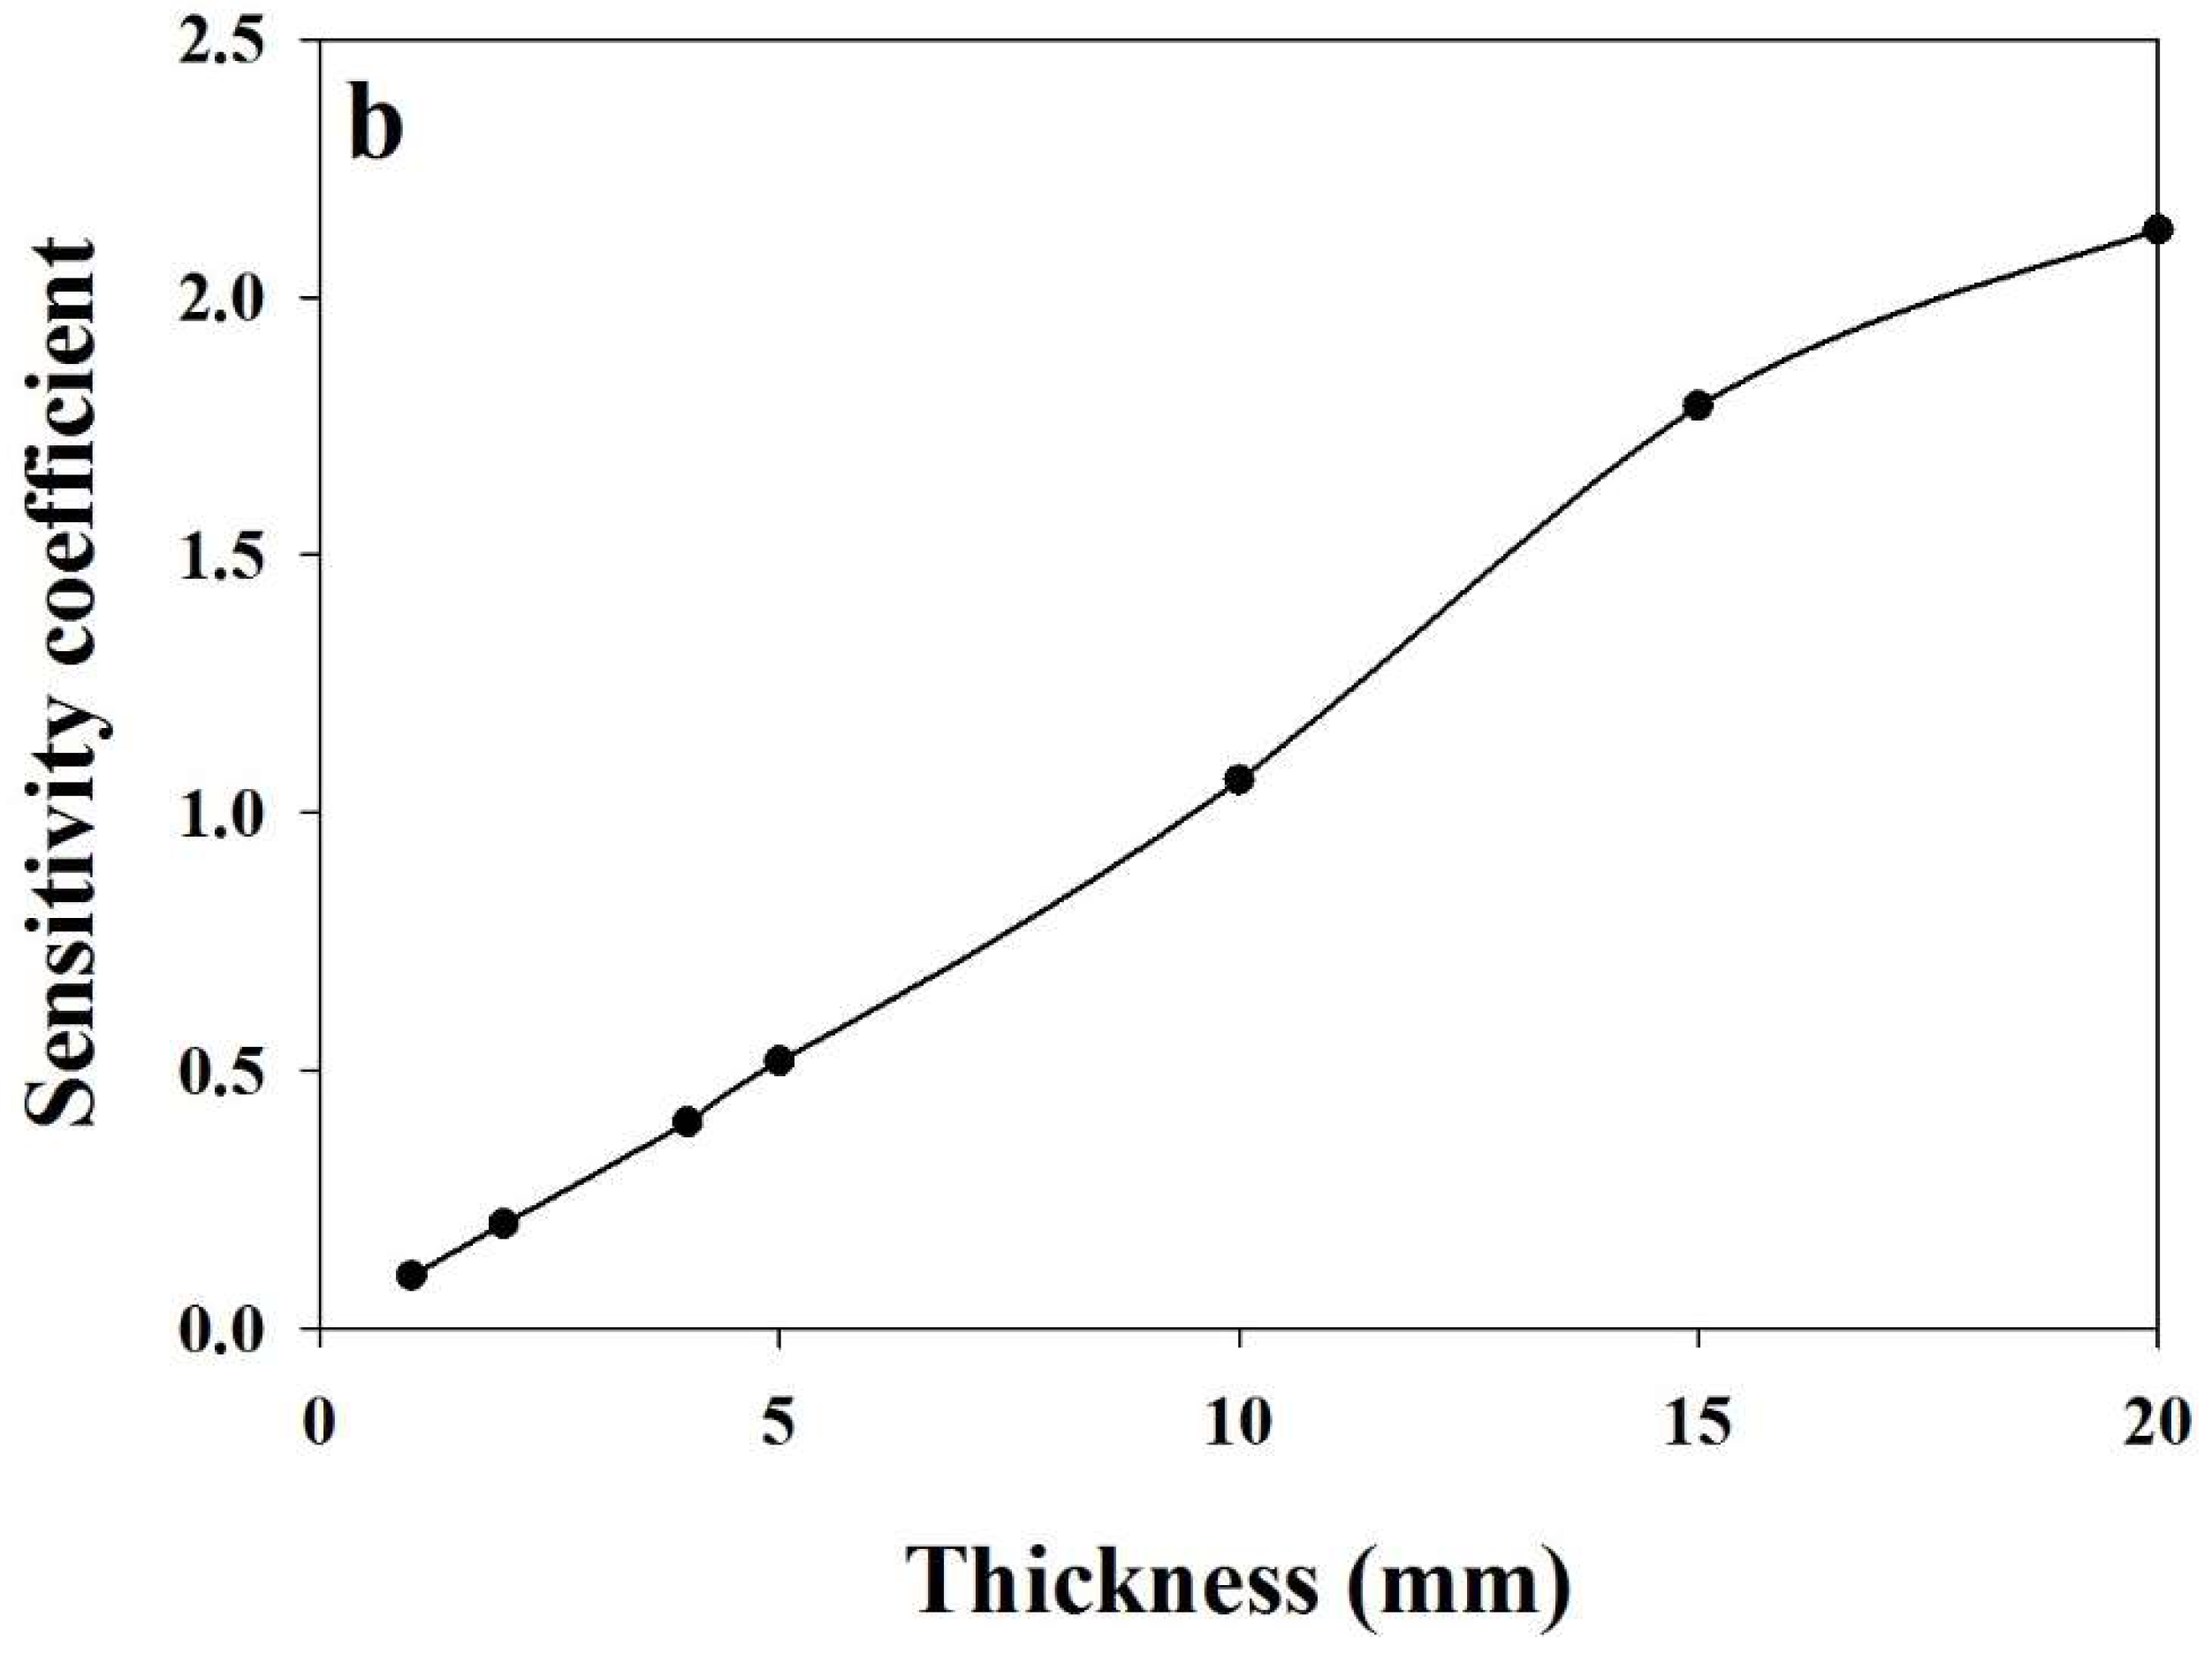
Figure 15.
Thermal screen control with different control strategies.

Figure 16.
Monthly energy consumption of greenhouse with different solar radiation values.

Figure 17.
Best monthly solar radiation set point for thermal screen opening.


Table 1.
Weather data variables used in the simulations.
| Weather Parameter | Unit | Time Interval | Sensor | Precision of Sensor | Data Recorded |
|---|---|---|---|---|---|
| Temperature | °C | 10 min | TR-76Ui-H, TECPEL | ±5 °C | Field recorded |
| Relative humidity | % | 10 min | TR-76Ui-H, TECPEL | ±5% | Field recorded |
| Solar radiation | kJ h−1 | 10 min | CMP3, Kipp & Zonen | <5% | Field recorded |
| Wind speed | m s−1 | 10 min | S-WDB-M003, ONSET | ±4% | Field recorded |
| Wind direction | degree | 10 min | S-WDA-M003, ONSET | ±4% | Field recorded |
| Ambient pressure | hPa | 10 min | PTB-220TS, VAISALA | ±0.15 hPa | KMA |
Table 2.
Specification of PD-11 prob.
| Feature | Unit | Sensor (PD-11) |
|---|---|---|
| Measuring temperature range | °C | −10 to 200 |
| Minimum sample size | mm3 | 100 × 50 × 20 |
| Measurement range | W·m−1·K−1 | 0.023 to 11.63 |
| Thin sample thickness | mm | 0.03 to 10 |
| Measuring time | Sec | 60 |
Table 3.
Description of TRNSYS 18 and other programs used in the simulation process.
| Component | Description |
|---|---|
| TRNBuild | This module used in conjunction with TYPE-56 to input the basic structural description of the greenhouse |
| TRNFlow | This is an add-on to TRNSYS used to design air flow network of natural ventilation of greenhouse |
| Soil noding program | A plugin for Google SketchUp™ program used to create 2D model of greenhouse floor which uses as an input by TYPE-49 |
| Google SketchUp™ | A program used to draw 3D model of greenhouse |
| Trnsys3d | A plugin for Google SketchUp™ program which creat a non-geometric data readable for TRNBuild about greenhouse structural design |
| Berkeley Lab Window 7.4 | This software used to create a DOE-2 file (which is readable by TRNBuild) of the greenhouse covering, and thermal screens using the following known properties of materials: solar transmittance and reflectance, thermal radiation transmittance and emission, visible radiation transmittance and reflectance, conductivity (W·m−1·K−1), and thickness (mm). |
Table 4.
Physical and thermal properties of the thermal screens.
| Screen Types | Thickness (mm) | Conductivity (W·m−1·K−1) | Transmittance (-) | Reflectance (-) | Emittance (-) |
|---|---|---|---|---|---|
| White polyester | 0.4 | 0.0510 | 0.02 | 0.04 | 0.94 |
| Luxous 1347 | 0.22 | 0.0463 | 0.38 | 0.18 | 0.44 |
| Tempa 8672 | 0.25 | 0.2133 | 0.01 | 0.32 | 0.67 |
| Multi-layers | 3.5 | 0.0370 | <0.001 | 0.10 | 0.90 |
Table 5.
Components of the greenhouse model in TRNSYS 18.
| Component | Type | Description |
|---|---|---|
| Weather data reader | 9 | Reads the user-provided weather file |
| Solar radiation processor | 16e | uses the total direct solar radiation on horizontal surface as an input and gives output of total, beam, reflected, and diffuse radiation of tilt surfaces. |
| Sky temperature calculator | 69b | Input: dew point temperature, beam and diffuse radiation on horizontal to calculate sky temperature |
| Psychrometric chart | 33 | Input is dry bulk temperature and humidity ration and calculate dew point temperature |
| Equation editor | This type was used to insert equation. | |
| Greenhouse building model | 56-TRNFlow | This type uses TRNBuild to process greenhouse geometry data and TRNFlow to calculate natural ventilation air flow |
| Ground coupling | 49 | Input for this type is heat transfer from greenhouse to floor and calculates floor temperature |
| Controller | 911 | This type was used to control opening and closing of the side and roof vents for natural ventilation |
| Printer | 25d | This type was used to print results on the external user-provided file |
| Plotter | 65c | This type was used to plot the results in an online plotter |
Table 6.
Summary of reference greenhouse with temperature-controlled vents and heating setpoint.
| Parameter | Operating Condition |
|---|---|
| Roof type | Gambrel |
| Glazing | PE |
| Glazing operation | Single-layer (9:00 AM to 5:00 PM) Double-layer (5:00 PM to 9:00 AM) |
| Orientation | East-West |
| Period | 01-Jan-2018 to 13-Jan-2018 |
| Natural ventilation | Side vents |
| Natural vents control set point temp | 25 °C |
| Thermal Screens | Yes |
| Thermal screens control | Open (8:00 AM), close (5:30 PM) |
| Dimension | 24 m × 7 m × 4 m |
| Floor area | 168 m2 |
| Volume | 532 m3 |
| Heating | 10 °C |
Table 7.
Summary of reference greenhouse with temperature controlled natural ventilation and thermal screen.
Table 7.
Summary of reference greenhouse with temperature controlled natural ventilation and thermal screen.
| Parameter | Operating Condition |
|---|---|
| Roof type | Gambrel |
| Glazing | PE |
| Glazing operation | Single-layer (9:00 AM to 5:00 PM) Double-layer (5:00 PM to 9:00 AM) |
| Orientation | East-West |
| Period | 07-Nov-2018 to 12-Nov-2018 |
| Natural ventilation | Side vents |
| Natural vents control set point temp | 23 °C |
| Thermal Screens | Yes |
| Thermal screens control | Open (8:00 AM), close (5:30 PM) |
| Dimension | 24 m × 7 m × 4 m |
| Floor area | 168 m2 |
| Volume | 532 m3 |
| Heating | No |
Table 8.
Calculated heating demand with the material’s properties.
| Screen | U-Value (W·m−2·K−1) | Thickness (mm) | Conductivity (W·m−1·K−1) | Emissivity (-) |
|---|---|---|---|---|
| Multi-layers | 700.3 | 3.5 | 0.0370 | 0.900 |
| Luxous | 739.8 | 0.22 | 0.0463 | 0.440 |
| Tempa | 802.7 | 0.25 | 0.2133 | 0.670 |
| Polyester | 858.1 | 0.40 | 0.0510 | 0.940 |
Table 9.
Results for different screen opening strategies.
| Value | Screen Closed (hours) | Energy Consumption (MJ·m−2) |
|---|---|---|
| Without thermal screens | ||
| 0 | 1015.6 | |
| Time control | ||
| 8:00 AM – 5:30 PM | 2100 | 705.5 |
| Outside global radiation | ||
| 1 (W·m−2) | 2063.5 | 707.3 |
| 10 (W·m−2) | 2098.8 | 705.7 |
| 20 (W·m−2) | 2145.8 | 704.1 |
| 30 (W·m−2) | 2192.7 | 702.4 |
| 40 (W·m−2) | 2233.2 | 701.3 |
| 50 (W·m−2) | 2273.3 | 700.5 |
| 60 (W·m−2) | 2307.3 | 700.3 |
| 70 (W·m−2) | 2340.8 | 700.3 |
| 80 (W·m−2) | 2372.2 | 700.9 |
| 90 (W·m−2) | 2403.2 | 701.8 |
| 100 (W·m−2) | 2432.2 | 702.5 |
| 110 (W·m−2) | 2462.2 | 703.7 |
| 120 (W·m−2) | 2488.2 | 704.9 |
| Outside global radiation and temperature | ||
| 60 (W·m−2)/−20 °C | 2332.7 | 700.3 |
| 60 (W·m−2)/−15 °C | 2332.7 | 700.3 |
| 60 (W·m−2)/−10 °C | 2346.0 | 700.5 |
| 60 (W·m−2)/−5 °C | 2391.7 | 707.6 |
| 60 (W·m−2)/0 °C | 2555.7 | 734.7 |
© 2019 by the authors. Licensee MDPI, Basel, Switzerland. This article is an open access article distributed under the terms and conditions of the Creative Commons Attribution (CC BY) license (http://creativecommons.org/licenses/by/4.0/).
Share and Cite
MDPI and ACS Style
Rasheed, A.; Na, W.H.; Lee, J.W.; Kim, H.T.; Lee, H.W. Optimization of Greenhouse Thermal Screens for Maximized Energy Conservation. Energies 2019, 12, 3592. https://doi.org/10.3390/en12193592
AMA Style
Rasheed A, Na WH, Lee JW, Kim HT, Lee HW. Optimization of Greenhouse Thermal Screens for Maximized Energy Conservation. Energies. 2019; 12(19):3592. https://doi.org/10.3390/en12193592
Chicago/Turabian StyleRasheed, Adnan, Wook Ho Na, Jong Won Lee, Hyeon Tae Kim, and Hyun Woo Lee. 2019. "Optimization of Greenhouse Thermal Screens for Maximized Energy Conservation" Energies 12, no. 19: 3592. https://doi.org/10.3390/en12193592
Note that from the first issue of 2016, this journal uses article numbers instead of page numbers. See further details here.