CO2-Argon-Steam Oxy-Fuel Production for (CARSOXY) Gas Turbines

Mechanical and Aerospace Engineering, Cardiff University, Cardiff CF24 0EA, UK
*
Author to whom correspondence should be addressed.
Energies 2019, 12(18), 3580; https://doi.org/10.3390/en12183580
Submission received: 17 July 2019
/
Revised: 28 August 2019
/
Accepted: 30 August 2019
/
Published: 19 September 2019
Abstract
:Due to growing concerns about carbon emissions, Carbon Capture and Storage (CCS) techniques have become an interesting alternative to overcome this problem. CO2-Argon-Steam-Oxy (CARSOXY)-fuel gas turbines are an innovative example that integrates CCS with gas turbine powergen improvement. Replacing air-fuel combustion by CARSOXY combustion has been theoretically proven to increase gas turbine efficiency. Therefore, this paper provides a novel approach to continuously supply a gas turbine with a CARSOXY blend within required molar fractions. The approach involves H2 and N2 production, therefore having the potential of also producing ammonia. Thus, the concept allows CARSOXY cycles to be used to support production of ammonia whilst increasing power efficiency. An ASPEN PLUS model has been developed to demonstrate the approach. The model involves the integrations of an air separation unit (ASU), a steam methane reformer (SMR), water gas shift (WGS) reactors, pressure swing adsorption (PSA) units and heat exchanged gas turbines (HXGT) with a CCS unit. Sensitivity analyses were conducted on the ASU-SMR-WGS-PSA-CCS-HXGT model. The results provide a baseline to calibrate the model in order to produce the required CARSOXY molar fraction. A MATLAB code has also been developed to study CO2 compression effects on the CARSOXY gas turbine compressor. Thus, this paper provides a detailed flowsheet of the WGS-PSA-CCS-HXGT model. The paper provides the conditions in which the sensitivity analyses have been conducted to determine the best operable regime for CARSOXY production with other high valuable gases (i.e., hydrogen). Under these specifications, the sensitivity analyses on the (SMR) sub-model spots the H2O mass flow rates, which provides the maximum hydrogen level, the threshold which produces significant CO2 levels. Moreover, splitting the main CH4 supply to sub-supply a SMR reactor and a furnace reactor correlates to best practices for CARSOXY. The sensitivity analysis has also been performed on the (ASU) sub-model to characterise its response with respect to the variation of air flow rate, distillation/boiling rates, product/feed stage locations and the number of stages of the distillation columns. The sensitivity analyses have featured the response of the ASU-SMR-WGS-PSA-CCS-HXGT model. In return, the model has been qualified to be calibrated to produce CARSOXY within two operability modes, with hydrogen and nitrogen or with ammonia as by-products.
1. Introduction
Generating power with high efficiency has become a necessity rather than an option. Conventional power generation methods that employ fossil fuel-fired plants have unquestionably increased carbon dioxide emissions and tightened up tolerance margins across the world [1]. The use of alternative working fluids in gas turbines promises both to increase cycle efficiency and limit carbon emissions [2]. Several alternative working fluids stand out from the crowd. These are helium, ammonia, humidified working fluids, and CO2-Ar-H2O. The latter is used for a novel concept called CARSOXY gas turbines [2,3]. Although the latter are just conceptual, these systems have the potential to provide large power outputs with high efficiency. The concept is based on the use of humidified inert atmospheres with oxyfuel combustion. Carbon dioxide can be obtained through carbon capture and storage (CCS). Adding inert gases such as argon from air separation units (ASUs) to be mixed with the working fluid plays an important role in enhancing the thermodynamic properties of the system [2]. Recent studies [2] employed a CARSOXY blend with molar fractions of 25, 19, 23, 11 and 22 (vol%) of Ar, CO2, H2O, CH4 and O2, respectively, demonstrating an increase of efficiency by 13.93%. Increasing the molar fraction of argon up to 47% showed an increment in specific heat capacity of the working fluid, which as a result increases the cycle efficiency by an additional 10% [3].
However, CARSOXY gas turbines face technical and economic challenges. As discussed, CARSOXY blends contain high molar fractions of argon. Argon is separated from atmospheric air which contains only a 0.93% molar fraction of the gas [4]. Conventional engineering practices for argon production are based on cryogenic ASUs with side rectifiers [5], i.e., expensive components which produce argon with high purity [6]. Interestingly, obtaining argon with oxygen would be more economic by reducing separation whilst enabling the use of oxygen in these CARSOXY cycles. Similarly, adopting conventional Carbon Capture and Store (CCS) technologies would also enable high carbon molar factions in the blend, thus ensuring that CO2 is utilized whilst removing it from exhaust gases that contribute to climate change.
The elegance of producing the CARSOXY by the suggested approach appears as an opportunity to use it in sites where Ammonia is produced. The process of producing ammonia involves hydrogen and nitrogen production. The sub-process of producing hydrogen is typically methane steam-reforming. Nitrogen is produced by an air separation sub-process. Both of the sub-processes are involved in the proposed approach to generate CARSOXY.
Therefore, this paper proposes a novel approach of continuously providing a gas turbine with the required molar fractions of CARSOXY blend whilst enabling the production of H2 and N2 to be used in other industrial processes or ammonia fabrication. This paper discusses the production aspects of CARSOXY. Neither cycle efficiencies nor technoeconomics are covered in this paper.
2. Background
The developed approach of producing the required CARSOXY molar fraction involves the integrations of an air separation unit (ASU), a steam methane reformer (SMR), water gas shift (WGS) reactors, a pressure swing adsorption (PSA) unit, a Carbon Capture and Storage (CCS) unit and a humidified gas turbine (HXGT) cycle.
2.1. Air Separation Unit (ASU)
Air separation methods mainly fall into three categories (namely membrane separation, pressure swing, and cryogenic distillation). The focus will be on cryogenic distillation as a more proper choice for CARSOXY gas turbines since it is capable of separating a ternary mixture into its individual components. Air can be separated into nitrogen, oxygen, and argon, with the last two being components of CARSOXY, which can be obtained at once within the same cryogenic distillation unit [7,8,9,10].
2.2. Steam Methane Reforming (SMR)
SMR is one of the fully developed technologies used to produce hydrogen [11]. Light hydrocarbon fuels such as methane (CH4) react with steam to be converted into hydrogen as the main product, carbon monoxide, and carbon dioxide as by-products. In the reforming process, two endothermic reactions take place. Equation (1) requires 206 kJ to react one mole of methane with one mole of steam. This produces hydrogen and a by-product carbon monoxide. Water gas shift (WGS) reactors utilize steam to convert the by-product carbon monoxide to hydrogen and carbon dioxide [12]. Equation (2) requires no WGS as it directly produces hydrogen and carbon dioxide. It consumes 165 kJ and produces hydrogen and carbon dioxide [13]:
CH4 + H2O ↔ CO + 3H2
CH4 + 2H2O ↔ CO2 + 4H2
2.3. Water Gas Shift (WGS)
Water-gas shifting of one mole of carbon monoxide produces approximately 40 kJ. The reaction is typically accelerated by two types of catalysts (namely iron-based and copper-based) [14]. Whenever carbon monoxide is an unwanted by-product gas, water-gas shifting is a scope of interest. In fact, it is a very reliable way to purify produced hydrogen via steam reforming of hydrocarbon fuel such as methane [15]. Removing CO and producing hydrogen, i.e., Equation (3), is typically conducted into two stages. These are through high-temperature and low temperature reactors:
H2O + CO ↔ CO2 + H2
2.4. Pressure Swing Adsorption (PSA)
Hydrogen can be separated from a mixture by cryogenic distillation, PSA, or a hybrid combination of the two methods. However, the typical process which is followed in the industry to separate H2 from the WGS products is PSA. References [16,17,18] indicate that PSA is insensitive to the changes in molar fractions of the feed stream or to its boundary conditions (i.e., temperature or pressure), where 90% of the hydrogen is recovered with a 99.99% purity. A detailed description of the process is available somewhere else [17].
2.5. Carbon Capture and Storage (CCS)
The main technologies of carbon capture and storage are pre-combustion, post-combustion and oxyfuel combustion. The CCS unit which is used in this paper is a post-combustion unit. Therefore, the focus is only on post-combustion CCS. This technique removes the carbon dioxide from the combustion products requiring no major changes on the combustion practice. The process can be easily integrated to currently used power plants in the market [18]. However, this technique incurs in an unsatisfying 70% increase in the electricity bill in most applications [19].
2.6. Heat Exchanged Gas Turbine (HXGT) Cycle
The heat exchanged gas turbine cycle is basically a simple gas turbine cycle, which is integrated with a recuperator. Exhaust gases from the turbine exchange heat with the compressor outlet gases in order to reduce heat losses. Alrebei et al. [3] conducted a parametric study on several CARSOXY gas turbine cycles. These simple cycles were: heat exchanged cycle, free turbine & simple cycle, evaporative cycle and humidified gas turbine cycle. The performances of the five cycles using CARSOXY were estimated for wet and dry compression. The results were obtained from the MATLAB codes that had been developed to conduct the cycle analyses for the CARSOXY gas turbines. Analyses were based on the higher heating value (HHV) of methane as fuel. Alrebei et al. [3] also identify domains of operating conditions for each cycle, where efficiency can be increased by up to 12% using CARSOXY heat exchanged cycle compared to air-driven cycles. Therefore, HXGT cycle has been chosen for this paper.
3. Modeling Approach
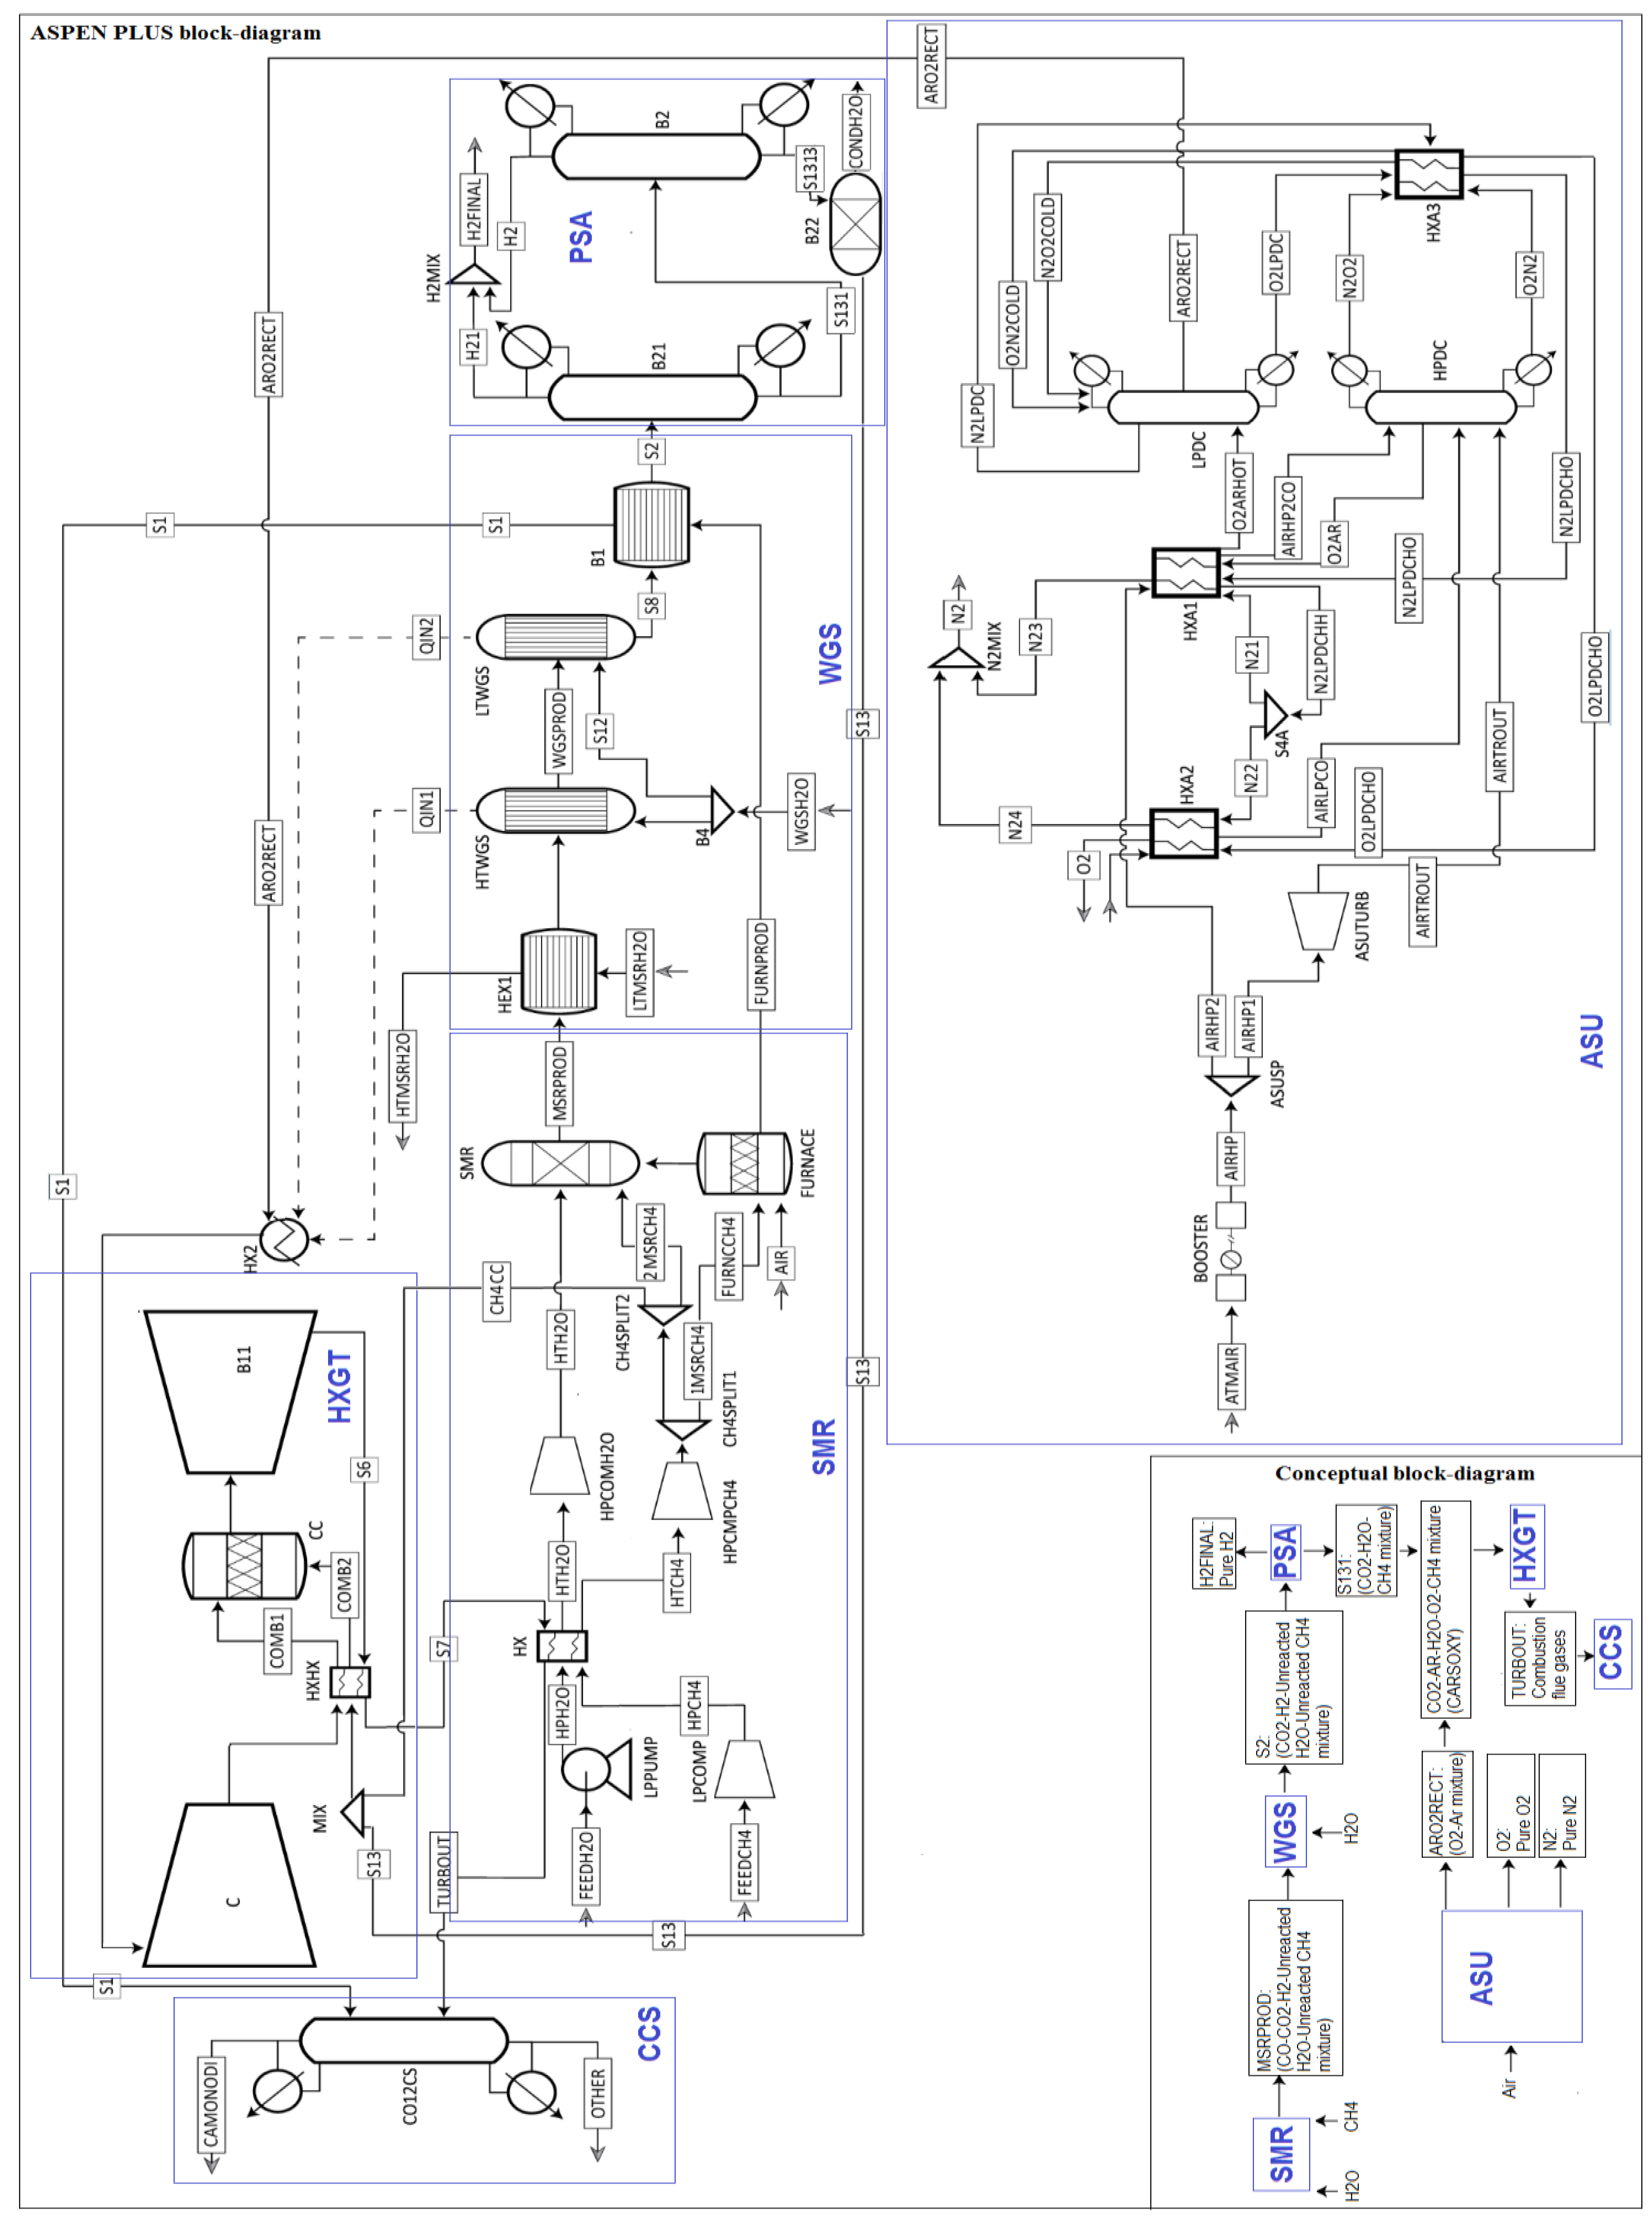
The fully integrated model (Figure 1) has been developed using ASPEN PLUS software. The model is based on the Peng-Robinson equation of state. It consists of six sub-models which are the SMR, WGS, PSA, ASU, heat exchanged gas turbine cycle and CCS. The process for each sub-model is provided in this section. The final numeric description is provided in the sensitivity analysis section. Table 1 shows the mass balance results of the model.
3.1. SMR Sub-Model
As shown in Figure 1, the SMR process starts by feeding water and methane to the sub-model by the water (FEEDH2O) and methane (FEEDCH4) streams. Table 2 shows the values of these streams. The water stream is partially compressed to 1.5 bar by the (LPPUMP) pump. Similarly, the methane stream is compressed by the (LPCOMP) compressor. LPCOMP is an isentropic compressor model which has an isentropic efficiency of 85%. Both streams are then heated up in the heat exchanger (HX) by the flue gases of the gas turbine. The final compression stage for water is provided by the (HPCOMPH2O) compressor and by (HPCOMPCH4) compressor for methane. Both compressors increase the pressures to 15 bar. Water at this stage is fully converted to steam. The outlet of the methane compressor (HPCOMPH2O) is split into the (1MSRCH4) and (FURNCCH4) streams to feed the CH4SPLIT1 splitter and a furnace, respectively. The (CH4SPLIT1) splitter provides the CH4SPLIT2 splitter with 80.8% of the original methane feed. The (1MSRCH4) stream is further split into the (2MSRCH4) and the (CH4CC) streams to feed the SMR reactor and the CC combustion chamber, respectively. The furnace has been modeled using an RSTOIC reactor to simulate stoichiometric combustion of methane with air. The furnace provides the SMR reactor with the required heat to conduct the reforming process via the (QIN) heat stream.
3.2. WGS Sub-Model
The products of the SMR reactor are cooled down in the (HEX1) heat exchanger prior to the water gas shift, Figure 1. The cooling down process is conducted against the (LTM-SRH2O) water stream. The (WGSH2O) water stream is used to feed the WGS reactors. The stream is split into the (S9) and (S12) streams to feed the high-temperature water gas shift reactor (HTWGS) and the low-temperature water gas shift (LTWGS) reactor with a split ratio of 9:1, respectively. Both water gas shift reactors are modeled using (STOIC) reactors to simulate WGS, which are specified in the Reaction (3). The reactors are connected in series and their final product (S8) is warmed up again in the (B1) heat exchanger using the furnace flue gases. The products exit the heat exchanger. Since both reactors perform exothermic reactions, the heat streams (QIN1) and (QIN2) from the reactors are utilized to heat (AR2RECT) stream. The latter provides the required argon and oxygen supply to the gas turbine unit.
3.3. PSA Sub-Model
The WGS product (S2) has a high hydrogen content. The (H21) stream carries the separated hydrogen. Stream (S131) carries the remaining contents of the WGS process (i.e., mainly steam, methane and carbon dioxide). However, stream (S131) still has a relatively high molar fraction of hydrogen. The (B2) separator further separates the remaining hydro- gen coming in stream (S131), which is then mixed with stream (H21) in (H2MIX). The (S131) stream at this stage carries only steam, methane and carbon dioxide with minor residuals of carbon monoxides. Excess steam in the (S131) stream is partially separated to the (CONDH2O) stream through the (B22) separator. The (S1313) stream and the (CH4CC) streams provide the necessary H2O-CH4-CO2 supply to the CARSOXY turbine unit at the required molar fractions.
3.4. ASU Sub-Model
Figure 1 also shows the ASU sub-model. It has been modeled using reference [20] as a baseline design. However, the unit needs to be modified to fulfill the CARSOXY requirement. The air separation process starts by compressing the atmospheric air stream (ATMAR) by the isentropic booster. The compressed air is split into the (AIRHP1) and the (AIRHP2) streams. The (AIRHP1) air stream is then fed to the (ASUTRUB) isentropic turbine in order to expand the air stream before it is finally delivered to the high-pressure distillation column (HPDC) by the (AIRTROUT) stream. The (AIRHP2) stream is cooled down in the (HXA1) against the ASU products in the (N21), (N2LPDCHO) and (O2LPDCHO) streams. The (AIRHP2) stream leaves the (HXA1) heat exchanger as (AIRHP2CO) stream and is fed to the high-pressure distillation column (HPDC). Another atmospheric air stream is also fed to the ASU through the (HXA2) stream. The latter is cooled down against the ASU products in the (N22) and (O2LPDCHO) streams. The flow leaves the heat exchanger as (AIRLPCO) stream and is fed to the high-pressure distillation column (HPDC). The (AIRTROUT), (AIRHP2CO) and (AIRLPCO) streams are therefore at three different pressure levels (all above ambient pressure). As a result, these are fed to the high-pressure distillation column (HPDC) at three different stages. Both the (HPDC) and the (LPDC) are modeled using the ASPEN PLUS RADFRAC model block. The (N2O2) stream and the (O2N2) stream have high molar fractions of nitrogen and oxygen, respectively. Both streams are cooled down in the (HXA3) heat exchanger against the products of the distillation column (LPDC). Only pure oxygen exists in the (O2LPDC) stream, while pure nitrogen is only present in the (N2O2COLD) stream. Stream (ARO2RECT) contains argon and oxygen molecules. The conventional process typically separates the (ARO2RECT) stream into argon and oxygen. Instead, the process parameters have been re-calibrated to provide the required argon and oxygen for the CARSOXY turbine unit.
3.5. Heat Exchanged Gas Turbine Sub-Model
As a follow up to previous work [3] a heat exchanged cycle has been fully integrated within the specified assumptions of CARSOXY (Table 3). An RSTOIC reactor has been used to model the combustion chamber (CC), the compressor (C), the turbine (B11) and the heat exchanger (HXHX) by using their ASPEN-PLUS defined blokes. The results from the reference have also shown that dry compression would increase the efficiency more than wet compression. Dry compression refers to the injection of steam to the CO2-Argon mixture post the compressor. Nevertheless, the compressor is fed by the oxygen- argon stream (ARO2RECT) instead of a carbon dioxide-argon stream as recommended in previous works [3].
Therefore, it has been essential to validate this diversion from the reference. A MATLAB code has been developed in order to test the oxygen-argon compression against the carbon dioxide-argon within a heat exchanged gas turbine. The results are based on Equation (4) to Equation (10) [21] and Equation (11) to Equation (15) [22] within the specifications in Table 3 for both cases:
3.6. CCS Sub-Model
The (CO12CS) is a (SEP2) ASPEN PLUS block model, which captures the produced carbon dioxide and carbon monoxide from the (B11) turbine flue gases. These follow the (S6)-(S7)-(TURBOUT) route to be then captured by the (CO12CS) block. In addition, flue gases from the furnace in the SMR unit are also captured by (CO12CS) block. These follow the (FURNPROD)-(S1) route.
3.7. Initial and Final Inputs
Each sub-model in Figure 1 had been set up on initial values which have been modified after the sensitivity analysis to fulfill the CARSOXY molar fraction requirements. The initial input values had been adopted for the SMR, WGS, PSA, ASU, heat exchanged gas turbine and CCS sub-models from the references [3,20,23,24,25,26]. Table 2 shows the initial and final input values.
4. Results and Sensitivity Analysis
The sensitivity analysis in this paper is provided for the parameters that are the most effective means to control the products molar fractions. These are carbon to steam mole ratio (C/S), steam mole flow rate, and SMR to FURNACE mass split ratio in CH4SPLIT in the SMR sub-model. Similarly, in the WGS sub-model, water mole flow (WGSH2O) is the most effective method to control the molar fractions of the products. In the ASU sub-model, ATMIR and AIRLP mole flow rates are analyzed, while some of the parameters in the LPDC have been also modified from their initial values. The following results have been produced within the initial values of the parameters specified in Table 2.
4.1. SMR Sub-Model Sensitivity Analysis
4.1.1. SMR Molar Fractions vs. H2O Feed
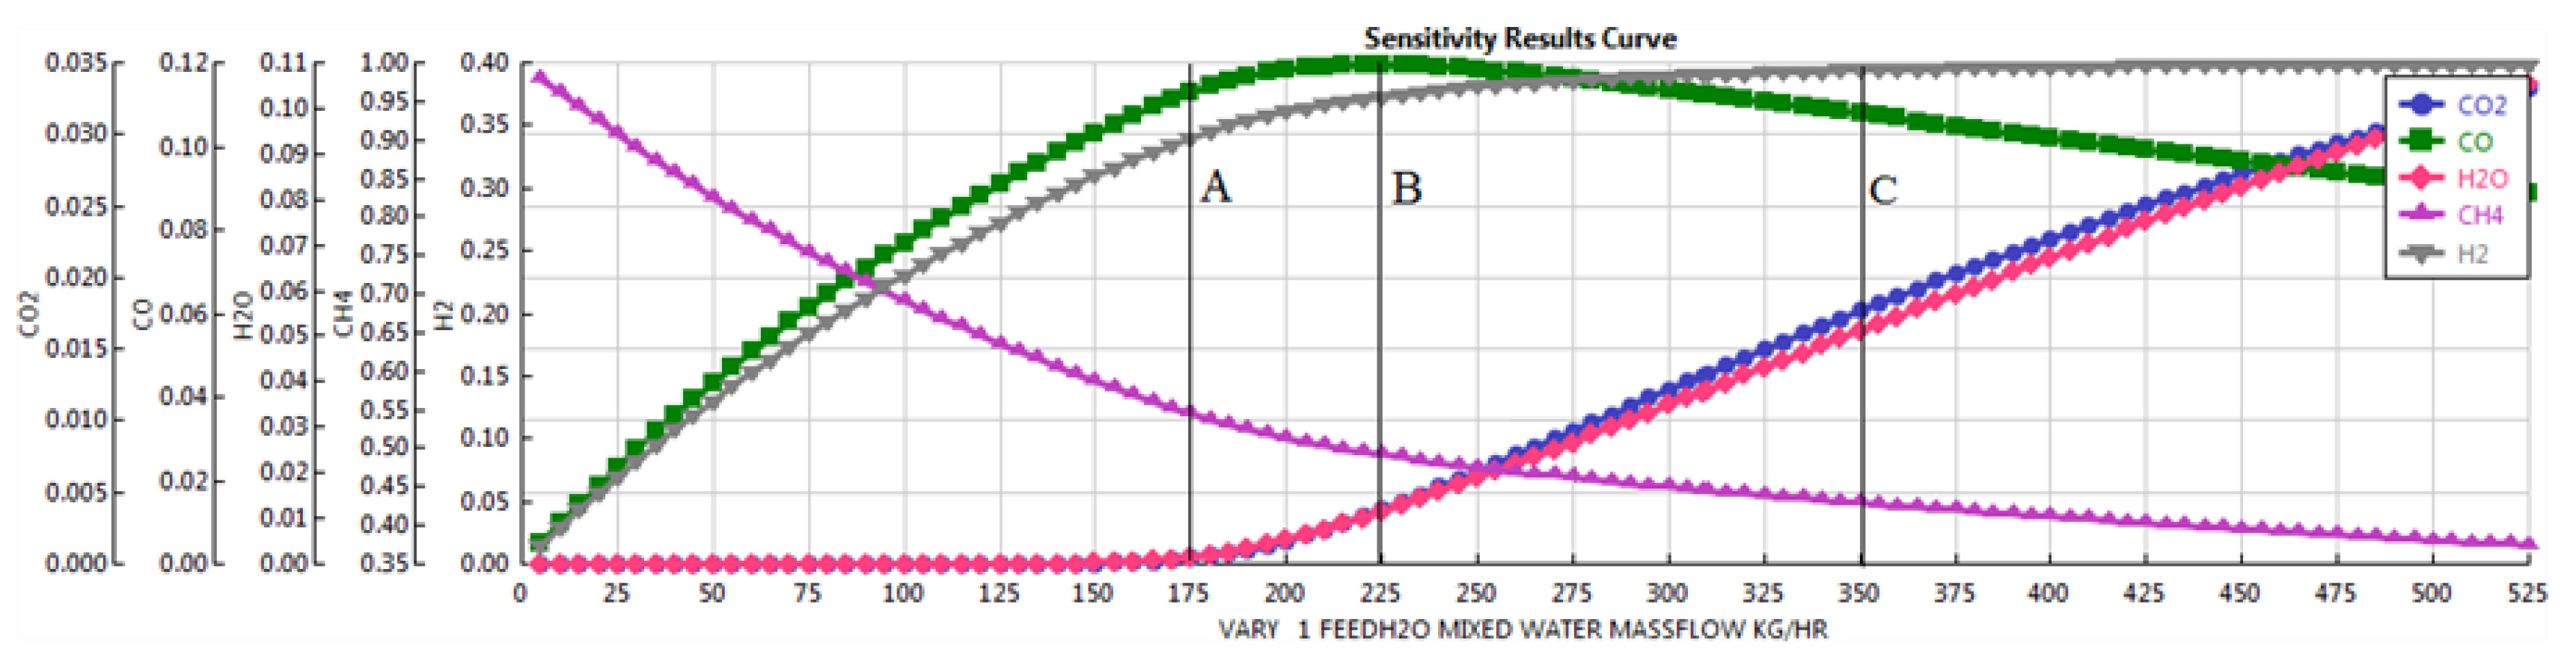
Figure 2 shows the sensitivity analysis when varying the mass flow of water from 10 kg/h to 510 kg/h with respect to the molar fractions of the product stream from the SMR. It can be seen that increasing the water mass flow increases the molar fraction of hydrogen in the SMR product. However, increasing the water mass flow beyond 350 kg/h has a negligible effect on hydrogen production. Line C (at 350 kg/h of H2O feed) corresponds to the point in which hydrogen molar fraction remains constant regardless the increase of the H2O flow rate. One of the remarkable observations can be seen with the help of Line B (at 225 kg/h of H2O feed), CO starts to decrease and CO2 starts to increase. This indicates that a water-gas-shift reaction would partially take place in the reformer after this point (225 kg/h of H2O). Meanwhile, Line A (at 175 kg/h of H2O feed) indicates highest conversion factor of H2O (at 175 kg/h of H2O feed).
4.1.2. SMR Molar Fractions vs. CH4 Feed
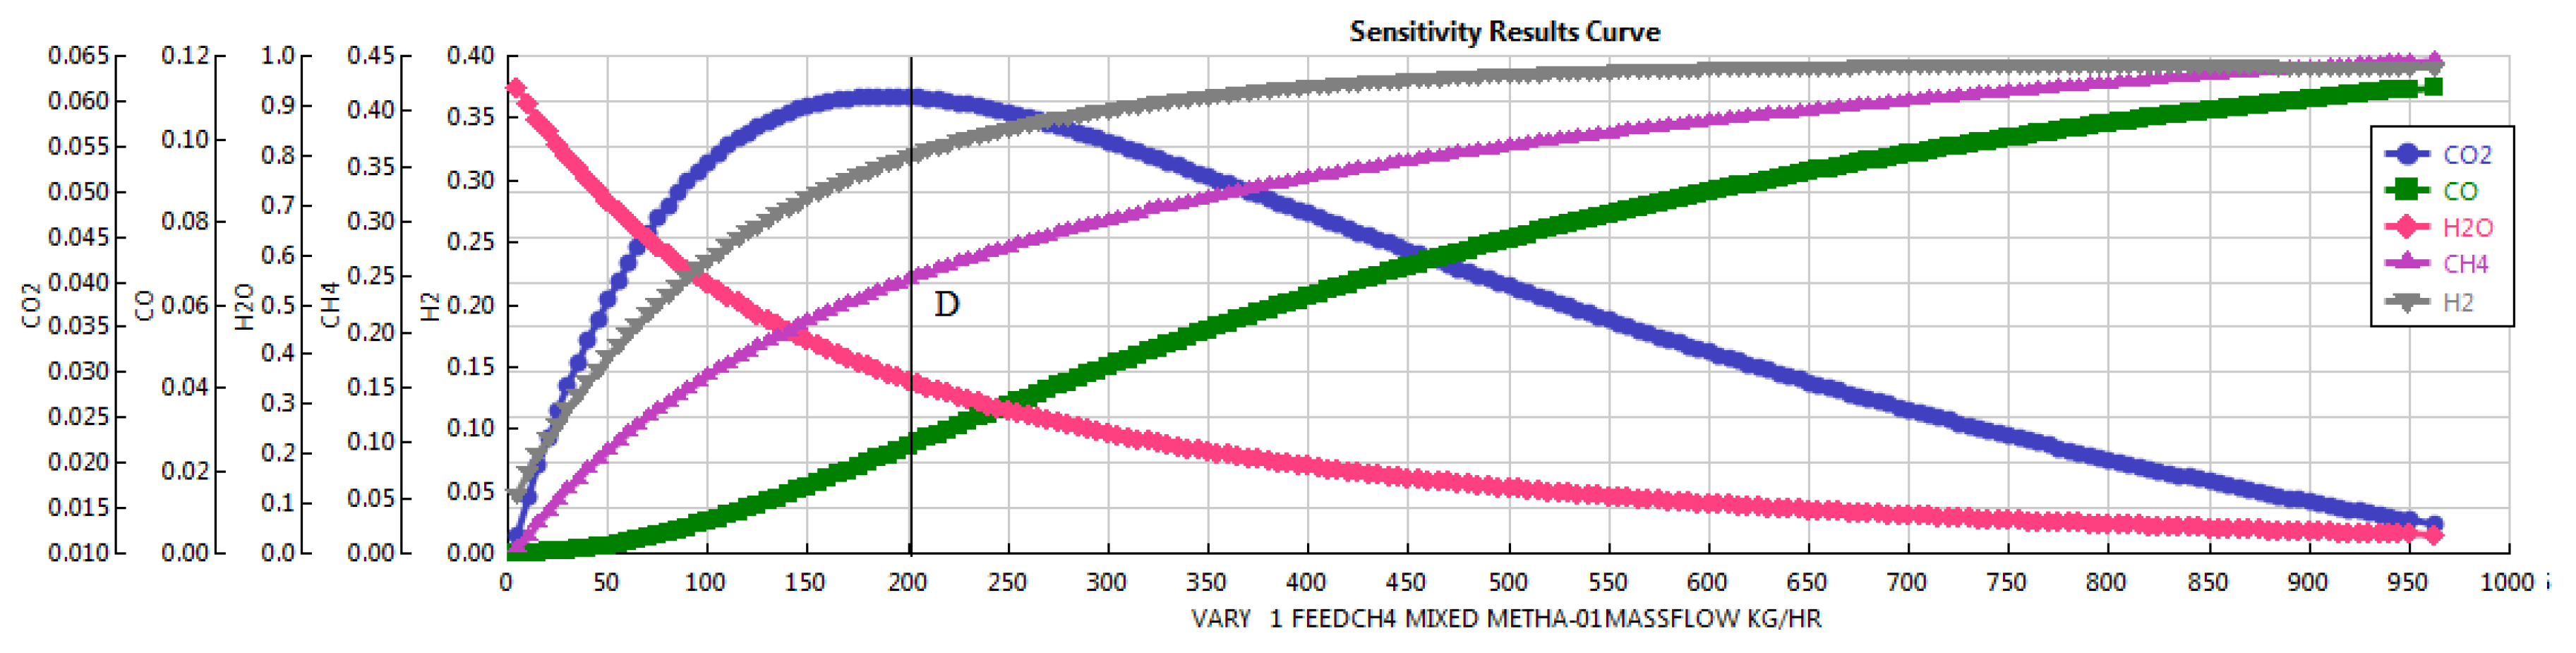
Figure 3 shows the sensitivity analysis when varying the mass flow of methane from 10 kg/h to 950 kg/h with respect to the molar fractions of the product stream from the SMR. Up to Line D, which corresponds to the H2O/CH4 feed mass ratio of 1.54 and methane conversion factor of 0.315, CO2 increases as the mass flow of CH4 increases. Beyond this line, CO2 starts to decrease and CO increases as the CH4 mass flow increases. High hydrogen molar fraction can be obtained by increasing the CH4 mass flow rate. However, this would be at the expense of overproducing CO. Moreover, CO2 production would also be reduced, which is undesirable to the case of CCS or even in the CARSOXY cycles.
4.1.3. SMR Molar Fractions vs. CH4 Split Ratio
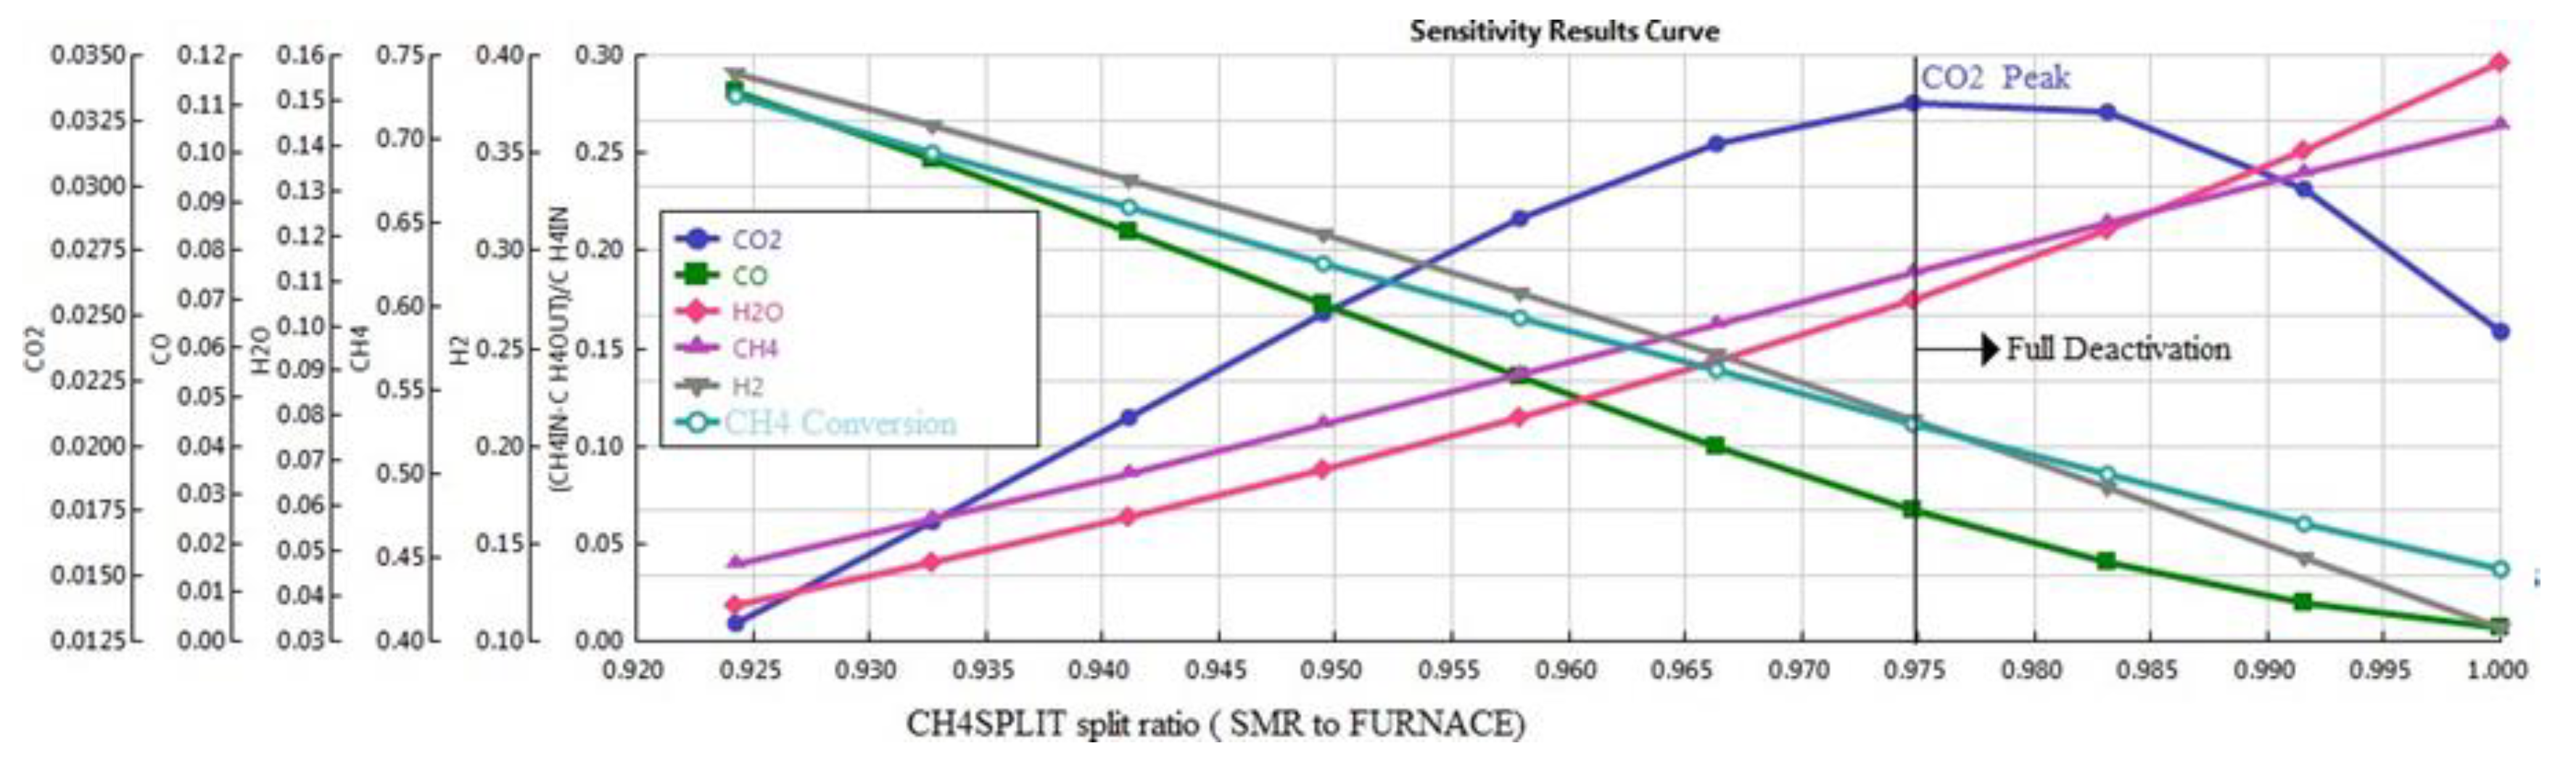
Figure 4 shows that varying the split ratio of the CH4SPLIT splitter (SMR to FUR NACE) is one of the very effective methods to control the molar fractions of the SMR. The conversion factor of CH4 decreases as the SMR receives more methane and the furnace receives less methane. This is due to the fact that the SMR becomes less activated as the furnace supplies less heat, which is due to the reduction of furnace feed of methane.
The CO2 molar fraction in the SMR product has significantly increased. In fact, the increase of the molar fraction curve of CO2 could be underestimated for the actual increase of CO2 moles in the products. It must be highlighted that the molar fraction of CO2 has increased even with the additional increase of the total moles—more CH4 moles—in the mixture. This is indeed desirable for CARSOXY production since high levels of CO2 is produced within the minimal conversion of CH4.
However, the splitting fraction of the SMR methane feed shall not exceed the limit where the CO2 molar fraction is at the peak since this would be the threshold of the full deactivation of the SMR which is basically neither in favor of the CARSOXY approach (i.e., high molar fractions of CO2 and CH4) nor the conventional approach (i.e., high CH4 conversion factor).
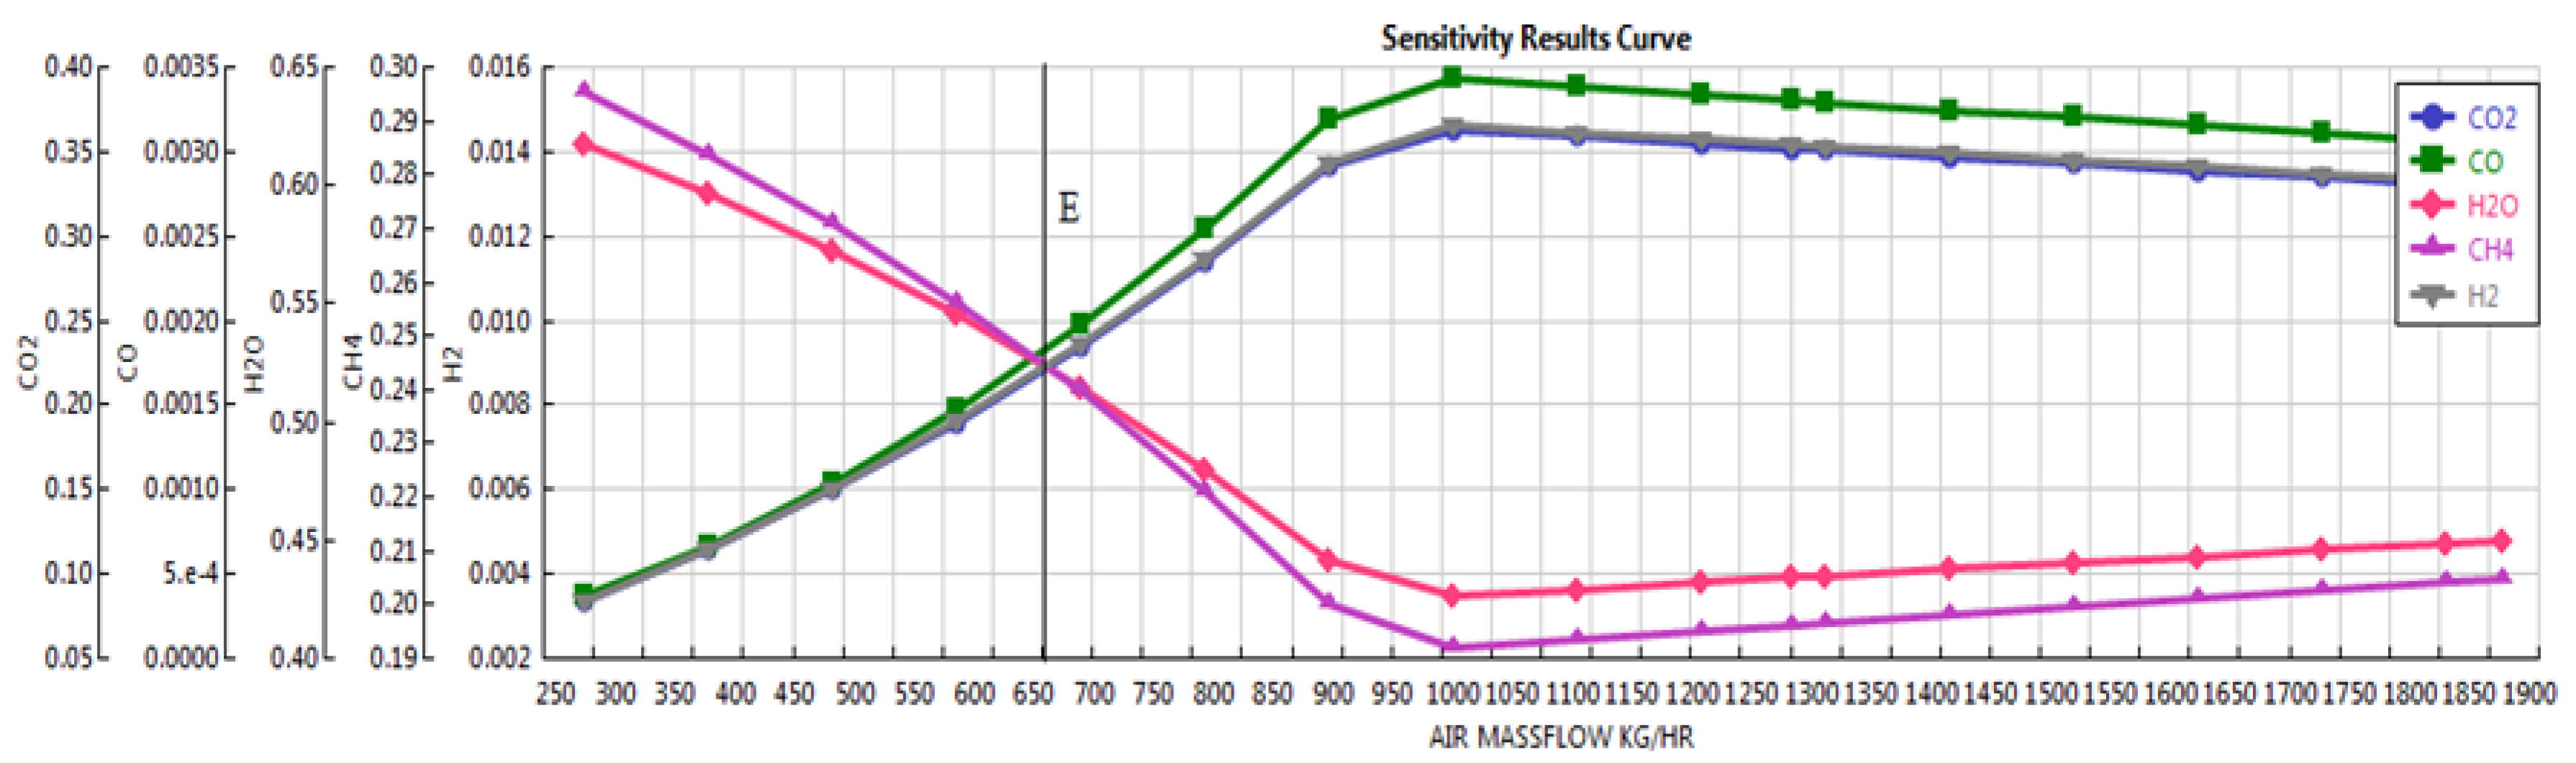
4.1.4. SMR Molar Fractions vs. Furnace Air Mass Flow Rate
Figure 5 shows the sensitivity analysis of varying the furnace air mass flow from 25 kg/h to 1900 kg/h with respect to the molar fractions of the product stream from the SMR. As the air mass flow rate increases up to 1000 kg/h, the production of hydrogen, carbon dioxide and carbon monoxide increases. However, it can be seen that the molar fraction of CH4 significantly drops. This is an expected and desirable result for conventional SMR. Unlike the conventional SMR, CARSOXY SMR aims to produce high levels CO2 within the minimal conversion of CH4. Therefore, Line E which corresponds to the Air flow rate of 650 kg/h could be the ultimate choice to compromise between both requirements.
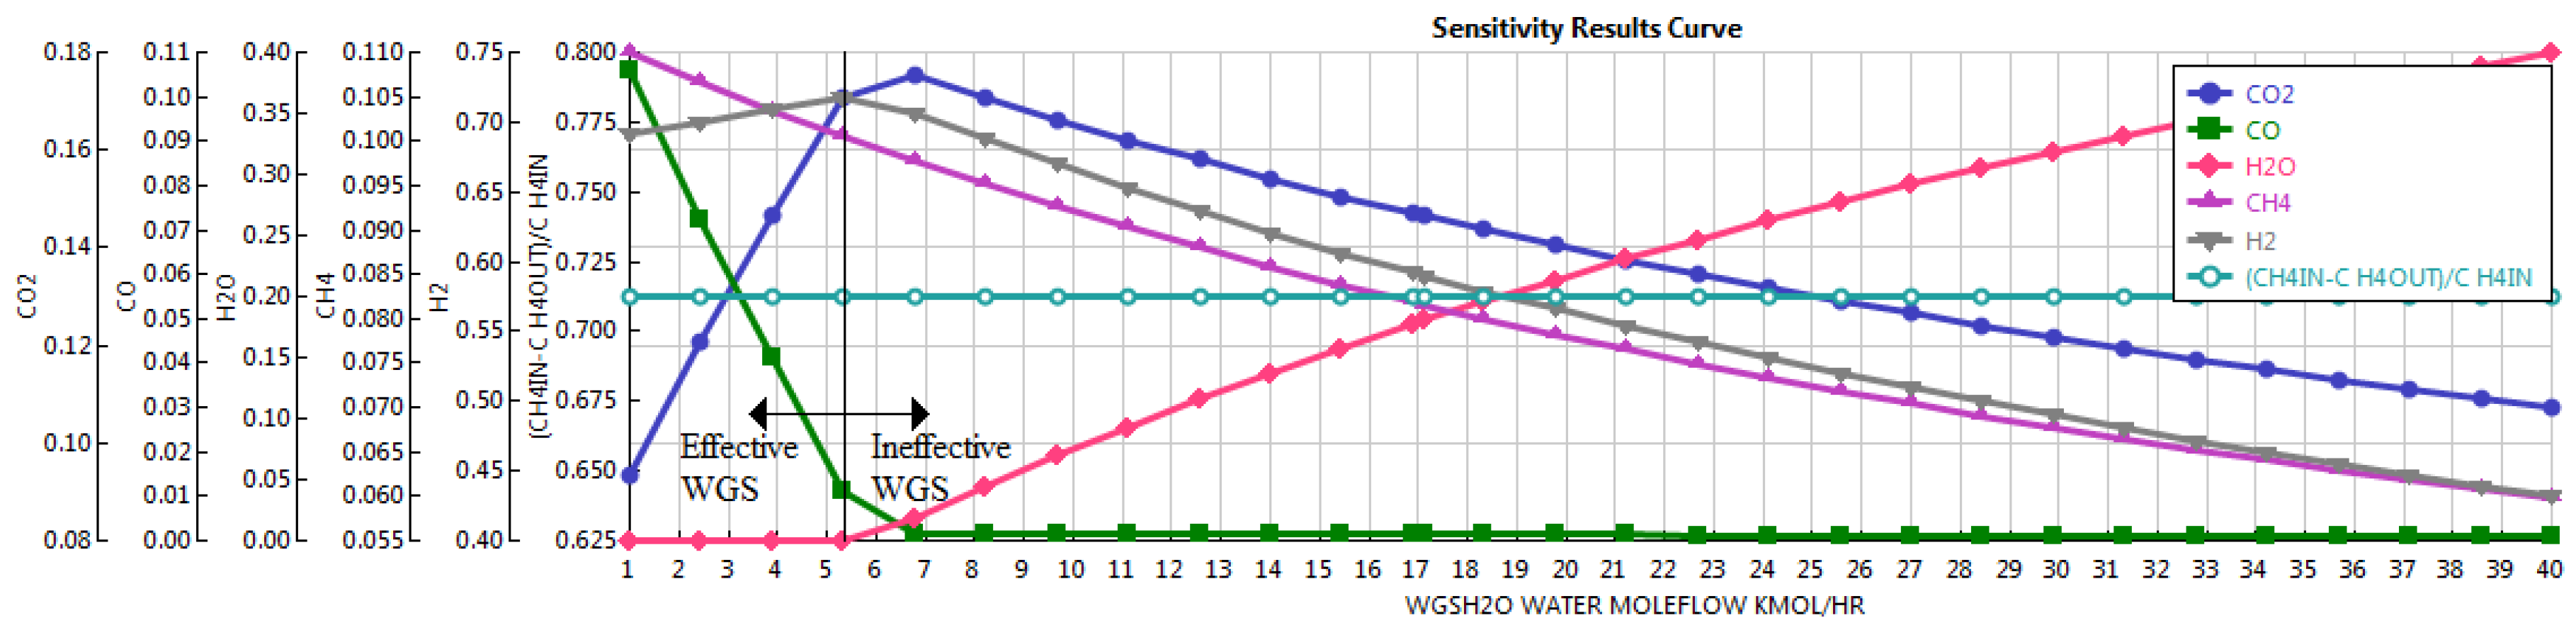
4.2. WGS Sub-Model Sensitivity Analysis
Figure 6 shows the molar fraction variation of the WGS product with respect to the variation of the H2O mole flow rate in the (WGSH2O) stream. It can be seen that increasing H2O mole flow rate up to 5.25 kmol/h ensures effective WGS. In the effective region, the WGS has zero molar fractions of H2O.
This indicates that all H2O molecules have reacted with carbon monoxide molecules to produce hydrogen and carbon dioxide. However, increasing the mole flow rate of H2O beyond 5.25 kmol/h does not increase hydrogen nor carbon dioxide production since the WGS approaches its ineffective region. Unreacted H2O molecules appear in the WGS product since no further reactions take place in this region. This increases H2O molar fraction. As a result, CH4, CO2, and H2 molar fractions decrease. However, their actual moles remain constant. The ineffective region allows any desired modification of the H2O molar fraction in order to match the required H2O level in any CARSOXY blend.
4.3. ASU Sub-Model Sensitivity Analysis
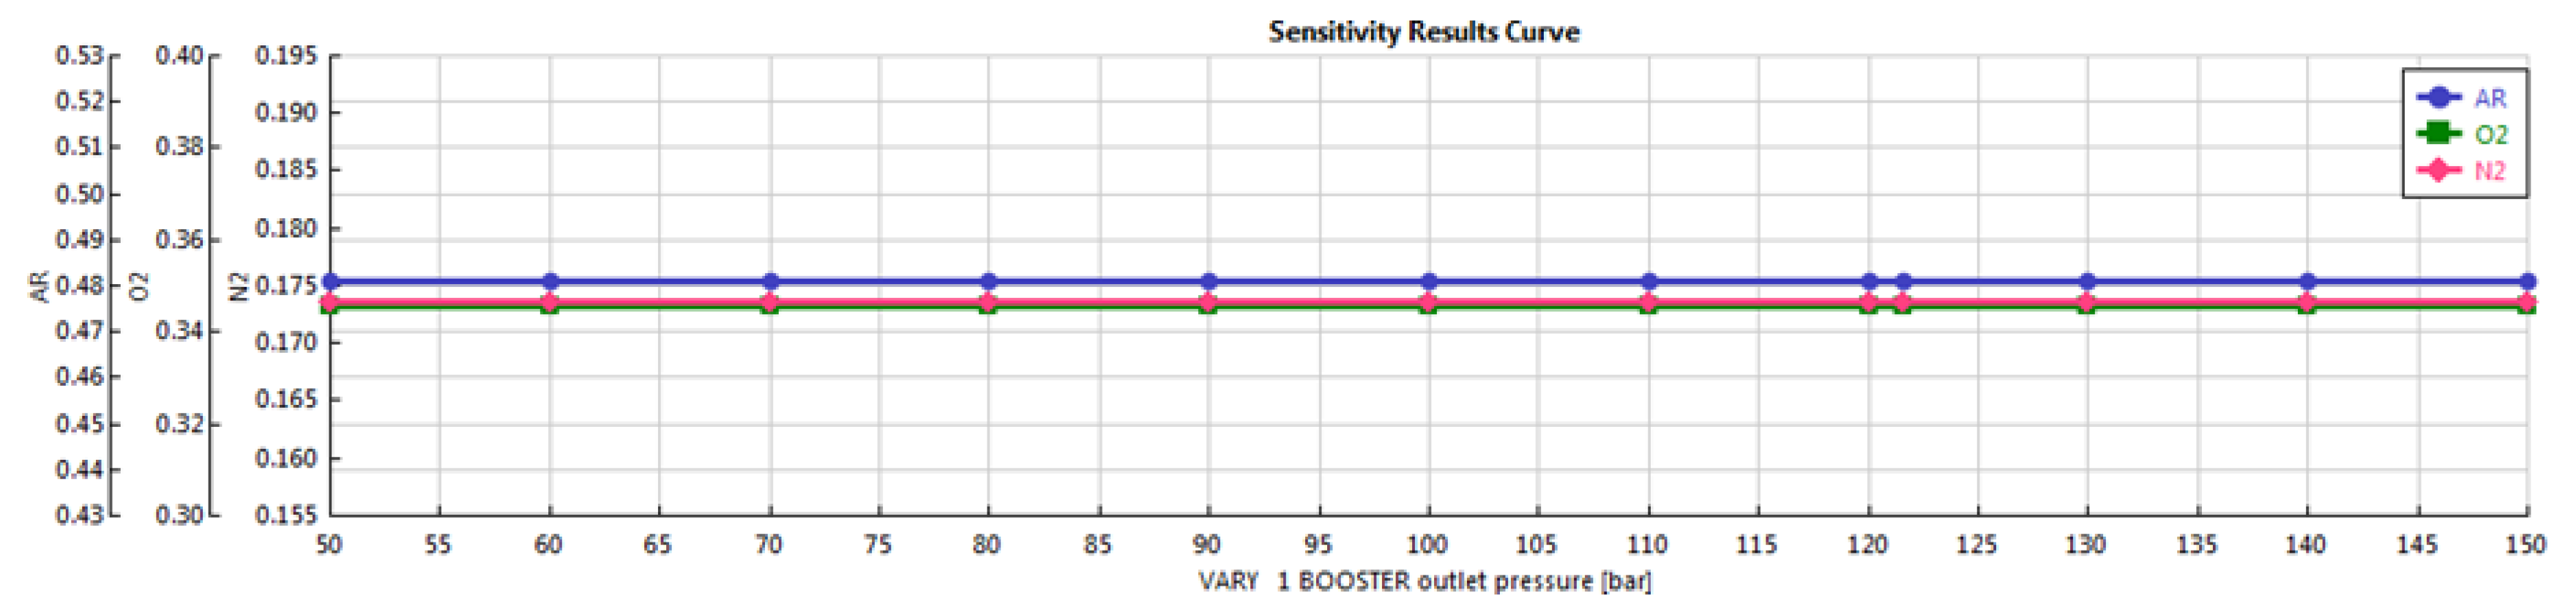
4.3.1. ARO2RECT Molar Fractions vs. BOOSTER Discharge Pressure
Figure 7 shows the results of the molar fractions of the (ARO2RECT) stream with respect to varying the discharge pressure of the (BOOSTER). It can be seen that the molar fractions of the (ARO2RECT) stream are insensitive towards the variation of the discharge pressure. However, this result shall not be misinterpreted, as the discharge pressure also affects other parameters such as the distillate rate, boil-up rate and other heat duties. It can be seen from Table 2 that the discharge pressure final value is 76 bar, while the initial value is 121.59 bar. Since the results have been plotted for the initial values, the following set of results is only relevant for the 121.59 bar of the (BOOSTER) discharge pressure.
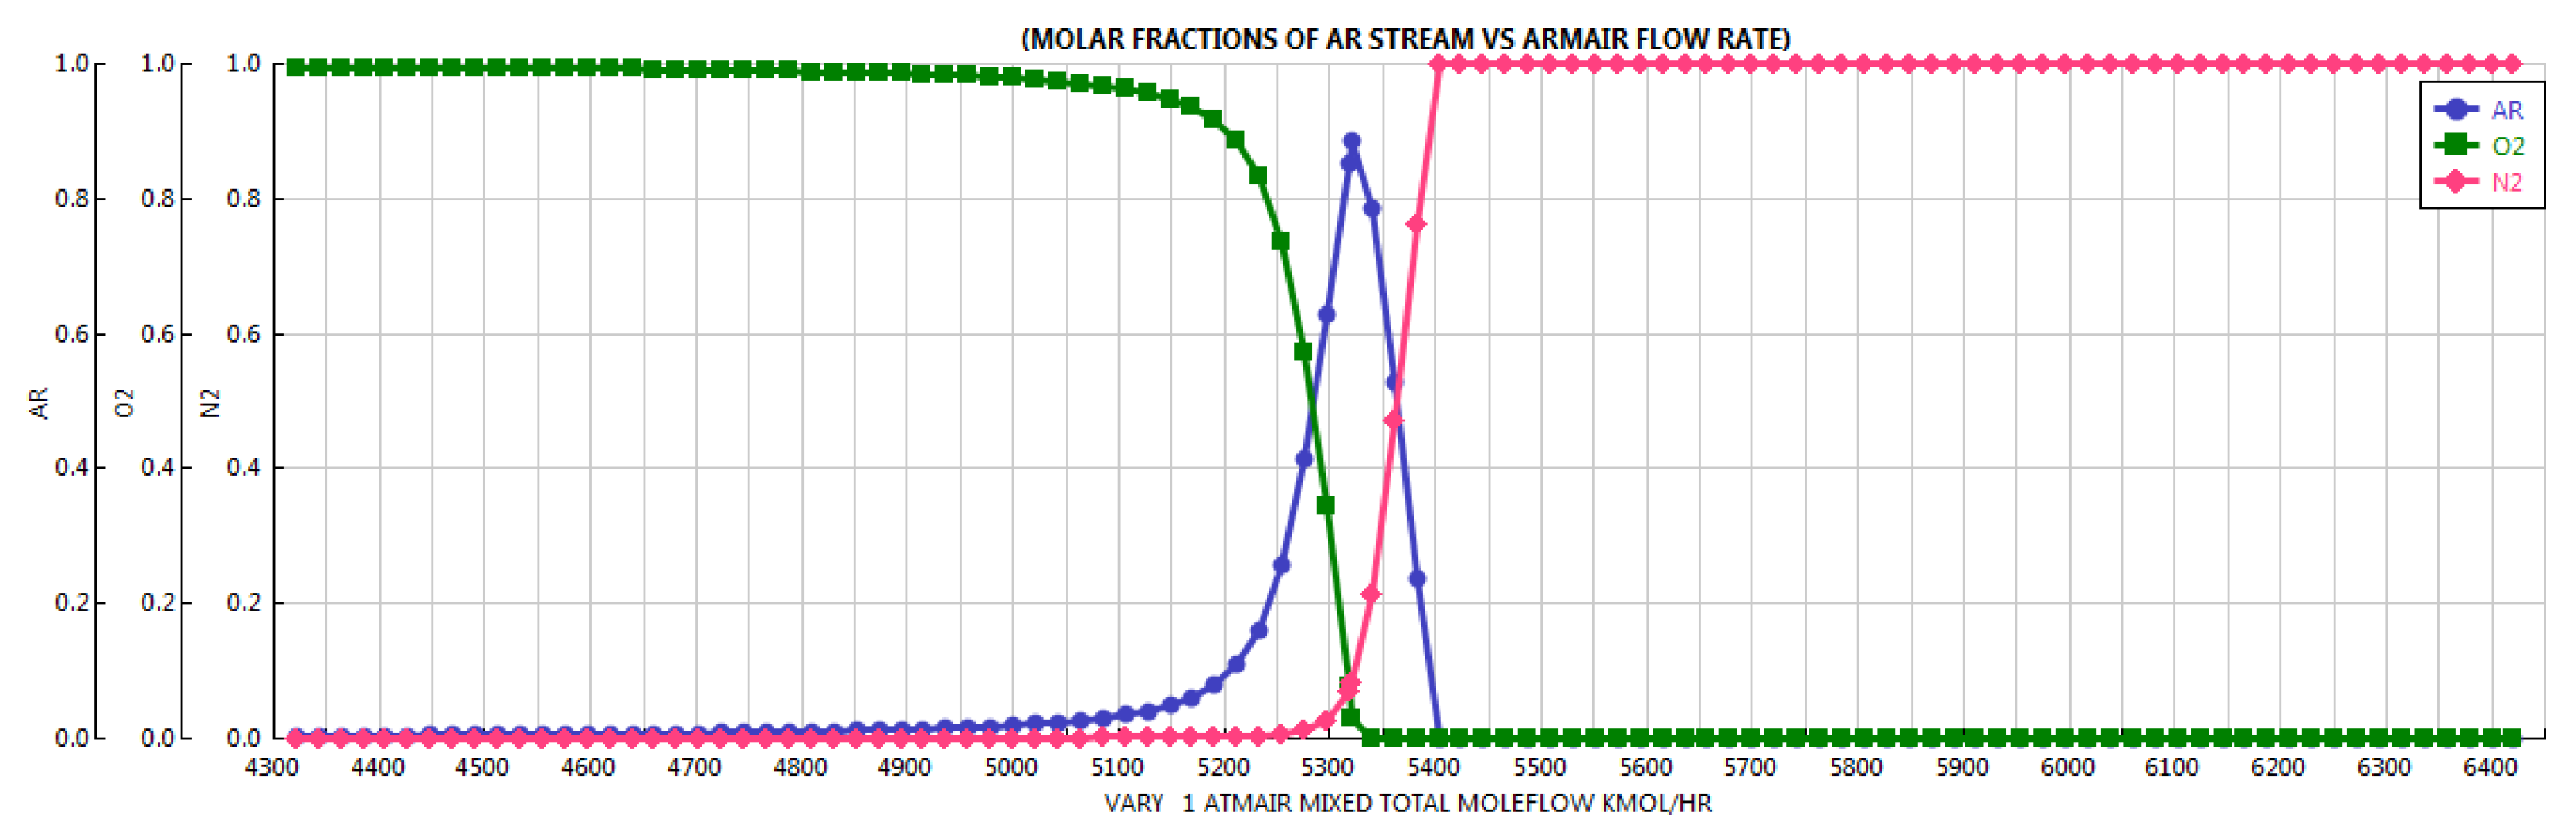
4.3.2. ARO2RECT Molar Fractions vs. ATMIR Mole Flow Rate
Figure 8 shows the molar fractions of Ar, O2, and N2 in the (AR) stream. The molar fractions correspond to the variation of the mole flow rates of the (ATMAIR) stream in the interval of 4300–6400 kmol/h. In the interval of 4300–4900 kmol/h the LPDC is incapable of separating argon from oxygen. The separation process starts only when the flow rate of the (ATMAIR) is approximately in the interval of 4900–5400 kmol/h. The highest purity argon is obtained at 5350 kmol/h with minor residuals of nitrogen and oxygen. Beyond 5400 kmol/h, the (AR) stream is only composed of nitrogen, which indicates that the number of stages in the LPDC has to be adjusted or the (ARO2RECT) product stage has to be changed.
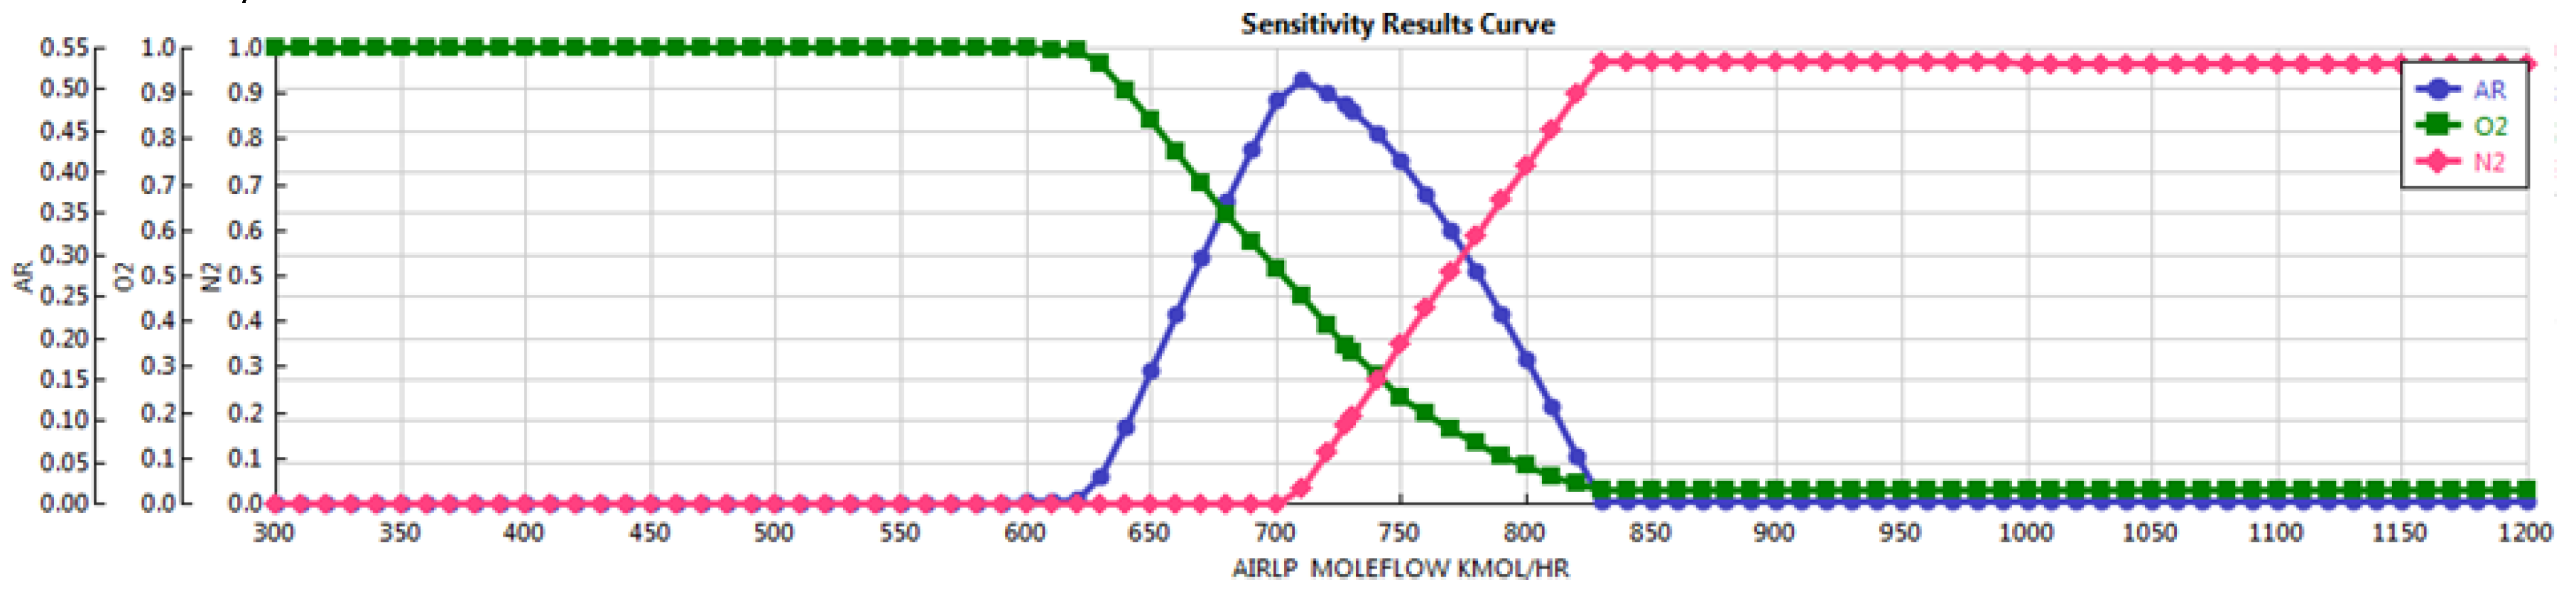
4.3.3. ARO2RECT Molar Fractions vs. AIRLP Mole Flow Rate
Figure 9 shows the molar fractions of Ar, O2, and N2 in the (AR) stream. The molar fractions correspond to the variation of the mole flow rates of the (AIRLP) stream in the interval of 300–1200 kmol/h. The results in Figure 9 followed the same pattern as those in Figure 8. However, the separation process starts only when the flow rate of the (AIRLP) is approximately in the interval of 610–840 kmol/h.
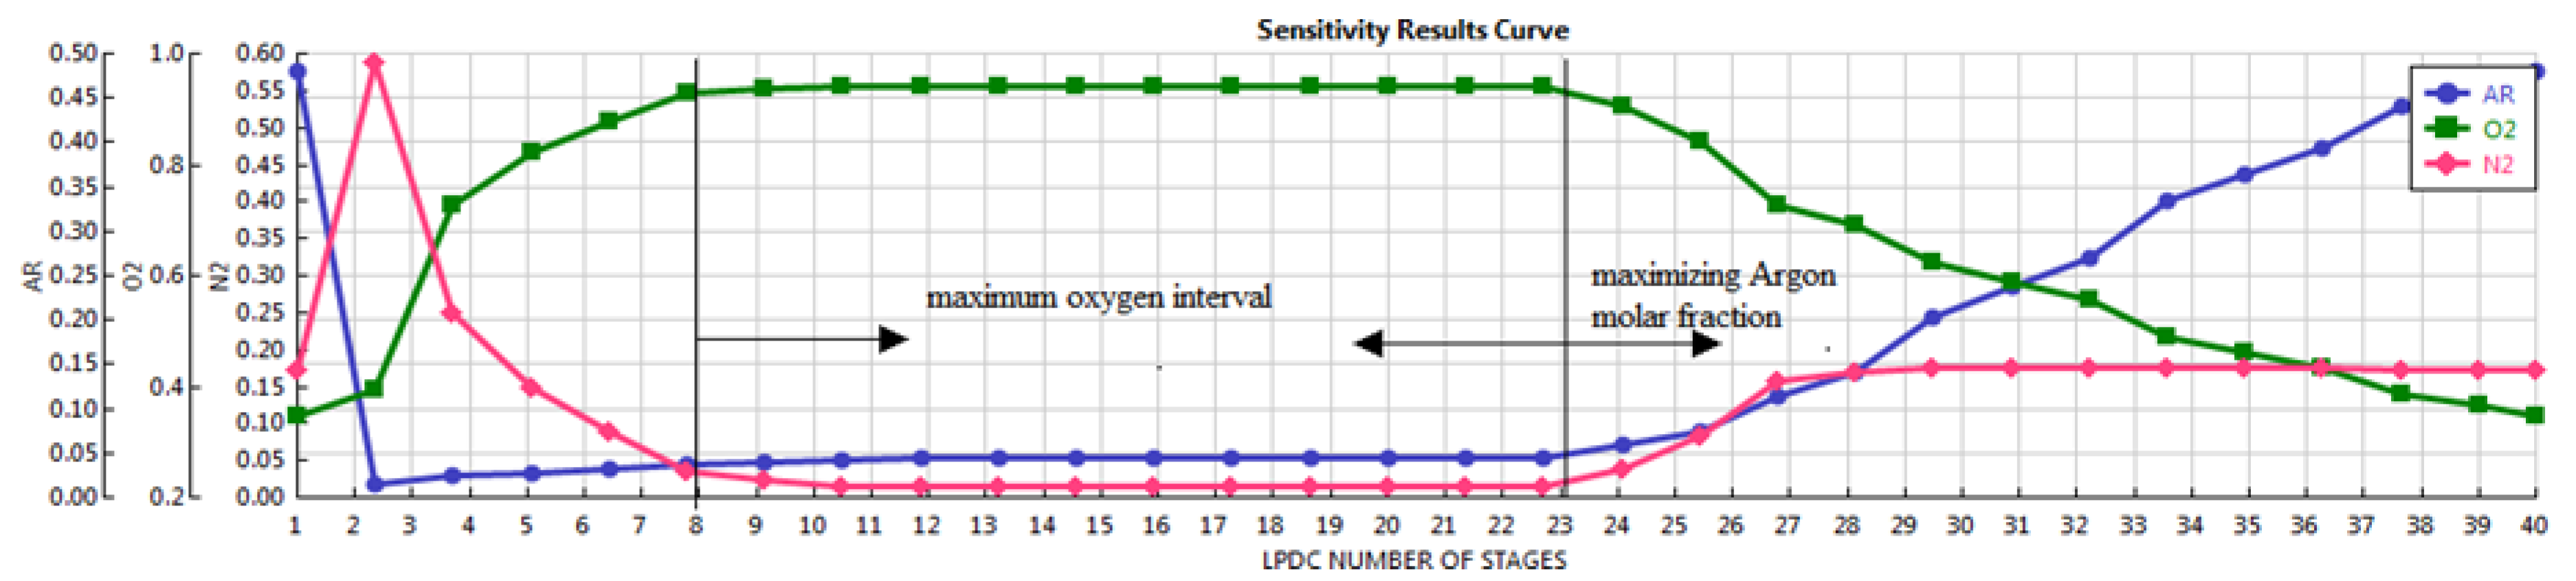
4.3.4. ARO2RECT Molar Fractions vs. LPDC Number of Stages
As demonstrated in Figure 10 the molar fractions of oxygen in the (ARO2RECT) can be maximized if the number of LBDC stages is in the interval of 8–23 stages. However, this interval provides a very low level of argon molar fraction. As the number of stages increases beyond 23 stages, the molar fraction of argon increases. Meanwhile, the molar fraction of oxygen decreases and the molar fraction of nitrogen remain approximately unaffected.
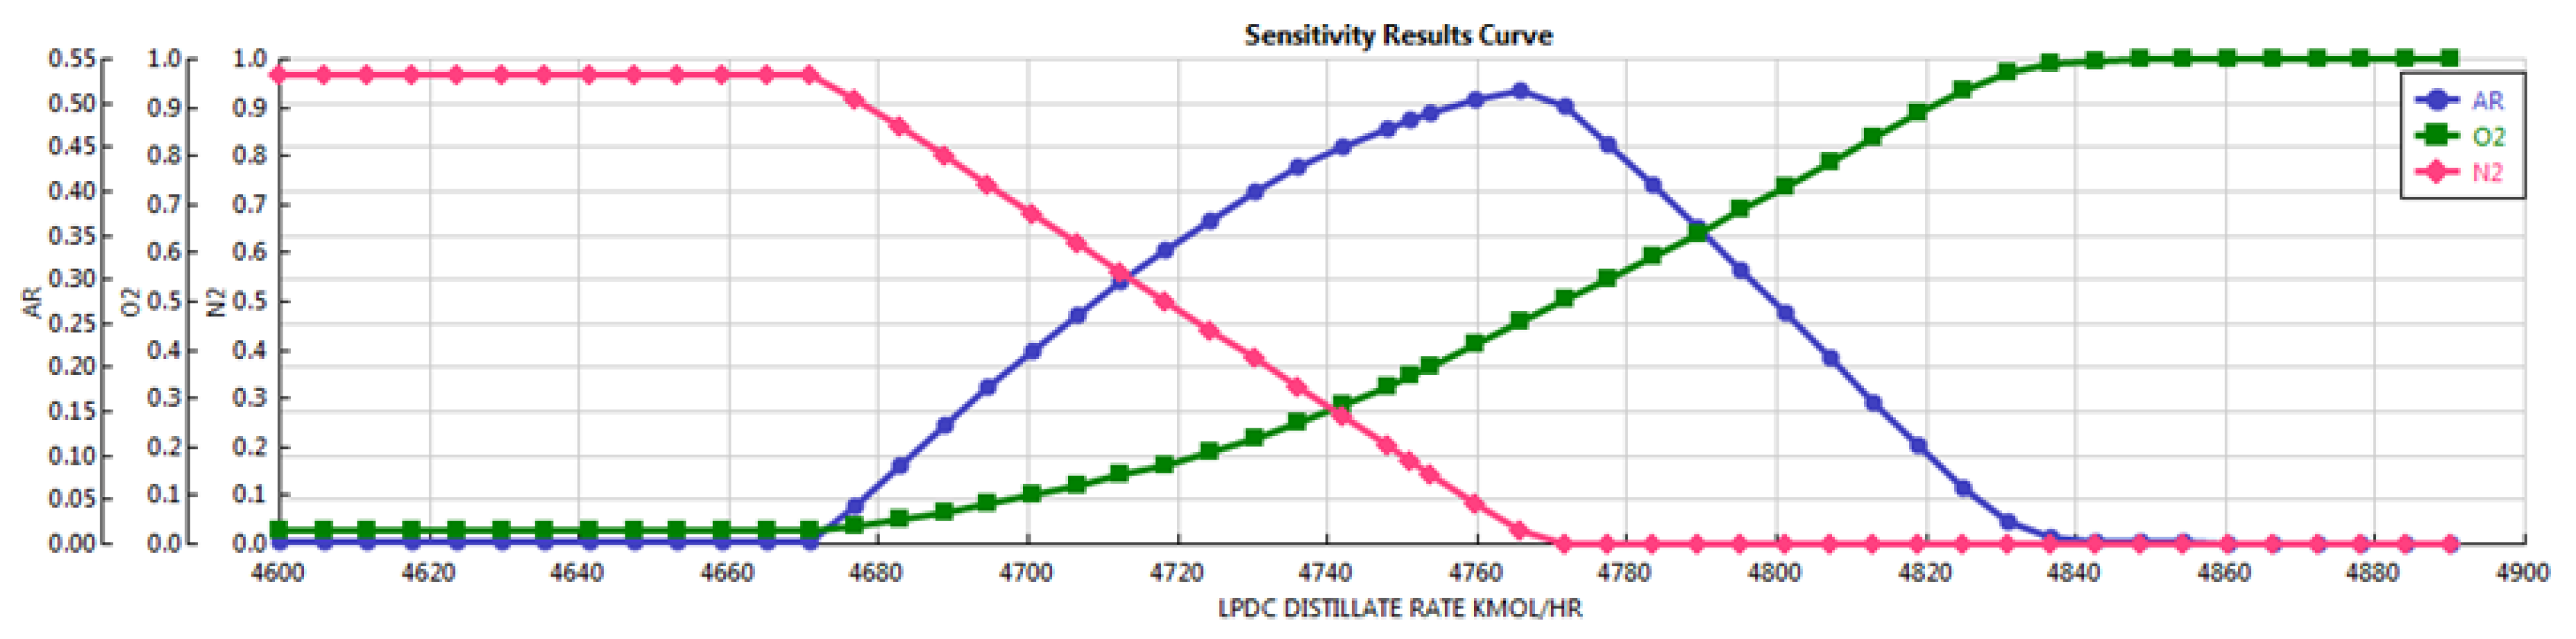
4.3.5. ARO2RECT Molar Fractions vs. LPDC Distillate Rate
It can be seen in Figure 11 that the (LPDC) has the highest molar fraction of argon at a distillate rate of approximately 4765 kmol/h. The oxygen and nitrogen molar fraction curves followed approximately the opposite patterns of those in Figure 8 and Figure 9. It can be generally concluded that the molar fraction of oxygen is directly proportional to the distillate rate of the (LPDC) but inversely proportional to air flow rates in the (ATMIR) and (AIRLP) streams. In the three cases (i.e., varying the (ATMIR) flow rate, (AIRLP) flow rate, (LPDC) distillate rate), nitrogen molar fraction followed approximately the opposite curve-patterns of oxygen.
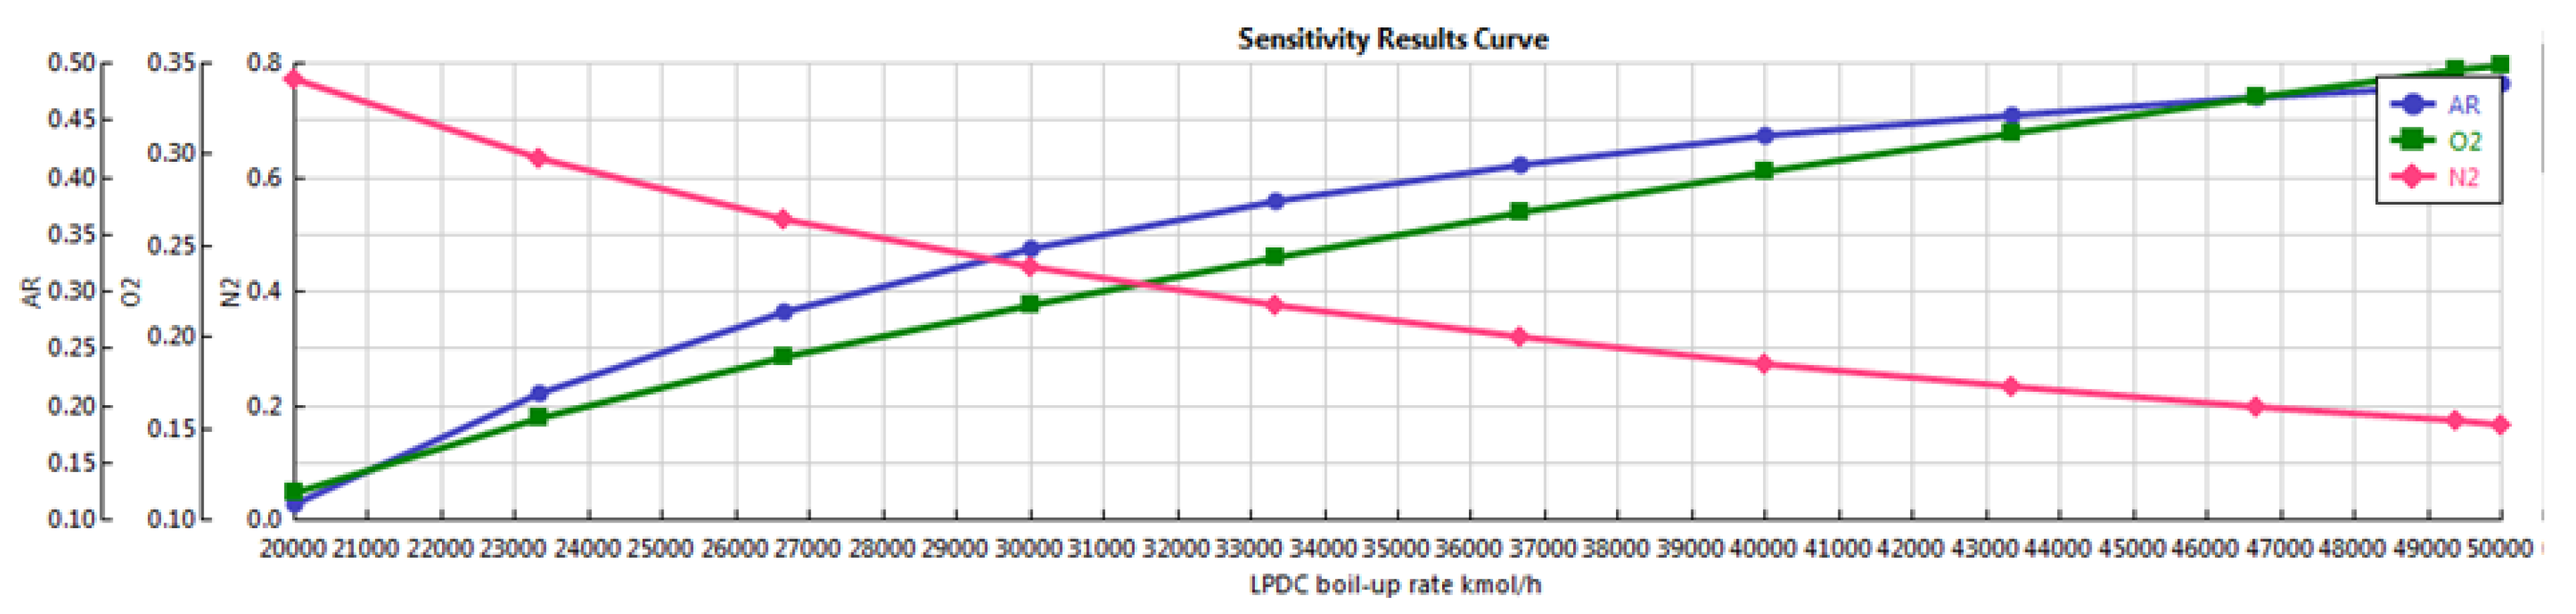
4.3.6. ARO2RECT Molar Fractions vs. LPDC Boil-Up Rate
Figure 12 illustrates that as the boil-up rate increases in the (LPDC), the molar fractions of oxygen and argon increase in the (ARO2RECT) as well. Meanwhile, the molar fraction of nitrogen decreases.
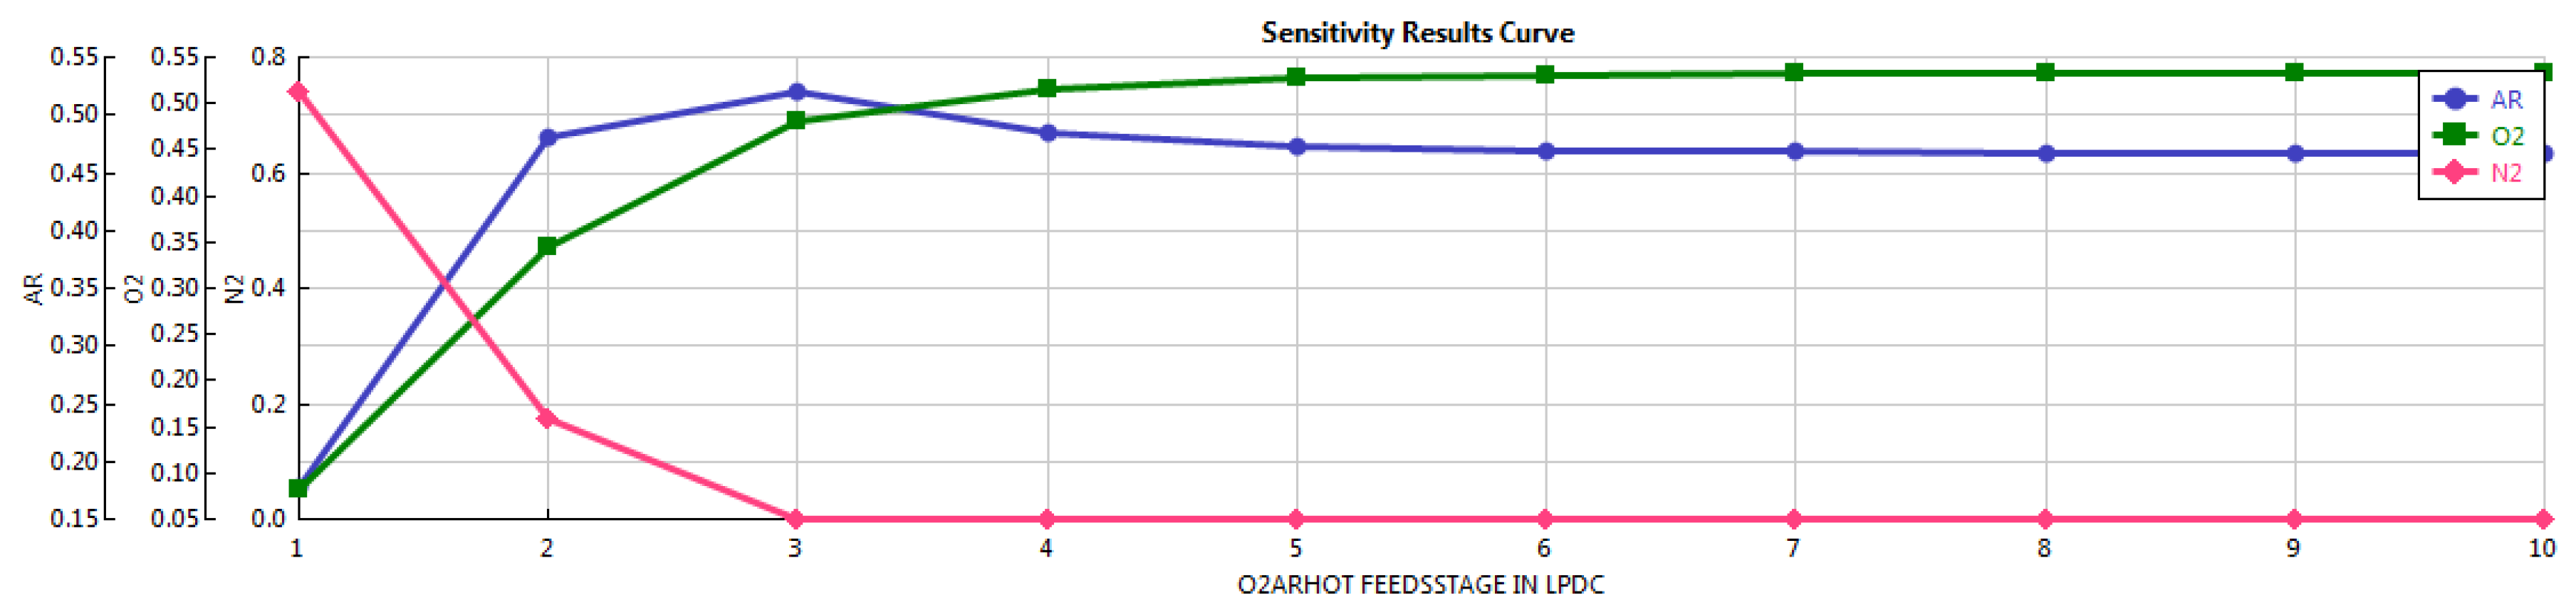
4.3.7. ARO2RECT Molar Fractions vs. O2ARHOT Feed Stage Location in the LPDC
Each column in the ASU sub-model is divided into a series of stages, which are numbered from top down. Figure 13 shows that a mixture with high levels of argon and oxygen can be harvested with a zero residual of nitrogen if the feed stage of the (ARO2RECT) is over stage 3. The molar fractions of oxygen and argon can reach approximately 50% each between the third and the fourth stage.
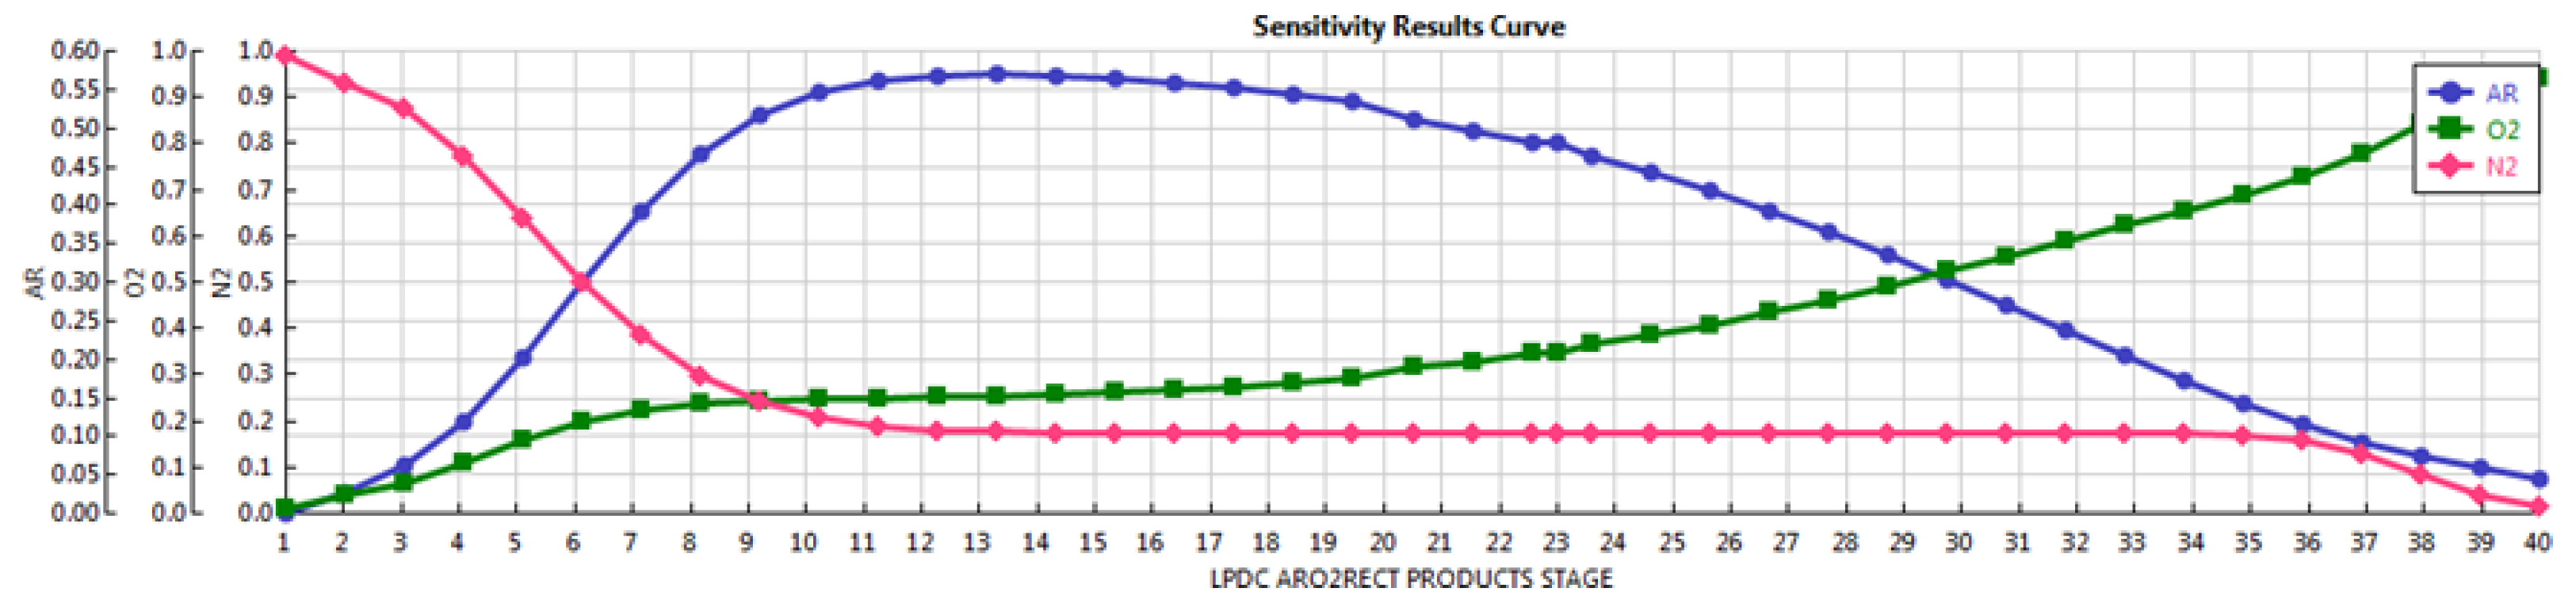
4.3.8. ARO2RECT Molar Fractions vs. ARO2RECT and O2LPDC Product Stage Locations in the LPDC
It can be seen from Figure 14 that a mixture with dominant molar fraction of argon can be obtained in the interval of 7–30 of (ARO2RECT) product stage. If the mixture is required to contain a dominant molar fraction of oxygen, then the (ARO2RECT) product stage shall be over 30. The molar fractions in the (ARO2RECT) are insensitive of the product stage location of the (O2LPDC) stream.
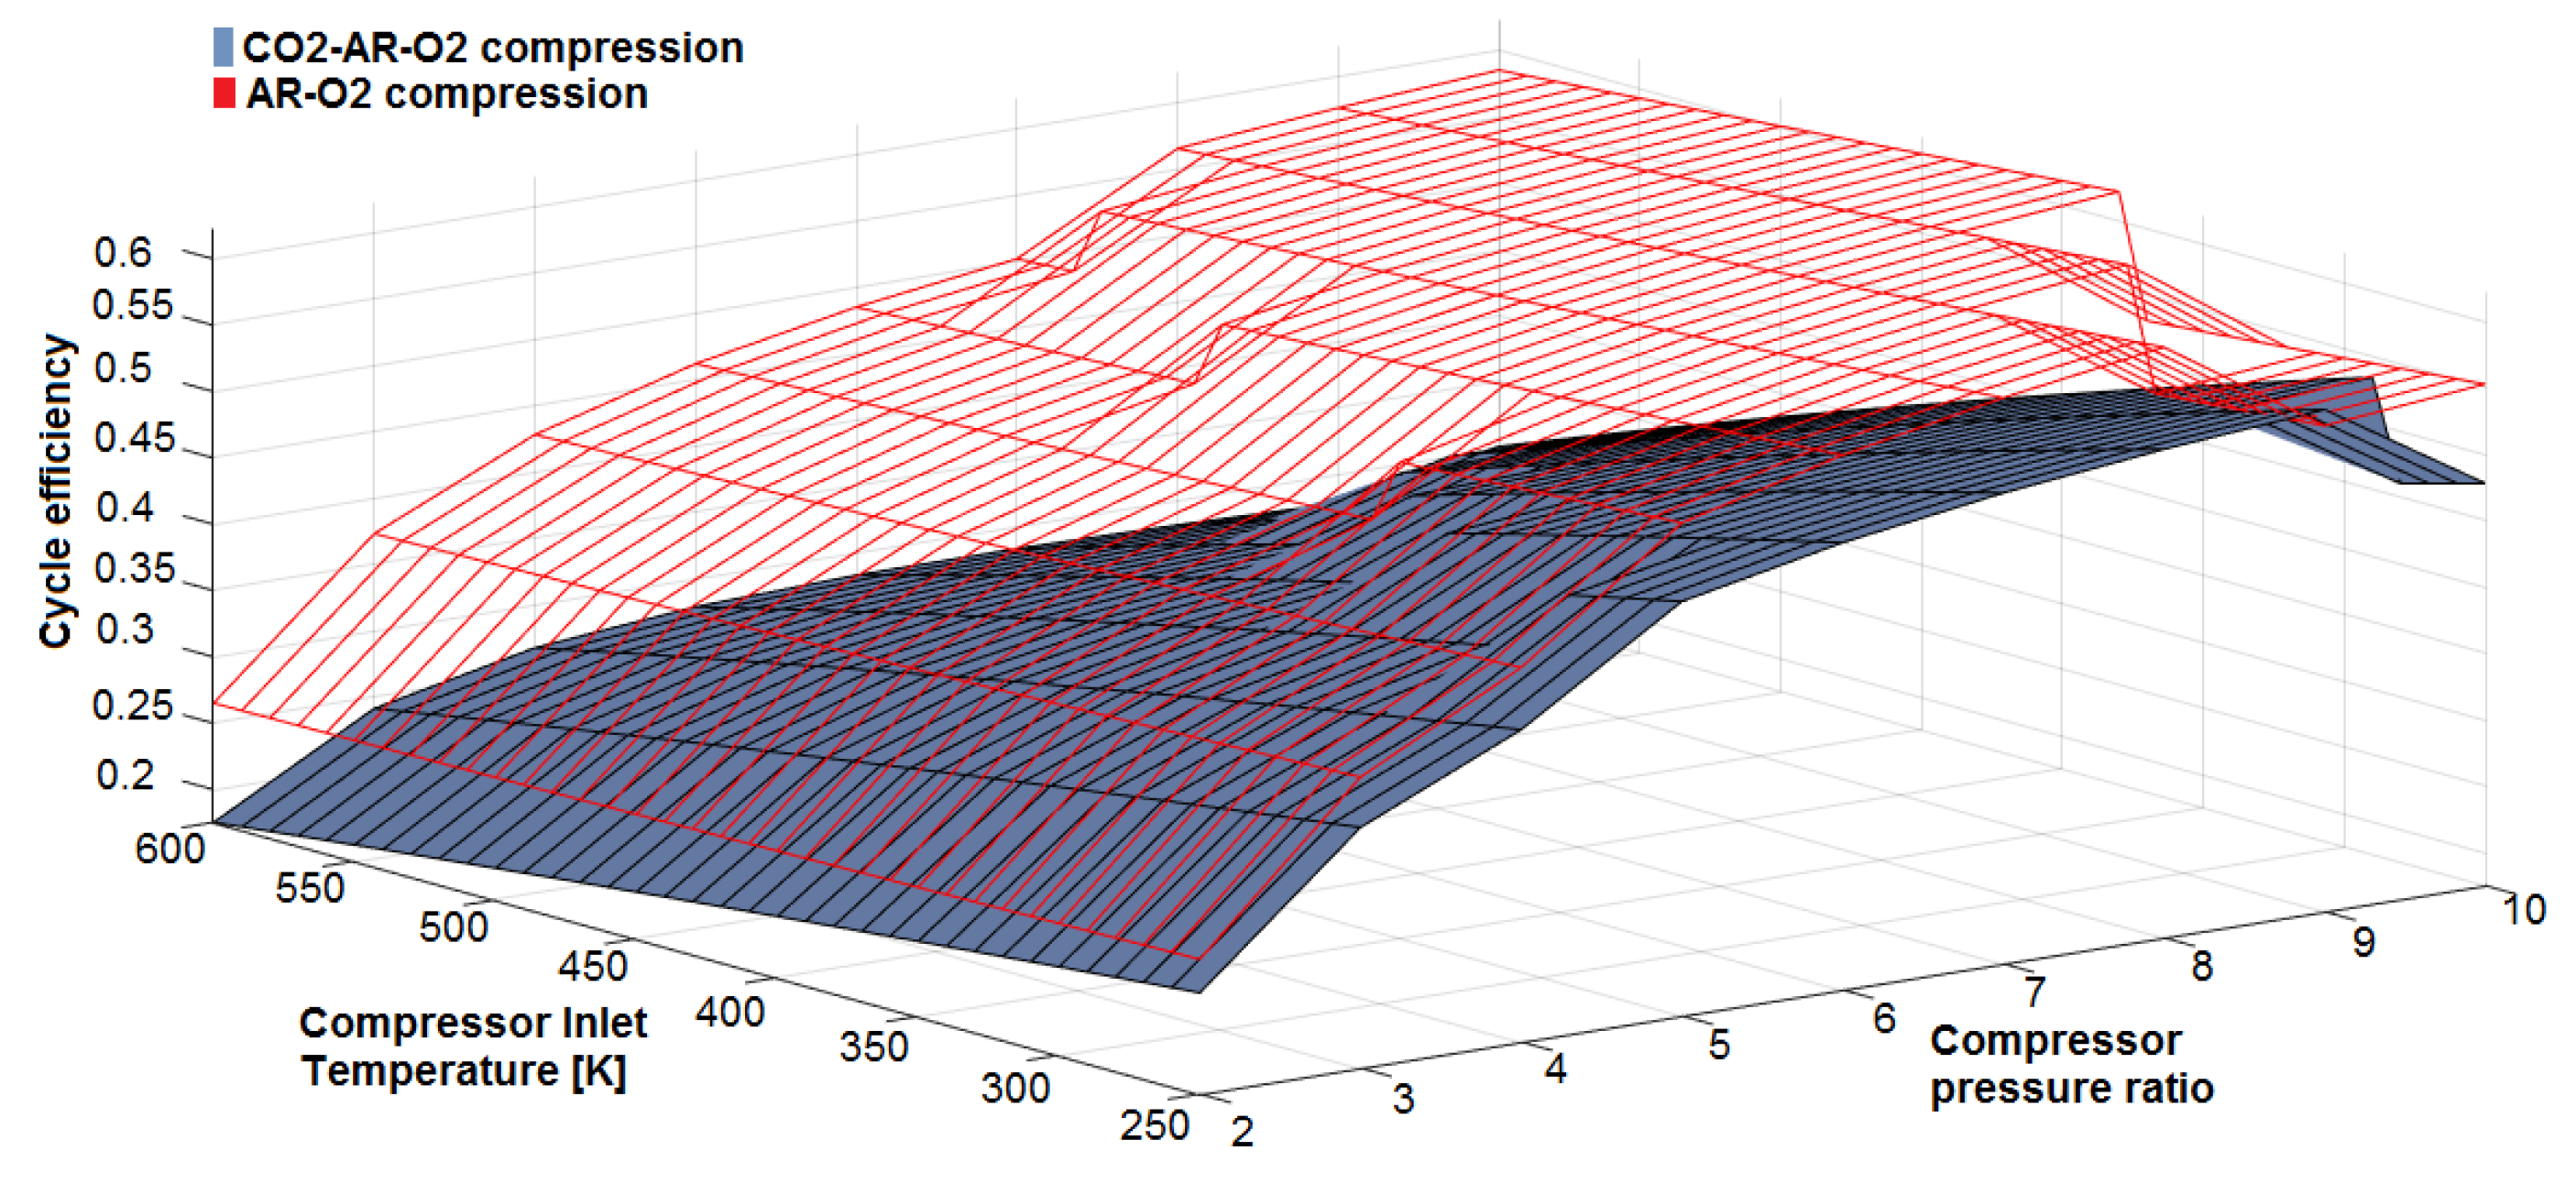
4.3.9. Oxygen-Argon-Carbon Dioxide Compression vs. Oxygen-Argon Compression
As it has been discussed previously in section (3), the compressor is fed by the oxygen- argon stream (ARO2RECT) instead of a carbon dioxide-argon stream as recommended by reference [3]. Therefore, the results in Figure 15 have been produced using the MATLAB code, discussed in section (3), to validate this diversion from the reference. Through this theoretical investigation, it can be clearly seen that the oxygen-argon compression process ensures higher cycle efficiency than the oxygen-argon-carbon dioxide compression. It is worth mentioning that the carbon dioxide is supplied to the combustion chamber of the gas turbine by the (S13) stream at the high level of pressure and requires no additional compression. This is another reason for choosing oxygen-argon compression instead of oxygen-argon-carbon dioxide compression.
4.4. Final Results
The sensitivity analysis provided guidelines to adjust the ASU-SMR-WGS-PSA-HXGT cycle in order to fulfill the requirements of any desired performance. The initial values of the cycle parameters, which are shown in Table 2, have been adjusted to the final values to provide the required molar fractions of CARSOXY. Table 4 shows the molar fractions of argon and oxygen which are supplied by the (ARO2RECT) stream together with the molar fractions of methane, carbon dioxide and steam which are supplied by the stream (S13) to the gas turbine cycle. The results have been obtained throughout approximately 30 numerical attempts. Errors can be farther decreased using more attempts. Nevertheless, the emphasis is to prove the concept. Hydrogen, nitrogen, and oxygen are also produced with high purity in the ASU-SMR-WGS-PSA-CCS-HXGT cycle by the N2, H2FINAL, and O2 streams, respectively.
It is important to highlight that the ASU-SMR-WGS-PSA-CCS-HXGT model is functional in any required capacity (from a laboratory-based scale to a large-scale industry). This can be achieved provided that a constant ratio is used to adjust all mole flow rates, boil- up mole rates and distillate mole rates. On this note, Table 5 shows the required mole flow rates of feed streams, the anticipated mole flow rates of product streams, (LPDC) boil-up rate and distillate rates for 1 kmol/h of methane.
5. Discussion
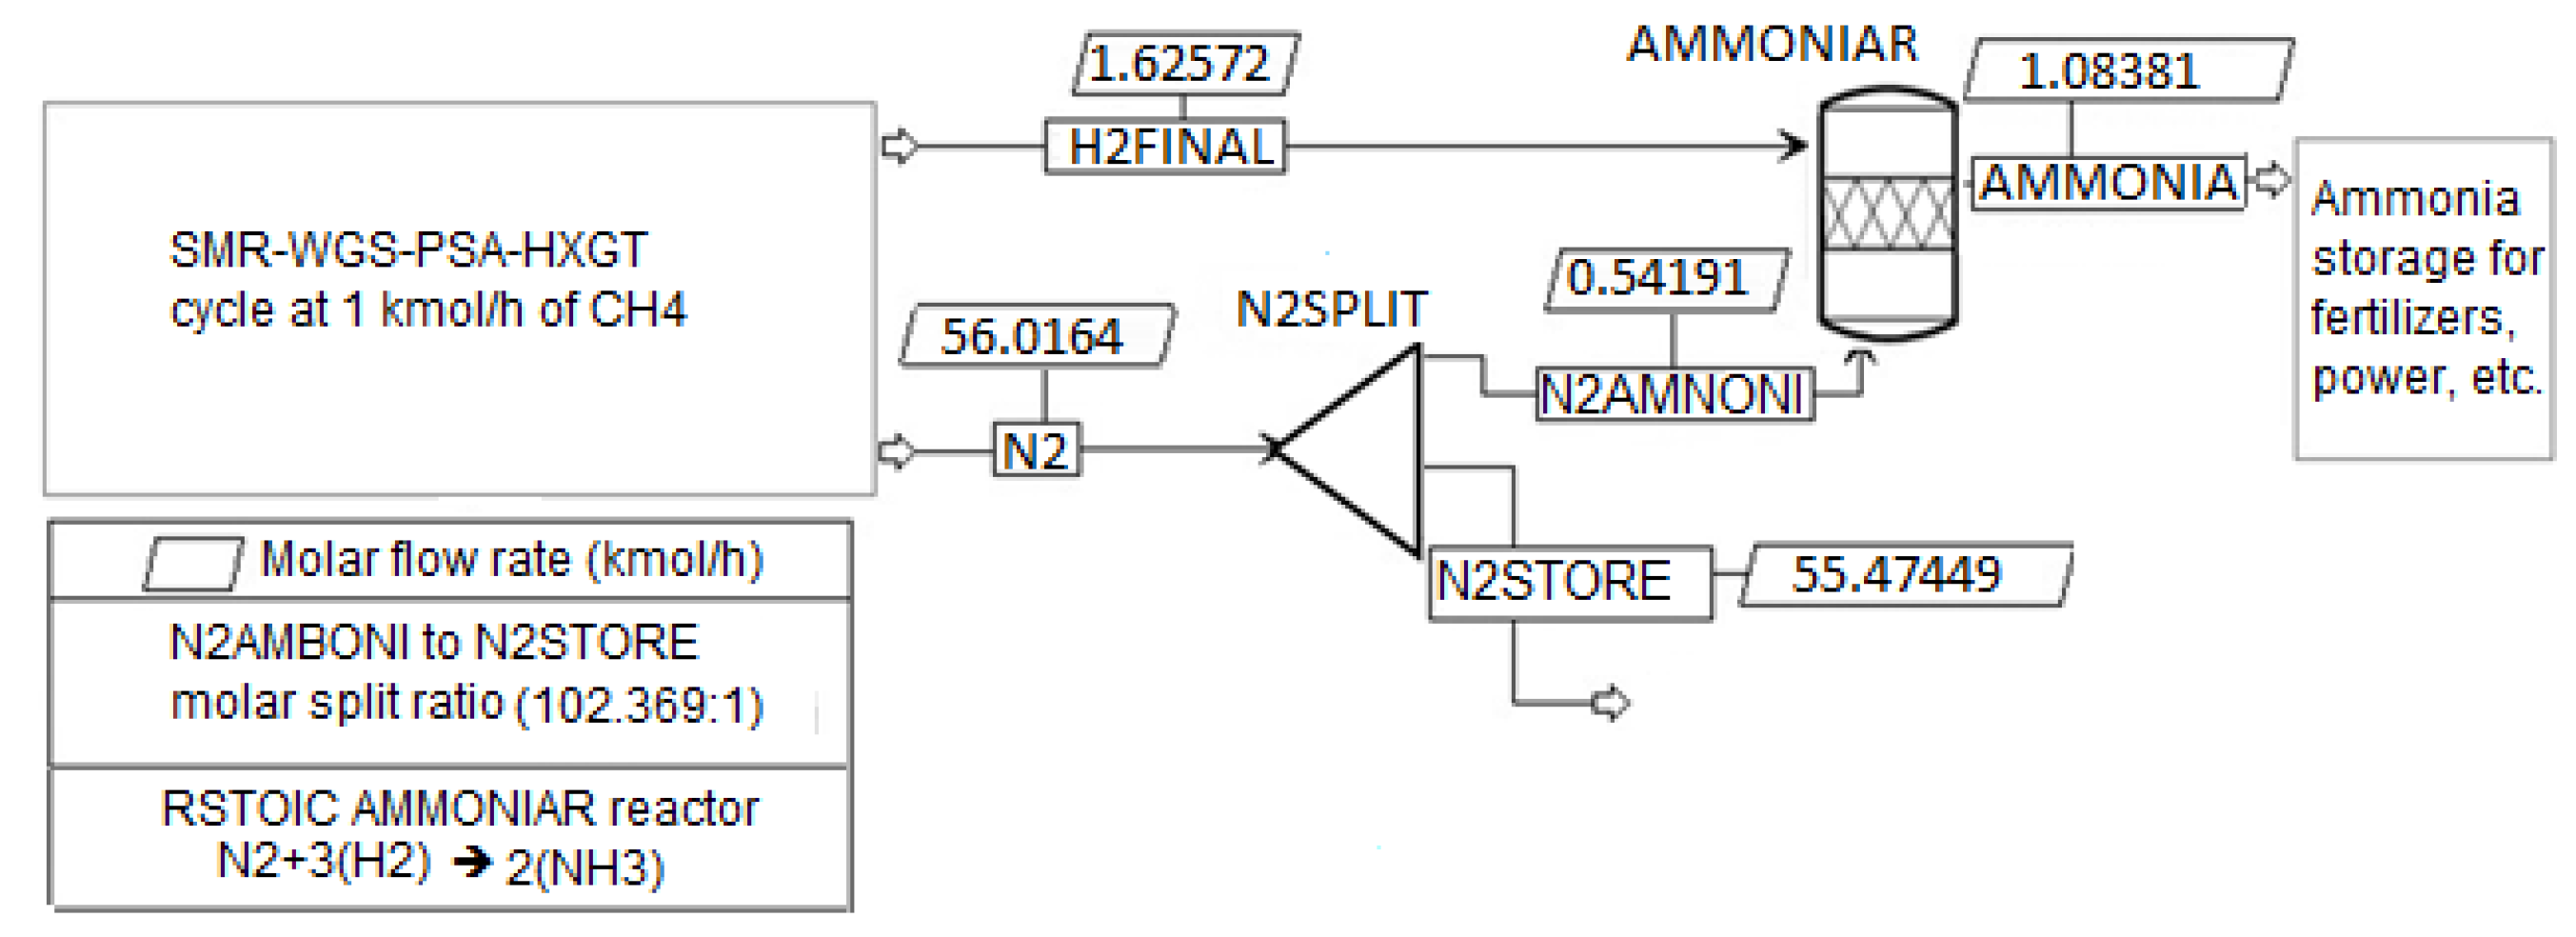
The ASU-SMR-WGS-PSA-CCS-HXGT cycle has two operability modes. As shown in Table 4 and Table 5, the first mode produces the CARSOXY within the required molar fraction with hydrogen and nitrogen as by-products. The second mode reacts nitrogen with hydrogen to produce ammonia (Haber-Bosch process). As shown in Table 5 approximately 2 kmol/h of hydrogen is by-produced in order to produce CARSOXY within the required molar fractions using 1 kmol/h of methane. Enough nitrogen to convert 2 kmol/h of hydrogen to ammonia is also produced. Ammonia can be used for many applications, including fertilizing or fueling of cycles [27]. Figure 16 shows the necessarily detailed flowsheet which can be added to the ASU-SMR-WGS-PSA-CCS-HXGT cycle in order convert it to the second mode (producing ammonia).
The second mode establishes an easier introduction of CARSOXY to the market in the near future. The second mode allows the CARSOXY cycle to be used where ammonia is produced. The processes involved in the ASU-SMR-WGS-PSA-CCS-HXGT have diverged from the conventional processes in many aspects. To name a few, after the sensitivity analysis the final parameters of the WGS model have been chosen to ensure low methane conversion factor (enough to produce the required carbon dioxide and maintain the required methane level as unreacted). In addition, conventional argon production involves a rectifying process, while it has been eliminated in the ASU-SMR-WGS-PSA-CCS-HXGT cycle by customizing the operation conditions of the ASU. This shall decrease the capital cost and provides better matching between the ASU and the gas turbine unit. Moreover, the integration of all the involved sub-models has utilized the waste energy (i.e., using the HX heat exchanger) between the gas turbine model and the SMR model.
As observed from Table 1 and Table 4, hydrogen and nitrogen are produced from the process. These gases can be used either as separate by-products or to produce ammonia. If the latter is selected, the process could be defined as in Figure 16. It is estimated that using 1 kmol/h of methane in the process, 1.37 kmol/h of ammonia could be produced. It must be remembered that production of this ammonia would come with an energy excedent from the CARSOXY process, which eventually would also lead to recovery of CO2 via CCS technologies. Therefore, the process has the potential to deliver an appreciated commodity whilst delivering extra power via efficient and clean cycles.
6. Conclusions
This paper has provided a sensitivity analysis to study the behaviour of the involved sub- models in the ASU-SMR-WGS-PSA-CCS-HXGT cycle. This has enabled the modification of the operating conditions in order to provide the required CARSOXY molar fractions for power, CCS and ammonia production purposes. The utilisation of waste heat amongst the sub-models and the elimination of some facilities which would have existed in conventional processes, have the potential to decrease both the operation and the capital cost of such a cycle. This paper has shown various methods in order to obtain the required CARSOXY molar fractions. Some methods stand out from the crowd. The sensitivity analyses on the (SMR) sub-model spots the H2O mass flow rates most appropriate for the use of CARSOXY and recovery of other gases, namely nitrogen and hydrogen, for further processes. These are 350 kg/h, 225 kg/h and 175 kg/h of H2O, respectively within a variation interval of (10–510) kg/h of H2O. In addition, varying the CH4 mass flow rate within the interval of (10–950) kg/h identifies the point which peaks the CO2 product level, 200 kg/h of CH4. This has identified the CH4 mass splitting ratio which activates/deactivates the (SMR) sub-model, 0.975 SMR to furnace CH4 mass ratio. A 650 kg/h of air to the furnace has been identified as a compromise point between both of the conventional and CARSOXY demands. Similarly, a 5.25 kmol/h of H2O supply to the (WGS) sub-model has been identified as the activation/deactivation point of the sub-model. As a future work, conducting techno-economic analyses on the cycle is essential in order to prove economic sustainability. Exergy analysis and mathematical modeling can further optimize the waste heat utilization for real, profitable applications.
Author Contributions
Conceptualization, O.F.A., A.A.-D, P.B., A.V.M; methodology, O.F.A., A.A.-D, P.B., A.V.M; software, O.F.A., A.A.-D, P.B., A.V.M; validation, O.F.A., A.A.-D, P.B., A.V.M.; formal analysis, O.F.A., A.A.-D, P.B., A.V.M.; investigation, O.F.A., A.A.-D, P.B., A.V.M.; resources, O.F.A., A.A.-D, P.B., A.V.M.; data curation, O.F.A., A.A.-D, P.B., A.V.M.; writing—original draft preparation, O.F.A., A.A.-D, P.B., A.V.M.; writing—review and editing, O.F.A., A.A.-D, P.B., A.V.M.; visualization, O.F.A., A.A.-D, P.B., A.V.M.; supervision, P.B., A.V.M.; project administration, O.F.A., A.A.-D, P.B., A.V.M; funding acquisition, O.F.A., A.A.-D, P.B., A.V.M.
Funding
This research was funded by the Welsh European Funding Office (WEFO) through its program “Flexible Integrated Energy Systems (FLEXIS)”, grant number 80835” and The APC was funded by Cardiff university-School of engineering.
Acknowledgments
The authors gratefully acknowledge the support from the Welsh European Funding Office (WEFO) through its program “Flexible Integrated Energy Systems (FLEXIS)”, project no. 80835.
Conflicts of Interest
The authors declare no conflict of interest.
Nomenclature
| Molar fraction of fuel in CARSOXY mixture | |
| Molar fraction of the oxygen in CARSOXY mixture | |
| Hydrocarbon fuel, methane (x:1 and y:4) | |
| Specific heat at constant pressure of a mixture (J/mol·K) | |
| Specific heat at constant pressure of ith component in a mixture (J/mol·K) | |
| Specific heat of a mixture at constant volume (J/mol·K) | |
| Change in heat capacity at constant pressure (J/mol·K) | |
| Fuel to air ratio | |
| Higher heating value at the combustion inlet temperature (kJ/kg) | |
| Higher heating value at the combustion outlet temperature (kJ/kg) | |
| Enthalpy of the working fluid at the combustion outlet temperature (kJ/mol) | |
| Enthalpy of the working fluid at the combustion inlet temperature (kJ/mol) | |
| Standard enthalpy change of the combustion reaction | |
| Enthalpy of products (kJ/mol) | |
| Enthalpy of reactants (kJ/mol) | |
| Enthalpy of the combustion reaction at the combustion inlet temperature (kJ/mol) | |
| Enthalpy of H2O at the combustion inlet temperature (kJ/kg) | |
| Lower heating value at the combustion inlet temperature (kJ/kg) | |
| Molecular weight of methane (x:1 and y:4) (g/mol) | |
| Molecular weight of H2O (g/mol) | |
| Number of moles of H2O produced due to combustion | |
| Number of moles of hydrocarbon fuel in CARSOXY mixture | |
| Compressor pressure ratio | |
| Gas constant of a gaseous mixture (J/mol·K) | |
| SFC | specific fuel consumption |
| Compressor inlet temperature (K) | |
| Turbine inlet temperature (K) | |
| Turbine specific work (kJ/kg) | |
| Specific work required from the turbine to run the compressor (kJ/kg) | |
| Molar fraction of the argon in CARSOXY mixture | |
| Molar fraction of i-th component in a mixture | |
| Molar fraction of H2O in CARSOXY mixture | |
| Volume fraction of i-th component in CARSOXY mixture | |
| Heat capacity ratio of a mixture | |
| Cycle efficiency | |
| Average molecular weight of a mixture (g/mol) | |
| Molecular weight of i-th component in a mixture (g/mol) | |
| Molar fraction in products |
References
- Cormos, C.-C. Evaluation of reactive absorption and adsorption systems for post-combustion CO2 capture applied to iron and steel industry. Appl. Therm. Eng. 2016, 105, 56–64. [Google Scholar] [CrossRef]
- Ali, A.-D.; Gutesa, M.; Valera-Medina, A.; Syred, N.; Ng, J.-H.; Chong, C.T. CO2-argon-steam oxy-fuel (CARSOXY) combustion for CCS inert gas atmospheres in gas turbines. Appl. Therm. Eng. 2017, 122, 350–358. [Google Scholar]
- Alrebei, O.; Valera-Medina, A. Parametric Study of Carbon Dioxide-Argon-Steam Oxy-fuel (CARSOXY) Gas Turbines in. In Proceedings of the 13th Conference on Sustainable Development of Energy, Palermo, Italy, 30 September–4 October 2018; Volume 13, pp. 208–209. [Google Scholar]
- AM, K.Z.; Rabah, A.A.; Taj Alasfia, M.B. A new cryogenic air separation process with flash separator. ISRN Thermodyn. 2013, 2013. [Google Scholar] [CrossRef]
- King, C.J. Separation Processes; Courier Corporation: New York, NY, USA, 2013. [Google Scholar]
- Rakesh, A.; Yee, T.F. Heat pumps for thermally linked distillation columns: An exercise for argon production from air. Ind. Eng. Chem. Res. 1994, 33, 2717–2730. [Google Scholar]
- Agrawal, R.; Woodward, D.W.; Yee, T.F. Argon production from air distillation: Use of a heat pump in a ternary distillation with a side rectifier. Gas Sep. Purif. 1994, 8, 37–43. [Google Scholar] [CrossRef]
- Yang, R.T. Gas Separation by Adsorption Processes; Butterworth-Heinemann: New York, NY, USA, 2013. [Google Scholar]
- Smith, A.R.; Klosek, J. A review of air separation technologies and their integration with energy conversion processes. Fuel Proc. Technol. 2001, 70, 115–134. [Google Scholar] [CrossRef]
- Harry, C. Moderate-pressure cryogenic air separation process. Union Carbide Ind. Gases Technol. Corp 1989, 5, 24–25. [Google Scholar]
- Barelli, L.; Bidini, G.; Gallorini, F.; Servili, S. Hydrogen production through sorption-enhanced steam methane reforming and membrane technology: A review. Energy 2008, 33, 554–570. [Google Scholar] [CrossRef]
- Ding, Y.; Alpay, E. Adsorption-enhanced steam–methane reforming. Chem. Eng. Sci. 2000, 55, 3929–3940. [Google Scholar] [CrossRef]
- Hufton, J.R.; Mayorga, S.; Sircar, S. Sorption-enhanced reaction process for hydrogen production. AIChE J. 1999, 45, 248–256. [Google Scholar] [CrossRef]
- Mendes, D.; Mendes, A.; Madeira, L.M.; Iulianelli, A.; Sousa, J.M.; Basile, A. The water-gas shift reaction: From conventional catalytic systems to Pd-based membrane reactors—A review. Asia-Pac. J. Chem. Eng. 2010, 5, 111–137. [Google Scholar] [CrossRef]
- Crabtree, G.W.; Dresselhaus, M.S.; Buchanan, M.V. The hydrogen economy. Phys. Today 2004, 57, 39–44. [Google Scholar]
- Tao, L.; Xiao, P.; Qader, A.; Webley, P.A. CO2 capture from high concentration CO2 natural gas by pressure swing adsorption at the CO2CRC Otway site, Australia. Int. J. Greenh. Gas Control 2019, 83, 1–10. [Google Scholar] [CrossRef]
- Barg, C.; Ferreira, J.M.P.; Trierweiler, J.O.T.; Secchi, A.R. Simulation and optimization of an industrial PSA unit. Braz. J. Chem. Eng. 2000, 17, 695–704. [Google Scholar] [CrossRef]
- Terry, F.W. Combustion processes for carbon capture. Proc. Combust. Inst. 2007, 31, 31–47. [Google Scholar]
- Manmeet, K. Carbon Capturing and Storage Technology & current CCS initiatives in India (Emerging Technology in the field of Environmental Engineering). Int. J. Adv. Res. Comput. Sci. 2017, 8, 52–55. [Google Scholar]
- Frank, G.K. Industrial Gas Handbook: Gas Separation and Purification; CRC Press: Boca Raton, FL, USA, 2007. [Google Scholar]
- Irvin, G.; Richard, A.; Nick, Y.; Glumac, G. Combustion; Academic Press: London, UK, 2014. [Google Scholar]
- Kalyan, A.; Puri, I.K.; Jog, M.A. Advanced Thermodynamics Engineering; CRC Press: Boca Raton, FL, USA, 2011. [Google Scholar]
- Kim, J.; Grace, J.R.; Elnashaie, S.S.E.H.; Kolbeinsen, L.; Eriksen, D. Modeling of sorption-enhanced steam reforming in a dual fluidized bubbling bed reactor. Ind. Eng. Chem. Res. 2006, 45, 4133–4144. [Google Scholar]
- Noureddine, H.; Pons, M.-N.; Houas, A.; Renaudin, V. Exergy analysis: An efficient tool for understanding and improving hydrogen production via the steam methane reforming process. Energy Policy 2012, 42, 392–399. [Google Scholar]
- Cynthia, B.T.; Croiset, E.; Peter, L.; Gupta, M.D.; Chowdhury, M.H. Techno-economic study of CO2 capture from natural gas based hydrogen plants. Int. J. Greenh. Gas Control 2007, 1, 55–61. [Google Scholar]
- Stéphanie, H.; Bartlett, M.; Finkenrath, M.; Evulet, A.; Ursin, T.P. Performance and cost analysis of advanced gas turbine cycles with precombustion CO2 capture. J. Eng. Gas Turbines Power 2009, 131, 021701. [Google Scholar]
- Adam, W.; Middleton, H.; Damopoulos, I. Ammonia as a fuel in solid oxide fuel cells. J. Power Sources 2003, 118, 342–348. [Google Scholar]
Figure 1.
ASU-SMR-WGS-PSA-CCS-HXGT model.

Figure 2.
SMR sensitivity results (SMR molar fractions vs. H2O feed). Lines A, B and C correspond to the H2O flow rates of 175, 225 and 350 kg/h, respectively.
Figure 2.
SMR sensitivity results (SMR molar fractions vs. H2O feed). Lines A, B and C correspond to the H2O flow rates of 175, 225 and 350 kg/h, respectively.

Figure 3.
SMR sensitivity results (SMR molar fractions vs. CH4 feed). Line D corresponds to the CH4 flow rate of 200 (kg/h).
Figure 3.
SMR sensitivity results (SMR molar fractions vs. CH4 feed). Line D corresponds to the CH4 flow rate of 200 (kg/h).

Figure 4.
SMR sensitivity results (SMR molar fractions vs. CH4 split ratio).

Figure 5.
SMR sensitivity results (SMR molar fractions vs. Furnace Air mass flow rate). Line E corresponds to the Air flow rate of 650 kg/h.
Figure 5.
SMR sensitivity results (SMR molar fractions vs. Furnace Air mass flow rate). Line E corresponds to the Air flow rate of 650 kg/h.

Figure 6.
WGS sensitivity results (WGS product molar fractions vs. WGSH2O mass flow rate).

Figure 7.
ARO2RECT molar fractions vs. BOOSTER discharge pressure.

Figure 8.
ARO2RECT molar fractions vs. ATMIR mole flow rate.

Figure 9.
ARO2RECT molar fractions vs. AIRLP mole flow rate.

Figure 10.
ARO2RECT molar fractions vs. LPDC number of stages.

Figure 11.
ARO2RECT molar fractions vs. LPDC Distillate rate.

Figure 12.
ARO2RECT molar fractions vs. LPDC Boil-up rate.

Figure 13.
ARO2RECT molar fractions vs. O2ARHOT Feed stage location in the LPDC.

Figure 14.
ARO2RECT molar fractions vs. ARO2RECT product stage location in the LPDC.

Figure 15.
Oxygen-argon-carbon dioxide compression vs. oxygen-argon compression.

Figure 16.
Ammonia production (Second mode).


Table 1.
Mass balance of the ASU-SMR-WGS-PSA-CCS-HXGT (CARSOXY) model.
| The Relative Difference between the Inlet and Outlet Mass Flows (Rel.Diff) | |||
|---|---|---|---|
| Model/block | Mass Rel.Diff | Model/block | Mass Rel.Diff |
| Entire model | 0.200831 × 10⁻⁷ | B2 | 0 |
| SMR | 3.06110493 × 10⁻¹⁵ | LPDC | 4.44654277 × 10⁻⁸ |
| Furnace | 0.2572 × 10⁻¹¹ | HPDC | 4.49540319 × 10⁻¹⁰ |
| HTWGS | 3.31185307 × 10⁻¹⁶ | CC | 0 |
| LTWGS | 0 | CO12CS | 0 |
| B21 | 1.589198 × 10⁻¹⁶ | BOOSTER | 0 |
| Convergence tolerance | |||
| 0.2572 × 10⁻¹¹ | |||
Table 2.
Initial and final input values.
| Parameter | Initial Value | Final Value (After the Sensitivity Analysis) |
|---|---|---|
| SMR sub-model | ||
| Maximum methane conversion efficiency (%) | 72 | 72 |
| Steam to Carbon mole ratio (S/C) | 3.5 | 2 |
| Steam mole flow rate (kmol/h) | 60 | 47.5 |
| Methane mole flow rate (kmol/h) | 17.14 | 42 |
| Feed streams temperature (K) | 293.15 | 293.15 |
| Feed streams pressure (bar) | 1 | 1 |
| LPPUMP and LPCOMP discharge pressure (bar) | 1.5 * | 1.5 |
| HPCOMPH2O and HPCOM-PCH4 discharge pressure (bar) | 6 * | 6 |
| SMR to FURNACE molar split ratio in CH4SPLIT1 | 12.2:1 * | 4.23:1 |
| CC combustion chamber to SMR molar split ratio in CH4SPLIT2 | 0 * | 1:2.36 |
| SMR reactor temperature (K) | 1073 | 1073 |
| Air to fuel mass ratio of the FURNCE | 17.19:1 | 5.5:1 |
| WGS sub-model | ||
| Water mole flow (WGSH2O) (kmol/h) | 17.14 | 32 |
| WGSH2O pressure (bar) | 10 | 10 |
| WGSH2O temperature (K) | 573 | 573 |
| HTWGS to LTWGS steam mass Split ratio in B4 | 9:1 | 9:1 |
| HTWGS temperature (K) | 400 | 400 |
| LTWGS temperature (K) | 200 | 200 |
| S2 temperature (K) | 573 | 573 |
| PSA sub-model | ||
| B21and B2 Hydrogen purity (%) | 99.99 | 99.99 |
| B21and B2 Hydrogen recovery (%) | 90 | 90 |
| B22 heat duty (-kW) | 0 * | 0.103 |
| ASU sub-model | ||
| BOOSTER discharge pressure (bar) | 121.59 | 76 |
| ATMIR mole flow rate (kmol/h) | 5321.4 | 2642.38 |
| AIRHP1 to AIRHP2 Mass split ratio in ASUSP | 1:2.2 | 1:2.2 |
| AIRLP mole flow rate (kmol/h) | 727.5 | 341.69 |
| N22 to N21 Mass split ratio in ASUSP | 1:1 | 1:1 |
| LPDC | ||
| Number of stages | 40 | 4 |
| Boil-up rate (kmol/h) | 49,392 | 24,458.92 |
| O2N2COLD and N2O2COLD feed stage | 2 | 2 |
| O2ARHOT feed stage | 8 | 2 |
| ARO2RECT product stage1 | 10 | 23 |
| N2LPDC product stage | 1 | 1 |
| O2LPDC product stage | 40 | 42 |
| HPDC | ||
| Number of stages | 26 | 26 |
| Reflux ratio | 0.5459 | 0.5459 |
| Boil-up ratio | 1.0279 | 1.0279 |
| AIRTROUT feed stage | 1 | 1 |
| AIRHP2CO feed stage | 2 | 2 |
| AIRLPCO feed stage | 3 | 3 |
| N2O2 and O2N2 product stage | 1 | 1 |
| Heat exchanged gas turbine sub-model | Specified in Table 3 | Specified in Table 3 |
| CCS sub-model | ||
| CO2 capture efficiency (%) | 80 | 80 |
(Note: stages are numbered from top down) (The initial input values had been adopted for the SMR, WGS, PSA, ASU, heat exchanged gas turbine and CCS sub-models from the references [3,20,23,24,25,26] (Note: Some sub-models contain features which are not in the references. The initial values of these features are marked by the (*) symbol).
Table 3.
Specifications of the heat exchanged gas turbine cycle [3].
Table 3.
Specifications of the heat exchanged gas turbine cycle [3].
| HXGT Parameters | |
|---|---|
| Equivalence ratio | 1 |
| Turbine Inlet temperature (K) | 1900 |
| HX effectiveness | 0.8 |
| Compression isentropic efficiency | 0.85 |
| Compression pressure ratio | 7 |
| Turbine discharge pressure (bar) | 2 |
| Expansion isentropic efficiency | 0.87 |
| Mechanical efficiency | 0.99 |
| Combustion efficiency | 0.98 |
| Pressure losses with respect to the stage inlet | |
| Combustion chamber | 0.02 |
| HX cold side | 0.03 |
| HX hot side | 0.04 |
| Exhaust | 0.3 |
Table 4.
CARSOXY final molar fraction.
| Stream | Component | Actual Molar Fraction | Required Molar Fraction | Error |
|---|---|---|---|---|
| ARO2RECT and S12 (required for the CARSOXY) | AR | 0.2683 | 0.25 | 0.01 |
| O2 | 0.2316 | 0.22 | 0.03 | |
| CH4 | 0.0980 | 0.11 | 0.02 | |
| CO2 | 0.1760 | 0.19 | 0.10 | |
| H2O | 0.2171 | 0.23 | 0.07 | |
| N2 | N2 | 0.9905 | - | - |
| H2FINAL | H2 | 0.9999 | - | - |
| O2 | O2 | 0.9970 | - | - |
Table 5.
ASU-SMR-WGS-PSA-CCS-HXGT mole flow rates for 1 kmol/h of Methane.
| Feed Stream | Mole flow Rate (kmol/h) |
| FEEDCH4 | 1 |
| FEEDH2O | 1.130952381 |
| AIR | 0.416790653 |
| WGSH2O | 0.761975882 |
| ATMIR | 62.91381236 |
| AIRLP | 8.135406772 |
| Product Stream | Mole flow Rate (kmol/h) |
| N2 | 56.01640226 |
| O2 | 13.87471457 |
| H2 | 1.625724047 |
| S13 | 1.158104548 |
| ARO2RECT | 1.158102272 |
| LPDC Rates | Mole flow Rate (kmol/h) |
| distillate | 56.01640226 |
| boil-up rate | 582.3536394 |
© 2019 by the authors. Licensee MDPI, Basel, Switzerland. This article is an open access article distributed under the terms and conditions of the Creative Commons Attribution (CC BY) license (http://creativecommons.org/licenses/by/4.0/).
Share and Cite
MDPI and ACS Style
Fawwaz Alrebei, O.; Al-Doboon, A.; Bowen, P.; Valera Medina, A. CO2-Argon-Steam Oxy-Fuel Production for (CARSOXY) Gas Turbines. Energies 2019, 12, 3580. https://doi.org/10.3390/en12183580
AMA Style
Fawwaz Alrebei O, Al-Doboon A, Bowen P, Valera Medina A. CO2-Argon-Steam Oxy-Fuel Production for (CARSOXY) Gas Turbines. Energies. 2019; 12(18):3580. https://doi.org/10.3390/en12183580
Chicago/Turabian StyleFawwaz Alrebei, Odi, Ali Al-Doboon, Philip Bowen, and Agustin Valera Medina. 2019. "CO2-Argon-Steam Oxy-Fuel Production for (CARSOXY) Gas Turbines" Energies 12, no. 18: 3580. https://doi.org/10.3390/en12183580
Note that from the first issue of 2016, this journal uses article numbers instead of page numbers. See further details here.