The Emission Characteristics of a Diesel Engine During Start-Up Process at Different Altitudes


School of Automotive Studies, Tongji University, Shanghai 201804, China
*
Author to whom correspondence should be addressed.
Energies 2019, 12(18), 3556; https://doi.org/10.3390/en12183556
Submission received: 9 August 2019
/
Revised: 8 September 2019
/
Accepted: 11 September 2019
/
Published: 17 September 2019
Abstract
:With increasingly stringent emission regulations, the cold start emissions have become more important than ever. Using a low compression ratio is a feasible way to improve a heavy-duty engine’s efficiency and emissions. However, cold start performance restricts the development of this technology, especially at high altitudes. In response, we conducted a study of the emissions of a heavy-duty low-compression-ratio diesel engine during start-up process at different altitudes. A plateau simulation system controlled the inlet and exhaust pressure to create altitude environments of 0 m, 1000 m, 2000 m, 3000 m, 3750 m and 4500 m. The gas, particulate and volatile organic compound (VOC) emissions were analyzed with speed and cycle during the start-up process. The results indicated that cold start performance and combustion characteristics became worse as altitudes increased. The gas and particulate emissions of carbon monoxide (CO), carbon dioxide (CO2), total hydrocarbon (THC) and nitrous oxide (NOX) almost all increased as the engine speed and altitude increased, and was much higher than in idle conditions. The PN and PM emissions in each particle diameter also increased as the altitude increased, which was the same as the nucleation mode and the accumulation mode particles. VOC emissions were also measured, which increased during the start-up process as altitudes increased.

1. Introduction
With the development of electric vehicles, the internal combustion engine is facing tough competition in the automotive marketplace. It seems to be a better way to reduce CO2 emissions for electricity to not be produced from fossil fuels. However, in the future, electric motors cannot easily replace diesel engines in commercial vehicles on account of their extremely high requirements for power, capacity, endurance and torque. Diesel engines are the main power source for commercial vehicles, which make up the majority of the transportation volume. Almost 80% of freight and passenger transportation are powered by diesel engines in China. Over 90% of particulate mass (PM) and 60% of nitrogen oxide (NOX) are also produced by diesel engines which are the main sources of haze and smog. The global environmental problems, especially air pollution and the associated greenhouse effects require diesel engines to be highly efficient while producing low emissions. All over the world, pollution and carbon emissions are strictly limited by the latest regulations, which gives the diesel engine a severe challenge.
Cold start emissions, accounting for more than 70% of emissions during the whole testing cycle, are the main focus of recent emission regulations. Aftertreatment devices do not work at the first few seconds of cold start because of the low exhaust temperature. As hybrid technologies have developed, start working conditions have appeared much more often than usual. Existing literature indicates that while total vehicle emissions have dropped significantly in recent years, those associated with cold starts can still constitute up to 80% of some pollutant types. Starting emissions are consistently found to make up a high proportion of total transportation-related methane (CH4), nitrous oxide (N2O), and volatile organic compounds (VOCs) [1]. The recent Euro VI emission regulations added the Real-Road emission testing and have much more rigorous limitations for transient emissions during start-up and low temperature conditions [2]. To improve the cold start emissions, the process needs a precise transient control that does not harm start-up performance. Many scientists and companies have worked hard to overcome the emissions limitations under the Euro VI regulations, which need the engine emissions to be as clean as possible, to decrease the costs of aftertreatment devices [2,3].
Low CO2 emissions mean high efficiency which requires diesel engines to have high compression ratios and leads to excessive pressure and temperature. Therefore, it is extremely difficult to control NOX emissions and engine reliability. Superchargers, with relatively low compression ratios, are a recognized solution to this challenge, especially for the high-power diesel engines [4]. At the same time, the supercharger technology has become the most effective means of restoring power in high-altitude environments. However, a relatively low compression ratio will lead to a lower in-cylinder temperature at top dead center (TDC), which makes diesel engines harder to start because the supercharger does not work in cold start conditions. The problem is amplified when the altitude increases because of the leaner air density. So cold start-up performance becomes a serious limitation when attempting to reduce a diesel engine’s compression ratio.
The start-up performance and emissions of different injection parameters [5,6,7,8,9], speeds [10,11], temperatures [12,13,14,15], and kinds of fuels [16,17,18,19] have been published by researches all over the world. Prof. Yunshan Ge from the Beijing Institute of Technology has researched combustion characteristics and brake thermal efficiency of heavy-duty diesel engines fueled with diesel and biodiesel at high altitudes. However, the tests occurred in different places making it difficult to control the testing boundary [20,21]. He also researched the emissions of diesel engines at different altitudes on the same testing bench, but the highest altitude tested was only 2000 m [22]. There is little research focusing on the effects of different altitudes, especially more than 3000 m in height. Research focusing on VOC during the cold start process has not been published [23]. The latest emissions regulations have already given specific demands for high altitude environments, so research relating to this needs to be undertaken.
The Tibetan Plateau has an average altitude of more than 4000 m which accounts for 25% of China’s total area. So, the start-up performance and emissions of diesel engines at high altitudes are important for transportation in such environments. The high altitude causes lower intake and exhaust pressures which also happens if the air filter and the diesel particulate filter (DPF) were jammed. This research can provide a reference on the design margin of the engines’ aftertreatment system. Our team has done some research on the spray and combustion characteristics of a diesel engines at altitudes [24,25] from 0 m to 4500 m, which covers almost all kinds of plateaus in the world. This article focuses on the emission characteristics of a low-compression-ratio diesel engine during cold start at altitudes from 0 m to 4500 m, including gaseous and particle emissions, using the plateau simulation test system. Emissions during start-up process were analyzed in detail and compared with the engine speed and combustion characteristics.
2. Apparatus and Methodology
2.1. Experimental Apparatus
The research used a 16L DI heavy-duty mid-speed intercooled-turbocharged diesel engine with an electric-control in-line pump. Its specifications are listed in Table 1.
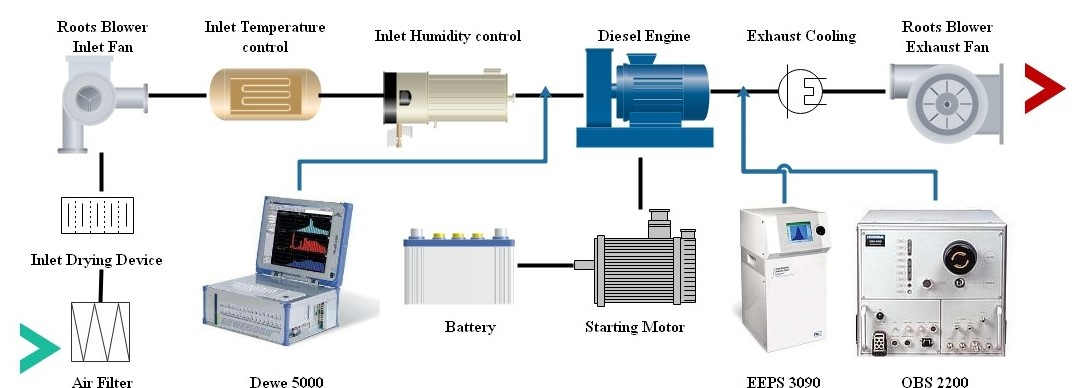
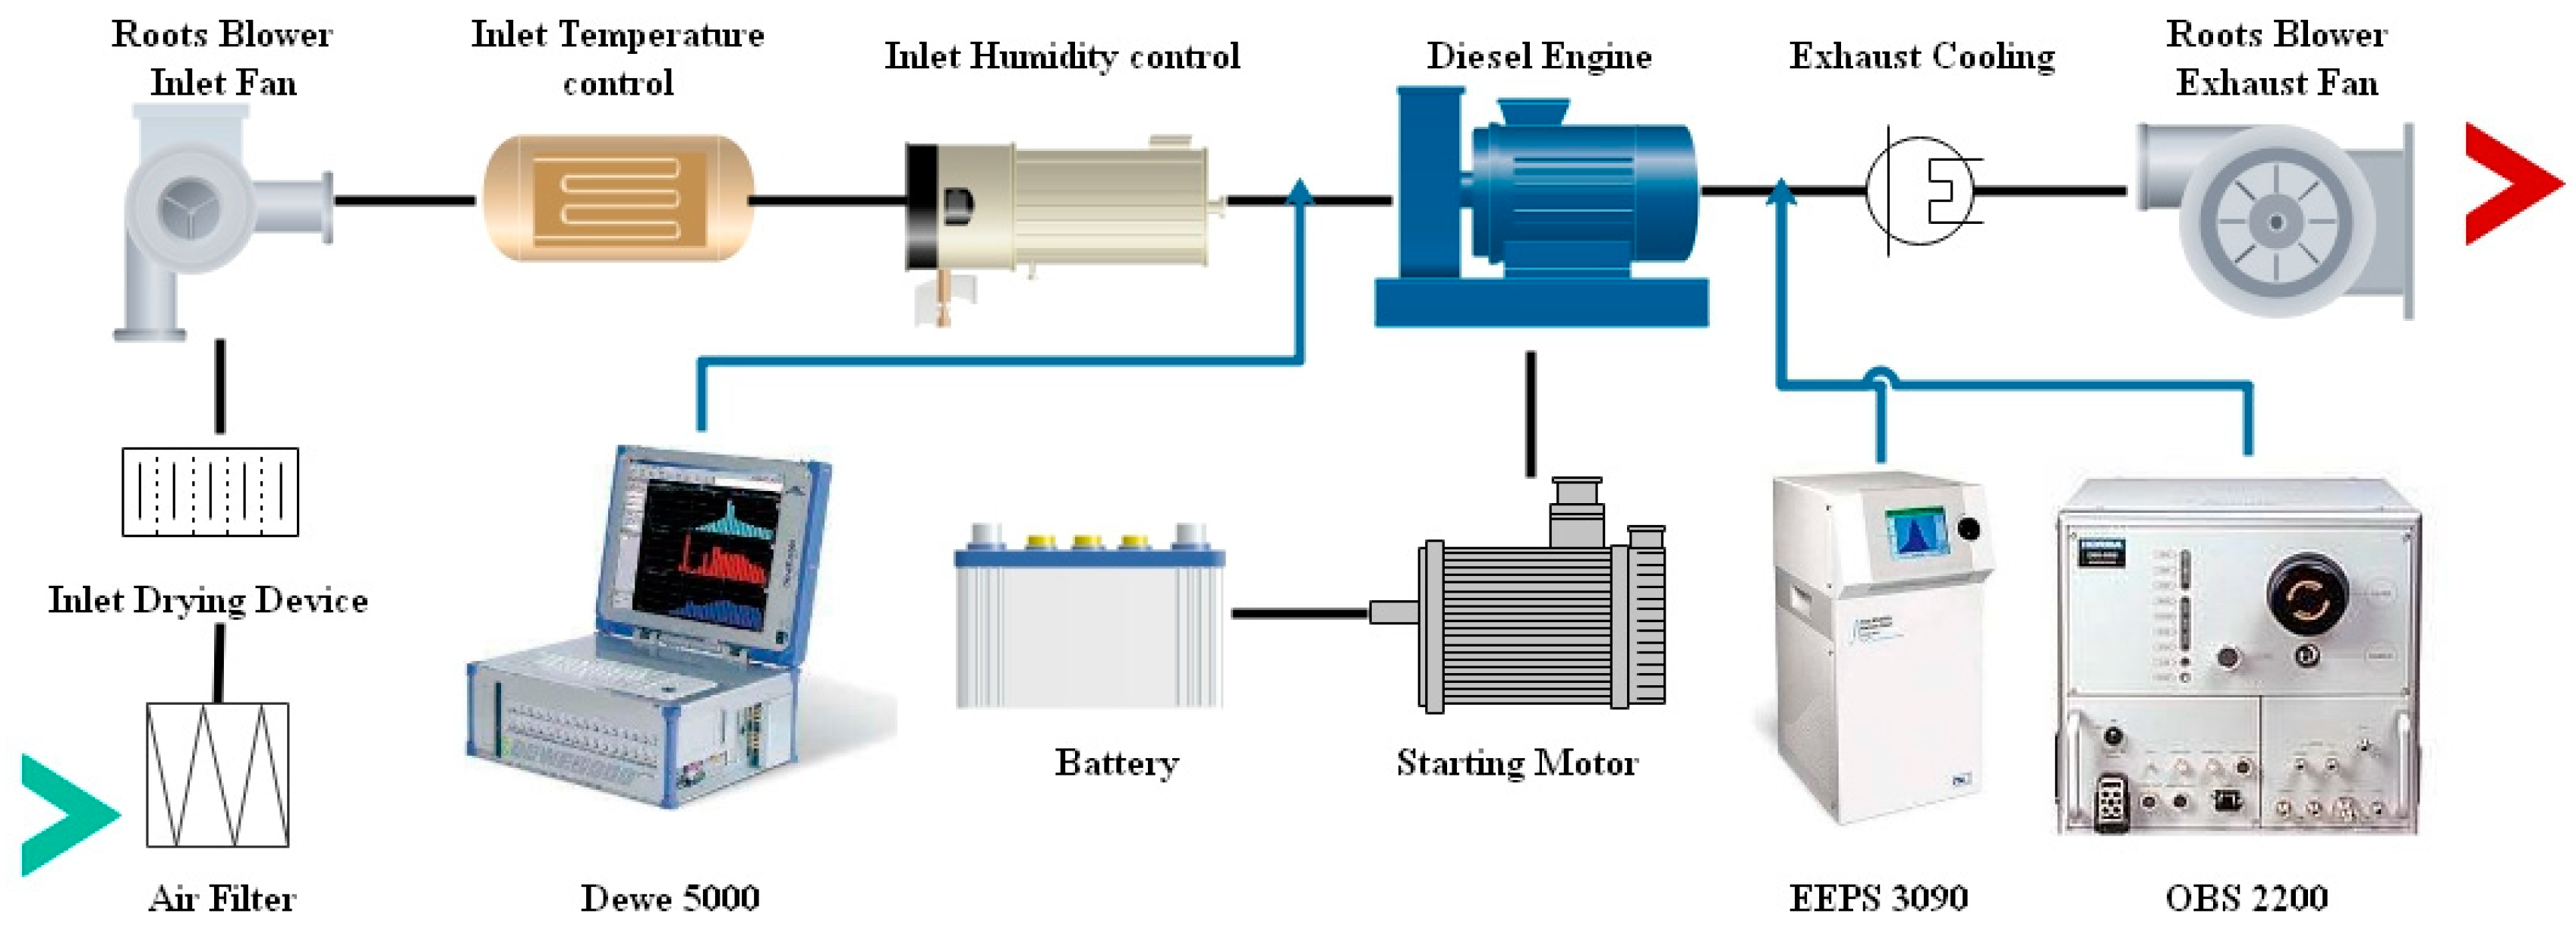
The experimental system included a combustion analysis system, an emission measurement system and a plateau simulation system, as shown in Figure 1. Intake and exhaust pressure of the engine were controlled by the plateau simulation system (Imtech, Hamburg, Germany), consisting of two Roots blowers, stable pressure boxes and other equipment, which control the altitude from 50 to 150 MPa. It also controlled the temperature and humidity of the intake air at the same time. The cylinder pressure was measured by a high precision water cooled cylinder pressure sensor (Kistler 6061B). The inlet air pressure was collected by a pressure resistance type absolute pressure sensor (Kistler 4007C). The fuel injection pressure was collected by a piezoresistive high pressure sensor (Kistler 4067E). The crank angle was collected by a hall sensor with a 360-2 gear pulse. The combustion-analysis (Dewetron 5000) was used to store and process this transient data to analyze the combustion characteristics and engine speed. The emission analysis system consisted of a gas emission system (Horiba OBS 2200) and a particle emission system (TSI EEPS 3090), which can measure the carbon monoxide (CO), total hydrocarbon (THC), nitrogen oxide (NOX), carbon dioxide (CO2), particulate number (PN) and particulate mass (PM) emissions, with a sample frequency reaching 0.1 s.
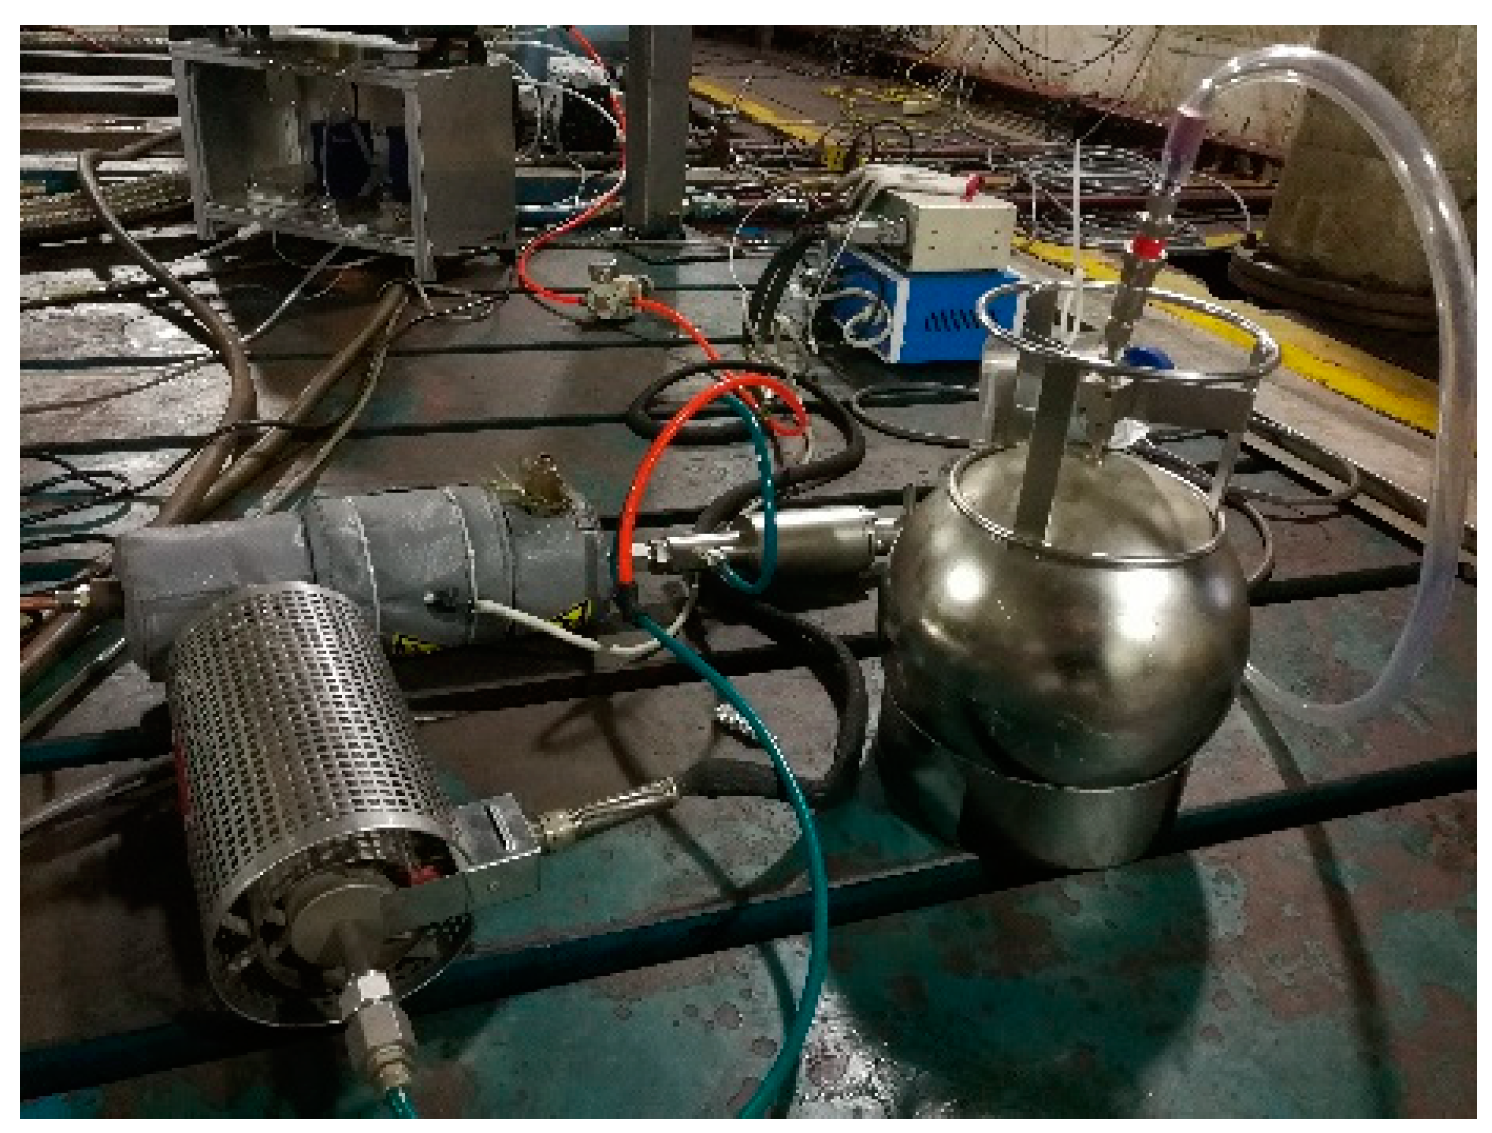
The VOCs created during the start-up process were collected with a summa canister and an instantaneous sampler. Then a gas chromatograph-mass spectrometer (7890A/5975C) was used to analyze the VOCs emission and components. The summa canister collection system for VOCs is shown in Figure 2.
2.2. Start Process Definition
- (a)
- Cranking process: the diesel engine crankshaft was driven by an external force and started to rotate until the speed rose steadily.
- (b)
- Start-up process: the engine began to run steadily until the speed rose to its idle speed.
- (c)
- Idle process: the engine’s speed ran steadily at an idle speed.
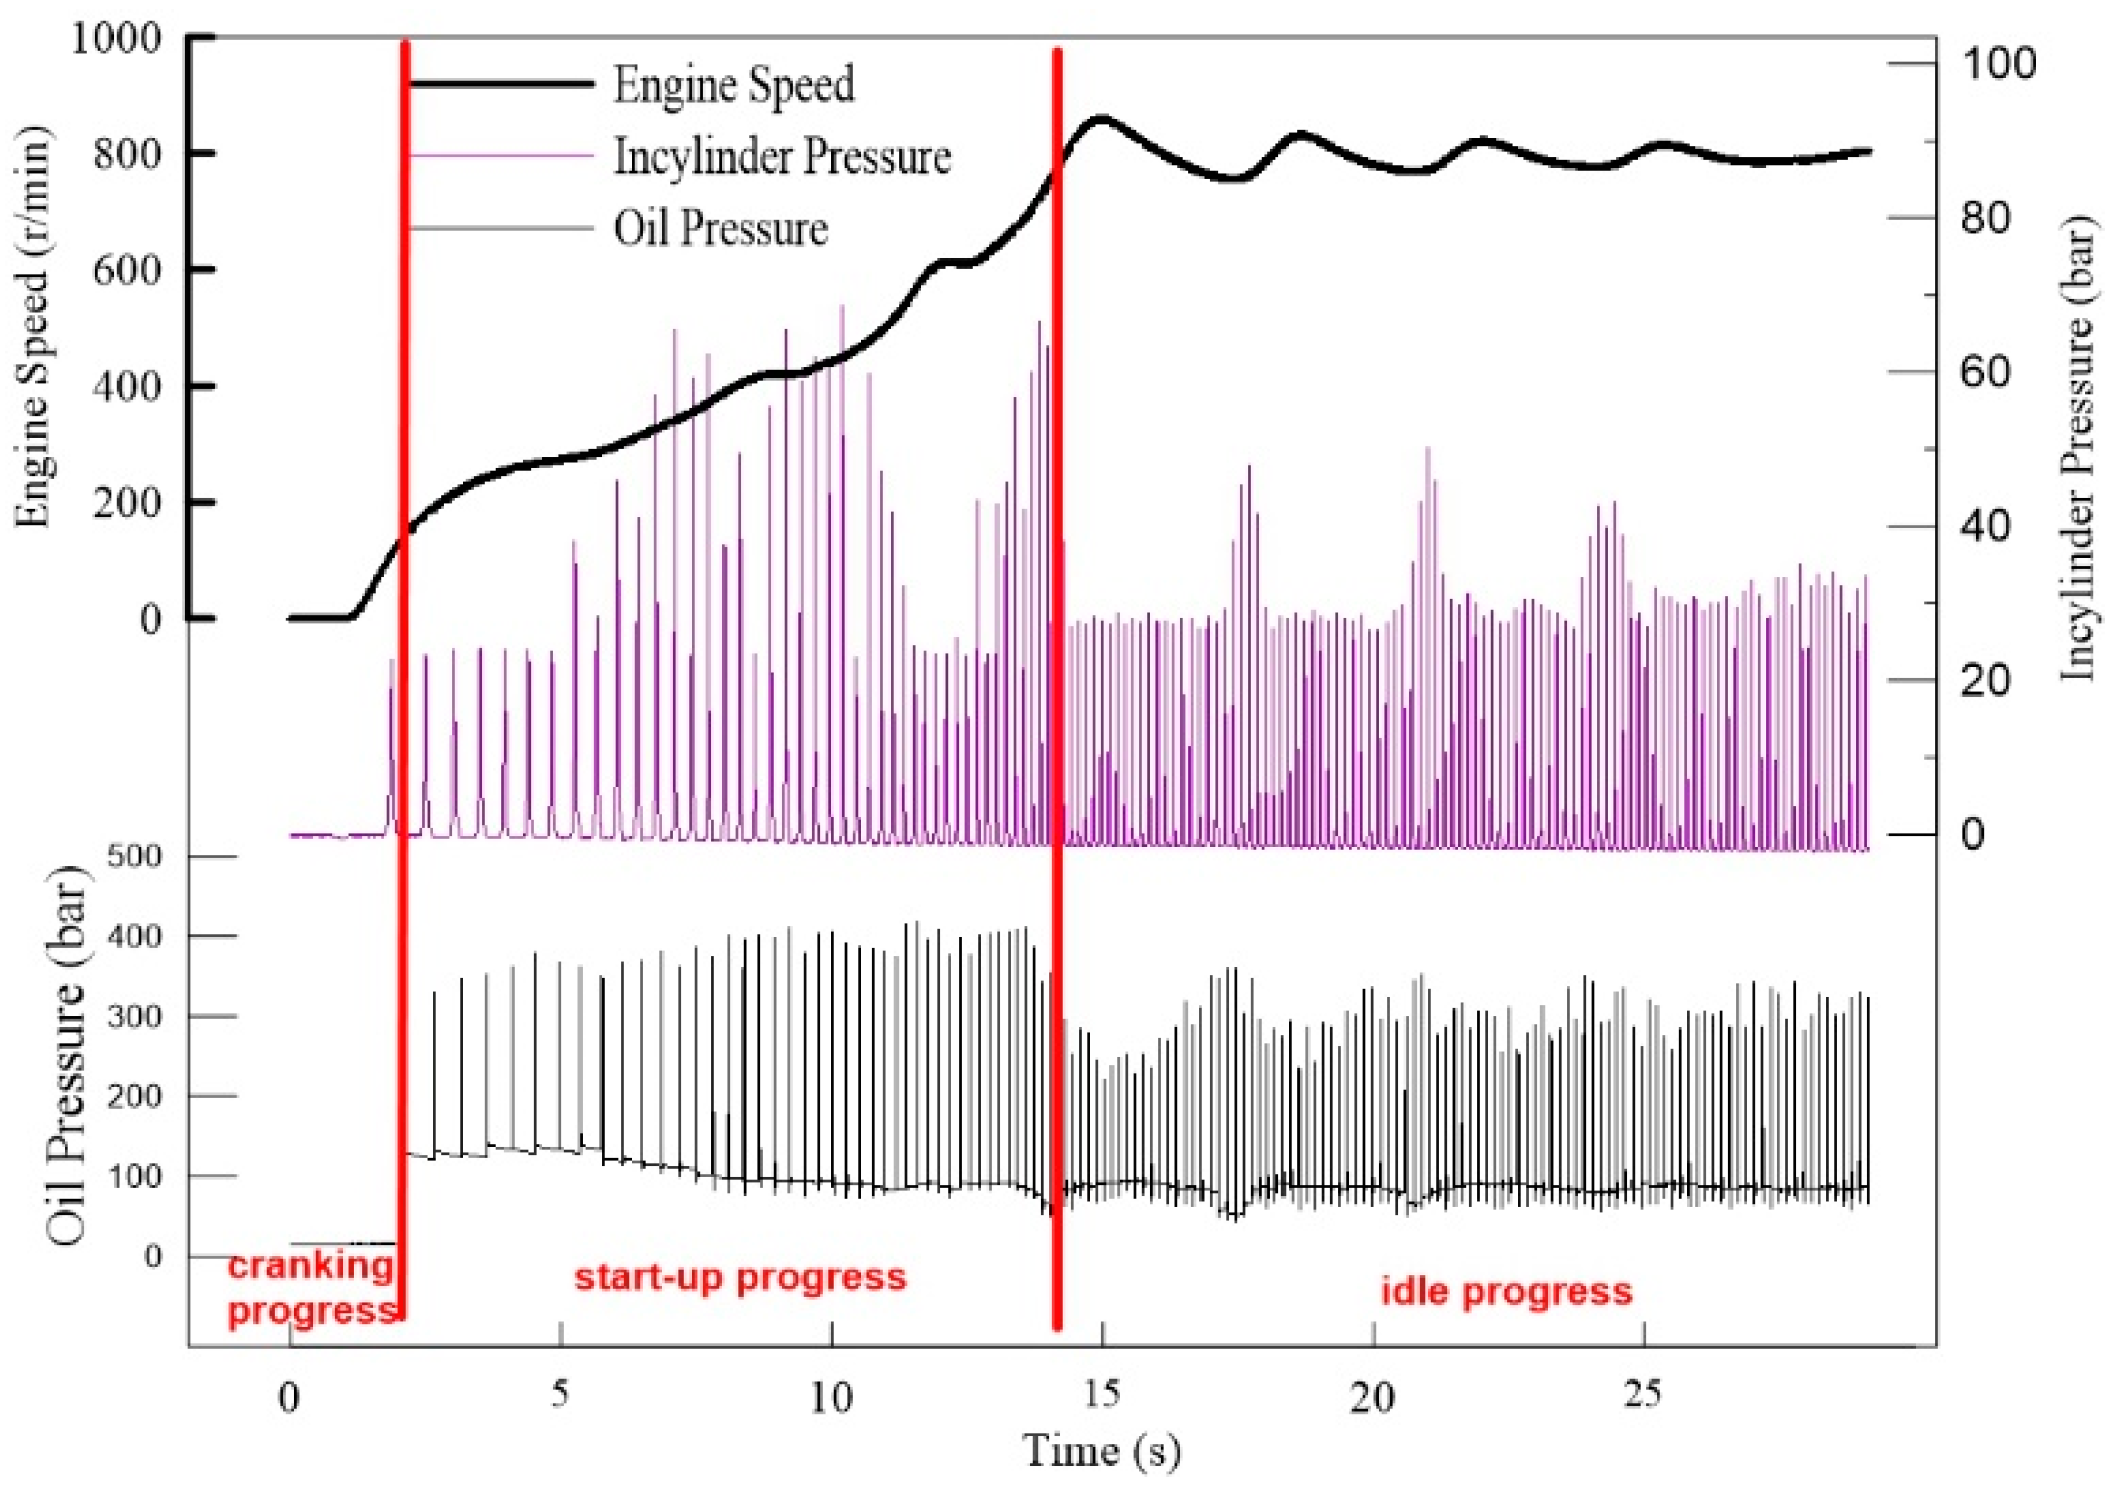
In this study, the crank speed was 200 r/min, so the crank process lasted from the time the cranking motor was turned on until the engine speed moved past 200 r/min. The idle speed of this engine was 800 r/min, so the idle process was from an engine speed more than 800 r/min to a coefficient of speed fluctuation less than 3%. This article focused on the start-up process in which the engine speed rose from 200 r/min to 800 r/min, which had the worst emission characteristics.
2.3. Experiment Procedure
The cold start emissions were tested at different altitudes of 0 m, 1000 m, 2000 m, 3000 m, 3750 m and 4500 m, representing heights from the plains to the plateaus. According to the GB/T 20969.1–2007, each altitude has a corresponding ambient pressure which is shown in Table 2. It can be seen that the air pressure at 4500 m is nearly 50% less than at 0 m. The diesel engine needed to be still for at least 6 to 8 h to cool down, making the temperature of lubrication oil and coolant water close to the ambient temperature, in order to get the same lubrication conditions of the engine. At the beginning of each start, the combustion and emission analyzers would be stabilized and zeroed. An electrical pump was used to sample the exhaust at a constant flow, so the emissions were calculated in concentration (ppm). During the experiments, the ambient temperature was controlled around 293 K, and the inlet temperature and humidity were maintained by the plateau system at 293 K and 25% at each altitude. Diesel were injected into the cylinder at −20° crank angle (CA) after top dead center (ATDC) and the fuel supply strategy remained unchanged.
2.4. Analysis Procedure
Each altitude was tested at least twice to reduce the variation. Normally the emission was estimated as time change. However, for the transient emissions, especially for cold start, the emission should be estimated based on the whole changing process. Cold start is a process that every engine must go through and then continue to work, no matter how long the start process takes. In common conditions, it takes nearly the same time for each kind of engine. However, in extreme conditions, engines need much more time to reach the idle speed. The emissions should be analyzed in the whole start-up process.
On the other hand, for a transient process, the crank speed at different altitudes are various in the same unit of time. Faster start-up leads to more times of combustion during the start-up process, which are bound to higher the emissions characteristics. Therefore, emissions of the whole transient process are more reasonable to be analyzed.
3. Start-Up Performance
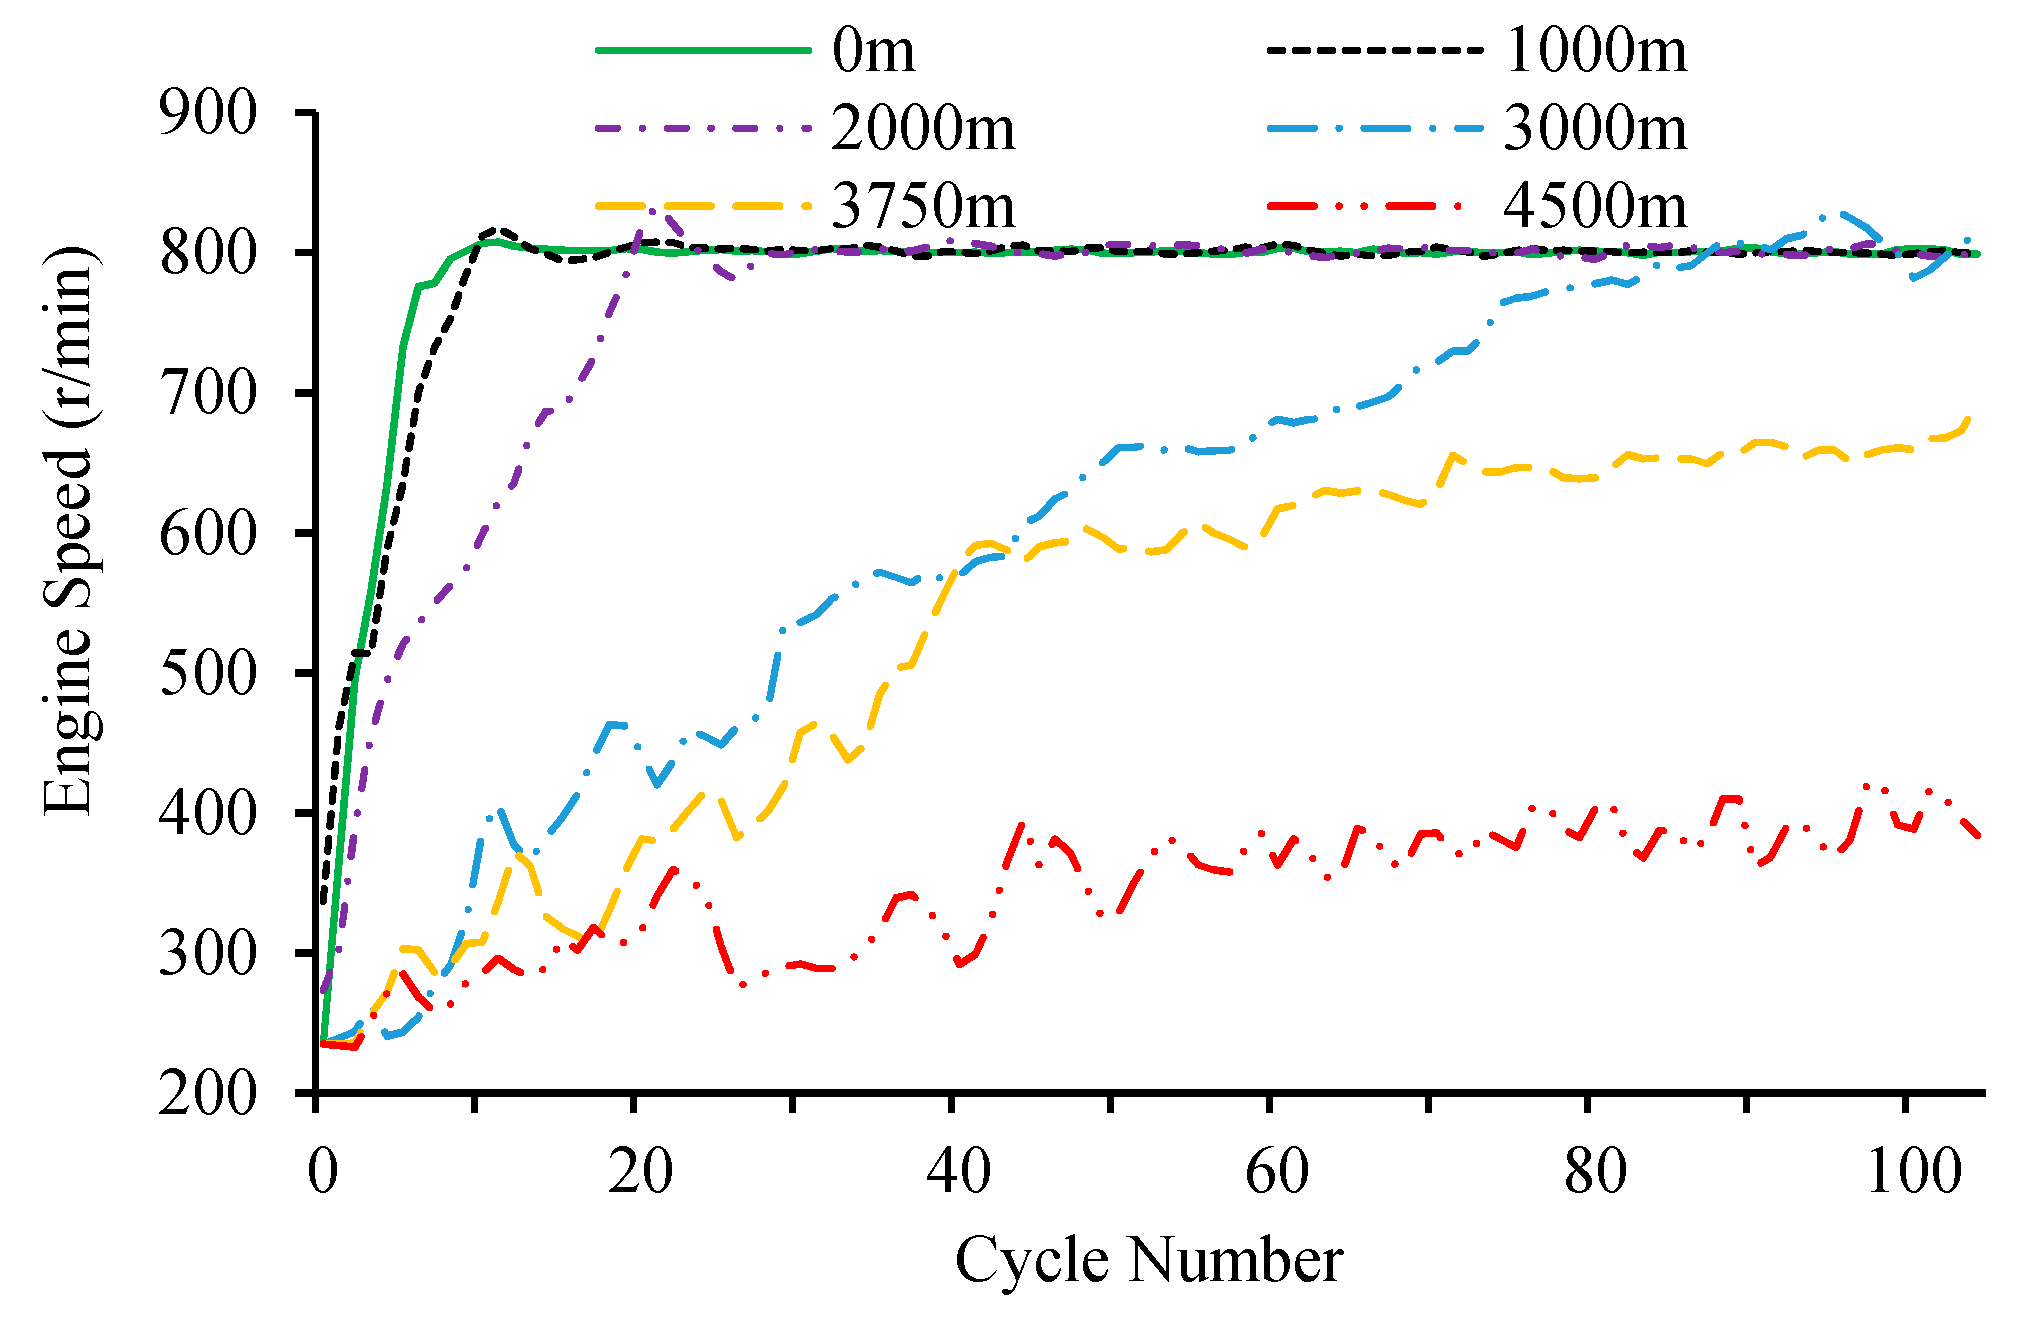
Figure 4 showed the transient speed of the engine changed in cycles during the whole cold start period from 0 m to 4500 m. The cycles were calculated with one of the four cylinders, so the actual cycles might be four times greater. As the altitude increased, the start-up duration and speed fluctuation clearly increased. The engine could start quickly below 2000 m. The top engine speed also got higher as the altitude increased because of the speed fluctuation. At 3750 m, the engine had difficulty starting and needed more than 30 s to do so. At 4500 m, the engine could not start successfully without assistance and the engine speed would not rise above 500 r/min. As the altitude increased, the engine’s cold start got more and more difficult.
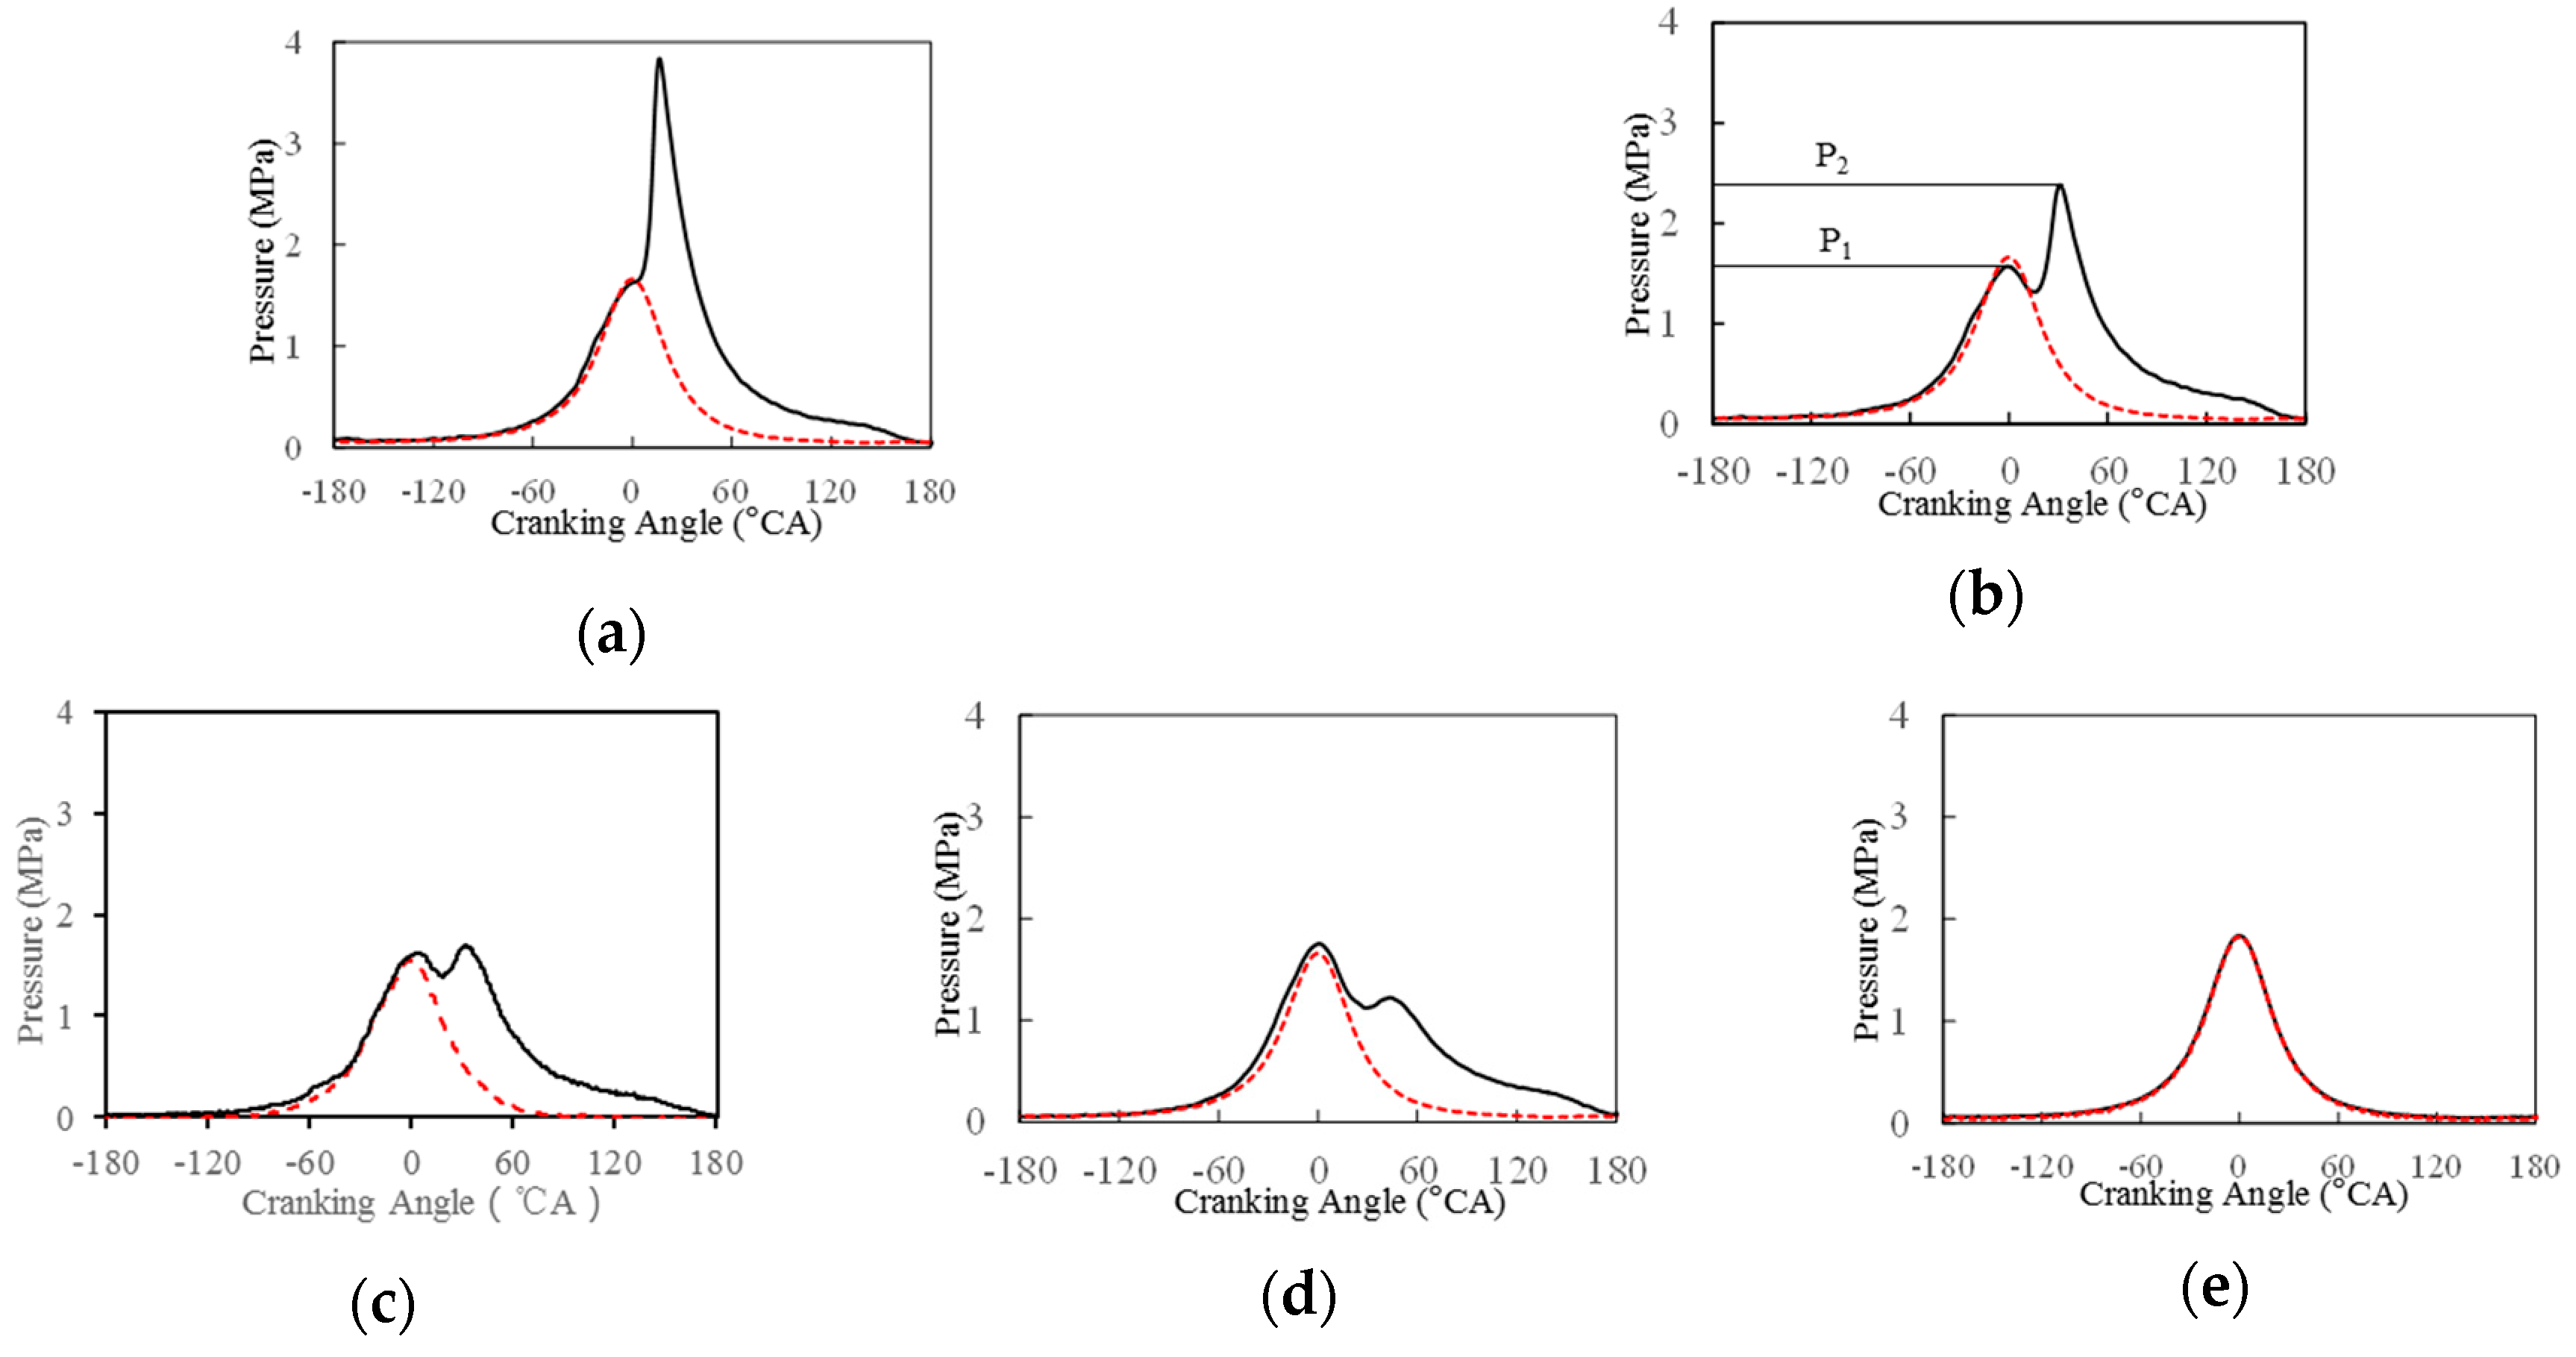
Due to the ignition delay, there were different in-cylinder pressure curves (black) shown in Figure 5 which could be classified into five combustion patterns [26]. The red line represented the in-cylinder compression curves. The best combustion condition should be a single peak such as in Figure 5a, which had the highest in-cylinder pressure and heat release rate. The in-cylinder pressure pick was just behind the compression pick (TDC). Diesel ignited into the cylinder was always well burned and generated more power. When the ignition delay increased, the ignition time was delayed so that the in-cylinder pressure pick was retarded. Two more peaks began to show up, respectively the parents peak (P2–P1 > 5bar), double peak (|P2–P1| ≤ 5bar) and afterburn (P1–P2 > 5bar). P1 is the compression peak pressure, P2 is the combustion peak pressure. As the ignition delay increased, the power generated by combustion was deferred to the expansion stroke that reduced the energy efficiency. As the altitude increased, the in-cylinder temperature decreased, and the ignition delay was too long to ignite. The misfire pattern showed up such as in Figure 5e which was almost the same as the compression curve, representing that the fuel was hardly burned. From Figure 5a–e, the combustion pressure dropped lower as the ignition delay increased indicating the combustion became worse.
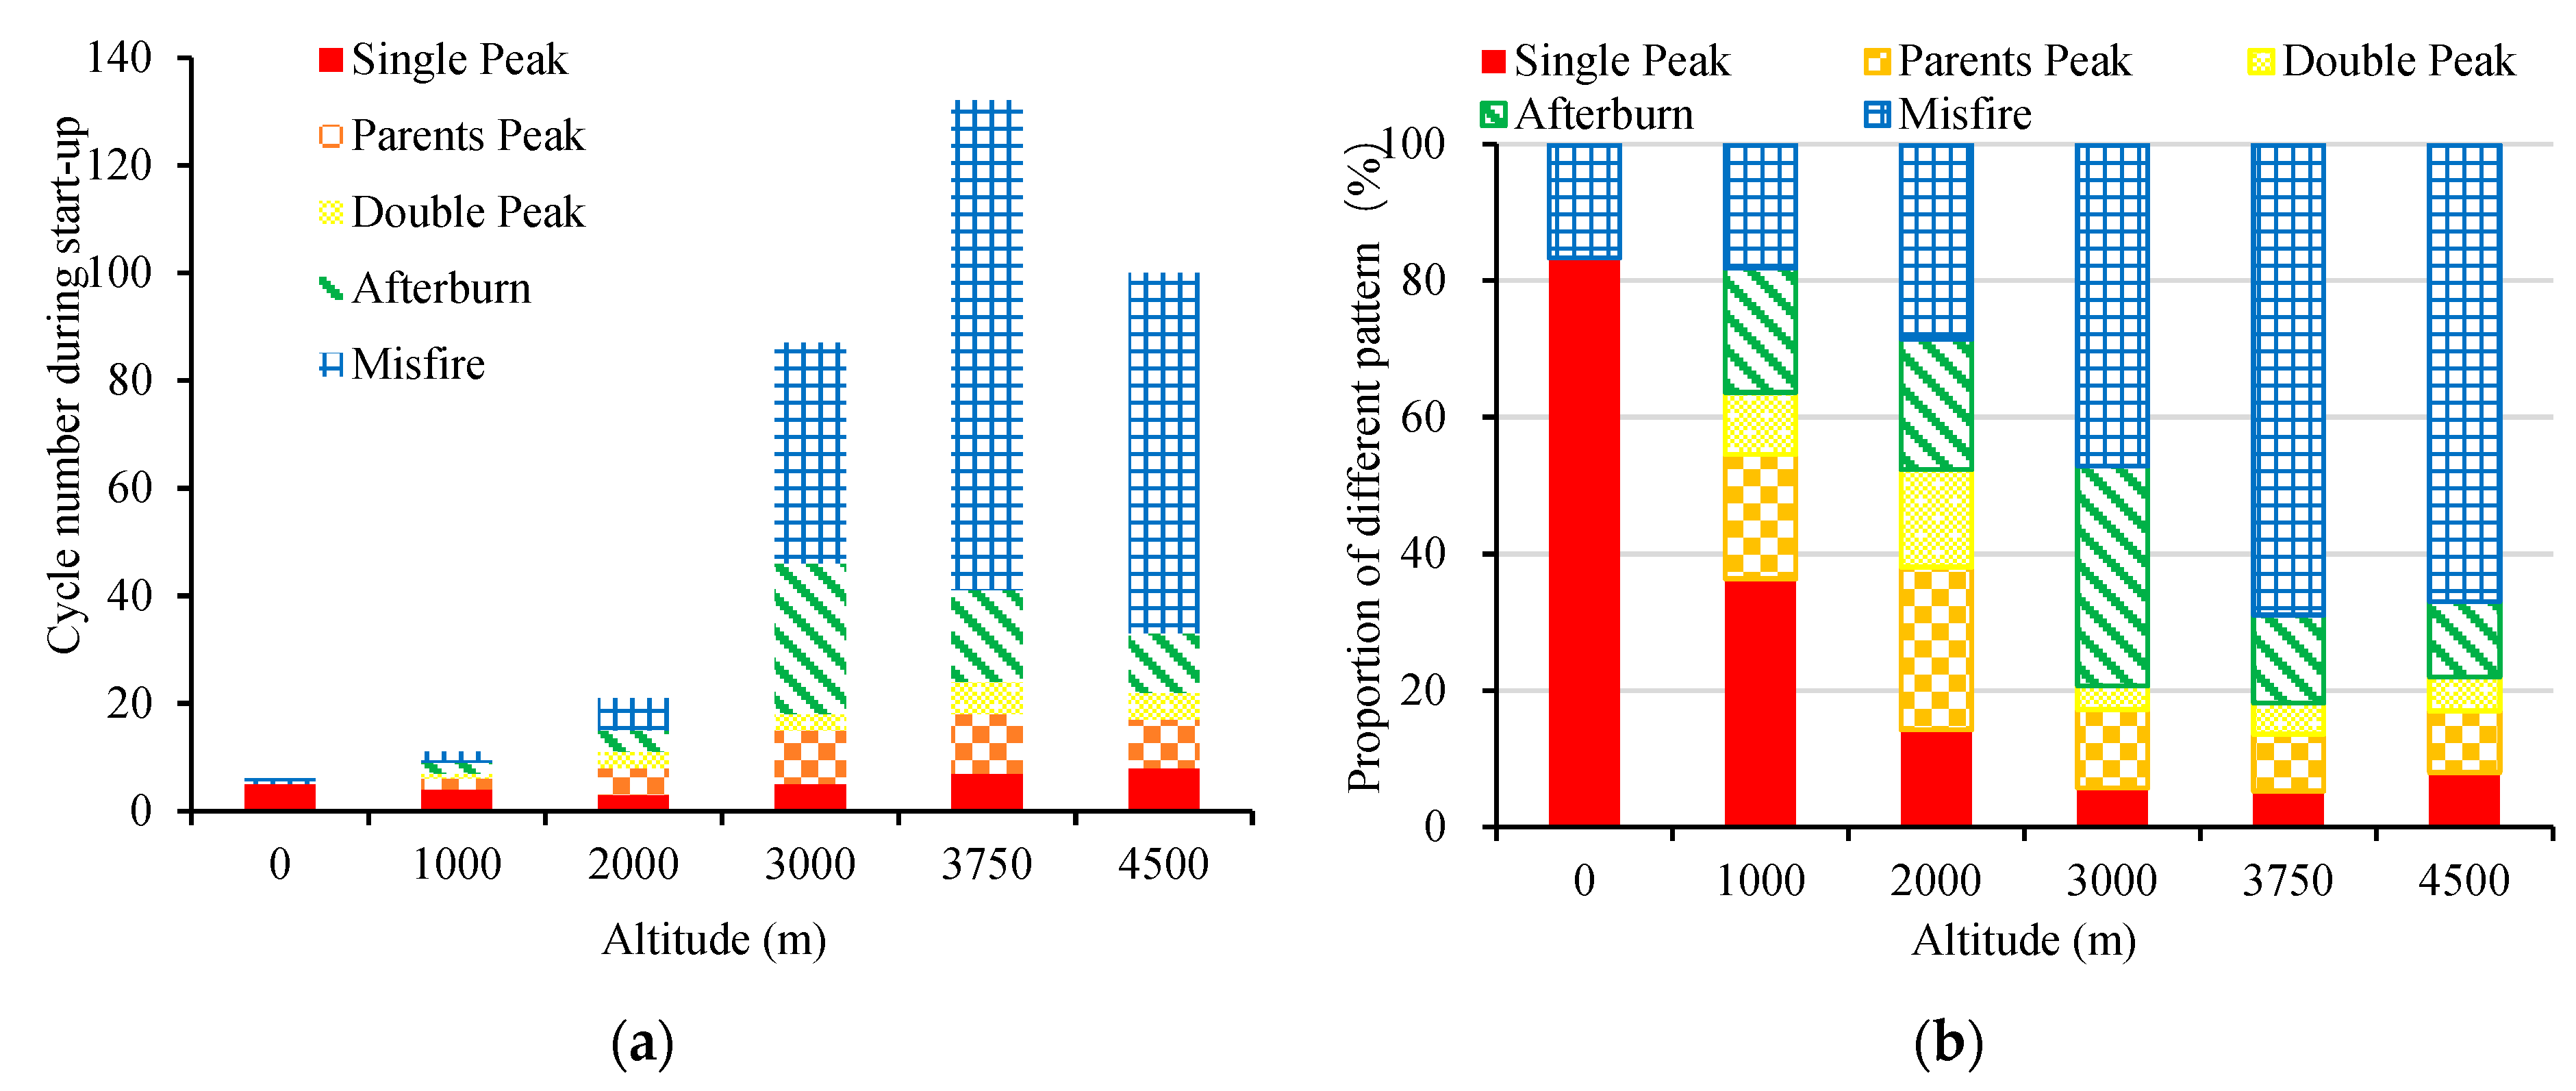
Figure 6a showed the same pattern of start-up process as Figure 4 at different altitudes. As the altitude increased, more cycles were needed for the engine to reach the idle speed. Parents peak, double peak, afterburn and misfire began to show up frequently. At 0 m, the engine needed only 6–8 cycles to reach 800 r/min which was more than 20 times less than at 3750 m. Because of the failure of start-up at 4500 m, the cycles were calculated at less than 3750 m.
Figure 6b shows the proportions of different combustion types. Oxygen content and inlet air pressure were relatively low when the altitude increased, which would cause a lower in-cylinder pressure and temperature at TDC. The single peak pattern turned into other minority and the misfire pattern grew more obvious because of the longer ignition delay at increasing altitudes, which produced more misfire patterns and other incomplete and inefficient combustion conditions [27].
When the altitude was relatively low (<2000m), the engine started quickly, the diesel spray was fully burned and the single peak and parents peak pattern were dominant. As the altitude increased, the afterburn and misfire pattern became prevalent. For the afterburn and double peak pattern, the fuel burned to CO2 but the time was delayed, failing to produce efficient power to the engine, and causing the speed to rise slowly. For the misfire pattern, the fuel barely burned and there were some low temperature chemical reactions. When the altitude was higher than 3000 m, misfires were widespread and made the engine hard to start. The engine speed fluctuated greatly leading to noisy and unstable working conditions.
4. Result and Analysis
The engine emission data was measured by time and the engine speed was measured by crank angle. Researchers usually analyze emissions over time. However, this does not represent the transient conditions well because the incertitude changes during the same period of time. In terms of the same speed variation interval, this article built a relationship between crank angle, engine speed and time, to combine the emissions with engine speed which shows the transient emission changes as the engine speeds up.
4.1. CO Emission
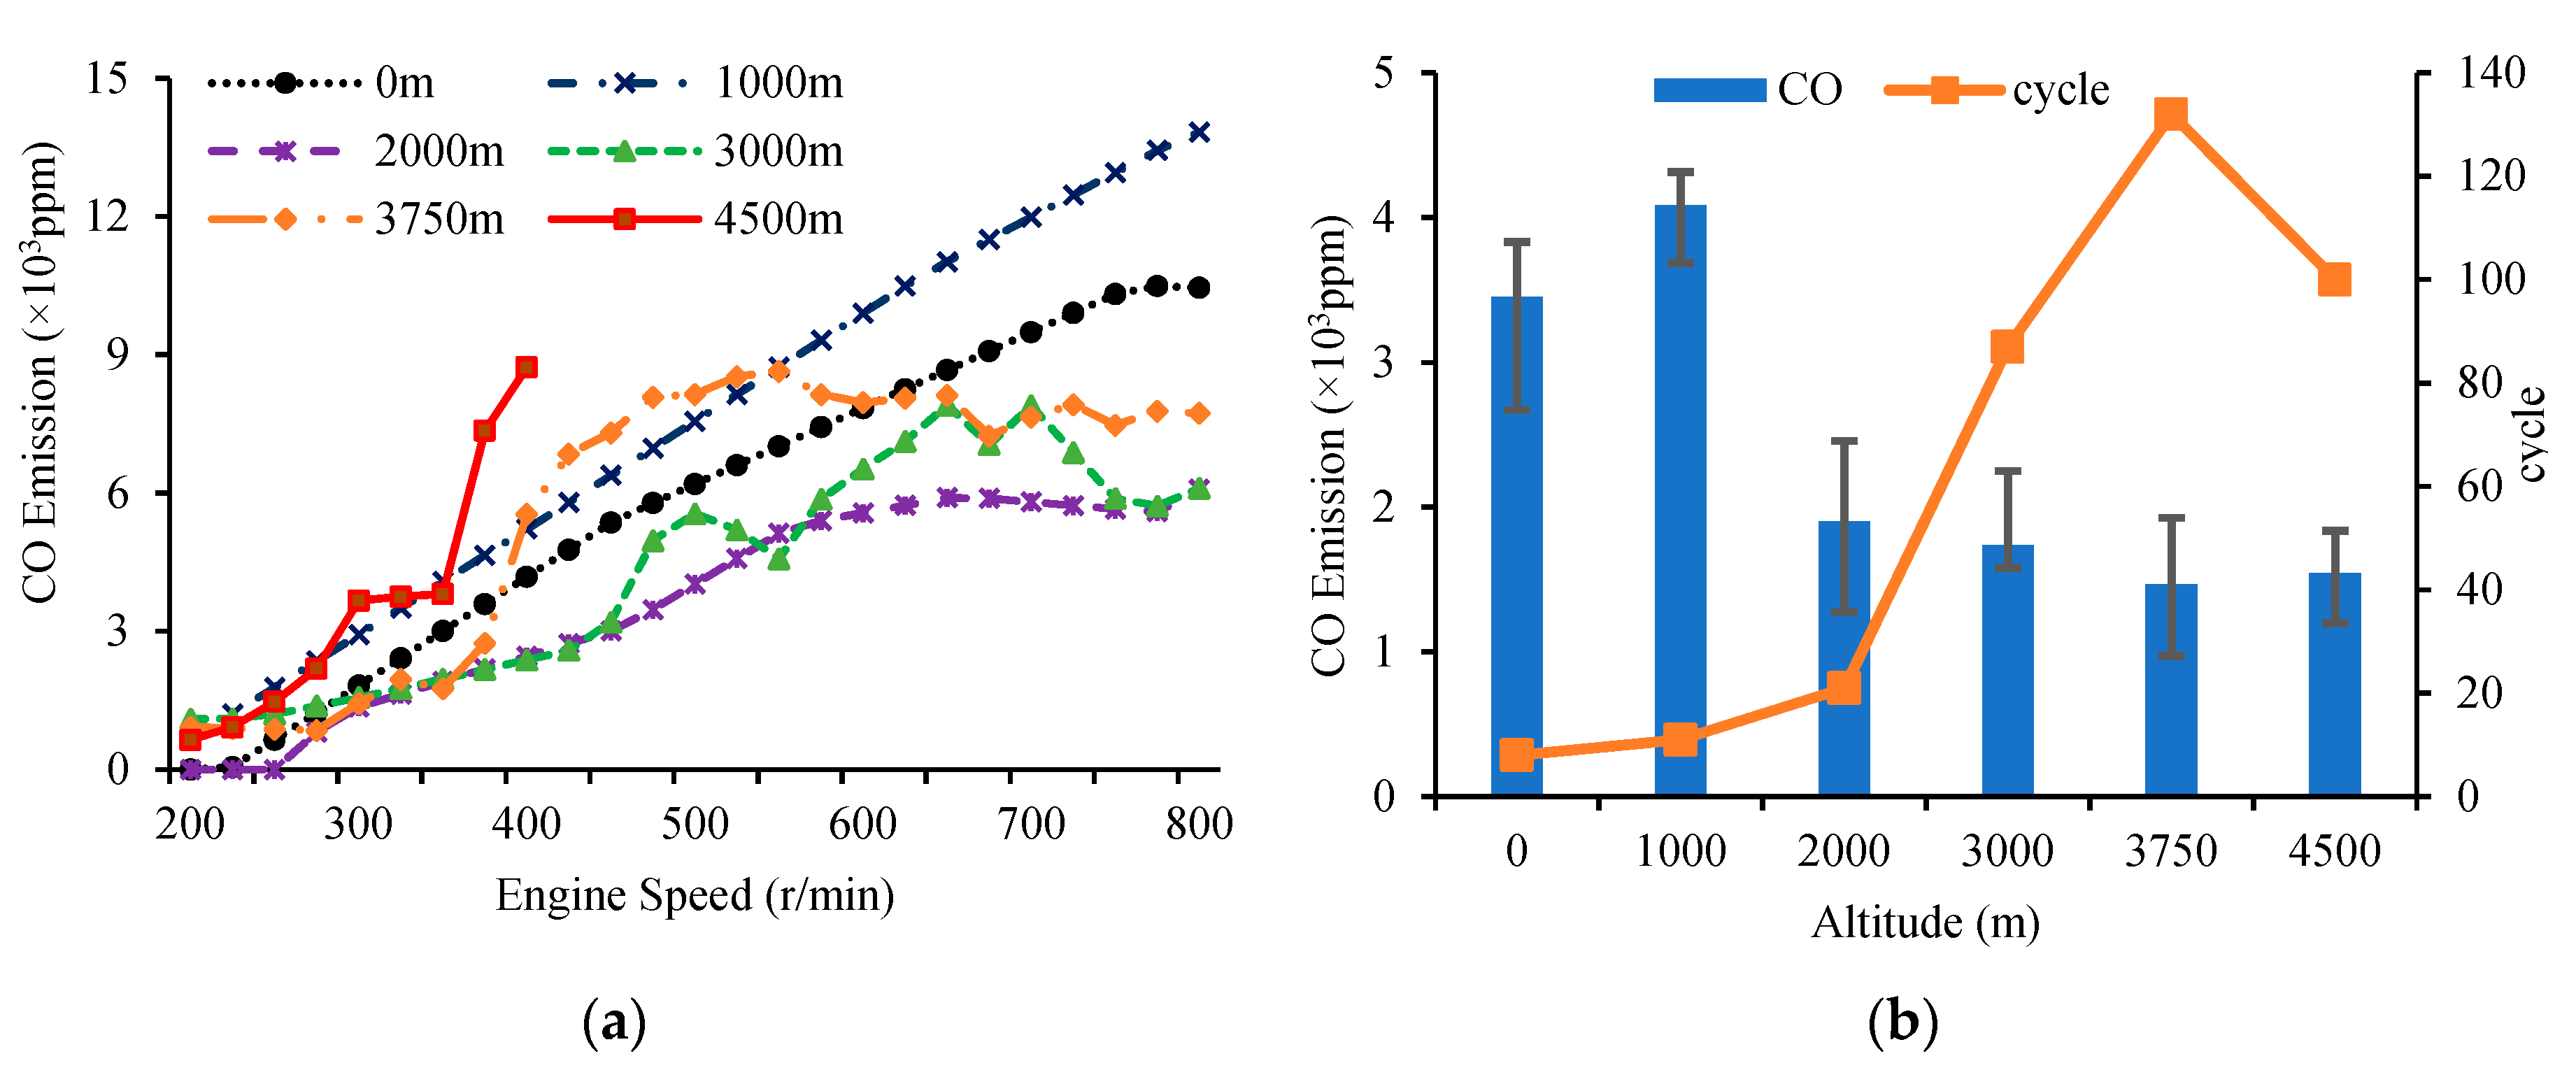
Figure 7 shows the CO emissions at different altitudes. Figure 7a indicates that the CO transient emission increased with engine speed at all kinds of altitudes because higher engine speed caused combustion to occur more in a unit time, leading to more CO emission. The CO emission trend became gentle after 600 r/min because of the fuel injection strategy which used less diesel after the engine speed was higher than 600 r/min. There was not a large change in CO emissions between each altitude. However, at 2000 m and 3000 m, CO emissions were slightly lower than at other altitudes. During the start-up process, the engine was well calibrated, and diesel burned well to CO2 at 0 m. As the altitude increased to 1000 m, less air was let in to the cylinder which made combustion worse and produced more CO, according to the chemical equilibrium theory. As the altitude continued to rise, insufficient combustion appeared and even could not be burned to CO, but stayed in the large hydrocarbon molecules. When the altitudes were higher than 3000 m, the start-up process extended obviously and needed many more cycles to reach the idle speed according to Figure 4, which exhausted more CO and other pollutions. The longer the time to start, the more CO produced at high altitudes.
Average CO emissions for each cycle during the start-up process are shown in Figure 7b. At low altitude, the CO emission was high, such that nearly no misfire showed up. Diesel injected into cylinder were all burnt and produced more CO. As the altitude grew higher than 2000 m, the combustion became worse and misfire began to appear frequently, some of the diesel could not burn, so average CO emissions decreased. Average CO emissions for each cycle at 0 m and 1000 m were about 200% higher than other altitudes.
4.2. CO2 Emission
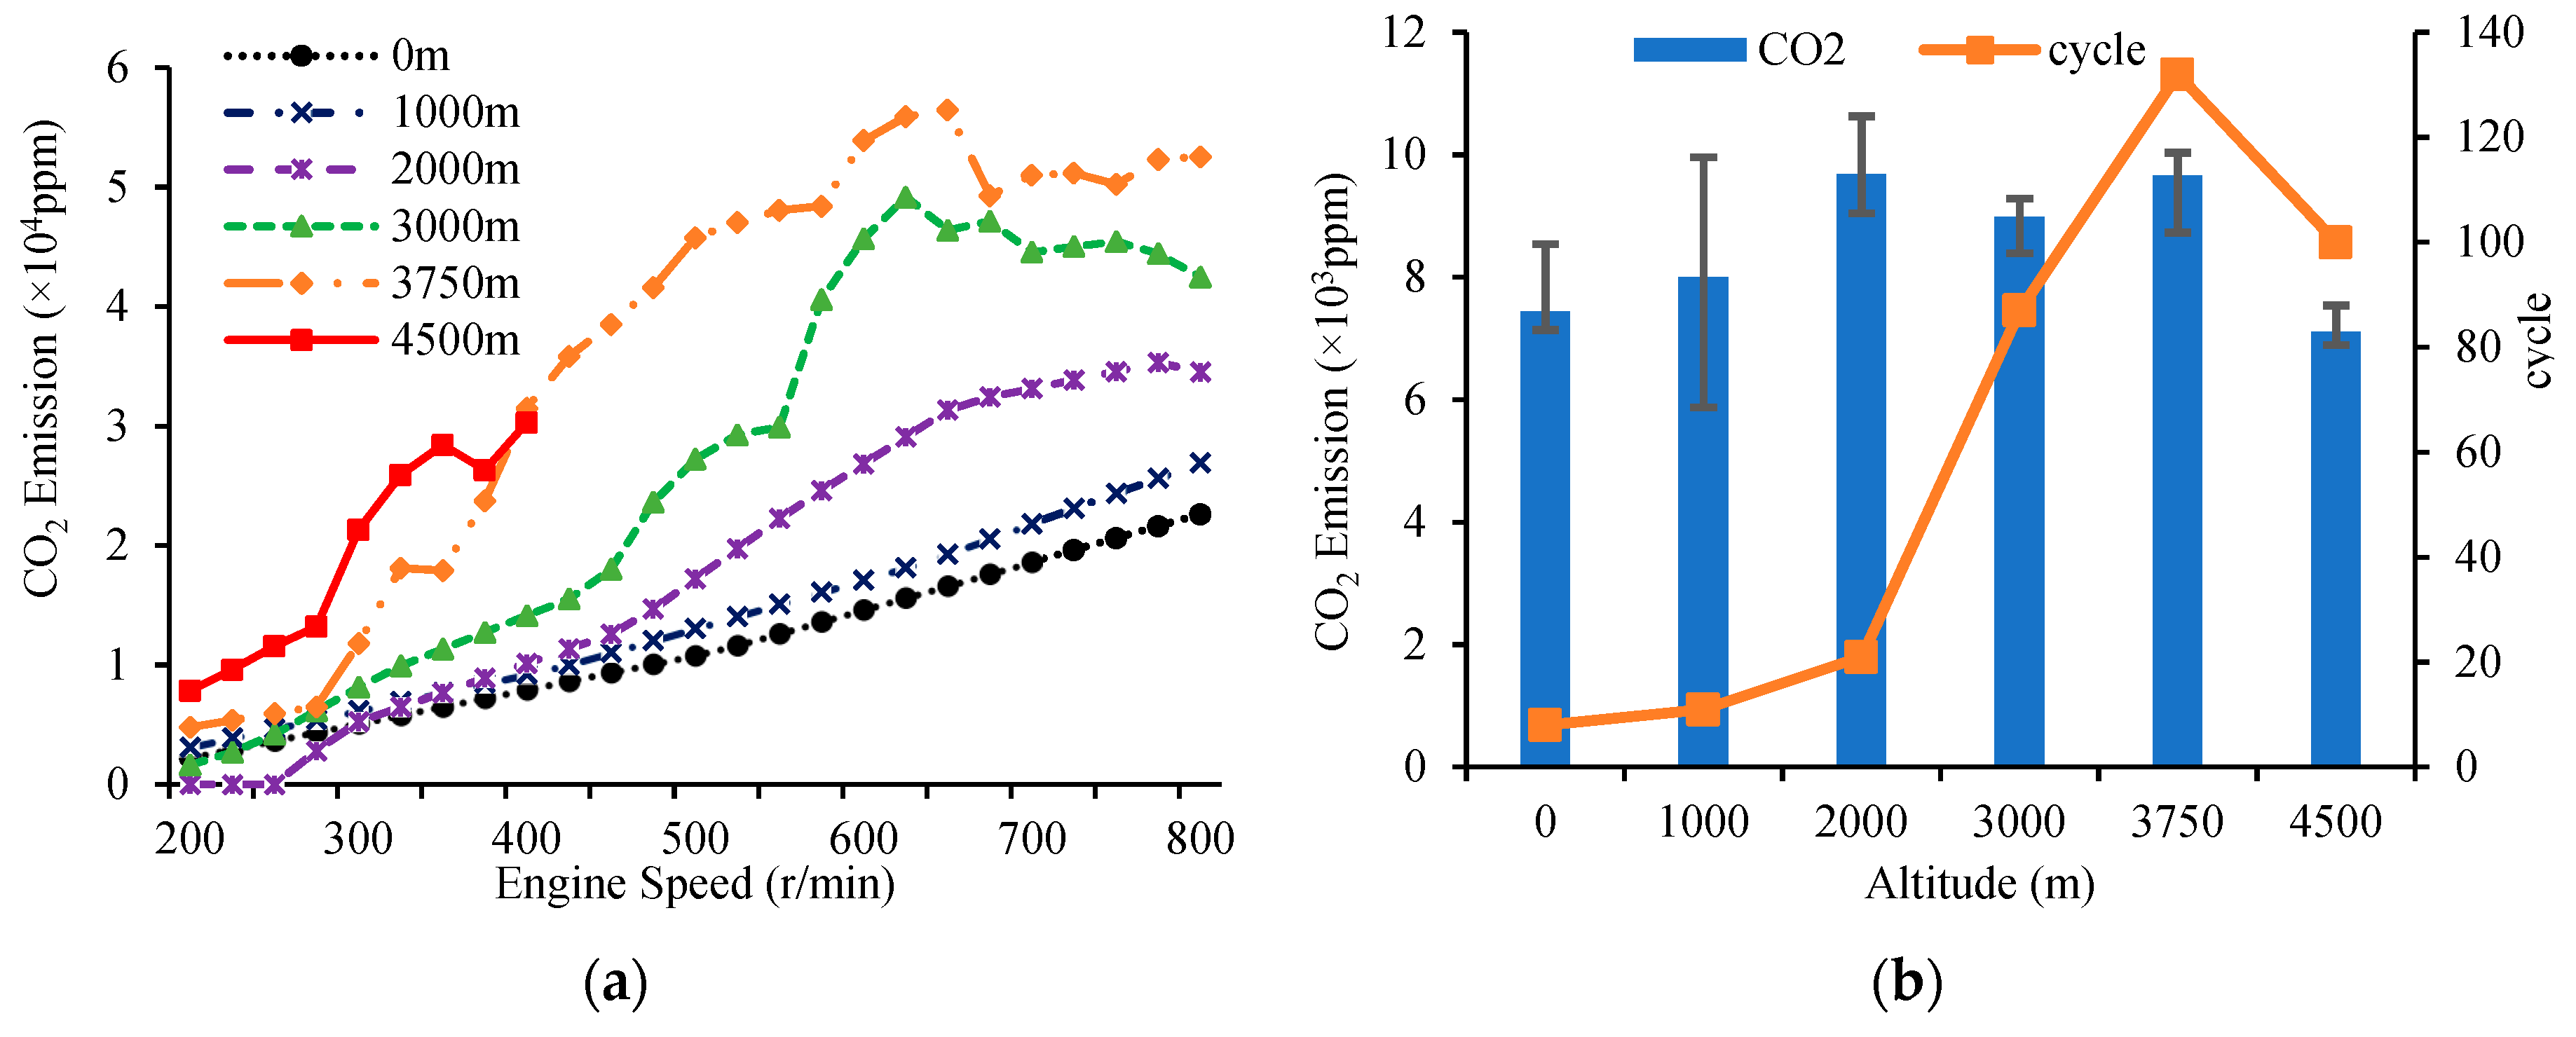
Figure 8 shows CO2 emissions at different altitudes. Figure 8a indicates that the CO2 transient emission increased as the engine speed grew at all kinds of altitude, and then the trends slowed after 600 r/min. That was because of the fuel injection strategy that injected less diesel after reaching engine speeds higher than 600r/min. As the altitude increased, CO2 emissions also increased at each engine speed. It had the same trend as the cold start performance. Longer start-up duration brought a higher CO2 emission, because it needed more cycles and more times of combustion to reach the idle speed. The CO2 emission increasing amplitude was similar to the number of cycles during the start-up process. Besides, the air/fuel ratio of diesel engines is always relatively high. Normally, the emissions will contain amounts of unreacted air. However, as the altitude increases, the inlet pressure and air content become smaller than at lower altitudes. As the air/fuel ratio went down and little air remained in the emission gas, the CO2 concentration increased relatively.
During the start-up process, as Figure 8b shows, average CO2 emissions for each cycle increased a little and then decreased as the altitude was raised. Higher altitudes caused less air to be taken into the cylinder. With the same amount of diesel, almost the same amount of O2 reacted and produced the similar CO2, so that less air made the concentration of CO2 increase a little. Meanwhile at 4500 m, the engine did not successfully start, and the majority of the combustion patterns were misfires. A big amount of diesel could not even react to CO2, so the concentration of CO2 emissions was decreased. The average CO2 emissions at different altitudes did not have an obvious difference during the start-up process.
4.3. THC Emission
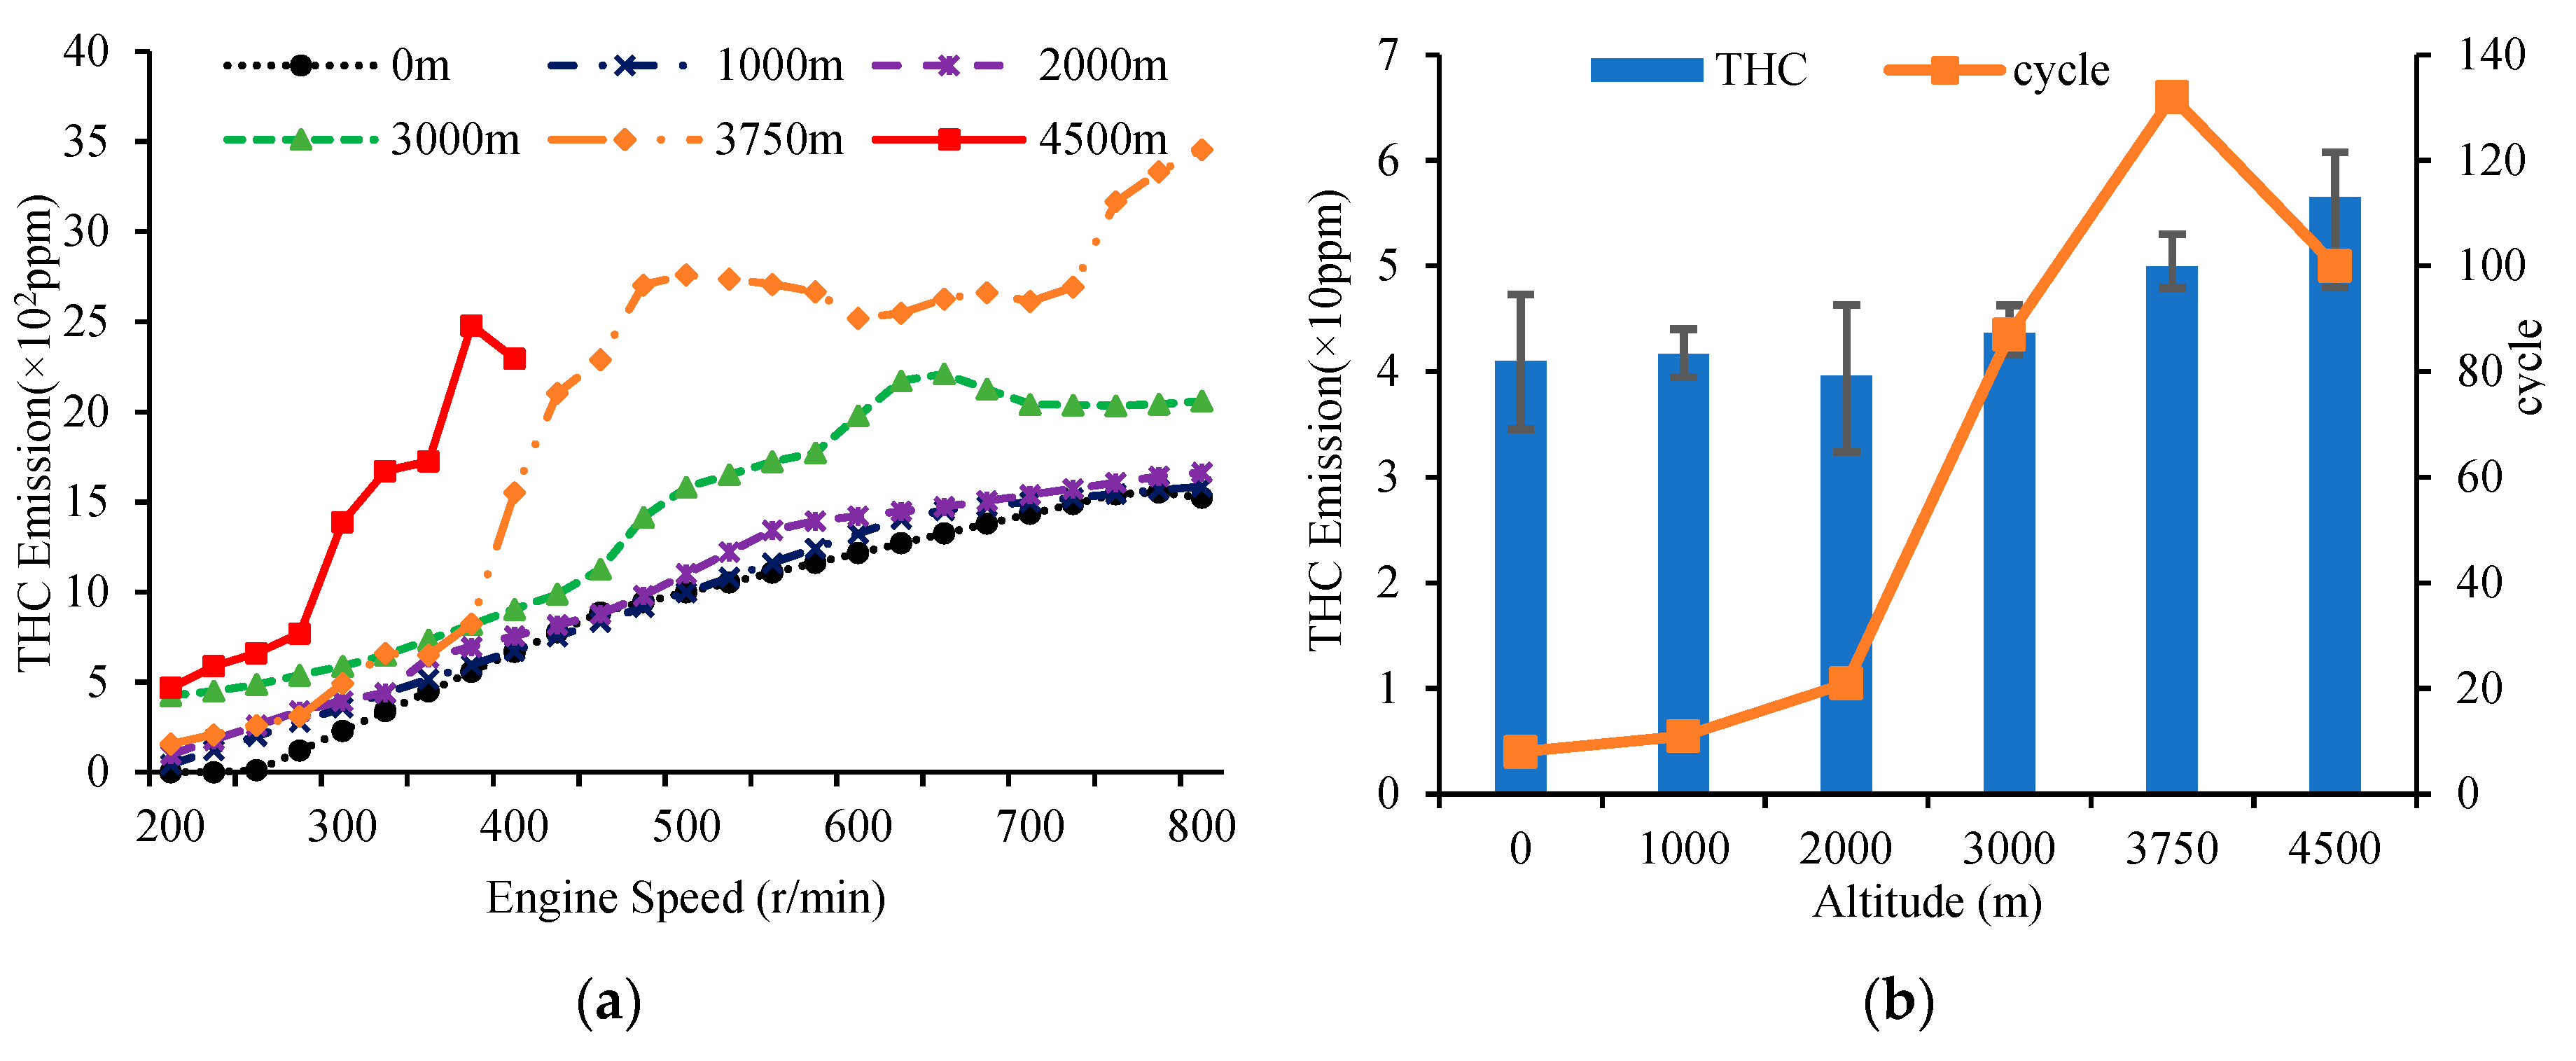
Figure 9 shows THC emissions at different altitudes. Figure 9a indicates that THC transient emissions increased as the engine speed went up at all kinds of altitude and then the trend decreased after 600 r/min. At medium and low altitudes (<3000 m), THC emissions did not show obvious difference. However, at high altitudes, THC emissions increased rapidly. Figure 6 indicates that at low altitudes, different combustion patterns showed up, but single peak and parents peak still made up the majority of the start-up process. At high altitude, diesel fuel became hard to ignite with the ignition delay prolonged, and the misfire and afterburn patterns were prevalent. Temperatures at the TDC were relatively low at high altitudes during cold start, because of a worse atomization of the diesel spray and a longer spray penetration, which would enhance the wall-burning and cause a high THC emission. Moreover, the engine needed much more time to reach idle speed at altitudes higher than 2000 m, so there were more series of diesel injections and more THC was produced. The higher the altitude, the more misfires appeared, and the more THC was produced.
During the start-up process, as Figure 9b shows, average THC emissions for each cycle increased with an increase in altitude. Average THC emissions had a strong relationship to the combustion characteristics. Higher altitudes let less air into the cylinder accompanied by a worse spray characteristic and a longer ignition delay. This led to insufficient combustion and more misfires and afterburn were produced, followed by higher diesel consumption and average THC emissions. At 4500 m, the engine did not successfully start, ignition was even more difficult, the majority of the combustion patterns were misfires and THC emissions reached high levels. The average THC emission for each cycle at 4500 m was 1.4 times higher than at 0 m during the start-up process.
4.4. NOX Emissions
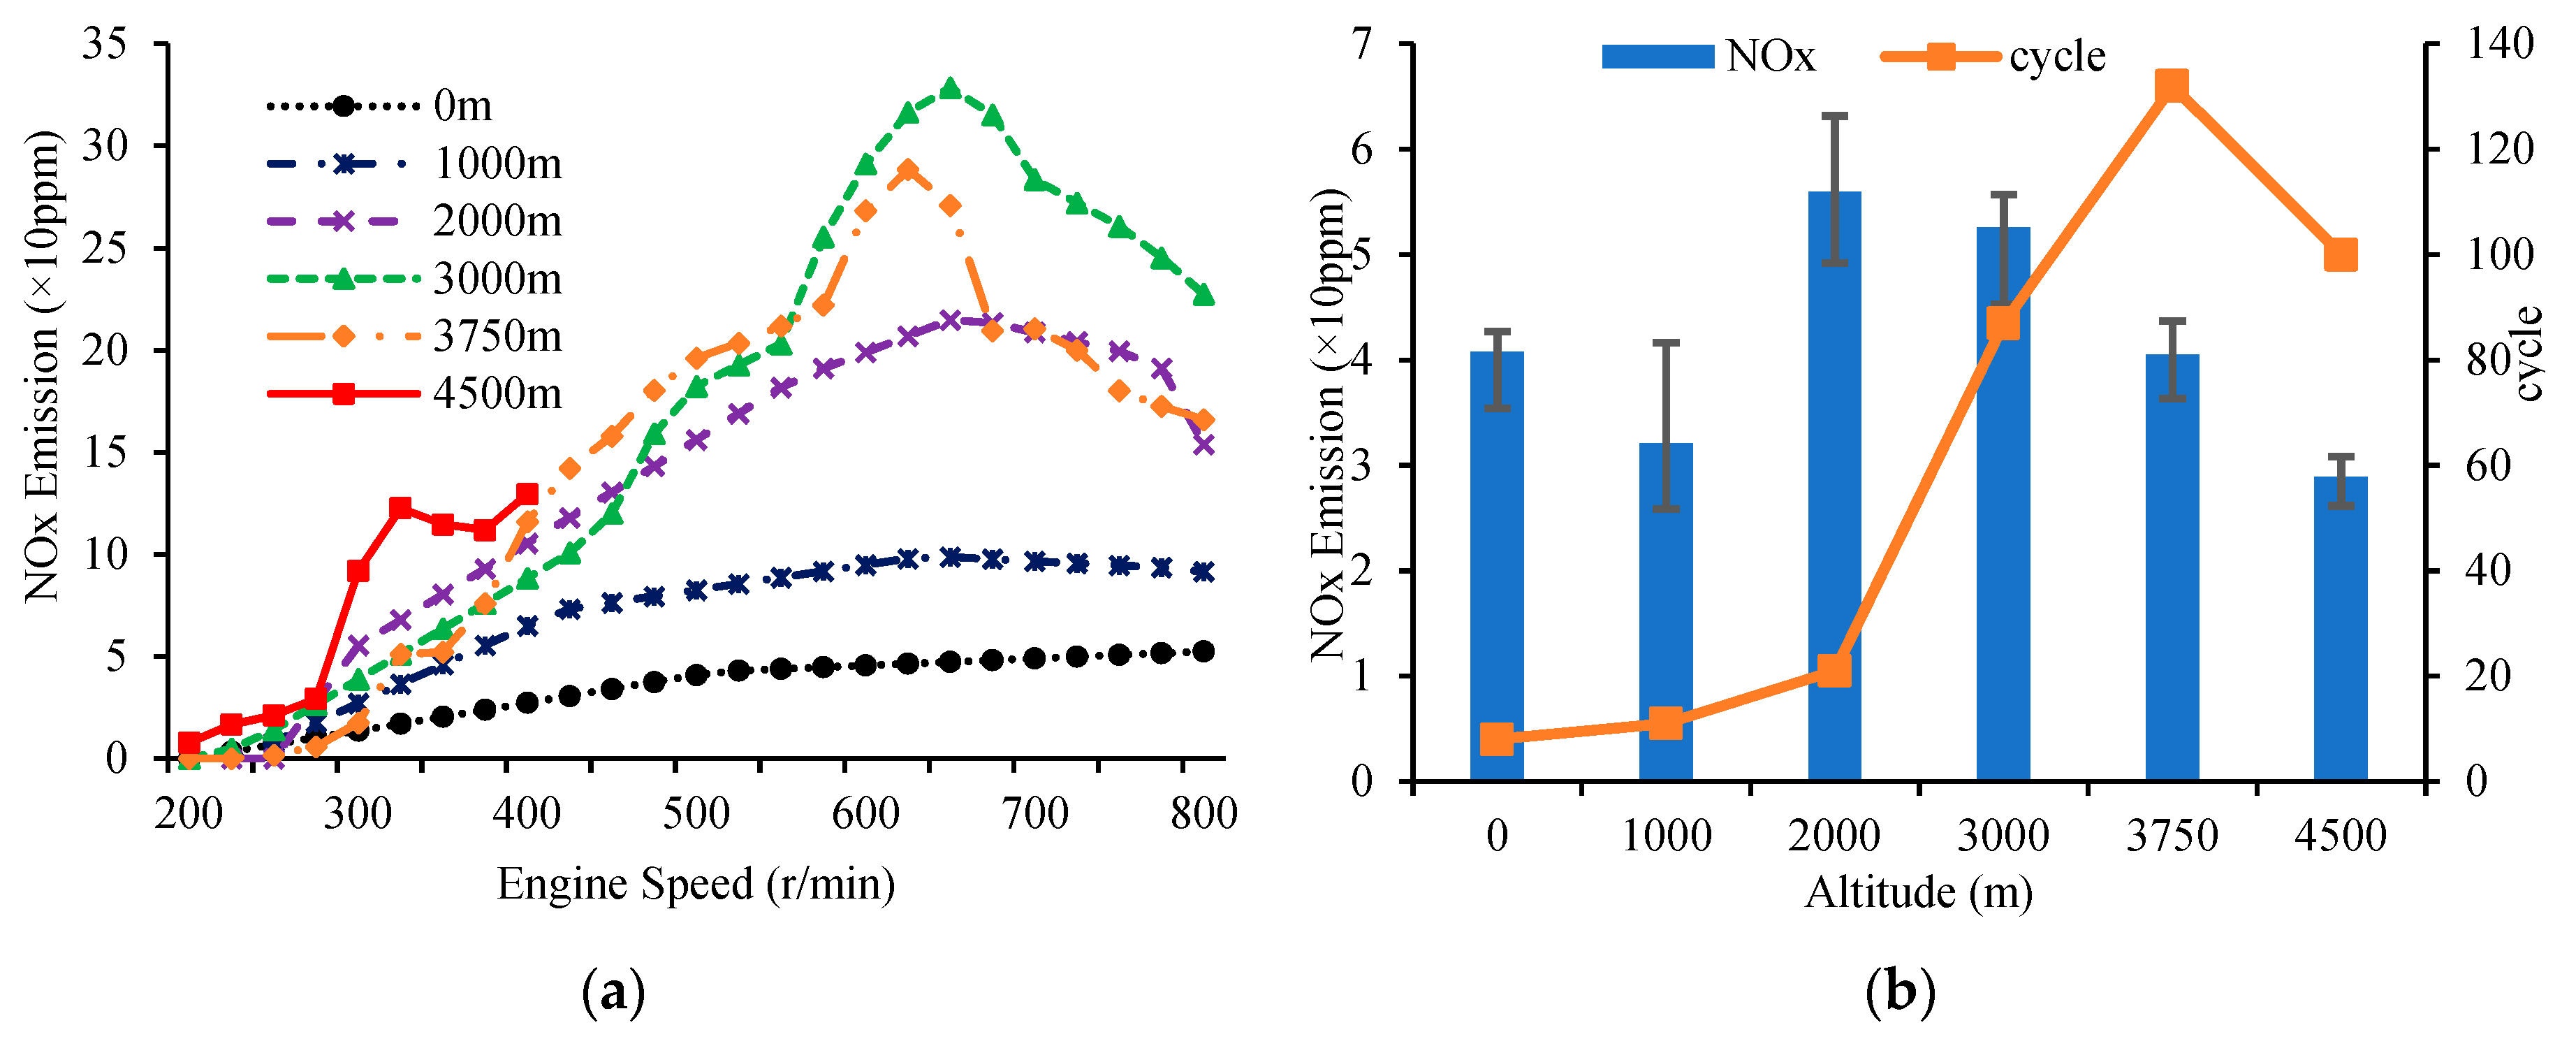
Figure 10 shows NOX emissions at different altitudes. Figure 10a, indicates that NOX transient emissions increased when the engine speed rose at all kinds of altitude and then decreased after 600 r/min. As the altitude increased, NOX emissions increased at each engine speed becoming more apparent as the speed rose. As the altitude rose over 3000 m, the NOX emission stopped increasing and even exhausted less.
As the altitude increased, the in-cylinder combustion became more unsteady and produced many kinds of combustion patterns. High altitudes caused an anomalous spray and air–fuel mixture. According to the NOX formation mechanism, normally the NOX is produced in diesel engines because of the high combustion temperature (over 1500 °C) and rich oxygen environment (Thermal NOX) in the combustion chamber. Higher altitudes provided less O2 and lower TDC temperature, the Thermal NOX was restrained and produced less NOX. However, that was with a focus on normal combustion conditions. As the altitudes rose higher than 2000 m, misfire and afterburn patterns appeared more frequently. Many diesels combusted slowly or were even unburnt, bringing a relatively lower combustion temperature. Especially in the cold start condition, the maximum in-cylinder temperature was hardly more than 1300 °C. It made the fuel produce HCN, CN, NH3, then react to NO (Fuel NOX). At the same time, when the air/fuel ratio was relatively low, NO was produced instantaneously according to the Fenimore mechanism (Prompt NOX) [28]. These two important NOX formation mechanisms were not common to the normal in-cylinder combustion, particularly under 1500 °C. However, for cold start, higher altitude resulted in less air inlet into the cylinder, which brought a lower TDC temperature and air/fuel ratio. The undesirable combustion and spray atomization caused a lower combustion temperature and too rich mixture that enhanced the Fuel NOX and Prompt NOX Mechanism. Therefore, more NOX was produced as the altitude increased. On the other hand, the start-up process was longer as the altitude increased. The engine produced more cycles and burned more diesel during the transient start process, so that it exhausted more NOX in general.
During the start-up process, as Figure 10b shows, the average NOX emission for each cycle slightly decreased with the altitude. There were trade-off properties between thermal NOX mechanism, fuel NOX and prompt NOX. Below 3000 m, the engine was well calibrated and Thermal NOX played a large role due to the relatively fast start-up and higher combustion temperature, so that as the altitude increased, TDC temperature and mass of air were lower, which produced less NOX. At altitudes above 3000 m, the Fuel NOX and Prompt NOX were enhanced and exhausted a little more NOX than lower altitudes. However, the NOX emission trends were the same along with the altitudes. The average NOX emissions for each cycle at 4500m were only 70% less than at 0 m during the start-up process.
4.5. PN Emission
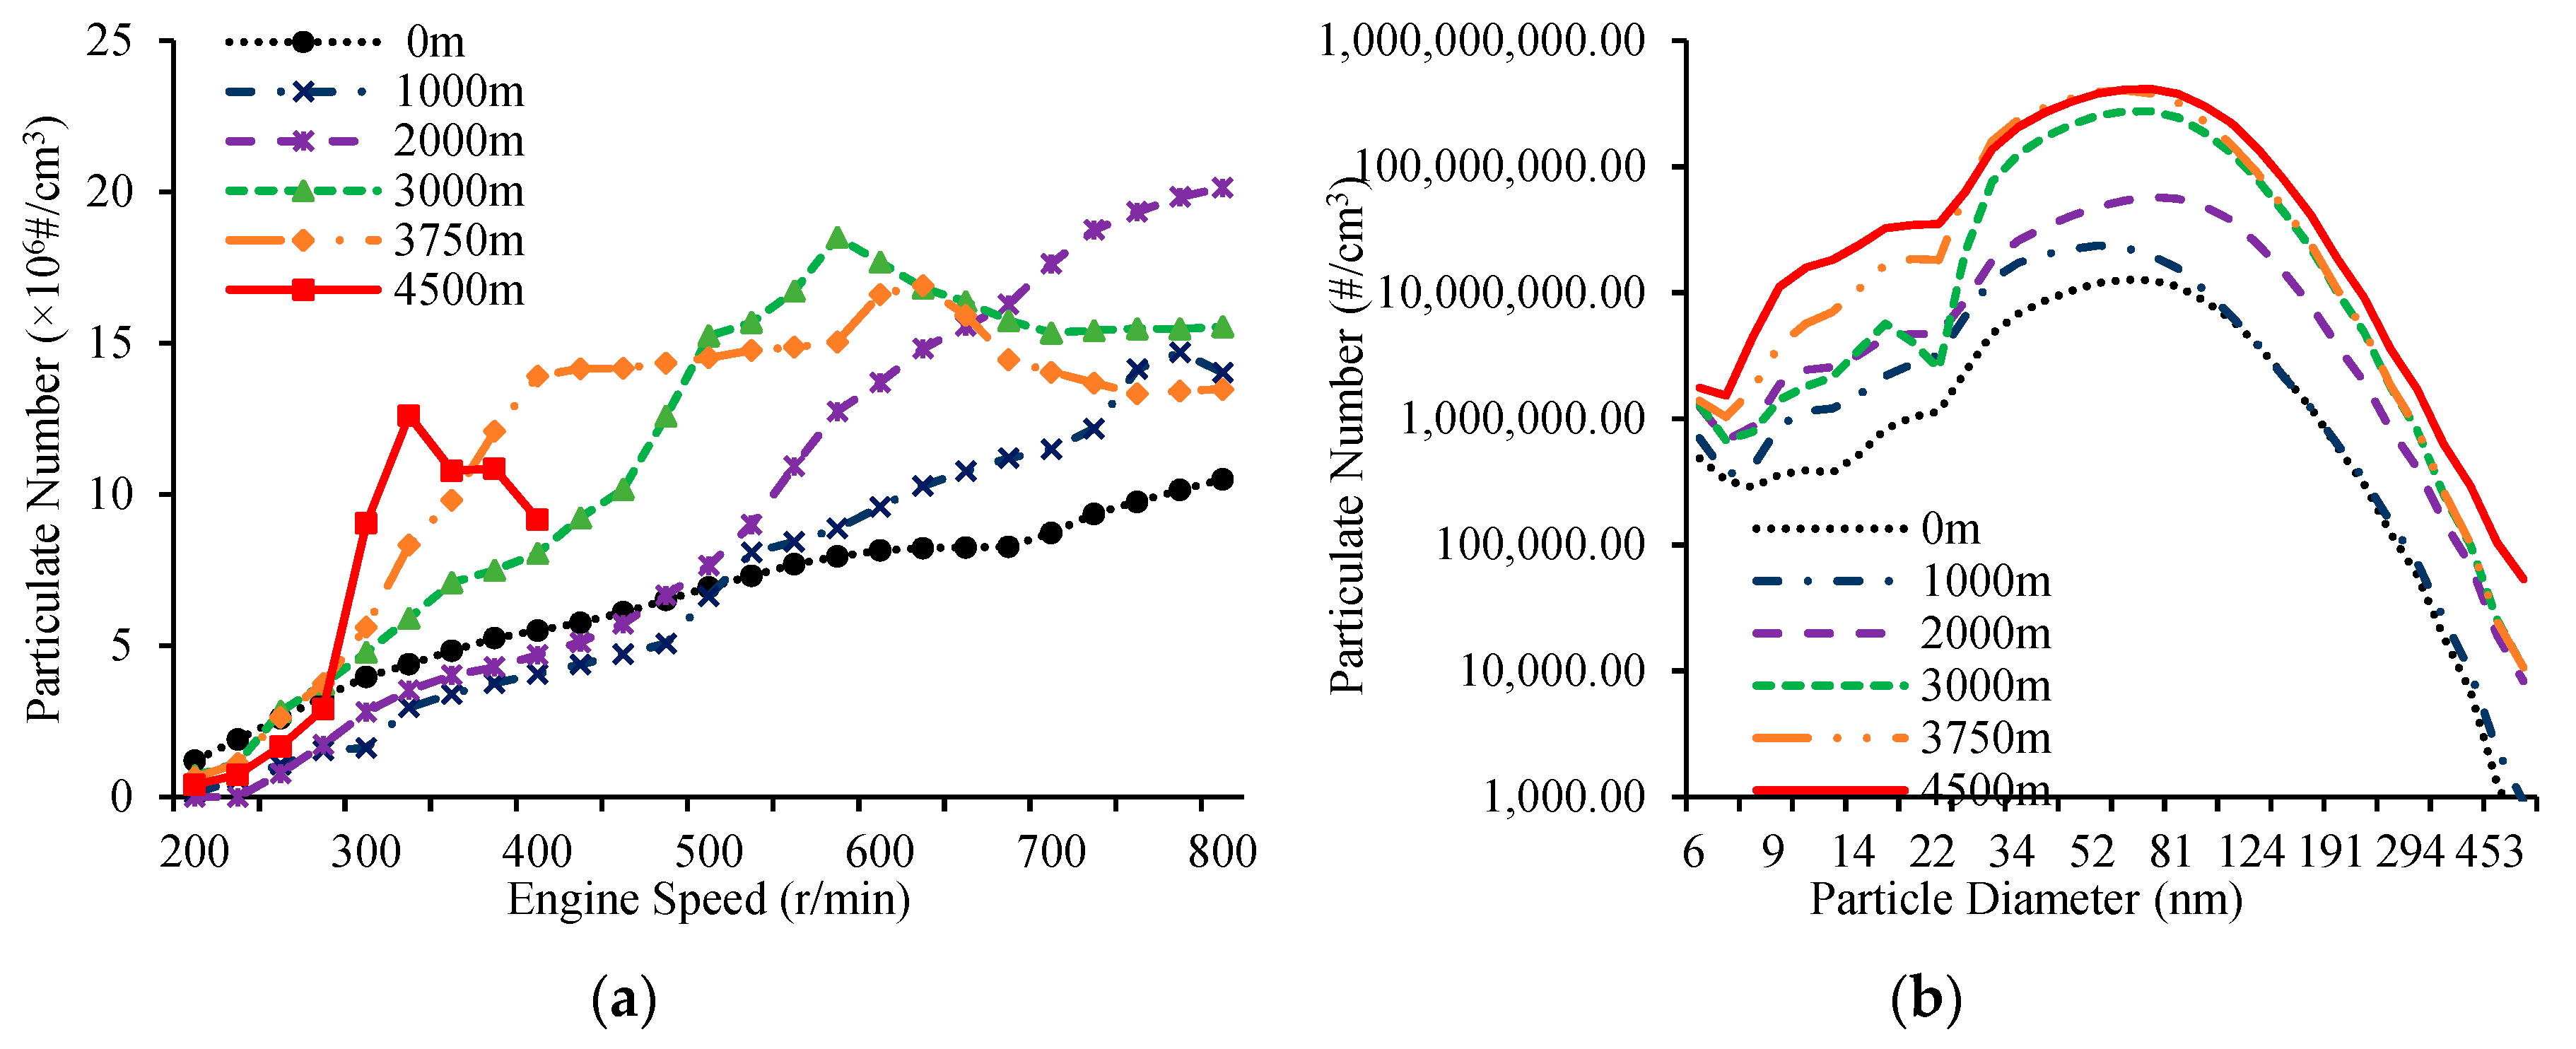
Figure 11 shows the PN emissions at different altitudes. Figure 11a indicates that PN transient emissions increased when the engine speed increased at all kinds of altitudes. As the altitude increased, PN emissions increased. At high altitudes, it had poor diesel spray atomization and longer ignition delay which led to poor combustion characteristics. Insufficient combustion caused particulates. The abnormal combustion patterns meant that the diesel did not burn well in-cylinder creating double peaks, afterburn and misfires. As the altitude increased, the proportion of abnormal combustion patterns increased which caused particulate emissions to increase. As the engine speed rose past 600 r/min, there was less diesel injected into the cylinder and PN emissions became gentle.
Figure 11b shows the diameter distribution of PN emissions at different altitudes during the start-up process. As the altitude increased, the PN emission increased at each diameter. The diameter distribution was similar to mono-distribution, and in small particles no peak showed up. The particulates were concentrated between 20 nm and 190 nm and peaked near 70 nm. From 0 m to 4500 m, the engine needed more times of combustion to reach the idle speed which produced more particles during the start-up process. Meanwhile, the combustion became worse at high altitude and produced more particles. According to Figure 6a, the increase of single peak and parents peak promoted the small particles emissions, and the increase of misfire and afterburn promoted the large particles emissions. The combustion patterns might be used to estimate the PN and PM general emissions in the future.
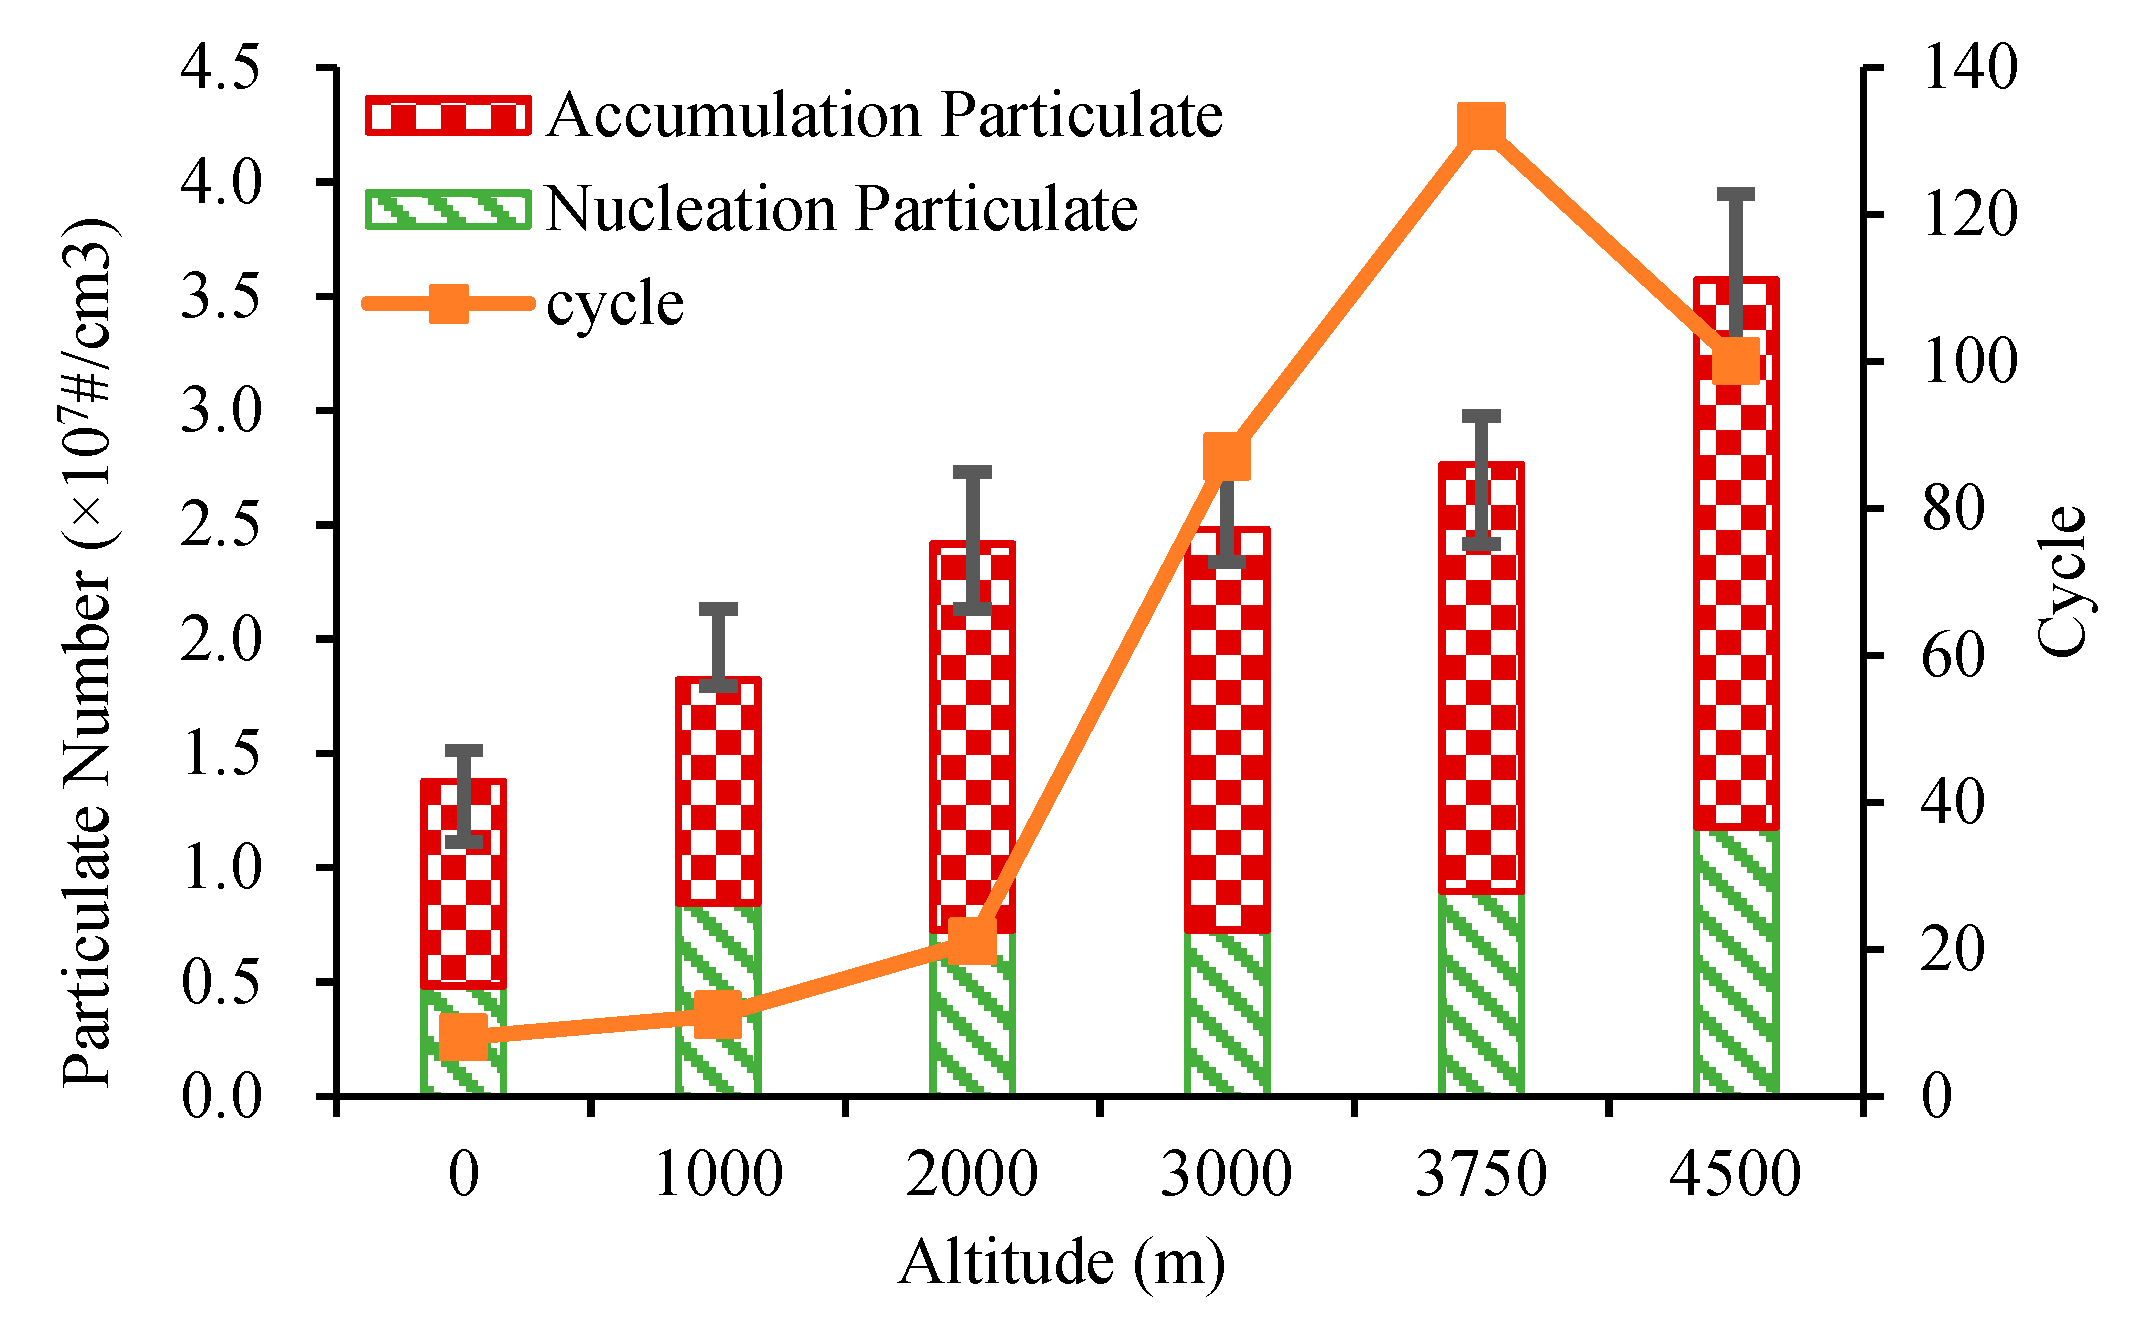
The particulate was in both nucleation mode and accumulation mode. The nucleation mode includes the super tiny particles with diameters less than 50 nm, and the accumulate mode consists of all the other larger particles. Many studies have concluded that nucleation mode particles are volatile organic carbons (VOCs) which originate from fuel and lube oil, whilst accumulation mode particles consist of soot particles containing a crystalline form of carbon with a carbon element [29].
Figure 12 shows the diameter distribution of average PN emissions for each cycle at different altitudes during the start-up process. As the altitude increased, both nucleation and accumulation particulates emissions were increased. From 0 m to 1000 m, the engine’s start performances were almost the same. The combustions were little influenced and produced more nucleation particulates. From 1000 m to 3750 m, the lower TDC temperature and air/fuel ratio made the ignition delay longer. Many unexpected combustions appeared, and accumulation particulates emissions were increased. At 4500 m, the ignition delay was too long, the combustions were unstable, and the engine could not successfully start up. Therefore, it produced the highest PN emissions which was 2.6 times more than at 0 m.
4.6. PM Emission
Figure 13 shows PM emissions at different altitudes. In Figure 13a, PM transient emissions increased as the engine speed increased at all kinds of altitude, and then went down or turned flat around 600 r/min at each altitude. At 4500 m, the engine speed could not move past 500 r/min and hardly burned any diesel, so the PM emission had a big fluctuation than at other altitudes between 300 to 500 r/min. PM emissions increased with the altitude, especially from 1000 m to 3000 m. PM was highly influenced by the particle diameter, and large particulate made up most of the particulate mass. As the altitude increased, the proportion of insufficient combustion was increased which caused PM emissions to increase. The engine started quickly under 3000 m which did not give the engine enough time to heat up. Therefore, when the engine reached the idle speed, PM emissions were relatively higher or continued to rise under 3000 m.
Figure 13b shows the diameter distribution of PM emissions at different altitudes during the start-up process. As the altitude increased, the average PM emission increased in each diameter. The PM was concentrated between 40 nm and 500 nm, which formed an emission peak near 110 nm. It had almost the same trend as the diameter distribution of PN emissions and had the same causes. However, the distinction in the small particles was not as obvious as it was in the large ones, because large particles were much more sensitive to PM emissions. The PM distribution was shown to be unimodal and the large particles took the lead. The diameter distribution gave a specific explanation to the particulate emissions characteristics. It also had a relationship with the combustion patterns. The amount of misfire and afterburn were related to the PM emissions. The PM emission distribution peak at 4500 m was 3.2 times higher than at 0 m.
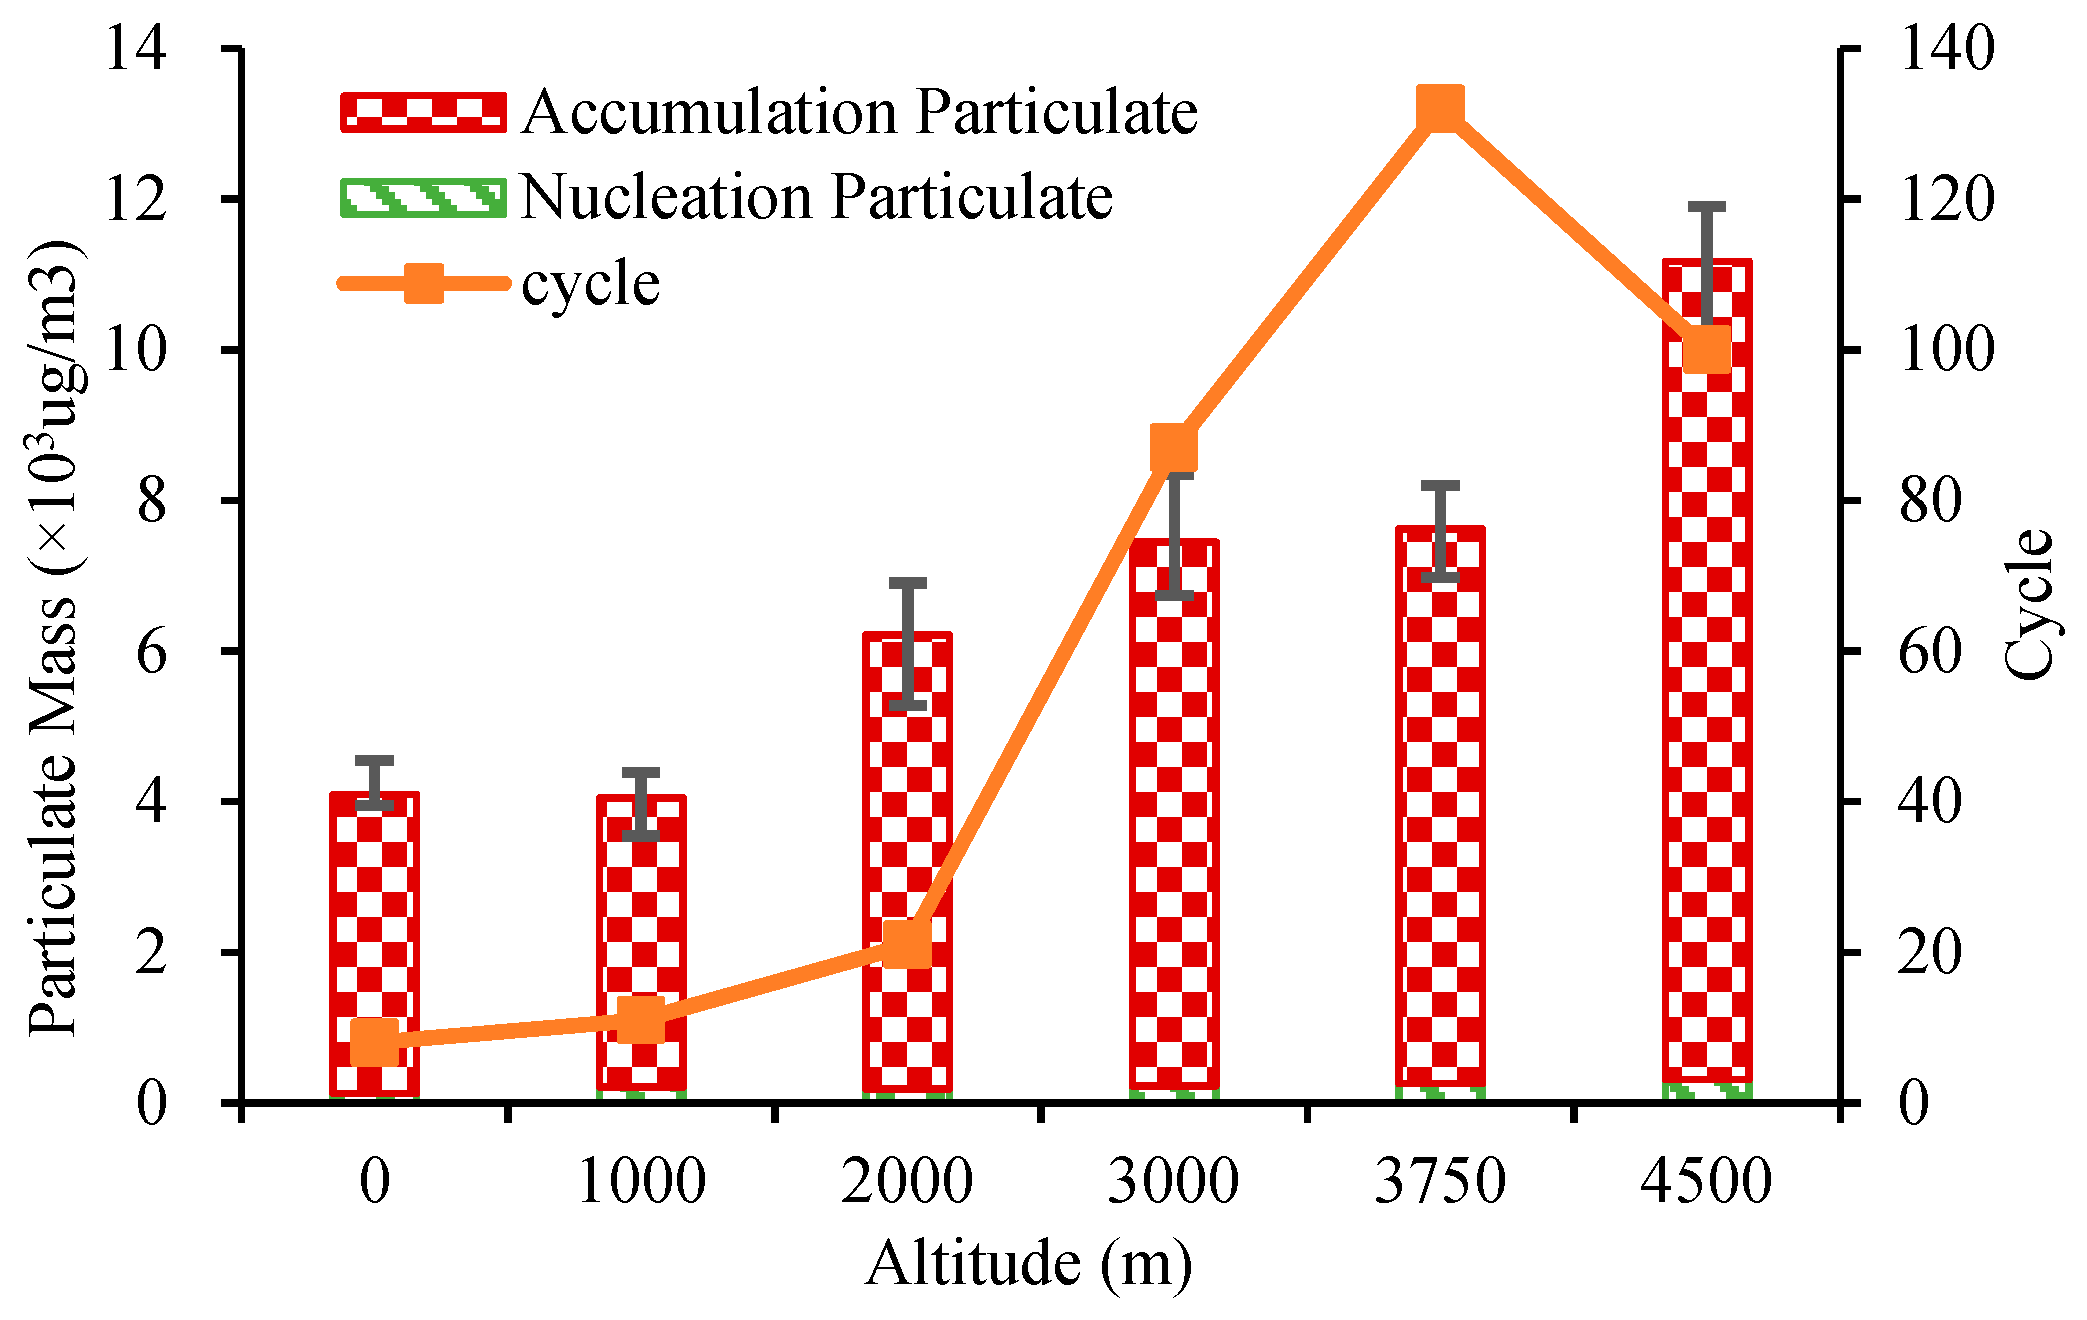
During the start-up process, as Figure 14 shows, the average PM emissions for each cycle increased significantly with the altitude. The accumulation particulate mass made up the majority of PM emissions. The nucleation and accumulation particulate showed almost the same trend as average PN emissions. As the altitude increased, less air was let into the cylinder so that the TDC temperature was lower, which made the ignition delay longer. When the ignition delay was long enough, the combustion started long after the TDC and could not burn rapidly and sufficiently. Combined with the worse spray characteristic, more particles were produced, especially accumulation particulate. The average PM emission for each cycle at 4500 m was 2.73 times higher than at 0 m during the start-up process.
4.7. VOC Emission
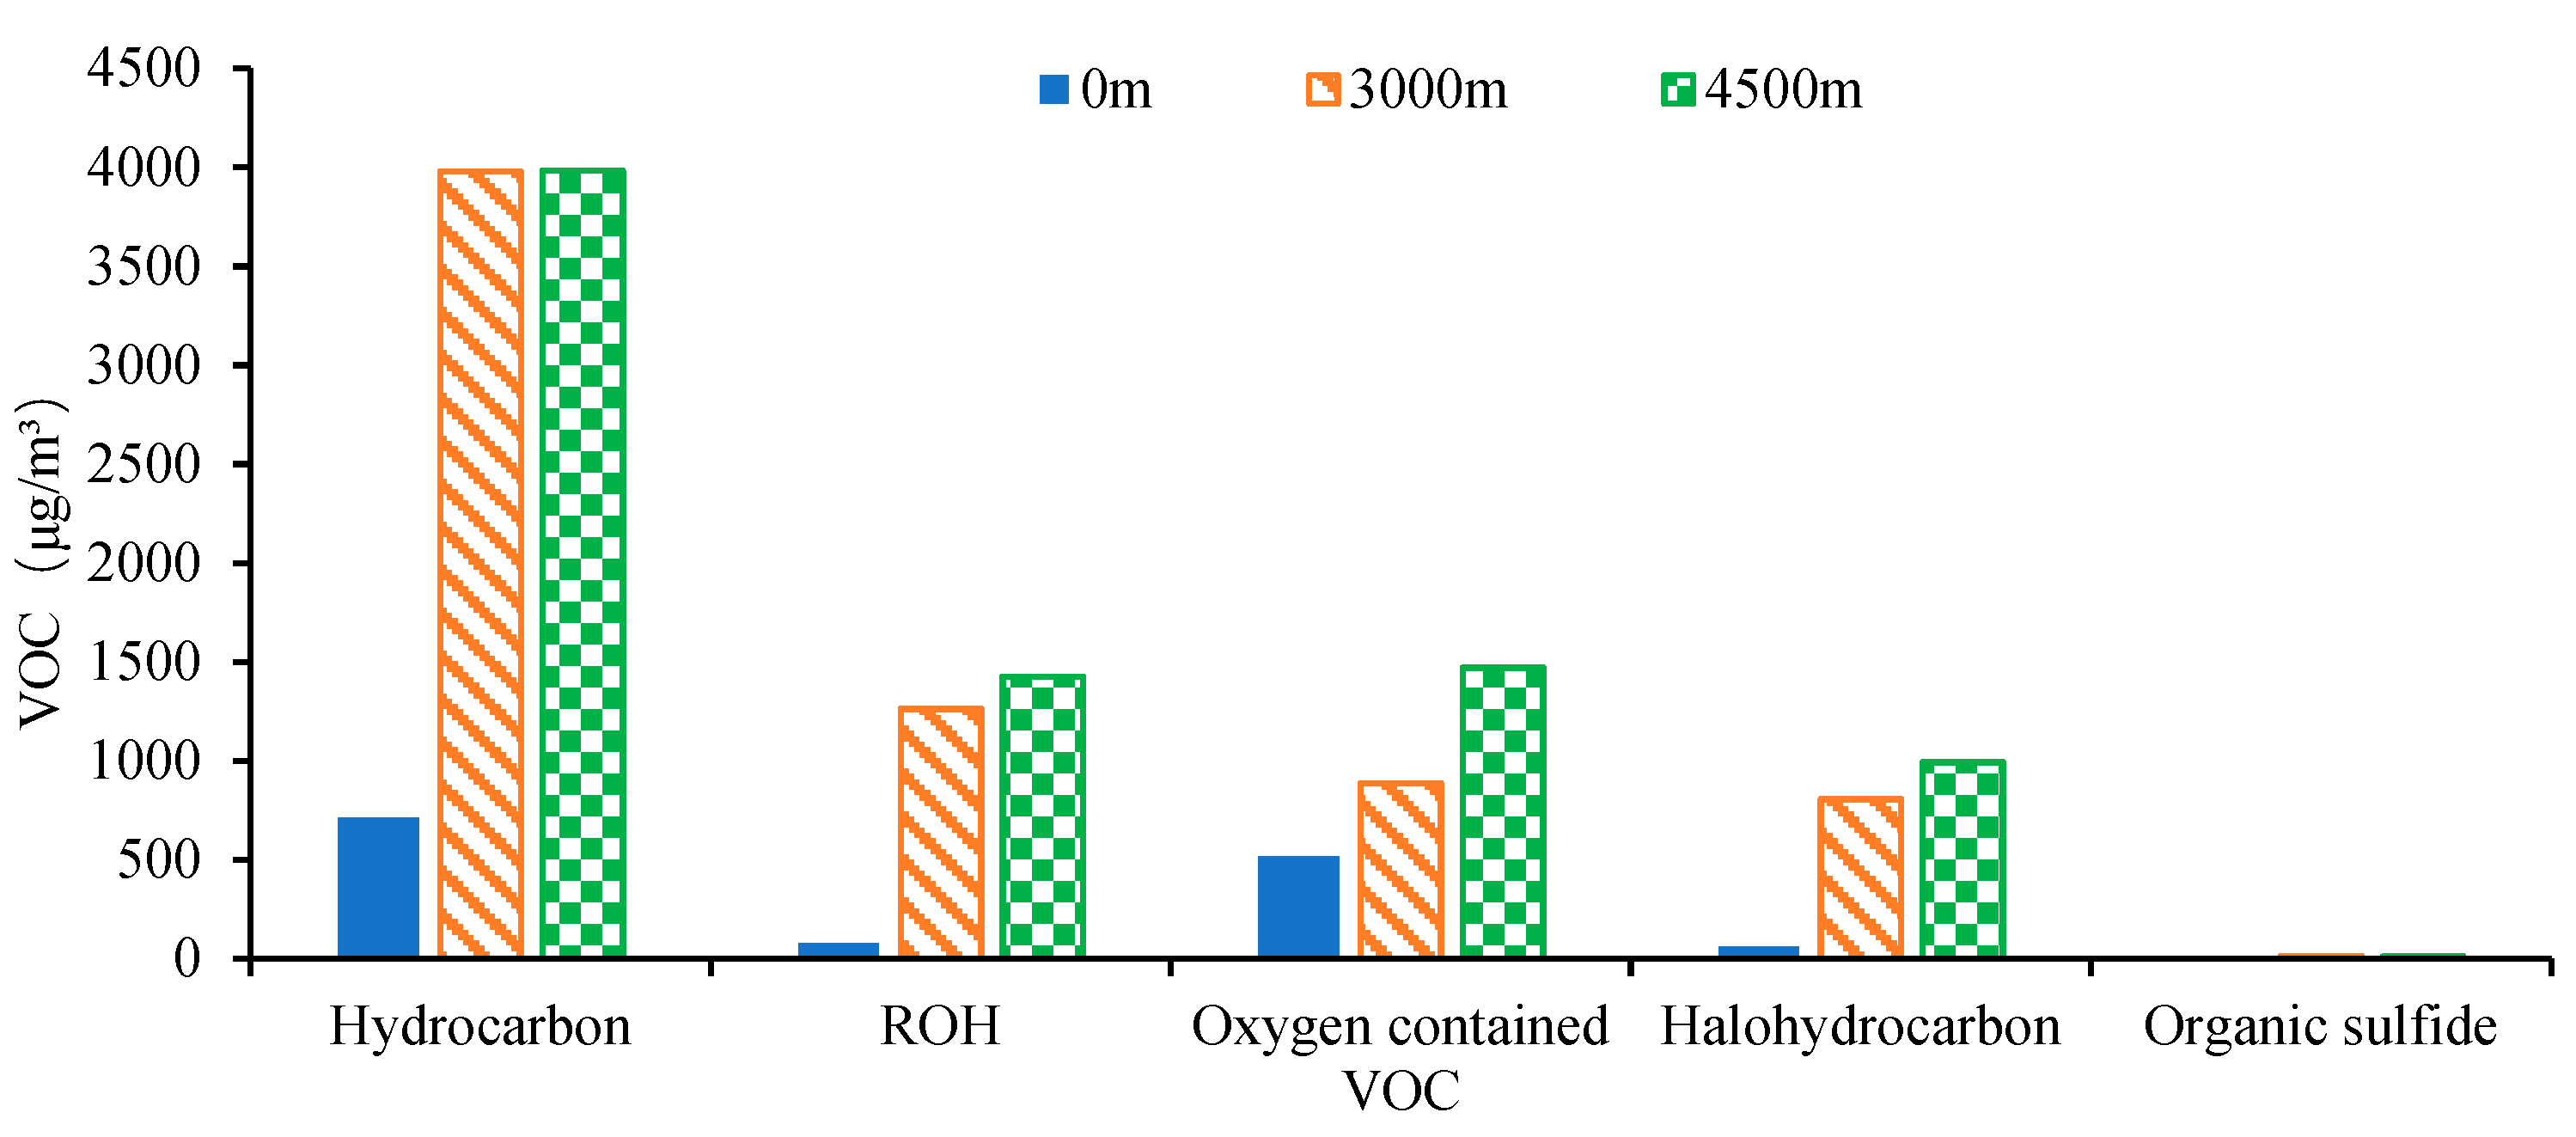
VOC (volatile organic compounds) are kinds of toxic gas which can cause cancer and other diseases. They have always been discussed in relation to indoor air quality. The combustion of diesel also produces many kinds of toxic volatile organics due to the complex components and complicated chemical reactions. In this research, 123 kinds of VOC were measured. The VOC emissions consist of hydrocarbon, ROH, oxygen contained VOC, halohydrocarbon and organic sulfide with hydrocarbon in the majority. The aromatic hydrocarbon mainly includes methylbenzene, naphthalene, styrene, benzene, ethylbenzene, paraxylene and o-xylene. The alkane has many kinds of components, with the n-pentane and iso-pentane making up the majority. Alcohol was the main component of the ROH and trichlorofluoromethane was the main component of the halohydrocarbon. The oxygen contained VOC consist of aldehyde, ketone, ether, esters and others.
Figure 15 shows VOC emissions at different altitudes during the start-up process. As the altitude increased, the hydrocarbon, ROH, oxygen contained VOC, halohydrocarbon and organic sulfide emissions all increased (Table S1). At high altitudes, the combustion became worse and diesel burned insufficient which produced and exhausted many intermediate products like the VOCs. Hydrocarbon exhaust during start-up process was nearly 2.5 times higher than other VOCs which was the main components of diesel and its combustion products. With the promotion of low-sulphur diesel, the organic sulfide emission was really low during the diesel combustion. These VOC emissions might have a more serious influence on the environment which should be of concern. This was a simple experiment on VOC emissions during the cold start of a diesel engine. The complex species and the transformation of the air might cause more serious problems. Further study is needed on the VOC emissions of internal combustion engines and their toxins.
5. Conclusions
Emission characteristics during start-up process in different altitudes was investigated by experiments conducted on a direct-injection intercooled turbocharged diesel engine with a compression ratio of 14.25 by using the plateau testing system. Emission characteristics were analyzed with transient conditions, average emission and average cycles. VOC emissions were also measured during the start-up process.
High altitudes deteriorate the spray and combustion characteristics which produce more gaseous and particle emissions through the whole start-up process. It is difficult for engines to start up at high altitudes. THC, NOX and particle emissions all increased obviously. Therefore, it is important for engineers to consider the high altitudes performance during calibration, as well as the VOCs emissions, in order to have a stable performance and tolerable emissions. Especially for the old vehicles, it will also happen when the intake air filter and exhaust aftertreatment systems are blocked. More studies focusing on the combustion, spray, chemical kinetics, emissions on the extreme environments should be undertaken in the future. Transient emissions and control strategies should also be given more attention for future RDE regulations.
Supplementary Materials
The following are available online at https://www.mdpi.com/1996-1073/12/18/3556/s1. Table S1. VOC result list.
Author Contributions
Conceptualization, D.L. and P.T.; methodology, Z.H.; validation, D.L., Z.H. and P.T.; investigation, L.F.; resources, D.L.; data curation, L.F.; writing—original draft preparation, L.F.; writing—review and editing, L.F.; supervision, D.L.; project administration, Z.H.
Funding
This research was funded by National Key R&D Program of China (Grant NO. 2017YFB0103501).
Acknowledgments
In this section you can acknowledge any support given which is not covered by the author contribution or funding sections. This may include administrative and technical support, or donations in kind (e.g., materials used for experiments).
Conflicts of Interest
The authors declare no conflict of interest.
References
- Kockelman, M.S.R.K.M. The problem of cold starts: A closer look at mobile source emissions levels. Transp. Res. Part D Transp. Environ. 2016, 43, 123–132. [Google Scholar] [Green Version]
- Williams, M.; Minjares, R. A technical summary of Euro 6/VI vehicle emission standards. Int. Counc. Clean Transp. (ICCT) 2016. Available online: https://theicct.org/publications/technical-summary-euro-6vi-vehicle-emission-standards (accessed on 10 July 2017).
- Vressner, A.; Gabrielsson, P.; Gekas, I.; Senar-Serra, E. Meeting the EURO VI NOx Emission Legislation using a EURO IV Base Engine and a SCR/ASC/DOC/DPF Configuration in the World Harmonized Transient Cycle. SAE Tech. Pap. 2010. [Google Scholar] [CrossRef]
- Pacaud, P.; Perrin, H.; Laget, O. Cold start on diesel engine: Is low compression ratio compatible with cold start requirements? SAE Int. J. Engines 2008, 1, 831–849. [Google Scholar] [CrossRef]
- Tan, P.; Zhang, X.; Hu, Z.; Lou, D. Effects of DOC+CDPF on particulate emission from a diesel engine with biodiesel fuel. China Environ. Sci. 2015, 35, 2978–2984. [Google Scholar]
- John, D.; Gajarlawar, N. Experiences in cold start optimization of a multi-purpose vehicle equipped with 2.2 L common rail diesel engine. SAE Tech. Pap. 2011. [Google Scholar] [CrossRef]
- Kumar, D.; Murugesan, L.; Nagarajan, M.; Kakde, N.; Mahesh, P. Experimental investigation of six cylinder turbocharged Di-diesel engine cold startability. SAE Tech. Pap. 2014. [Google Scholar] [CrossRef]
- La Rocca, A.; MacMillan, D.; Shayler, P.; Murphy, M.; Pegg, I. CFD investigation on the influence of in-cylinder mixture distribution from multiple pilot injections on cold idle behaviour of a light duty diesel engine. SAE Tech. Pap. 2014. [Google Scholar] [CrossRef]
- Wang, Z.; Ding, H.; Wyszynski, M.L.; Tian, J.; Xu, H. Experimental study on diesel fuel injection characteristics under cold start conditions with single and split injection strategies. Fuel Process. Technol. 2015, 131, 213–222. [Google Scholar] [CrossRef]
- Chaichan, M.T. Effect of injection timing and coolant temperatures of DI diesel engine on cold and hot engine startability and emissions. IOSR J. Mech. Civ. Eng. (IOSRJMCE) 2016, 13, 62–70. [Google Scholar]
- Phatak, R.; Nakamura, T. Cold startability of open-chamber direct-injection diesel engines—Part I: Measurement technique and effects of compression ratio. SAE Trans. 1983, 92, 1031–1040. [Google Scholar]
- Han, Z.; Henein, N.; Nitu, B.; Bryzik, W. Diesel engine cold start combustion instability and control strategy. SAE Tech. Pap. 2001. [Google Scholar] [CrossRef]
- Mathis, U.; Mohr, M.; Forss, A. Comprehensive particle characterization of modern gasoline and diesel passenger cars at low ambient temperatures. Atmos. Environ. 2005, 39, 107–117. [Google Scholar] [CrossRef]
- Weilenmann, M.; Soltic, P.; Saxer, C.; Forss, A.M.; Heeb, N. Regulated and nonregulated diesel and gasoline cold start emissions at different temperatures. Atmos. Environ. 2005, 39, 2433–2441. [Google Scholar] [CrossRef]
- Chaichan, M.T.; Maroon, O.K.; Abaas, K.I. The effect of diesel engine cold start period on the emitted emissions. Int. J. Sci. Eng. Res. 2016, 7, 749–753. [Google Scholar]
- Cârulescu, S.; Şoica, A.; Cârulescu, R. Emission level approximation at cold start for diesel vehicles. Combustion 2015, 51, 5. [Google Scholar]
- Roy, M.M.; Calder, J.; Wang, W.; Mangad, A.; Diniz, F.C.M. Cold start idle emissions from a modern Tier-4 turbo-charged diesel engine fueled with diesel-biodiesel, diesel-biodiesel-ethanol, and diesel-biodiesel-diethyl ether blends. Appl. Energy 2016, 180, 52–65. [Google Scholar] [CrossRef]
- Ramadhas, A.S.; Xu, H. Cold start particle number, size and mass emissions from a CRDI diesel engine running on biodiesel blends in a cold environment. Biofuels 2016, 7, 353–363. [Google Scholar] [CrossRef]
- Cárdenas, M.D.; Gómez, A.; Armas, O. Pollutant emissions from starting a common rail diesel engine fueled with different biodiesel fuels. J. Energy Eng. 2016, 142, E4015012. [Google Scholar] [CrossRef]
- Wang, X.; Ge, Y.; Yu, L.; Feng, X. Comparison of combustion characteristics and brake thermal efficiency of a heavy-duty diesel engine fueled with diesel and biodiesel at high altitude. Fuel 2013, 107, 852–858. [Google Scholar] [CrossRef]
- Yu, L.; Ge, Y.; Tan, J.; He, C.; Wang, X.; Liu, H.; Zhao, W.; Gou, J.; Fu, G.; Feng, X.; et al. Experimental investigation of the impact of biodiesel on the combustion and emission characteristics of a heavy duty diesel engine at various altitudes. Fuel 2014, 115, 220–226. [Google Scholar] [CrossRef]
- He, C.; Ge, Y.; Ma, C.; Tan, J.; Liu, Z.; Wang, C.; Yu, L.; Ding, Y. Emission characteristics of a heavy-duty diesel engine at simulated high altitudes. Sci. Total Environ. 2011, 409, 3138–3143. [Google Scholar] [CrossRef]
- Ambrozik, A.; Ambrozik, T.; Lagowski, P. Fuel impact on emissions of harmful components of the exhaust gas from the CI engine during cold start-up. Eksploat. Niezawodn. 2015, 17, 95–99. [Google Scholar] [CrossRef]
- Kan, Z.; Hu, Z.; Lou, D.; Tan, P.; Cao, Z.; Yang, Z. Effects of altitude on combustion and ignition characteristics of speed-up period during cold start in a diesel engine. Energy 2018, 150, 164–175. [Google Scholar] [CrossRef]
- Kan, Z.C.; Lou, D.M.; Cao, Z.Z.; Hu, Z.Y.; Liu, S.; Yang, Z.H. Effects of altitude on combustion characteristic during cold start of heavy-duty diesel engine. Int. J. Automot. Technol. 2017, 18, 209–217. [Google Scholar] [CrossRef]
- Kobayashi, A.; Kurashima, A.; Endo, S. Analysis of cold start combustion in a direct injection diesel engine. SAE Tech. Pap. 1984. [Google Scholar] [CrossRef]
- Kan, Z.C.; Hu, Z.Y.; Lou, D.M.; Cao, Z.Y.; Cao, J. Effect of the altitude on the combustion characteristics of a low-compression-ratio diesel engine during the start-up process. Proc. Inst. Mech. Eng. Part D J. Automob. Eng. 2017, 231, 1838–1847. [Google Scholar] [CrossRef]
- Wu, B. The composing mechanism of NOx in combustion. Electr. Power Environ. Prot. 2003, 19, 9–12. [Google Scholar]
- Jimenez, J.L.; Canagaratna, M.R.; Donahue, N.M.; Prevot, A.S.H.; Zhang, Q.; Kroll, J.H.; DeCarlo, P.F.; Allan, J.D.; Coe, H.; Ng, N.L.; et al. Evolution of organic aerosols in the atmosphere. Science 2009, 326, 1525–1529. [Google Scholar] [CrossRef]
Figure 1.
Plateau simulation test system.

Figure 2.
Summa canister collection system for volatile organic carbons (VOC).

Figure 3.
Definition of different start processes.

Figure 4.
The whole cold start period at different altitudes.

Figure 5.
Classification of cylinder pressure curved patterns: (a) single peak; (b) parents peak; (c) double peak; (d) afterburn; (e) misfire.
Figure 5.
Classification of cylinder pressure curved patterns: (a) single peak; (b) parents peak; (c) double peak; (d) afterburn; (e) misfire.

Figure 6.
Different combustion patterns during start-up process: (a) number of different patterns; (b) proportion of different patterns.
Figure 6.
Different combustion patterns during start-up process: (a) number of different patterns; (b) proportion of different patterns.

Figure 7.
Carbon monoxide (CO) emissions at different altitude: (a) CO emissions with engine speed up; (b) average CO emissions for each cycle during start-up.
Figure 7.
Carbon monoxide (CO) emissions at different altitude: (a) CO emissions with engine speed up; (b) average CO emissions for each cycle during start-up.

Figure 8.
Carbon dioxide (CO2) emission at different altitude: (a) CO2 emission with engine speed up; (b) average CO2 emission for each cycle during start-up.
Figure 8.
Carbon dioxide (CO2) emission at different altitude: (a) CO2 emission with engine speed up; (b) average CO2 emission for each cycle during start-up.

Figure 9.
Total hydrocarbon (THC) emissions at different altitudes: (a) THC emissions with increased engine speed; (b) average THC emissions for each cycle during start-up.
Figure 9.
Total hydrocarbon (THC) emissions at different altitudes: (a) THC emissions with increased engine speed; (b) average THC emissions for each cycle during start-up.

Figure 10.
Nitrogen oxide (NOX) emissions at different altitudes: (a) NOX emissions with engine speed up; (b) average NOX emissions for each cycle during start-up.
Figure 10.
Nitrogen oxide (NOX) emissions at different altitudes: (a) NOX emissions with engine speed up; (b) average NOX emissions for each cycle during start-up.

Figure 11.
Particulate number (PN) emissions at different altitude: (a) PN emission swith engine speed up; (b) diameter distribution of PN emissions at different altitude during the start-up.
Figure 11.
Particulate number (PN) emissions at different altitude: (a) PN emission swith engine speed up; (b) diameter distribution of PN emissions at different altitude during the start-up.

Figure 12.
Average PN emission for each cycle during start-up.

Figure 13.
Particulate matter (PM) emissions at different altitudes: (a) PM emissions with engine speed up; (b) diameter distribution of average PM emissions at different altitudes during start up.
Figure 13.
Particulate matter (PM) emissions at different altitudes: (a) PM emissions with engine speed up; (b) diameter distribution of average PM emissions at different altitudes during start up.

Figure 14.
Average PM emissions for each cycle during start-up.

Figure 15.
Volatile organic compound (VOC) emissions at different altitudes during the start-up process.
Figure 15.
Volatile organic compound (VOC) emissions at different altitudes during the start-up process.


Table 1.
Specification of the engine.
| Item | Value | Item | Value |
|---|---|---|---|
| Cylinders | 6 Symmetrical | Fuel supply system | EIL |
| Displacement | 15.9 L | Compression ratio | 14.25 |
| Bore | 150 mm | Intake system | TCI |
| Stroke | 160 mm | Valve per cylinder | 4 |
| Rod length | 300 mm | Nozzle | 10 |
| Cylinder angle | 60° | Idle speed | 800 r/min |
Table 2.
Ambient pressure at different altitudes.
| Simulation Altitude (m) | Intake/Exhaust Pressure (kPa) |
|---|---|
| 0 | 101.3 |
| 1000 | 90.1 |
| 2000 | 79.2 |
| 3000 | 70.1 |
| 3750 | 63.5 |
| 4500 | 57.6 |
© 2019 by the authors. Licensee MDPI, Basel, Switzerland. This article is an open access article distributed under the terms and conditions of the Creative Commons Attribution (CC BY) license (http://creativecommons.org/licenses/by/4.0/).
Share and Cite
MDPI and ACS Style
Fang, L.; Lou, D.; Hu, Z.; Tan, P. The Emission Characteristics of a Diesel Engine During Start-Up Process at Different Altitudes. Energies 2019, 12, 3556. https://doi.org/10.3390/en12183556
AMA Style
Fang L, Lou D, Hu Z, Tan P. The Emission Characteristics of a Diesel Engine During Start-Up Process at Different Altitudes. Energies. 2019; 12(18):3556. https://doi.org/10.3390/en12183556
Chicago/Turabian StyleFang, Liang, Diming Lou, Zhiyuan Hu, and Piqiang Tan. 2019. "The Emission Characteristics of a Diesel Engine During Start-Up Process at Different Altitudes" Energies 12, no. 18: 3556. https://doi.org/10.3390/en12183556
Note that from the first issue of 2016, this journal uses article numbers instead of page numbers. See further details here.