Numerical Simulation of a Supersonic Ejector for Vacuum Generation with Explicit and Implicit Solver in Openfoam


1
AR Vacuum, Sant Joan Despí, ES-08970 Catalunya, Spain
2
LABSON—Department of Fluid Mechanics, Universitat Politecnica de Catalunya, Terrassa, ES-08222 Catalunya, Spain
*
Author to whom correspondence should be addressed.
Energies 2019, 12(18), 3553; https://doi.org/10.3390/en12183553
Submission received: 30 July 2019
/
Revised: 6 September 2019
/
Accepted: 11 September 2019
/
Published: 17 September 2019
Abstract
:Supersonic ejectors are used extensively in all kind of applications: compression of refrigerants in cooling systems, pumping of volatile fluids or in vacuum generation. In vacuum generation, also known as zero-secondary flow, the ejector has a transient behaviour. In this paper, a numerical and experimental research of a supersonic compressible air nozzle is performed in order to investigate and to simulate its behaviour. The CFD toolbox OpenFOAM 6 was used, with two density-based solvers: explicit solver rhoCentralFoam, which implements Kurganov Central-upwind schemes, and implicit solver HiSA, which implements the AUSM+up upwind scheme. The behaviour of the transient evacuation ranges between adiabatic polytropic exponent at the beginning of the process and isothermal at the end. A model for the computation of the transient polytropic exponent is proposed. During the evacuation, two regimes are encountered in the second nozzle. In the supercritic regime, the secondary is choked and sonic flow is reached. In the subcritic regime, the secondary flow is subsonic. The final agreement is good with the two different solvers, although simulation tends to slightly overestimate flow rate for large values region.

1. Introduction
Supersonic ejectors use a primary supersonic flow, obtained from a pressure source, to generate a secondary flow that mix with the former in a a mixing chamber. Both mixed flows are then expelled to the atmosphere or used in a feedback cycle. A scheme of these flows is depicted in Figure 1. Vacuum ejectors are extensively used for a wide number of applications: compression of refrigerants in cooling systems, pumping of volatile fluids or in vacuum generation applications. Vacuum generators have, presently, many applications because of their velocity of vacuum production. Vacuum can be used also to manipulate objects. The mechanism is simple, since it only needs a pressure source, an ejector and a vacuum cup. Although high vacuum levels as large as 99% can be reached, for objects manipulation in industry vacuum ejectors can easily create what it is called a "useful vacuum", which is a vacuum level of about 80%.
In recent years, a significant number of investigations have been performed. José Sierra-Pallares [1] and García del Valle [2] did a shape optimization of a rectangular ejector for refrigeration, with R134a with Ansys, and they increased the entrainment ratio to the valueof 16%. Lambert et al. [3,4,5] analysed, by using OpenFOAM and experimental data, a new method of transport phenomena in supersonic ejectors and found that net gain the secondary flow is maximum when the back pressure is close to its critical value, and they found an explanation of the entrainment ratio limitation in supersonic ejectors as the compound-choking theory. They used the rhoCentralFoam changing the outlet pressure instead of the secondary inlet pressure. Expósito Carrillo et al. [6] optimized a single-phase ejector geometry by means of a multi-objective evolutionary algorithm and CFD model with Ansys and they obtained a potential increase of 55% and 110% in the back pressure, and also on the entrainment ratio ratio for air. They used another gas, CO, and air, as well. Petrovic et al. [7] evaluated the performance of 1-D models to predict variable area supersonic gas ejector performance, although they used different gases. Arun Kumar et al. [8] showed the physics of vacuum generation in ejectors when they are in zero-secondary flow such as bubbles on the secondary flow that obstruct the entrainment ratio of air. Zhang et al. [9] studied the effect of the friction on the ejector and they found that it can, actually, effect on the function, although their most incisive part of this are the constant-area section and the diffuser, that were considered of low incidence for the present work. Chen et al. [10] developed a theoretical model that could work overall modes although they worked with different gases. Croquer et al. [11] compared an ejector designed by thermodynamic model versus another designed by CFD. They found that they both are in a good agreement at the design conditions, about 2% difference. Jafarian et al. [12] studied, both numerically and experimentally, the transient phenomenon when the air is being evacuated. Although they worked basically on the motive flow profile they found that as the slope of the motive flow pressure profile increases, the suction increases BY 40%. Kong et al. [13] studied analytical and with CFD the performance of vacuum of a chevron ejector and they found that with this kind of nozzle helps the secondary stream into the mixing chamber. Mazzelli et al. [14] also performed a numerical and experimental analyses in order to check the effectiveness of the different turbulence models. They found that SST showed as the most suitable turbulence model in both 2D and 3D simulations.
The objective of the present work is to numerically simulate an ejector and study its transient flow regimes. It is organised as follows. The next section describes both experimental and numerical methods. Section 3 presents the main results obtained, in Section 4 these results are discussed, and finally, conclusions are drawn.
2. Materials and Methods
2.1. Experimental Method
Two types of experiment were made. In the first experiment, the secondary flow rate moved by the ejector from a vessel in steady state flow was measured, for different secondary pressure. It was performed in a testbench with a vessel. The vacuum pressure in vessel (P3 in Figure 2) was measured with open tubes manometers with mercury. In Figure 2, the experimental setup used for the present paper is depicted and, in Table 1, more details about the valves, gauges, are given.
The primary flow rate was obtained with a flange orifice, according to ISO 5167 standard [15],
where A is the orifice surface, is the rate between orifice and pipe diameters, is air density upstream, is the pressure difference measured, is the expansion factor and C is the discharge coefficient for the flange orifice. The calculations were performed with the python package fluids [16]. Secondary flow is measured with an inlet nozzle
where is the nozzle surface, is the air density at atmospheric pressure and temperature, is the pressure measured and is the discharge coefficient for the nozzle.
Two diameter flanges’ orifices and two different fluids, in open tubes manometers, were used to measure the pressure difference, . The secondary pressure in the vessel was normalised with atmospheric pressure:
The first flange, with a diameter of and water, was used to obtain from to . The second, with a diameter of , was used from to , with water. From to its maximum vacuum pressure used the small flange and alcohol () because of its precision.
The primary pressure source, P in Figure 2, was kept steady and at a value of 6 bar (relative) for all the measurements. The ball valve, in the scheme V2, controls the secondary flow rate when the system reaches a steady state.
The second experiment consisted of the transient measurement of the pressure decay in the vessel versus time. This experiment was performed with two different vessel volumes, and . For the a vacuometer sensor by AR-Vacuum [17], with an error of 200 Pa, was used.
2.2. Numerical Method
2.2.1. The Solver
The present work used the OpenFOAM [18] simulation toolbox that solves the equations for unsteady compressible flow of mass, momentum and energy:
along with the equation for perfect gases
where , is the specific heat at constant volume and is the constant for the gas.
An explicit and an implicit solver were used for the sake of comparison. The explicit solver, available in the standard distribution of OpenFOAM, rhoCentralFoam, is a transient density-based solver, which uses the Kurganov and Tadmor central-upwind schemes for face interpolation [19,20]. First-order Euler explicit time scheme was used and the semi-discrete form for the set of equations reads
where V is the cell volume and is the right side of Equation (8) after face integration. This integration is usually performed with some limiter, like a van Leer limiter in the present case. For details about computational algorithm, the reader is referred to Greenshields et al. [19]. CFL number was set in 0.5 for all the operating conditions, and the steady-state solution was stated by monitorization of flow rate in outlet.
The open source transient implicit solver is HiSA, which implements the AUSM+up upwind scheme for face fluxes [21,22]. This solver permits solving unsteady flows with a significant larger Courant numbers than the explicit solvers. Moreover, it was also reported that for high Mach numbers, implicit solvers are much more efficient and accurate that explicit solvers [20,23,24]. In the present case, however, the steady-state time scheme was used, so that the set of non-linear equations is
These equations are solved with the Generalized Minimal Residual (GMRES) Algorithm [22,25] with Lower-Upper Symmetric Gauss–Seidel (LU-SGS) preconditioning [26].
For the turbulence model we used k- SST, since it was reported to give better results for these kind of simulation by comparison with k-, k- realizable and stress- Reynolds Stress Model [14].
2.2.2. The Mesh
A 2D axisymmetric mesh was used for the sake of simplicity and performance times. The general view of the mesh is shown in Figure 3. The details of the mixing region of the supply flow and the secondary flow are shown in Figure 4.
The mesh is composed of structured blocks, generated with blockMesh, with the help of the open source Python script ofblockmeshdicthelper [27], which is useful when geometry is complex, but the meshing process has to be fast and accurate [28]. A grid convergence study was performed in order to state the goodness of the mesh. The study mesh is 2D axisymmetric with 20,300 tetrahedrical cells. A coarser mesh, with 13,000 cells, and a finer mesh, with 29,250 cells, were tested. The study was performed following the recommendations of Celik et al. [29] and, hence, the variation in cells size is about 30% and the refinement was structured. Three results were considered for the grid convergence study: primary and secondary flow rates for atmospheric inlet pressure (and, thus, maximum secondary flow rate), and minimum pressure in secondary inlet. Data are presented in Table 2.
The grid convergence analysis gives a relative error of 0.4% for the secondary flow rate and, hence, the result is . The relative error for all the numerical results for secondary flow rate will be considered the same in the rest of the work.
2.2.3. Boundary Conditions
The boundary condition in primary inlet is 6 bar (relative) of total pressure, and Neumann condition for velocity for both HiSA and rhoCentralFoam solvers. In the secondary inlet also the total pressure is prescribed in function of the operating condition, and the flow rate is given by the simulation. In the outlet the standard atmospheric pressure is set but, in order to avoid reflections, the waveTransmissive [30,31] boundary condition was used for the rhoCentralFoam solver. For the implicit HiSA solver, the characteristic far field boundary condition [32] was used in outlet. The temperature was set as the standard atmospheric total temperature of 293 K in all the boundaries.
2.2.4. Simulations Performance
The performance of both solvers were compared. All the simulations were executed in a 64 AMD Opteron cores cluster, with 64 GB of RAM memory, using 8 cores in each run, with the same domain decomposition for parallel processing. As an illustration, here we show the performance of the simulations for the case of atmospheric pressure in outlet boundary, when secondary flow rate is maximum. Simulations were considered to be converged when secondary flow rate reaches a steady value. Figure 5 shows the convergence history for both solvers. The transient explicit rhoCentralFoam converges for about of flow time and the steady-state implicit HiSA needs about 15,000 iterations. The run time for the first case (rhoCentralFoam) was about 2 h and half, and for the second case (HiSA) was about half an hour, that is, 5 times smaller.
3. Results
3.1. Experimental Data
Evacuation of air from the vessel is a process that can be considered to follow a general polytropic relationship,
where and are pressure and density reference values. Continuity equation, combined with perfect gases (7) and polytropic (15) expressions leads to
where V is the volume of the vessel. Secondary flow rate is normalised with primary mass flow rate (17), giving the entrainment ratio .
Results from the second experiment are shown in Figure 6. The pressure decay is presented versus time. It was normalised with the characteristic time:
Secondary pressure could be estimated from Equation (16) assuming a known value of k. If limit values related to isothermal () and adiabatic () processes are considered, the result is shown in Figure 7, compared with actual values of secondary mass flow rate measured in laboratory.
It is clear from Figure 7 that air evacuation exhibits an adiabatic behaviour in the first phase of the process, tending gradually to isothermal for small secondary flow rate at the end of the test. This behaviour agrees with the intuitive argument that heat transfer is less efficient for a high flow rate and, thus, process is adiabatic and, on the contrary, temperature has more time to balance for a small flow rate and the process is more likely isothermal.
The actual value of the polytropic coefficient k can be experimentally estimated from the computation of the pressure decay rate and the secondary flow rate for each value of the pressure.
Secondary mass flow rate is obtained by experimental tests for the large vessel volume. Computation of k, with Equation (19), is plotted in Figure 8, for both vessel volumes.
This computation requires, besides the time derivative of the pressure, the value of the secondary flow rate for each pressure. This value is obtained by the interpolation of the flow rate in function of the vacuum pressure. This function can be considered to be a piece wise linear composition of two segments [33] where the breakpoint is the change of regime from the supercritic, with choked secondary flow, and the subcritic. The computation of the breakpoint, and , was done with the python library pwlf [34], which uses global optimization for the location of the point, as illustrated in Figure 9.
The polytropic coefficient starts with the expected value of 1.4, but it quickly decreases, almost linearly, until it reaches the isothermal value of for . It seems to stabilise in this value up to . After that, the behaviour differs depending of the vessel’s volume. Since the measurements with the larger volume were higher and they were acquired in a more accurate way, it is assumed that from the flow rate measurements with the small volume can be discarded. Then, the value of k decreases slightly down to 0.9 dropping quickly to 0.6 at the very final stage of the process. This roughly agrees with results by [35] with air discharging from a pressurised vessel.
3.2. Numerical Simulations
The numerically simulated entrainment ratio is shown in Figure 10 for explicit (RCF) and implicit (HiSA) solvers. In addition, experimental measurements are plotted for the sake of comparison. Figure 10 shows the ejector turns to be zero-secondary flow [8] reach maximum vacuum pressure of on the experimental results. However simulation results differ in vacuum pressure and entrainment ratio at below . The maximum vacuum pressure obtained with HiSA is (see Figure 11 and Figure 12). Instead, Figure 13 shows an entrainment ratio at for RCF. This entrainment ratio, for the numerical results of HiSA, is found at .
Figure 11 and Figure 12 show contours of the Mach number for the secondary flow obtained from the simulations with the implicit solver, HiSA. Normalised vacuum pressure ranges from , corresponding to the vessel at atmospheric pressure to the minimum secondary pressure, for zero secondary flow rate, .
In the first subfigure of Figure 11, for secondary flow accelerates until at the end of the second nozzle. Downstream there is a shock wave (not shown in Figure) before air exits to atmospheric pressure.
At the pressure of , the in the entrainment ratio is not located at the end of the nozzle, like in the previous subfigure, but advanced in the nozzle. Thus, downstream there is a shock wave (not shown in Figure). In this case the shock wave is located more advanced.
At the pressure of , the is located in the middle of the secondary nozzle and at , the is located advanced the middle, close to the entrance of the nozzle. The first subfigure of Figure 12 is the last to reach and it is situated at the entrance of the second nozzle.
At the pressure of , the flow does not reach the sonic condition (). Thus, the flow is not choked. In the last subfigure, at the pressure of , there is no secondary flow rate due to the flow expansion of the primary flow.
In the experimental results, the critical point is at and the flow rate is kg/s. The critical point in the HiSA numerical results was spotted qualitatively, although it could have appeared a little higher . However HiSA numerical results for the critical point, approximately, are 22% higher the experimental ones: , and the flow rate is 2.5 times: . Finally, the maximum vacuum pressure reached on the experimental results is . The maximum vacuum pressure, on the HiSA numerical results, is 15% higher: .
4. Discussion
A good agreement was found after using two density-based solvers: explicit solver RCF, and implicit solver HiSA. It seems that both solvers for numerical simulations overestimate the flow rate in the same suction pressure for small vacuum level (large values of suction pressure in secondary level) while underestimate the flow rate in the low values region. It also tends to slightly overestimate the value of maximum suction pressure (zero flow performance), especially the explicit solver for small values of . Explicit RCF is not able to correctly resolve flow rate for small values of pressure in vessel. On the contrary, implicit solver HiSA, although gives slightly high values of for large pressure in vessel, gives a very good result for small values of pressure.
Whereas the implicit HiSA reaches as a maximum vacuum level, the explicit RCF shows secondary flow choked for a vacuum level (). Figure 13 shows the secondary flow is choked. According to the experimental results, the maximum vacuum level reached for the ejector is . Thus, RCF is not able to calculate the primary flow rate expansions after the shock wave.
Two regimens of secondary flow rate are found in the second nozzle. In the supercritic regime the secondary flow is choked and a sonic condition () is reached to different points of the nozzle, according to the pressure on the secondary inlet. However, the less pressure left at the vessel, the closer to the entrance of the nozzle is found the sonic condition. In the subcritic regime, the secondary flow is subsonic. Finally, the secondary flow gets stuck, creating a big bubble, and becoming a zero-secondary flow ejector. Figure 12 shows the secondary flow retained before the mixing chamber, due to the flow expansion of the primary flow. A breakpoint of regimes was spotted in the experimental results, and confirmed by the numerical results from the simulation. Figure 9 shows, at the vacuum pressure , the entrainment ratio has a critical regime. The presence of means the flow is choked. Figure 12 shows that, at the vacuum pressure , the regime changes to subcritical.
The air evacuation from the vessel is a transitory phenomenon and depends on the polytropic coefficient. When the evacuation starts, flow rate is maximum and heat transport is negligible. The process is practically adiabatic. For a time of the order of the characteristic time (Equation (18)) the polytropic coefficient drops until the corresponding value to a isothermal flow. This progression of the polytropic coefficient is more less lineal. From to , the flow seems to behave isothermically. Experimental measurements suggest that for the polytropic coefficient adopt a value of .
5. Conclusions
In this study, numerical simulations with an explicit and implicit density-based solver were used to investigate the transient phenomenon in a vacuum ejector. Validation of the numerical results were made with a double check of experiments in the laboratories with two vessel volumes.
The main measured parameters were flow rate and suction pressure in the vessel. The numerical simulation offered results in compliance with experiments at an acceptable level of correspondence for steady state experiments. Nevertheless, implicit solver presents better agreement with experimental results than explicit solver for low flow rate regime. The maximum vacuum level obtained in laboratory is about 19%. The implicit solver presents a value of 22% and the explicit solver tends to a much inferior value. It is obvious that for the simulation of maximum vacuum level for an ejector geometry, the implicit solver gives a better performance. For high values of entrainment ratio both solvers agree with experimental results.
At the secondary pressure of 19%, the primary flow expanses in the mixing chamber and, as a consequence of this expansion, obstructs the secondary flow and the vacuum ejector becomes a zero-secondary ejector. This secondary pressure corresponds to the ultimate vacuum capacity of the ejector.
Two different regimes of flow rate profiles were found, numerically and experimentally, on the ejector performance: the supercritic and subcritic. In the first regime the secondary flow is choked in the second nozzle of the ejector, whereas, in the second regime, there is no secondary choked flow.
Transient pressure decay was measured and a model for polytropic coefficient k transient behaviour has been proposed. It was observed that k decreases linearly from its adiabatic value to the isothermal value in the first characteristic time and it keeps its value for about another , dropping finally to about until the end of the process, for .
This work will be used in future investigations to infer transient behaviour for a numerical simulation of an ejector from the performance curve of vacuum pressure versus flow rate obtained from steady state simulations. The solver chosen, HiSA, will be used for future research.
Author Contributions
L.M., E.C. and R.C. conceived and designed the experiments; L.M. performed the experiments; L.M. and R.C. set up and performed numerical simulations; L.M. and R.C. analysed the data; S.C., P.J.G.-M. and E.C. contributed materials/analysis tools; L.M. wrote the paper.
Funding
This research received external funding from Generalitat de Catalunya.
Acknowledgments
Support of Industrial Doctorate (2018 DI 025) from Generalitat de Catalunya is acknowledged. Many thanks to laboratory technicians Jaume Bonastre, father and son, for their help. Special thanks to Oliver Oxtoby, from CSIR (South Africa) for his invaluable comments.
Conflicts of Interest
The authors declare no conflict of interest.
Abbreviations
The following abbreviations are used in this manuscript:
| A | flange orifice surface [] |
| nozzle surface [] | |
| rate between orifice and pipe diameters | |
| C | discharge coefficient |
| discharge coefficient | |
| specific heat at constant volume | |
| E | specific heat at constant volume |
| expansion factor | |
| k | polytropic coefficient |
| constant for gases [J/mol K] | |
| characteristic time | |
| air density upstream [] | |
| air density at atmospheric pressure and temperature [] | |
| density [] | |
| Mach number | |
| entrainment ratio | |
| primary flow rate [kg/s] | |
| secondary flow rate [kg/s] | |
| pressure measured [Pa] | |
| pressure difference measured [Pa] | |
| atmospheric pressure [Pa] | |
| secondary pressure in vessel [Pa] | |
| normalized secondary pressure in vessel | |
| RCF | rhoCentralFoam |
References
- Sierra-Pallares, J.; García del Valle, J.; Paniagua, J.M.; García, J.; Méndez-Bueno, C.; Castro, F. Shape optimization of a long-tapered R134a ejector mixing chamber. Energy 2018, 165, 422–438. [Google Scholar] [CrossRef]
- García del Valle, J.; Sierra-Pallares, J.; Garcia Carrascal, P.; Castro Ruiz, F. An experimental and computational study of the flow pattern in a refrigerant ejector. Validation of turbulence models and real-gas effects. Appl. Therm. Eng. 2015, 89, 795–811. [Google Scholar] [CrossRef]
- Lamberts, O.; Chatelain, P.; Bartosiewicz, Y. Numerical and experimental evidence of the Fabri-choking in a supersonic ejector. Int. J. Heat Fluid Flow 2018, 69, 194–209. [Google Scholar] [CrossRef]
- Lamberts, O.; Chatelain, P.; Bourgeois, N.; Bartosiewicz, Y. The compound-choking theory as an explanation of the entrainment limitation in supersonic ejectors. Energy 2018, 158, 524–536. [Google Scholar] [CrossRef]
- Lamberts, O.; Chatelain, P.; Bartosiewicz, Y. New methods for analyzing transport phenomena in supersonic ejectors. Int. J. Heat Fluid Flow 2017, 64, 23–40. [Google Scholar] [CrossRef]
- Expósito Carrillo, J.A.; Sánchez de La Flor, F.J.; Salmerón Lissén, J.M. Single-phase ejector geometry optimisation by means of a multi-objective evolutionary algorithm and a surrogate CFD model. Energy 2018, 164, 46–64. [Google Scholar] [CrossRef]
- Petrovic, A.; Jovanovic, M.Z.; Genic, S.; Bugaric, U.; Delibasic, B. Evaluating performances of 1-D models to predict variable area supersonic gas ejector performances. Energy 2018, 163, 270–289. [Google Scholar] [CrossRef]
- Arun Kumar, R.; Rajesh, G. Physics of vacuum generation in zero-secondary flow ejectors. Phys. Fluids 2018, 30. [Google Scholar] [CrossRef]
- Zhang, H.; Wang, L.; Jia, L.; Zhao, H.; Wang, C. Étude De L’Influence De La Friction Sur La Performance D’Un Éjecteur Supersonique. Int. J. Refrig. 2018, 85, 229–239. [Google Scholar] [CrossRef]
- Chen, W.; Shi, C.; Zhang, S.; Chen, H.; Chong, D.; Yan, J. Theoretical analysis of ejector refrigeration system performance under overall modes. Appl. Energy 2017, 185, 2074–2084. [Google Scholar] [CrossRef]
- Croquer, S.; Poncet, S.; Galanis, N. Comparison of ejector predicted performance by thermodynamic and CFD models. Int. J. Refrig. 2016, 68, 28–36. [Google Scholar] [CrossRef]
- Jafarian, A.; Azizi, M.; Forghani, P. Experimental and numerical investigation of transient phenomena in vacuum ejectors. Energy 2016, 102, 528–536. [Google Scholar] [CrossRef]
- Kong, F.S.; Jin, Y.Z.; Kim, H.D. Analytical and computational studies on the vacuum performance of a chevron ejector. Shock Waves 2016, 26, 771–788. [Google Scholar] [CrossRef]
- Mazzelli, F.; Little, A.B.; Garimella, S.; Bartosiewicz, Y. Computational and experimental analysis of supersonic air ejector: Turbulence modeling and assessment of 3D effects. Int. J. Heat Fluid Flow 2015, 56, 305–316. [Google Scholar] [CrossRef]
- ISO. Measurement of Fluid Flow by Means of Pressure Differential Devices Inserted in Circular-Cross Section Conduits Running Full—Part 2; ISO 5167-2:2003; International Organization for Standardization: Geneva, Switzerland, 2003. [Google Scholar]
- Bell, C. fluids: Fluid Dynamics Component of Chemical Engineering Design Library (ChEDL). 2016–2018. Available online: https://github.com/CalebBell/fluids (accessed on 20 June 2019).
- AR Vacuum Technology. 2007. Available online: https://www.ar-vacuum.com/vacuum-Electronic_vacuumpressure_sensors-82.html (accessed on 10 June 2019).
- OpenFOAM Foundation. OpenFOAM® Documentation. 2018. Available online: http://www.openfoam.org/docs (accessed on 20 June 2019).
- Greenshields, C.J.; Weller, H.G.; Gasparini, L.; Reese, J.M. Implementation of semi-discrete, non-staggered central schemes in a colocated, polyhedral, finite volume framework, for high-speed viscous flows. Int. J. Numer. Methods Fluids 2010, 63, 1–21. [Google Scholar] [CrossRef]
- Gao, X.; Xu, C.; Dong, Y.; Xiong, M.; Li, D.; Wang, Z.; Deng, X. Developing a parallel density-based implicit solver with mesh deformation in OpenFOAM. J. Comput. Sci. 2018, 28, 59–69. [Google Scholar] [CrossRef]
- Snedde, G.; Heyns, J.; Oxtoby, O. HISA. 2018. Available online: https://hisa.gitlab.io (accessed on 20 June 2019).
- Heyns, J.A.; Oxtoby, O.F.; Steenkamp, A. Modelling high-speed flow using a matrix-free coupled solver. In Proceedings of the 9th OpenFOAM Workshop, Zagreb, Croatia, 23–26 June 2014; pp. 1–12. [Google Scholar]
- Fürst, J. Development of a coupled matrix-free LU-SGS solver for turbulent compressible flows. Comput. Fluids 2018, 172, 332–339. [Google Scholar] [CrossRef]
- Ye, S.; Yang, W.J.; Xu, X.; Li, H.; Huang, C. The Implementation of An Implicit Coupled Density based Solver based on OpenFOAM. In Proceedings of the 2017 2nd International Conference on Communication and Information Systems—ICCIS 2017, Wuhan, China, 7–9 November 2017; ACM Press: New York, NY, USA, 2017; pp. 121–125. [Google Scholar] [CrossRef]
- Saad, Y.; Schultz, M. GMRES: A Generalized Minimal Residual Algorithm for Solving Nonsymmetric Linear Systems. SIAM J. Sci. Stat. Comput. 1986, 7, 856–869. [Google Scholar] [CrossRef] [Green Version]
- Yoon, S.; Jameson, A. Lower-upper symmetric-Gauss-Seidel method for the Euler and Navier-Stokes equations. AIAA J. 1988, 26, 1025–1026. [Google Scholar] [CrossRef]
- Takaaki, A. ofblockmeshdicthelper. 2018. Available online: https://github.com/takaakiaoki/ofblockmeshdicthelper (accessed on 20 June 2019).
- Kumar, V.; Sachdeva, G. 1-D model for finding geometry of a single phase ejector. Energy 2018, 165, 75–92. [Google Scholar] [CrossRef]
- Celik, I.; Ghia, U.; Roache, P. Procedure for Estimation and Reporting of Uncertainty Due to Discretization in CFD Applications. J. Fluids Eng. 2008, 130, 078001. [Google Scholar] [CrossRef] [Green Version]
- Poinsot, T.; Lelef, S. Boundary conditions for direct simulations of compressible viscous flows. J. Comput. Phys. 1992, 101, 104–129. [Google Scholar] [CrossRef]
- Garcia-Alcaide, V.M.; Palleja-Cabre, S.; Castilla, R.; Gamez-Montero, P.J.; Romeu, J.; Pamies, T.; Amate, J.; Milan, N. Numerical study of the aerodynamics of sound sources in a bass-reflex port. Eng. Appl. Comput. Fluid Mech. 2017, 11, 210–224. [Google Scholar] [CrossRef] [Green Version]
- Blazek, J. Computational Fluid Dynamics: Principles and Applications; Butterworth-Heinemann: Oxford, UK, 2015. [Google Scholar]
- García del Valle, J.; Saíz Jabardo, J.; Castro Ruiz, F.; San José Alonso, J. An experimental investigation of a R-134a ejector refrigeration system. Int. J. Refrig. 2014, 46, 105–113. [Google Scholar] [CrossRef]
- Jekel, C.F.; Venter, G. pwlf: A Python Library for Fitting 1D Continuous Piecewise Linear Functions. 2019. Available online: https://github.com/cjekel/piecewise_linear_fit_py (accessed on 30 June 2019).
- Thorncroft, G.; Patton, J.S.; Gordon, R. Modeling compressible air flow in a charging or discharging vessel and assessment of polytropic exponent. In Proceedings of the American Society for Engineering Education Annual Conference Proceedings, Honolulu, HI, USA, 24–27 June 2007. [Google Scholar]
Figure 1.
(a) Drawing of the vacuum ejector and its boundary names; (b) Detail with schematic representation of primary and secondary flow.
Figure 1.
(a) Drawing of the vacuum ejector and its boundary names; (b) Detail with schematic representation of primary and secondary flow.

Figure 2.
Experimental setup used in LABSON laboratories.

Figure 3.
General view of the mesh.

Figure 4.
Detail of mixing region.

Figure 5.
Performance of CFD solvers for 1 atm in outlet boundary condition. (a) Transient explicit rhoCentralFoam solver converges for about . (b) Steady-state implicit HiSA solver converges for about 15,000 iterations.
Figure 5.
Performance of CFD solvers for 1 atm in outlet boundary condition. (a) Transient explicit rhoCentralFoam solver converges for about . (b) Steady-state implicit HiSA solver converges for about 15,000 iterations.

Figure 6.
Experimental normalised pressure decay for both large and small vessel volumes.

Figure 7.
Transient evacuation from adiabatic to isothermal polytropic coefficient.

Figure 8.
Different values of k, versus time.

Figure 9.
(a) Piecewise linear composition of performance function; (b) Detail of the breakpoint.

Figure 10.
Results from both solvers versus experimental results.

Figure 11.
Secondary flow for . The flow direction is from the left (inlet) to the right (outlet).

Figure 12.
Secondary flow for .
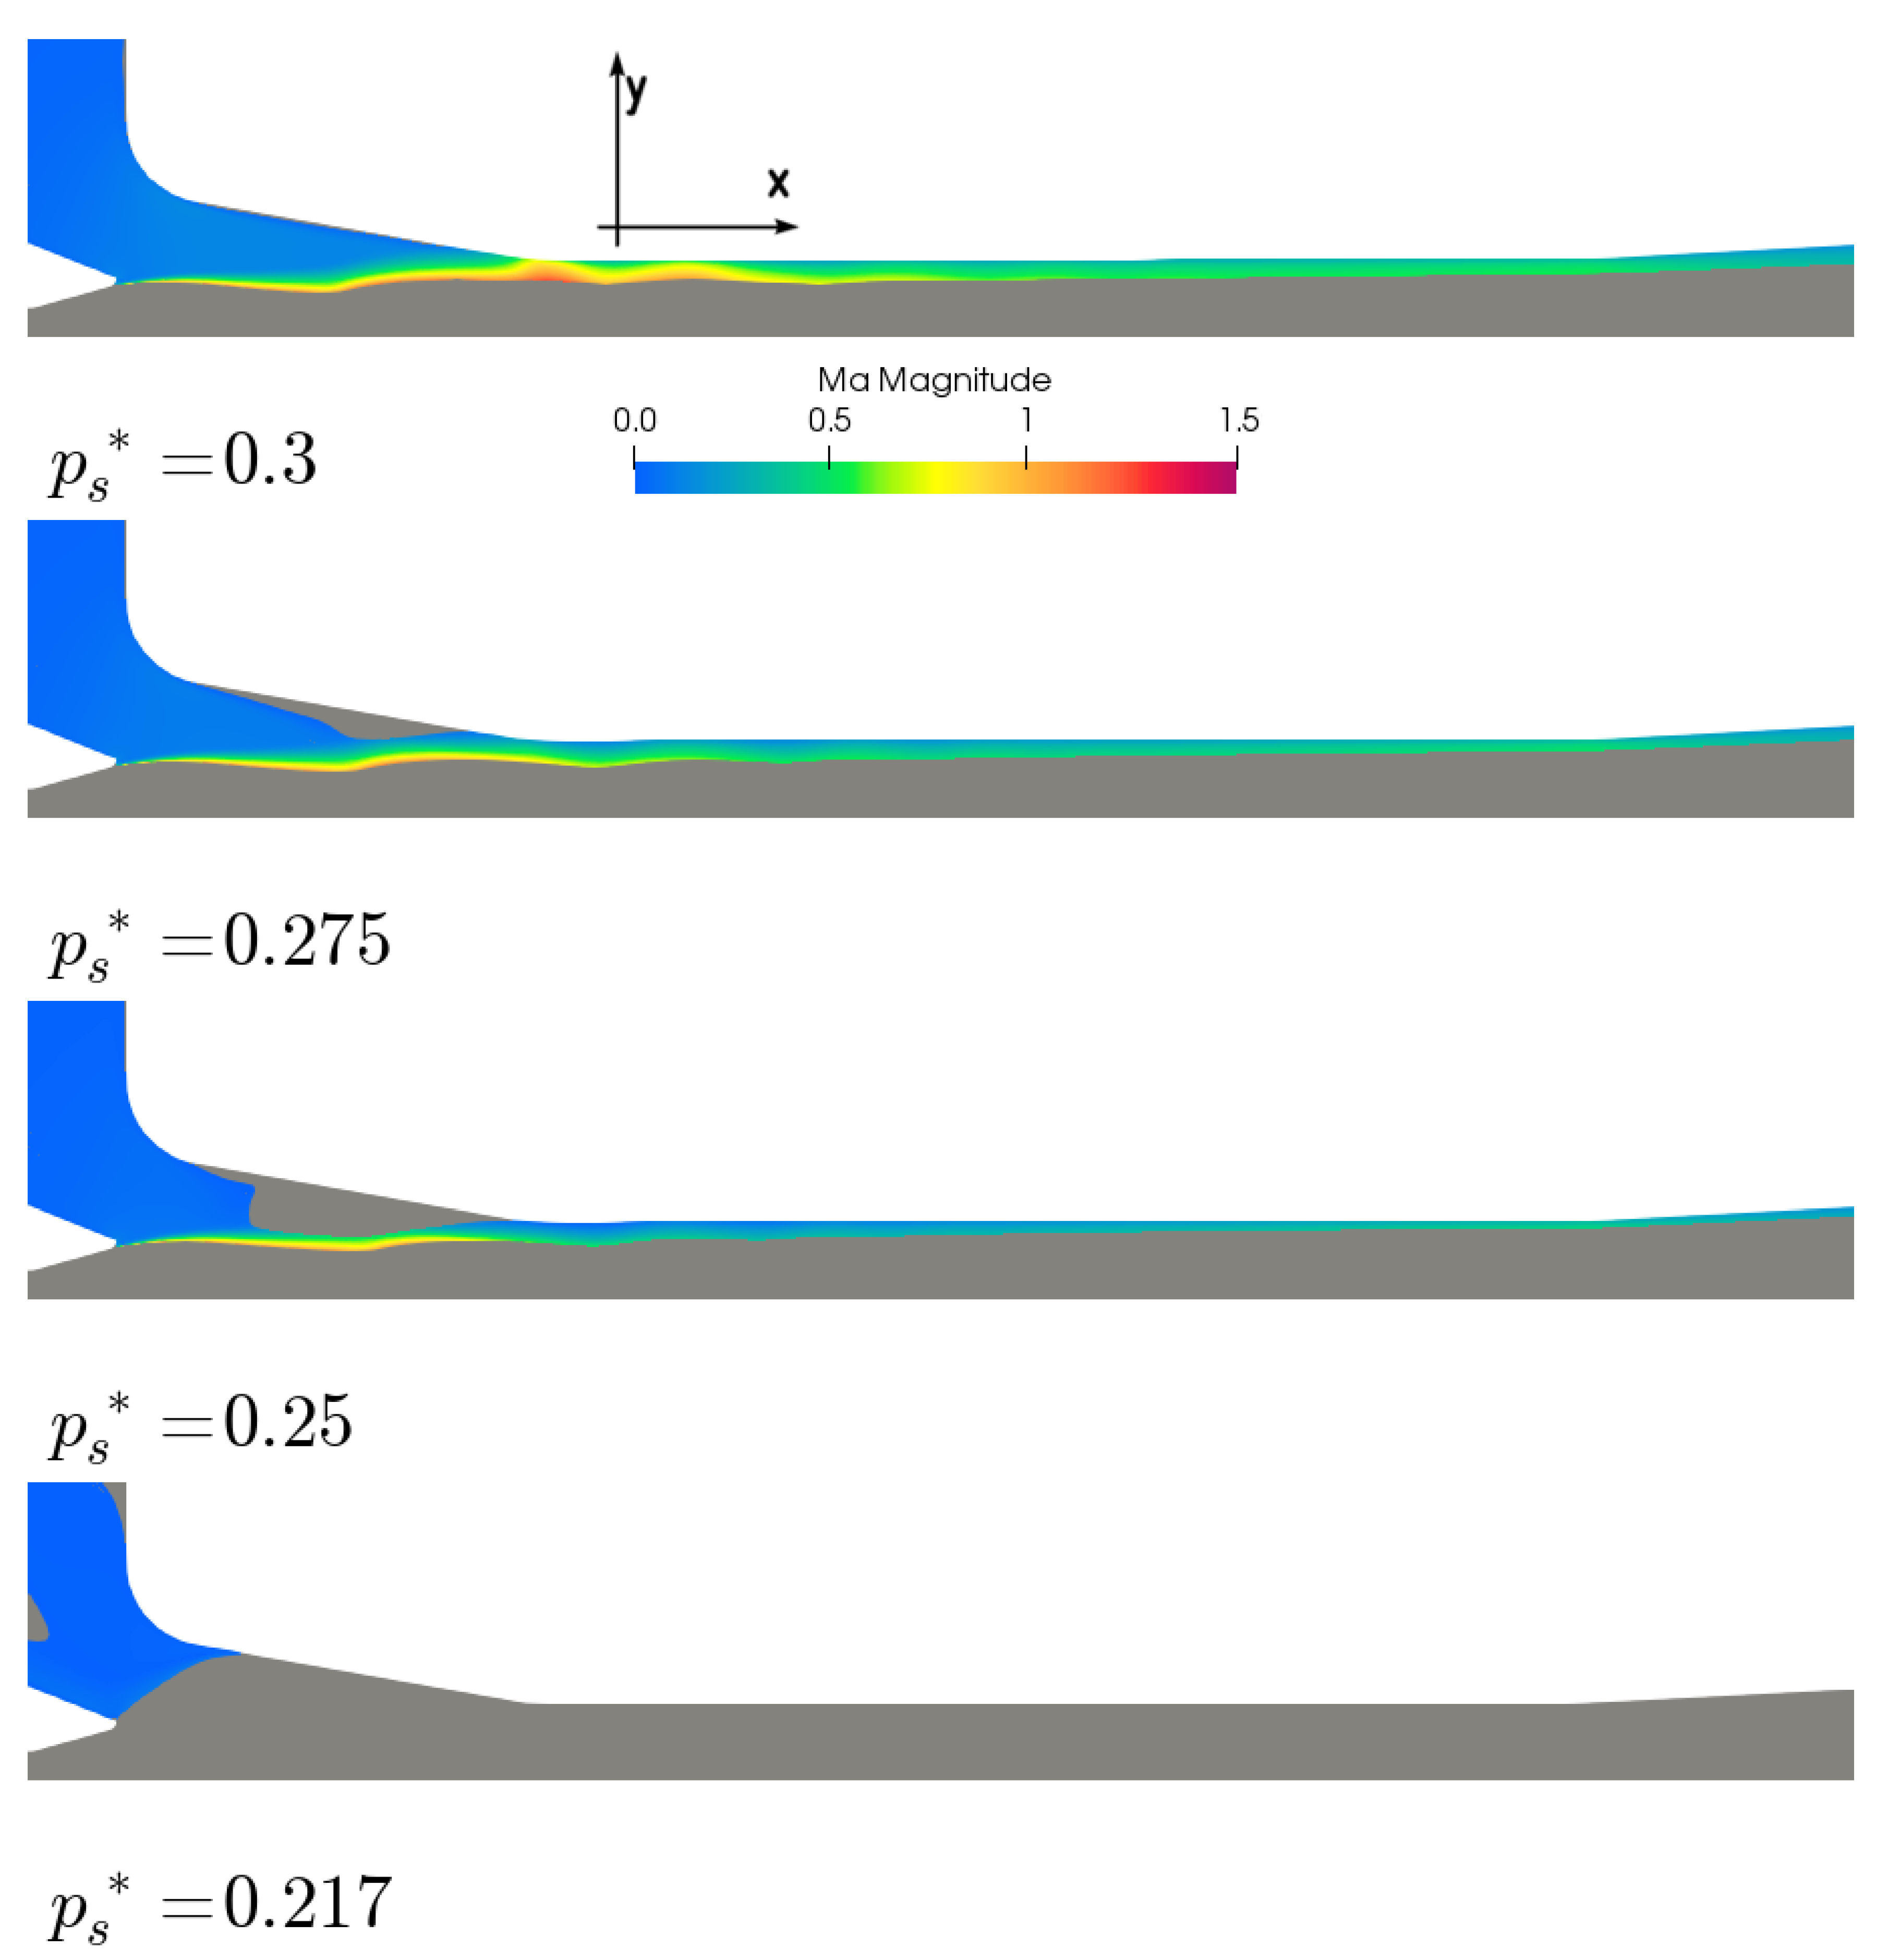
Figure 13.
Secondary flow with explicit solver rhoCentralFoam for .


Table 1.
Data for the experimental setup.
| Label | Name | Function |
|---|---|---|
| V1 | Pressure Valve | Setting for operating pressure |
| DP | Flange orifice | Pressure differential for primary flow rate |
| P1 | Gauge pressure | Inlet pressure |
| P3 | Vacuometer sensor | Pressure in the vessel |
| V2 | Vacuum valve | Setting the different vessel’s pressure |
| P2 | Gauge Pressure | Pressure for secondary flow rate |
Table 2.
Data for grid convergence study.
| Mesh | Number of Cells | [kg/s] | [kg/s] | [kPa] |
|---|---|---|---|---|
| Coarse mesh | 13,000 | 0.00945 | 0.00932 | 21.57 |
| Study mesh | 20,300 | 0.00946 | 0.00938 | 21.73 |
| Fine mesh | 29,250 | 0.00948 | 0.00936 | 21.90 |
© 2019 by the authors. Licensee MDPI, Basel, Switzerland. This article is an open access article distributed under the terms and conditions of the Creative Commons Attribution (CC BY) license (http://creativecommons.org/licenses/by/4.0/).
Share and Cite
MDPI and ACS Style
Macia, L.; Castilla, R.; Gamez-Montero, P.J.; Camacho, S.; Codina, E. Numerical Simulation of a Supersonic Ejector for Vacuum Generation with Explicit and Implicit Solver in Openfoam. Energies 2019, 12, 3553. https://doi.org/10.3390/en12183553
AMA Style
Macia L, Castilla R, Gamez-Montero PJ, Camacho S, Codina E. Numerical Simulation of a Supersonic Ejector for Vacuum Generation with Explicit and Implicit Solver in Openfoam. Energies. 2019; 12(18):3553. https://doi.org/10.3390/en12183553
Chicago/Turabian StyleMacia, Ll, R. Castilla, P. J. Gamez-Montero, S. Camacho, and E. Codina. 2019. "Numerical Simulation of a Supersonic Ejector for Vacuum Generation with Explicit and Implicit Solver in Openfoam" Energies 12, no. 18: 3553. https://doi.org/10.3390/en12183553
Note that from the first issue of 2016, this journal uses article numbers instead of page numbers. See further details here.