Constellation of Condensation and Raindrops and Its Effect on the DC Flashover Voltage of Inclined Silicone Insulation


1
Laboratory of Electrical Engineering, Department of Electrical Engineering, University A. Mira of Bejaia, Bejaia 06000, Algeria
2
Faculty of Electrical Engineering and Computer Science, University of Applied Sciences, Theodor-Koerner-Allee 16, 8800 Zittau, Germany
*
Author to whom correspondence should be addressed.
Energies 2019, 12(18), 3549; https://doi.org/10.3390/en12183549
Submission received: 7 July 2019
/
Revised: 17 July 2019
/
Accepted: 22 July 2019
/
Published: 17 September 2019
Abstract
:The purpose of this paper is to characterize the arrangement of raindrops and natural condensation and its effect on the direct current voltage’s flashover of a hydrophobic silicone insulating surface under variable inclination. Two devices have been realized, one for on-site exposure of insulation samples under rain and condensation, and the other for laboratory use in order to allow the variation of the angle of their inclination. The temporal evolution of the constellation of raindrops and natural condensation as well as the electrical discharge produced in the laboratory was visualized. The results emanated from the on-site investigation allowed the identification of the most reproducible type of arrangement of rainwater and natural condensation drops as well as the estimation of their respective volume. The results from the laboratory clearly show the existence of an interval of the insulation’s inclination angle, which allows the best approximation of its electrical performance to what was obtained in the absence of these drops. Moreover, these same results also inform us about some very critical situations to avoid regarding the insulation by a judicious choice of its inclination angle.
1. Introduction
From an electrical point of view, the insulators for electrical power transmission lines are used to prevent any leakage of electrical current from the phase to the ground. Although they represent only about 6% of the total cost of the line, they play a very prominent role for the quality of the transport of the electrical energy. The reliability of the service will be much higher as the choice and the dimensioning of these insulators will be based on a reliable design and take into account external environmental constraints and, particularly, those of pollution [1,2]. The latter usually results in a deposit covering its surface. Under the effect of dew, fog, or rain, the humidification of this deposit can cause a current leakage toward the ground and, in some cases, the flashover of the insulator [1,2]. This can result in the destruction of highly sensitive equipment connected to the power grid.
The flashover voltage of an insulator is related to its geometrical parameters (length, profile, position, number of insulators and their connection, location, and type of insulator) and electrical parameters (longitudinal dielectric strength and surface electrical resistance). The degree of their individual or simultaneous effect on their electrical performance has been the subject of several research studies in order to end up in an insulator profile with the best electrical performance [3,4,5,6,7,8,9,10,11].
Static and dynamic models of flashover of hydrophilic or hydrophobic insulators have been proposed by several researchers to understand the phenomenon of insulator’s flashover and its design [12,13]. Their improvement still requires the introduction in these models of other parameters for its better characterization. During the last five decades, a very high taxation of silicone insulation compared to ceramics has been observed in power transmission lines [14,15]. This is justified by the multiple advantages favoring these polymers (lightness, very good hydrophobicity, and its transfer to pollution, as well as very high resistance to pollution and vandalism).
On the other hand, the most cited disadvantage of such isolations is the loss of hydrophobicity of their surface and their long-term alteration following the recurrence and the duration of the phenomenon of condensation or natural rain [16,17]. This is due to partial electrical discharges and flashover caused by drops of rainwater or dew deposited on their surface under service voltage. In these investigations, the electrical conductivity of the spray solution or the intensity and the speed of rain falling on the insulators’ surface were of interest to most researchers. On the other hand, the geometrical parameters of the fog or rain drops coming into contact with the insulator’s surface had attracted very little attention of the researchers [18]. Among these geometric factors that influence the performance of a polymer insulator, we can mention the number of water drops, their size, their angle of fall, their impact speed on the surface, their rebound or bounce, their burst, the distance between the drops, their arrangement along the perimeter, and the leakage path of the insulator. Individually or combined, the effect of these parameters is reflected in the degree of wetting of the insulator’s leakage path and the resulting number of partial electrical discharges, hence, the degree of degradation of the insulation surface and its electrical performance.
Other sizes concerning the profile of the insulator, such as, the angle of inclination with respect to the horizontal line of an insulator’s sheds may exert an influence, depending on the value of the inclination’s angle of the insulation [11,19,20], on the constellation and the volume of raindrops covering its surface. Regarding the stagnation effect of the amount of rainwater on the periphery of the slightly inclined sheds of some insulators, on the elevation of the damp leakage path of the insulator, and, consequently, the decrease of its power of electrical isolation, very few published works focused on this area [11,19,20]. These multiple reasons justify our interest focused, initially, on the characterization of the constellation and volume of water drops formed on the surface of silicone insulators during condensation and natural rainfall phenomena.
In the second step, the constellation of water drops obtained on site is reproduced in the laboratory on silicone insulation with quantification of its flashover voltage, according to its angle of inclination, the volume of the water drops, and the degree of water accumulation on the surface of the insulation neighboring the grounded electrode.
2. On-Site and Laboratory Experimental Devices and Measurement Techniques
Condensation or dew is a type of water precipitation resulting from the liquefaction of water vapor of the air. It appears as water droplets. It is usually deposited in the evening and sometimes in the morning on all bodies exposed to the open air, when their temperature drops to the dew point of the ambient air. This causes condensation of the water vapor contained in the air layer.
Rain is a natural phenomenon by which water drops fall from clouds or fog, from the sky to the ground. There are several forms of rain (mild to violent, dense to spaced, fine to heavy, cold, mixed with snow, or sometimes hailstone to partially frozen, lukewarm to warm, coarse to fine, sometimes completely evaporated before touching the ground).
In order to characterize the constellation and volume of water drops formed during natural or artificial condensation or natural rainfall, we used 10 samples of silicone insulators with a single shed (Figure 1). The characteristics of this are given in Figure 1a. These samples were cut from a silicone insulator with 16 alternating sheds. This insulator was offered by the Algerian National Electricity and Gas Company (SONELGAZ) to the laboratory of Electrical Engineering of the University of Bejaia (LGEB) for research. In order to take account of the north-south direction of the wind, two sectors of 1 cm2 of surface have been delimited on the top surface of these 10 sheds and arranged in such a way that the sector S1 is oriented geographically toward the north and sector S2 to the south (Figure 1b).
Figure 1c shows the support on which the 10 samples distributed in two rows are suspended vertically. Each one of the samples contains five isolators. These samples have been carefully washed and cleaned with isopropanol and then placed in a desiccator used to remove the moisture absorbed by the silicone samples during their exposure to condensation and rain and to protect them from further absorption before a new exposure.
The tests carried out with these 10 samples relate to three distinct periods of condensation and natural rain and a single period of artificial condensation. The reproduction of the latter is obtained by using refrigeration. These samples are deposited in a refrigerator dedicated to this experiment for a well-chosen period. During this period, the temperature and humidity were maintained, respectively, at 10 °C and 100% within it. Generally, after one hour of exposure, the samples are removed from the refrigerator and then placed in an enclosure heated to 35 °C. During each of the sample exposure periods, the constellation of water drops formed on their surface during the condensation or natural rain phenomenon was filmed using a camera and recorded on a personal computer. In addition, the amount of water accumulated over time by cm2 of surface on the northern and southern sectors was taken. Lastly, the evolution of these two quantities, according to environmental conditions, has been taken into consideration.
The laboratory determination of the flashover’s direct voltage of a silicone insulation with a variable inclination angle and covered with water drops in a similar arrangement to that found on site requires silicone samples and a device allowing the variation of the inclination angle.
The samples used are in the form of silicone plates of dimensions 140 mm × 120 mm × 6 mm. All samples of this material were emanated from the high voltage laboratory of the University of Zittau/Goerlitz (Germany). They were manufactured and supplied by the German company Wacker Chemie. According to this supplier, this product is based on rubber on high vulcanization temperature (HTVSR). This two-component elastomer is mixed with aluminiumtrihydroxide at a rate of 4% to 5%. The static contact angle of a water drop, of 50 µL volume, lying on its surface was measured by this company. Its value is about 104°.
The values of some dielectric properties of this polymer are summarized in Table 1. εr and tanδ were measured using an alternative current Schering bridge under AC voltage (50 Hz). On the other hand, ρv and Rs were determined using a measuring cell with three flat and circular electrodes connected in series with a direct current microammeter under DC voltage.
The high voltage and ground electrodes are made of steel. Their shape is cylindrical and their ends are semi-spherical (Figure 2). The length of the electrodes used for the variation of the number of rows’ water droplet is 100 mm, whereas the length of the electrodes used for the variation of the insulation’s inclination angle is 50 mm. Their diameter φe is 20 mm and the radius of each half-sphere is equal to 10 mm. The total leakage path of the insulation between the Lc electrodes is fixed at 60 mm throughout the various tests carried out (Figure 2).
In order to reproduce volumes of water drops similar to those formed during the phenomenon of condensation and natural rain [21], the values of the volume Vd of water drops chosen in this study are equal to 20, 30, 45, 60, and 90 µL. Their precise measurement is carried out using a syringe graduated in tens of microliters.
The arrangement of water drops on the surface of the insulation is almost similar to that found during the characterization of the constellation of water drops formed during condensation and natural rain. This arrangement is illustrated in Figure 2. The water drops are arranged in a zigzag along the leakage path Lc of the insulation where the value is equal to 60 mm. The number of water drops deposited on a row is about 6. The row of water drops, drawn in Figure 2a, is described by the three geometrical parameters Ldh, Ldd (LDD), and Ldt. The constellation of water drops given in Figure 2a is characterized by the four parameters Ldh, Ldd (LDD), Ldt, and lrr. These four quantities are kept constant throughout the tests conducted in this study. Their values are, respectively, of the order: Ldh = Ldt = Ldd = 8.6 mm (LDD = 10 mm) and lrr = 10 mm.
The variation compared to the horizontal inclination angle α of the insulation between 0° and 90° is obtained by means of a device shown in Figure 3. A movable upper wall support is made of wood. It has the shape of a parallelepiped of dimensions: 500 mm × 500 mm × 400 mm. Its upper face is connected to a ball, which allows it to take the horizontal position corresponding to an angle of inclination α = 0° (Figure 3a), the oblique position (0° < α < 90°, Figure 3b), and, lastly, the vertical position corresponding to an angle of inclination α = 90° (Figure 3c). The fixing of an arbitrary angle of inclination was carried out using two glazed wooden rods. These pass through appropriate holes and are made especially on the two opposite vertical faces of the support to block it at a position corresponding to the chosen angle (Figure 3b).
The insulation as well as the two high voltage and grounded electrodes are fixed with two PVC rails on the mobile upper wall of the device in order to prevent them from falling during their inclination (Figure 3). The wooden support is painted with several coats of varnish to prevent it from absorbing the water drops that leave the surface of the inclined insulation and land on its lower wall at the end of each a flashover test of the material. In order to reproduce a constellation of water drops similar to that obtained on site, the centers of the water drops covering each tested sample are identified using an insulating black shade (Figure 2a).
In order to take into account the effect of the retention of some quantity of water on a partial area of the insulation and on its flashover voltage, the grounded electrode is provided with holes along it. Their presence allows the quantity of water, falling under the action of electrical forces, friction, and gravitation, to leave the inter-electrode surface by exiting through these holes (Figure 2b). However, when the grounded electrode is full, a certain amount of water is retained by it (Figure 2c).
The direct current test voltage of the insulation is provided by the measuring station shown in Figure 4, which mainly comprises a step-up transformer delivering a secondary voltage of 135 kV and a current of 80 mA. Its output is connected by diode D either in direct connection (1) or indirectly (2) to the weakening resistance of current Ra (106 kΩ), in derivation with the smoothing condenser CL (10 nF). In these cases, the connections of the silicone insulation (Is) and the peak voltmeter (VDC) are made, respectively, at the boundaries of the resistive voltage divider (R1/R2) and at the extremities of the measuring resistor R2. The variable rate of rise of the test voltage ramp, used in this study, was set at its maximum value of 4 kV/s. Its choice was made to avoid partial evaporation of water drops during the rise of the applied test voltage.
The number of samples used for each polarity of DC is taken to equal to 20. At the end of the tests of each series of 20 samples of the insulation, the latter are cleared of residual drops of water and cleaned with isopropanol. Then they are deposited in a desiccator in order to gain back, before the next test series, their hydrophobicity that is partially lost during their flashover by electric discharges [16,17]. The pause time interval between two successive tests on the same test sample is equal to 10 hours [19].
For each influence parameter investigated in this paper, a series of 20 tests were performed. The retained value of the insulation flashover voltage is the arithmetic average of all those obtained on the same series of measurements. Due to the good repeatability of the measurement techniques used in this study, the maximum relative error found does not exceed 5% of this average value.
The device for visualizing the electric discharge evolving above the water drops covering the surface of the considered silicone insulation is illustrated by Figure 4. This one includes a camera (Cam) at 1000 photos for the recording of the different phases of development of this electric discharge on the surface of the material, according to the angle of its inclination and a PC for the image processing using Video studio software 11.
The value of the electrical conductivity of the polluting solution used in this study is equal to 200 µS/cm. This was obtained by adding salt to a distilled water solution. It was measured using a mobile probe conductivity meter.
3. Results and Discussion
3.1. Constellation and Volume of Condensation and Rain Drops
Figure 5 illustrate the amount of condensation water collected per cm2 on the insulation surface, when the insulation is switched off. As a result, the collected volume of water as a function of the exposure time of the silicone samples increases initially, and then tends toward a constant limit value regardless of the period and nature of the condensation. After one hour of exposure, the amount of water collected per cm2 of the insulation surface is between 7 and 9 µL and, at saturation between 24 and 25 µL, for both types of condensation. The only difference is in the time required to reach this limit value under natural condensation, which is 3.5 times longer than under artificial condensation. Figure 5 also gives the temporal evolution of the amount of condensation water formed per cm2 as a function of the orientation of the chosen sector on the insulation. The curves characterizing this magnitude are almost identical for the north and south sectors regardless of the type of condensation considered. The difference lies in the rate of formation of water drops that form on the insulation, which value under artificial condensation is 3.5 times greater than that obtained under natural condensation. This can be explained by the variation in humidity, temperature, and wind conditions at the measurement site during the sample exposure periods.
Under artificial condensation, the values of these parameters remain constant inside the refrigeration chamber and are estimated at 100% for the moisture content, 8 °C for temperature, and 0 km/h for wind speed, respectively. However, under natural condensation, while the moisture rises from 80% to 98% at saturation, the temperature rises from 11° to 7°. At saturation, the values of these two quantities are practically very close to those displayed inside the artificial condensation chamber. As for wind speed, its value oscillates at a saturation between 3 and 5 km/h, depending on the period of exposure of the samples. Its influence on the development of water drops formed on the surface of the insulation generally manifests itself by a braking of their formation or their ejection from the place of their birth.
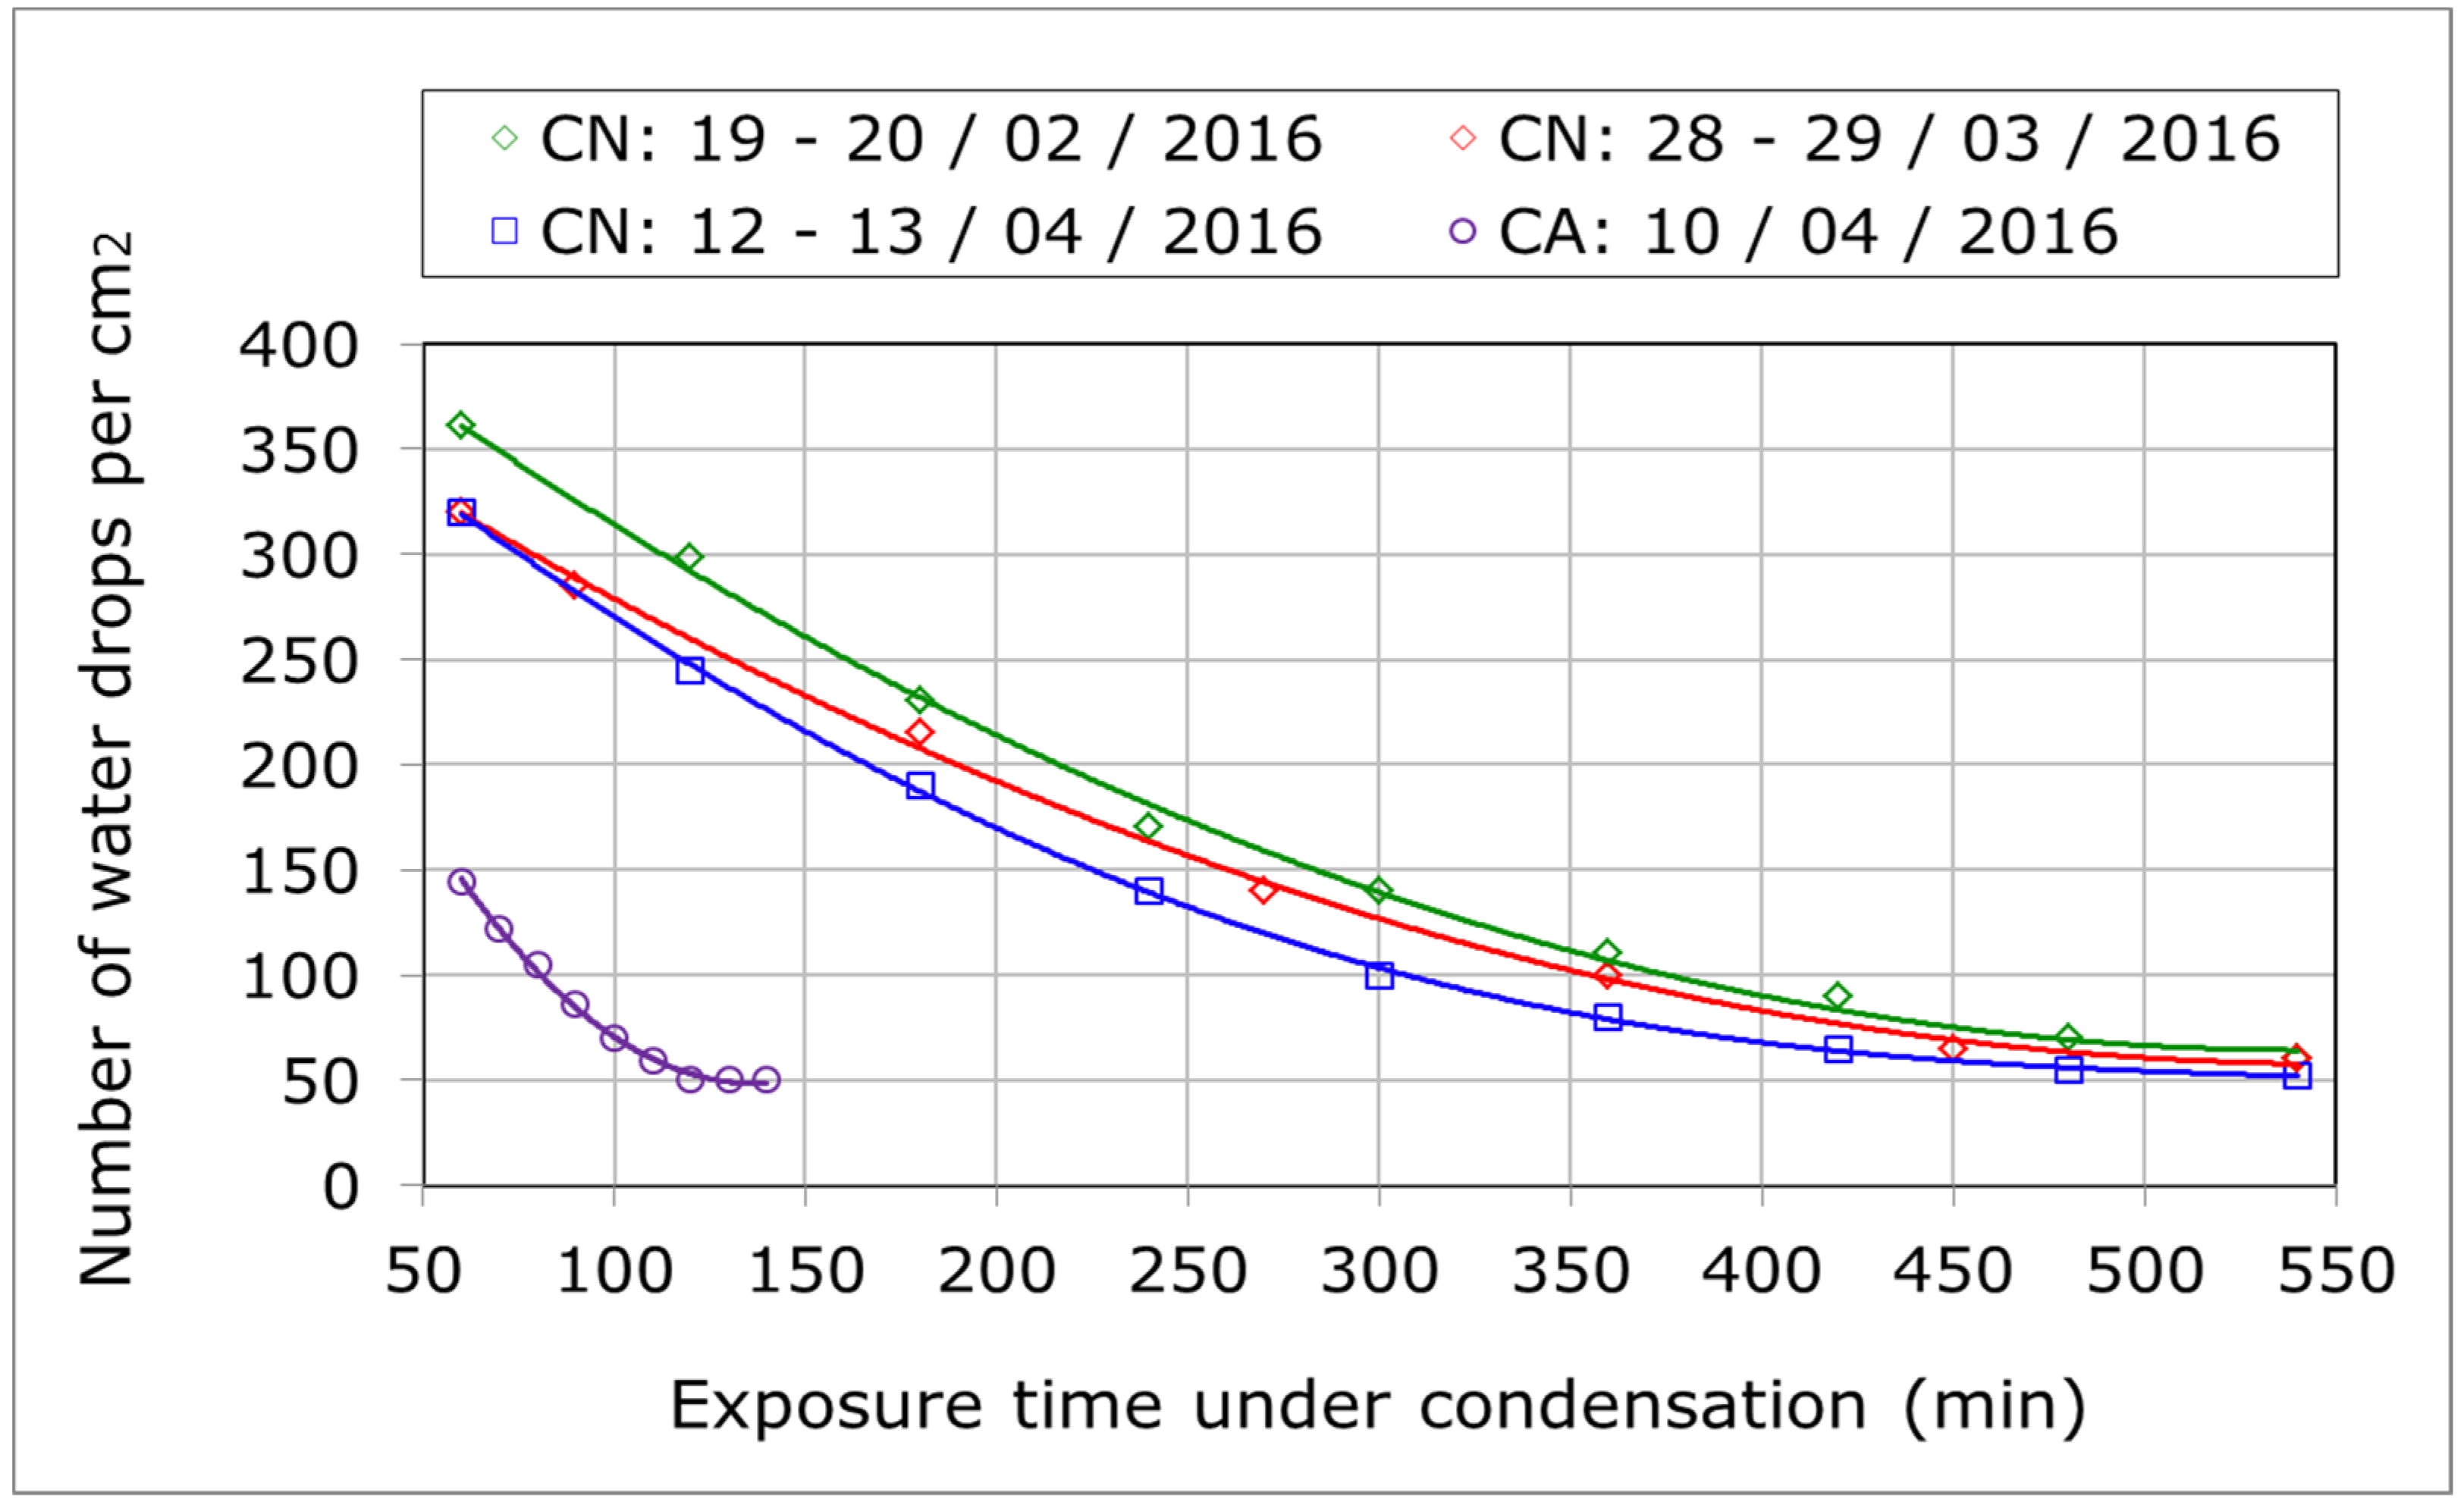
Figure 6 and Figure 7 show the evolution of the number of water drops formed on a surface of 1 cm2 of an insulation sector, according to the exposure time of samples under condensation. Figure 6 shows a temporal decline in the number of water drops regardless of the nature of the considered condensation, but they tend to stabilize at a limit value, which is of the order of 50 water drops for artificial condensation and 50 to 60 for natural condensation (Figure 7). The important difference between the two phenomena lies in the ratio of the number of water drops recorded at the start of natural and artificial condensation. Its value is about 2.5. This difference can be the result of the combined effect of the enormous volume of humidified air surrounding the samples on site and the weakening of 20% to 25% of the moisture’s level prevailing on this one compared to that prevailing inside the refrigeration enclosure, given practically the same amount of water recorded per cm2 of surface area for both types of condensation, the number of water drops, and their volume must be different at start-up and saturation.
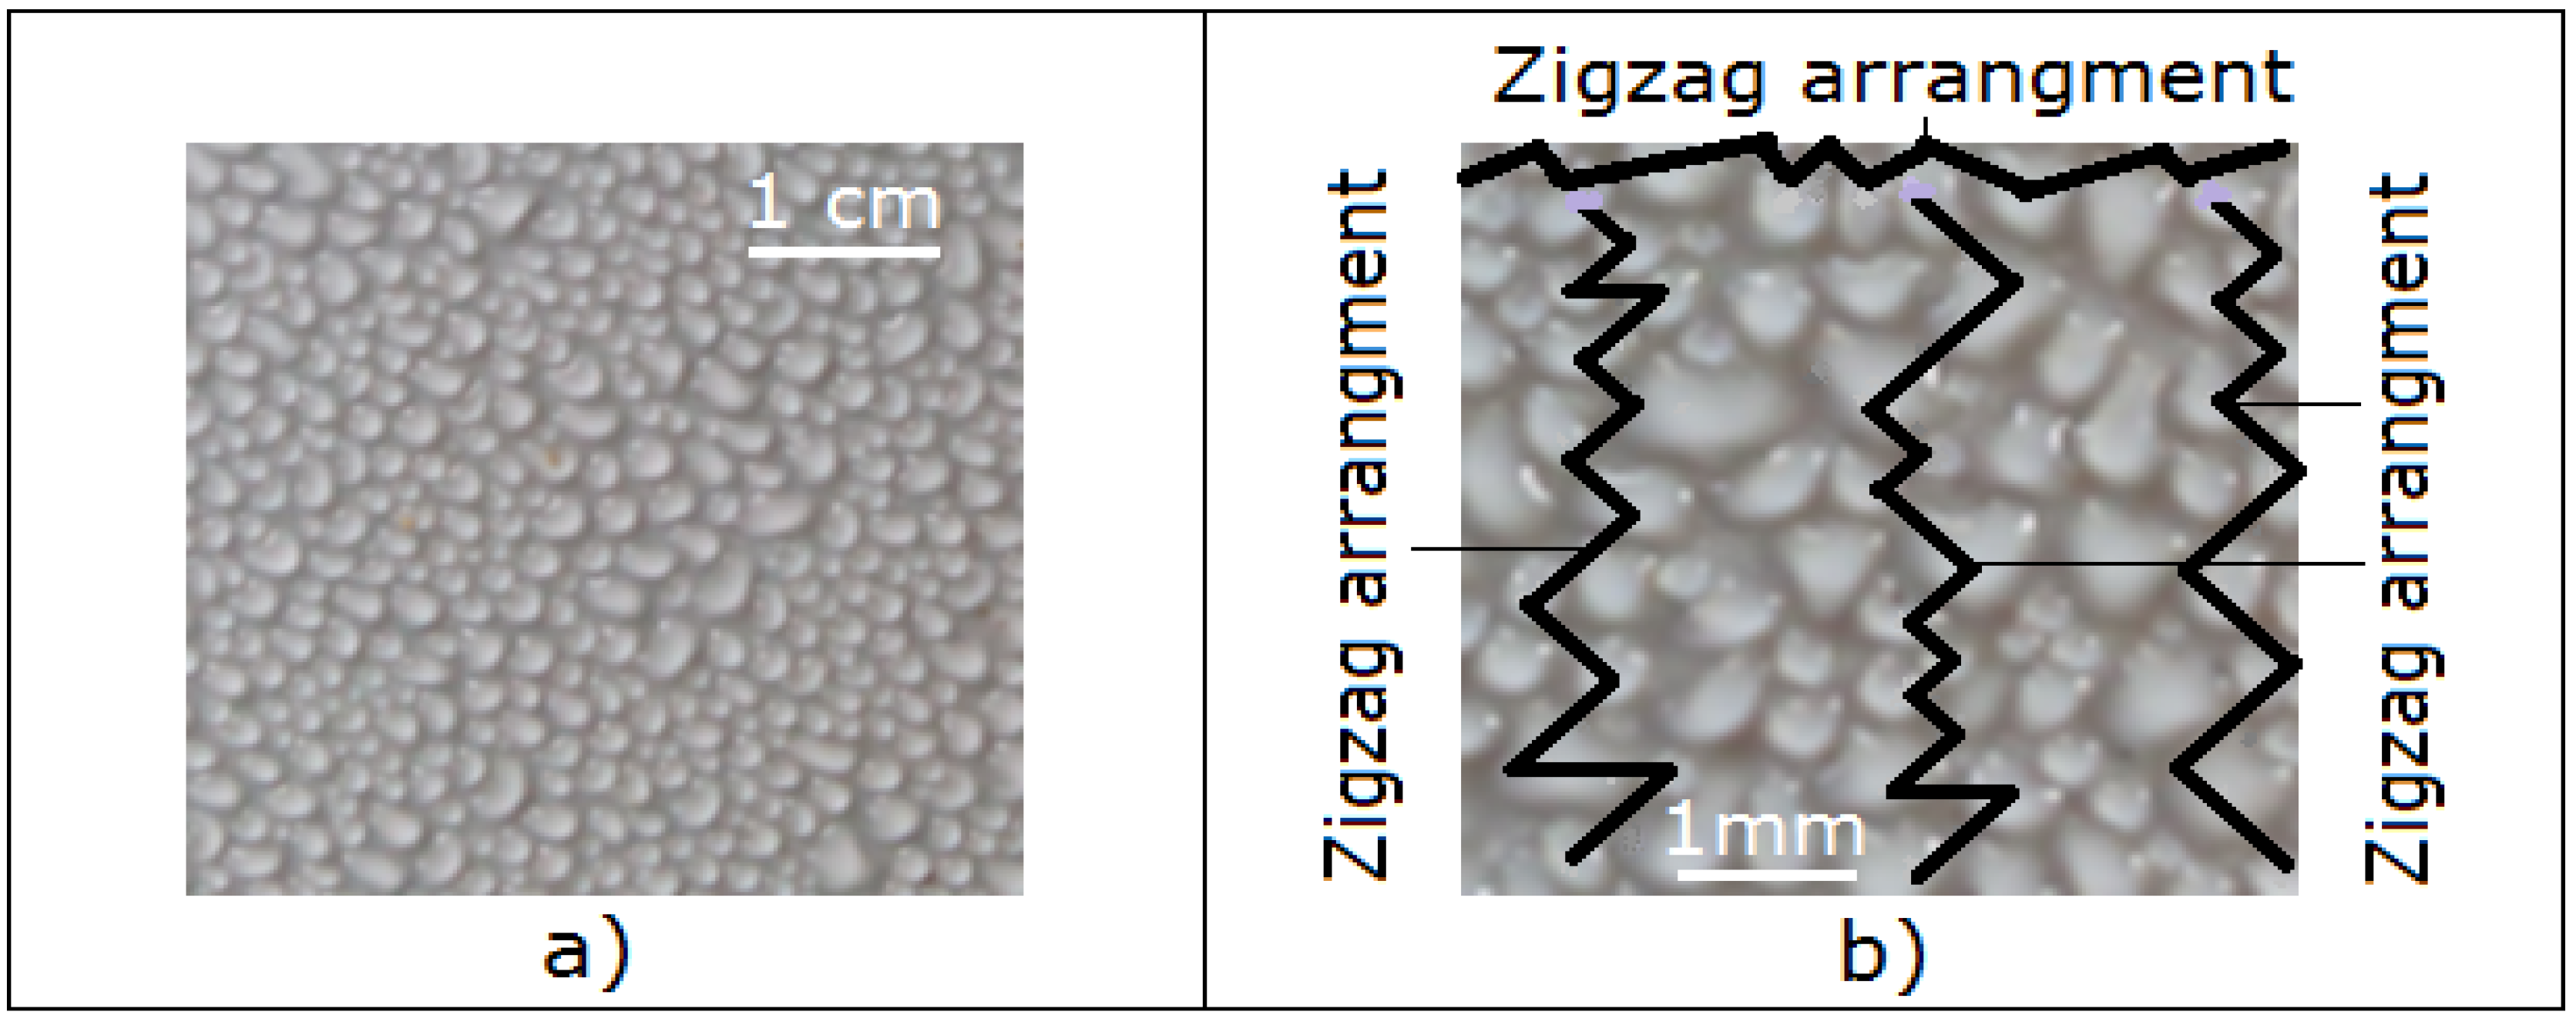
Figure 7 also illustrates the nature of the constellation of water drops formed on the surface of the same sample of silicone insulation, exposed to the phenomenon of natural condensation during two different time periods. As a result, the surface of this sample is covered with a set of small, medium, and large drops of water whatever the period of exposure and the climatic conditions prevailing on site during this period (Figure 7a). The distribution of their size along the leakage path of the insulation and its width is very random. Their arrangement along the width of the insulation and its leakage path is much closer to that of a zigzag than a straight line (Figure 7b). Moreover, the geometry of these zigzag curves is very asymmetrical.
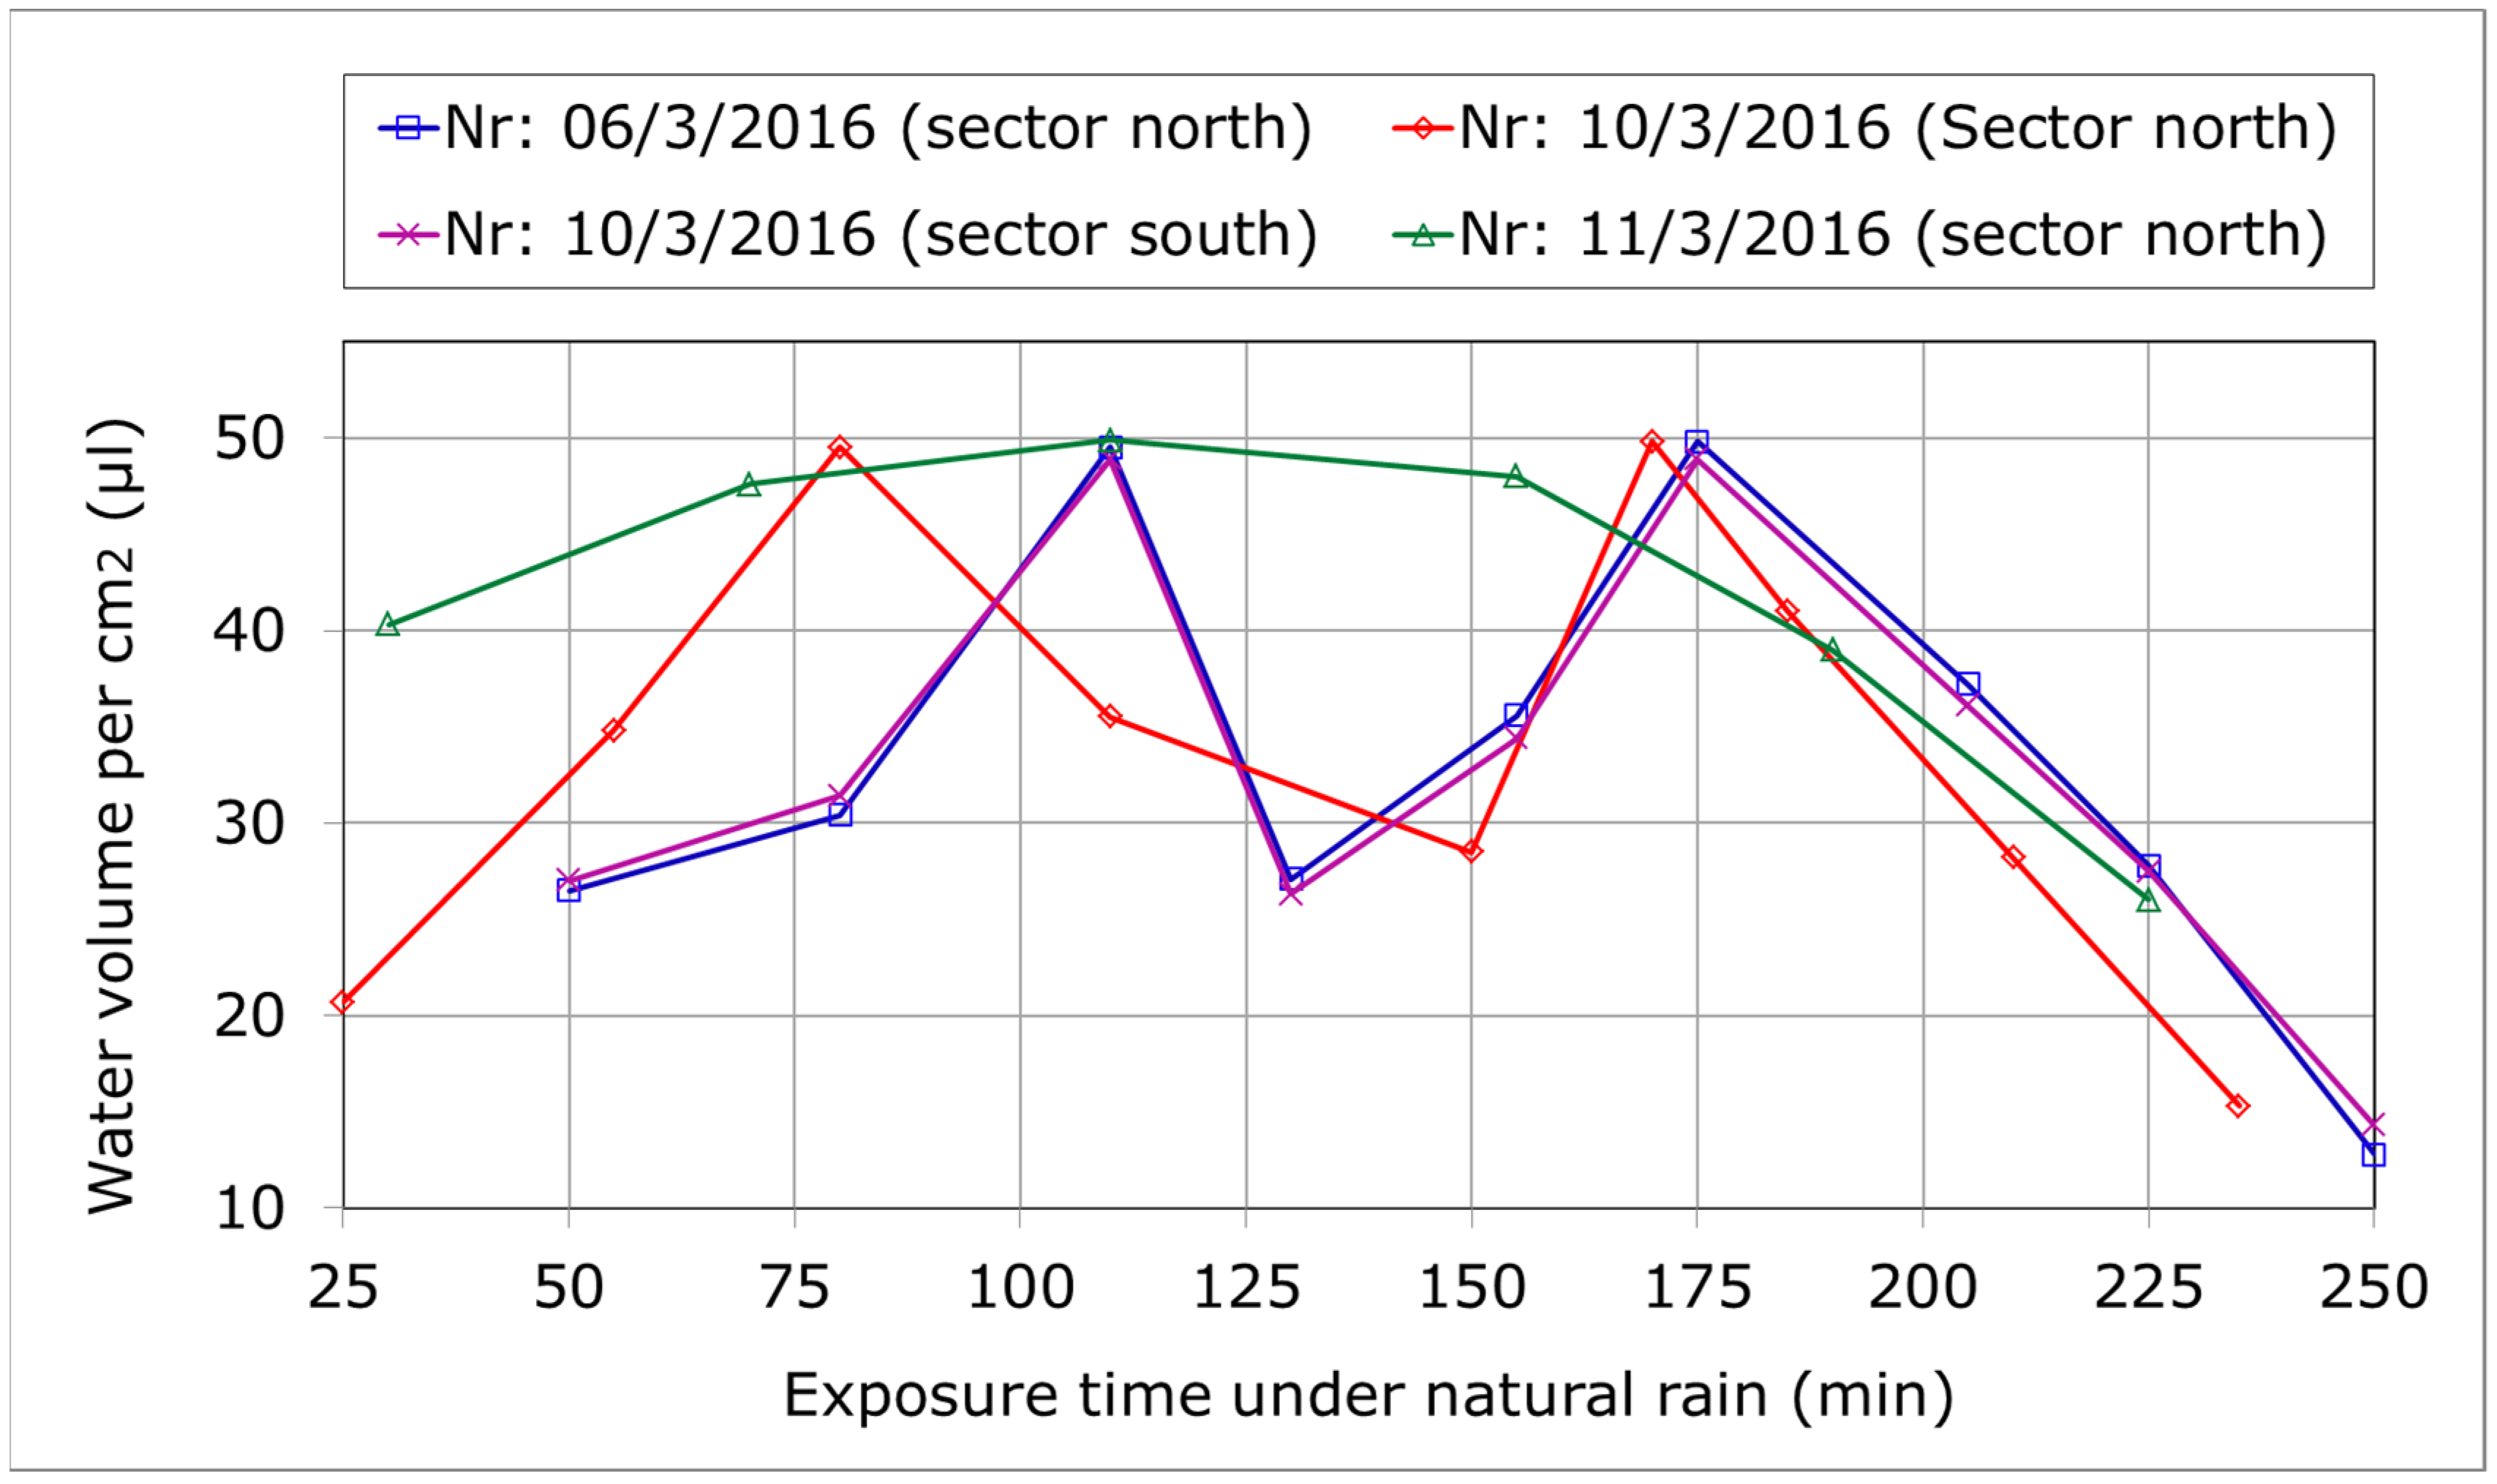
The temporal evolution of the amount of natural rainwater collected per cm2 on two different sectors of the various insulation samples is illustrated in Figure 8. The resulting curve is in the form of saw-tooth and is practically independent of the selected area. The very slight difference between the two sectors can be explained by the stability of the wind speed and temperature values recorded during the measurement periods, which are 22 km/h and 11 °C, respectively. The curves in Figure 8 show maximums and minimums of water volume. When the drops of natural rainwater fall on a hydrophobic insulating surface inclined 20° from the horizontal, the amount of water collected per cm2 of its surface increases until it reaches a maximum volume corresponding to the peaks illustrated in Figure 8.
This maximum volume is defined as the quantity of water still able to adhere to its point of impact on the surface of the de-energized insulation at a definite angle of inclination under the effect of its own weight and adhesion force. The value of these peaks depends on the angle of inclination of the insulation and climatic conditions, especially wind and temperature. In this case, its value is about 50 µL. When no electrical voltage is applied to the insulation, the heavy water droplets end up falling under the effect of gravitational and friction forces, leaving behind water droplet residues. If, at this point, the rain still falls, the volume of residual water is increased more or less to its maximum value by the rain drops falling on the same place. This maximum value depends on the variable intensity of the natural rain and the non-constant size of its drops falling on the impact point of the surface considered. However, if the rain stops falling, the maximum accumulated water volume will start to decrease because of its evaporation until total draining of the impact surface during a high temperature or its ejection completely from the point of impact by wind. However, during its decrease, it can also reach a minimum value shown in Figure 8. This is defined as the quantity of water recorded after a definite downtime of the first rainfall and just before the beginning of the second rainfall. Therefore, if the rain resumes its fall without interruption during the decrease of this volume of water, it increases again until reaching its maximum value cited before. The comparison results of the volumes of natural rainwater collected per cm2 of insulation surface during three distinct measurement periods are also summarized in Figure 8. As a result, all the curves presented have a shape like Saw-tooth. Each of the two curves, referring to the periods 6–10 March 2016, have two maximum values separated by a minimum and the curve relating to the period 11 March 2016 has only one. As mentioned previously, the existence of two peaks on the same curve separated by a minimum is explained by the fall of two successive natural rains and the presence of a single peak corresponds to the fall of a single natural rainfall. In the same figure, the reproduction of the maximum peak value of 50 µL is observed from one rainfall to another during the same period and from one measurement period to another. It should also be noted that the duration of the period from 11 March 2016 during which the maximum value of the volume of water is kept constant is large. The stability of this value can be explained by the fact that, during the rainfall, the site temperature and wind speed values are lower than those for the other two periods.
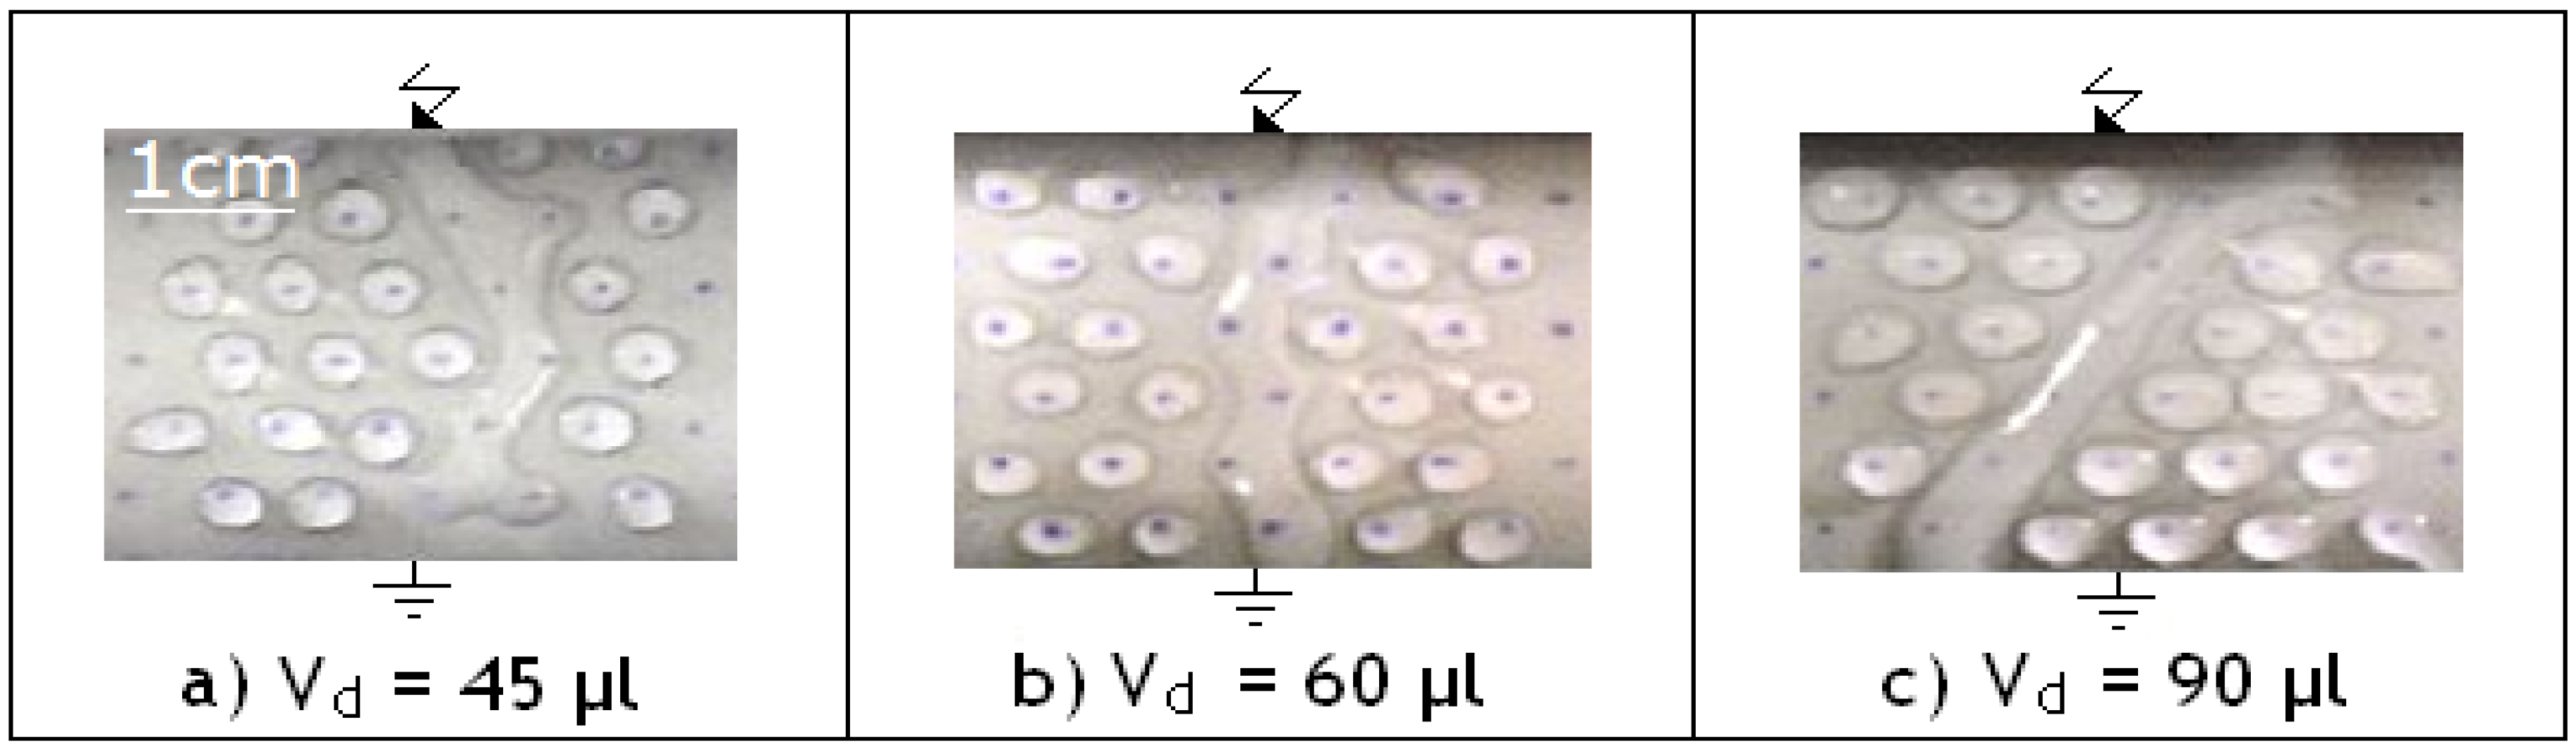
Figure 9 shows the nature of the constellation of natural raindrops that watered the upper surface of three silicone insulators with single sheds for three different time periods. The photographs of these sheds were taken at a moment when the amount of natural rainwater recorded per cm2 of insulation area is at a maximum on each of the three considered samples. The result is that the surface of each of these three sheds is covered with a multitude of large, medium, and small drops of water regardless of the period of exposure of the samples and the intensity of the natural rain falling on them. These various drops of natural rainwater are arranged on the leakage path and on the insulation conference in a zigzag arrangement rather than a straight line (Figure 9). The distribution of their volume along the leakage path of the insulation and its circumference is very random. Moreover, the geometry of these zigzag curves illustrated by Figure 9a–c is very asymmetrical.
In summary, we can conclude that the arrangement of the water drops formed during rain or condensation along the leakage path and the width of the silicone insulation, obeys a very asymmetrical zigzag arrangement for both considered phenomena. Moreover, the maximum volume of natural rainwater collected per cm2 of surface area of this insulation is practically twice that recorded on the same material subjected to the phenomenon of natural or artificial condensation. This means that the wet leakage path of the insulation under rain is almost twice as large as under condensation. Consequently, the risk of flashover of the insulation and the alteration of it is doubly great under rain than under condensation.
3.2. Effect of the Zigzag Arrangement of Water Drops on the Flashover of Silicone Insulation
3.2.1. Number of Rows of Water Drops
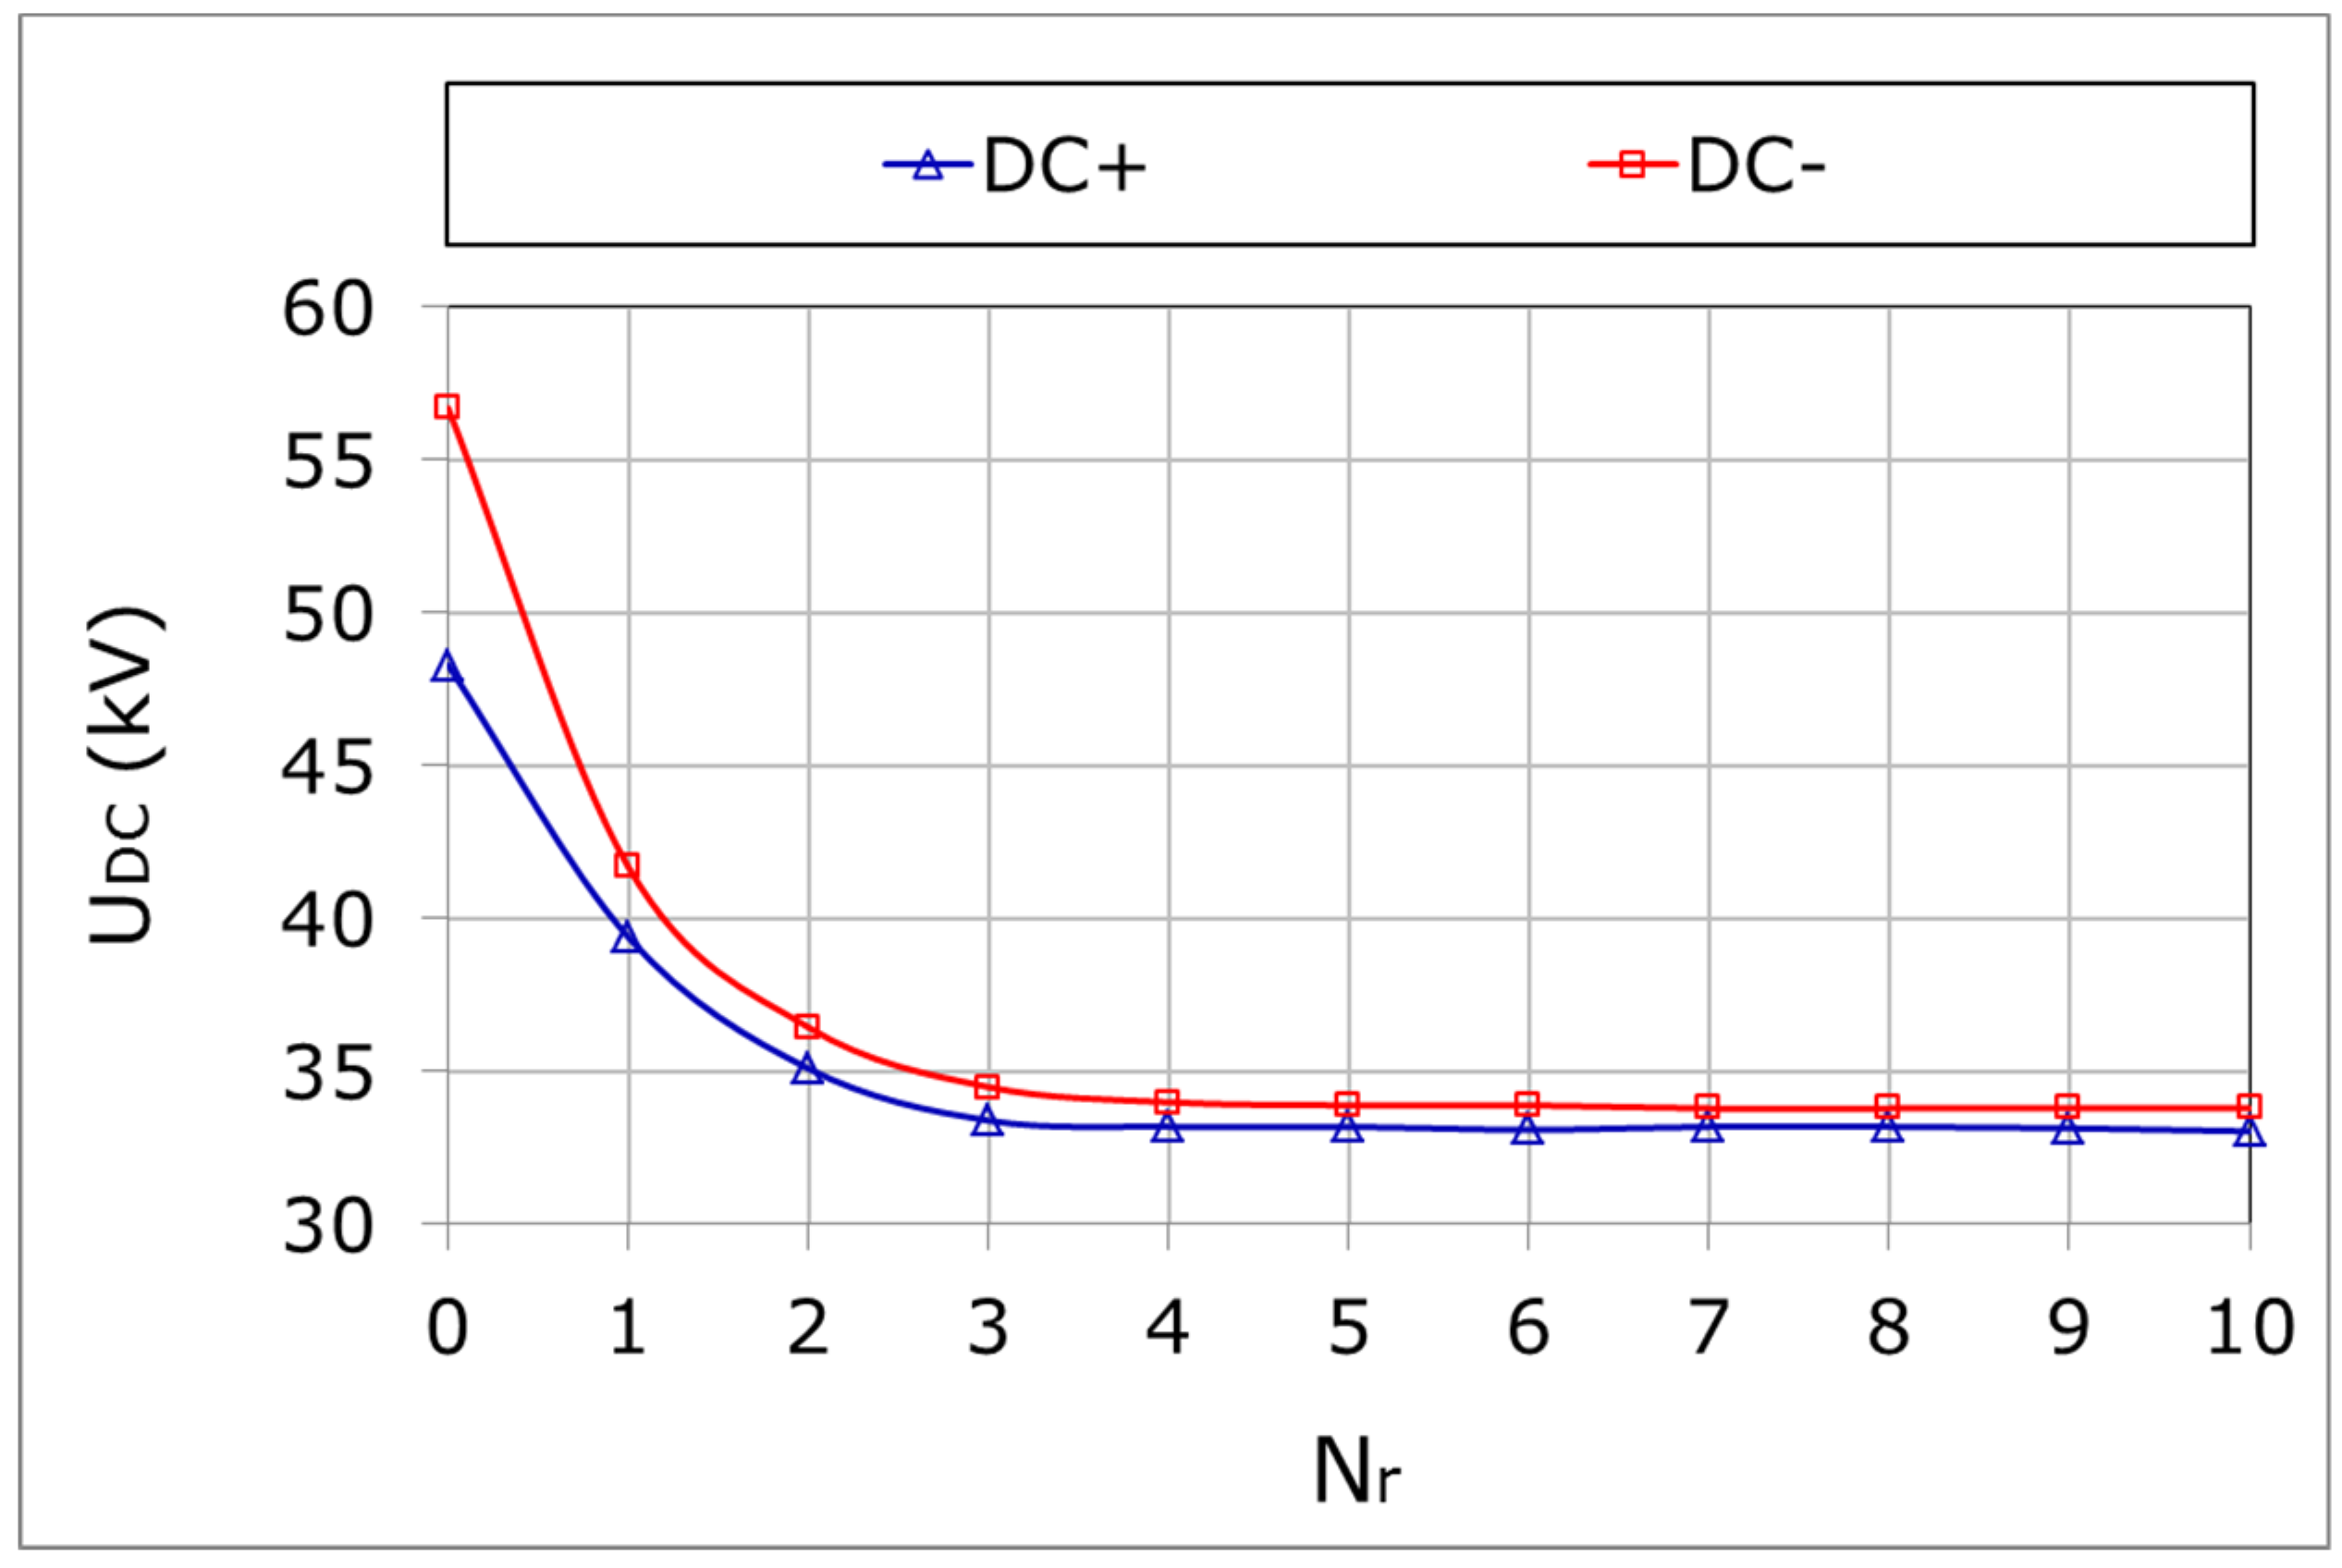
In this section, the number of rows Nr of water drops deposited in zigzag along the leakage path Lc of the insulation (Figure 2) and the polarity of the voltage stress applied to the material have varied. An average volume of 45 μL drops of water is fixed along the leakage path and the width of the insulation. The values of the three quantities characterizing the location of the symmetrical zigzag water drops on the surface of the insulation (Ldh, Ldd, and Ldt) were taken as equal to 8.6 mm (Figure 2). The distance lrr separating two successive rows over the width of the insulation is set at 10 mm during these tests. These values were selected on the basis of the results obtained in the literature [19]. The measurement results of the characteristic of the silicone insulation’s flashover voltage as a function of the number of rows of water drops are illustrated in Figure 10. This results in a subdivision of its characteristic into two distinct zones.
- (i)
- The first zone showing a rapid decline in the flashover voltage of the material from the value obtained in the absence of water droplets on its surface up to a minimum value. This one is obtained for a number of rows of drops of the order of 4 to 5, regardless of the polarity of the applied voltage.
- (ii)
- The second zone characterizing the constancy of the minimum flashover voltage of the insulation regardless of the number of additional rows added on its surface.
ℜu is defined as the ratio of the flashover voltages of the insulation with water drops and without them. In this case, this ratio is of the order of 68% under DC+ and 60% under DC−. It should be noted that, beyond a number greater than or equal to 5 rows of water drops, the polarity of the applied voltage to the insulation has a negligible effect on this ratio.
The covering of a silicone surface in the form of a symmetrical zigzag arrangement of several rows of water drops results in a reduction of the insulation’s electrical performance only in the case where the number of rows does not exceed 4 to 5, regardless of the polarity of the applied DC voltage. Beyond this number, no decrease in electrical performance has been observed.
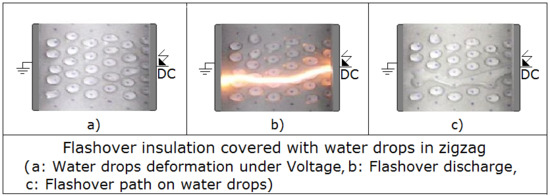
The visualization of the electric discharge phenomenon shows that the deformation of the water drops always touches 4 to 5 rows and the flashover is frequently established on a path resulting from the junction of the drops of water located on one or two oblique lines formed on the interelectrode surface, as shown in Figure 11a,c. The Flashover along the path given in Figure 11b is rare. When Nr is greater than or equal to 10, a second electric discharge may originate on the surface of the same insulation and develop parallel and independently of the first [5]. In this case, these two electric discharges are always spaced from each other by a distance equivalent to a band of insulation on which four to five rows of water droplets rest. This phenomenon is very similar to the one seen in the case where multiple rows of water droplets are deposited in straight lines on the surface of the same insulation [19]. In summary, the number of water droplets made on the same row gives information on the humidification rate of the dry leakage path of the insulation and possibly the number of partial electric discharges that can appear in series. On the other hand, the number of rows deposited along the width of the insulation informs us about the number of parallel electric discharges that can develop before the final flashover of the insulation. This total number of electric discharges that can reign on the interelectrode surface under such conditions is a means of indicating the state of aging of the material undergoing the test.
3.2.2. Inclination Angle of Insulation and Volume of Water Droplets
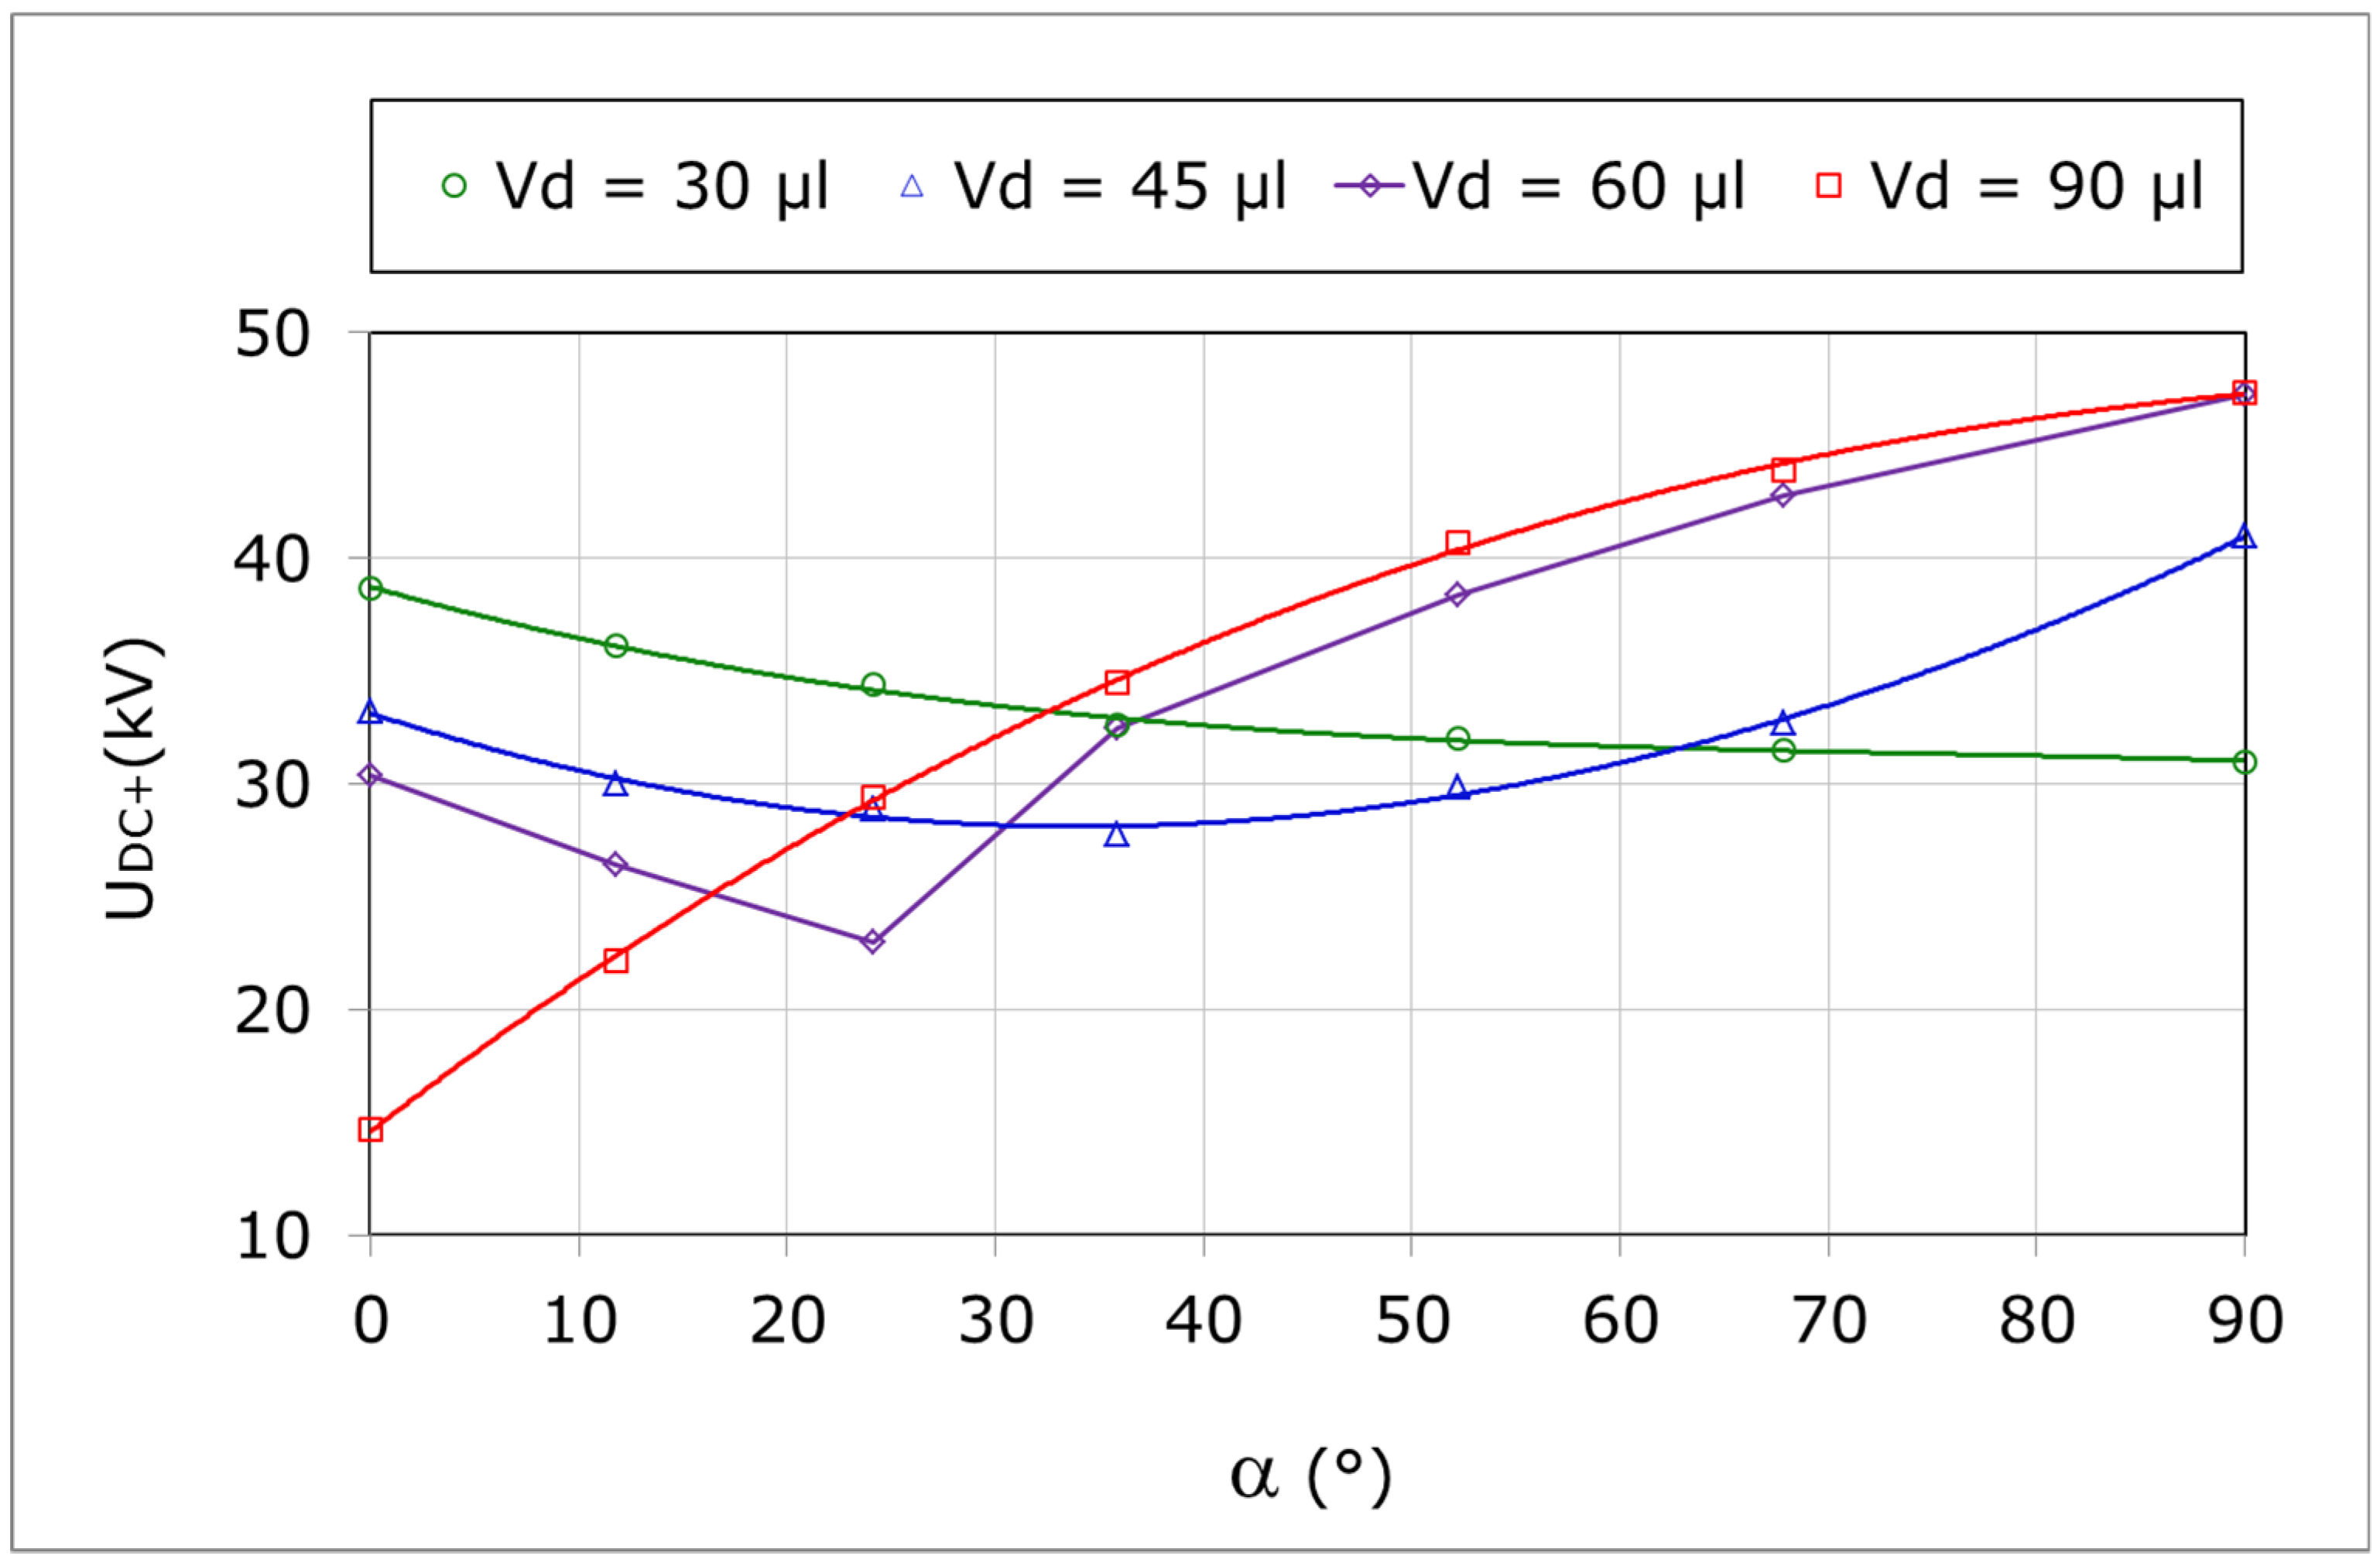
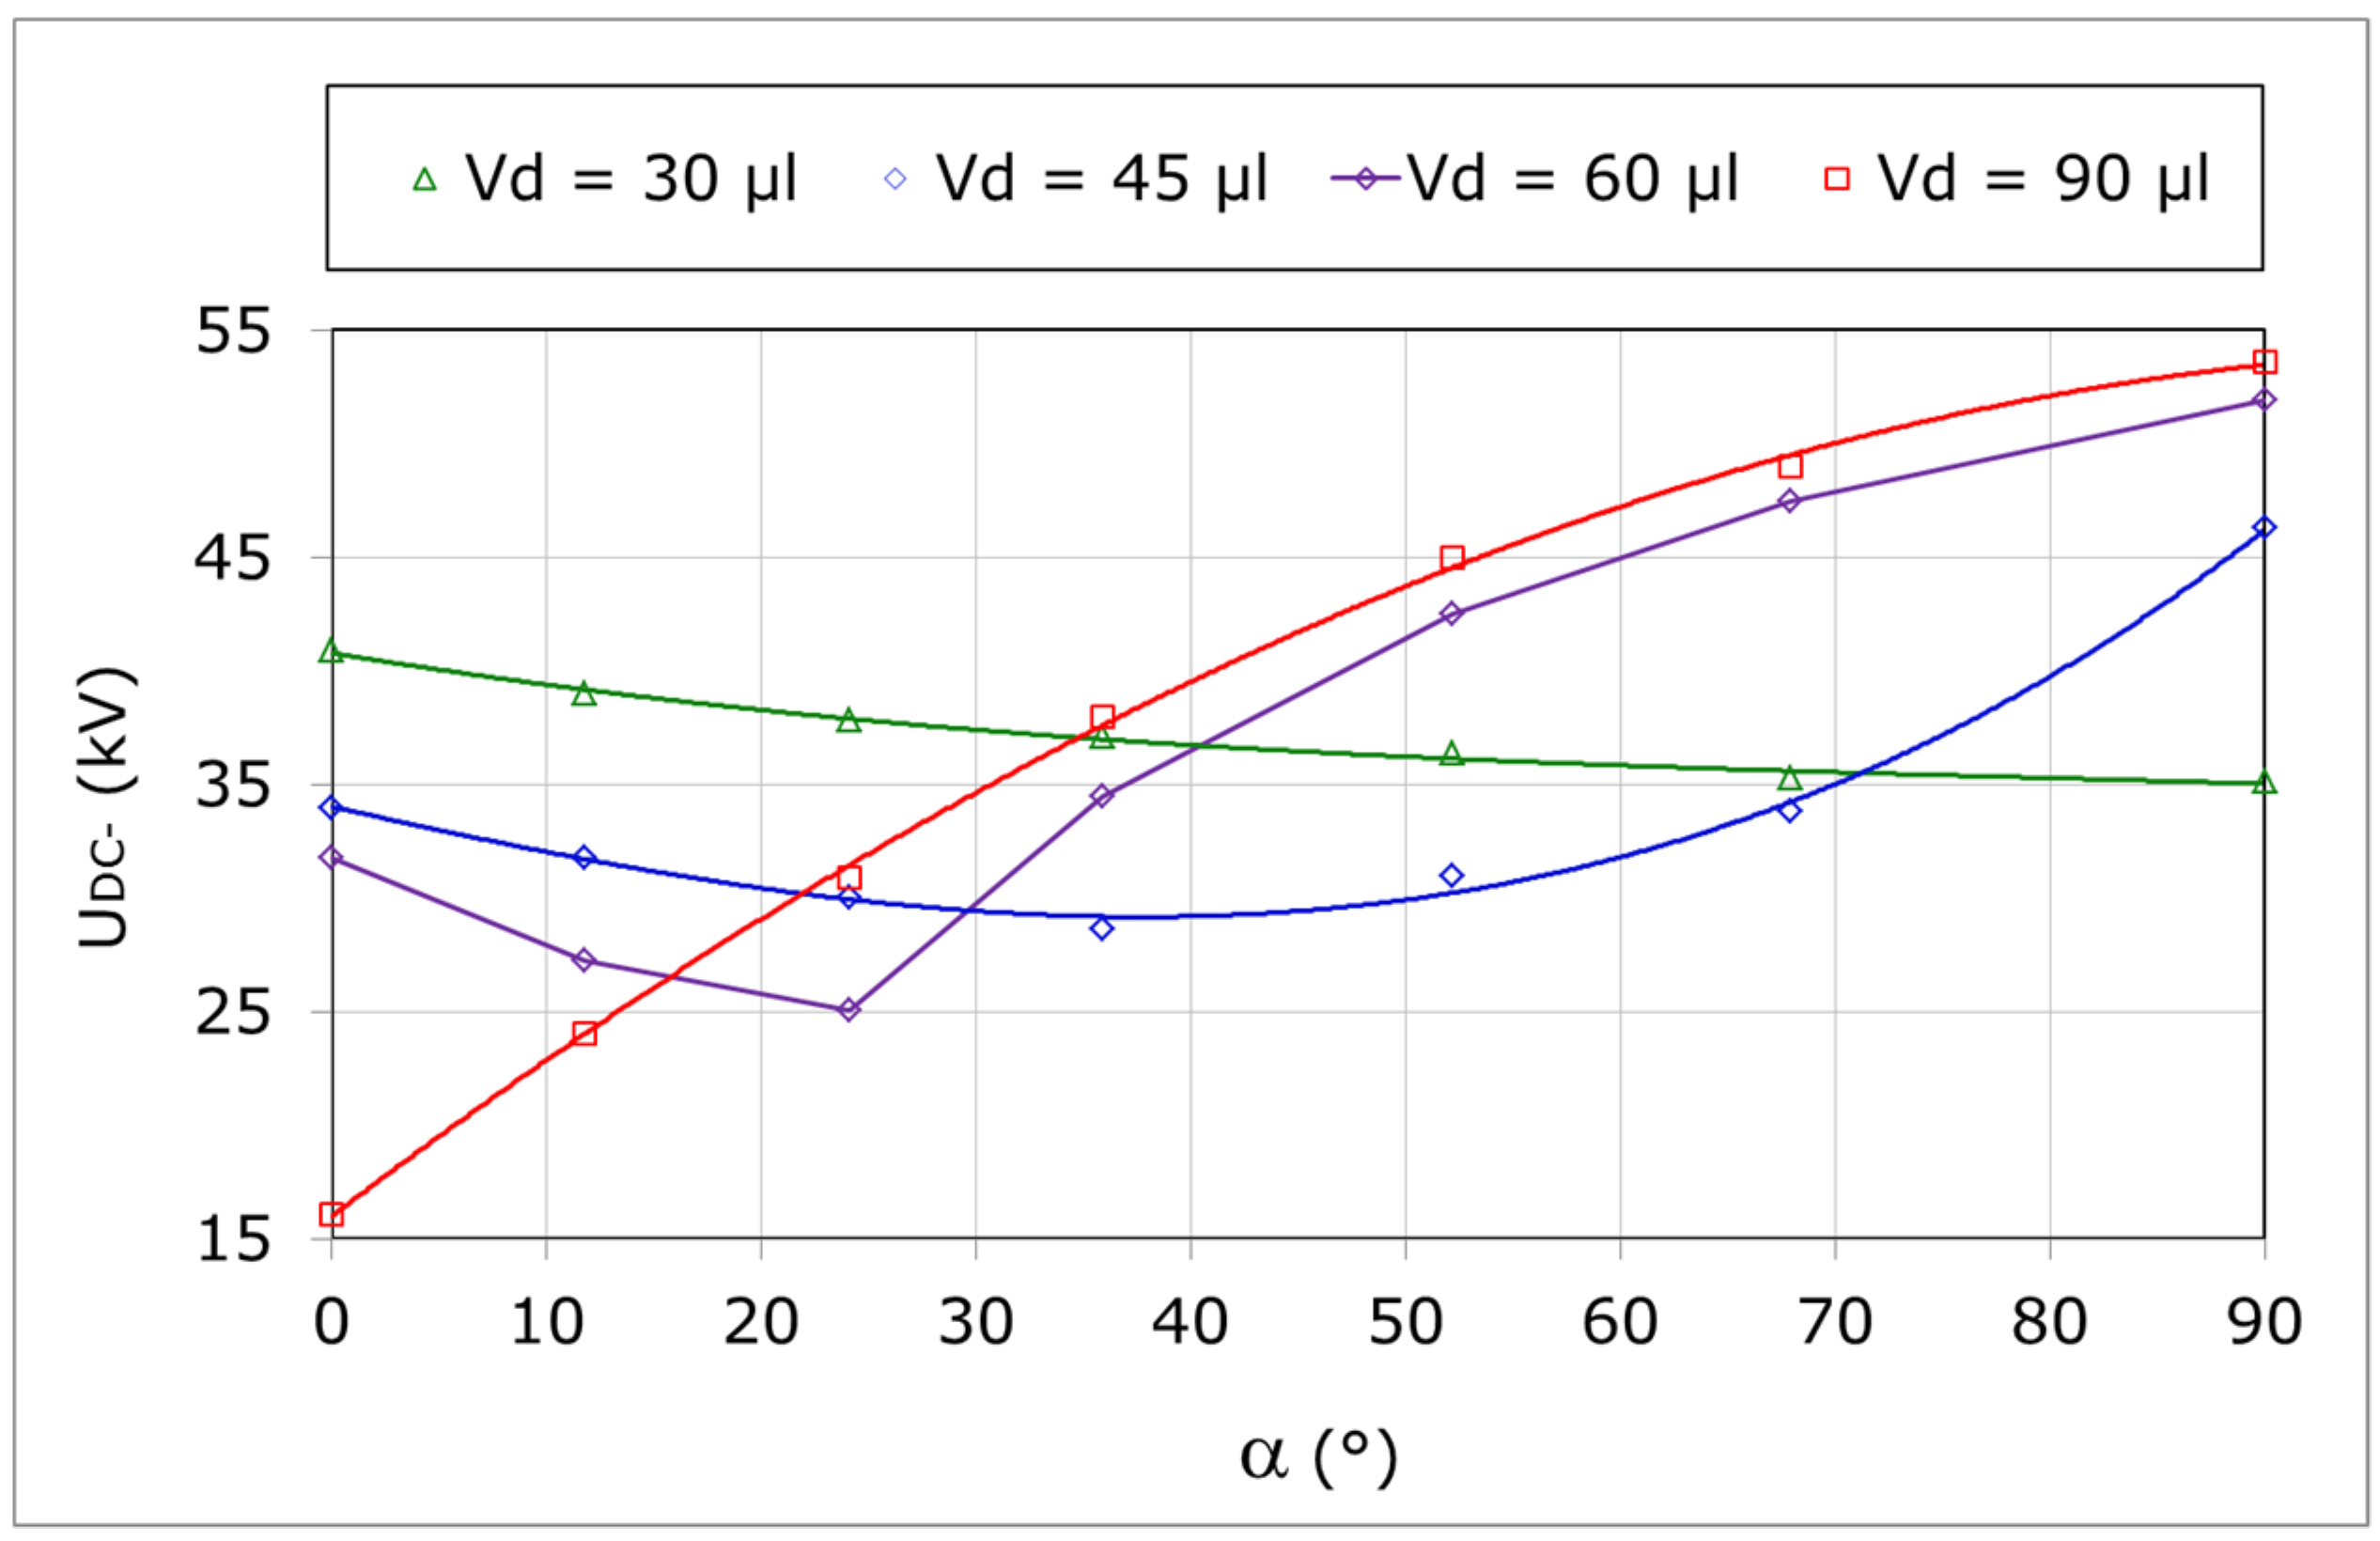
In this section, a zigzag arrangement of 5 × 6 of water droplets is taken into consideration. Their electrical conductivity is equal to 200 μS/cm. The full electrode (Figure 2c) is used to take into account the effect of water retention by this one on the electrical performance of the insulation. The water droplets are manually deposited on the landmarks on the surface of the material in a horizontal position. Then, it is turned manually and slowly to be brought to an angle of its inclination chosen beforehand. Once the desired position is reached, a DC voltage is applied to it. The characteristics of the flashover voltage of the insulation as a function of the angle of its inclination and the volume of the water droplets covering it are illustrated, respectively, in Figure 12 and Figure 13. The results can be grouped into three distinct cases.
- (1)
The decrease of the flashover voltage of the insulation with the angle of its inclination can be justified by the persistence of the adhesion of water droplets of such a size when the angle α goes from 0° to 90° and their maximum elongation in the vertical position of the insulation. Certainly these water droplets are subjected simultaneously to electric forces, friction, and to their own increasing weight with the slope of the insulation, but the resultant of all these forces is, despite its increase with the inclination, is insufficient to bring down the water droplets of such a volume. On the other hand, because of their increased elongation at this inclination, they cause a shortening of its dry leakage path and, consequently, a reduction of its flashover voltage. This situation is favorable for horizontal or slightly inclined sheds and unfavorable for the cores of silicone insulators under the effect of the phenomenon of very strong condensation.
- (2)
- When 30 µL < Vd < 90 µL, the curve of the insulation’s flashover voltage as a function of its inclination angle has a minimum regardless of the polarity of the voltage applied to the considered insulation (Figure 12 and Figure 13). The position of this minimum moves toward lower angles of inclination of the insulation with the growth of the size of the water droplets (0° < α < 50°). The value of this minimum decreases as the insulation’s angle of inclination approaches 0°, regardless of the polarity of the applied voltage.
For Vd = 60 μL, this minimum is equal to 48% of the value of insulation’s flashover voltage without these drops in DC+ (Figure 12) and 44% in DC− (Figure 13). Such a decrease is due to the high increase in length of the wet leakage path of the insulation. This is explained by the lengthening of the water drops under the combined action of electric forces, friction, and gravitation. The critical angle of inclination of the corresponding insulation is equal to 25° for this volume, whatever the polarity of the applied voltage. This critical inclination’s angle of the insulation corresponds to a situation where the adhesion of the water droplets on the material has reached its limit value. For angles greater than this limit, the result of all the forces generated may cause the removal of water droplets of such a size.
On both sides of this critical position, the flashover voltage of the insulation increases and becomes more increased especially in the vicinity of high inclinations. This rise is due to the sudden fall of water droplets with the growth of the slope of the insulation and their replacement by electrolytic residues of increasingly smaller volume. This again causes the increase of the dry leakage path of the insulation and, consequently, its flashover voltage. In the latter case, a very low value of ℜu was recorded. The weakness of this ratio can be explained by the reduction in the length of the wet leakage path of the insulation due to the fall of water droplets and their replacement by tiny electrolytic residues.
- (3)
- When Vd = 90 μL, the shape of the characteristic UDC = f(α) is strictly increasing for both polarities (Figure 12 and Figure 13). For α = 0°, the value of the ratio ℜu is the lowest. It is of the order of 30% in DC+ (Figure 12) and 28% in DC− (Figure 13). This is due to the greater shortening of the dry leakage path of the insulation by voluminous water droplets. For α = 90°, the very bulky drops leave the surface well before the arrival of the insulation at this position. Under the effect of the resultant electric forces, friction, and gravitation, these give up their place to electrolytic residues. The variation of their volume is closely related to the angle of inclination and, consequently, the number and the frequency of the bump between the initial droplets of water belonging to the extreme row located in the immediate vicinity of the electrode under voltage and the residual droplets of the following rows.
The insulation’s flashover with electrical arc was established above these very thin droplets of water far apart from each other. Maintaining of the flashover voltage of the insulation at a high level, in this case, is explained not only by the tiny length of the wet leakage path occupied by the tiny water droplets but also the great distances separating them. It should be noted that the flashover voltage is very close to that of the insulation in the absence of these electrolytic rejections without being equal to it (Figure 12 and Figure 13).
Lastly, for 50° ≤ α ≤ 90°, the rapprochement one to another of the two characteristics UDC = f(α) corresponding to the volumes equal to 60 μL and 90 μL, respectively (Figure 12 and Figure 13), have been noticed whatever the polarity of the voltage applied on the insulation. This is due to the fact that the tiny electrolytic residues, resulting from the drops of such volumes, under the combined action of the three forces mentioned before, are practically identical. According to Figure 12 and Figure 13, the volume of these electrolytic residues is less than 15 μL. These results are also in accordance with those established in AC in the literature [22]. These residual micro droplets do not elongate at all under the effect of applied forces and, therefore, the length of the wet zone of the sliding path exploited by the electrical arc’s flashover of the insulation is practically negligible in front of its total dry leakage path.
For this reason, in this interval of the inclination angle, the value of the ratio ℜu is greater than 85% in DC+ (Figure 12) and 75% in DC− (Figure 13). For these reasons, the installation of silicone insulators with sheds with inclination’s angle, located in this interval, is strongly recommended in areas with higher rainfall. Lastly, the tests carried out on various real insulators, constrained under AC voltage and artificial rain, show that the best-performing insulator has sheds inclined by 55° [20]. This angle of inclination is within the interval found in this study.
3.2.3. Evacuation of Water through the Holey Ground Electrode
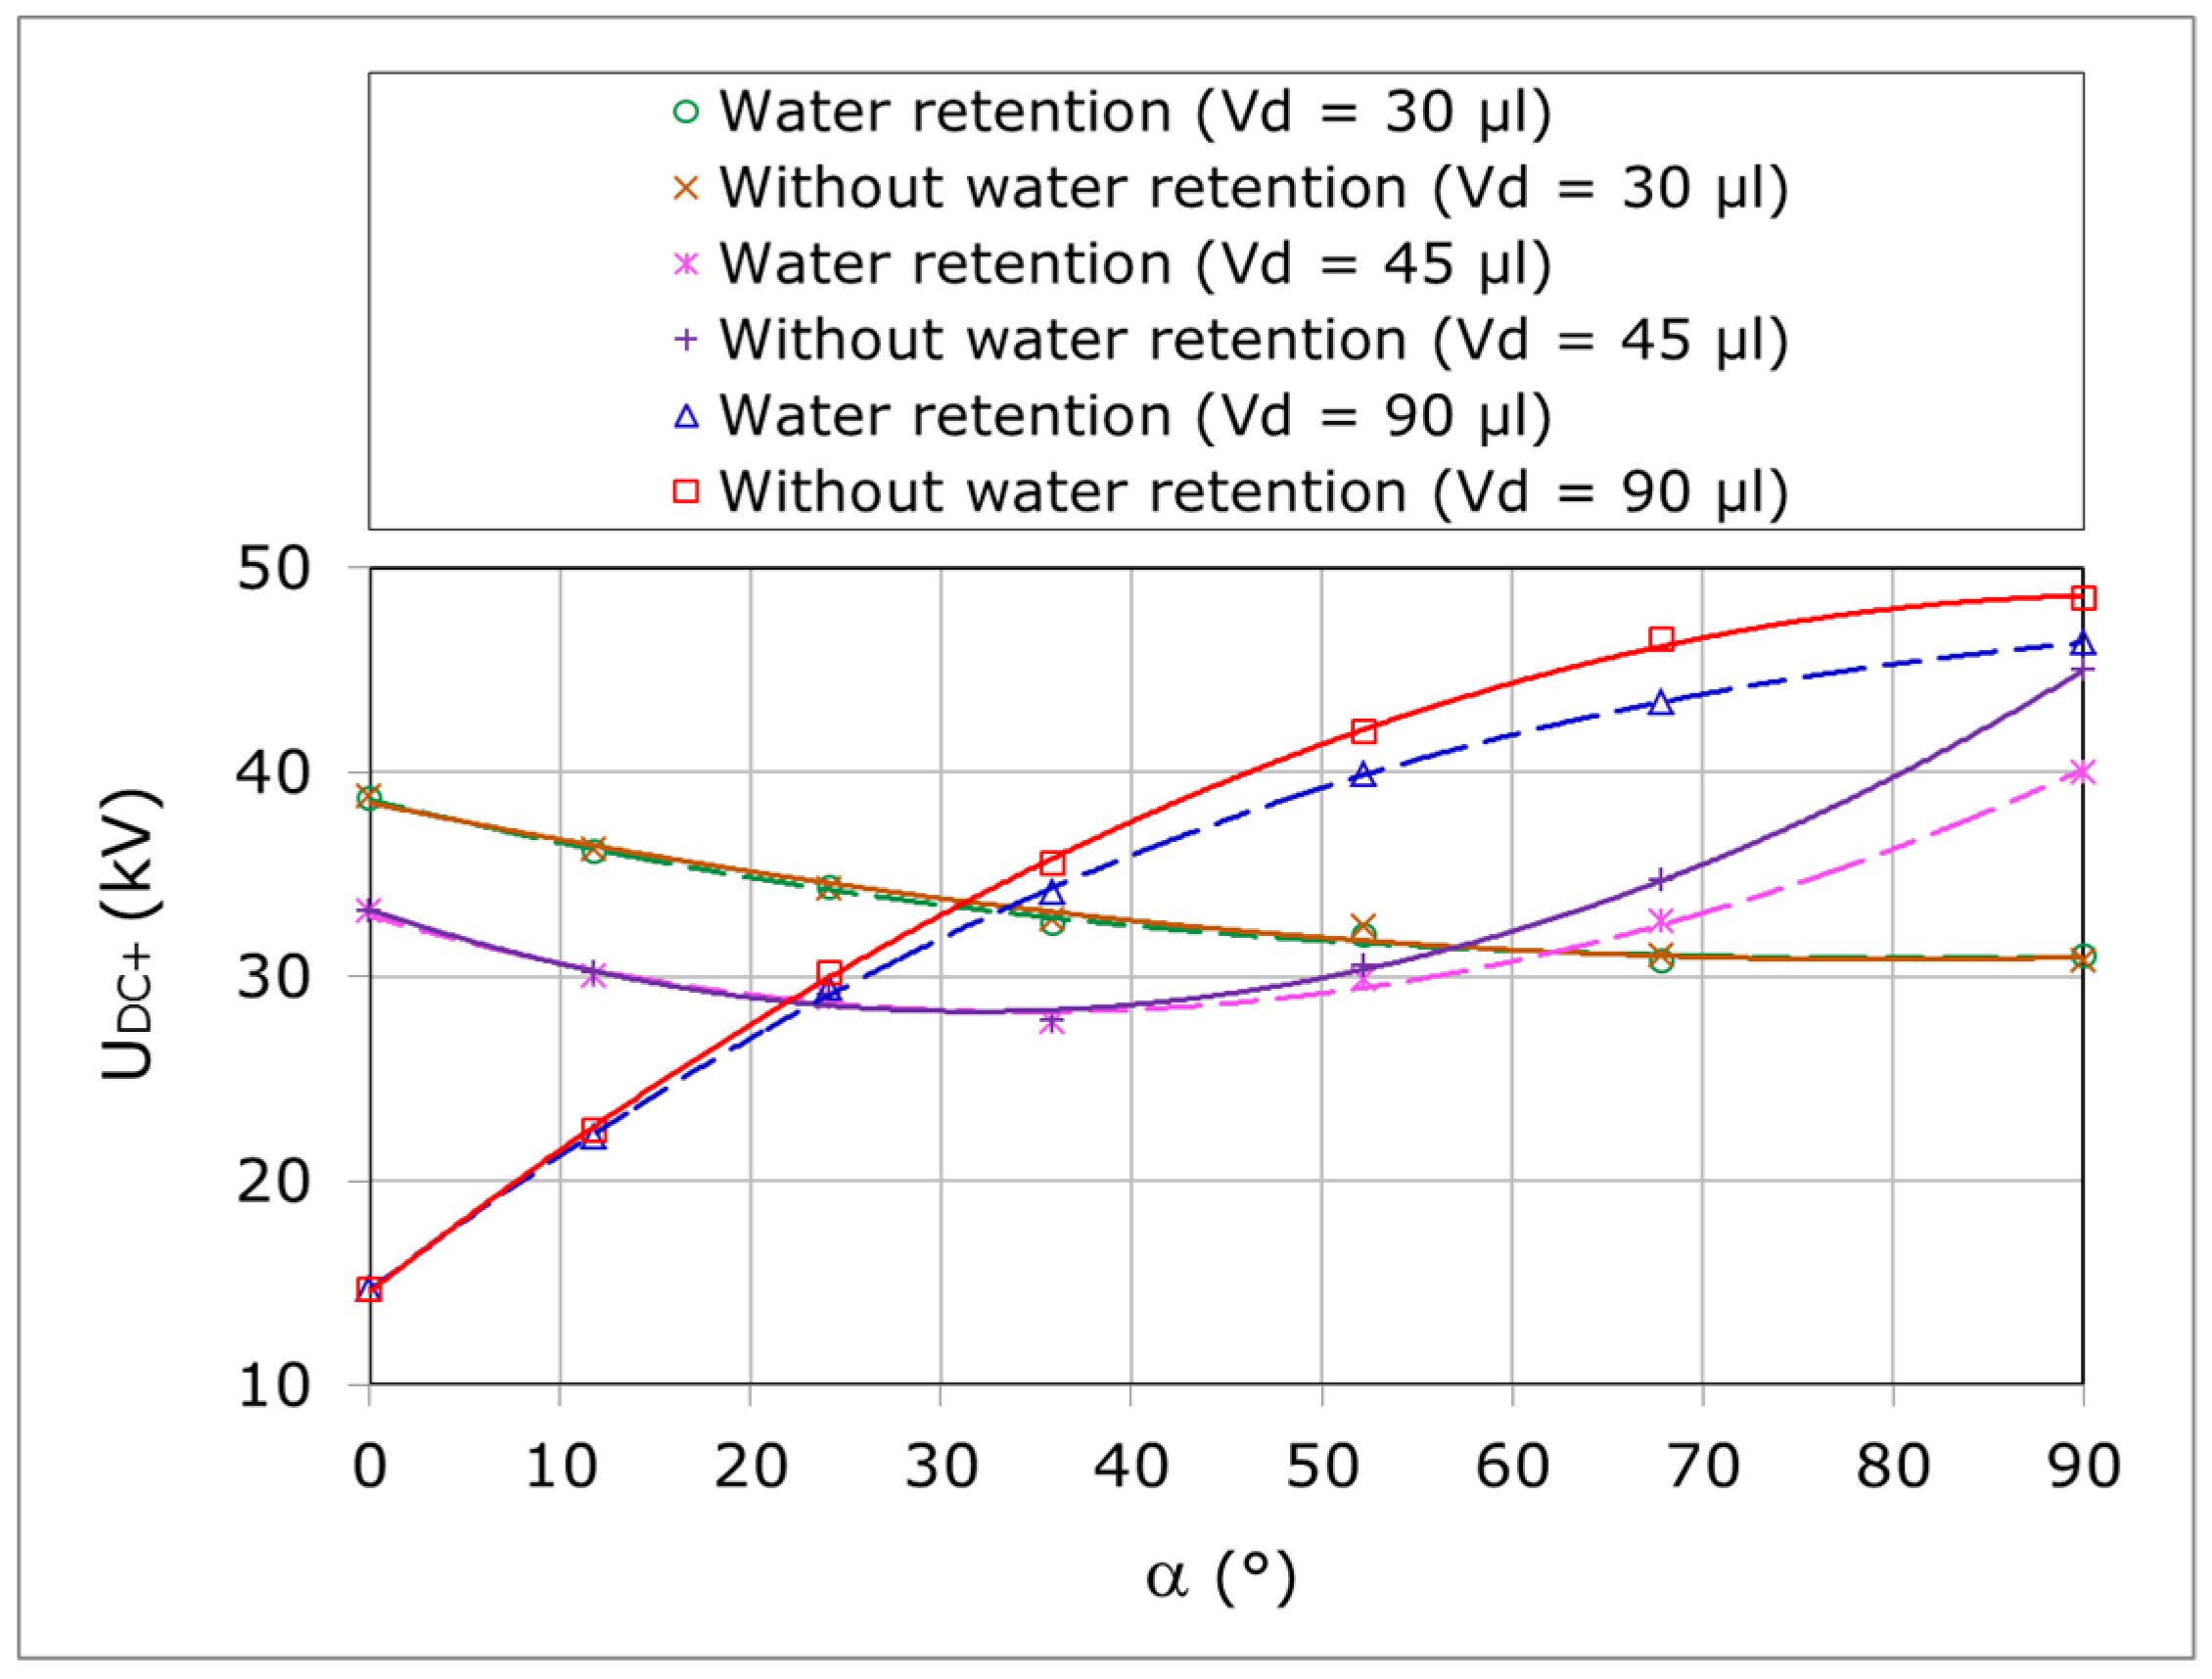
In this section, the holey grounded electrode (Figure 2b) is used to ensure the passage through it to water droplets during their fall due to the inclination of the insulation. The surface of the silicone insulation is covered with a zigzag arrangement of five rows containing six water droplets each. Their electrical conductivity is fixed at 200 μS/cm. The results of measurement of its flashover voltage as a function of the degree of water evacuation through the grounded electrode, the angle of inclination of the silicone insulation, and the volume of water drops deposited manually on its surface in a horizontal position are summarized in Figure 14 and Figure 15. The curves obtained with water retention at the level of the full grounded electrode correspond to those found in Section 3.2.2.
It arises that, for a volume of water droplets equal to 30 µL, the flashover voltage curves of the insulation with evacuation or water retention are practically similar regardless of the inclination’s angle of the insulation and the polarity of the voltage applied to this one. This can be explained by the fact that, for such a size of water droplets, they do not fall at some inclination of the surface of the insulation to cause a voltage difference between these two states. On the other hand, for the volumes of 45 and 90 μL, the existence of an insulation flashover voltage difference, between the state where the water droplets falling on the ground electrode, are evacuated through its holes. The one where some amount of fallen water is retained in the vicinity of the ground electrode was detected. This difference is shown for α ≥ 50° in the case where Vd = 45 μL and for α ≥ 20° where Vd = 90 μL. The maximum relative difference between these two voltages is of the order of 11%. This is obtained for an inclination’s angle of the insulation equal to 90° and for an average volume of 45 μL and whatever the polarity of the voltage applied to the insulation. It should be noted that the flashover voltage of the insulation is higher when some amount of water is evacuated through the holes of the ground electrode. This may be explained by the fact that the dry leakage path of the insulation, of higher electrical resistance, becomes larger because of the removal of water from the vicinity of the grounded electrode. This results in a maximum value of the ratio ℜu of 93% for Vd = 45 μL and 100% for Vd = 90 μL. Therefore, for such a profile of sheds and geometry of electrodes of the considered insulator, micro-discharges and flashover become very rare. Therefore, a nonexistent virtual alteration of the material is used.
4. Conclusions
The characterization of the constellation of raindrops and natural condensation on sheds inclined by 20° from a de-energized silicone insulator and the measurement of their volume showed that:
- -
- The surface of a shed is covered with a combination of large, medium, and small droplets of water obeying to a constellation much closer to an asymmetric zigzag arrangement than a straight line.
- -
- The maximum volume of natural rainwater, collected per square centimeter of the surface of this insulation, is almost twice that resulting from natural or artificial condensation. Therefore, the leakage path of the natural rain insulation is reduced by almost half only under the effect of condensation, so the risk of flashover is higher, in this case, and the degradation of the material is higher as well.
- -
- The reproduction in the laboratory of a symmetrical zigzag arrangement of several rows of water droplets, manually deposited on silicone insulation with variable inclination and under DC voltage, led to the following essential results.
- -
- Under a zero inclination, five rows of six water drops of 45 μL of volume and 200 μS/cm of electrical conductivity, are sufficient to lower the insulation’s flashover voltage to a maximum of 40% compared to that obtained without these drops. Under these conditions, the volume of water droplets plays a very important role, since its elevation of 45 to 90 μL results in a reduction of the flashover voltage of the insulation of the order of 72% compared to the case without water droplets.
- -
- The interval of the insulation’s most favorable angle of inclination for such an arrangement of water droplets ranging between 60 and 90 µL, is between 50° and 90°. In the case of water retention at the ground electrode, it tolerates a maximum drop of 17% of the flashover voltage of the insulation compared to what was obtained without these droplets. On the other hand, if the water is evacuated through the perforated ground electrode, the maximum loss of the insulation’s flashover voltage is only about 13%. The volume of the residual micro-droplets is much less than 15 μL. The micro-discharges and the flashover become very rare. Therefore, such a profile of the sheds of a silicone insulator is highly recommended for reasons of its very low retention of water droplets and, therefore, a very slow electrical aging of this one.
- -
- On the other hand, under the same arrangement of water droplets varying between 45 and 60 μL, the interval of inclination’s angle of the insulation 0° < α < 50° is unfavorable, since it causes a reduction in the insulation’s flashover voltage of more than 48% compared to the case without water droplets. In addition, because of the strong adhesion of voluminous droplets on the surface of the insulation under voltage, the frequency of occurrence of electric discharges is very high and, therefore, the electrical aging of this one is greatly accelerated.
- -
- Lastly, a zero inclination’s angle of the insulation with such an arrangement is favorable only when it is under the effect of the phenomenon of condensation when the volume of water droplets remains well below 30 µL.
Author Contributions
Conceptualization: R.B., F.B., S.K. and K.D.H.; Methodology: R.B., F.B., S.K. and K.D.H.; Validation: R.B., F.B., S.K. and K.D.H.; Analysis: R.B., F.B., S.K. and K.D.H.; Resources: R.B., F.B., S.K. and K.D.H.; Writing: R.B., F.B., S.K. and K.D.H.; Visualization: R.B., F.B., S.K. and K.D.H.; Project administration: R.B.; Funding acquisition: R.B., F.B., S.K. and K.D.H.
Funding
This research received no external funding.
Acknowledgments
The authors would like to express their deepest gratitude to all of the members of the laboratory of HV in Bejaia.
Conflicts of Interest
The authors declare no conflicts of interest.
References
- Jia, Z.; Chen, C.; Wang, X.; Lu, H.; Yang, C.; Li, T. Leakage Current Analysis on RTV Coated Porcelain Insulators during Long Term Fog Experiments. IEEE Trans. Dielectr. Electr. Insul. 2014, 21, 1547–1553. [Google Scholar]
- Dong, B.B.; Jiang, X.L.; Zhang, Z.J.; Hu, J.L.; Hu, Q.; Shu, L.C. Effect of Environment Factors on AC Flashover Performance of 3 Units of Polluted Insulator Strings Under Natural Fog Condition. IEEE Trans. Dielectr. Electr. Insul. 2014, 21, 1926–1932. [Google Scholar] [CrossRef]
- Li, Y.; Jin, H.; Nie, S.; Tong, C.; Gao, N. Effect of superhydrophobicity on flashover characteristics of silicone rubber under wet conditions. AIP Adv. 2018, 8, 015313. [Google Scholar] [CrossRef]
- Nekahi, A.; McMeekin, S.G.; Farzaneh, M. Flashover Characteristics of Silicone Rubber Sheets under Various Environmental Conditions. Energies 2016, 9, 683. [Google Scholar] [CrossRef]
- Bouchelga, F.; Boudissa, R. Effect of the Development of Electrical Parallel Discharges on Performance of Polluted Insulators under DC Voltage. IEEE Trans. Dielectr. Electr. Insul. 2015, 22, 2224–2233. [Google Scholar] [CrossRef]
- Li, L.; Gu, Y.; Hao, Y. Shed Parameters Optimization of Composite Post Insulators for UHVDC Flashover Voltages at High Altitudes. IEEE Trans. Dielectr. Electr. Insul. 2015, 22, 169–176. [Google Scholar] [CrossRef]
- Zhang, Z.; Zhang, D.; You, J.; Zhao, J.; Jiang, X. Study on the DC Flashover Performance of Various Types of Insulators With Fan-shaped Non-uniform Pollution. IEEE Trans. Power Deliv. 2015, 30, 1871–1879. [Google Scholar] [CrossRef]
- Abbasi, A.; Shayegani, A.; Niayesh, K. Contribution of Design Parameters of SiR Insulators to Their DC Pollution Flashover Performance. IEEE Trans. Power Deliv. 2014, 29, 1814–1821. [Google Scholar] [CrossRef]
- Boudissa, R.; Bayadi, A.; Baersch, R. Effect of Pollution Distribution Class on Insulators Flashover under AC Voltage. Electr. Power Syst. Res. 2013, 104, 176–182. [Google Scholar] [CrossRef]
- Yang, L.; Hao, Y.; Li, L.; Zhao, Y. Comparison of Pollution Flashover Performance of Porcelain Long Rod, Disc Type and composite UHVDC Insulators at High Altitudes. IEEE Trans. Dielectr. Electr. Insul. 2012, 19, 1053–1059. [Google Scholar] [CrossRef]
- Wieczoreck, K.; Fleszynski, J.; Bretuj, W. Effect of Shape of Insulator Housings and Positions of Composite Insulators on Ageing Resistance Under High Voltage and Precipitation. IEEE Trans. Dielectr. Electr. Insul. 2012, 19, 1044–1052. [Google Scholar] [CrossRef]
- Bo, L.; Gorur, R.S. Modeling Flashover of AC Outdoor Insulators under Contaminated Conditions with Dry Band Formation and Arcing. IEEE Trans. Dielectr. Electr. Insul. 2012, 19, 1037–1043. [Google Scholar] [CrossRef]
- Aydogmus, Z.; Cebeci, M. A New Flashover Dynamic Model of Polluted HV Insulators. IEEE Trans. Dielectr. Electr. Insul. 2004, 11, 577–584. [Google Scholar] [CrossRef]
- Baer, C.; Baersch, R.; Hergert, A.; Kindersberger, J. Evaluation of the Retention and Recovery of the hydrophobicity of Insulating Materials in High Voltage Outdoor Applications under AC and DC Stresses With the Dynamic Drop Test. IEEE Trans. Dielectr. Electr. Insul. 2015, 23, 294–303. [Google Scholar] [CrossRef]
- Ghunem, R.; Ghunem, A. Using the Inclined-Plane Test to Evaluate the Resistance of Outdoor Polymer Insulating Materials to Electrical Tracking and Erosion. IEEE Electr. Insul. Mater. 2015, 31, 16–22. [Google Scholar] [CrossRef]
- Cherney, E.A.; Gorur, R.S.; Krivda, A.; Jayaram, S.H.; Rowland, S.M.; Li, S.; Marzinotto, M.; Ghunem, R.A.; Ramirez, I. DC inclined-plane tracking and erosion test of insulating materials. IEEE Trans. Dielectr. Electr. Insul. 2015, 22, 211–217. [Google Scholar] [CrossRef]
- Chandrasekar, S.; Sarathi, R.; Danikas, M.G. Analysis of surface degradation of silicone rubber insulation due to tracking under different voltage profiles. Electr. Eng. 2007, 89, 489–501. [Google Scholar] [CrossRef]
- Liu, Y.; Du, B.X.; Farzaneh, M. Characteristics of Induced Discharge on a Polymer Insulator Surface under Electro-wetting Conditions. IEEE Trans. Dielectr. Electr. Insul. 2015, 22, 2958–2967. [Google Scholar] [CrossRef]
- Boudissa, R.; Belhoul, T.; Haim, K.D.; Kornhuber, S. Effect of Inclination Angle of Hydrophobic Silicone Insulation Covered by Water Drops on its DC Performance. IEEE Trans. Dielectr. Electr. Insul. 2017, 24, 2890–2900. [Google Scholar] [CrossRef]
- De La O, A.; Gorur, R.S. Flashover of Contaminated Nonceramic Outdoor Insulators in a Wet Atmosphere. IEEE Trans. Dielectr. Electr. Insul. 1998, 5, 814–823. [Google Scholar] [CrossRef]
- Braunsberger, T.; Kurrat, M. Cyclic Water Drop Corona on silicone Rubber Samples. In Proceedings of the 15th International Symposium on High Voltage Engineering, University of Ljublijana, Elktroinstitut Milan Widmar, Ljublijana, Slovenia, 27–31 August 2007; pp. 33–34. [Google Scholar]
- Slimani, S.; Bouatia, N.; Belhoul, T.; Boudissa, R.; Kornhuber, S.; Haim, K.D. Effet de l’angle d’inclinaison sur le nombre et le volume des gouttes d´eau résiduelles recouvrant la surface d´une isolation en silicone mise hors ou sous tension alternative. In Proceedings of the 11th Conference of French Society of Electrostatics, Grenoble, France, 29–31 August 2018. [Google Scholar]
Figure 1.
Features and support of single-shed silicone insulators.

Figure 2.
Zigzag arrangement of water drops on an insulation and set of electrodes allowing water evacuation or retention in their vicinity.
Figure 2.
Zigzag arrangement of water drops on an insulation and set of electrodes allowing water evacuation or retention in their vicinity.

Figure 3.
Insulation support with movable upper armature with an angle of inclination compared to the horizontal one varying between 0° and 90°.
Figure 3.
Insulation support with movable upper armature with an angle of inclination compared to the horizontal one varying between 0° and 90°.
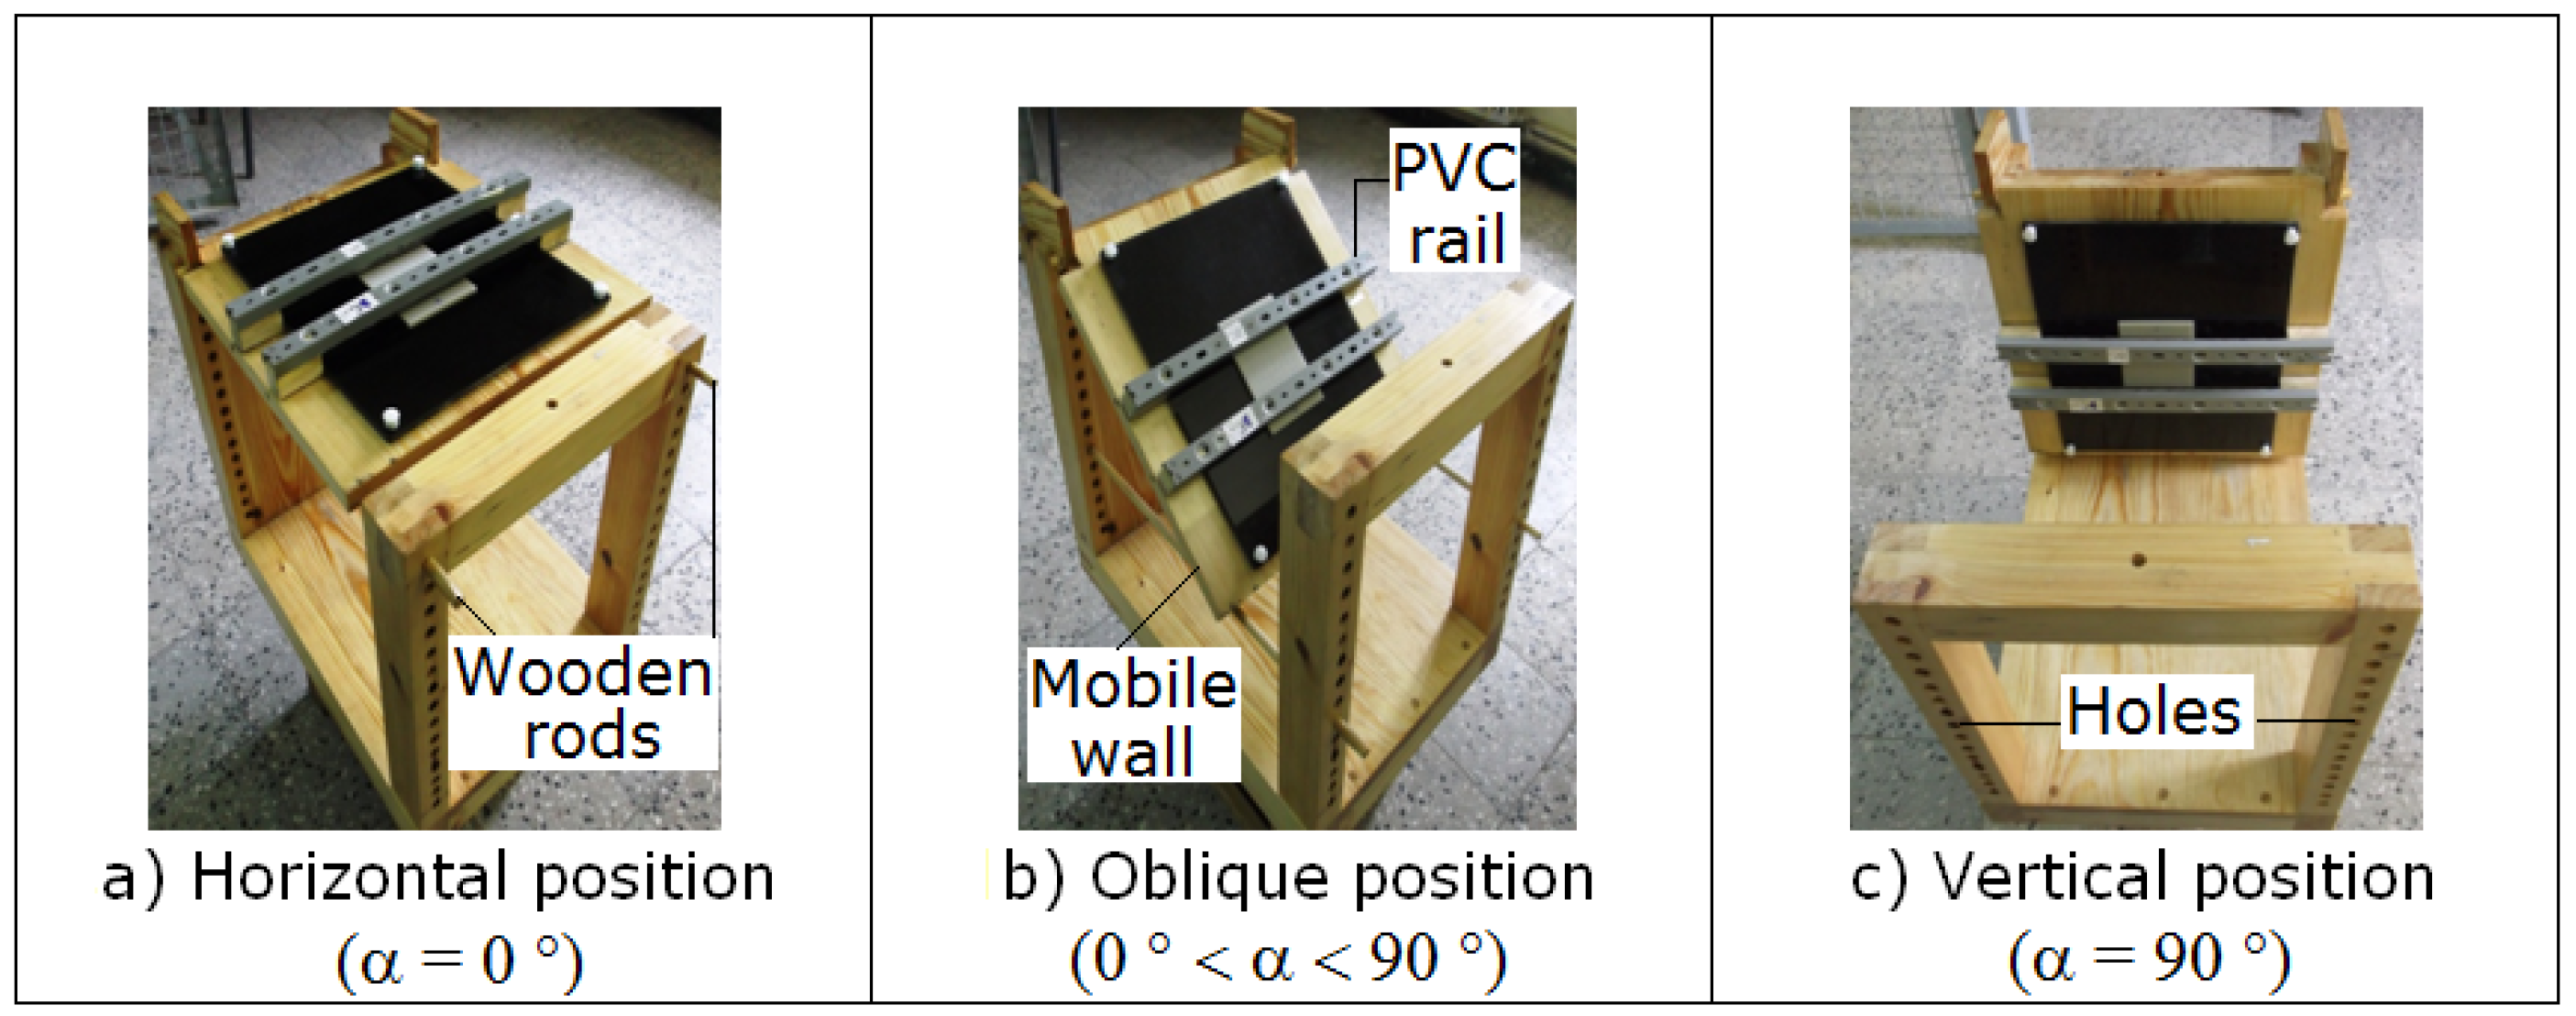
Figure 4.
Insulation flashover voltage measurement diagram with water drops and of the visualization of the electrical discharge evolving on its surface (Tr: Transformer, Ac: Device of automatic or manual control of the voltage applied to the isolation, Is: Silicone insulation, Cam: Fast camera, Pc: Computer screen, 1: DC+ output and 2: DC− output).
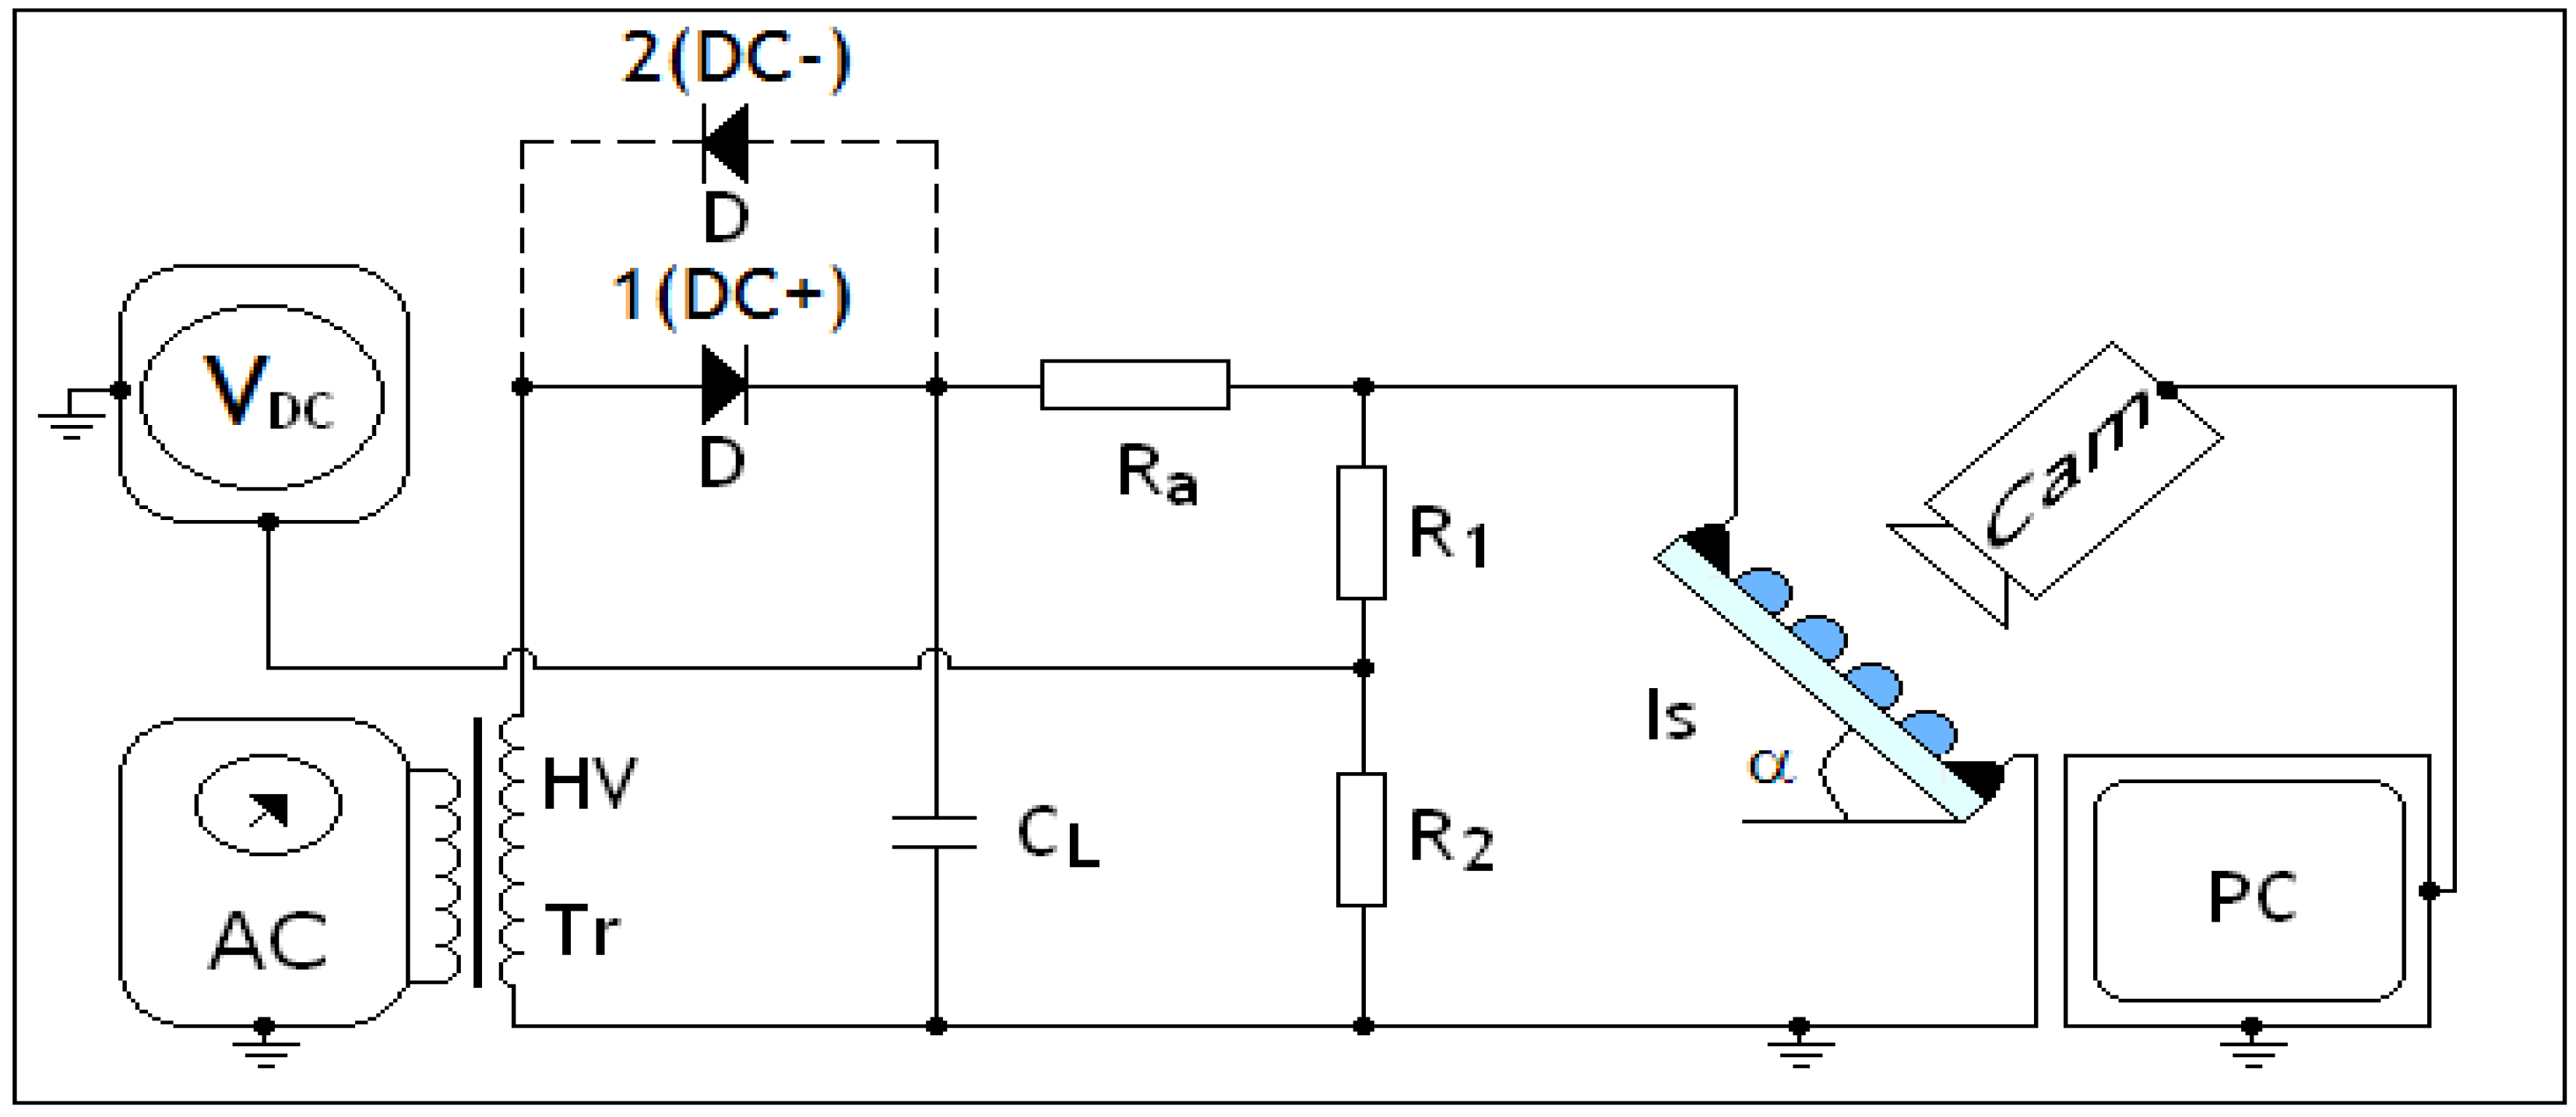
Figure 5.
Volume of water formed per cm2 over a sector as a function of the exposure time of samples under condensation (Nc: Natural condensation. Ac: Artificial condensation).
Figure 5.
Volume of water formed per cm2 over a sector as a function of the exposure time of samples under condensation (Nc: Natural condensation. Ac: Artificial condensation).
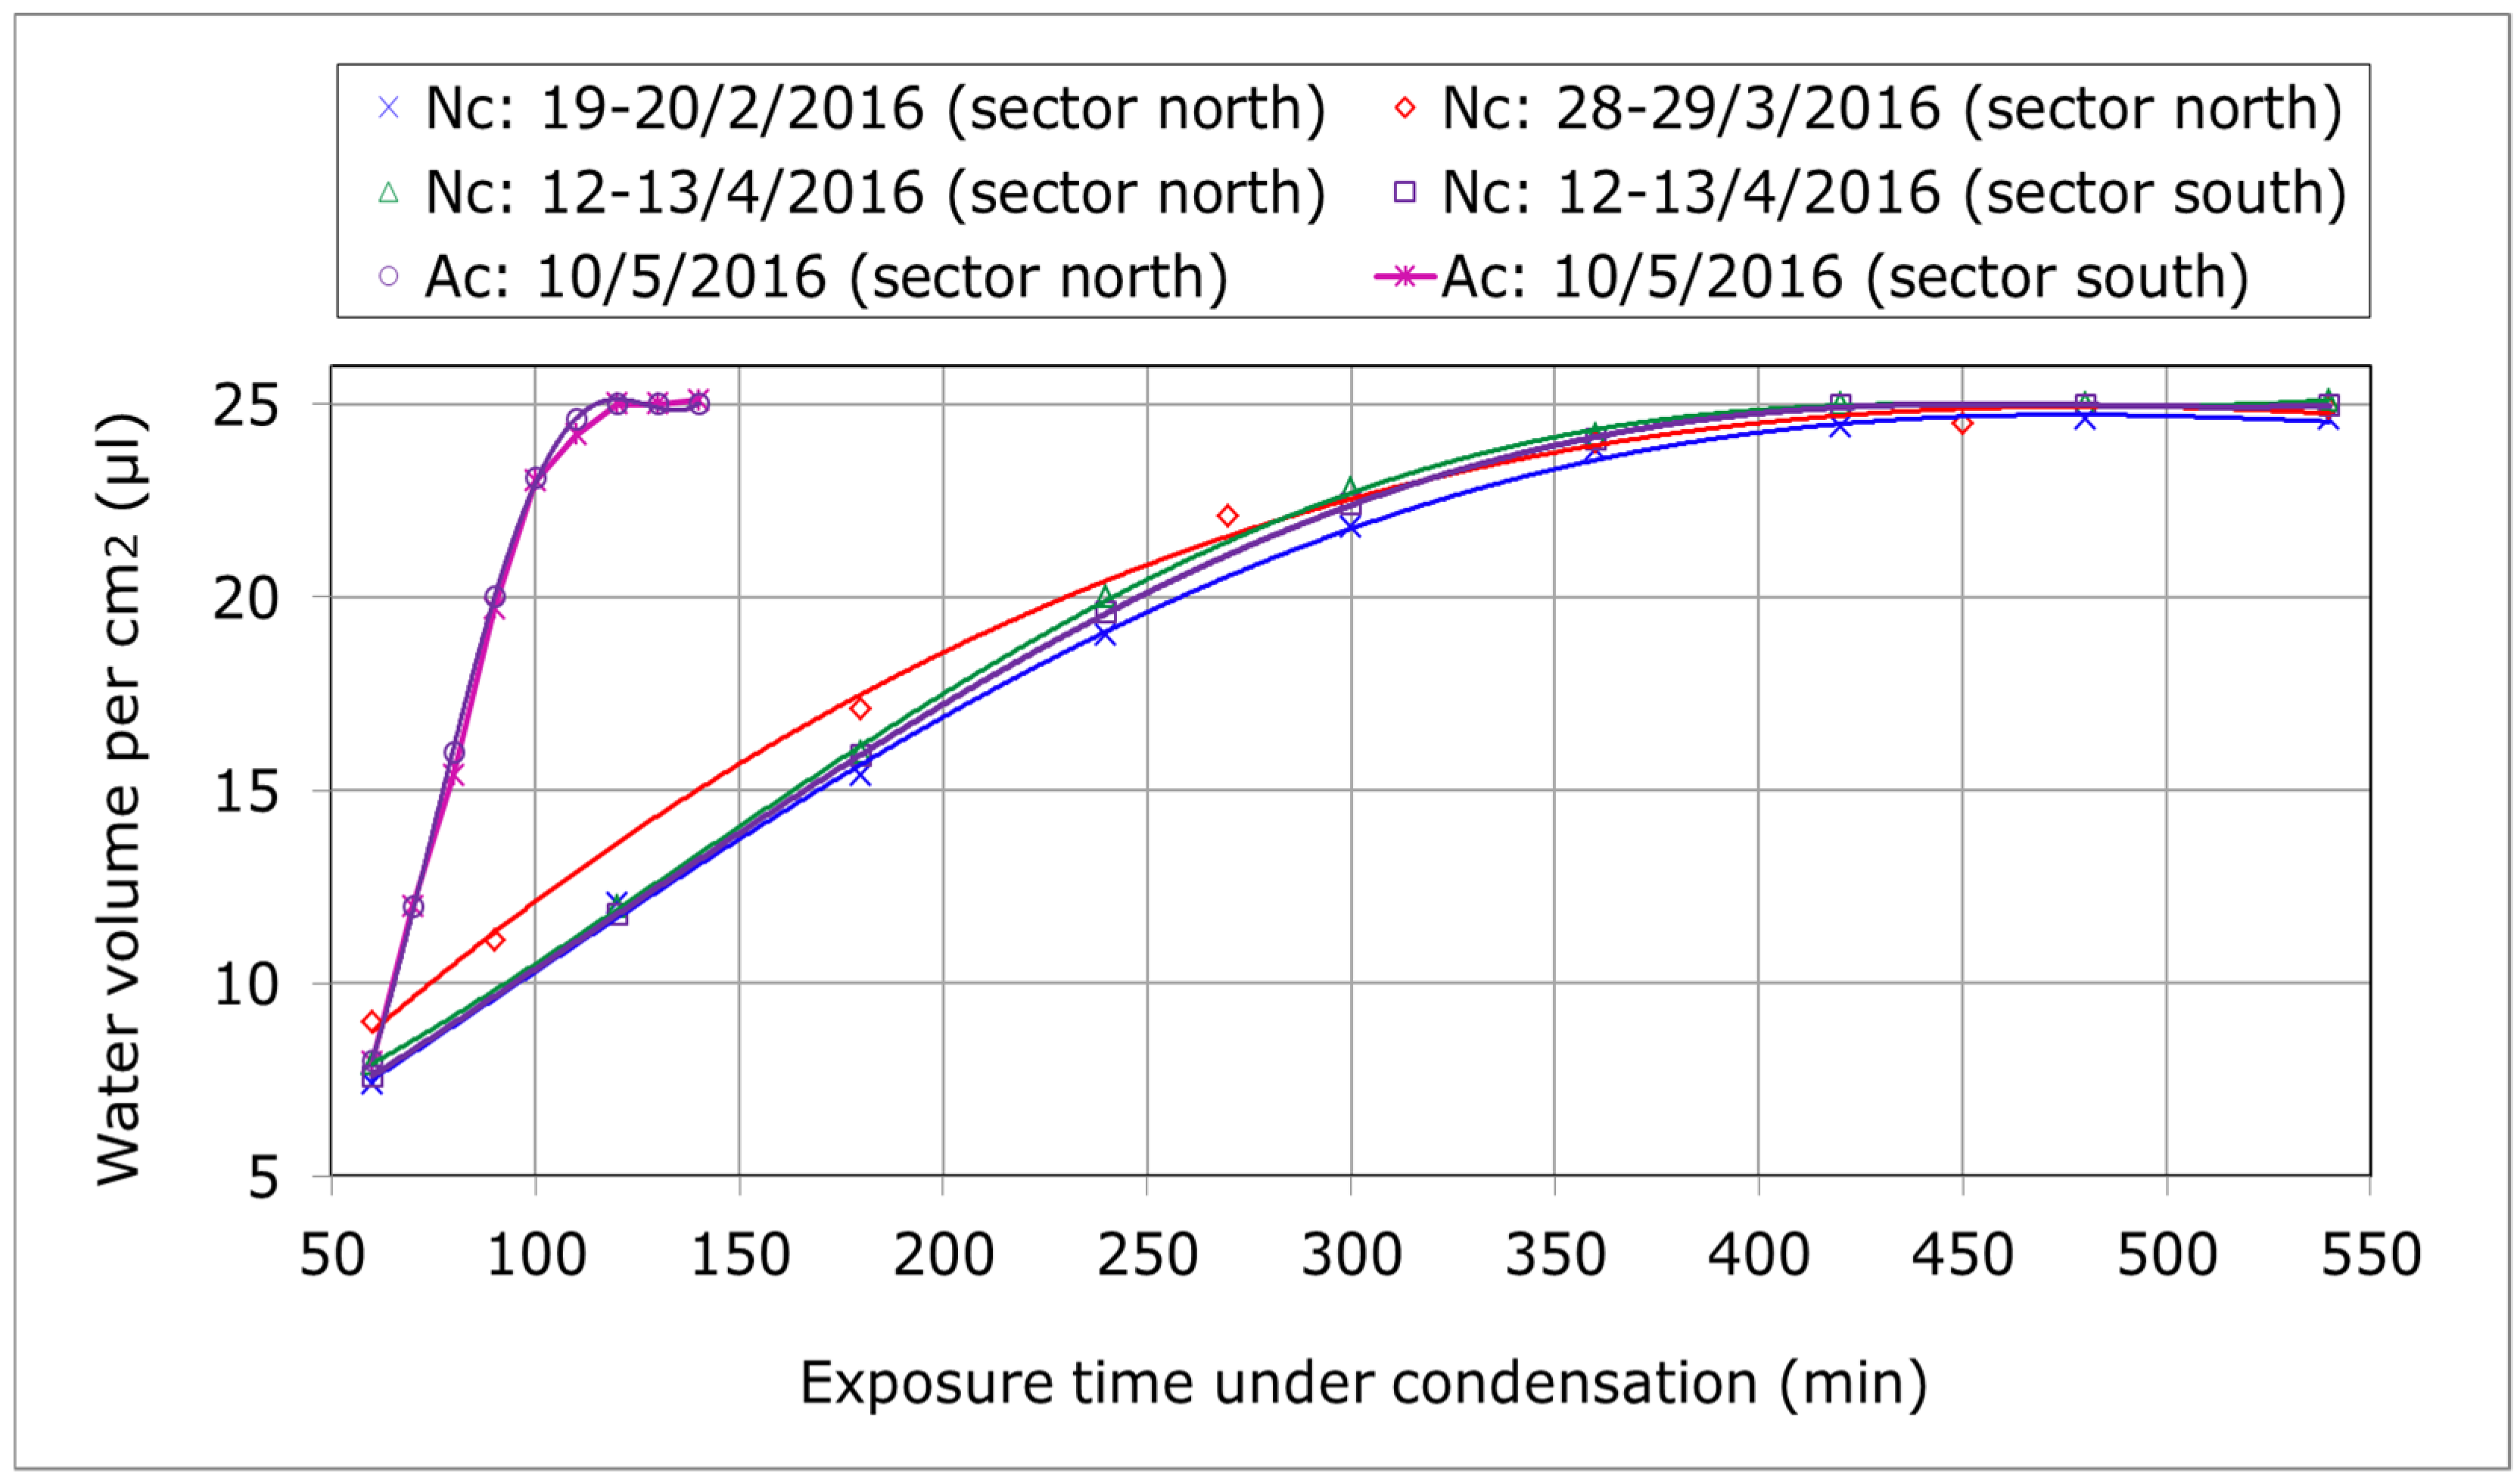
Figure 6.
Number of water droplets formed per cm2 over a sector as a function of the exposure time of samples under condensation (Nc: Natural condensation. Ac: Artificial condensation).
Figure 6.
Number of water droplets formed per cm2 over a sector as a function of the exposure time of samples under condensation (Nc: Natural condensation. Ac: Artificial condensation).

Figure 7.
Comparison of the number of water drops formed on the same surface of 1 cm2 after 60 min (at start-up) and 480 min (at saturation) of exposure of the sample under natural condensation. (a) Number of water drops per cm2 after 60 min of exposure. (b) Number of water drops per cm2 after 480 minutes of exposure.

Figure 8.
Volume of water collected per cm2 over an insulation sector as a function of the exposure time of samples under natural rainfall.
Figure 8.
Volume of water collected per cm2 over an insulation sector as a function of the exposure time of samples under natural rainfall.

Figure 9.
Constellation of drops of natural rainwater on the surface of insulation after a given period of its exposure. (a) Constellation of raindrops after 110 min of exposure (period: 6 March 2016, intensity: 3 L/m2), (b) Constellation of raindrops after 80 min of exposure (period: 10 March 2016, intensity: 2.7 L/m2), (c) Constellation of raindrops after 110 min of exposure (period: 11 March 2016, intensity: 2 L/m2.
Figure 10.
UDC = f (Nr) a silicone insulation covered with water drops (α = 0°, Vd = 45 µL, σv = 200 µS/cm, Lc = 60 mm, Ldd = Ldh = Ld t = 8.6 mm, and lrr = 10 mm).
Figure 10.
UDC = f (Nr) a silicone insulation covered with water drops (α = 0°, Vd = 45 µL, σv = 200 µS/cm, Lc = 60 mm, Ldd = Ldh = Ld t = 8.6 mm, and lrr = 10 mm).

Figure 11.
Path taken by the flashover discharge according to the volume of the water droplets (Lc = 60 mm, Ldd = Ldh = Ldt = 8.6 mm and lrr = 10 mm, α = 0°, Nr = 5, Vd = 45 µL, and σv = 200 µS/cm).
Figure 11.
Path taken by the flashover discharge according to the volume of the water droplets (Lc = 60 mm, Ldd = Ldh = Ldt = 8.6 mm and lrr = 10 mm, α = 0°, Nr = 5, Vd = 45 µL, and σv = 200 µS/cm).

Figure 12.
UDC+ = f (α) of a silicone insulation covered with water droplets at a volume of 30 μL ≤ Vd ≤ 90 μL (5 × 6 water drops in zigzag, σv = 200 µS/cm, Lc = 60 mm, and Ldd = Ldh = Ldt = 8.6 mm et lrr = 10 mm).
Figure 12.
UDC+ = f (α) of a silicone insulation covered with water droplets at a volume of 30 μL ≤ Vd ≤ 90 μL (5 × 6 water drops in zigzag, σv = 200 µS/cm, Lc = 60 mm, and Ldd = Ldh = Ldt = 8.6 mm et lrr = 10 mm).

Figure 13.
UDC− = f (α) of a silicone insulation covered with water droplets with a volume of 30 µL ≤ Vd ≤ 90 µL (5 × 6 water drops in zigzag, σv = 200 µS/cm, Lc = 60 mm, Ldd = Ldh = Ldt = 8.6 mm, and lrr = 10 mm).
Figure 13.
UDC− = f (α) of a silicone insulation covered with water droplets with a volume of 30 µL ≤ Vd ≤ 90 µL (5 × 6 water drops in zigzag, σv = 200 µS/cm, Lc = 60 mm, Ldd = Ldh = Ldt = 8.6 mm, and lrr = 10 mm).

Figure 14.
UDC+ = f (α) of insulation with or without water retention in the vicinity of the ground electrode (5 × 6 water droplets in zigzag, σv = 200 µS/cm, Lc = 60 mm, Ldd = Ldh = Ldt = 8.6 mm, and lrr = 10 mm).
Figure 14.
UDC+ = f (α) of insulation with or without water retention in the vicinity of the ground electrode (5 × 6 water droplets in zigzag, σv = 200 µS/cm, Lc = 60 mm, Ldd = Ldh = Ldt = 8.6 mm, and lrr = 10 mm).

Figure 15.
UDC− = f (α) of insulation with or without water retention in the vicinity of the ground electrode (5 × 6 water droplets in a zigzag, σv = 200 µS/cm, Lc = 60 mm, Ldd = Ldh = Ldt = 8.6 mm, and lrr = 10 mm).
Figure 15.
UDC− = f (α) of insulation with or without water retention in the vicinity of the ground electrode (5 × 6 water droplets in a zigzag, σv = 200 µS/cm, Lc = 60 mm, Ldd = Ldh = Ldt = 8.6 mm, and lrr = 10 mm).


Table 1.
Measured dielectric properties of tested silicone rubber.
| Parameter | εr | Tanδ | ρv (Ωm) | Rs (Ω) |
|---|---|---|---|---|
| Value | 3.2 | 0.11 | 6.8 × 10¹¹ | 4 × 10¹⁰ |
© 2019 by the authors. Licensee MDPI, Basel, Switzerland. This article is an open access article distributed under the terms and conditions of the Creative Commons Attribution (CC BY) license (http://creativecommons.org/licenses/by/4.0/).
Share and Cite
MDPI and ACS Style
Boudissa, R.; Bouchelga, F.; Kornhuber, S.; Haim, K.D. Constellation of Condensation and Raindrops and Its Effect on the DC Flashover Voltage of Inclined Silicone Insulation. Energies 2019, 12, 3549. https://doi.org/10.3390/en12183549
AMA Style
Boudissa R, Bouchelga F, Kornhuber S, Haim KD. Constellation of Condensation and Raindrops and Its Effect on the DC Flashover Voltage of Inclined Silicone Insulation. Energies. 2019; 12(18):3549. https://doi.org/10.3390/en12183549
Chicago/Turabian StyleBoudissa, Rabah, Fatma Bouchelga, Stefan Kornhuber, and Klaus Dieter Haim. 2019. "Constellation of Condensation and Raindrops and Its Effect on the DC Flashover Voltage of Inclined Silicone Insulation" Energies 12, no. 18: 3549. https://doi.org/10.3390/en12183549
Note that from the first issue of 2016, this journal uses article numbers instead of page numbers. See further details here.