A Feedback Control Loop Optimisation Methodology for Floating Offshore Wind Turbines
by
 , ,
, ,
Joannes Olondriz
1,* ,
,
Josu Jugo
2,
Iker Elorza
1 and
Santiago Alonso-Quesada and Aron Pujana-Arrese
2,1 1
Ikerlan Technology Research Centre, Control and Monitoring Area. P∘. J. M. Arizmendiarrieta 2, 20500 Arrasate-Mondragón, Spain
2
University of the Basque Country UPV/EHU, Electricity and Electronics Area. Bo. Sarriena s/n, 48940 Leioa, Spain
*
Author to whom correspondence should be addressed.
Energies 2019, 12(18), 3490; https://doi.org/10.3390/en12183490
Submission received: 1 July 2019
/
Revised: 30 August 2019
/
Accepted: 6 September 2019
/
Published: 10 September 2019
(This article belongs to the Special Issue Optimal Control of Hybrid Systems and Renewable Energies)
Abstract
:Wind turbines usually present several feedback control loops to improve or counteract some specific performance or behaviour of the system. It is common to find these multiple feedback control loops in Floating Offshore Wind Turbines where the system perferformance is highly influenced by the platform dynamics. This is the case of the Aerodynamic Platform Stabiliser and Wave Rejection feedback control loops which are complementaries to the conventional generator speed PI control loop when it is working in an above rated wind speed region. The multiple feedback control loops sometimes can be tedious to manually improve the initial tuning. Therefore, this article presents a novel optimisation methodology based on the Monte Carlo method to automatically improve the manually tuned multiple feedback control loops. Damage Equivalent Loads are quantified for minimising the cost function and automatically update the control parameters. The preliminary results presented here show the potential of this novel optimisation methodology to improve the mechanical fatigue loads of the desired components whereas maintaining the overall performance of the wind turbine system. This methodology provides a good balance between the computational complexity and result effectiveness. The study is carried out with the fully coupled non-linear NREL 5-MW wind turbine model mounted on the ITI Energy’s barge and the FASTv8 code.
1. Introduction
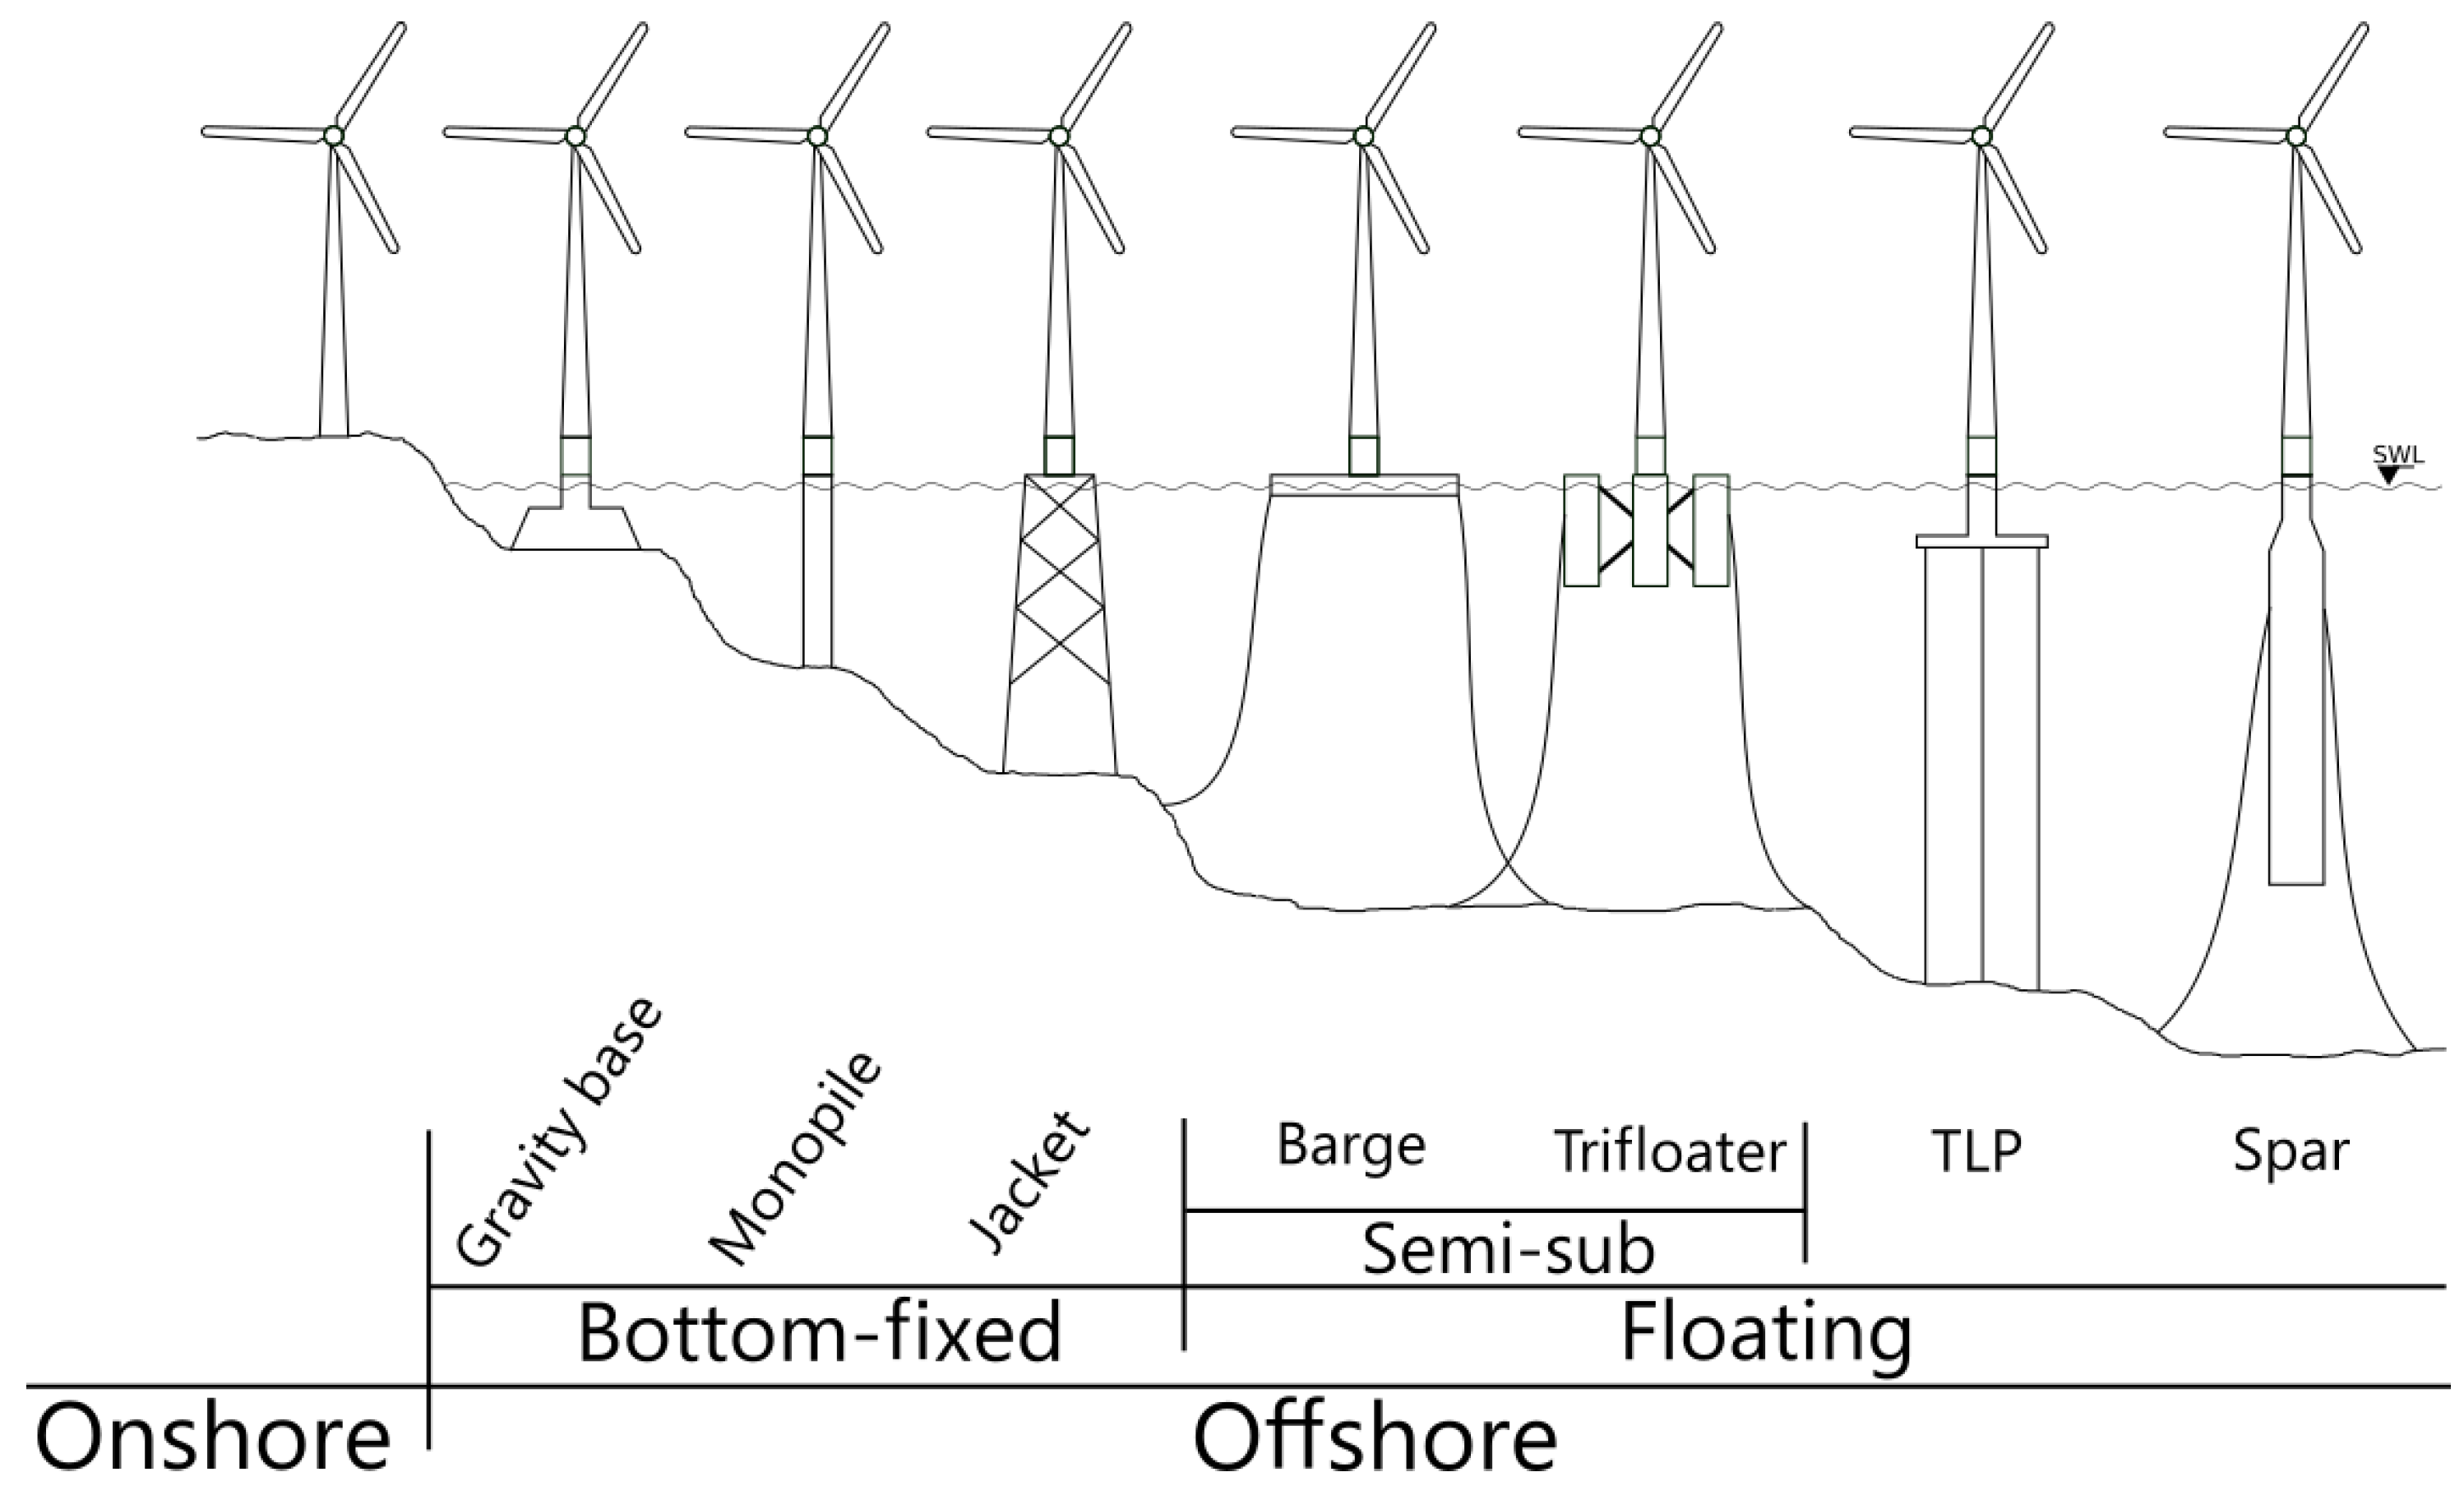
Wind energy is becoming a real green energy solution to reduce the exhaust gases produced by the fossil fuel of conventional energy production plants. Actually, wind energy can be harvested in offshore water areas thanks to the bottom fixed and Floating Offshore Wind Turbine (FOWT) technologies (see Figure 1), providing many advantages in comparison to its onshore counterpart [1]. The available amount of offshore wind energy is enough to supply most of the worldwide energetic needs (https://carnegiescience.edu/node/2248, last accessed: 12 June 2019). The bottom fixed technology presents the limitation of being installed in water depths less than 30–40 m [2]. This limitation significantly reduces the available offshore areas worldwide for the installation of bottom-fixed wind turbines. Thus, the alternative solution to overcome this limitation is to mount the wind turbines on floating platforms, i.e., the FOWTs.
Several FOWT prototypes have been launched since the first Blue H in 2007, such as Hywind, WindFloat, SWAY, VolturnUS, Kabashima, Mitsui, Shimpu, Hamakaze, Floatgen and Hibiki [3,4], among others. Furthermore, after the Hywind Scotland Pilot Park [5], several floating wind farms are now currently in the developing stage: Kincardine in Scotland [6], Windfloat Atlantic in Portugal [7], and four more in France (Groix Belle Ile, Golfe du Lion, Eolmed, and Provence Grand Large). The growing trend in these sort of projects confirms the industry interest in the FOWT technology.
The FOWT technology is actually in the development stage and not yet mature; this means that there are many different floating platform designs, each one holding its strengths and weaknesses [3]. All these platform designs can be classified into three main groups, i.e., Spar-buoys (Spar), Tension Leg Platforms (TLP) and Semi-submersible platforms (Semi-sub), as can be seen in Figure 1. These different designs considerably differ in terms of building processes as well as in performance characteristics. In general, platforms with larger hydrostatic restoring stiffness and hydrodynamic damping cost more to build, mount and deploy, whereas less stable platforms can affect to the FOWT’s performance [8]. In this sense, the control strategy implemented for above rated wind speed (Region III) in FOWTs is somehow conditioned by the platform design and performance. On the one hand, controllers implemented in platforms with high hydrodynamic stiffness can focus their duties on improving and optimising the overall system performance and reducing the mechanical loads of the components. On the other hand, controllers implemented in platforms with low hydrodynamic stiffness should mainly ensure the stability of the system due to the negative platform damping effect [9], and then, improve the performance of the system as much as possible without destabilising the system.
Several optimal controllers have been used to achieve improved behaviour in FOWT systems according to the platform technology. The Model Predictive Control (MPC) is mainly used for Spa- type platform-mounted wind turbines as found in [10,11], among others, or for hybrid Spar platform such as the concrete torus [12], although one study for the Barge type platform is also found [13]. Similarly, the optimal Linear Quadratic Regulator (LQR) controller is widely used in Spar-type FOWT models as found in [14,15] or [16], among others, but some researches for TLP [17,18] and Barge [19,20] floating technologies are also found. Finally, the H is used for the Spar and TLP type FOWT systems, but not for Semi-sub ones, as found in [21,22] and in [23], respectively.
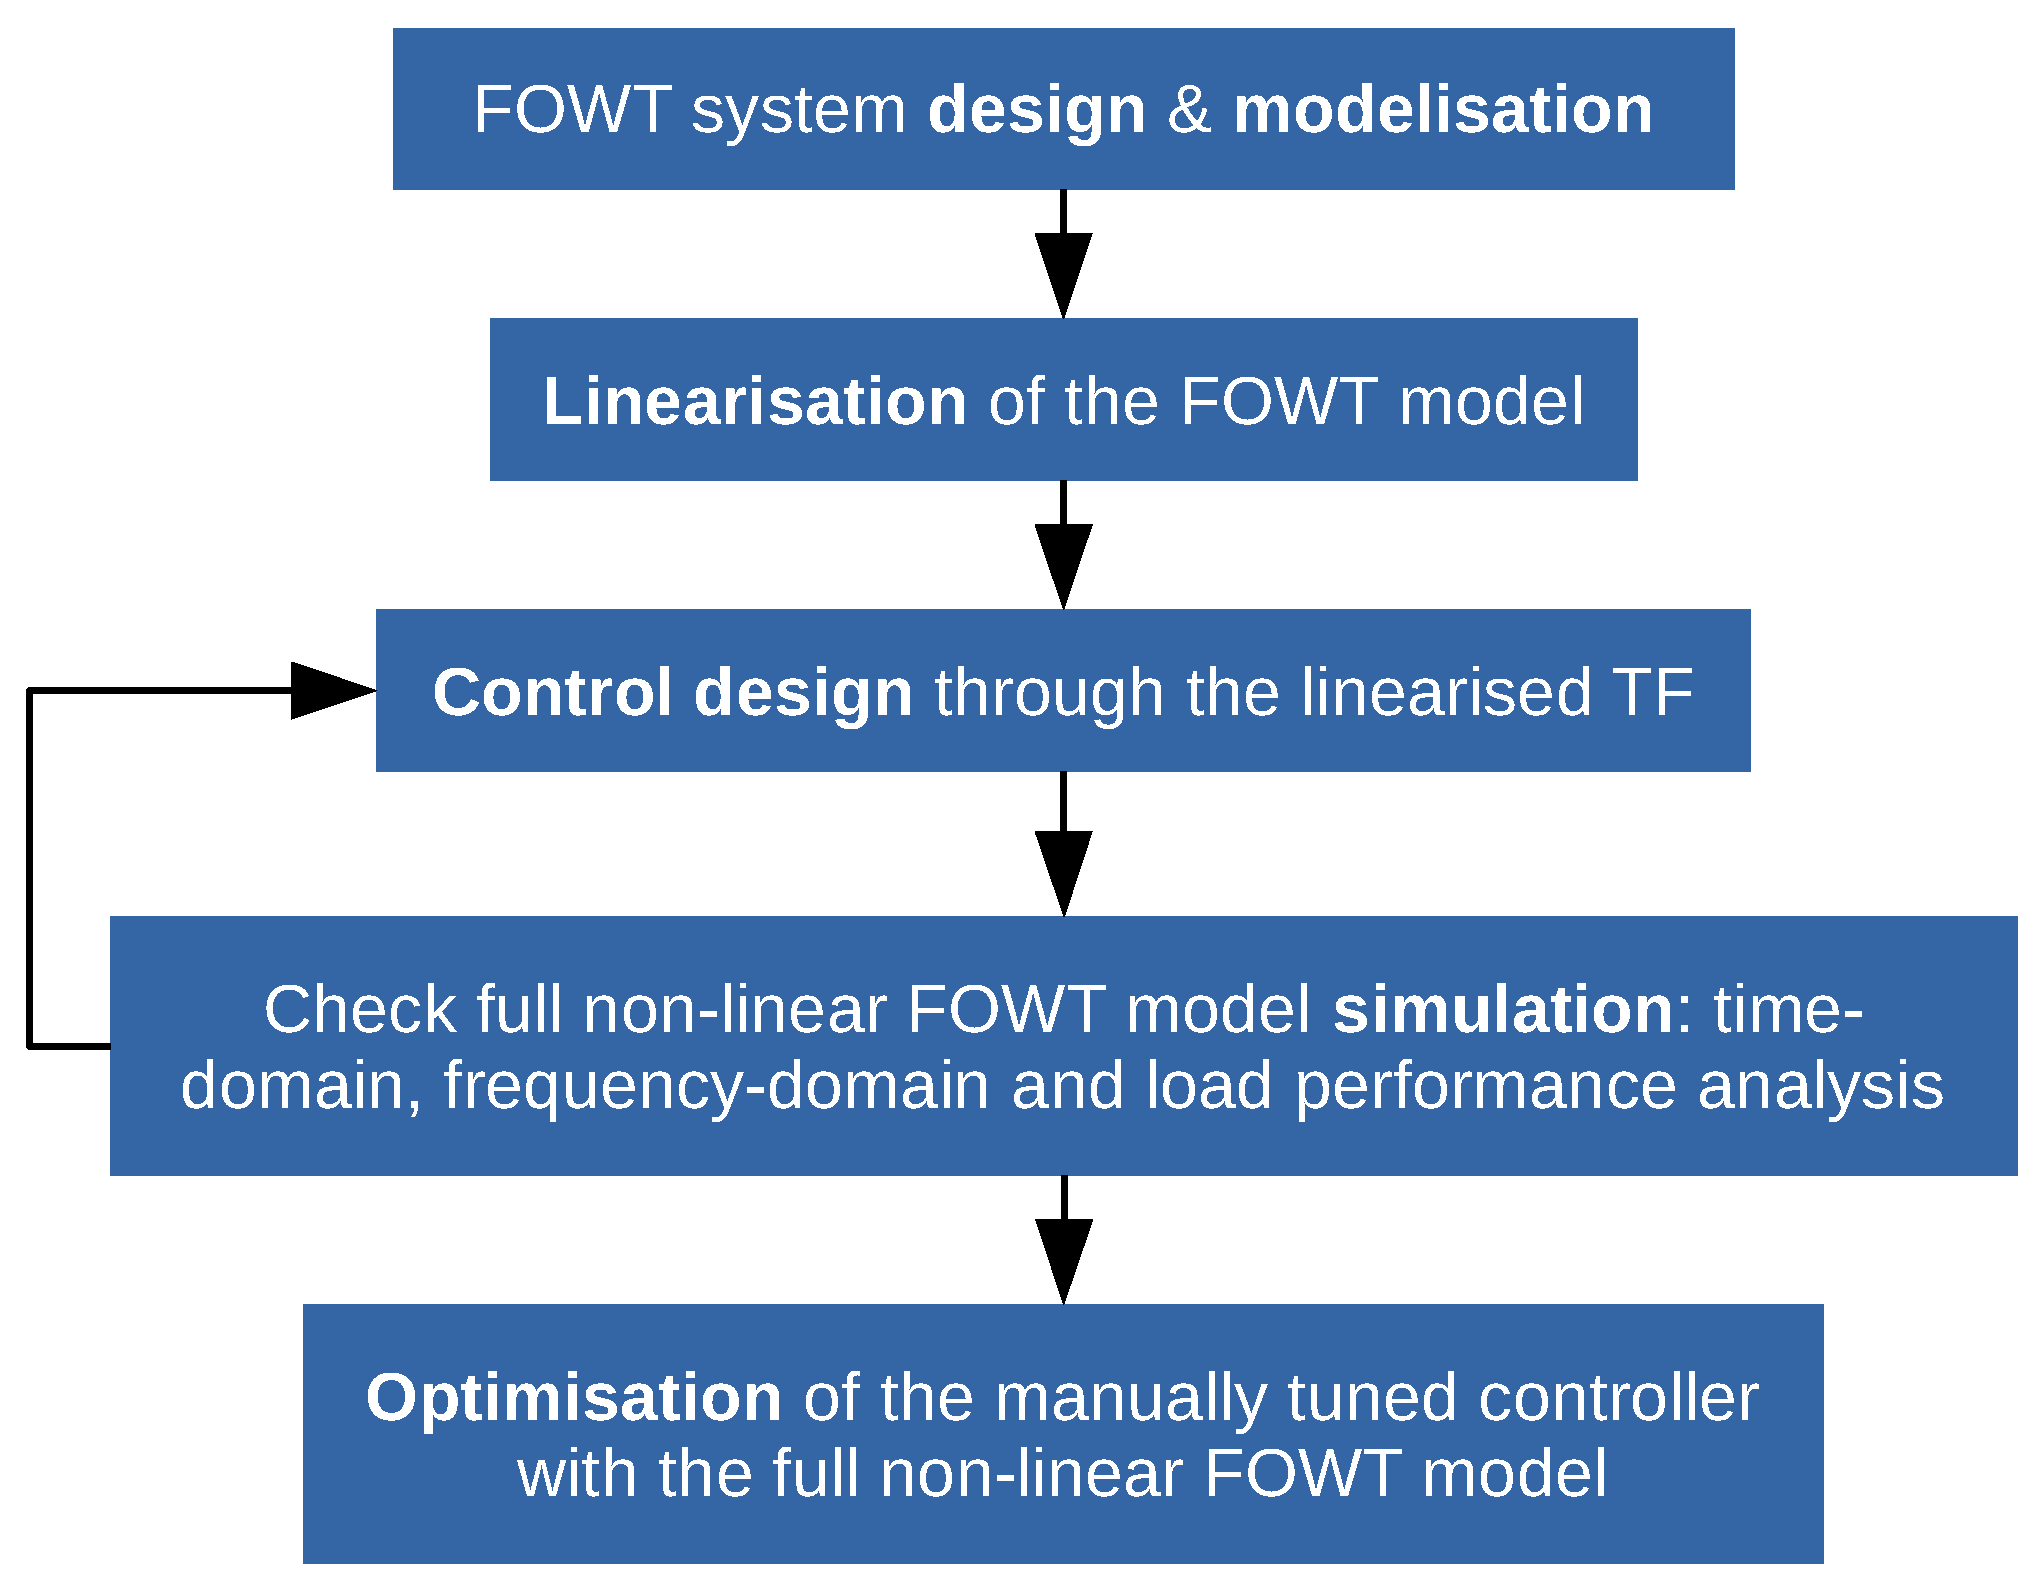
In practice, wind turbine manufacturers often favor simple controllers based on the Proportional and Integral (PI) feedback loops over more complex ones [24]. In previous studies, in combination with the conventional PI controller, the Aerodynamic Platform Stabiliser (APS) [25,26] and Wave Rejection (WR) [27] feedback control loops have been designed for above rated wind speed working region to reduce the platform-pitch motions, while improving the generator speed regulation and reducing the tower-base and blade-root loads of the NREL 5-MW wind turbine mounted on the ITI Energy barge. The APS control loop is designed to reduce the platform-pitch dynamics produced by the interactions of the conventional generator speed PI controller and platform dynamics while regulating the generator speed. Additionally, the WR control loop is designed to improve the APS control loop performance in rough sea states due to the excessive platform-pitch loads registered in some working conditions. The process followed to manually tune these control loops is: (1) the FOWT system is designed and modelled; (2) the FOWT model is linearised around the working points of interest; (3) the control loops are manually tuned through the loop shaping of the linearised transfer functions; and (4), if the designed control loops fulfil the time- and frequency-domains as well as the load performance analysis specifications, then (5) the manually tuned control loops can be optimised. This process is depicted by the flowchart in Figure 2.
Both designed APS and WR control loops include several control parameters, so it is tedious to improve the performance of the FOWT system by manual tuning. Such a fact motivates us to apply an optimisation methodology to automatically find the control parameters which will improve the system performance. The proposed optimisation methodology in this manuscript is based on the Monte Carlo method [28]. This method is especially appropriate for systems with significant uncertainties in inputs and large numbers of coupled degrees of freedom, such as the FOWTs. The novelty of this method ensures the minimisation of the cost function through the computation of the wind turbine DEL. The randomised algorithm is useful for numerically solving the optimisation problem through the simple random search of the control parameters around the best obtained solution. The random search is based on the arbitrary selection of the parameters within a constrained region. Although other optimisation methodologies can be found in the literature, e.g., gradient descent [29] or genetic [30] algorithms, the Monte Carlo method is numerically simpler to implement taking into account the complexity of the FOWT non-linear system and cost function characteristics. Furthermore, the random behaviour of this method prevents from getting stuck in a locally optimal point while providing a more global optimal solution.
In regards to the conclusions collected in [27], after the implementation of the WR control loop, the need to improve the tower-base DEL was summarised. Therefore, the optimisation methodology proposed in this study quantifies the DEL of the FOWT simulation results to improve the tower-base DELs automatically tuning the APS and WR control loops. All the simulations have been carried out with FASTv8 [31].
This paper is organised as follows. Section 2 provides an overview of the manually tuned APS and WR control loops processes. Section 3 describes the optimisation methodology used for automatically improving the manually tuned controllers. Section 4 presents the results obtained with the optimised APS and WR controllers in comparison to the manually tuned ones and, to the conventional generator speed Detuned PI controller performance taken from [32] as a reference. Finally, Section 5 summarises the conclusions achieved during the development of this work as well as recommendations for future work.
2. Manually Tuned Controllers
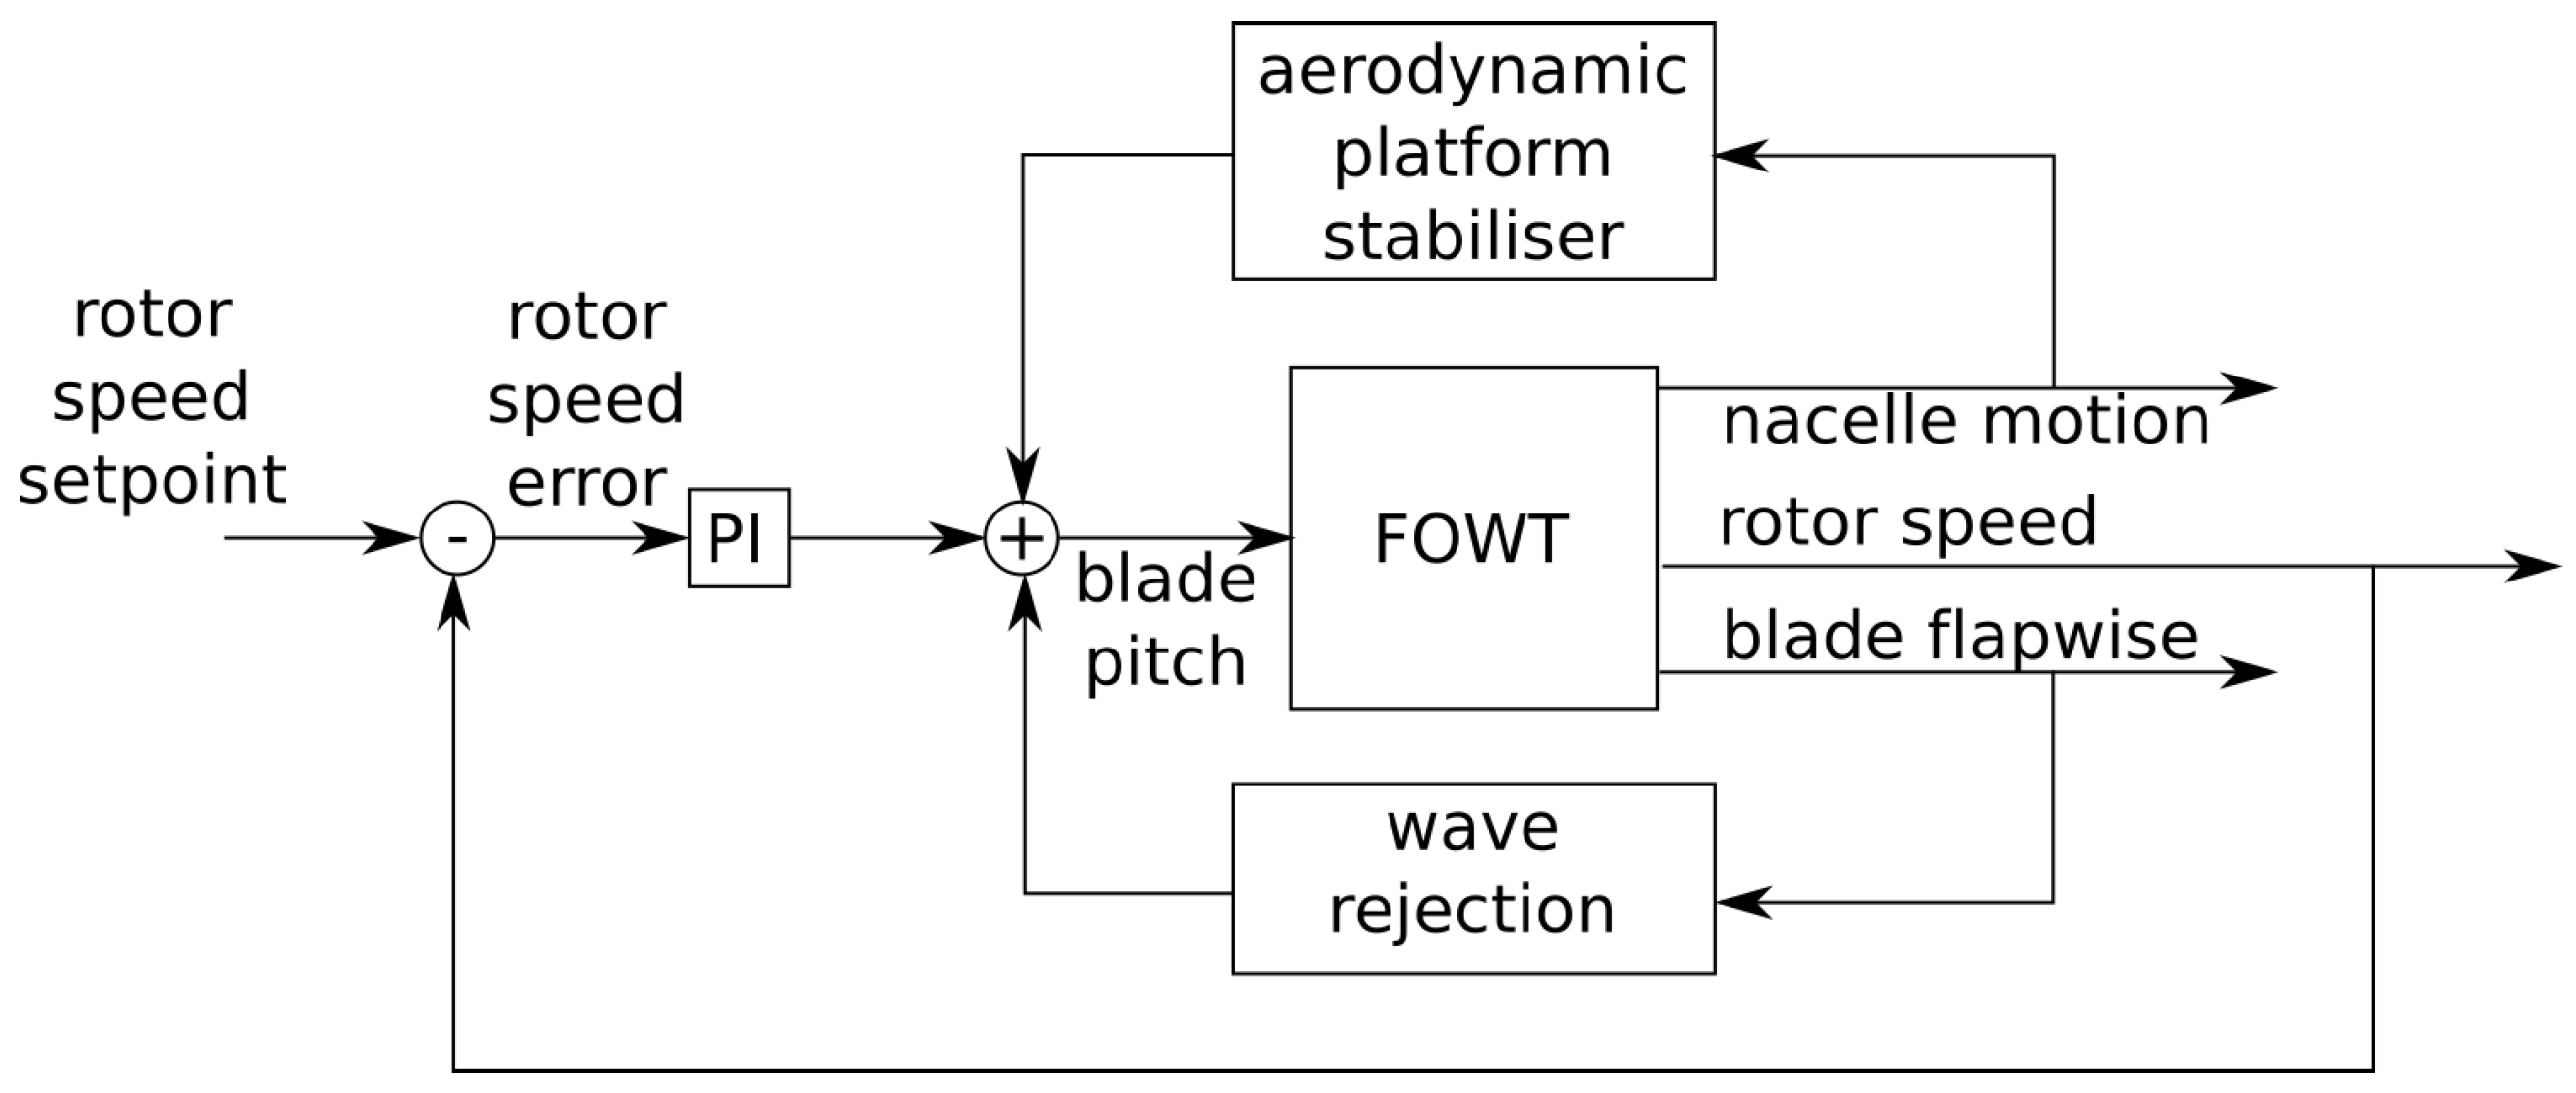
The APS and WR feedback control loops have been independently tuned: first, the APS is tuned to reduce the platform-pitch dynamics due to the coupling between the thrust in the rotor of the wind turbine and the low hydrodynamic stiffness of the platform while regulating the generator speed; and second, the WR is tuned to improve the APS control loop performance due to the excessive platform-pitch loads registered in some working conditions, concretely, in rough sea states. The APS control loop measures the nacelle-pitch angular velocity, e.g., through an Inertial Measurement Unit (IMU), and the WR measures the blade-flapwise moments, e.g., through strain gauges or optical fibre, both control loops contributing to the blade-pitch angle regulation as can be seen in Figure 3.
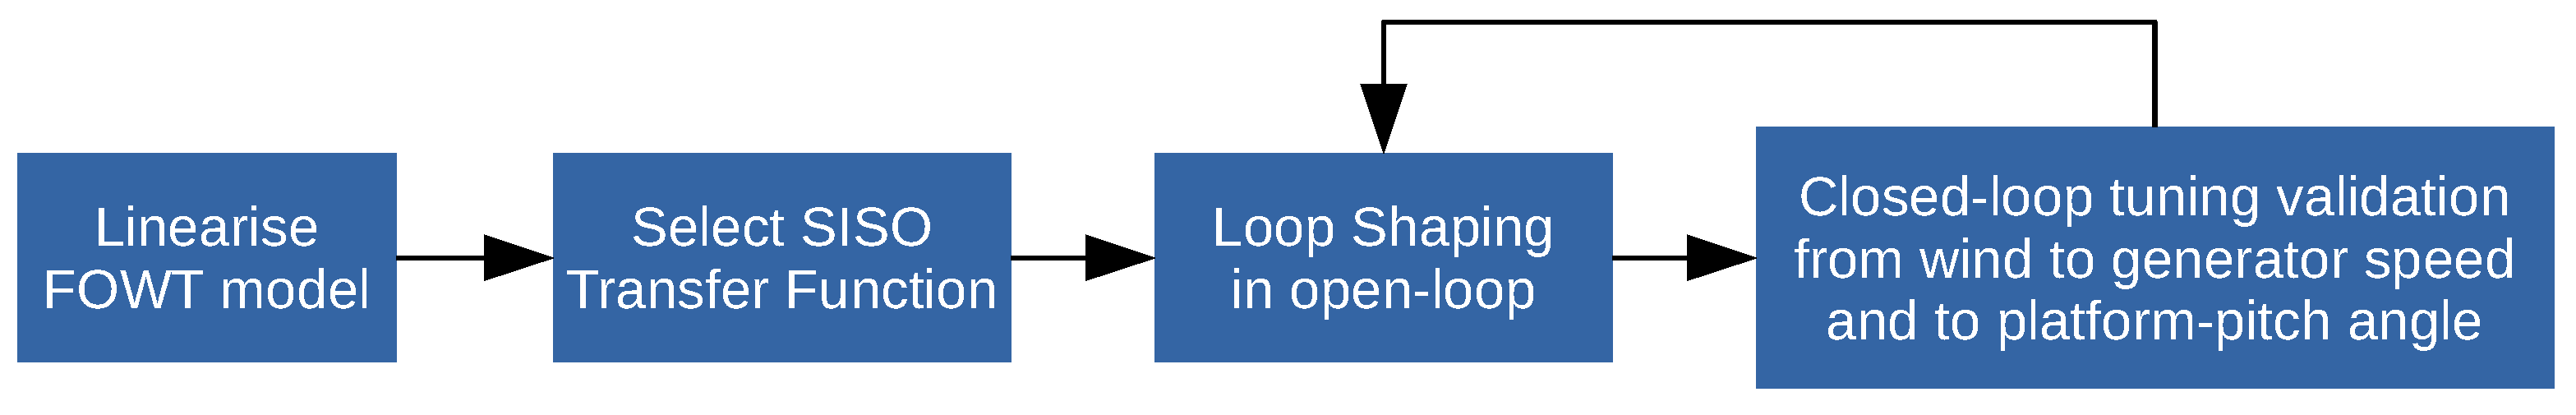
The APS and WR feedback control loops have been designed following the procedure of Figure 4. First, the FOWT model is linearised around certain above rated wind speeds, such as in this study, every 2 m/s from 13 to 25 m/s. Since the ITI Energy barge model presents very low hydrodynamic stiffness the linearisation process has been carried out with the alternative linearisation strategy of trimming the generator torque explained in [33]. Next, the Single Input Single Output (SISO) transfer functions for the tuning process are selected: for the APS control loop, the transfer function from the blade-pitch to the nacelle-pitch angular velocity; and for the WR, from the blade-pitch to the blade-flapwise bending moment. Then, the loop shaping of each control loop is done in open-loop configuration as explained in [26] for the APS, and in [27] for the WR. The last step includes the verification of the tuned control loops in a closed-loop configuration from wind to platform-pitch and to generator speed, as shown in [26] and [27], respectively.
Once each closed-loop transfer function response shows an acceptable behaviour, the sensitivity of the system and the Power Spectral Density (PSD) of the platform-pitch angle as well as the generator speed are analysed. The sensitivity of the system is to be reduced as much as possible while improving the PSDs results. In this study, the results of the reference Detuned PI controller [32] must be improved. If the requirements of lowering system sensitivity and improving the PSDs are not fulfilled, then the feedback control loop process is restarted, taking into the account the aspects that must be improved.
An additional strategy for switching both feedback control loops has been implemented to increase the effectiveness of each control loop duty as explained in [27]. The control loop switching strategy must deal with the on-line adjustment of each control loop weighting factor depending on the sea state to maximise its effectiveness.
After several retuning iterations, the manually tuned feedback control loops fulfil the FOWT performance requirements: the platform-pitch dynamics have been improved while regulating the generator speed, and the quality of the harvested electric energy is better than that of the reference Detuned PI controller; and, the blade-root-flapwise and -edgewise fatigue loads show a reduction below the reference in all sea state conditions. However, the tower-base-pitch loads are still above the reference in some rough sea state conditions. Since there are two feedback control loops with several parameters to be modified, an optimisation methodology has been implemented to automatically obtain the control parameters. The objective of this optimisation is to reduce the tower-base-pitch DELs, while maintaining the blade-root ones below the reference and keeping the performance of the overall system.
3. Optimisation Methodology
Optimal control deals with the problem of finding a control law to achieve the optimum system performance for a given criterion. The proposed optimisation methodology optimises the manually tuned feedback APS and WR controllers analysing the simulation results and automatically finding the optimal control parameters according to the defined cost function. Concretely, the cost function is based on the quantification of the DELs of the tower-base-pitch and blade-root results. The automatic finding of the control parameters is based on the random search strategy, which arbitrarily selects the control parameters of the APS and WR loops. The random search starts from the manually tuned parameters and the search range is limited within a set of constrains. The constrains are defined during the manually tuning process, where one can learn within which values the behaviour of the designed controller does not work as desired. The controller is improved every time the cost function is minimised, starting from the initial value obtained with the manually tuned controller results.
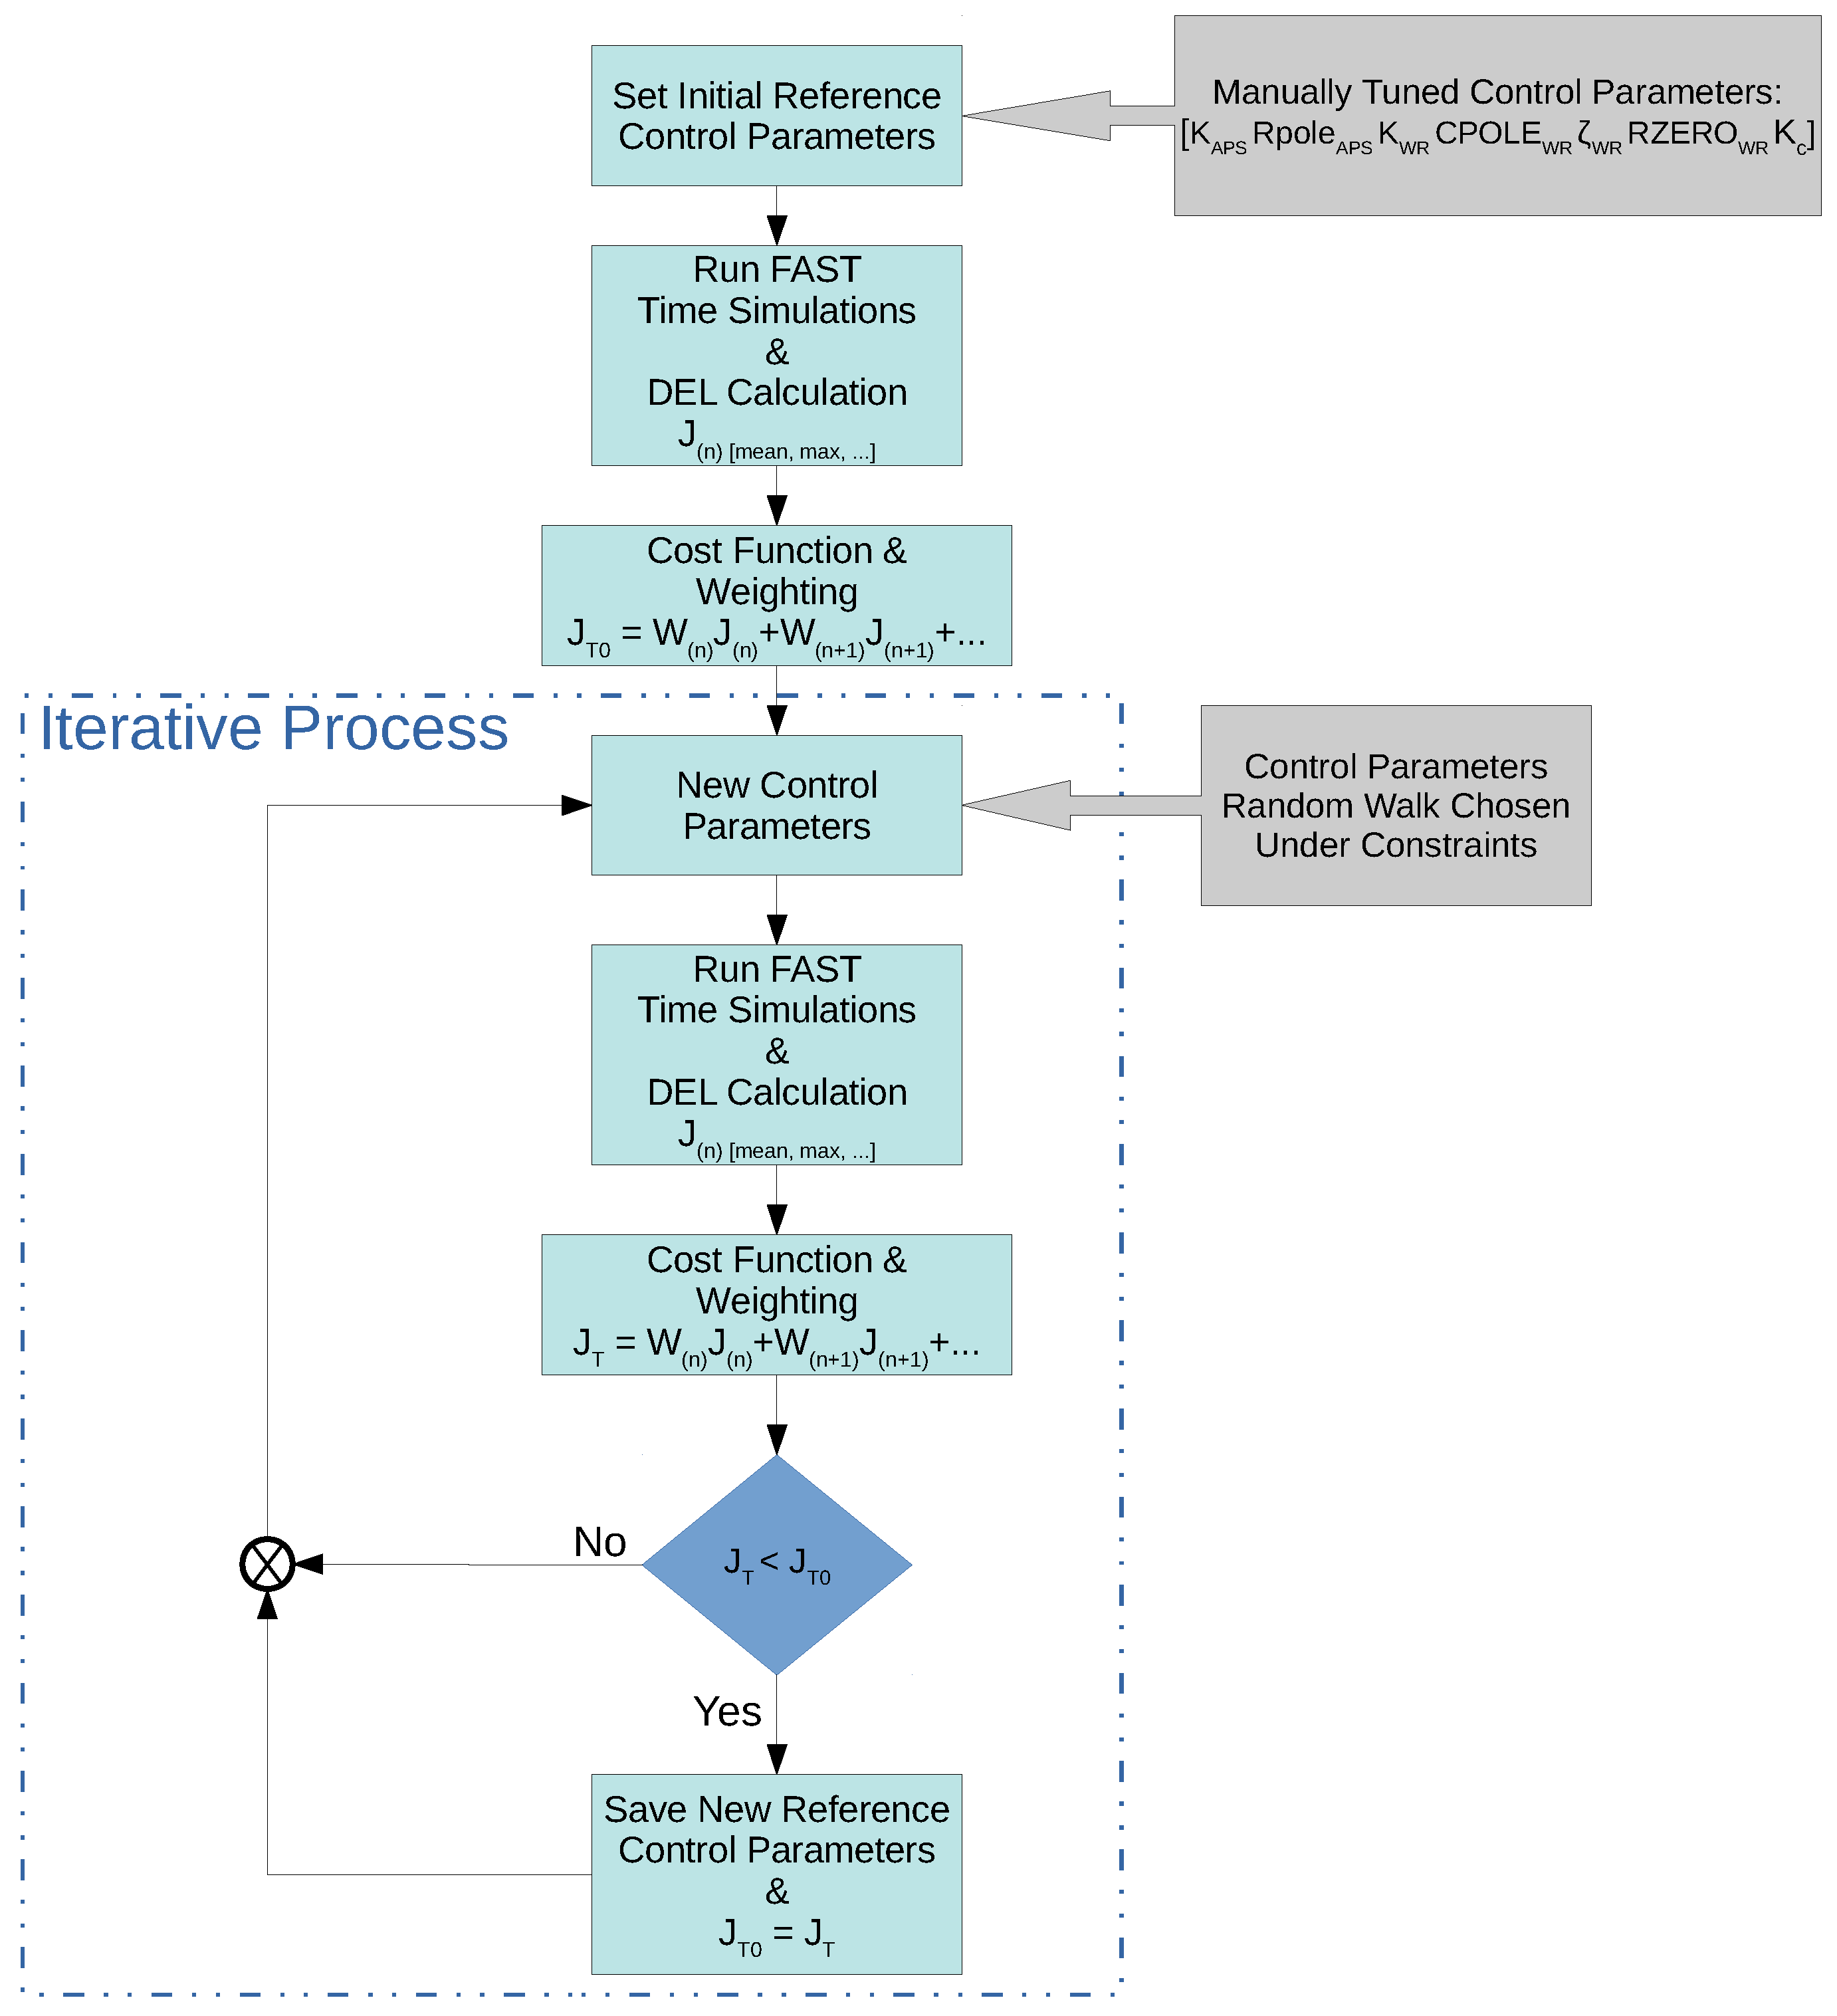
The proposed optimisation methodology takes the pole, zero and static gains of the manually tuned feedback control loops and automatically changes their control parameter values minimising the predefined cost function. This method will be referred to as Pole and Zero Optimiser (PZO). The process for the PZO methodology is illustrated by the block diagram of Figure 5. The process is divided in two main parts: the initialisation, where the initial cost function value is computed with the manually tuned control parameters; and the iterative loop, where the control parameters are automatically changed to minimise the cost function. The optimisation process step by step is explained in detail next.
In the first step of the PZO process, the control parameters of the manually tuned controller are inserted. The parameters of the APS control loop are: the static gain (K) and the real pole frequency (Real Pole). The parameters of the WR control loop are: the static gain (K), the complex pole frequency (Complex Pole) and damping coefficient (), and the real zero frequency (Real Zero). The static gain (K) of the control loop switching strategy is also included. In the second step, the simulations of the FOWT system are run, in this case with FASTv8 [31], for the following working conditions: wind speeds from 13 to 25 m/s, every 2 m/s; and significant wave heights from 0 to 6 m, every 1 m. After the simulations, the DEL of each working condition is computed. Then the partial terms of the cost function are defined: the mean and the maximum values of all the computed DELs (Equations (1) and (2), respectively). Since the main objective is to reduce the tower-base loads while maintaining the blade-root ones below the reference, the partial terms are repeated for all the measurement of blade-root-flapwise (), -edgewise (), and tower-base-pitch () bending moments, given as:
In the third step, the initial cost function is computed weighting (W) each partial term, as shown in Equation (3). The weighting of each partial term has been assigned according to the improvement interest, which has been heuristically chosen analysing the first PZO trials.
Once the initial cost function with the manually tuned control parameters is computed, the iterative loop of the PZO process starts. In this step, the new control parameters are selected through a random search. In the first optimisation loop the randomly chosen parameters are around the manually tuned control solution and, for the next loops, the parameters selected by the random search are around the last optimised control solution. A random value is added to the actual control parameters (for to the number of control parameters) to obtain the new ones , as can be seen in Equation (4). All the parameters are within the set of constraints that is defined with the knowledge acquired during the manually tuning process. During that process, one can learn between what range of control values the operation of the controller and FOWT system performance are acceptable.
In the next steps, simulations are run with FASTv8 [31] for the same working conditions as during the initialisation part. The DELs and cost function are computed for these new selected control parameters. If the cost function value obtained with the new control parameters is smaller than the values of previous iterations then these control parameters as well as the current value of the cost function are saved. After that, as well as if the cost function has not been minimised, the process is repeated going back to the previous step where the control parameters are selected through the random search around the last saved control parameters. Then, the PZO iterative process continues as explained. The PZO process can be concluded when the cost function is not minimised after a number of interactions.
4. Result Discussion
The proposed PZO process has been implemented with Matlab code whereas FASTv8 and the feedback control loops have been implemented in Simulink [34]. In the first part of the Matlab code the manually tuned control parameters and the initial cost function are computed. In the second part, the iterative optimisation process of the FOWT system simulations and the selection of the randomly chosen control parameters are carried out. The FOWT simulations are run in Simulink with FASTv8 and the NREL 5-MW wind turbine mounted on the ITI Energy barge model, where the FASTv8’s code has not been modified at all. The randomly chosen control parameters of the APS and WR control loops have been obtained with the rand command of Matlab. After simulations, the new cost function value and the comparison to the previous one are computed in Matlab.
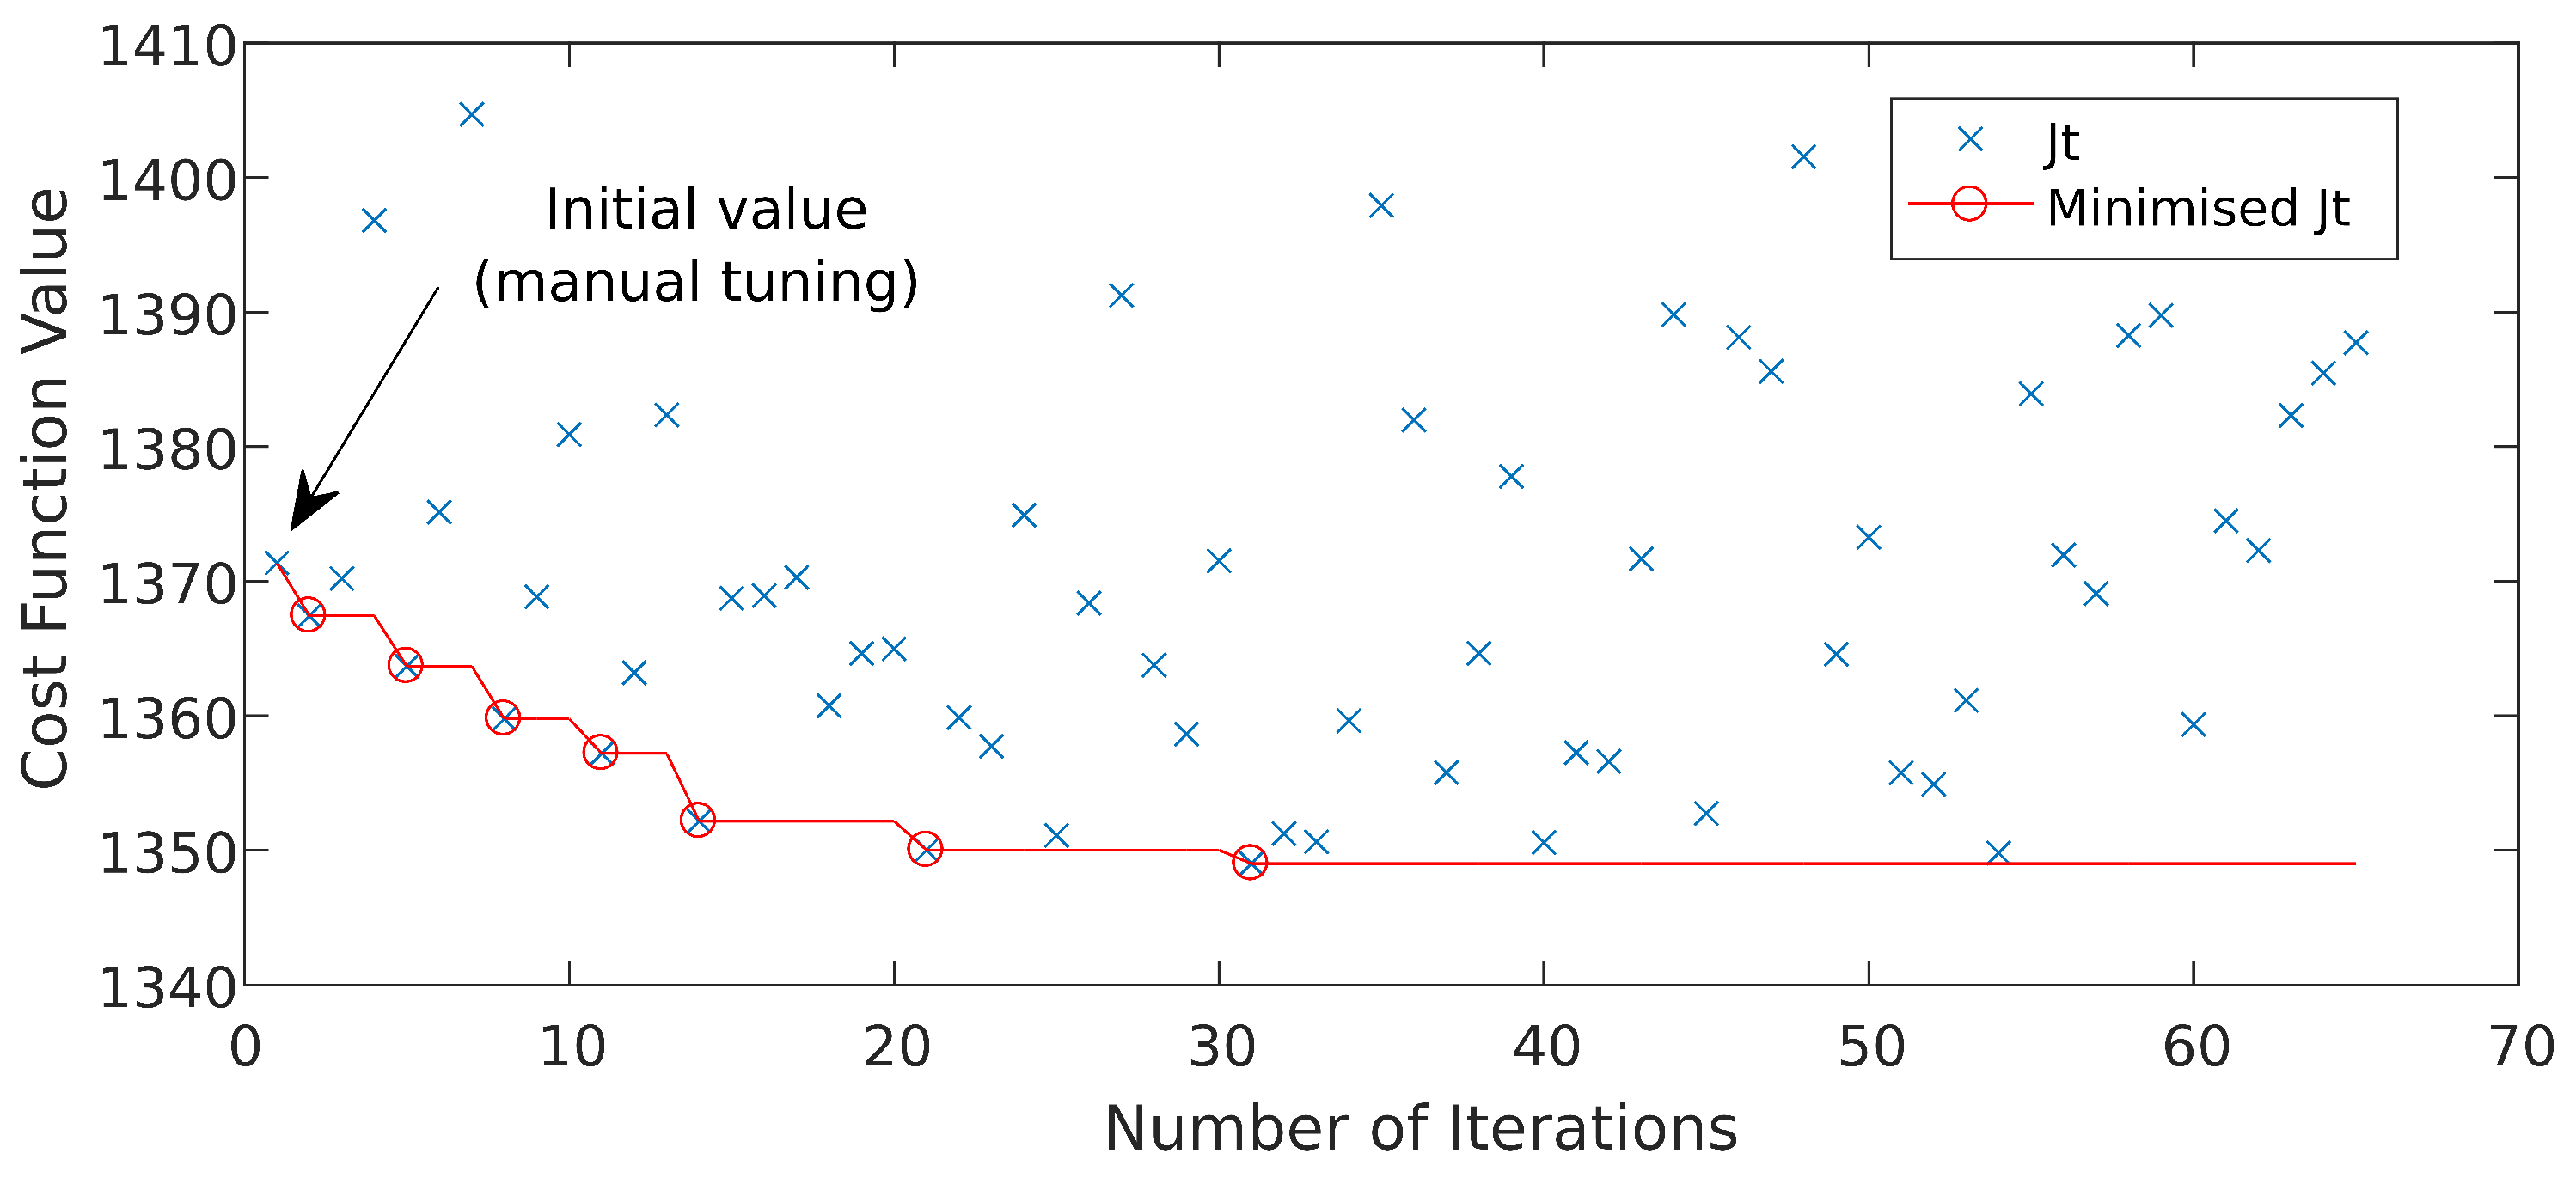
The PZO process has been repeated a number of times, first to adjust the weighting of the cost function partial terms, and second, to verify the convergence of the optimisation process. The selected weights for the mean and max ( and ) of the tower-base-pitch, blade-root-flapwise and -edgewise partial terms are 2, 1.2 and 1, respectively. The weight of each partial term have been keep constant throughout the optimisation process. The obtained cost function values during the iterative optimisation process are shown in Figure 6. One can see the stochastic cost function values obtained during the process due to the completely random input control values. The initial cost function value obtained with the manually tuned control parameters is minimised until the iteration 31. In the next iterations, until the optimisation process is interrupted, the cost function value has no longer been minimised. Considering the reduction of the minimisation rate in the last three minimisations and the lack of new minimised value in the last 34 iterations, it can be said that the chances for a new minimisation is unlikely. Otherwise, the minimisation rate will be so small that the impact on the system performance will be negligible considering the impact of the control parameters obtained in the last minimised iterations.
Note that since the control parameter values have several decimals, the number of possible solutions can be huge. However, from the FOWT performance point of view the variation of the least significant digits of the control parameters does not impact in the behaviour of the controller. Due to the stochastic nature of PZO process and the huge number of possible solutions, it may be a more optimal solution, even if the final FOWT operation shows hardly any improvements. Therefore, it can be said that the proposed PZO methodology is suboptimum. The manually tuned feedback control loop parameters, the optimised ones and the established constrains for the PZO process are summarised in Table 1.
All the simulations have been carried out with FASTv8 [31] and the fully non-linear FOWT model, with all Degrees Of Freedom (DOF) enabled [34]. The stochastic wind fields have been generated with the Turbsim v1.03.00 module. The most turbulent wind case scenarios have been selected (wind turbine class—A, according to the IEC61400-1 design standard [35]), to demonstrate the vigorous blade-pitch regulation with the designed controllers in harsh wind conditions. The irregular sea state conditions have been generated with the Hydrodyn v2.03 module [36] where the sea state is derived from the Joint North Sea Wave Project (JONSWAP) wave spectrum, as prescribed by IEC61400-3 offshore standard [37].
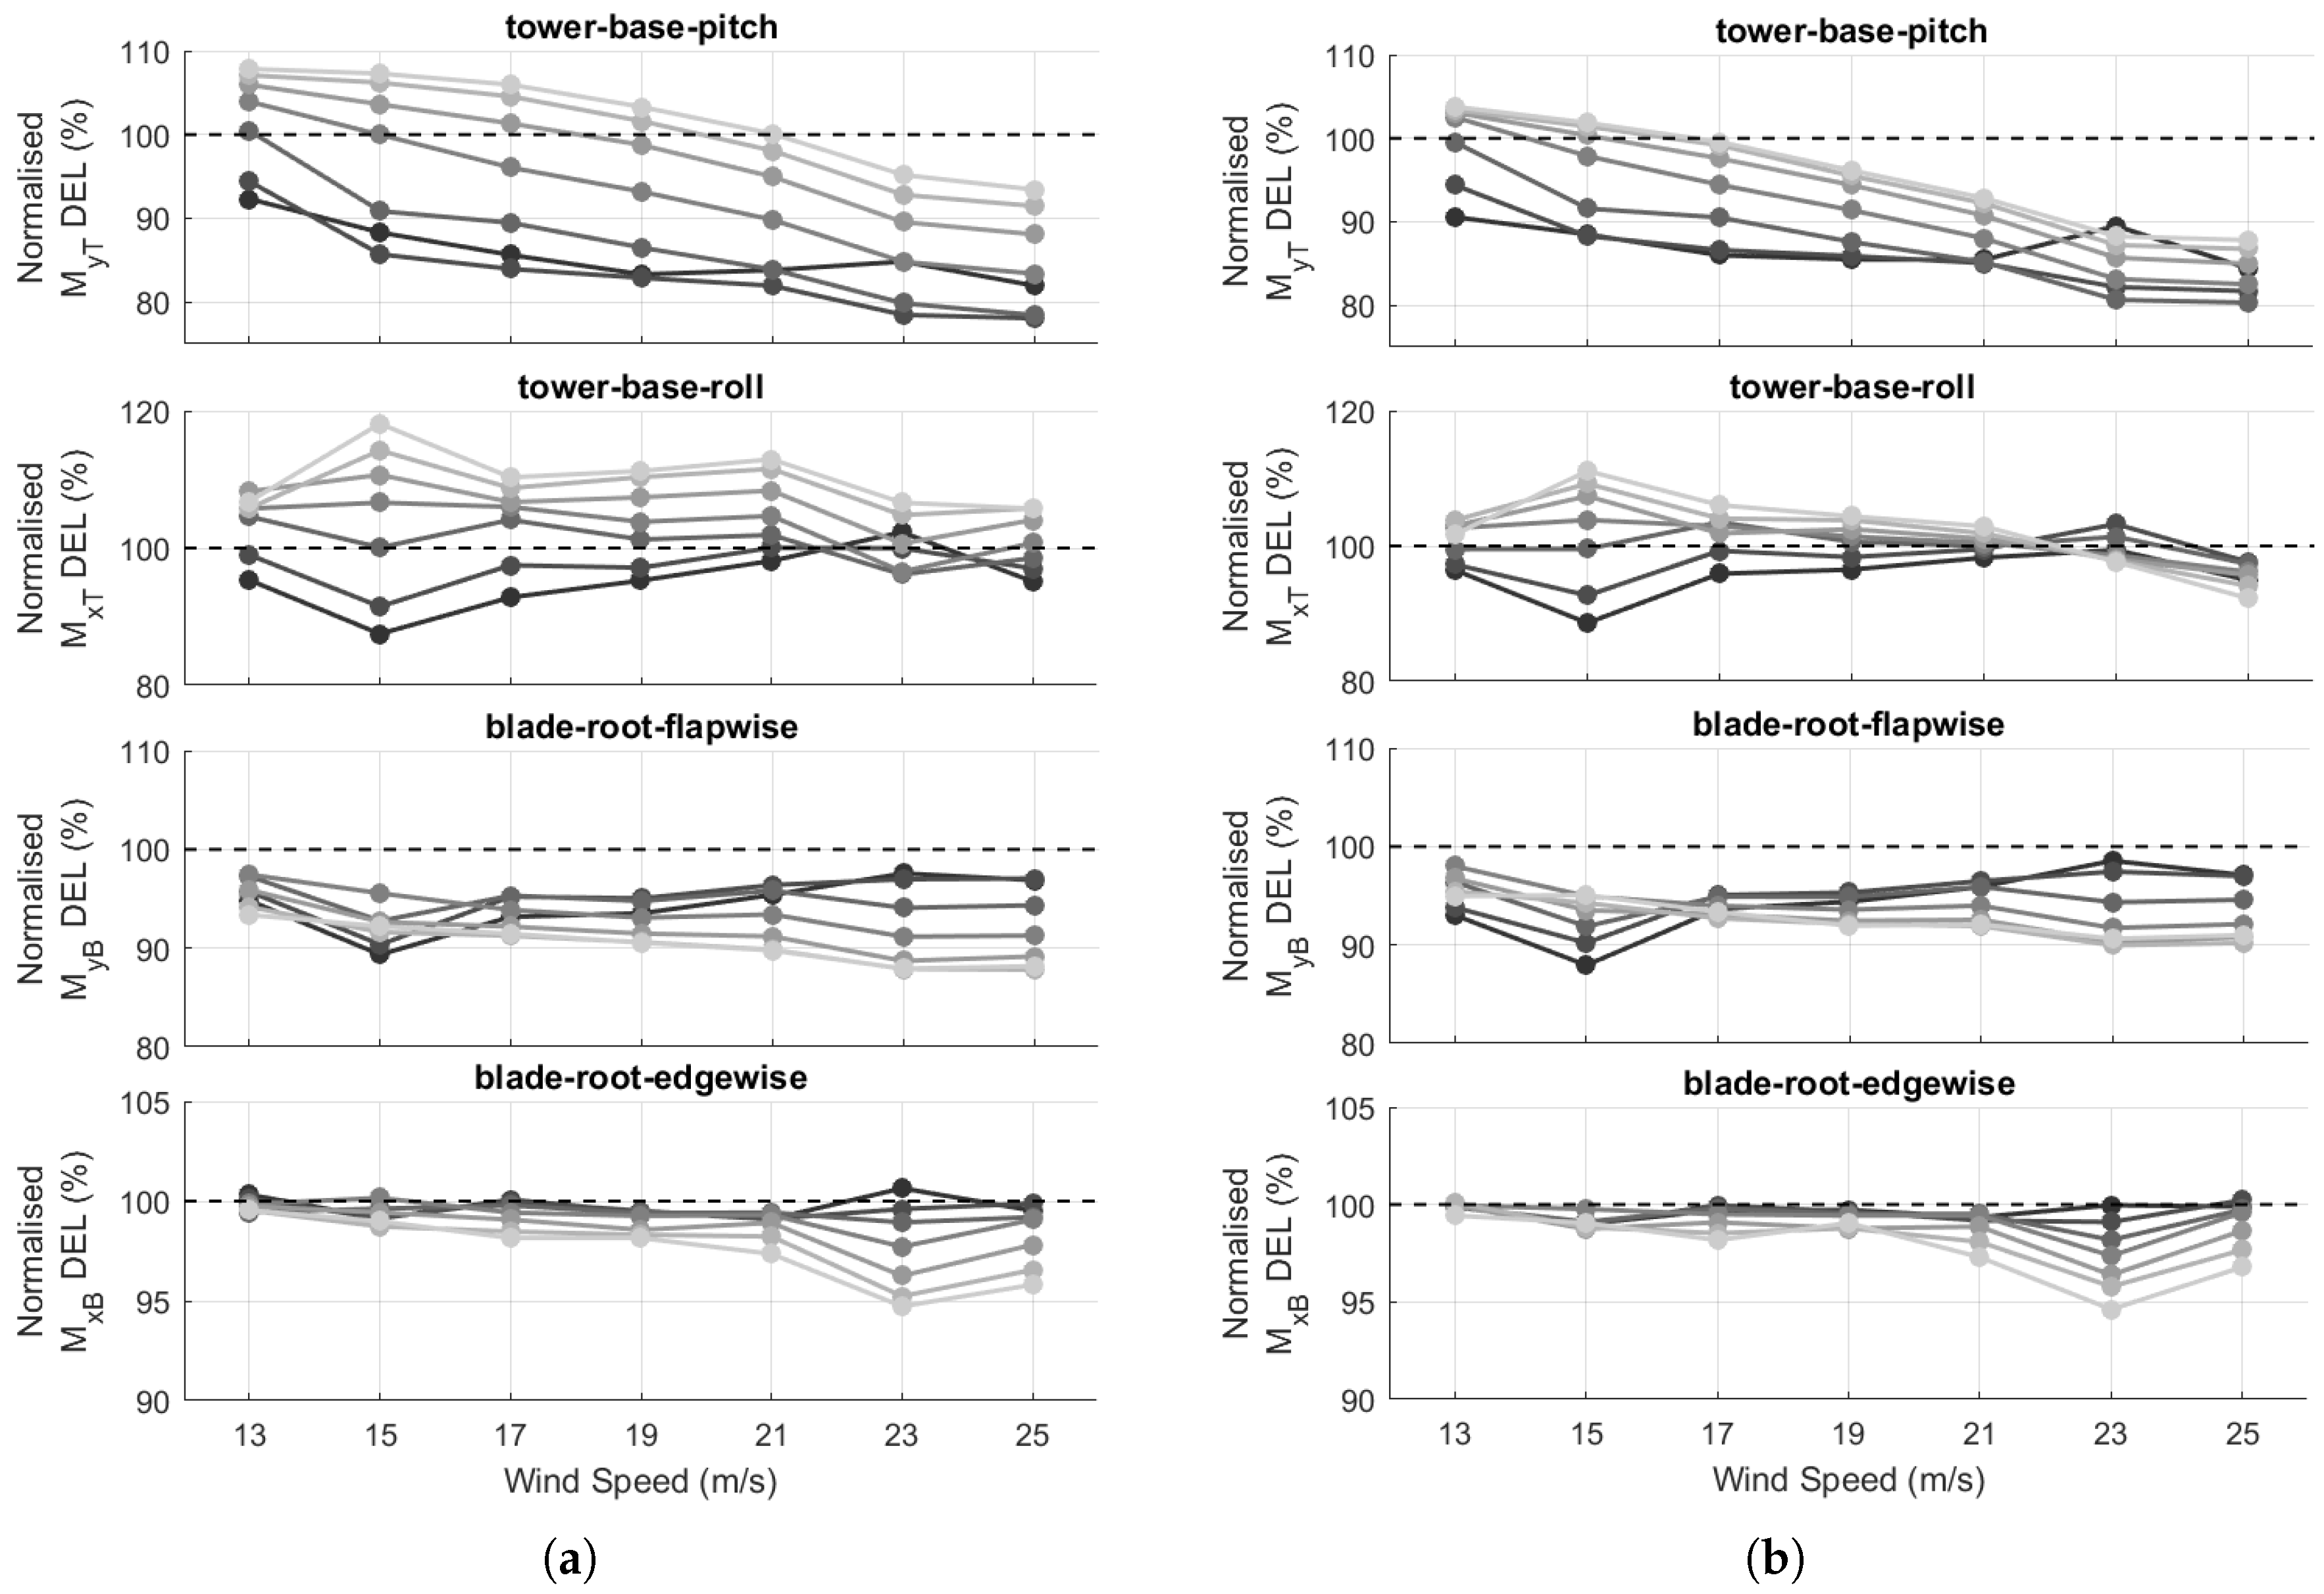
Figure 7 contains the DEL results of the simulations carried out at all working conditions with the control parameters shown in Table 1. The results of the manually and optimised controllers are shown normalised according to the reference Detuned PI results. One can see how the objective of reducing the tower-base-pitch DELs has been achieved with the results obtained by using the optimised controller below the reference Detuned PI controller ones in the most of the FOWT working conditions. From 17 m/s wind speed to above all the DEL, results are below the reference with the optimised controller. Some results below this wind speed are above the reference; in contrast, such conditions are hardly expected to happen according to [32]. This region is also highly influenced by the switching between the below and above rated wind speed controllers. Therefore, it is believed that these results can be improved with a smooth controller switching strategy. Furthermore, the second objective of keeping the blade-root-flapwise and -edgewise DELs below the reference has been achieved as well. The tower-base-roll DELs have also been reduced, although the reductions are not significant due to the magnitude difference in comparison to tower-base-pitch loads, which are between and % smaller depending on the working condition.
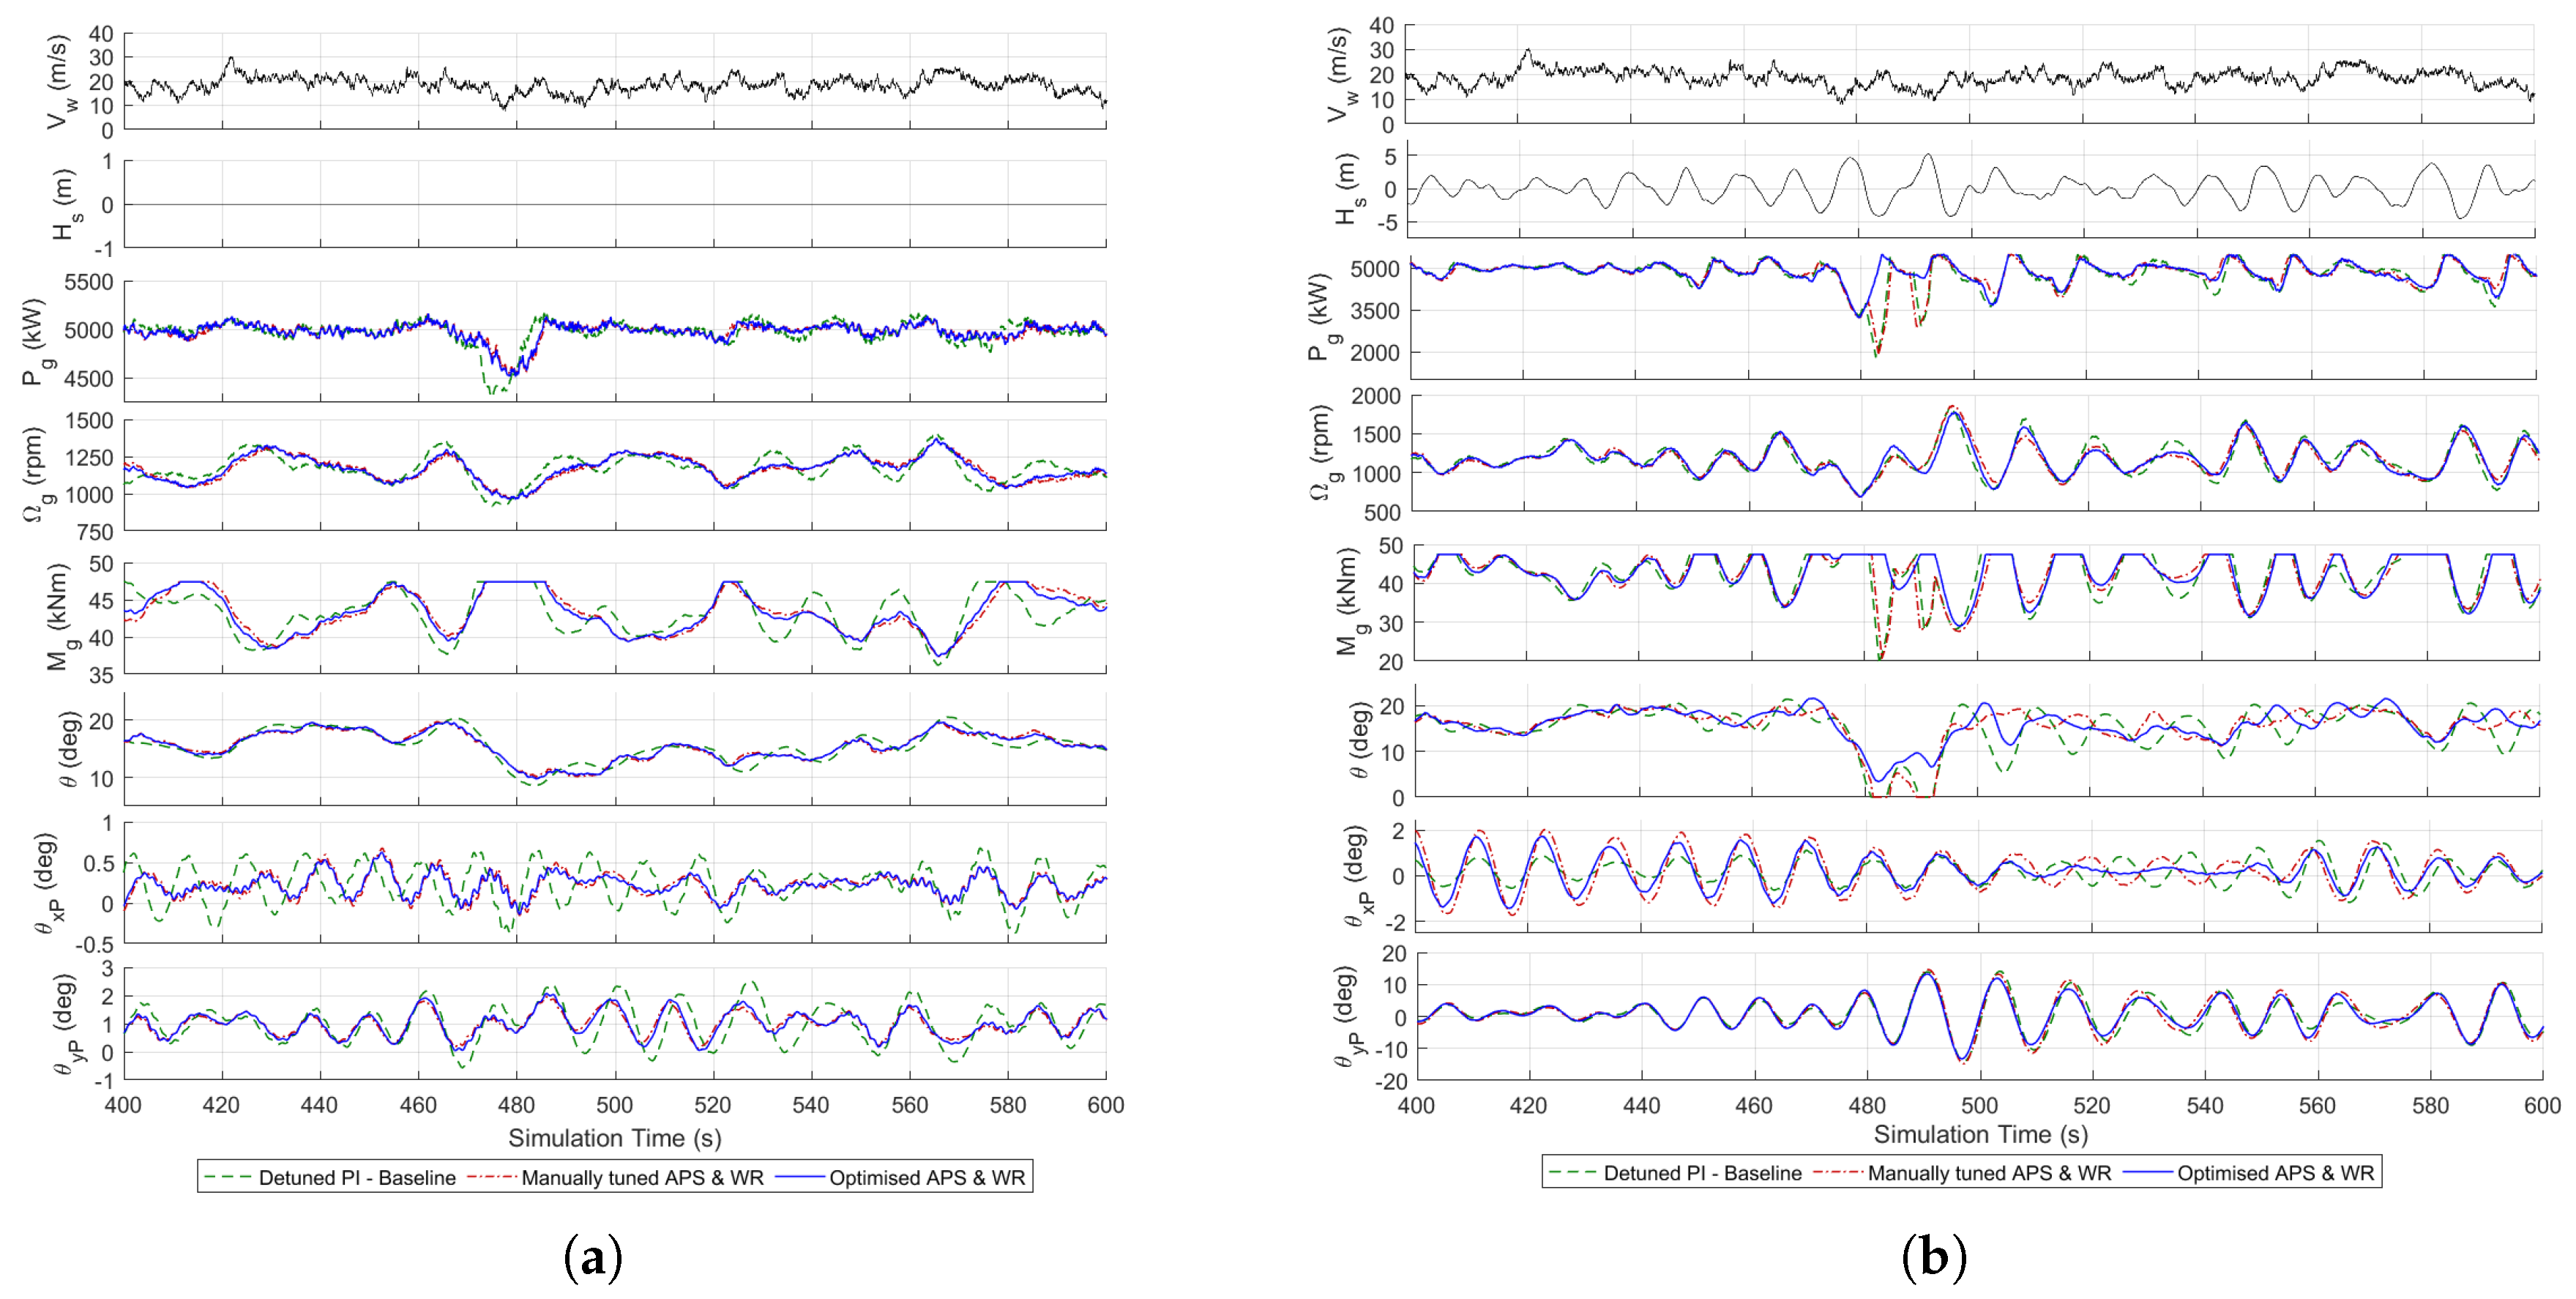
The improvements in the DELs results do not negatively affect the overall performance of the FOWT. The performance of the optimised controller is quite similar to the manually tuned one as can be seen in calm (a) and rough (b) sea states in Figure 8. This is due to the controller parameters being slightly modified with respect to those of the manually tuned controller (as shown in Table 1) to achieve the objectives defined by the cost function in the previous section, but without altering the essence of the original controller. However, the generated electric power () quality has been improved and not only in calm sea states avoiding the gaps when extreme waves occur, but also in rough sea states where the improvement is much more accused. The generator speed () excursions have been also reduced in both sea state conditions as well as the generator torque (), which shows smother regulation. This provides more conservative operation reducing the strokes in the gear-box. The platform-roll () and -pitch () oscillations have been reduced successfully, mainly in rough sea states which is the main contributor to the positive tower-base DEL results shown in Figure 7. In addition, the blade-pitch () activity shows less excursions than the reference Detuned PI and the manually tuned controller contributing to a minor deterioration of the blade-pitch actuator.
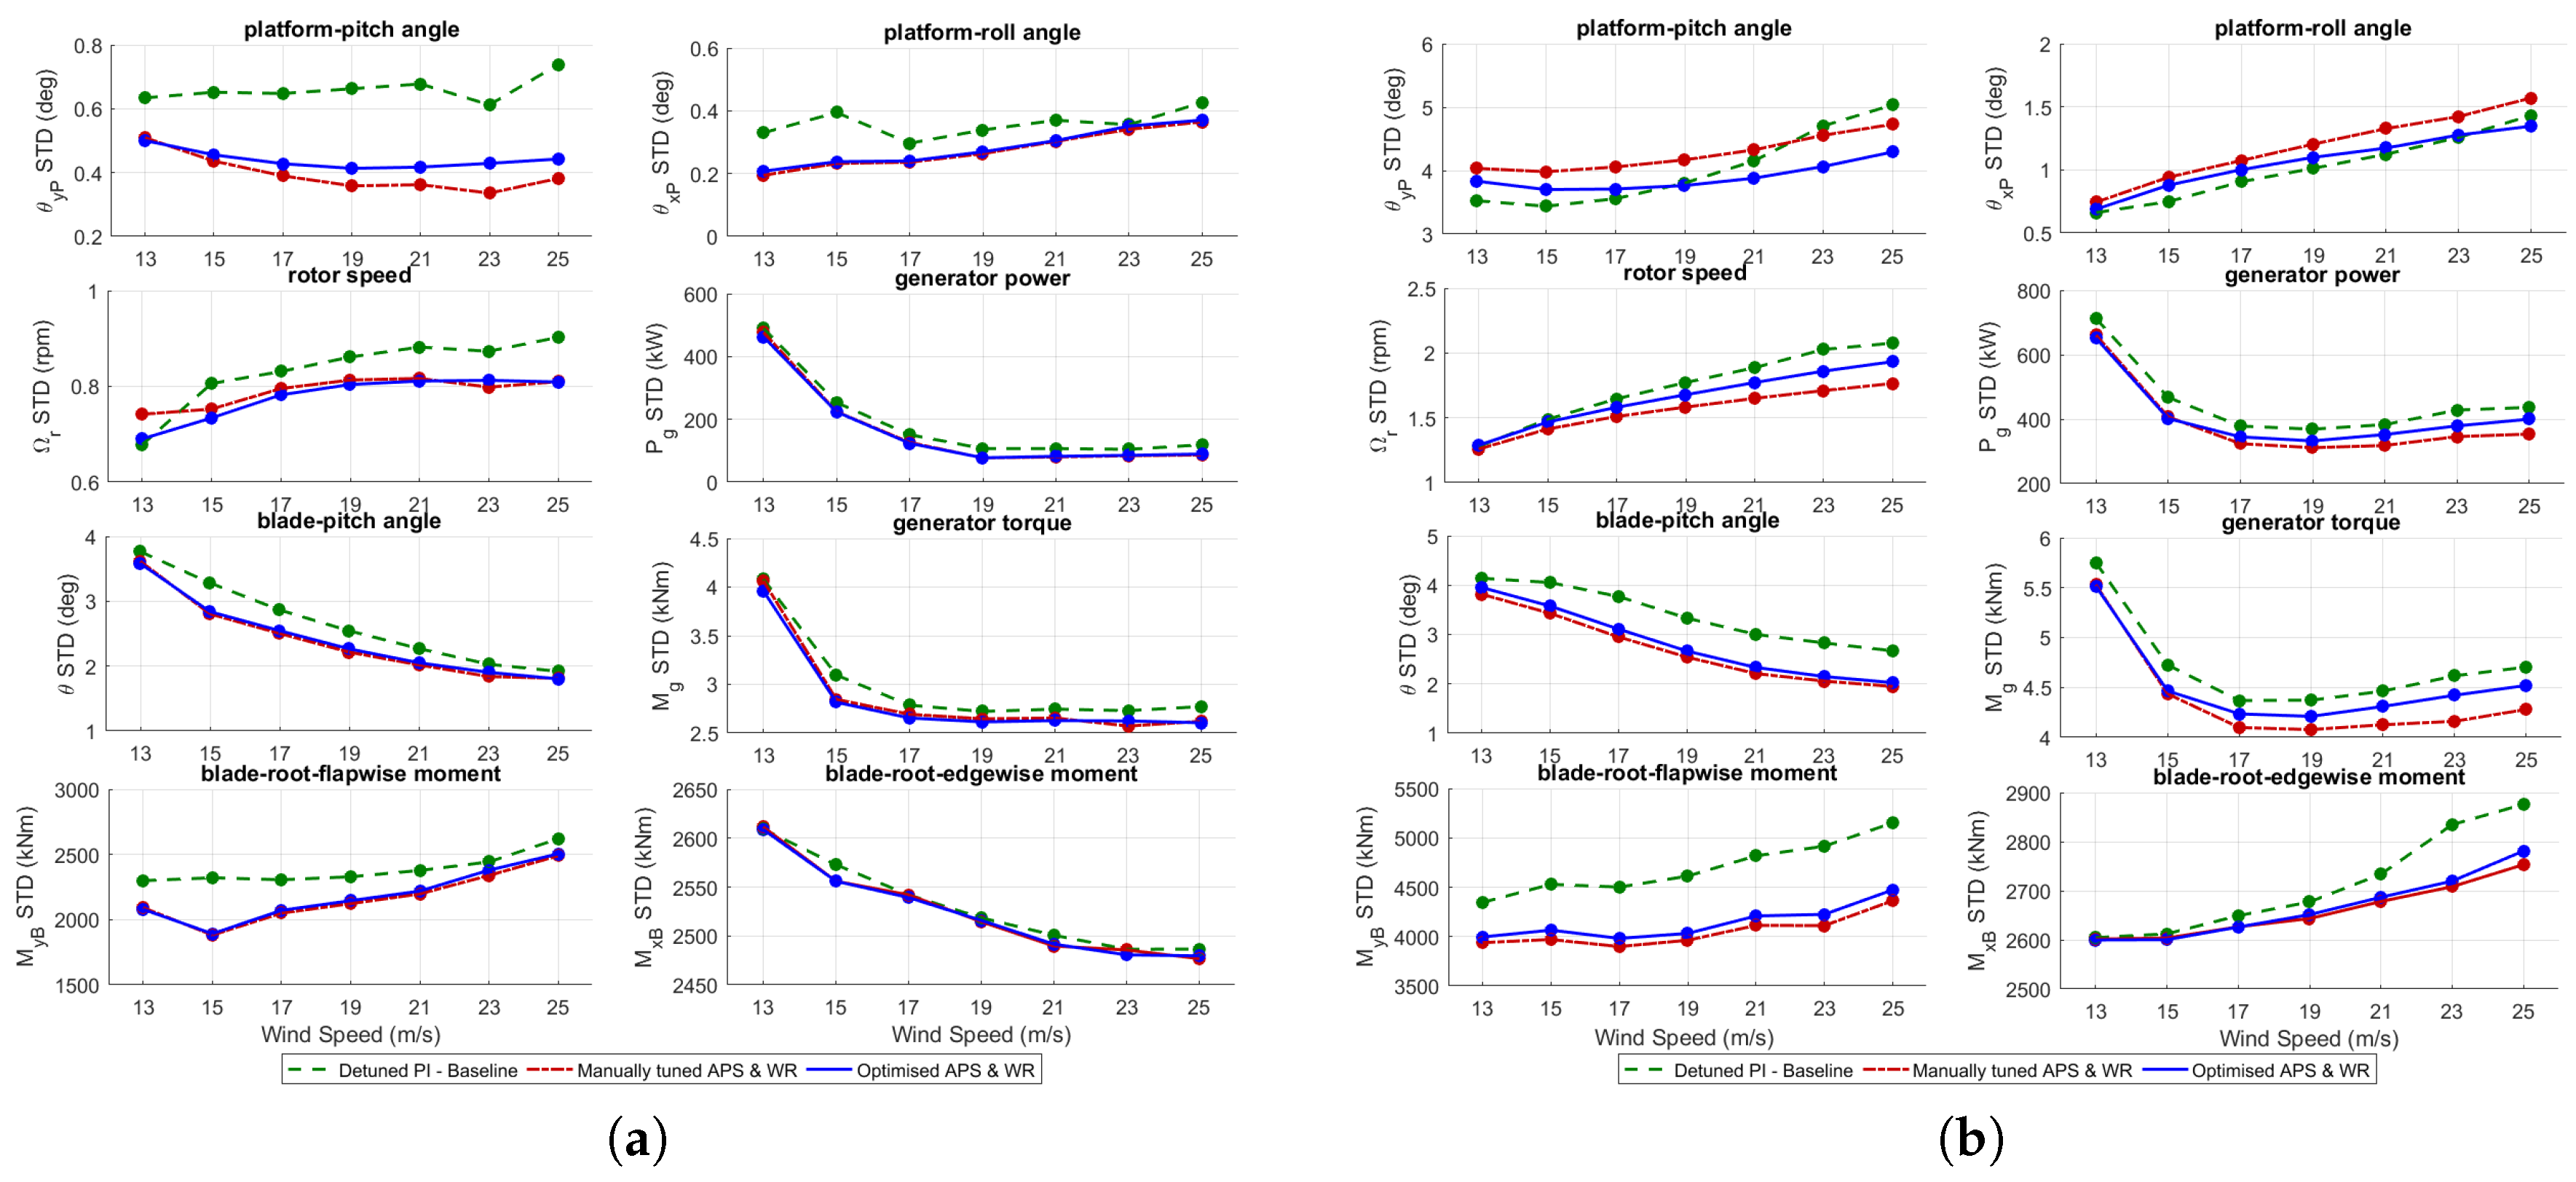
The Standard Deviation (STD) quantifies the amount of dispersion of the set of variables shown in the time-domain results of Figure 8. One can see the platform-pitch and -roll STD reductions in rough sea states with the optimised controller in Figure 9b, not increasing the blade-root-flapwise and -edgewise ones. The platform-pitch and -roll STD have been reduce up to 10 and 14%, respectively. The generator speed and generator torque regulation have been slightly worsen with the optimised controller compared to the results obtained with the manually tuned controller, as it can be seen in Figure 9b. However, still showing better results than the reference Detuned PI controller. These results are consistent with those of Figure 8.
5. Conclusions and Recommendations
In this article, a novel optimisation methodology for the manually tuned FOWT feedback controllers for an above rated wind speed region is presented. This method automatically updates the manually tuned feedback control loop parameters to improve the system performance minimising the described cost function. In this study, the previously presented APS [25,26] and WR [27] control loops for the NREL 5-MW ITI Energy barge FOWT models are used for the optimisation process. These two control loops present several parameters to be manually optimised, therefore, a novel optimisation methodology has been presented in this article based on Monte Carlo, showing the potential to improve the manually tuned controller performance through the objectives of: (1) reduce the tower-base DELs in all the contemplated working conditions below the reference from 17 m/s wind speed to above; (2) keep the blade-root DELs below the reference; and (3), preserve the overall FOWT performance hardly affected in comparison to the reference Detuned PI controller results. Efforts are currently being carried out at IK4-IKERLAN to further improve this preliminary optimisation method and analyse different variants with the aim of comparing the results obtained in this study as well as investigating other optimisation methods, e.g., genetic algorithms, in order to examine the trade off between code complexity, computational time and performance results.
Author Contributions
This paper is part of J.O.’s PhD thesis conducted at the University of the Basque Country UPV/EHU. J.J. contributed in the design and implementation of this work. I.E. contributed in the theoretical and result analysis of this work. S.A.-Q. contributed to the final version of the manuscript. A.P.-A. supervised the project.
Funding
This work has been partially funded by the Spanish Ministry of Economy and Competitiveness through the research project DPI2017-82930-C2-2-R.
Conflicts of Interest
The authors declare no conflict of interest.
References
- Bilgili, M.; Yasar, A.; Simsek, E. Offshore wind power development in Europe and its comparison with onshore counterpart. Renew. Sustain. Energy Rev. 2011, 15, 905–915. [Google Scholar] [CrossRef]
- Musial, W.; Butterfield, S.; Ram, B. Energy from offshore wind. In Proceedings of the Offshore Technology Conference, Houston, TX, USA, 1–4 May 2006. [Google Scholar]
- Rhodri, J.; Ros, M.C. Floating Offshore Wind: Market and Technology Review; Carbon Trust Report Prepared for the Scottish Government; Carbon Trust: London, UK, 2015. [Google Scholar]
- Shyam Kularathna, A.H.T.; Suda, S.; Takagi, K.; Tabeta, S. Evaluation of co-existence options of marine renewable energy projects in Japan. Sustainability 2019, 11, 2840. [Google Scholar] [CrossRef]
- Jiang, Z.; Zhu, X.; Hu, W. Modeling and analysis of offshore floating wind turbines. In Advanced Wind Turbine Technology; Springer International Publishing: Berlin/Heidelberg, Germany, 2018. [Google Scholar]
- Gonzalez, S.F.; Diaz-Casas, V. Present and future of floating offshore wind. In Floating Offshore Wind Farms; Springer International Publishing: Berlin/Heidelberg, Germany, 2016. [Google Scholar]
- Roddier, D.; Cermelli, C.; Weinstein, J.; Byklum, E.; Atcheston, M.; Utsunomiya, T.; Jorde, J.; Borgen, E. State-of-the-Art. In Floating Offshore Wind Energy: The Next Generation of Wind Energy; Springer International Publishing: Berlin/Heidelberg, Germany, 2016. [Google Scholar]
- Wayman, E.N.; Sclavounos, P.D.; Butterfiel, S.; Jonkman, J.; Musial, W. Coupled Dynamic Modeling of Floating Wind Turbine Systems; NREL/CP-500-39481; National Renewable Energy Laboratory (NREL): Golden, CO, USA, 2006. [Google Scholar]
- Jose, A.; Falzarano, J.; Wang, H. A study of negative damping in floating wind turbines using coupled program FAST-SIMDYN. In Proceedings of the 1st International Offshore Wind Technical Conference (IOWTC), San Francisco, CA, USA, 4–7 November 2018. [Google Scholar]
- Schlipf, D.; Sandner, F.; Raach, S.; Matha, D.; Cheng, P.W. Nonlinear Model Predictive Control of Floating Wind Turbines; International Society of Offshore and Polar Engineers (ISOPE): Mountain View, CA, USA, 2013. [Google Scholar]
- Chaaban, R.; Fritzen, C.P. Reducing blade fatigue and damping platform motions of floating wind turbines using model predictive control. In Proceedings of the 9th International Conference on Structural Dynamics (EURODYN), Porto, Portugal, 30 June–2 July 2014. [Google Scholar]
- Lemmer, F.; Raach, S.; Schlipf, D.; Cheng, P.W. Prospects of linear model predictive control on a 10 MW floating wind turbine. In Proceedings of the International Conference on Ocean, Offshore and Arctic Engineering, St. John’s, NL, Canada, 31 May–5 June 2015. [Google Scholar]
- Yang, F.; Song, Q.W.; Wang, L.; Zuo, S.; Li, S.S. Wind and wave disturbances compensation to floating offshore wind turbine using improved individual pitch control based on fuzzy control strategy. Abstr. Appl. Anal. 2014, 2014, 968384. [Google Scholar] [CrossRef]
- Christiansen, S.; Bak, T.; Knudsen, T. Minimum thrust load control for floating wind turbine. In Proceedings of the IEEE International Conference on Control Applications (CCA), Dubrovnik, Croatia, 3–5 October 2012. [Google Scholar]
- Namik, H.; Stol, K. Individual blade pitch control of a spar-buoy floating wind turbine. IEEE Trans. Control. Syst. Technol. 2014, 22, 214–223. [Google Scholar] [CrossRef]
- Ramos, R.L. Linear quadratic optimal control of a spar-type floating offshore wind turbine in the presence of turbulent wind and different sea states. J. Mar. Sci. Eng. 2018, 6, 151. [Google Scholar] [CrossRef]
- Namik, H.; Stol, K. Individual blade pitch control of a floating offshore wind turbine on a tension leg platform. In Proceedings of the 48th AIAA Aerospace Sciences Meeting Including the New Horizons Forum and Aerospace Exposition, Orlando, FL, USA, 4–7 January 2010. [Google Scholar]
- Ma, Y.; Sclavounos, D.; Cross-Whiter, J.; Arora, D. Wave Forecast and its application to the optimal control of offshore floating wind turbine for loads mitigation. Renew. Energy 2018, 128, 163–176. [Google Scholar] [CrossRef]
- Zuo, S.; Song, Y.D.; Wang, L.; Song, Q.W. Computationally inexpensive approach for pitch control of offshore wind turbine on barge floating platform. Sci. World J. 2013, 2013, 357849. [Google Scholar] [CrossRef] [PubMed]
- Bagherieh, O.; Nagamune, R. Gain-scheduling control of a floating offshore wind turbine above rated wind speed. Control Theory Technol. 2015, 13, 160–172. [Google Scholar] [CrossRef]
- Bakka, T.; Karimi, H.R. Robust H∞ dynamic output feedback control synthesis with pole placement constraints for offshore wind turbine systems. Math. Probl. Eng. 2012, 2012, 616507. [Google Scholar] [CrossRef]
- Hara, N.; Nihei, Y.; Iijima, K.; Konishi, K. Blade pitch control for floating wind turbines: Design and experiments using scale model. In Proceedings of the IEEE Conference on Control Technology and Applications (CCTA), Kohala Coast, HI, USA, 27–30 August 2017. [Google Scholar]
- Betti, G.; Farina, M.; Guagliardi, G.A.; Marzorati, A.; Scattolini, R. Development of a control-oriented model of floating wind turbines. IEEE Trans. Control. Syst. Technol. 2014, 22, 69–82. [Google Scholar] [CrossRef]
- Lackner, M. Controlling platform motions and reducing blade loads for floating wind turbines. Wind Eng. 2009, 33, 541–553. [Google Scholar] [CrossRef]
- Olondriz, J.; Elorza, I.; Trojaola, I.; Pujana, A.; Landaluze, J. On the effects of basic platform design characteristics on floating offshore wind turbine control and their mitigation. J. Phys. Conf. Ser. 2016, 753, 052008. [Google Scholar] [CrossRef] [Green Version]
- Olondriz, J.; Elorza, I.; Jugo, J.; Alonso-Quesada, S.; Pujana-Arrese, A. An advanced control technique for floating offshore wind turbines based on more compact barge platforms. Energies 2018, 11, 1187. [Google Scholar] [CrossRef]
- Olondriz, J.; Jugo, J.; Elorza, I.; Alonso-Quesada, S.; Pujana-Arrese, A. A blade feedback control for floating offshore wind turbines. J. Phys. Conf. Ser. 2019, 1222, 012014. [Google Scholar] [CrossRef]
- Kroese, D.P.; Rubinstein, R.Y. Monte Carlo Methods. Wiley Interdiscip. Rev. Comput. Stat. 2012, 4, 48–58. [Google Scholar] [CrossRef]
- Tyatyushkin, A.I. Numerical optimization methods for controlled systems with parameters. Comput. Math. Math. Phys. 2017, 57, 1592–1606. [Google Scholar] [CrossRef]
- Whitley, D. A genetic algorithm tutorial. Stat. Comput. 1994, 4, 65–85. [Google Scholar] [CrossRef]
- Jonkman, B.; Jonkman, J. FAST v8.16.00a-bjj; National Renewable Energy Laboratory: Golden, CO, USA, 2016. [Google Scholar]
- Jonkman, J. Dynamics Modeling and Loads Analysis of an Offshore Floating Wind Turbines; NREL/TP-500-41958; National Renewable Energy Laboratory (NREL): Golden, CO, USA, 2007. [Google Scholar]
- Olondriz, J.; Jugo, J.; Elorza, I.; Alonso-Quesada, S.; Pujana-Arrese, A. Alternative linearisation methodology for aero-elastic Floating Offshore Wind Turbine non-linear models. J. Phys. Conf. Ser. 2018, 1037, 062019. [Google Scholar] [CrossRef]
- Jonkman, J.M.; Buhl, M.L., Jr. FAST User’s Guide; NREL/EL-500-38230; National Renewable Energy Laboratory (NREL): Golden, CO, USA, 2005. [Google Scholar]
- Wind Turbines—Part 1: Design Requirements, 3rd ed.; Technical Report IEC61400-1; International Electrotechnical Commission (IEC): Geneva, Switzerland, 2005.
- Jonkman, J.M.; Robertson, A.N.; Hayman, G.J. HydroDyn User’sGuide and Theory Manual; National Renewable Energy Laboratory (NREL): Golden, CO, USA, 2014. [Google Scholar]
- Wind Turbines—Part 3: Design Requirements for Offshore Wind Turbines; Technical Report IEC61400-3; International Electrotechnical Commission (IEC): Geneva, Switzerland, 2009.
Figure 1.
Illustrative representation of the main offshore wind turbine concepts.

Figure 2.
Process carried out for FOWT control design.

Figure 3.
Conventional PI, Aerodynamic Platform Stabiliser and Wave Rejection feedback control loops.
Figure 3.
Conventional PI, Aerodynamic Platform Stabiliser and Wave Rejection feedback control loops.

Figure 4.
Process carried out for the APS and WR control loops manual tuning.

Figure 5.
Process carried out for the manually tuned control parameters optimisation.

Figure 6.
Cost function value results during the iterative optimisation process.

Figure 7.
Damage Equivalent Load relatives to the baseline Detuned PI results (dashed lines) for m (decreasing darkness for increasing ). (a) Manually tuned APS & WR. (b) Optimised APS & WR.
Figure 7.
Damage Equivalent Load relatives to the baseline Detuned PI results (dashed lines) for m (decreasing darkness for increasing ). (a) Manually tuned APS & WR. (b) Optimised APS & WR.

Figure 8.
Time-domain simulation results. (a) m/s and m. (b) m/s and m.

Figure 9.
Time-domain simulation Standard Deviations results. (a) m. (b) m.


Table 1.
Manually tuned and optimised control parameters values after applying the PZO method.
| Control Parameter | Manually | Optimised | Constrains |
|---|---|---|---|
| K (–) | 7 | 2–8 | |
| Real Pole (Hz) | – | ||
| K (–) | – | ||
| Complex Pole (Hz) | – | ||
| (–) | – | ||
| Real Zero (Hz) | – | ||
| K (–) | 2 | –3 |
© 2019 by the authors. Licensee MDPI, Basel, Switzerland. This article is an open access article distributed under the terms and conditions of the Creative Commons Attribution (CC BY) license (http://creativecommons.org/licenses/by/4.0/).
Share and Cite
MDPI and ACS Style
Olondriz, J.; Jugo, J.; Elorza, I.; and Aron Pujana-Arrese, S.A.-Q. A Feedback Control Loop Optimisation Methodology for Floating Offshore Wind Turbines. Energies 2019, 12, 3490. https://doi.org/10.3390/en12183490
AMA Style
Olondriz J, Jugo J, Elorza I, and Aron Pujana-Arrese SA-Q. A Feedback Control Loop Optimisation Methodology for Floating Offshore Wind Turbines. Energies. 2019; 12(18):3490. https://doi.org/10.3390/en12183490
Chicago/Turabian StyleOlondriz, Joannes, Josu Jugo, Iker Elorza, and Santiago Alonso-Quesada and Aron Pujana-Arrese. 2019. "A Feedback Control Loop Optimisation Methodology for Floating Offshore Wind Turbines" Energies 12, no. 18: 3490. https://doi.org/10.3390/en12183490
Note that from the first issue of 2016, this journal uses article numbers instead of page numbers. See further details here.