1. Introduction
Critique of fossil fuel depletion and its subsequent environmental impacts have led to a surge in the quest for ecologically and economically cost effective energy alternatives in recent decades [
1,
2]. As a result, modern development has seen an ever-increasing expansion and reliance on the consumption of raw materials, energy, and natural resources. Yet, the environmental impact of this over reliance has been just as detrimental [
3]. One of the most critical challenges the energy sector presently faces is finding innovative ways of overcoming and reducing these environmental impacts while addressing the upward trend in energy demand [
4].
According to Mohamed et al. [
5] and Marmoush et al. [
6], the availability of energy coupled with the environmental threats caused by fossil fuel consumption is a global issue that has created an immediate cause for concern in the search for significant and viable alternative energy sources. According to the International Energy Outlook 2018 [
7], the increase in world electricity generation is expected to rise to 69% by 2040. The world electricity consumption in 2012 was 21.6 trillion kWh. This figure is expected to rise to 25.8 trillion kWh by 2020, with this increase expected to continue, reaching 36.5 trillion kWh by 2040.
Electricity is the world’s fastest-growing energy form of end-use consumption. As a result, the utilization rates of coal and natural gas are anticipated to increase, especially as current reserves of fossil resources are becoming increasingly limited. There are many problems associated with fossil fuel supplies. These include but are not limited to; economic dependence of non-producer countries on their producer counterparts, depletion of reserves, greenhouse gas emissions, and emissions of traditional air pollutants [
8,
9]. According to the Global Energy and CO
2 Status Report in 2018, the global energy-related CO
2 emissions rose to 1.7% at a historic high of 33.1 Gt CO
2 [
10]. This increase has pushed the imperative in finding alternative energy sources that can reduce greenhouse gas emissions as well as supplement/replace the use of fossil fuels [
11]. One particular alternative that has seen a surge in popularity in recent years is wind energy. At present, there is large international advocacy by numerous states and governments supporting renewable energy installation, including wind power. Amongst these is Jordan. During the last decade, the Jordanian government implemented a new law providing for a wide range of facilities for international companies to encourage investment of renewable energy projects in Jordan [
12]. This legislation came into effect in 2010 and has thus far been somewhat successful. A number of renewable energy projects are currently underway. Some have started producing electricity; while others are still undergoing the construction and/or are in the planning phases. [
12].
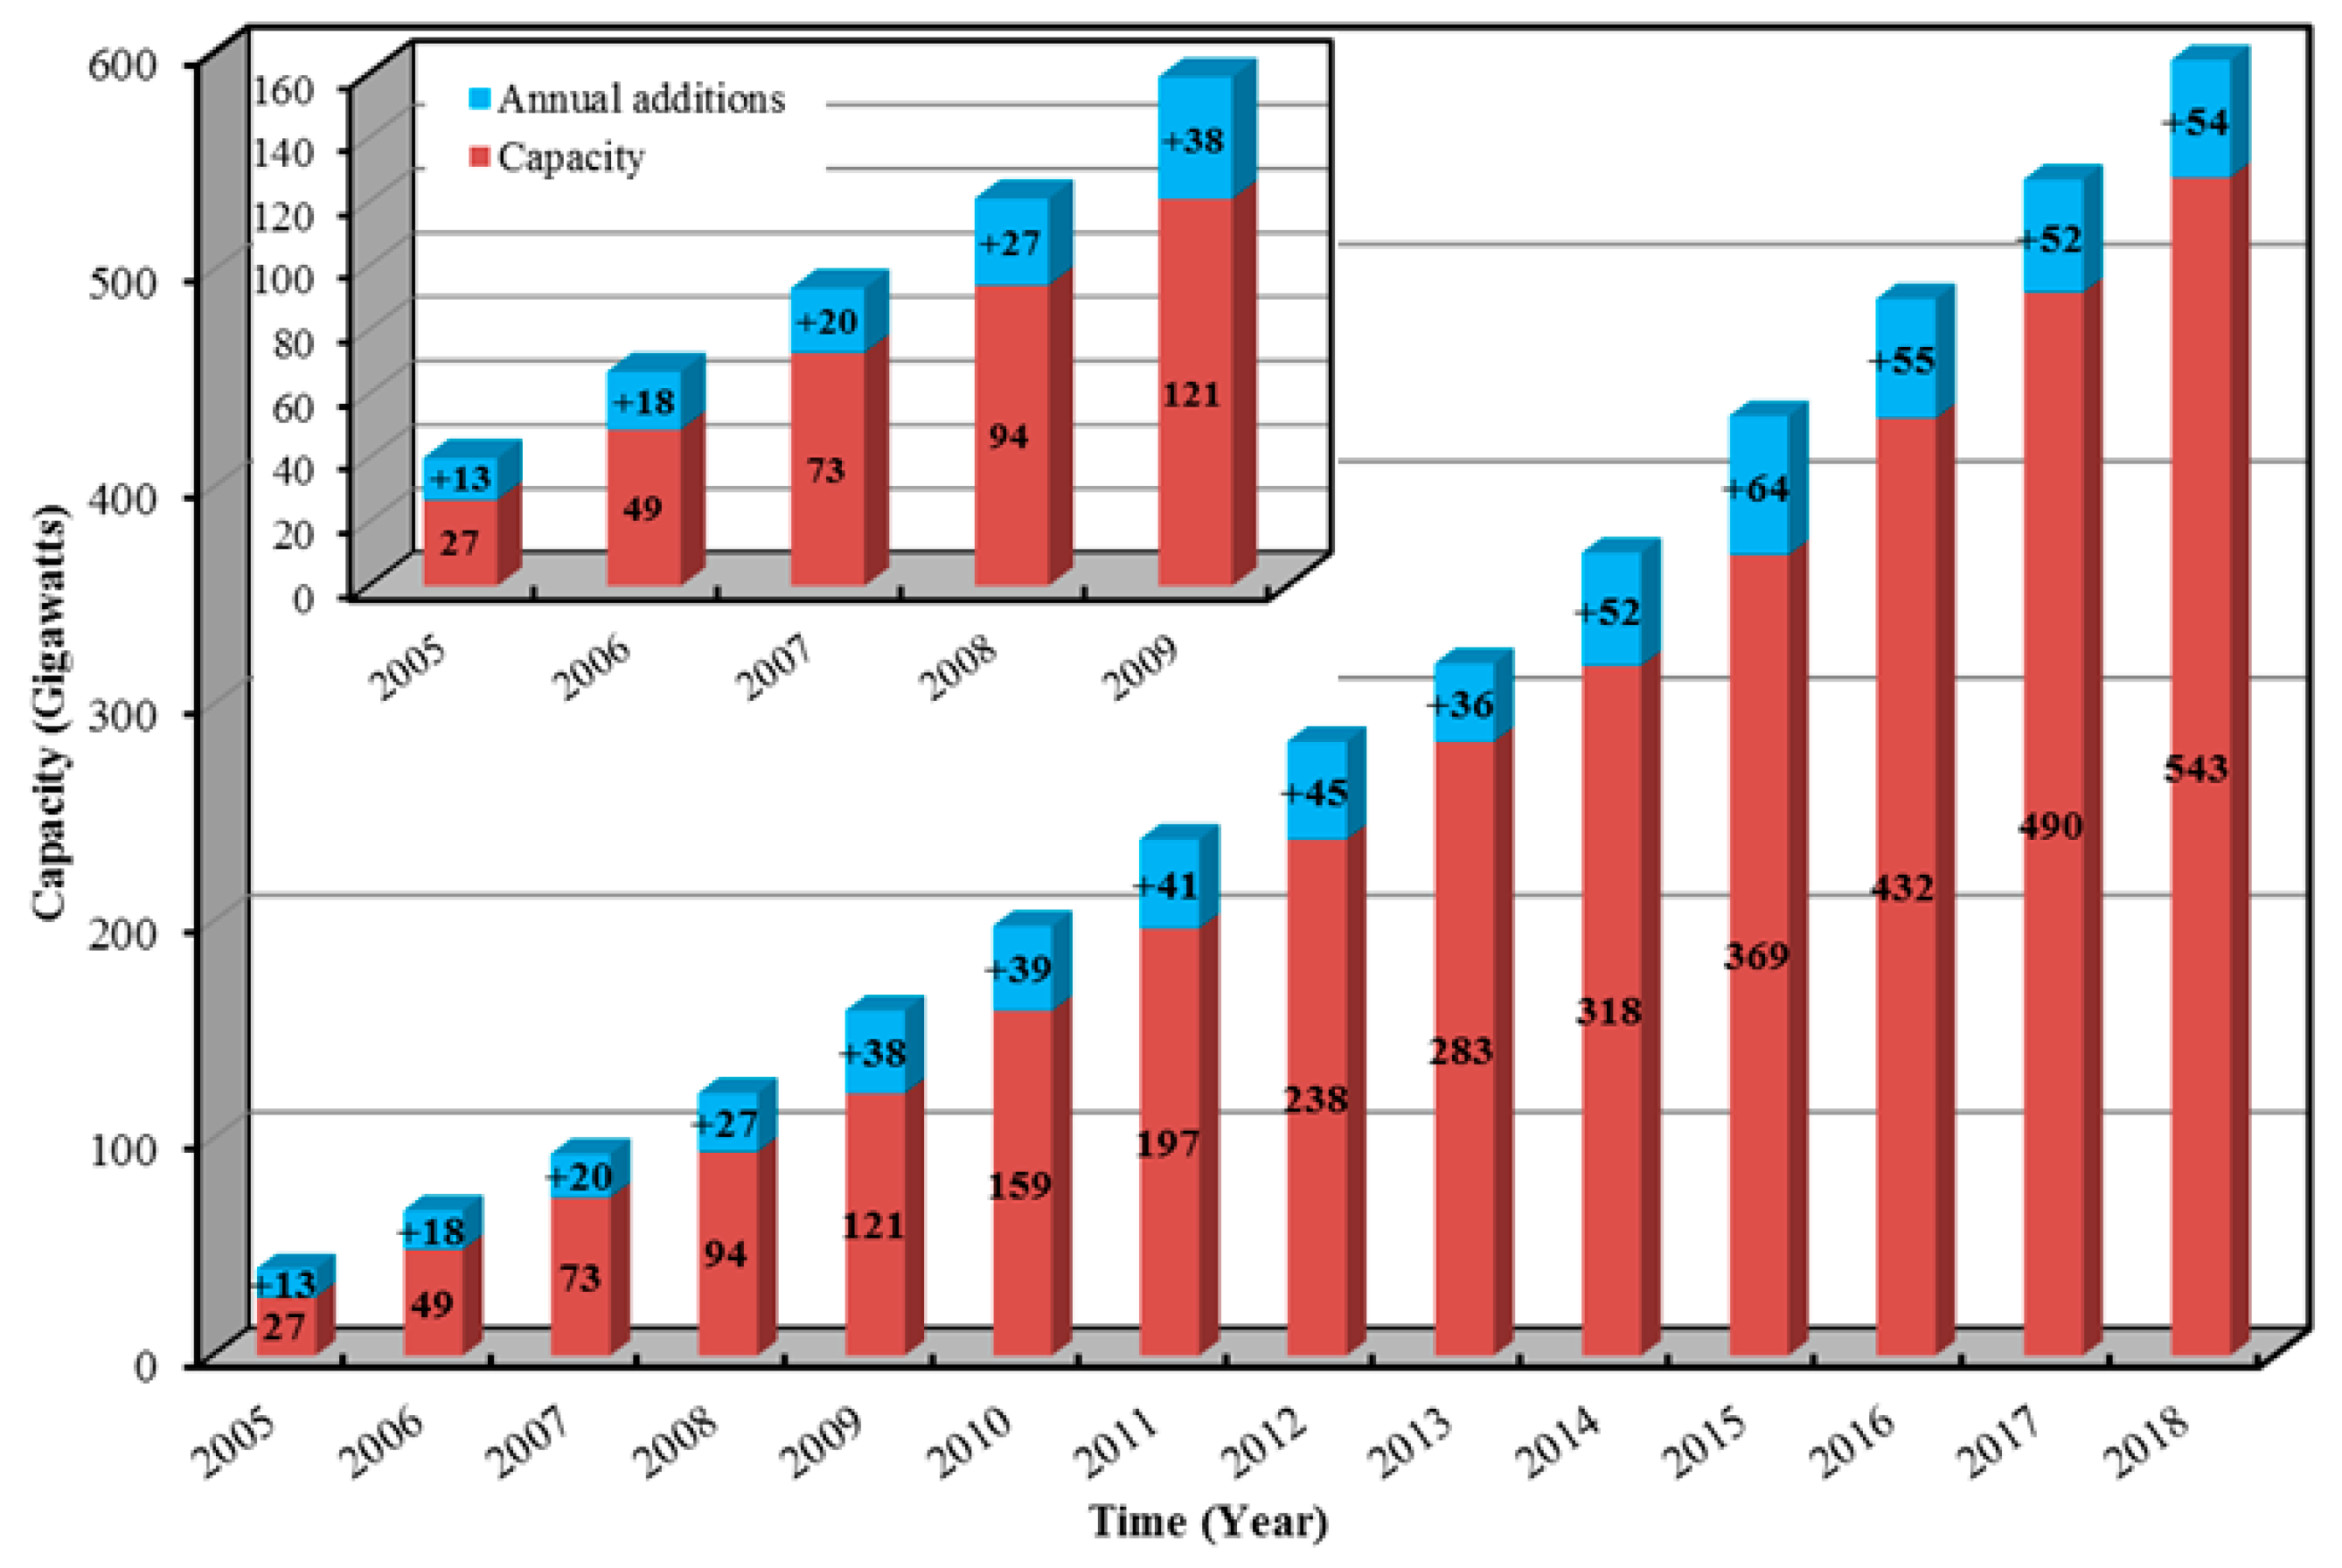
1.1. Global Wind Power Capacity
The total capacity of wind turbines installed worldwide increased to 542 GW in 2017. By 2018 this figure reached 597 GW [
13].
Figure 1 shows the total capacity of wind energy systems (WESs) around the world for the period between 2007 and 2018. The countries that have the largest capacity of WESs are shown in
Figure 2. The three largest contributes during this period were China, the United States, and Germany, with 19.7 GW, 7GW and 6.1 GW, respectively. The proportion of WES from the total energy production in China rose steadily in the last years, rising from 3.3% in the year 2015 to 4.8% by 2017 [
13]. In 2018, Denmark set a new world record with 51% of its electrical power generation produced from wind energy [
13]. An increasing number of countries have also reached a double-digit wind power share, including Germany, Ireland, Portugal, Spain, Sweden and Uruguay [
14].
1.2. Problem and Method
Wind power produces clean energy. However, it is often during the manufacturing and installation stages, such as the extraction and transportation of raw materials, manufacturing various parts of the wind turbine and its transportation, that produces harmful emissions released into the surrounding environment [
15]. Consequently, an investigation and evaluation of the environmental impacts and energy performance of a wind farm system have become all the more imperative.
A Life Cycle Assessment (LCA) method, as defined by the International Organization for Standardization (ISO), provides a cogent way of assessing the environmental impacts related to phases of a product’s life [
15,
16,
17]. LCA assists all relevant stakeholders such as developers, designers, policymakers, and researchers in attaining relevant data pertaining to the environmental effects of different energy options. It is evident that renewable energy sources and their mechanisms, such as wind turbines and PV panels, for instance, emit greenhouse gases in their manufacturing and installation phases. These harmful byproducts are generally measured in CO
2 units, as the latter is considered to be one of the main contributors to climate change. The proceeding section details this study’s methodical process and relevance.
1.3. Literature Review
LCA studies of wind turbines are often based on those with low power capacity production that typically fall below one MW. Schleiner [
18] conducted the first wind turbine LCA for a 500 kW turbine. Ardente et al. [
19] carried a life cycle analysis of a wind farm operating 11 turbines with an estimated power output of 660 kW. Khan et al. [
20] created a LCA of a hybrid wind-turbine system containing fuel cells, with a wind turbine having a power rating of 500 kW. In addition, several previous studies have been conducted based on large wind farms. Alexandra et al. performed an LCA on two onshore and two offshore wind power plants [
21]. The main findings from their study confirmed that materials are responsible for more than 70% of climate change impacts both onshore and offshore. Similarly, Martinez et al. [
22] investigating the environmental effects of wind turbines in Spain using LCA, found that the foundation phase contributed significantly to environmental impacts. A study by Oebels et al. [
23] also reported that for a 141.5 MW wind farm in Brazil, over 50% of emissions emanated from tower manufacture, whereas transportation accounted for only 6%. The emission intensity of carbon dioxide was found to be 7.10 g CO
2/kWh in Brazil. Further reaffirming these findings is Wagner et al. [
24] that conducted LCA on a German offshore wind farm alpha ventus. The results obtained found that 1 kWh generated electricity from the wind farm, also generated 0.137 kWh primary energy-equivalent and 32 g of CO
2-Equivalent. Al-Behadili and El-Osta [
15] performed LCA on Dernah wind farm located in Libya. The analysis revealed that the energy payback period is around 0.475 year with the payback ratio at 42.1. These reported results confirm that wind energy produces the lowest CO
2 emissions per kWh of electricity (~10 g m/kWh) compared to fossil fuel.
Raadal et al. [
25] evaluated the greenhouse gas (GHG) emissions and energy performance of an offshore wind power farm. Six different 5-MW offshore wind turbines were part of their evaluation. The resulting GHG emissions varied between 18 and 31.4 g CO
2- equivalents per kWh, while the energy performances were assessed as energy payback ratio (EPR) and energy payback time (EPT), both varying between 7.5 and 12.9, and 1.6 and 2.7 years. Huang et al. [
26] also conducted LCA and energy evaluation of offshore wind power systems.
Lenzen et al. [
27] proved that the tower, typically composed of steel, constitutes 23.3% of the average total mass of the turbine. The concrete foundation may account for almost twice as much or 60.3% of the overall average mass. Since concrete and steel account for the significant quantity of mass, choosing discrete values for emission factors and energy content could lead to considerable variances in the LCA results. Meanwhile, the required input energy for extracting and refining steel depends on the refinement technique (that is, blast furnace or electric arc furnace), the type of steel product (plate steel against galvanized or rebar coil) as well as the country the product was manufactured. Such variability has resulted in energy input values within past studies ranging between 20.7 and 55 MJ/kg of steel [
28].
Furthermore, assumptions regarding material recycling may influence LCA outcomes [
29]. The recycling may affect indirect emissions and input energy at the end of life cycle-during the refining/extraction of raw materials or in the decommissioning stage of the wind turbine. The application of recycled materials for the manufacture of turbines leads to emissions and less input energy. This is because the emissions and consumed energy emanating from the recycled materials do not exceed that of raw materials. Similarly, recycling materials at the end of a wind turbine’s life cycle decreases the quantity of emissions and input energy emanating from any future use. When utilized as a credit for LCA results, this may save a significant quantity of input energy and avert associated air emissions. In cases where materials of the wind turbine are recycled to a maximum practical extent, recycling may lead to averting almost 20% of the wind turbine’s life cycle energy input [
30].
Wang and Sun [
31] developed an innovative technique to estimate CO
2 emissions per kWh produced throughout a wind farm’s life cycle. Using four wind farms, their study found that current wind power plants have a lifetime emission intensity of 5.0–8.2 g CO
2/kWh electricity. Davidsson et al. [
12] comparative analysis of 12 previous studies further details the methodical practicalities and advantages to be had utilizing an LCA method.
Finally, new indicators based on an engineering approach of irreversibility are proposed by Lucia and Giulia [
32]. These indicators can be used to evaluate both the technological level and the environmental impact of the production processes as well as any effects on the socio-economic conditions of the countries undergoing their installation. These are based on the exergy analysis and the irreversible thermodynamic approach.
1.4. Research Objectives
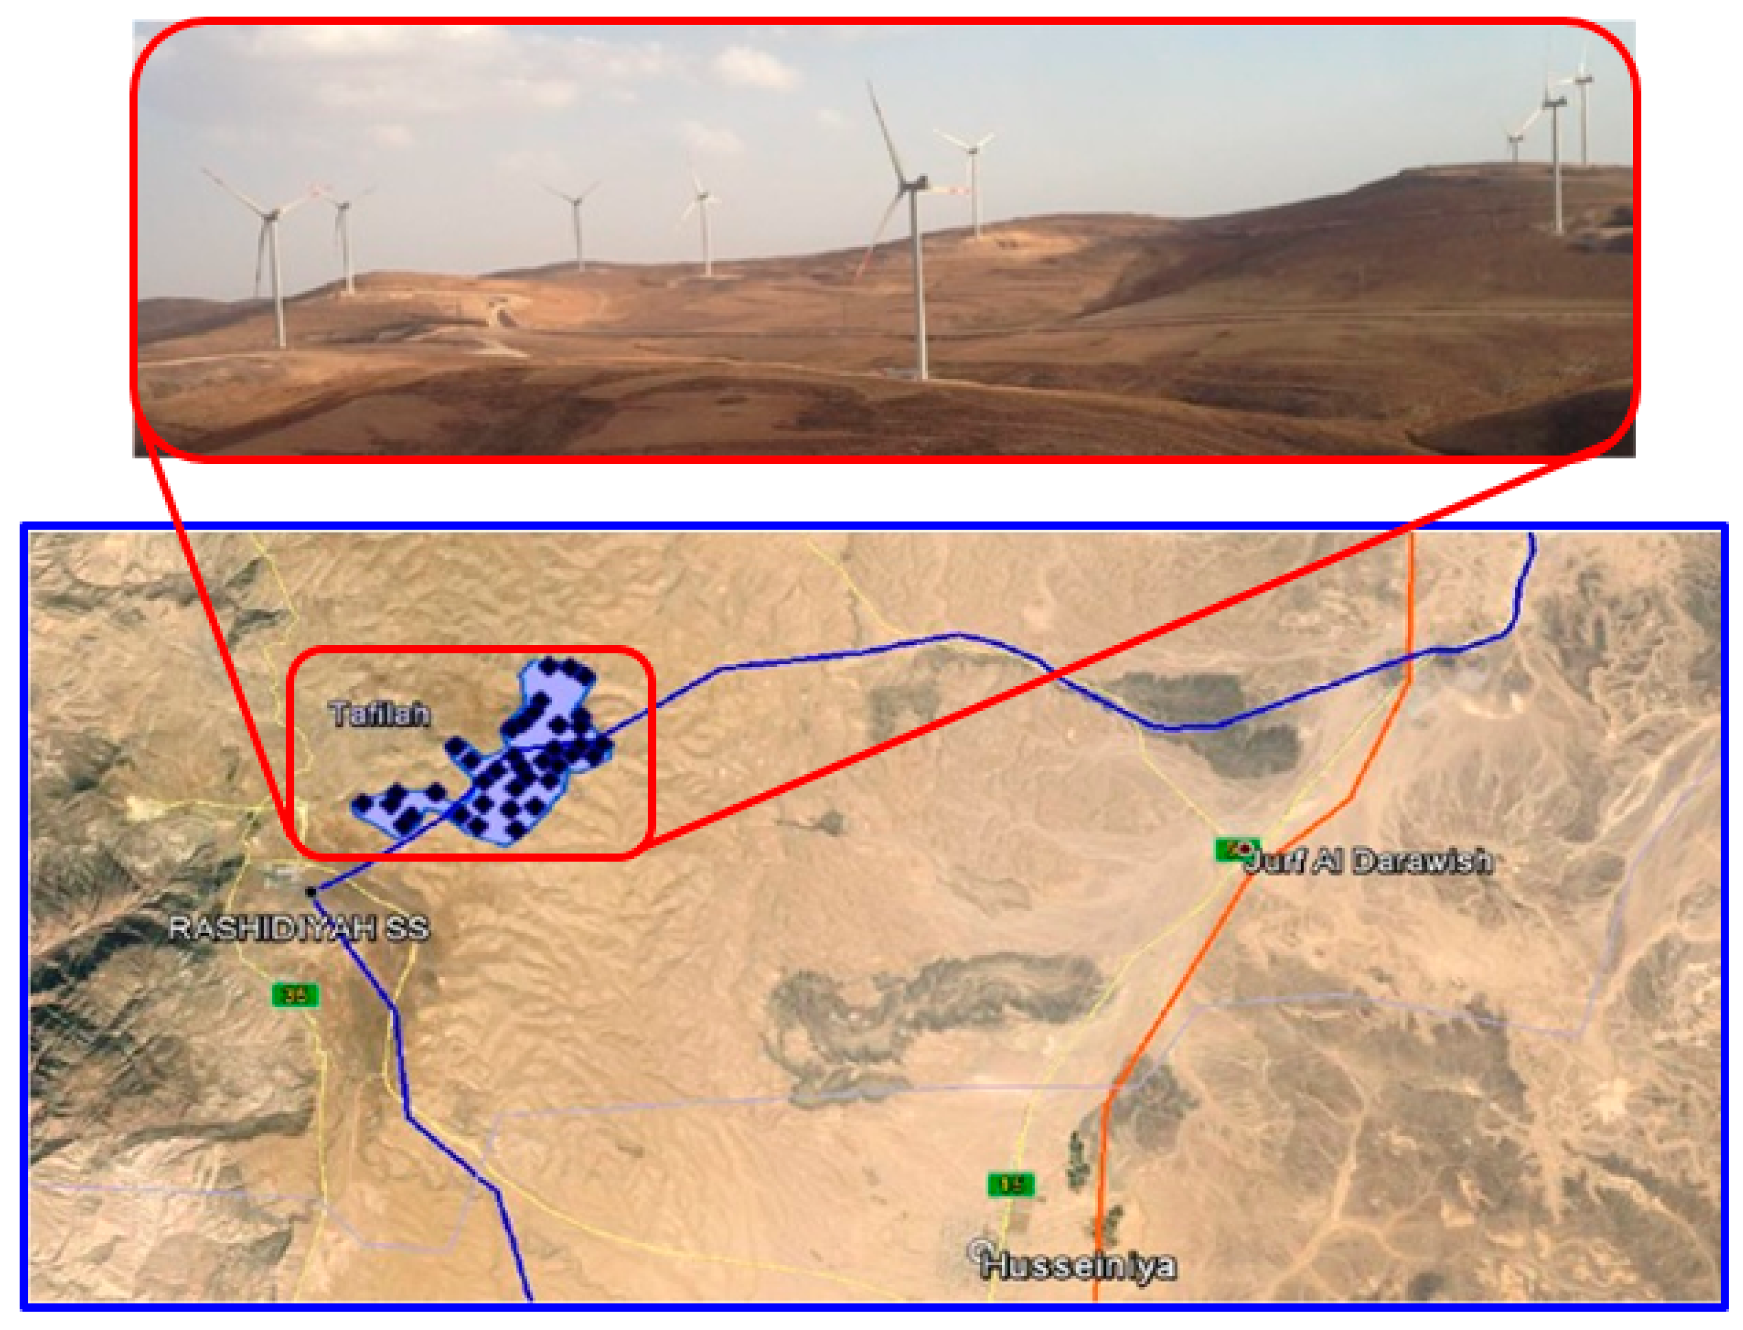
Tafilah Wind Farm (TWF) was the first developed wind energy system to materialize from Jordan’s Renewable and Energy Efficiency Law that was passed in 2010. This law stipulates that at least 7% of the country’s electricity supply must come from renewable energy sources by 2015, and reach at least 10% by 2020 [
33]. The farm was designed for an operational capacity of 117 MW at the start of the TWF operation in 2015. This came with a total investment of USD
$287 million [
34,
35]. Thirty-eight Vestas wind turbines, each with a 3-MW capacity, were installed. The wind farm was established in a location 180 km south of Amman, and 20 km east of the Tafilah Governorate as shown in
Appendix A, via
Figure A1. Jordan’s onshore wind turbine provides for a useful case study. This owes to both its generalizability owing to its use of large wind turbines commonly found across the globe, as well as being the first enterprise wind farm plant established in Jordan. Installing TWF had increased Jordan’s total power capacity by 3%, creating enough electricity to be able to power around 83,000 residential homes. The farm produces approximately 371 GWh of electricity annually, with TWF displacing almost 235,000 tons of CO
2 emissions per year. TWF accounts for almost 10% of Jordan’s 1800 MW renewable energy target for 2020 along with 3% of the country’s total energy needs [
36].
The objective for developing an LCA method for this study is to obtain an overview of the benefits of using wind energy as a renewable energy source in contexts like Jordan. Jordan is an example of a non-fossil fuel producing country that is overly reliant on external sources of support in this area. The findings are to assist local and international policy makers and investors in this field and providing a base for any subsequent studies and investigations into alternative energy sources for developing countries.
Therefore the main objective of this study is to evaluate the environmental impacts and energy performance of the first case of a wind farm installed in the Tafilah region located in the south of Jordan using a comprehensive life-cycle assessment (LCA) method. The foci of analysis here is an assessment of the greenhouse gas emissions from a wind farm during its manufacturing and installation phases. The results of this evaluation can illustrate the benefits to be had from wind energy and whether this provides for a stronger case in proceeding in the establishment of further wind farms in Jordan and similar developmental contexts.
2. Data Collection and Specifications
Figure A1 in
Appendix A lists the turbine components and its specifications.
Table 1,
Table 2,
Table 3 and
Table 4 show the material quantities for particular turbine components (nacelle, rotor, wiring, tower, and foundation), along with the SimaPro categories chosen for modelling such materials. When a category such as steel is selected in SimaPro, all processes for producing the steel, including mining and raw materials processes, are included in the inventory numbers that accompany the steel. The processes of manufacturing the materials into each turbine part were considered on an aggregated level, this includes all materials and energy used to manufacture each turbine part.
As illustrated via
Table 1, the modified data includes the number of thirty eight turbines in TWF, compared to the thirty three turbines quoted in Garrett and Rønde [
37], while
Table 2 accounts for the quantities and materials used in the wiring of V112 Turbines.
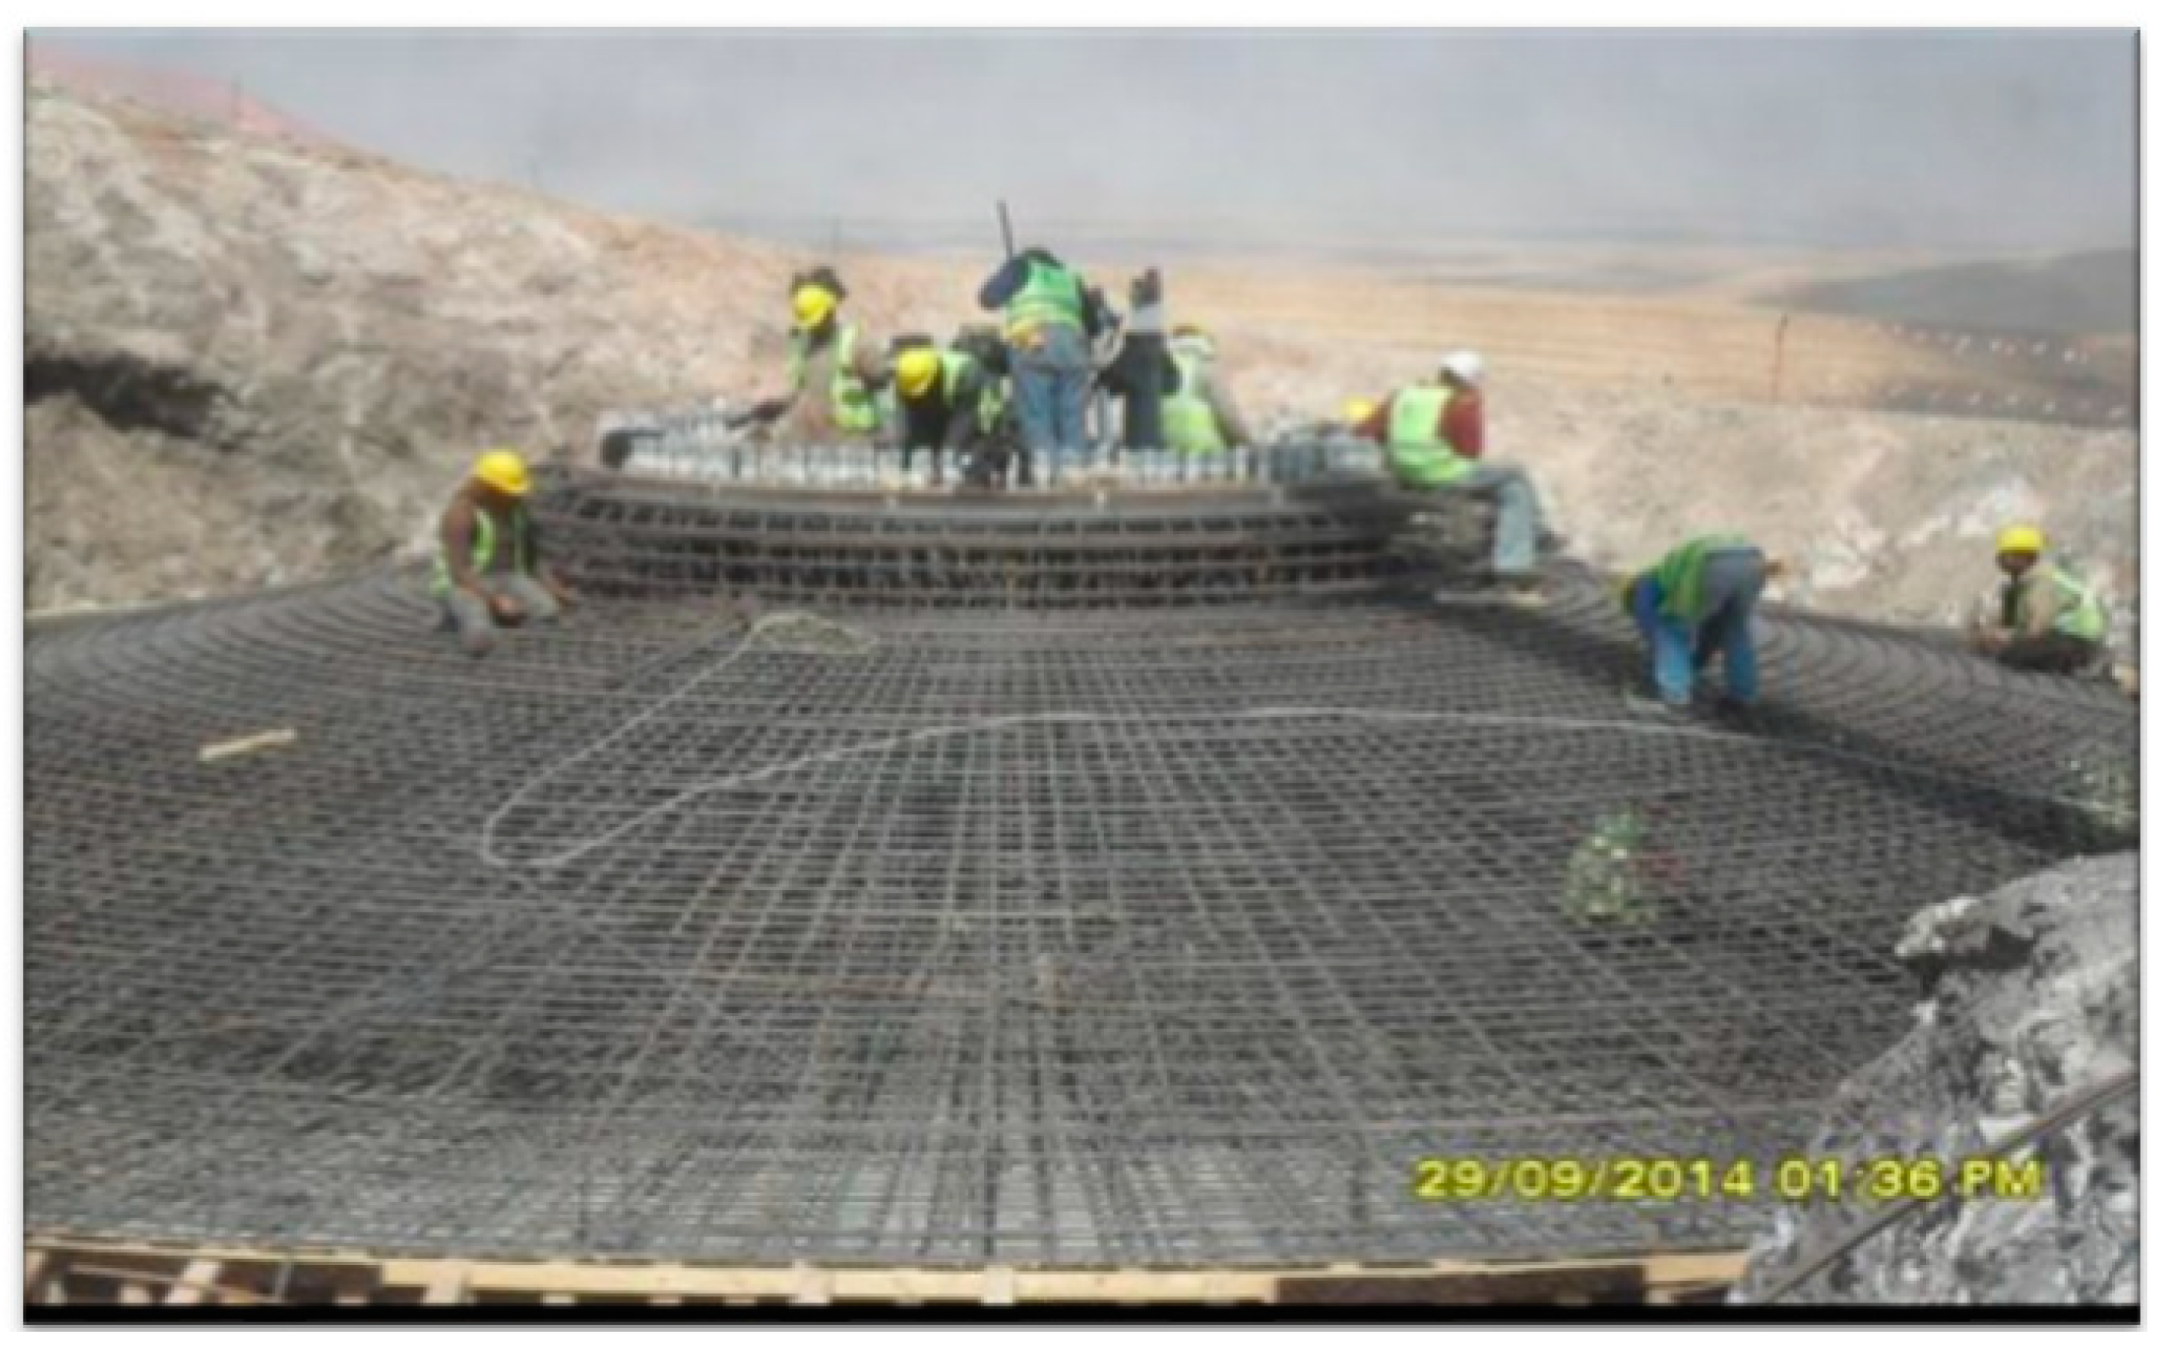
The concrete quantities used in the wind turbine foundation components of V112 Turbines are shown in
Table 3, whereas
Figure A2, in
Appendix A, shows the actual site during the construction stage of one of the wind turbine concrete foundation. The concrete material was supplied from a concrete plant a few kilometers away from the site, and the steel for reinforcement was supplied by a local company south of the capital city Amman.
The electrical grid connection for TWF was established at a voltage level of 132 kV. Physical connections were carried out through the 132 kV double circuit overhead power lines that currently run through the wind farm area. Currently, these power lines connect the substations of El Hasa and Rashadiyah at a voltage level of 132 kV. In order to attain an electrical connection, a new substation was erected near these mentioned power lines inside the wind farm area. Built, operated and owned by national energy production company (NEPCO), this substation became one of many erected by this electrical company that manages high voltage grids in the southern region of Jordan.
Figure A3, in
Appendix A, shows the substation that connects Tafilah wind farm with that of NEPCO at a high voltage level, while
Figure A2 lists the substation components and quantities used for the V112 turbine.
The project data sheets indicate that the shipping and transportation of the materials were done via land and sea, with both routes relying on diesel as a fuel resource. Transportation and shipping of the raw materials to the Vestas production plants followed a route starting from manufacturers in Denmark to the port city of Aqaba in Jordan, and then to its final construction place at the Tafilah wind farm.
Table 4 summarizes the distance and weights that were used throughout the modelling process. Using SimaPro, the distances were taken starting from the manufacturing locations, to their shipping sea ports, from these ports to the port of Aqaba in Jordan, and finally from Aqaba to the site of the wind farm in Tafilah. For modelling purposes via SimaPro, distances were entered in ton-kilometers (tkm).
The wind turbine installation phase included the performance of various activities undertaken in the assembling of the turbine and its component parts. Primarily, this included the construction of the foundation and the substation for collecting the power produced by the turbines. However, the main activities throughout this phase include; setting up of the control building, laying underground cables for the entire project, and preparing the access roads to the project site. The foundation for the onshore turbine consists of plate foundations made with reinforced concrete. Production of the concrete was included in this phase.
Table A3 in
Appendix A details the timetable for the construction phase.
The wind turbines’ foundation size was 20 × 20 m with a depth of 2.65 m. The diesel quantity to complete the construction of each turbine consisted of 21,600 liters of diesel. The amount of fuel was calculated as follows: ten pieces of heavy equipment (2 excavators, 2 loaders, 3 heavy trucks, bulldozer, crane, and grader) working simultaneously for periods of up to 12 h/day at an average diesel consumption rate of 30 liters/h. According to this timetable, starting from Wednesday, 6 November 2013–Thursday, 9 October 2014 (338 calendar days), excluding weekends and public holidays in Jordan (totaling 110 days), the resulting working days totaled 228 working days. Therefore, 10 heavy equipment × 12 h/day × 228 days × 30 liters/h)/38 = 21,600 liters/turbine.
The operation and maintenance phase entails the corrective and preventive maintenance of the turbines. This includes changing of oil, lubrication of gears and generator, as well as repair of the turbines when problems such as a breakdown occur. Manufacturer recommendations insist on lubricating the turbines once every five years, while recommending checkups on lubrication levels every other year. Each turbine consumes 375 kg of lubricant oil each time it is lubricated. This figure is equivalent to the 400 liters that are used for the Tafilah wind farm.
Table 5 shows the amount of lubricant needed in three different lifespans for all the turbines in the wind farm. The frequency of maintenance (e.g., lubricating) is assumed to remain constant over the 30 year lifespan. Since the turbines of this model have not yet reached their 20-year lifespan, there is no available data to show that the turbines might require more maintenance beyond these years.
Transport of materials for maintenance and repair of the turbines is carried out using diesel trucks. In addition to this, at least twice a year, a technician must survey the conditions of the turbines and cables. Transport of turbine parts and their materials for maintenance and repair are also reliant on the use of diesel trucks. This is further compounded by the need for routine assessments of the turbines and cables, to be conducted at least twice a year by a certified technician [
38].
Regarding the end-of-life phase, the average recyclability for the Vestas V112 3.0 MW wind turbine has been estimated at 81% [
39]. It is assumed that the entire turbine components are collated at the end of each life cycle phase. However, the entirety of the turbine is not recycled simultaneously nor in the same way; this process is outlined in
Table 6. All metal components, including gears, transformers, tower sections, etc., are assumed to be 98% recyclable. While 95% of cables are recyclable, the other parts of the turbine need to be treated.
Table 7 provides the energy consumption values for each phase of the life cycle, as well as for raw materials acquisition and manufacturing of major parts of the turbine. Energy consumed in the form of diesel fuel has been converted into kWh. The energy values for the parts include raw materials acquisition and manufacturing, but not transportation, as shown in
Table 7.
3. Methodology
3.1. Life Cycle Assessment Method
The LCA method is often employed to measure the environmental effects and energy performance of wind energy [
16]. LCA can facilitate the identification of opportunities to enhance the environmental aspects of products in several aspects of their life cycle. These cycles are decision-making in industry, public or private sectors i.e. governmental or non-governmental organizations (e.g. strategic delineation, priority position, product or process design or redesign). There are four stages in an LCA study. These include the Objective and Domain Definition Phase, Inventory Analysis Phase, Impact Rating Phase, and finally, the Interpretation Phase. These four phases are briefly described as follows [
40,
41]:
(1) Goal and Scope Definition Phase: In this phase, the definition of the product system is based on the functional unit (1 kWh) and system borders. The system boundary determines processes that will be examined within the life cycle assessment. One particular boundary that must be defined is the geographical area since the infrastructure and the ecosystems sensitivity to environmental impacts vary from one region to another. Of further importance, is defining the time boundary.
(2) Life Cycle Inventory (LCI): In the inventory analysis, material inputs, energy, waste outputs, and emissions for different processes that are within the system boundary are quantified. During LCI, all proper data is collected and collated. Without an LCI, a foundation for evaluating comparative environmental effects or possible environmental improvements would be near impossible. The data is collected directly from organizations, utilities, and firms or existing databases.
(3) Life Cycle Impact Assessment (LCIA): In this phase, LCIA converts inventory data into environmental and health effects information. Simultaneously, it minimizes significant data items of the inventory into a small quantity of effect scores. This involves modeling the possible effects of the inventory outcomes and presenting them in the form of impact scores.
(4)
Life Cycle Interpretation: This refers to a systematic process of evaluating, checking, qualifying, and identifying information from impact assessments and inventory analysis conclusions, and presenting them to fulfill the application requirements that were used for describing the scope and goal of the study. In addition, it offers recommendations and limitations and describes the environmental effects of each phase of the life cycle so a relationship can be derived at between the environmental impacts and the thresholds or the safety limits [
42,
43]. The appropriate interpretation may lead to valid and viable conclusions and recommendations, which will enable all relevant stakeholders to establish rules and regulations accordingly.
3.2. System Boundaries
The system boundaries considered in this study are defined according to boundaries in relation to nature in this LCA, where the consideration here is the entire life-cycle of the wind turbine, from the extraction phase of raw materials to the point of the total loss of its value (recycling or land filling) [
44]. Part of this study is the decommissioning and maintenance of the turbine. The latter two phases are part of the lifetime of the turbine. The phase of material production covers the extraction as well as the manufacturing of the materials, i.e. the processing of the raw materials into intermediate materials. Likewise, this phase covers transportation of raw materials to the process location of intermediate materials, and in turn, the subsequent transportation of the latter to the construction site of the wind turbine. The decommissioning and maintenance phase also includes the transportation needs of waste materials and old parts.
Geographical Boundaries: Jordan provides for the geographical limit in this study’s LCA. However, the production of "green energy" produced during the operating life of the turbine depends on the location of the wind turbine in terms of low, medium or high wind speed. In LCA, the appropriate location for a wind farm with relatively high wind speed is to be found in Jordan’s southern regions, where the medium range of wind speed is around 7–15 m/s.
Time Horizon: In this study, the time horizon refers to the time frame and date used in the study.
Allocation Procedures: Because only one product is produced, no allocation problems in the manufacture and operation of the wind turbine are identified.
Figure 3 shows the system boundaries for the wind turbine life cycle assessment. This includes the four phases, starting from raw materials, the amount of energy and the amount of fuel used in the extraction of the materials and processing [
39]. The manufacturing phase includes the components that were manufactured in Vestas factories or otherwise purchased from other manufacturers. The operation and maintenance phase includes the installation process. The end life phase also includes landfill and recycling.
3.3. Impact Assessment Method
SimaPro complies with the International Organization for Standardization (ISO) 14,040 and 14,044 methods [
43]. There are several methods within this that can be used in calculating the environmental impacts of a product. In this study, Tool for Reduction and Assessment of Chemicals and Other Environmental Impacts (TRACI) was used to calculate environmental impacts [
45]. TRACI methodology is consistent with the EPA decision of the non-aggregation between environmental impact categories and characterization, classification, and normalization. The normalization factors for the United States and Canada were calculated by Morten Rybert from the Technical University of Denmark [
46]. The characterizations of stressors that have potential effect on the environment facilitated by TRACI method are; global warming (kg CO
2eq), acidification (kg SO
2eq), human health cancer effects (carcinogenic) (comparative toxic units—humans, CTU
h), human health criteria-related effects (non-carcinogenic) (CTU
h), respiratory effects (kg PM
2.5eq), eutrophication (kg N
eq), ozone depletion (kg CFC-11eq), ecotoxicity (comparative toxic units—ecotoxicity, CTU
e) and smog (kg O
3eq).
3.4. Energy Performance
To measure the energy performance of a wind farm, there are two main energy indicators: energy payback ratio (EPR) and energy payback period (EPP). The useful energy produced by the wind farm is compared with the energy consumed by it throughout its entire life cycle. EPR is defined as the ratio between the energy developed and that which is consumed by the wind farm. The estimated payback time period for the consumed energy by the wind farm is called EPP.
4. Findings and Analysis
4.1. An Impact Assessment of TWF
The impact assessment represents the summation of all substances emitted into the atmosphere from all phases of V122 3-MW turbines (Tafilah Wind Farm). The results obtained pertain to the manufacturing and transportation phases, installation phase, and operation and maintenance phases. Amongst all the pollutant inducing phases, the manufacturing phase appears to cause the highest amount of pollution, with the operation and maintenance phases responsible for the lowest. The installation phase emits high quantities of carbon dioxide this may be due to the use of fossil fuel and chromium, most likely owing to chromium being naturally present in cementitious materials. The top 9 phases responsible for emissions are listed in
Table 8 and presented in
Figure 4 based on TRACI 2 V3.01 methods.
Global Warming – Carbon Dioxide (CO2): Substantial amounts of CO2 were released during the life cycle of the wind turbine. CO2 is a primary contributor to global warming. Starting from the raw materials acquisition phase; the use of fossil fuels caused high levels of carbon dioxide to be emitted. This was further compounded by the manufacturing phase, which included heating and cooling processes used in the fabrication of metals and other materials. There were also heavy processes in the installation phase that consumed fossil fuel and released carbon dioxides along with various other harmful substances.
Carbon dioxide is released in the completion of every phase or process that consumes fossil fuel. According to
Table 9, CO
2 was emitted in 91% of all phases. The operation phase possesses the lowest emittance rate of CO
2 (zero emission) in comparison to all other listed phases. The manufacturing and raw materials have the highest values in CO
2 emission in comparison to the rest.
Sulfur Dioxide (SO2) Acidification Category: Sulfur dioxide is produced whenever fossil fuels containing sulfur (coal and oil) are burned or mineral ores smelted. The combustion process aides in the release of sulfur dioxide. While the focus of this study is on the impact of CO
2 emission, for broader reference the authors have included the acidification category that is presented in
Table 10.
Nitrogen Oxides (NOx): This contributes to the impact categories of acidification, eutrophication, respiratory effect, and ozone smog. The NOx is usually produced during combustion at high temperatures and is thus produced during the manufacture processes of the turbine parts, as detailed in
Table 11.
Methane (CH4), Fossil, μm: This substance is often released whenever fossil fuel is part of the process. Like carbon dioxide and sulfur dioxide, the burning of natural gas and other types of fossil fuels causes the release of methane into the atmosphere. Fuel burning takes place throughout most of the listed phases, and this explains the high quantities of methane emission. Methane is one of the most significant pollutants to come from the wind turbine industry, as shown in
Table 12 for smog category analysis.
In addition, large amounts of particles were emitted in all the TWF phases including the manufacturing processes. For example, in the production of the blades made of fiber glass and the finishing processes requiring sanding and grinding, causing fine particles to be released during the process into the surrounding atmosphere. Fossil fuel as well as other variants of fuels used in the transportation phase may also be attributed to causing particle formation during the wind turbine’s life cycle.
Table A4 in
Appendix A illustrates the contribution of all listed phases of a wind turbine operation to the environmental impact categories. Measured in percentages, the table shows the biggest impact element in global warming to be CO
2 emission with an emission rate of 91.43%. 73.5% of the total figure is derived from the use of raw materials during the extracting and manufacturing phase, 24.9% during the installation phase, 1.41% in the transportation phase and 0.1% during the operation phase.
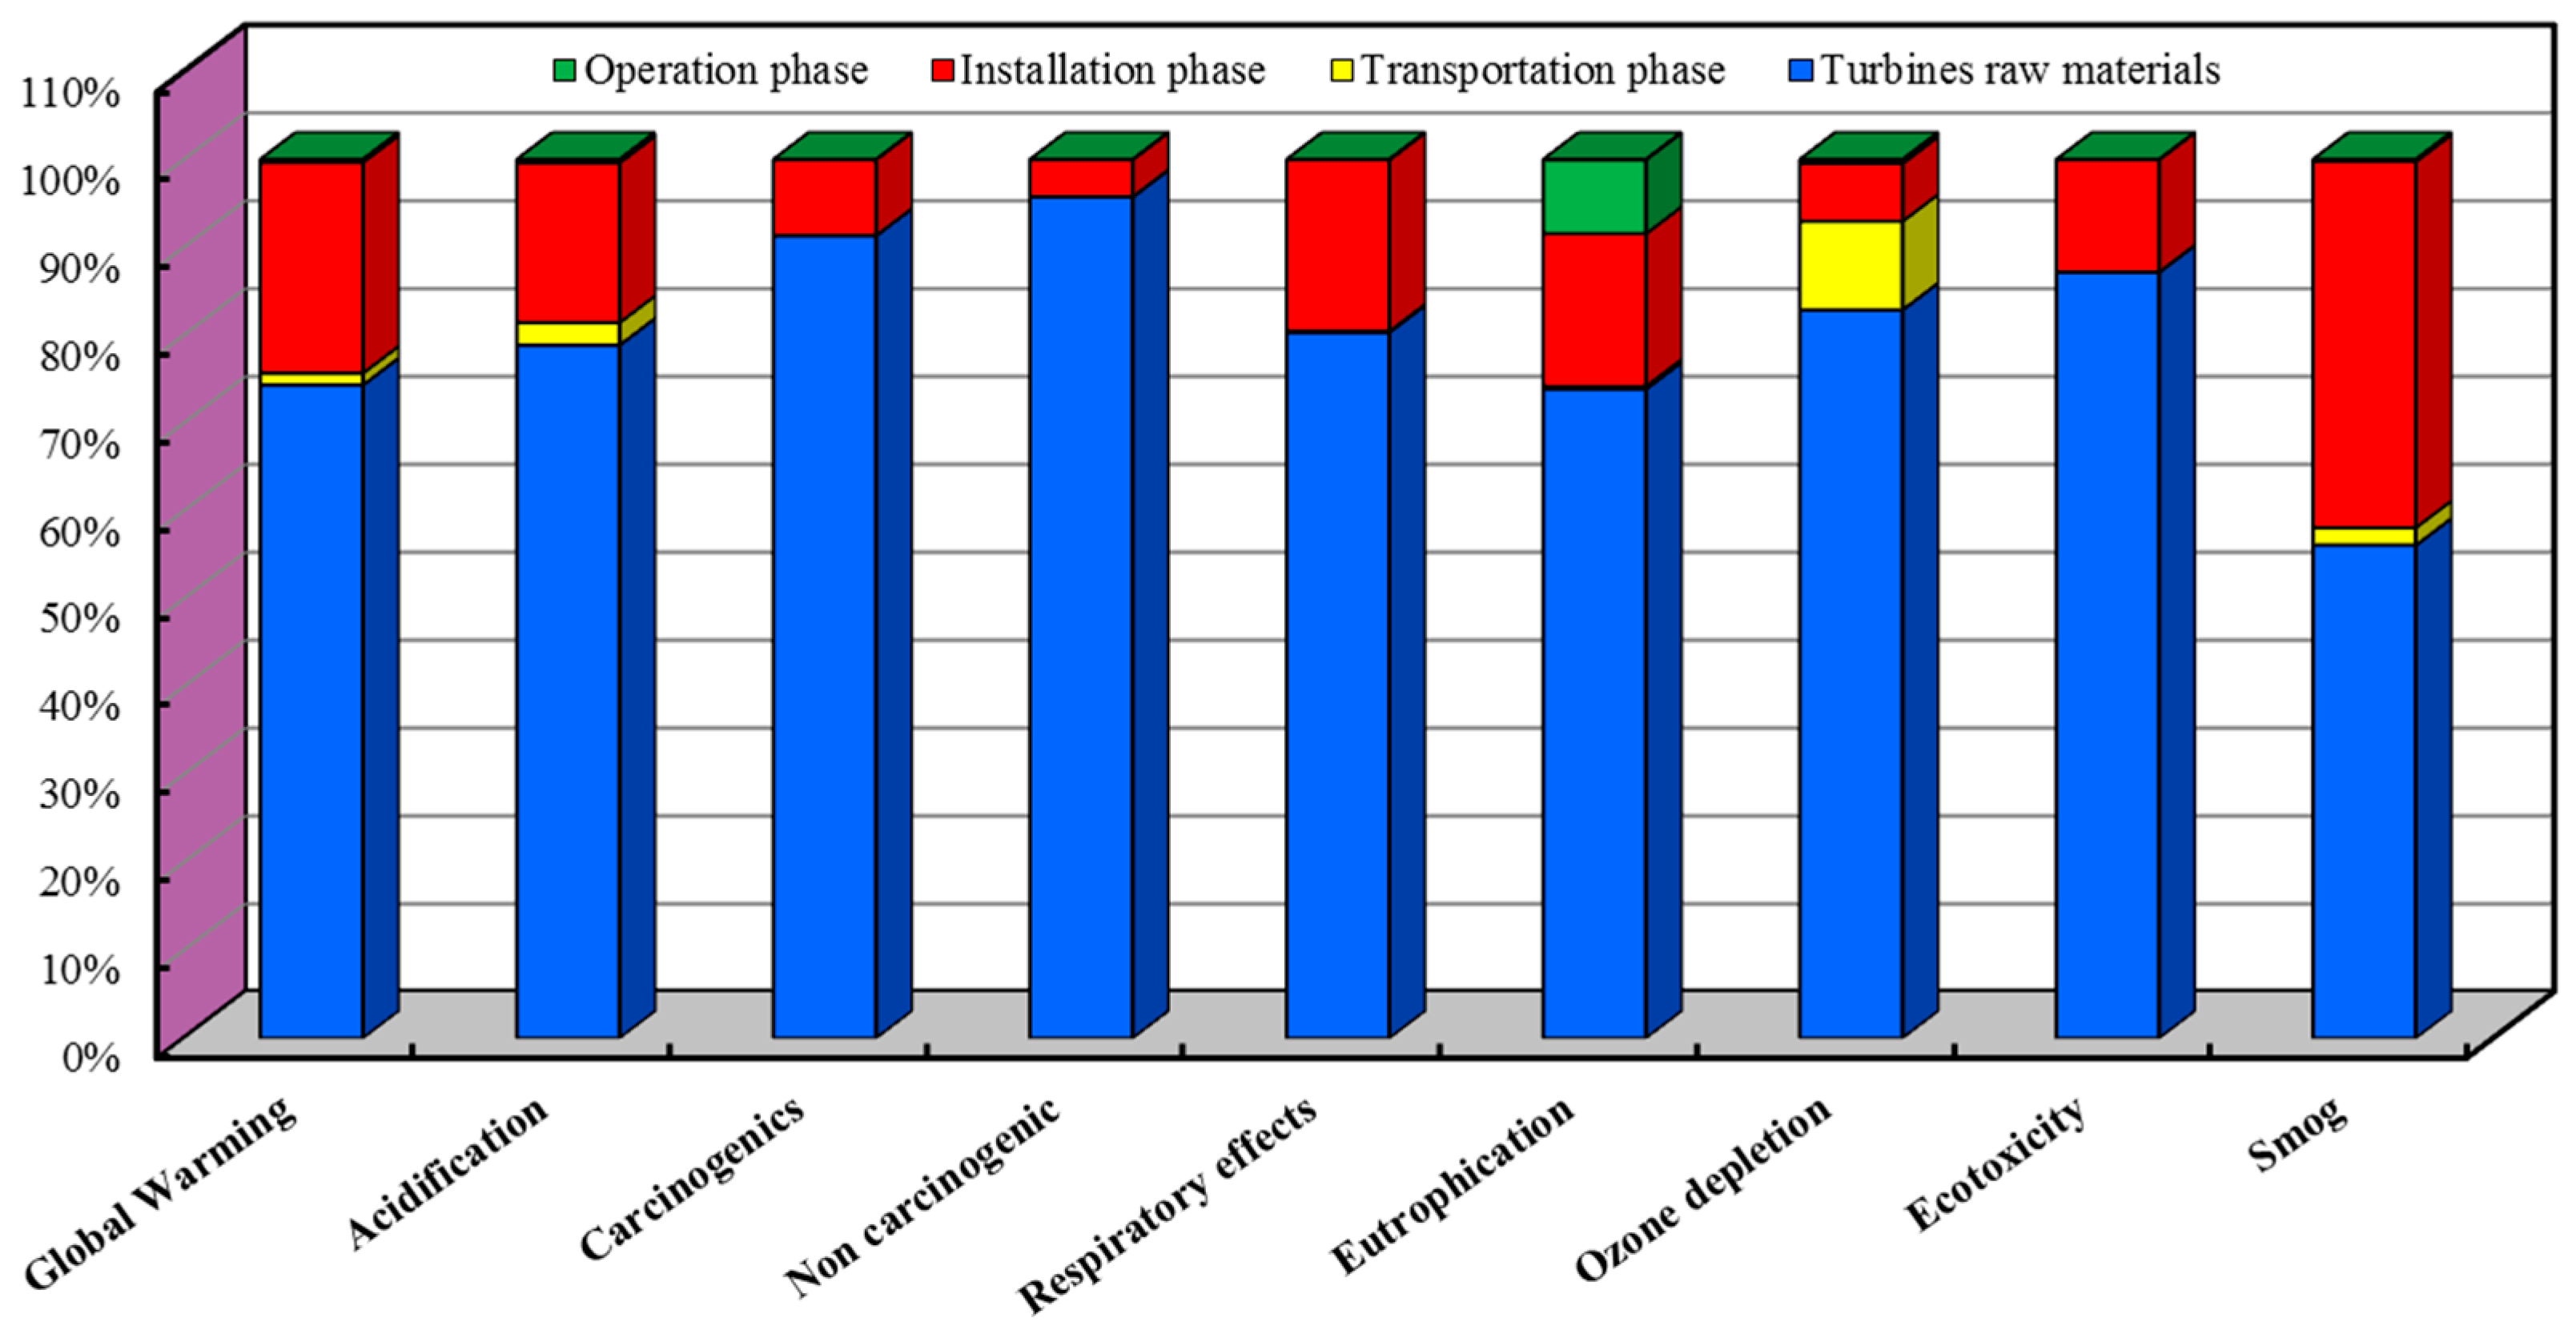
4.2. Impact Assessment of 1 kWh Energy Production
Table 13 highlights the contribution of all phases of the wind turbine toward the environmental impact categories. The wind turbine has six main phases throughout its life cycle. These are raw materials procurement, manufacturing, installation, operation and maintenance, and end-of-life, which include the disassembling of the turbine parts, and the recycling or landfilling of turbine materials. The sixth phase, namely transportation, includes transportation activities between all the previous phases. However, it is the manufacturing phase that primarily affects the results of this study. The manufacturing stage contributes to more than 80% to the impact categories of respiratory effects, human health potential, and eutrophication; more than 70% to the categories of acidification and global warming; and more than 25% to fossil fuel depletion, ozone smog formation, and stratospheric ozone depletion.
As illustrated in
Table 13 above, the manufacturing phase causes the highest percentage of environmental impacts per 1 kWh of generated electricity. This largely owes to the varied and complex manufacturing processes involved. For example, manufacturing a blade starts with the lay-up of a wet fiber made of fabric that is placed manually in a tool for lamination and then uniformly coated with liquid resin; this lamination process causes pollutants to be released, particularly fine particles, as this type of process requires grinding and sanding. After the resin is cured, the
prepreg lay-ups (
prepreg is a term for fabric reinforcement that has been pre-impregnated with a resin) are laid in a specially designed mold. This mold is subsequently closed, sealed, pressurized, and heated to the required or optimum temperature. This process yields the desired shape and dimension of the turbine blades; here heating requires fuel, causing the release of pollutants, including carbon dioxide. The sealant has a high concentration of chemicals such as polycyclic aromatic hydrocarbons (PAHs) and acids.
The turbine’s tower forms the largest part of the turbine and is made entirely of zinc coated steel. The tower is divided into several parts. Each part has a specific mold where the steel is heated to a high enough temperature (2500 °F) and then poured into the mold to form the required shape. This welding process causes various pollutants to be released, including components of particles such as lead, nickel, zinc, iron oxide, copper, cadmium, fluorides, manganese, and chromium, and gases like carbon monoxide and oxides of nitrogen [
47,
48,
49]. The last part is the nacelle, which contains the engine and all other devices to control the engine and blades. Most of the nacelle parts are manufactured in various plants and then assembled in one place. The transportation of these parts generates emissions such as NOx and particulate matter (PM) owing to the use of diesel [
50] fuel for the process.
Electricity used for manufacturing contributes most of the inventory emissions and impacts. Burning of coal for power production generates sulfur dioxides, fine particulates, and mercury. All of these substances are critical contributors to acidification, respiratory effects and non-carcinogenic health impacts derived from the manufacturing phase.
The burning of coal or natural gas for electricity production typically generates nitrogen oxides that are the main contributors to eutrophication and ozone smog formation that emanate from the manufacturing phase. They are also a secondary contributor to acidification. Any global warming impacts to be had are derived primarily from fossil fuel used and burnt during the manufacturing phase of the various types of steel for the tower, and nacelle and fiberglass for the rotor blades.
The transportation phase contributes 1.3% to the impact categories of global warming (CO2) due to its consumption of diesel fuel. Vehicles burning diesel fuel generate large amounts of nitrogen oxides that contribute to smog formation. Consequently, transportation in this context can be considered the largest contributor to ozone smog formation.
The installation phase contributes almost 24% to the global warming impact categories. The installation phase includes the production of cement for the concrete foundation. Cement production is energy-intensive, thus contributing to substantial greenhouse gas emissions. This energy is largely used for operating heavy equipment during the installation phase. Welding here is also a contributor to fossil fuel consumption that generates emissions of carbon dioxide in the climate change category.
As illustrated in
Table 13, the remaining phases possess less of an impact compared to that of the raw materials, manufacturing, transportation, and installation phases. The operation and maintenance phases include travel between the turbines twice a year for lubrication and inspection of turbine parts. The impact figures derived from this process is 0.3% of the global warming category and 8% impacts in eutrophication category. The environmental impacts of the recycling stage were not included in the end-of-life phase owing primarily to the recycled materials being used to make various other products altogether. The emissions from these processes are appropriately included with the new products.
4.3. Energy Balance
One of the most productive assessments in the life cycle analysis is the product’s energy balance. This refers to the net sum of the cumulative energy demand (CED) (negative) and energy production (positive) throughout the product’s lifespan. This method allows for the estimation of the length of time required for the turbine to generate the amount of energy consumed during the entirety of its life cycle and the number of times it is amortized in terms of energy.
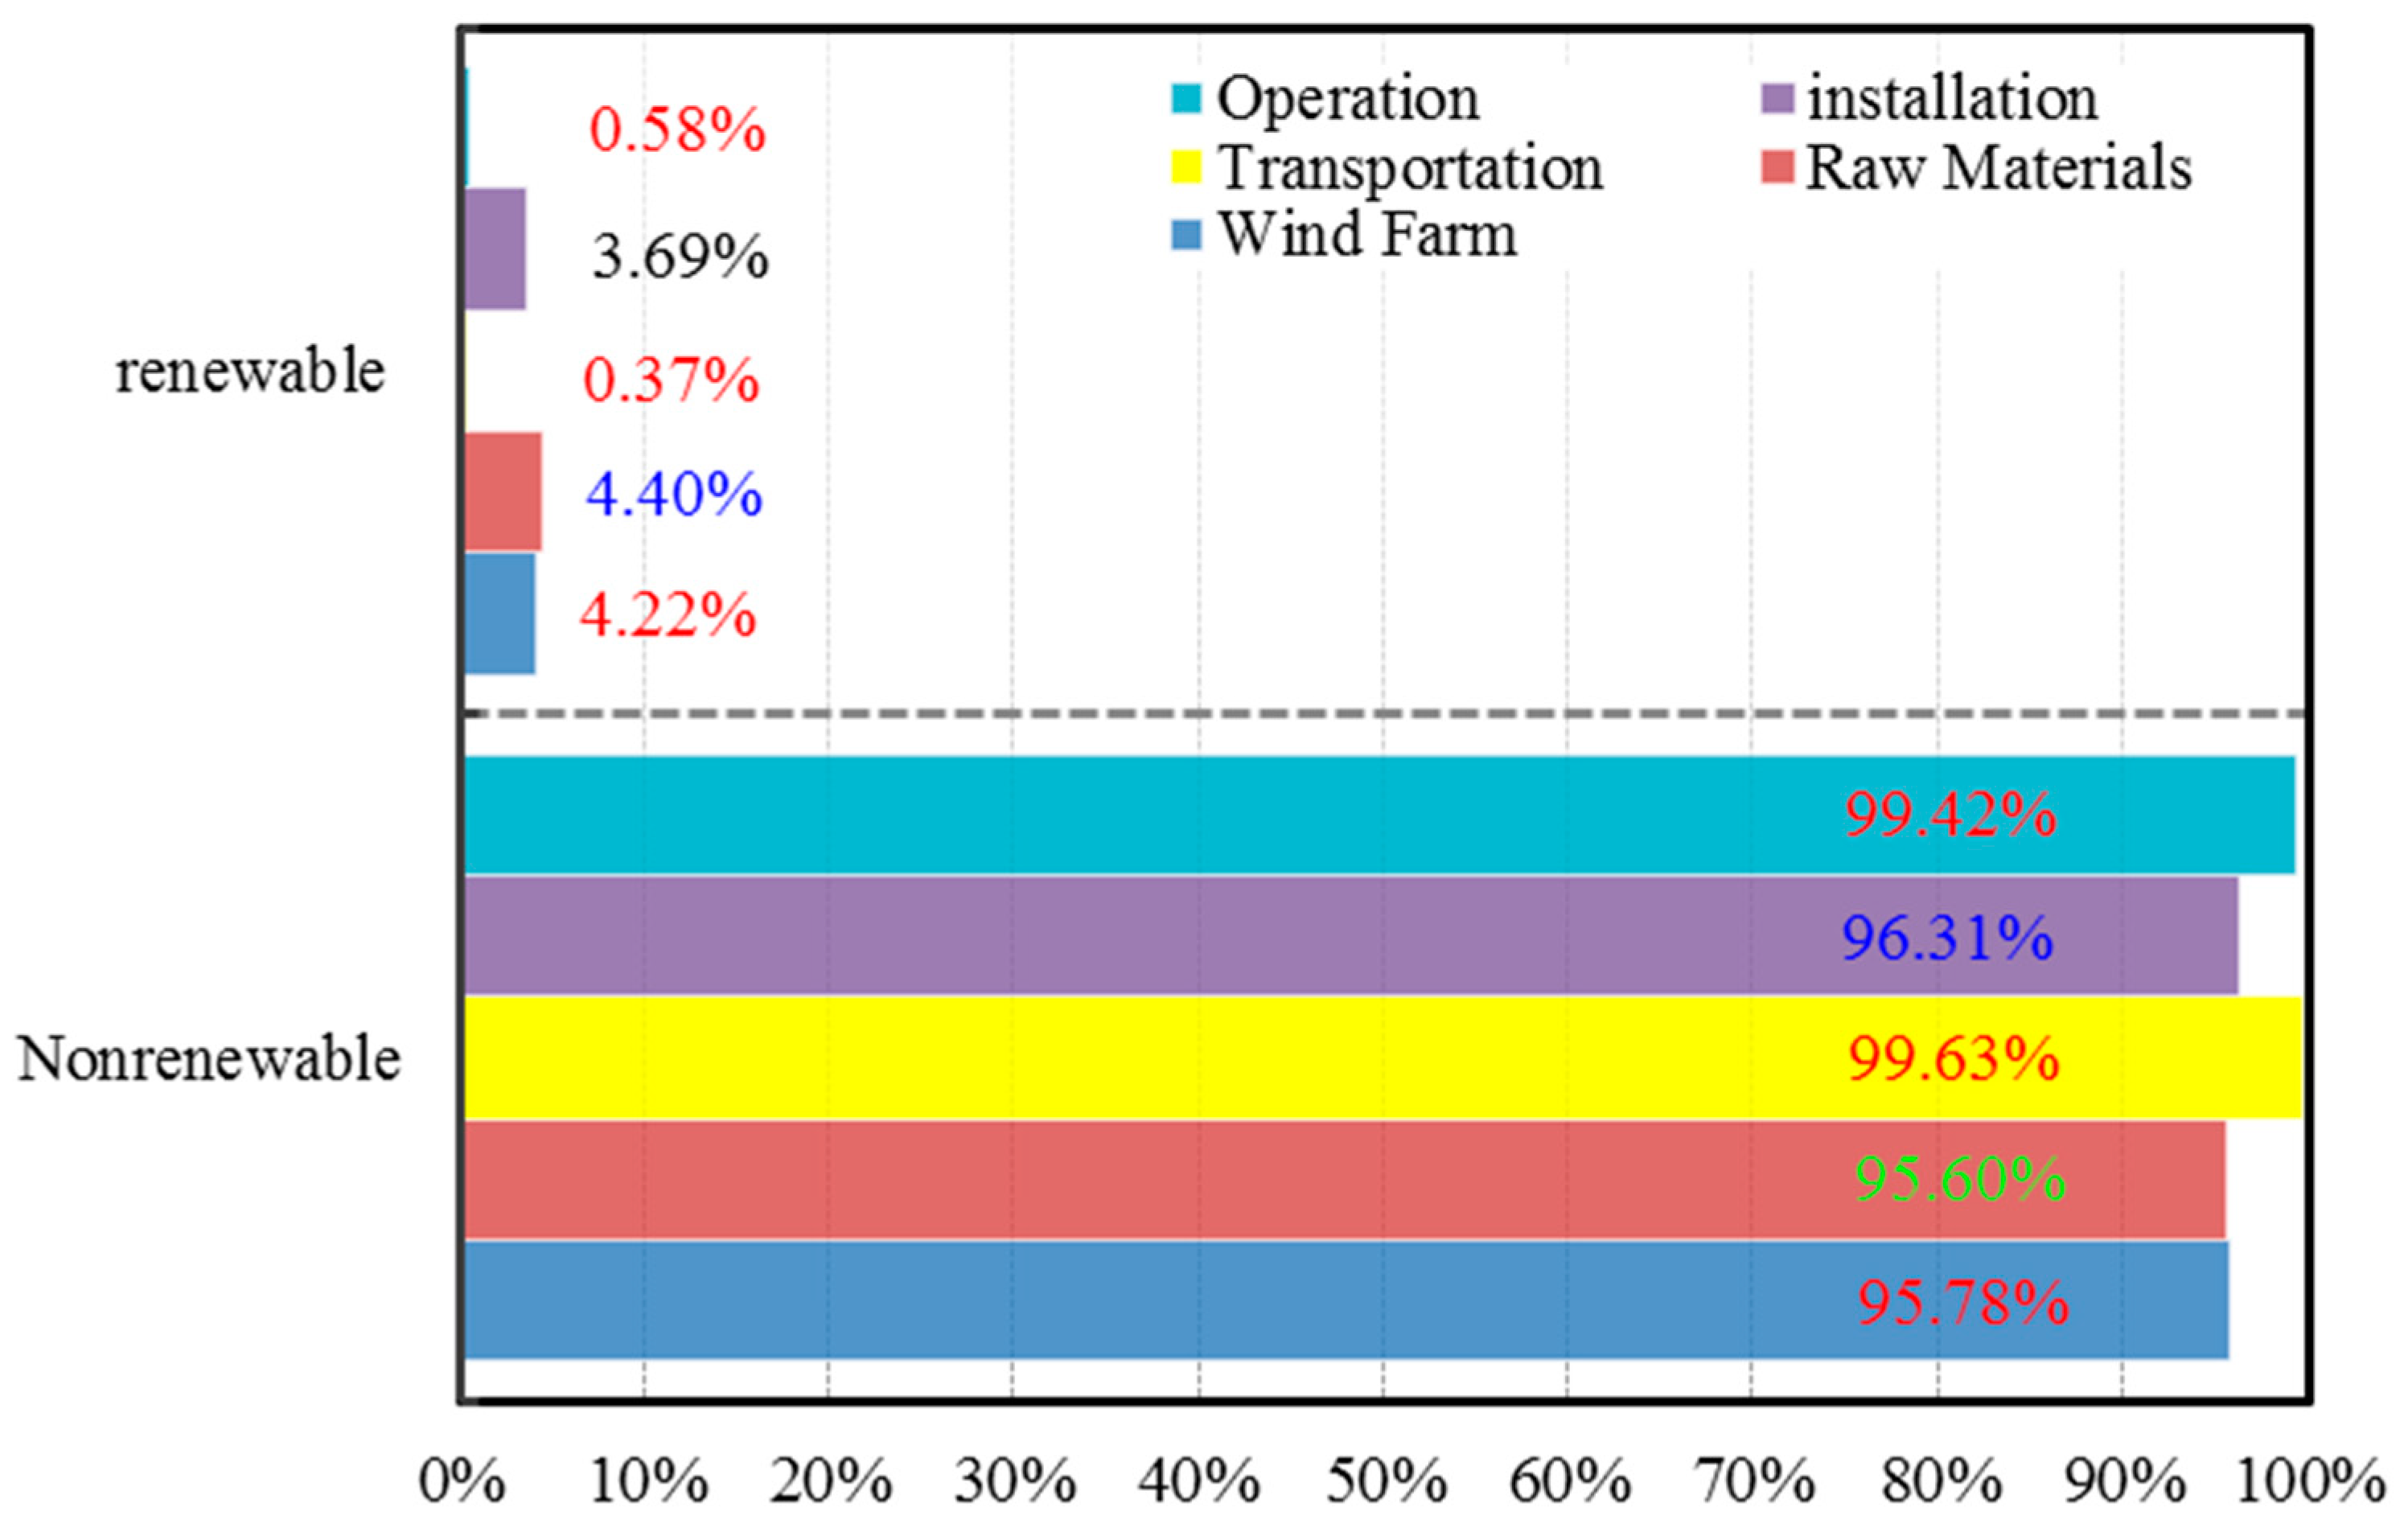
Table 14 and
Figure 5 illustrate in detail the cumulative energy demand for each phase of the turbines’ life cycle. Most of the used energy in all phases (>90%) are from nonrenewable sources (fossil fuel and nuclear). Large industries around the world continue to rely on fossil fuel as an energy source. Turbine manufacturing and raw material components were responsible for 80% of total energy consumption. The total renewable energy that was used in the life cycle of the wind farm according to the cumulative energy demand method is equal to 11 GWH with a percentage of 4.22%, as shown below in
Table 14. This is significantly low in comparison to that of non-renewable energy of 256.8 GWh with a percentage of 95.78%.
For the sensitivity analysis, the energy produced by the TWF at different wind speeds and over different lifespans is approximated. Three cases of the wind speed were then calculated. The first used a fixed wind speed of 8 m/s. This wind speed represents the optimal value of turbine performance according to the manufacturer. In the second case, 7 m/s was chosen to test for a wind speed below optimal performance. The third case involved using the ‘wind rose,’ representing the theoretical wind speed in the area. The final results obtained are from the TWF.
An alteration in wind speed would also alter the observed impacts owing to changes in energy production values. Since 7 and 8 m/s wind speeds represents both optimal performance and near realistic performance, only energy production could be calculated in this part of the sensitivity analysis. Other impacts were not revised.
Table 15 summarizes the energy for each case, the average wind rose, 8 m/s, and 7 m/s, and the actual results that rely on average annual productions of kWh.
From
Table 15, the theoretical energy production of the 38 turbines at TWF over a 20-year lifespan using an average wind rose is 7420 GWh/371 GWh/year.
Table 14 shows that the CED per Farm is 256.4 GWh, making the energy payback ratio 28.9 and the energy payback time period 0.69 year (approximately 8 months) to produce the energy consumed during the whole lifespan of the turbines. In addition, the annual CO
2 saving is 371 GWh/year (electricity production) × 0.602 kg CO
2 eq/kWh = 2.23 × 10
8 kg.
The given value of 0.602 CO2 eq/kWh is the LCA emission factor for electricity production from the steam power plant or electricity purchases in Jordan.
For this project’s case study, the average energy payback time and emissions are 8 months and 9.11 gCO
2/kWh respectively. This is in comparison to the average energy payback time and emissions of 7 months and 9 gCO
2/kWh, for the study conducted by Guezuraga et al. [
51]. This project’s findings reaffirm those of previous studies.
Table 16 and
Table 17, show the LCA’s approximation of total electricity sent to the national grid during the 20-year life expectancy of the installed wind turbines is 2.5 × 10
4 GWh with 90%, 1.1 × 10
5 GWh with 80%, 4.74 × 10
5 GWh with 70% and 1.86 × 10
6 GWh with 60% of generated electricity. The analysis also indicates that the expected number of newly manufactured and installed wind turbines are 3; 15; 64 and 252 times of the original 38 turbines at TWF. This expectation was based on the deduction of 10%; 20%; 30% and 40% of the total generated electricity sent to the national grid for a life cycle of 10 years. This is shown in
Figure 6, displaying the cumulative number of newly manufactured and installed turbines coupled with various percentages of the produced energy from the TWF. It can also be seen that the newly manufactured and installed turbines are, 10; 86; 569 and 3167 times × the original 38 turbines for a life cycle of 20 years.
5. Conclusion
This study investigates the environmental impact and energy performance of wind farms using an LCA method. This LCA study evaluated the impacts of environmental, health, and resource consumption, of V112 3-MW turbines that were installed in the province of Tafilah in the southern region of Jordan. All the phases throughout the wind turbine’s life cycle, from raw acquisition materials to manufacturing, installation, operation, and maintenance, were investigated for the purposes of performance and environmental impact assessments.
The manufacturing phase was found to produce the largest impact: 91% of global warming and 64% of cumulative energy demand. The transportation phase contributed to approximately 50% of the impact categories of fossil fuel depletion and ozone smog formation. This largely owed to the latter’s reliance on diesel fuel. The use of diesel fuel during the installation phase also led to 30% of ozone depletion and global warming impacts during this process. The analysis further revealed that the energy payback period is 0.69 year (8 months), with a payback ratio of 29. This reaffirms the assumptions and findings of previous studies discussed throughout this paper. Finally, this study also demonstrates that the annual CO2 saving is around 223, 302, and 310 × 106 kg for annual generated power 371, 501, and 515 GWh/year, respectively.
Ultimately, it is the methods and materials from the manufacturing phase of turbine parts that require further investigation and possible reassessment. The objective should be geared toward reducing energy consumed and the subsequent environmental impacts incurred, as it is this phase that saw the greatest generation of environmental impacts within this and previous studies. The stainless steel material and concrete productions form the largest and smallest impacts. At present, the benefits illustrated in this study of replacing the steel in the turbines tower with green cement could be further investigated and evaluated. Furthermore, using the exergy inefficiency as an indicator for sustainable development analysis should and will be considered in any further studies.


