Influence of the Spacing of Steam-Injecting Pipes on the Energy Consumption and Soil Temperature Field for Clay-Loam Disinfection

1
College of Engineering, Nanjing Agricultural University, Nanjing 210031, China
2
Jiangsu Province Engineering Laboratory for Modern Facilities Agricultural Technology and Equipment, Nanjing 210031, China
*
Author to whom correspondence should be addressed.
Energies 2019, 12(17), 3209; https://doi.org/10.3390/en12173209
Submission received: 3 July 2019
/
Revised: 16 August 2019
/
Accepted: 17 August 2019
/
Published: 21 August 2019
(This article belongs to the Special Issue Advances in Design, Modelling, and Applications of Heat Transfer Equipment)
Abstract
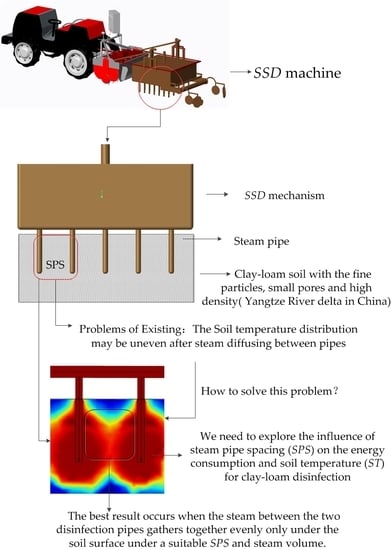
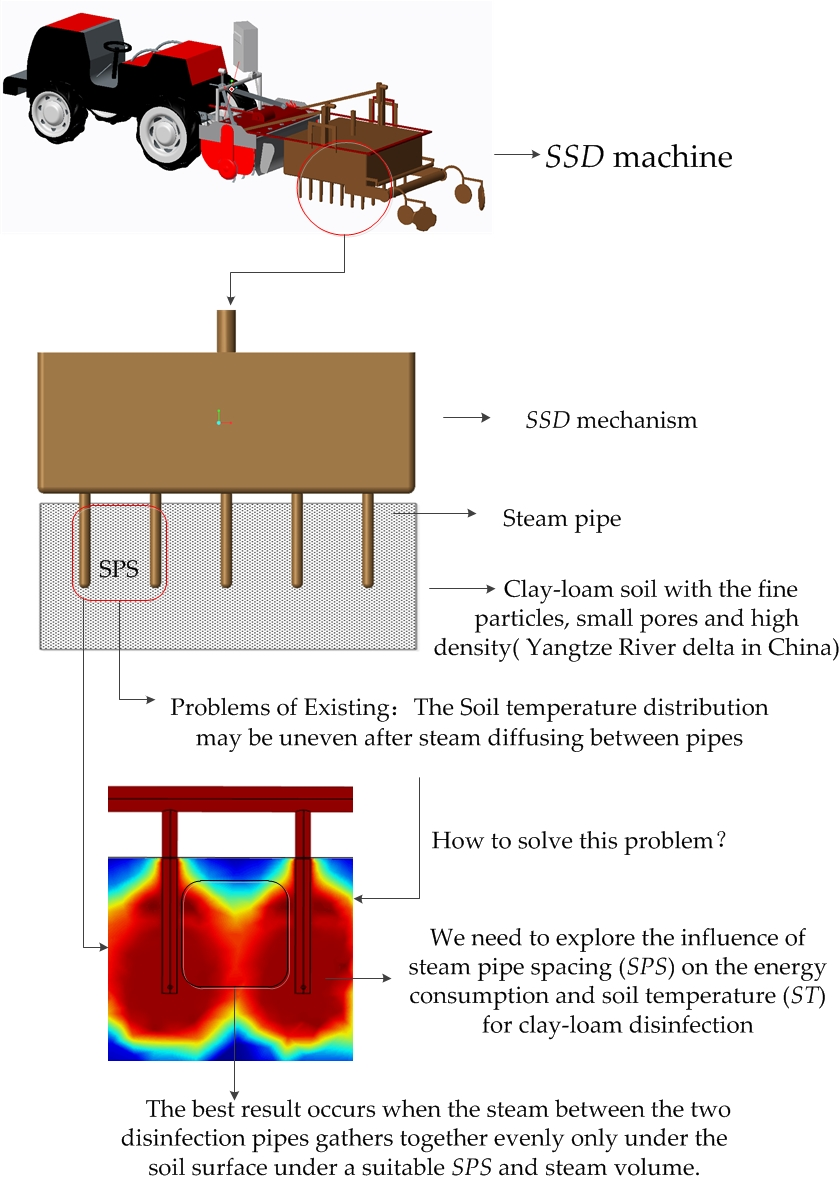
:Soil steam disinfection (SSD) technology is one of the effective means to eliminate soil-borne diseases, especially under the condition of clay-loam soil cultivation for facility agriculture in Yangtze River delta (China). With the fine particles, small pores and high density of the soil, the way of steam transport and heat transfer are quite different from those of other cultivation mediums, and when using SSD injection method, the diffusion of steam between pipes will be affected, inhibiting the heat transfer in the dense soil. Therefore, it is necessary to explore the influence of steam pipe spacing (SPS) on the energy consumption and soil temperature (ST) for clay-loam disinfection. The best results are to find a suitable SPS that satisfies the inter-tube steam that can be gathered together evenly without being lost to the air under limited boiler heating capacity. To this purpose, we first used a computational fluid dynamics model to calculate the effective SPS to inject steam into deep soil. Second, the ST, ST rise rate, ST coefficient of variation, and soil water content variation among different treatments (12, 18, 24, or 30 cm pipe spacing) were analysed. Finally, the heating efficiency of all treatments depending on the disinfection time ratio and relative energy consumption was evaluated. The result shows that in the clay-loam unique to Southern China, the elliptical shape of the high-temperature region obtained from the numerical simulation was basically consistent with the experiment results, and the ratios of short diameter to long diameter were 0.65 and 0.63, respectively. In the SPS = 12 and 18 cm treatments, the steam completely diffused at a 0–20 cm soil layer depth, and the heat transfer was convective. However, at an SPS = 12 cm, steam accumulation occurred at the steam pipe holes, causing excessive accumulation of steam heat. The relative energy consumptions for SPS = 30, 24, and 12 cm were above 2.18 kJ/(kg·°C), and the disinfection time ratio was below 0.8. Thus, under a two-pipe flow rate = 4–8 kg/h, the inter-tube steam was found to be completely concentrated with a uniform continuous high temperature distribution within the soil for an appropriate SPS = 18–22 cm, avoiding the unnecessary loss of steam heat, and this method can be considered for static and moving disinfection operations in the cultivated layer (−20–0 cm) of clay loam soil. However, for soil with higher clay contents, the SPS can be appropriately reduced to less than 18 cm. For soil with lower clay contents and higher sand contents, the SPS can be increased to more than 22 cm.
1. Introduction
Soil steam disinfection (SSD) technology can efficiently kill fungi, bacteria, and pests under the condition of soil cultivation for facility agriculture [1,2,3,4], which can solve the problem of continuous cropping in high-value crop cultivation [5,6,7]. Experts around the world found that the injection SSD method has the advantage of higher heating rate for deep soil [6,7,8,9,10,11,12,13,14,15]. But for the disinfection of clay-loam in Yangtze River delta (China), because of its soil clay content and small soil pores which cause poor water permeability [16,17], the SSD injection method under clay-loam conditions will seriously affect the diffusion range of steam in the dense soil [18,19], resulting in poor disinfection efficiency and increased energy consumption. For the disinfection of sandy-loam, Gay et al. [6] found that a thermal radius of a single steam pipe is 15 cm in soil and increasing the soil water content (SWC) can greatly increase the soil heating rate under limited energy condition. This is because the steam supplied by an injection pipe forces the re-evaporation of steam condensate, which contributes to deplete the soil porosity [6,13], and the sandy-loam soil because its large soil pores also promote the steam diffusion in loose soil even though the soil pores are filled with condensate [6,13]. So, compared with other loose soils, steam was difficult to diffuse in the clay-loam soil because of its dense structure. Thus, it will be very meaningful to study a way which can guarantee a high heating rate of the injection system while also saving energy consumption in clay-loam soil. Based on previous studies on the thickness of porous media [20,21,22,23,24], the soil thickness will affect the heat transfer rate. In the injection SSD process, changes in the steam pipe spacing (SPS), i.e., changes in the thickness of the disinfected soil, might also affect steam heat transfer efficiency. Thus, we studied the articles on the SPS of steam disinfection mechanism.
For the previous studies, we can also find that one major drawback of steam injection systems with multiple steam pipes is the irregular soil temperature (ST) distribution, which leads to excessive energy consumption [6,13]. This is because in the field of steam disinfection, the steam injection method and the sheet and hood method have different steam delivery modes in addition to a difference in soil disinfection depth [6]. The sheet method and the hood method are used to directly transport steam to the soil surface through a steam transfer pipe to form a continuous disinfection zone [14]; however, the injection method is used to insert different numbers of steam pipes into the soil to form a steam pipe group, after which the steam is injected into the soil for disinfection [6,13,15]. For a limited disinfection time, if the SPS is too large, in order to ensure that the soil between the pipes is fully heated, it is necessary to continuously inject steam into the soil because of the limited heat capacity of the soil [16]. At the same time, if the surface of the soil is not covered with insulation, a large amount of steam will be lost to the air [6,13], resulting in an ineffective loss of heat. However, when the amount of steam is reduced, the overall ST will be low, and disinfection will not occur. Therefore, because of its unique distinction of multiple sub-surface steam pipes, the disinfection area between steam pipes may not form a continuous and complete uniform temperature distribution zone. Thus, the best result occurs when the steam between the two disinfection pipes gathers together only under the soil surface under a suitable SPS and steam volume. To avoid heat transfer blind spots in the disinfection area, the SPS needs to be appropriately reduced. As the study by Jiang [15] showed, a thermal radius of a single steam pipe is 10 cm in soil, and considering the heat transfer blind zone, Jiang reduced the SPS to 14 cm, producing a good heat transfer effect in soil. Gay et al. [13] used 11 × 9 = 99 steam pipes and an iron hood to disinfect sandy-loam soil at soil layer depths (SLDs) of 0–−15 cm, in which each pipe was 25 cm long and 2.1 cm in diameter and the steam pipe spacing (SPS) was 23 cm. Gay found that the steam injection pipe could quickly heat the deep soil, and the iron hood could prevent the invalid loss of steam heat because of steam spilling over the soil surface. The structural design of the steam disinfection mechanism also affect soil heat transfer and energy consumption.
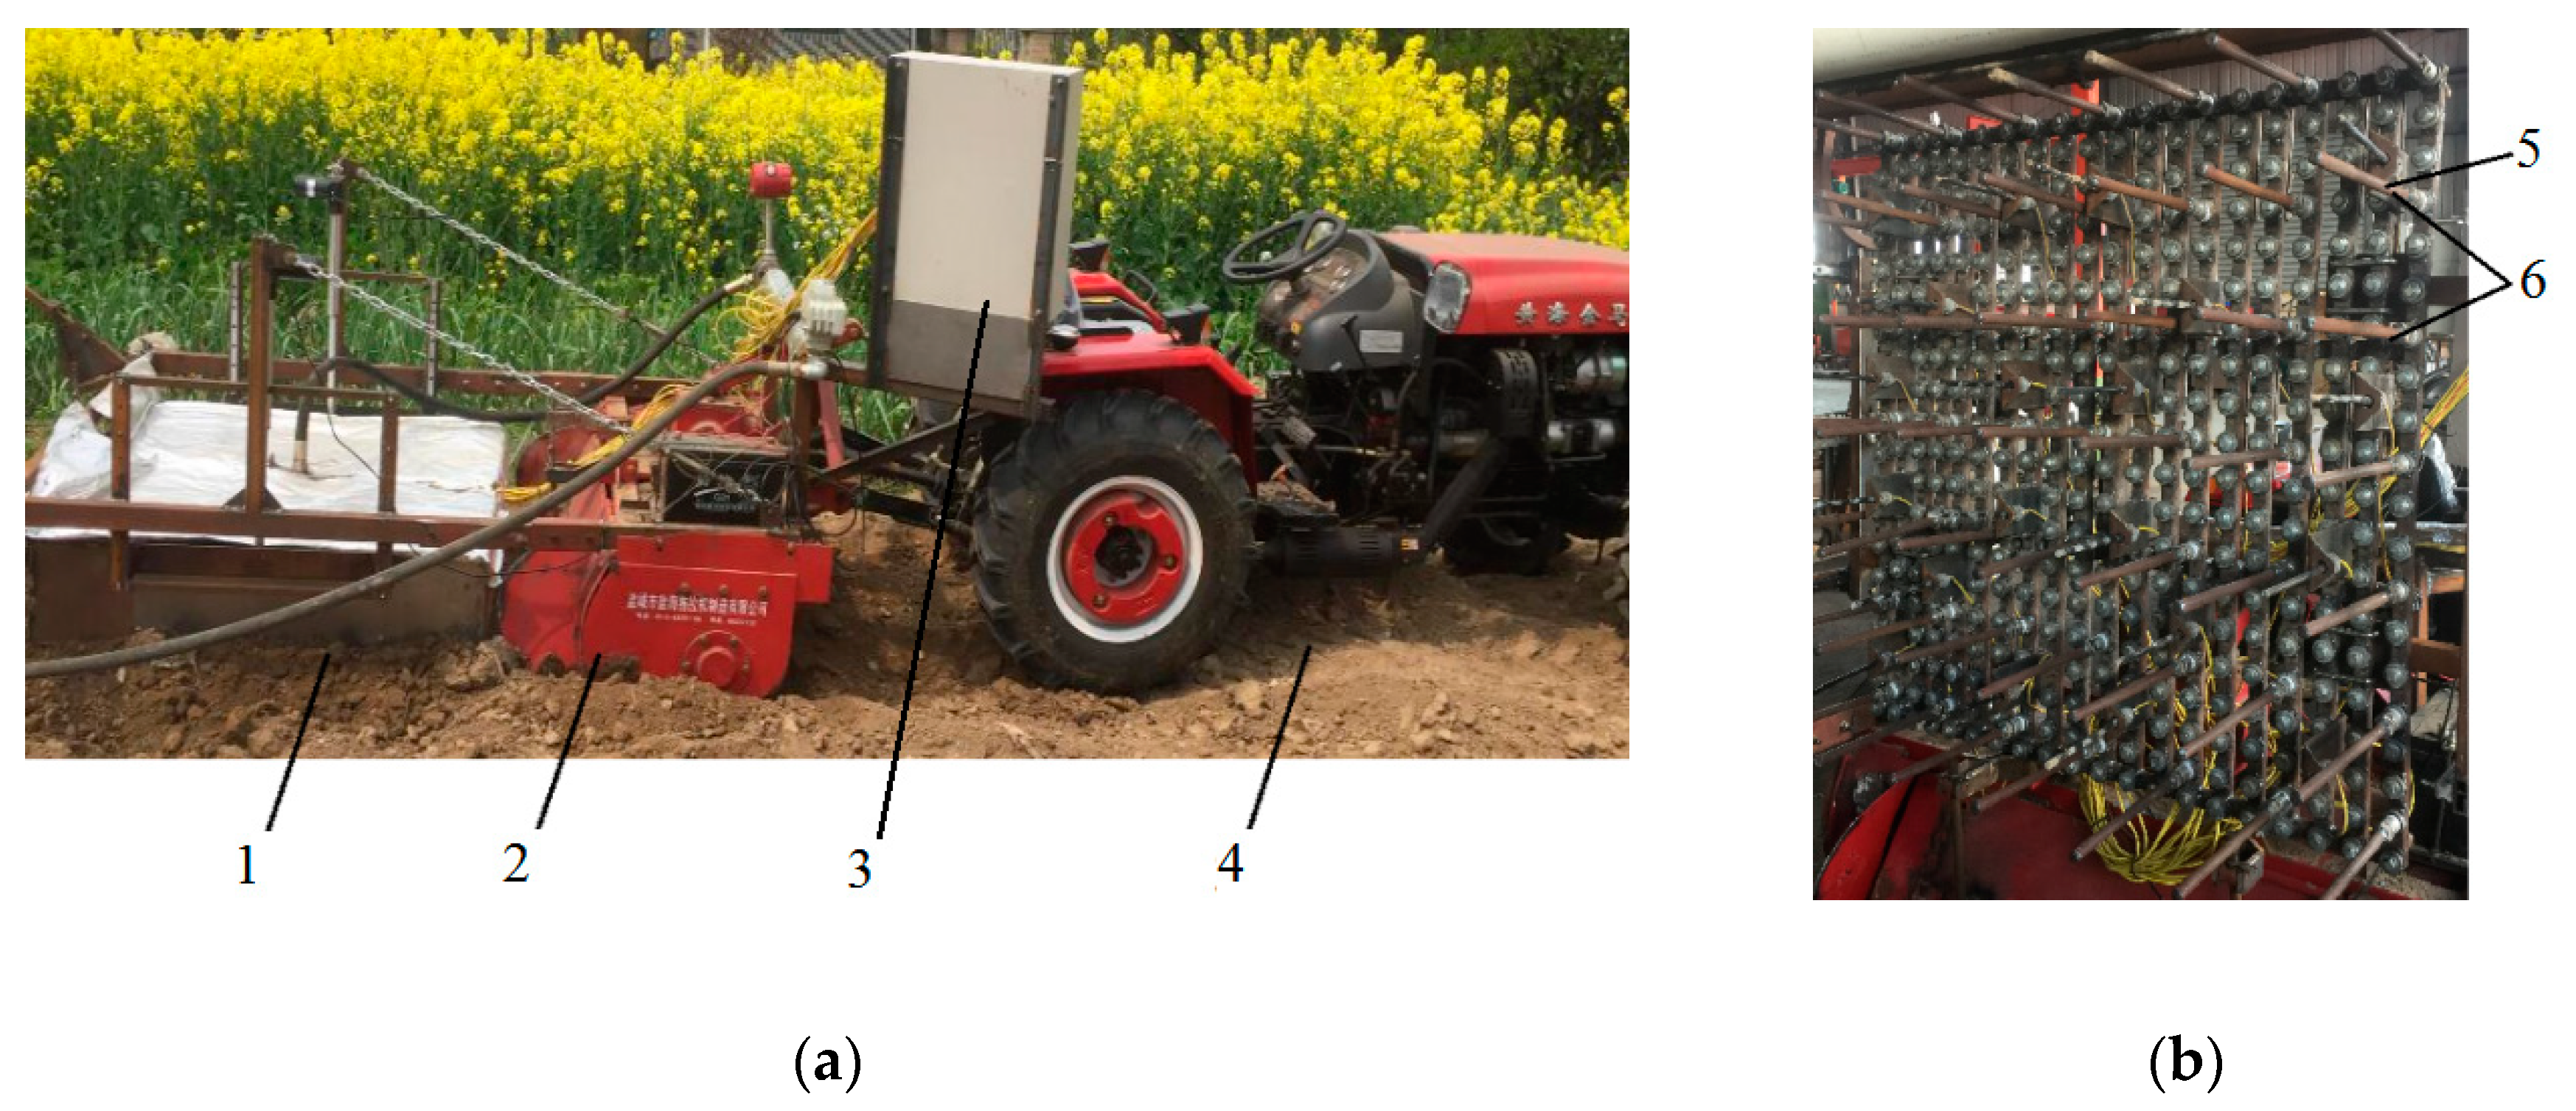
In the SSD machine (Figure 1a) made by our group, the steam disinfection mechanism (1) was mainly composed of an iron hood and some steam pipes (5). The rotary tillage device (2) functioned to reduce the resistance of the soil for the steam pipe (4) and to ensure sufficient contact with the steam discharged from the steam pipes by deep tilling the compacted soil. At the beginning of disinfection, the control box (3) adjusted the lift height of the electric push rod, and the steam disinfection mechanism was vertically inserted into the loose soil (SLDs = −20–0 cm) after rotary tillage. During the disinfection process, a large boiler heating capacity in the steam injection system can quickly increase soil temperature but may cause unnecessary energy consumption and increase the weight and cost of disinfection equipment. With a reasonable boiler capacity, the soil heating rate and temperature uniformity mainly depend on the disinfection pipe layout, e.g., quantity and spacing (Figure 1b), within a limited disinfection time. Therefore, analysing the soil temperature field and energy consumption variation for different SPSs is crucial for obtaining a high-temperature rise rate and evenly distributed temperature field. In this paper, under three steam flow rates (4, 6, and 8 kg/h), the effects of four SPSs (12, 18, 24, and 30 cm) on the ST, ST rise rate, and energy consumption were studied to obtain the best result for the injection method to form a continuous uniform disinfection area for the clay-loam unique to Yangtze River delta in China.
2. Theoretical analysis
Drying and SSD are opposite processes, and a wet porous medium can be divided into a dry zone, evaporation zone and wet zone during the drying process. The moisture in the wet zone is transported to the evaporation zone in the form of liquid water, and the generated vapour is rapidly diffused into the dry zone to complete the entire drying process [25,26,27]. Similar to the drying process, in the sheet method of SSD [28], experts have designed a two-dimensional soil disinfection area to undergo one-dimensional flow in the vertical direction. The whole disinfection process can be divided into two stages: The first stage is the steam convection heat transfer; the initial state of the soil is dry, and the saturated dry steam accumulates on the surface of the soil to form a gas phase zone. As the steam accumulates at the soil surface, the saturated dry steam condenses to form a gas–liquid two-phase flow in the soil pores, and the moisture content of the soil gradually increases to form a gas–liquid two-phase zone. The second stage is the condensed water heat conduction stage. As the disinfection progresses, a large amount of steam condenses into the liquid water and accumulates in a deep layer of the soil to form a wet zone. The deep layer of soil mainly relies on condensed hot water to conduct heat. In the process of sheet disinfection, the soil can be divided into a dry zone, gas phase zone, gas–liquid two-phase zone, and wet zone [28].
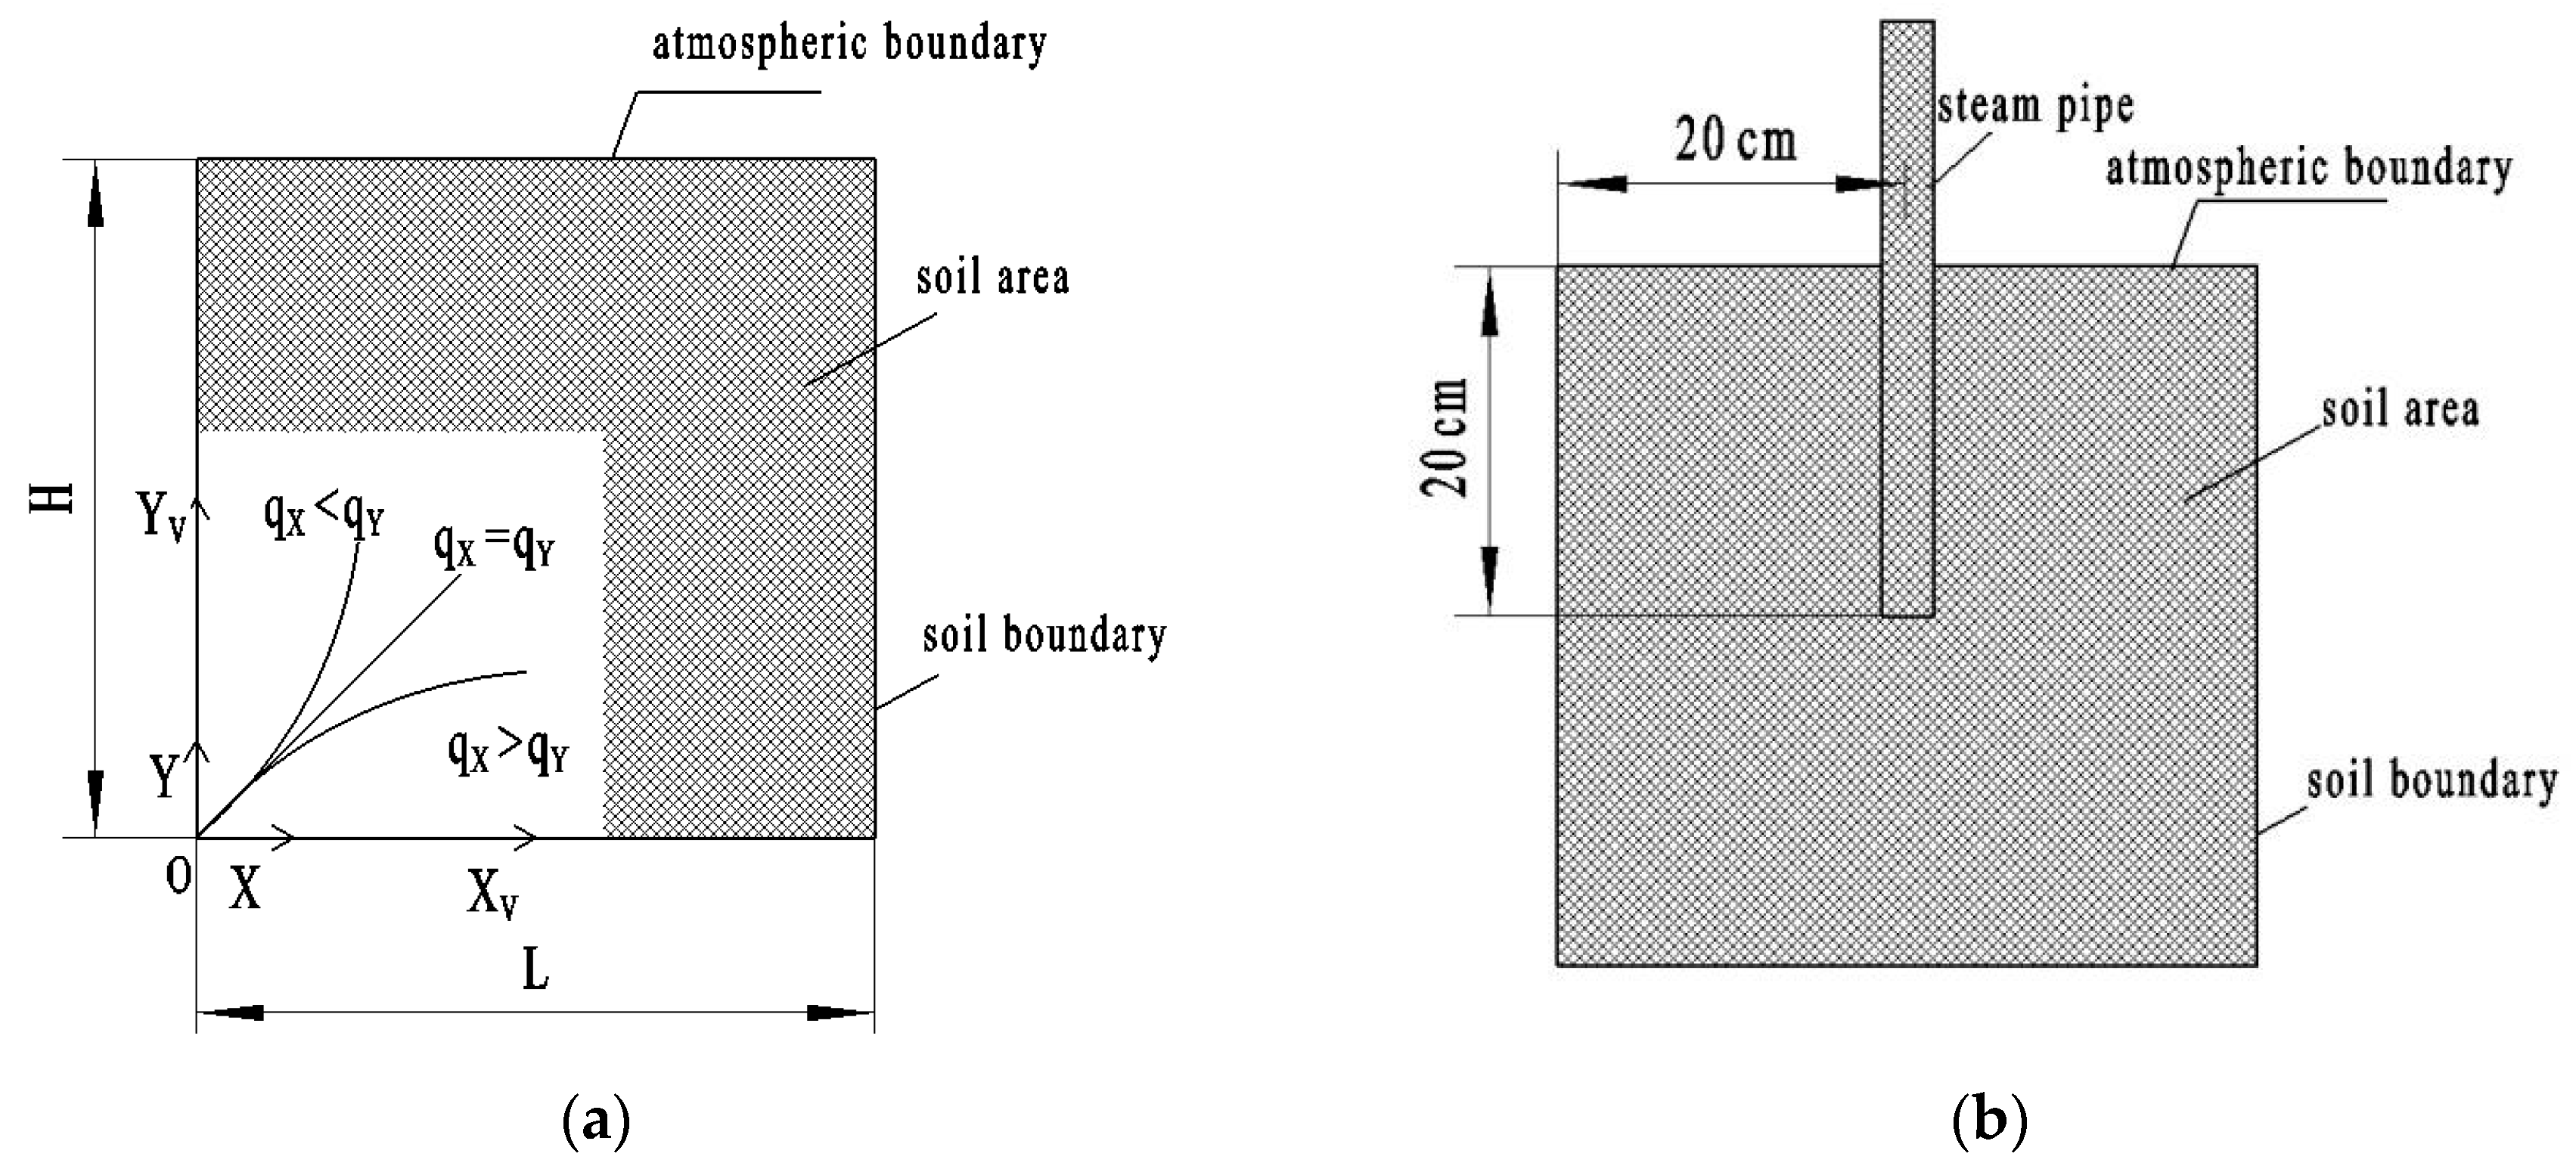
In contrast to the sheet method, the steam pipes used in the injection method are buried in the soil. To explore the diffusion law of the steam in the soil, a two-dimensional disinfection area is first created, centred on point 0, which was the steam ejection point. L and H are horizontal and vertical distances in the soil, respectively, as shown in Figure 2. Assuming that the horizontal heat flux diffusion velocity (qX) is greater than the vertical heat flux diffusion velocity (qY), that is, the horizontal diffusion distance of the vapour (Xv) is greater than the vertical diffusion distance of the vapour (Yv) under each disinfection time period, it is necessary to determine Yv when Xv is L. If qX = qY, then Xv = Yv. If qX < qY, when Yv = H, Xv < H, and then it is necessary to determine Xv to prevent the steam from leaving the surface, resulting in heat loss.
To explore the diffusion law of steam from a single pipe in the horizontal and vertical directions, it is necessary to study the ST field. In this paper, computational fluid dynamics (CFD) simulation technology is used to simulate the ST field after disinfection. The simplified model is established by using the geometric modelling tool in COMSOL Multiphysics software (COMSOL Inc). The soil area is 40 cm × 40 cm, the atmosphere boundary is set as the heat insulation layer, and there is no heat exchange with the outside air, as shown in Figure 2. This model uses a quadrilateral mesh; the number of grid cells is approximately 130,000, and the number of mesh nodes is 26,000.
In this paper, the ST field is numerically simulated using the heat transfer equation of porous media proposed by De Vries [27,28,29,30,31]. The expression is as follows:
where ρp is the soil bulk density, kg/m3; Cρ,p is the soil specific heat capacity, J/(kg·K); Cp is the fluid heat capacity at constant pressure, J/(kg·K); T is the absolute temperature, k; u is the velocity, m/s; q is the conducted heat flux (W/m2); Q is the additional heat source (W/m3); (ρCp)eff is the effective volumetric heat capacity at constant pressure defined by an averaging model to account for both solid matrix and fluid properties, J/(m3·K); and 1 − θp is the porosity.
The physical variables in the expression above are determined from the actual soil parameters, where ρp = 1.15 g/cm3, Cp = 1700 J/(kg·K), 1 − θp = 0.40, and the initial ST is 20 °C. Because of the large number of steam disinfection pipes in an actual SSD operation, the flow rate from the boiler was 100 kg/h, the steam flow rate of a single pipe was set to 2, 3, or 4 kg/h, and the steam temperature was set to 120, 140, or 160 °C. In the simulation process, when the soil average temperature reached 90 °C, the required heat was 4379.2 kJ, and the disinfection time of each treatment was measured (Table 1). Table 1 shows that the steam temperature is proportional to the steam flow rate and the disinfection time; under the same steam temperature condition, the disinfection time decreases with an increase in the steam flow rate, and the steam flow rate has a significant effect on the disinfection time [32], while the steam temperature has less of an influence on the disinfection time.
The inlet of the steam pipe was an inlet boundary condition with the flow rate (2, 3, and 4 kg/h). The four sides of soil were subjected to the boundary conditions of a static pressure, and the static pressure was zero. The temperatures of the pipe and soil were 20 °C.
From Figure 3a, the diffusion of the steam heat flux in the horizontal and vertical directions is basically in accordance with qX < qY at different flow rates. The high-temperature region of the soil has an elliptical shape [33]; that is, the horizontal steam diffusion distance is smaller than the vertical steam diffusion distance. When the vertical heat transfer distance of the vapour (Yh) is 0.2 m, the horizontal heat transfer distance of the vapour (Xh) is 0.13 m (elliptical short radius to long radius = 0.65). When Xh > 0.13 m (Figure 3b), the surface of the soil forms a superheated area, and the shape of the high-temperature area of the soil changes from an ellipse to a rectangle.
3. Soil Steam Disinfection Test
According to the first section, the diffusion law of the steam in the single pipe indicates that Xh is less than Yh and that when Yh = 20 cm, Xh = 13 cm. For a single pipe with Xh = 13 cm, a steam disinfection test was carried out by the hood-injection method in this paper [6]. The test was carried out in March 2019 at the Yanhai Tractor Factory test base (120°12′ E, 33°22′ N) in Yancheng, Jiangsu Province, China. The indoor temperature was 22 °C, and the relative humidity was 84%.
3.1. Test Conditions and Materials
Two steam pipes were tested, each with a length of 300 mm, a diameter of 10 mm, and a wall thickness of 2 mm. One end of the steam pipe was the inlet end, and the other end was the closed end. There were three holes (aperture = 3 mm) uniformly distributed at a distance of 10 mm from the closed end, and the circumferential direction of the holes was 120°.
The test soil was taken from the test base of the Yanhai Tractor Factory. The basic properties of the soil are shown in Table 2.
The main test equipment, an ST-SWC control box, including a PT100 ST sensor (Jinan Zhengmiao Automation Equipment Co., Ltd.), a ZMSF-AB SWC sensor (Jinan Zhengmiao Automation Equipment Co., Ltd.), an SR20 Programmable Logic Controller (PLC Siemens), and a TPC7062 display screen (Kunlun state), is shown in Figure 5. The ST and SWC sensors are calibrated for normal use.
3.2. Test Methods
According to the simulation and previous research results [6,13,15], the SPS is designed to be 12, 18, 24, or 30 cm because the single pipe flow is 2, 3, or 4 kg/h and two steam pipes are used in the following study. The tested flow rates are 4, 6, and 8 kg/h. Each group of experiments was repeated 3 times, for a total of 36 groups.
The initial ST was 20 ± 1.5 °C, and the initial SWC was 19.5 ± 2%. The residual condensate in the steam pipe was drained before the test, the SPS was adjusted to 12, 18, 24, or 30 cm, and the soil bin was divided into 12 × 6 cm, 18 × 9 cm, 24 × 12 cm, and 30 × 15 cm areas by the partition plate. Finally, the steam pipes were inserted to reach the test area at SLD = 20 cm [6,13], and the surface of the soil bin was sealed with an iron cover to prevent the steam overflow. Two drains at the bottom of the bin allowed excess steam condensate to discharge.
The boiler pressure was adjusted to 0.3 MPa to ensure that the saturated dry steam temperature reached 132.88 °C; the 4–20 mA flow valve was used to control the proportional ball valve opening degree; then, the flow valve opening degree through the flow metre was calibrated to ensure that the steam flow is stabilized at 4, 6, or 8 kg/h. In this paper, when the average ST reached 90 °C, the flow valve was closed, and the disinfection test was completed. At this time, the total amount of steam (Qs) flowing through the flow metre was measured.
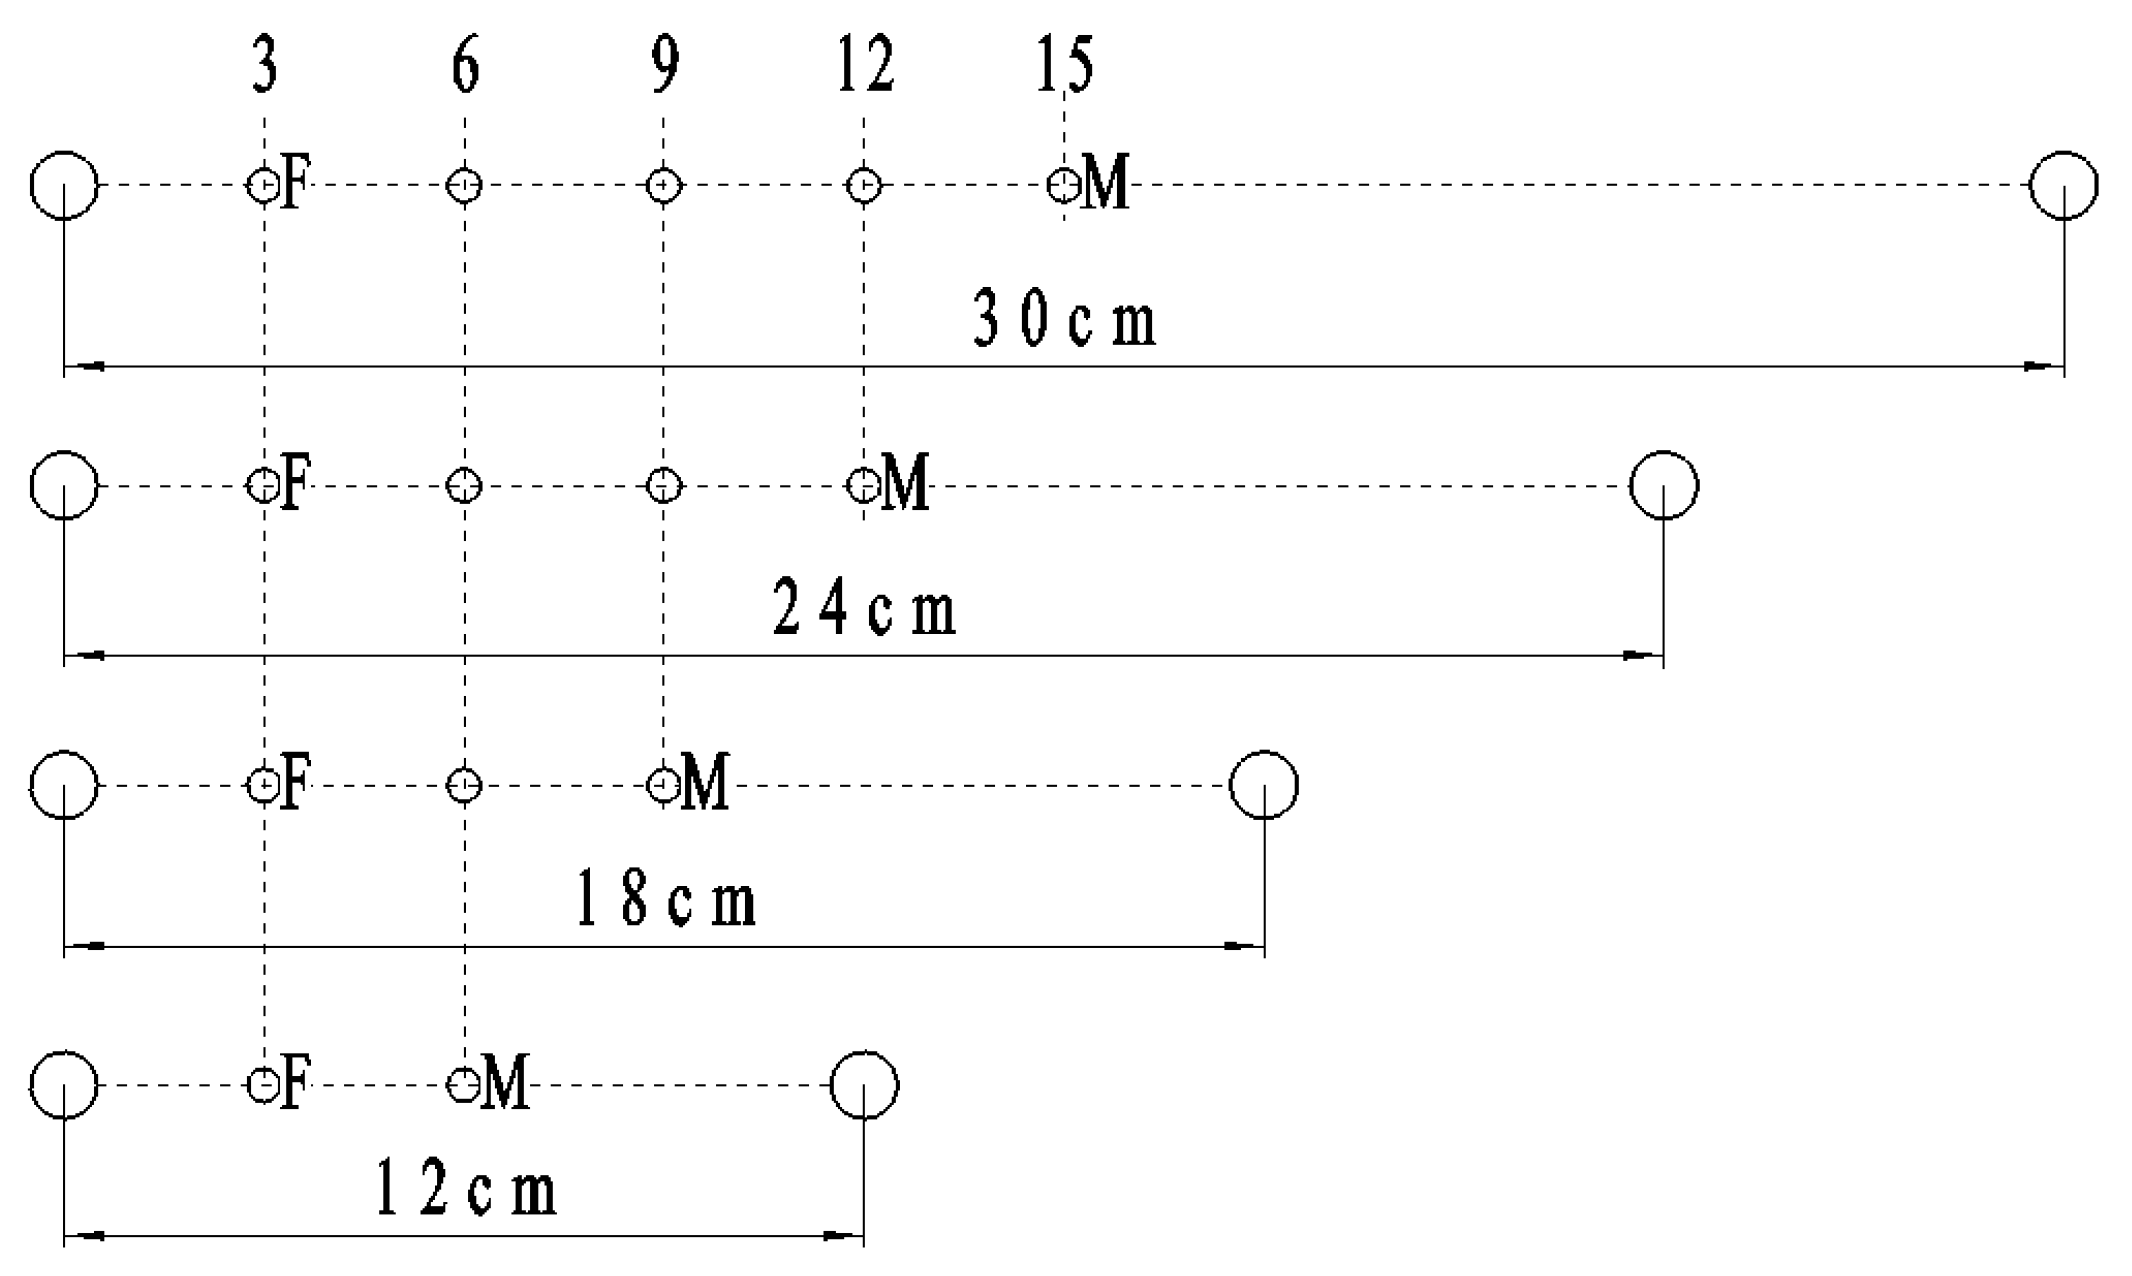
Since the two steam pipes were symmetrically distributed with respect to the midpoint M, only the left half of the soil was measured, and the test sensor and the steam pipe were in the same vertical section. Because the distance between the two pipes was varied, the corresponding horizontal test distances were 3–6, 3–9, 3–12, and 3–15 cm. The initial test point for setting the left soil was F, and the ending test point was M, including for SPS = 12 cm, which corresponded to 2 horizontal test positions of 3 and 6 cm. The other tests were performed in the same manner. SPS = 30 cm corresponded to the 5 horizontal test positions of 3, 6, 9, 12, and 15 cm. The ST sensors were buried at SLDs of 0, −5, −10, −15, and −20 cm, and the SWC sensors were buried at SLDs of 0, −10, and −20 cm, as shown in Figure 4 and Figure 6, respectively. The ST and SWC control system collected data every 10 s.
3.3. Data Analysis
The ST rise rate is an important indicator used to measure the change in temperature. The expression is as follows:
where Vt is the ST rise rate, °C/s; Tt-1 is the ST at t−1, °C; and Δt is the time interval between t and t−1, s.
The ST coefficient of variation (Cv) can reflect the uniformity of the ST distribution. The smaller the temperature coefficient of variation is, the better the uniformity of the ST distribution. The Cv calculation formula is as follows:
where SD is the standard deviation of ST, °C, and is the average ST, °C.
Because the soil thickness varies between the two pipes, the energy consumption is based on the relative energy consumption, which is defined as the amount of heat consumed per unit mass of soil per 1 °C in units of kJ/(kg·°C).
where ms reflects the soil quality between pipes, kg; Qs is the cumulative amount of steam, kg; H is the enthalpy change in steam to liquid water, kJ/kg; T90 is the temperature after soil disinfection, which equals 90 °C; and T20 is the initial temperature of the soil, which equals 20 °C.
Because the disinfection time of each treatment is different, for the ratio of disinfection time, that is, the ratio of the theoretical to the actual time, the closer it is to 1, the closer the actual disinfection time is to the theoretical disinfection time, and the higher the heating efficiency of the steam in the soil.
where te is the actual time required to heat the soil to 90 °C, s; tc is the theoretical time required to heat the soil to 90 °C, s; C is the soil specific heat capacity, kJ/kg °C; and Q is the steam flow rate, kg/h.
The vertical profiles of ST and SWC were plotted using Surfer 12 software (Golden Software, Inc.). The distributions of ST and SWC were obtained from the vertical profiles. The area corresponding to STs below 60 °C is the low-ST area, the area corresponding to STs of 60–80 °C is the moderate-ST area, and the area corresponding to ST > 80 °C is the high-ST area; in the figures, red represents the high-ST area, green and yellow represent the moderate-ST area, and blue and black represent the low-ST area. The area corresponding to SWCs below 25% is the low-SWC area, SWCs of 25–30% correspond to the moderate-SWC area, and SWCs > 30% correspond to the high-SWC area; in the figures, red represents the high-SWC area, green and yellow represent the moderate-SWC area, and blue and black represent the low-SWC area.
4. Results and Analysis
4.1. Analysis of the Change in Soil Temperature
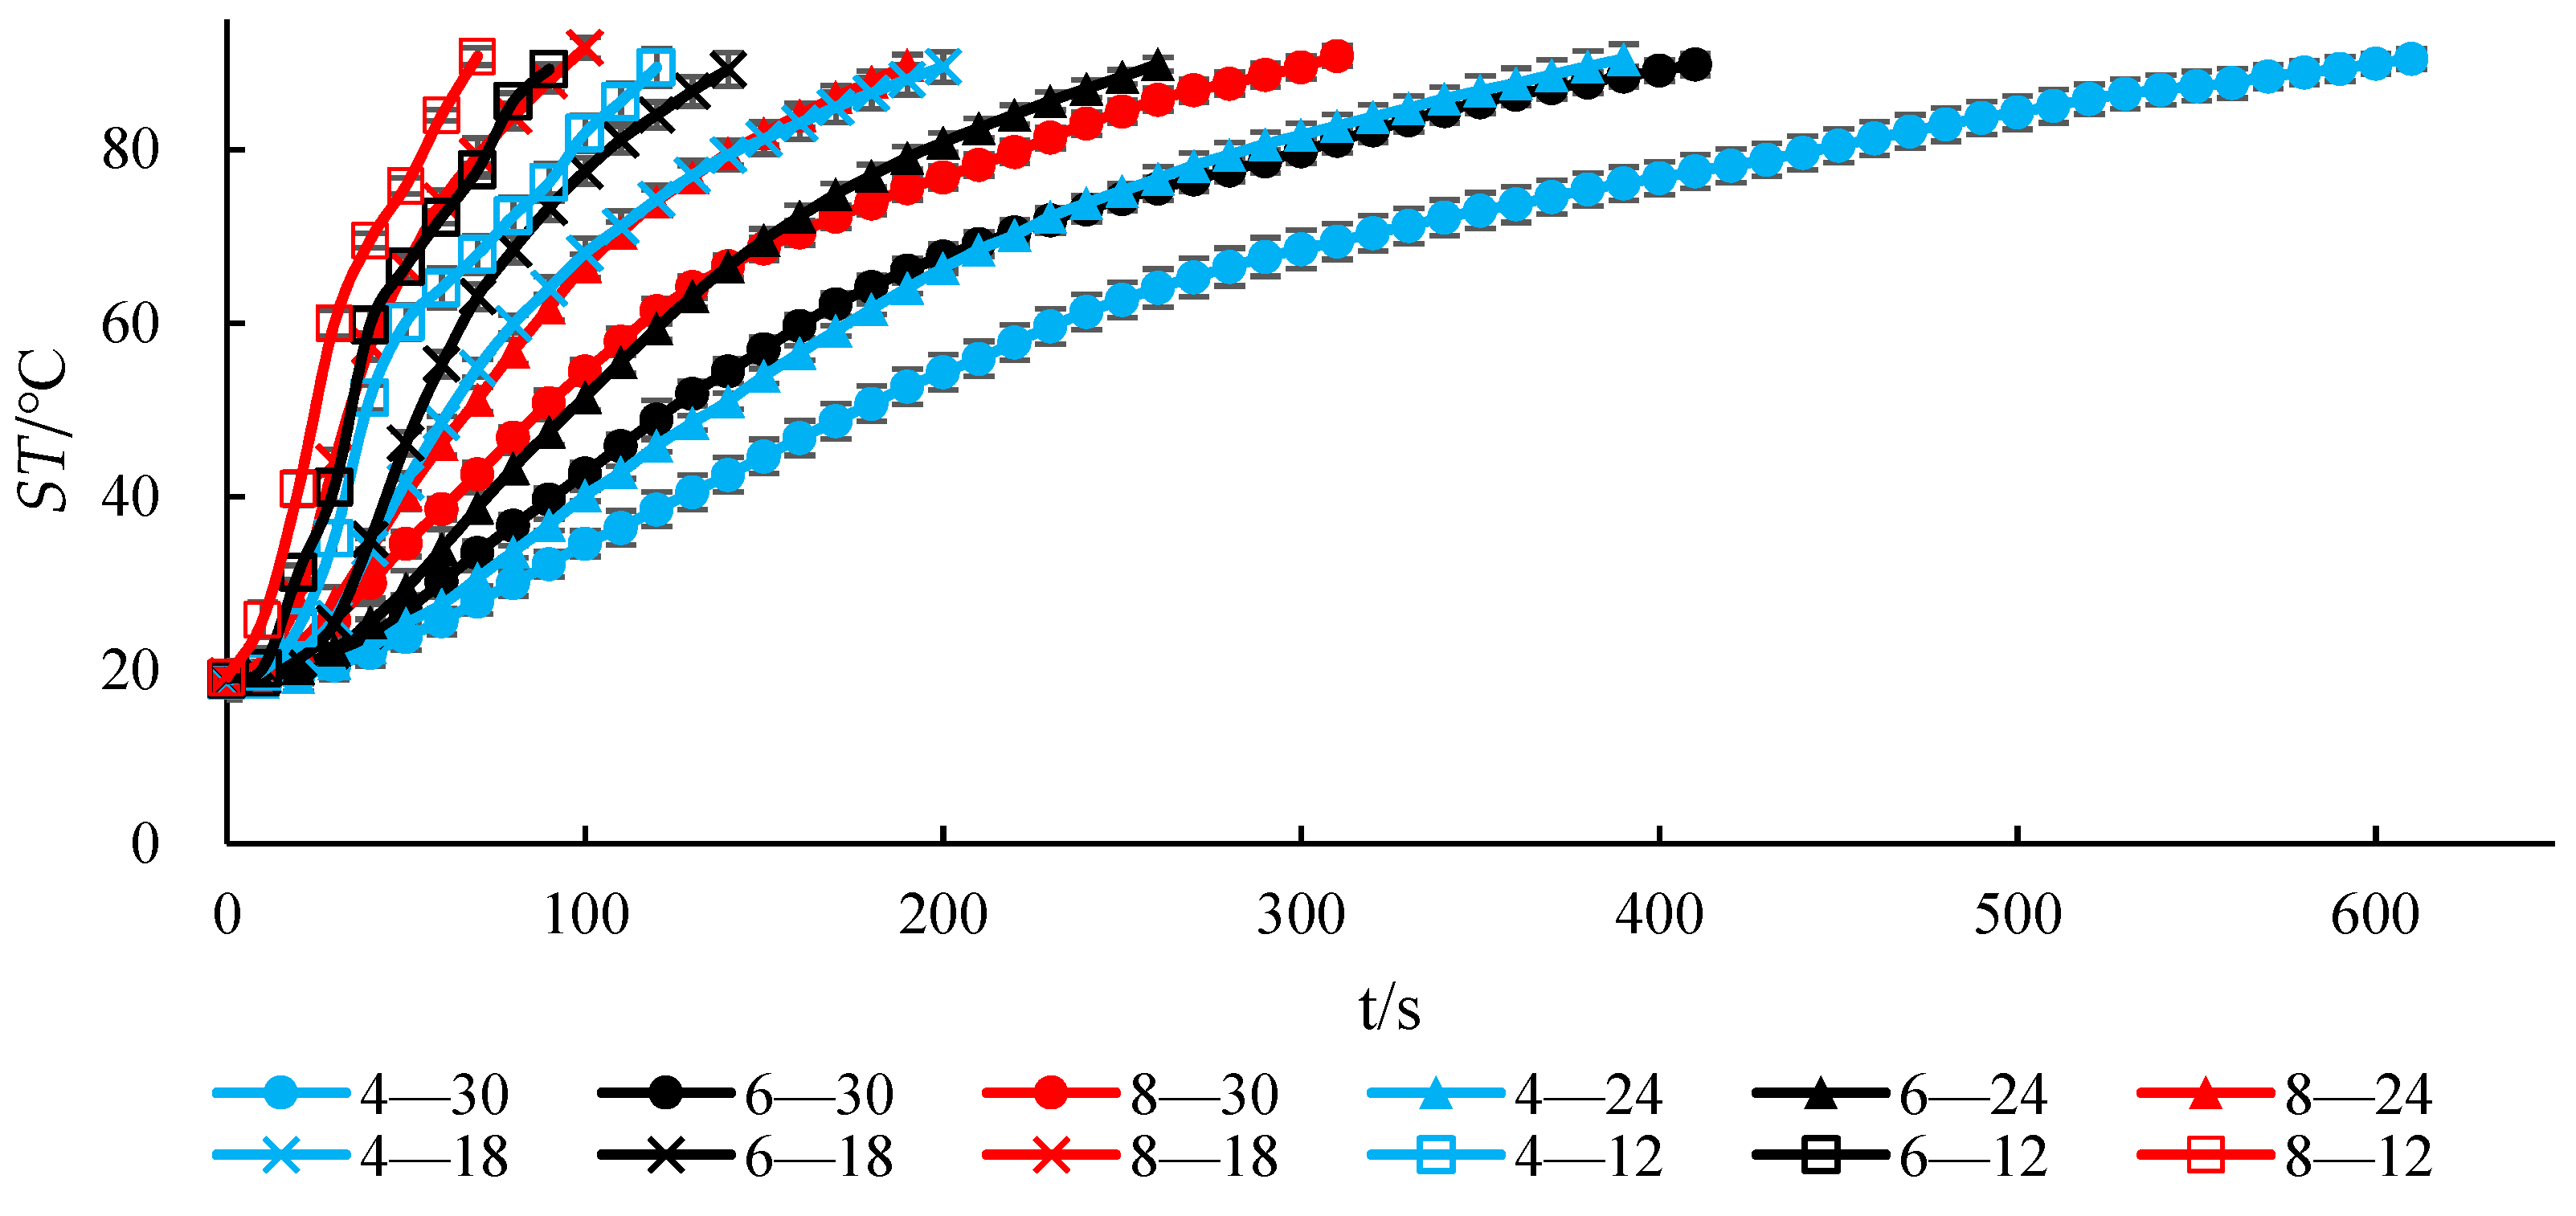
The change in soil average temperature with disinfection time is shown in Figure 7. The ST increases faster at the beginning of disinfection than at other times. When the average temperature of the soil reaches 80 °C, the ST shows a slower increasing trend. This change occurs because in the initial stage of disinfection, the temperature difference between the steam and soil is large, and the heat exchange is sufficient; in the later stage of disinfection, the ST field tends to be stable.
At the same SPS, as the steam flow increases, the ST curve shifts left as a whole, the slope of the curve increases, the ST quickly increases, and the disinfection time gradually shortens. Similarly, in a study of soil remediation techniques, Li [33] found that aeration flow is one of the most important factors affecting the removal efficiency. Increasing the aeration flow can improve the removal efficiency of pollutants and shorten the soil remediation time. Under the same flow rate, as the SPS increases, the ST curve shifts right as a whole, the slope of the curve decreases, the ST slowly increases, and the time required for the soil to heat to the same temperature increases.
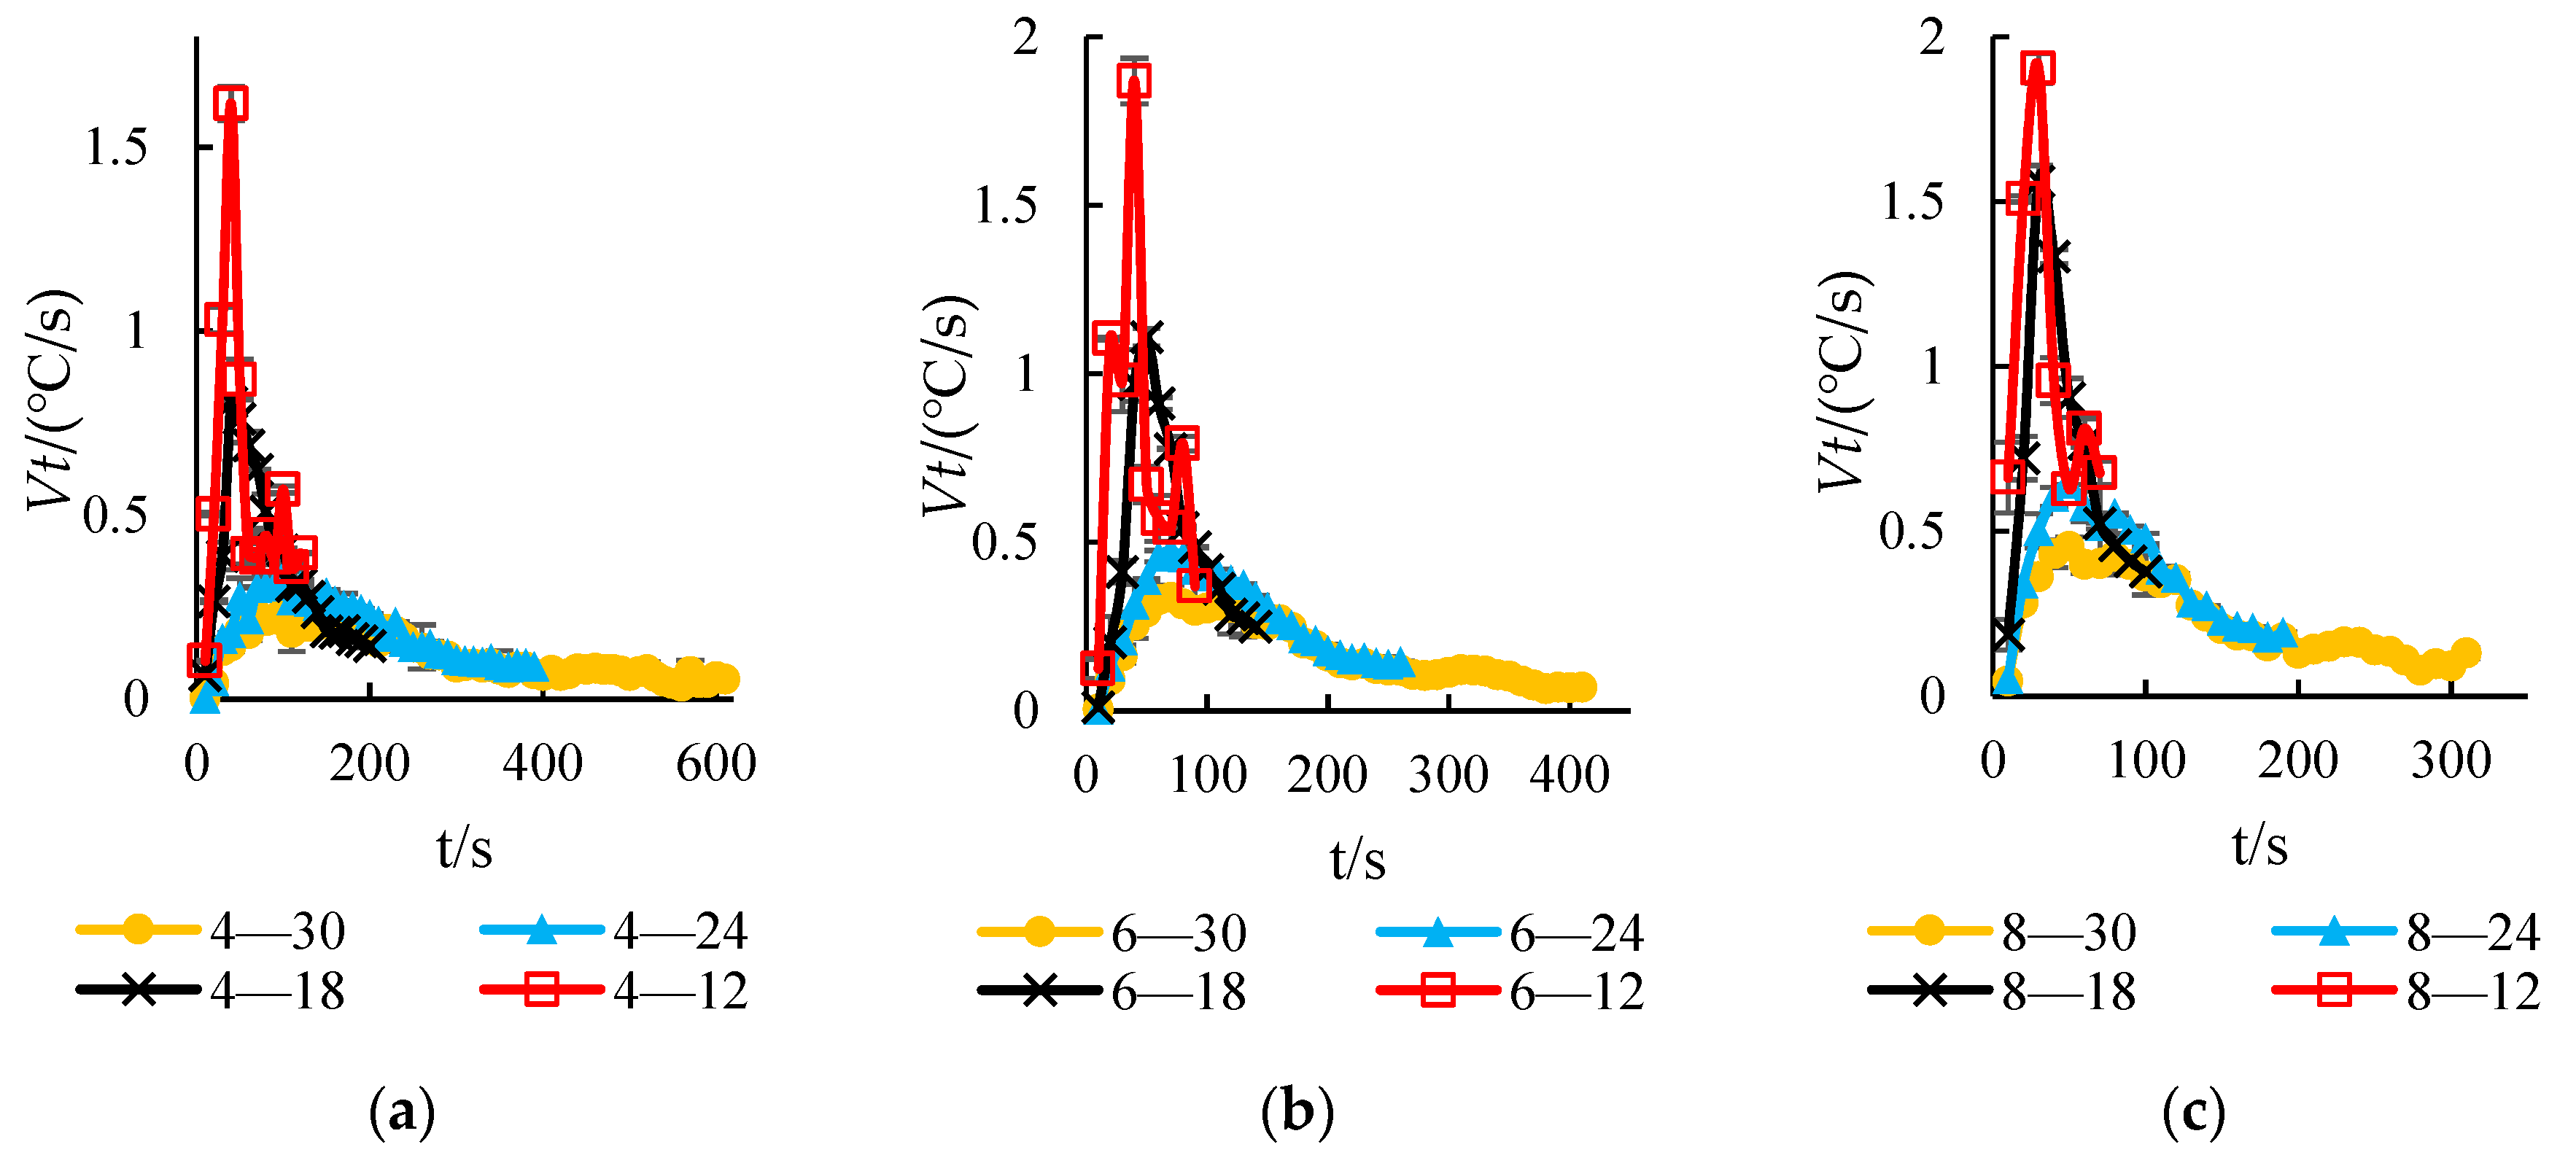
Figure 8 shows that the average ST rise rate (Vt) with time curve indicates a parabolic change, and the slope of the curve before the peak is greater than the slope of the curve after the peak; that is, the curve rises rapidly to the peak and then gradually decreases to a stable value, similar to that described in the analysis of the average ST (Figure 7). At the same flow rate, the average Vt increases with decreasing SPS. This result occurs because the smaller the SPS is, the less soil between the pipes, the shorter the vapour diffusion distance, and the lower the resistance, as observed in studies of ground source heat pumping or drying technology [16,17,18,19,20]. At the same SPS, the larger the steam flow rate is, the higher the starting point of the curve, and the larger the peak of the Vt; however, the overall shape of the curve is the same, which indicates that the heat transfer modes for the same SPS are basically the same under different steam flows.
4.2. Soil Temperature Distribution Analysis
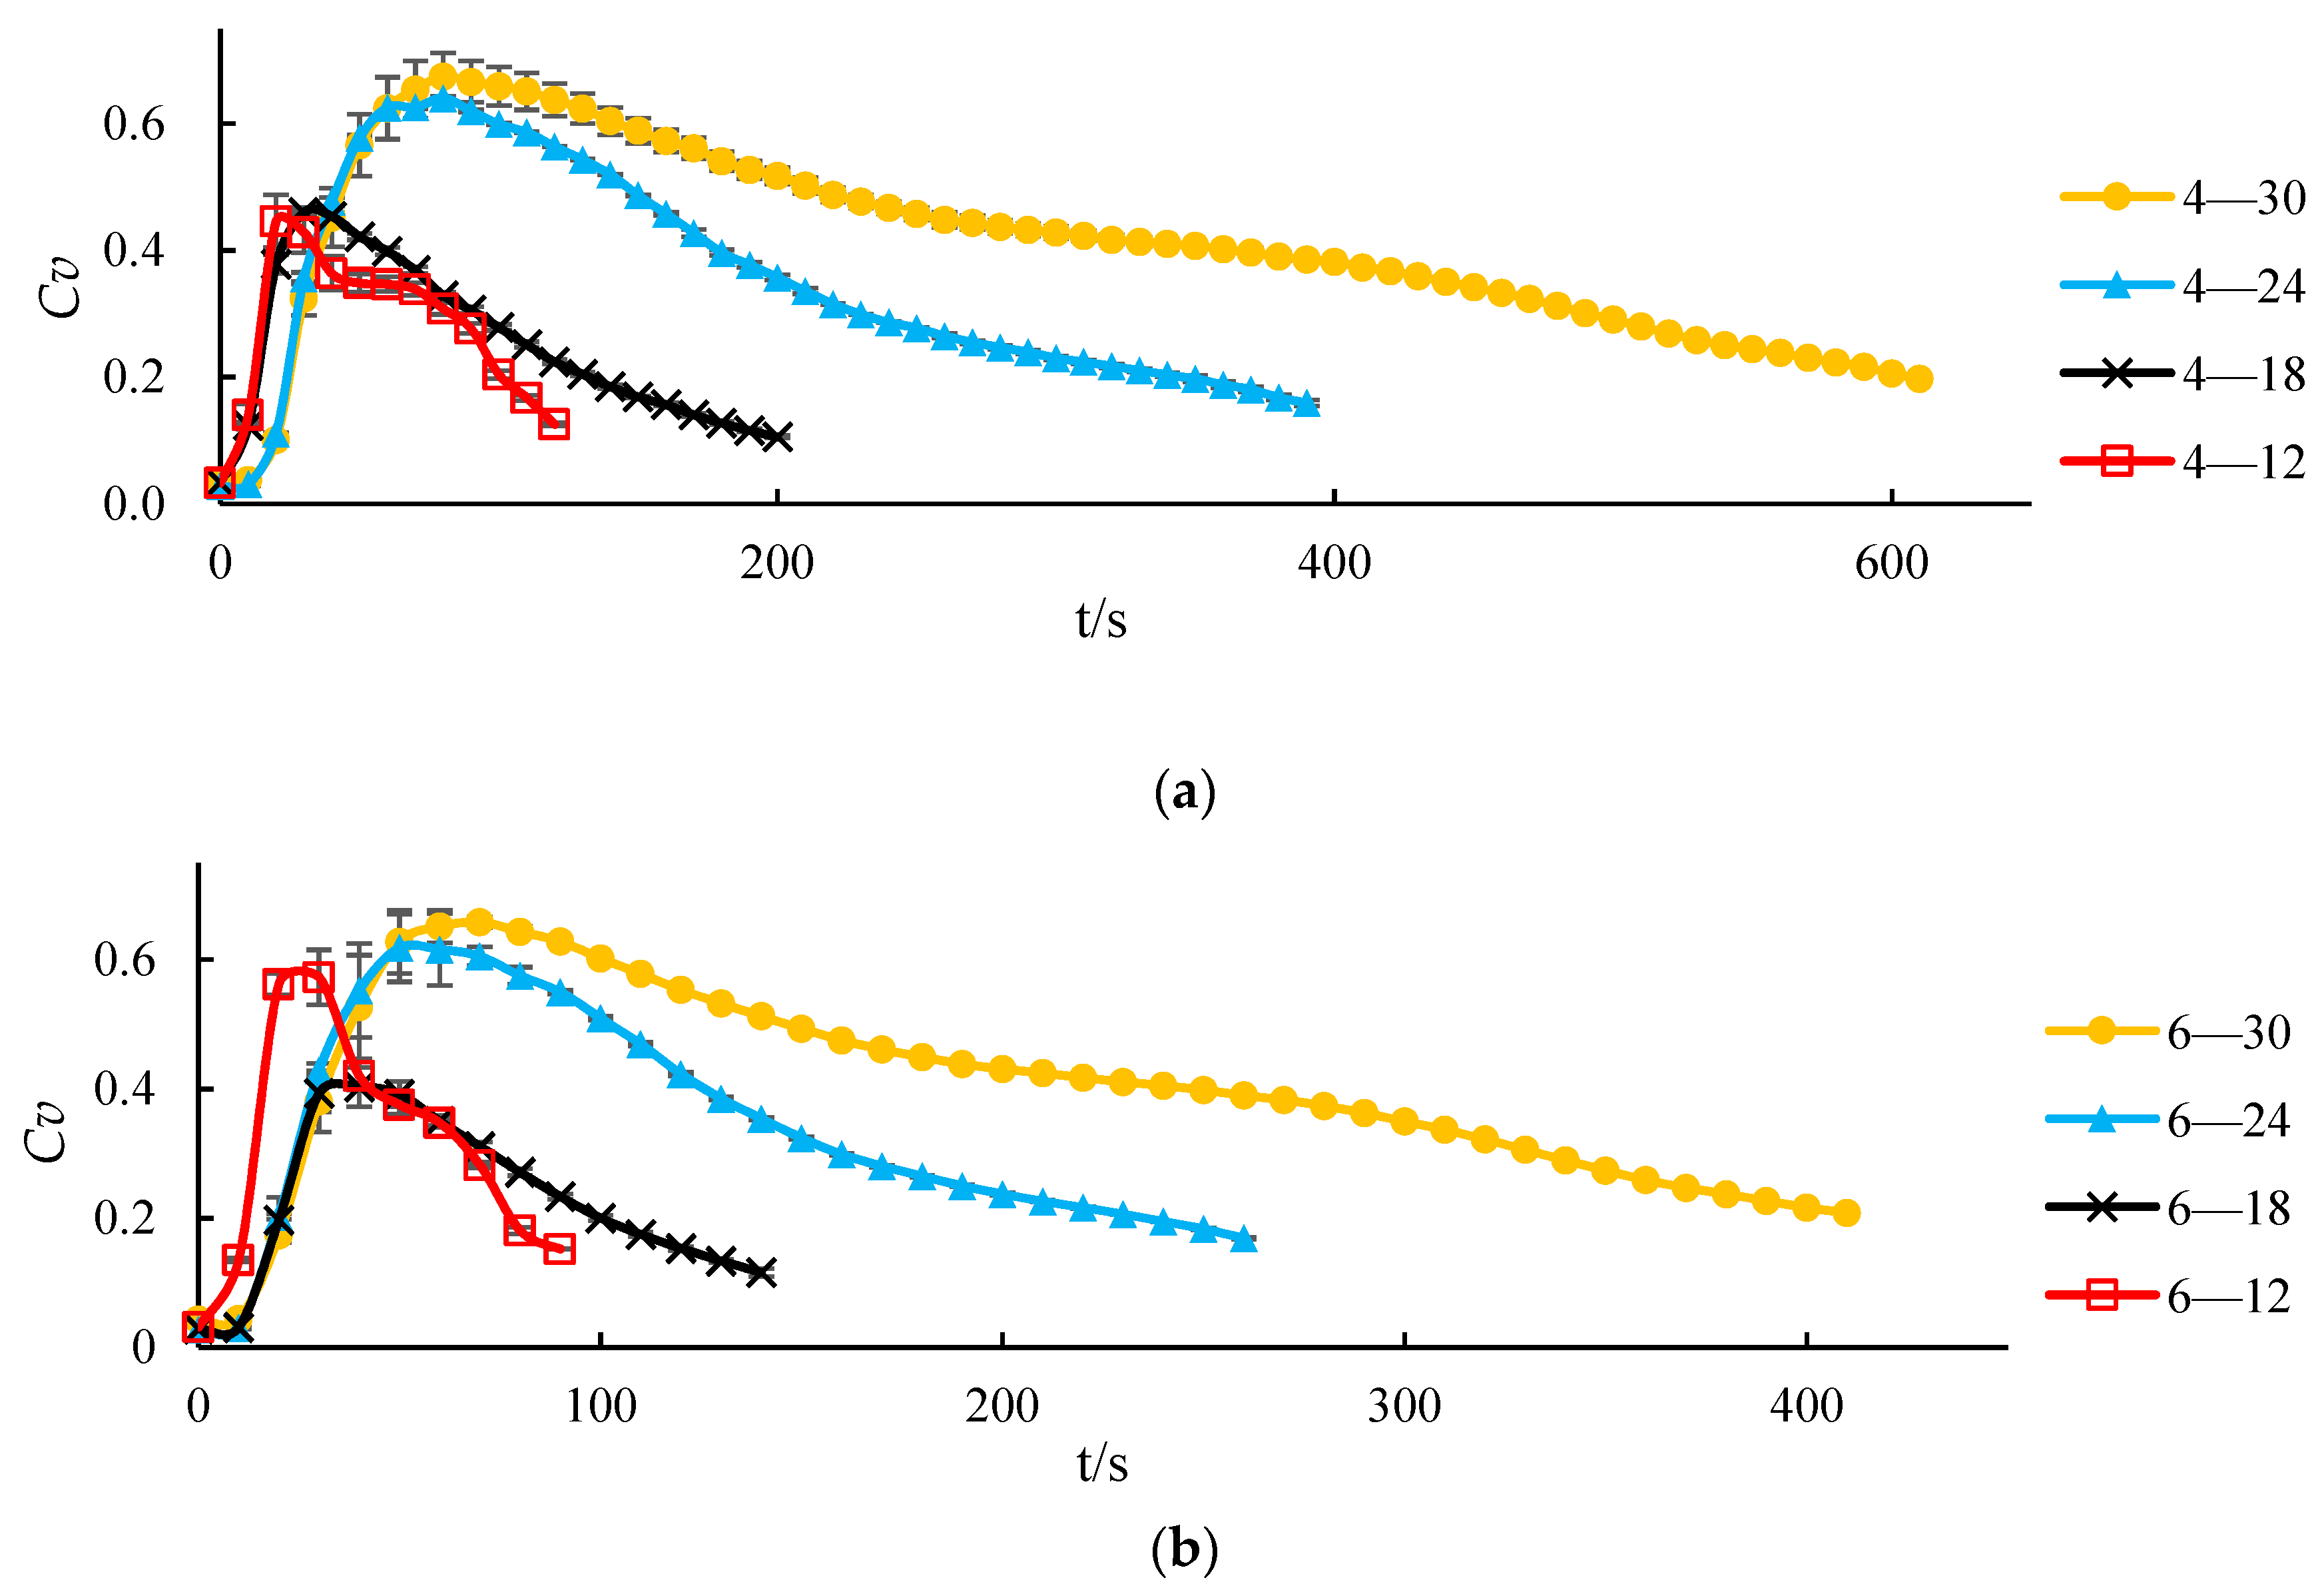
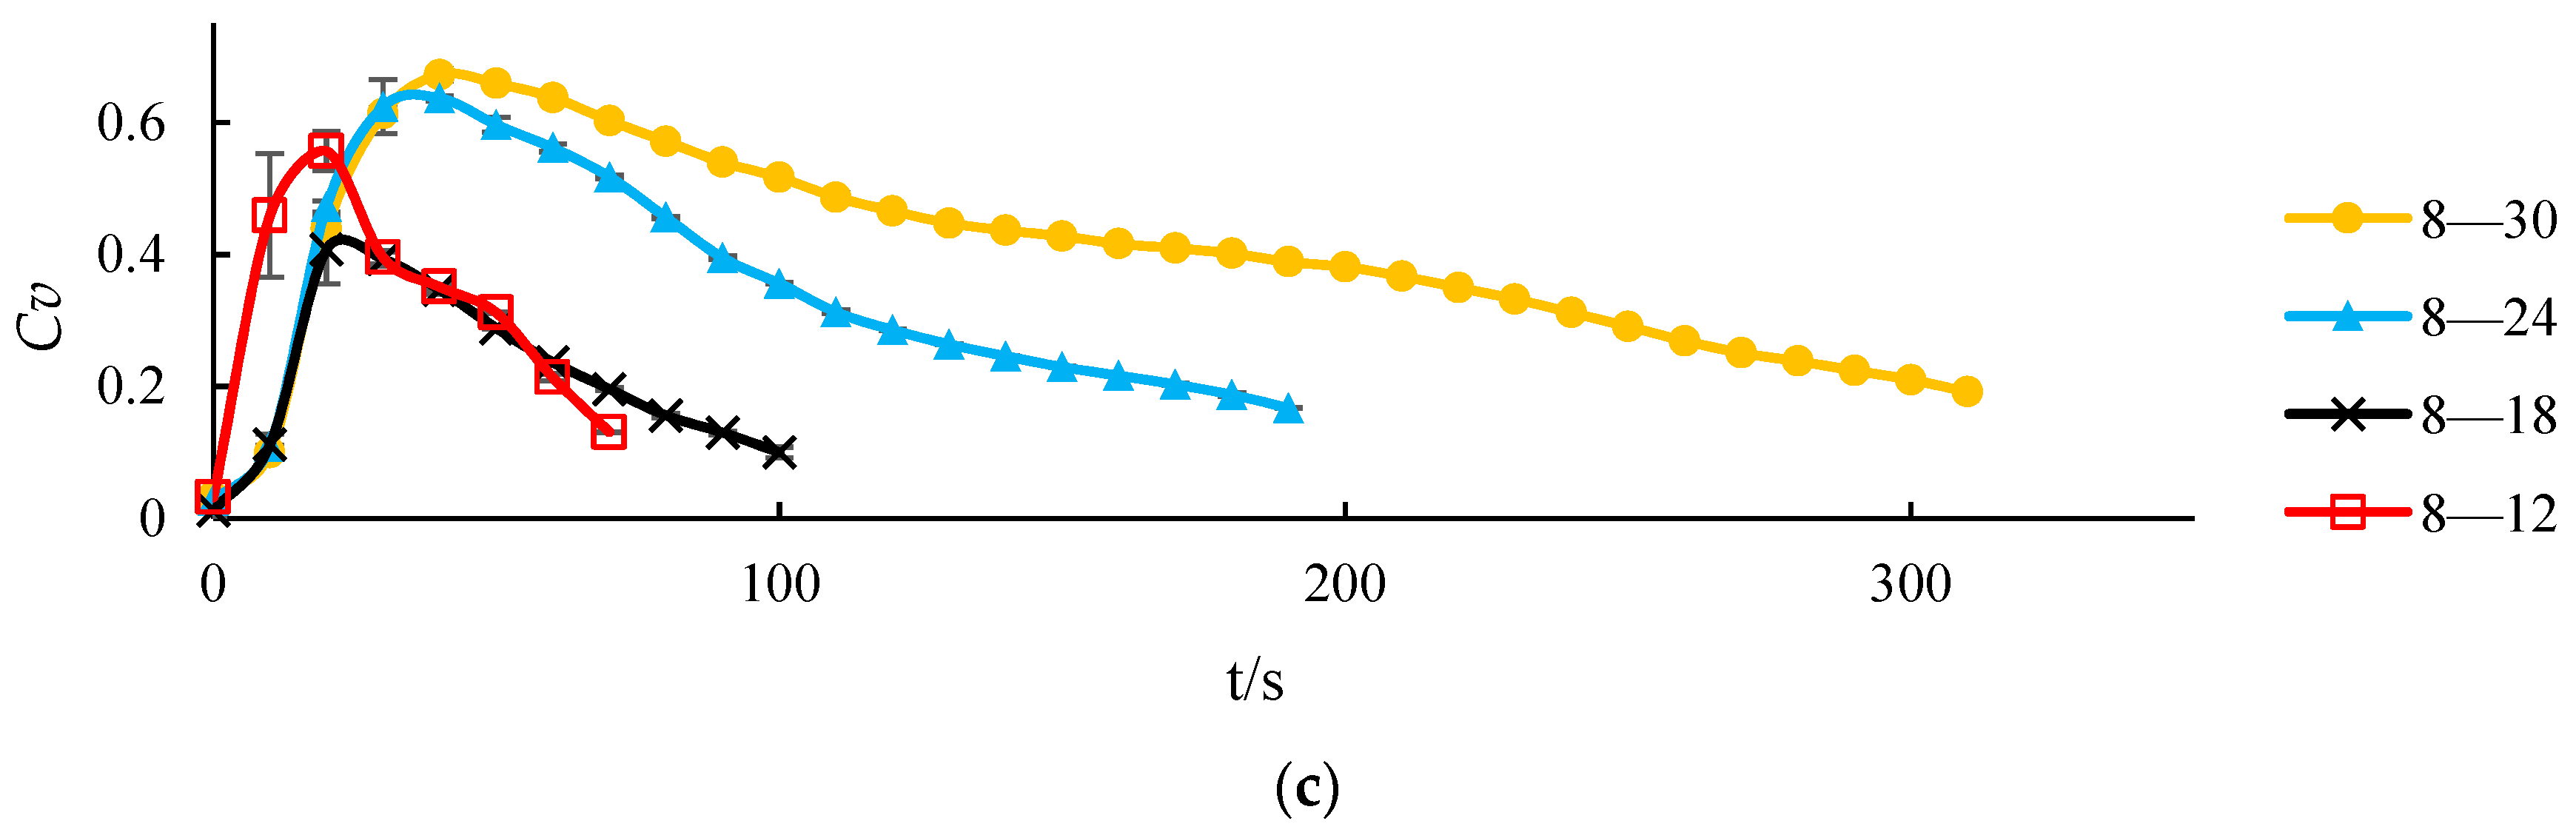
Figure 9 shows that the curve of the ST coefficient of variation (Cv) with time shows a parabolic change, and the slope of the curve before the peak is greater than the slope of the curve after the peak. This result occurs because the ST near the steam pipe holes is too high at the beginning of the disinfection process. The overall ST difference is large, and the ST distribution is uneven. The ST field tends to be stable in the late stage of disinfection; the ST difference gradually decreases and approaches zero, creating a uniform temperature distribution. Under the same flow rate, with the decrease in SPS, the ST coefficient of variation decreases first and then increases. The peak value of the curve with a spacing of 18 cm is only 0.4–0.45, which indicates that the ST distribution with SPS = 8 cm is more uniform, approximately 90 °C. Under the same ST conditions, the ST Cv curves of the different flow treatments were basically the same, which indicated that the changes in ST under different flow rates but with the same SPS were essentially the same.
Because the ST distributions for the same SPS are basically the same under different flow rates, this paper mainly analyses the ST field of the four SPSs under a flow rate of 4 kg/h.
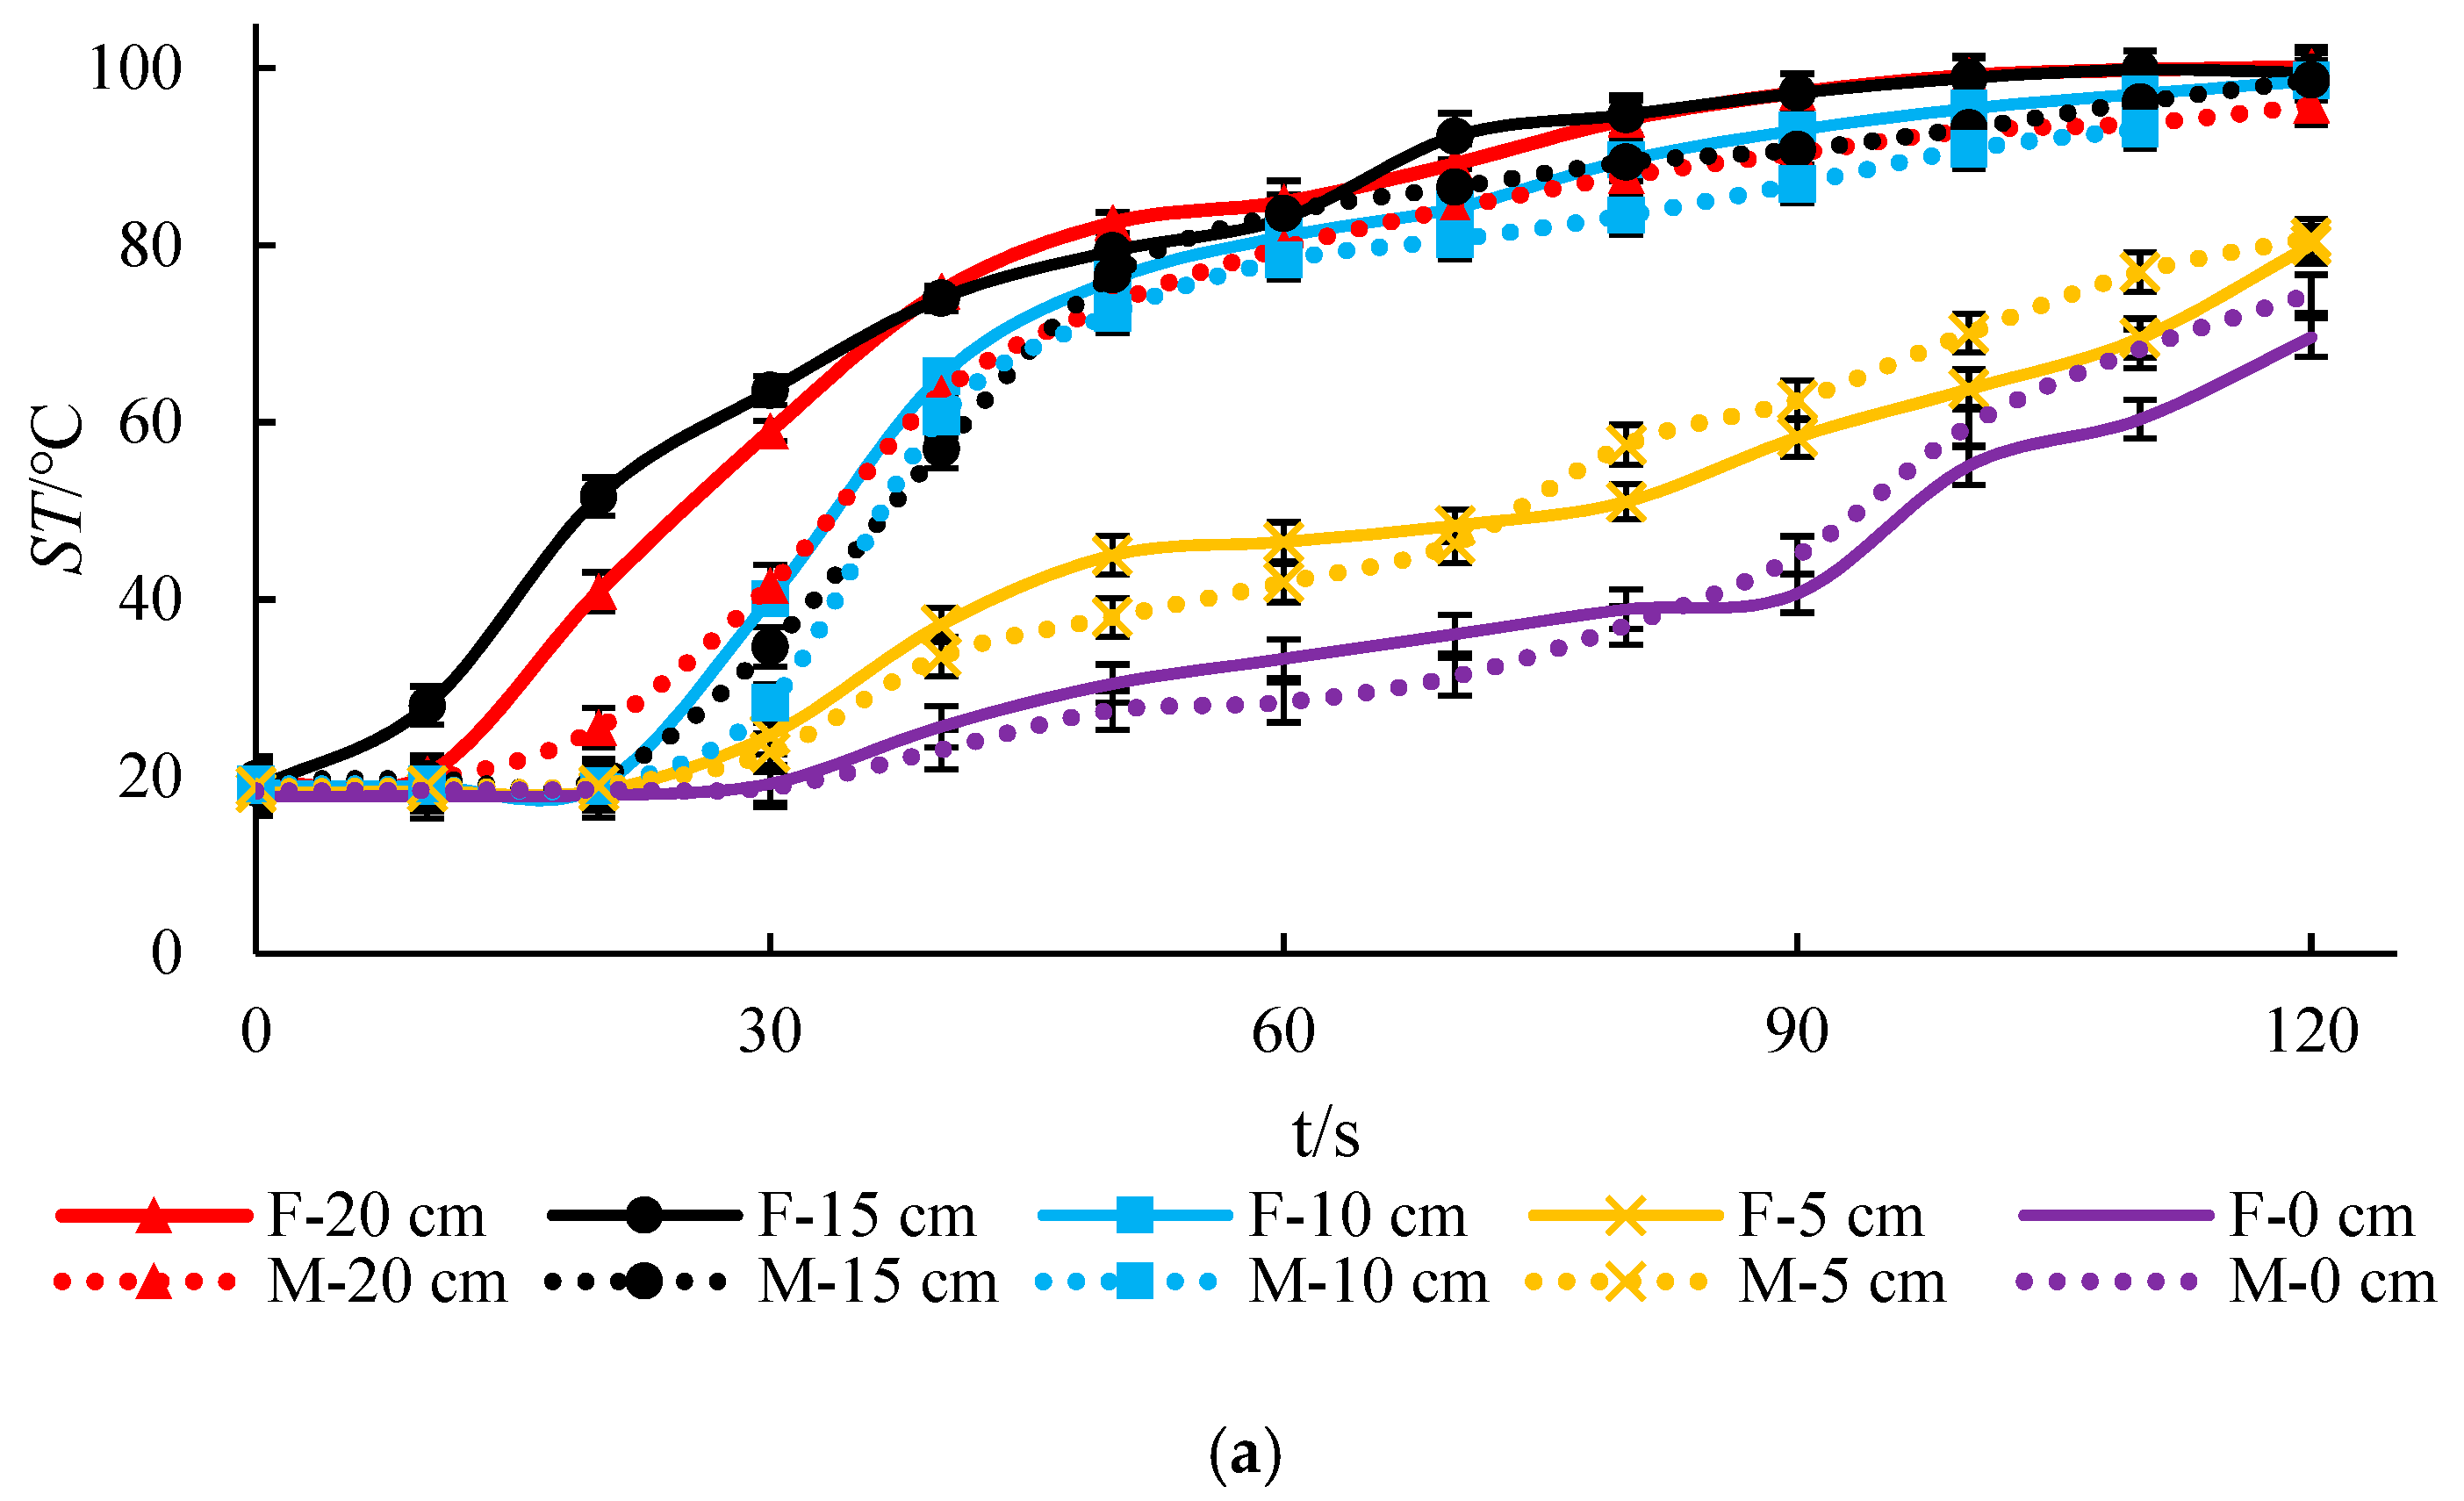
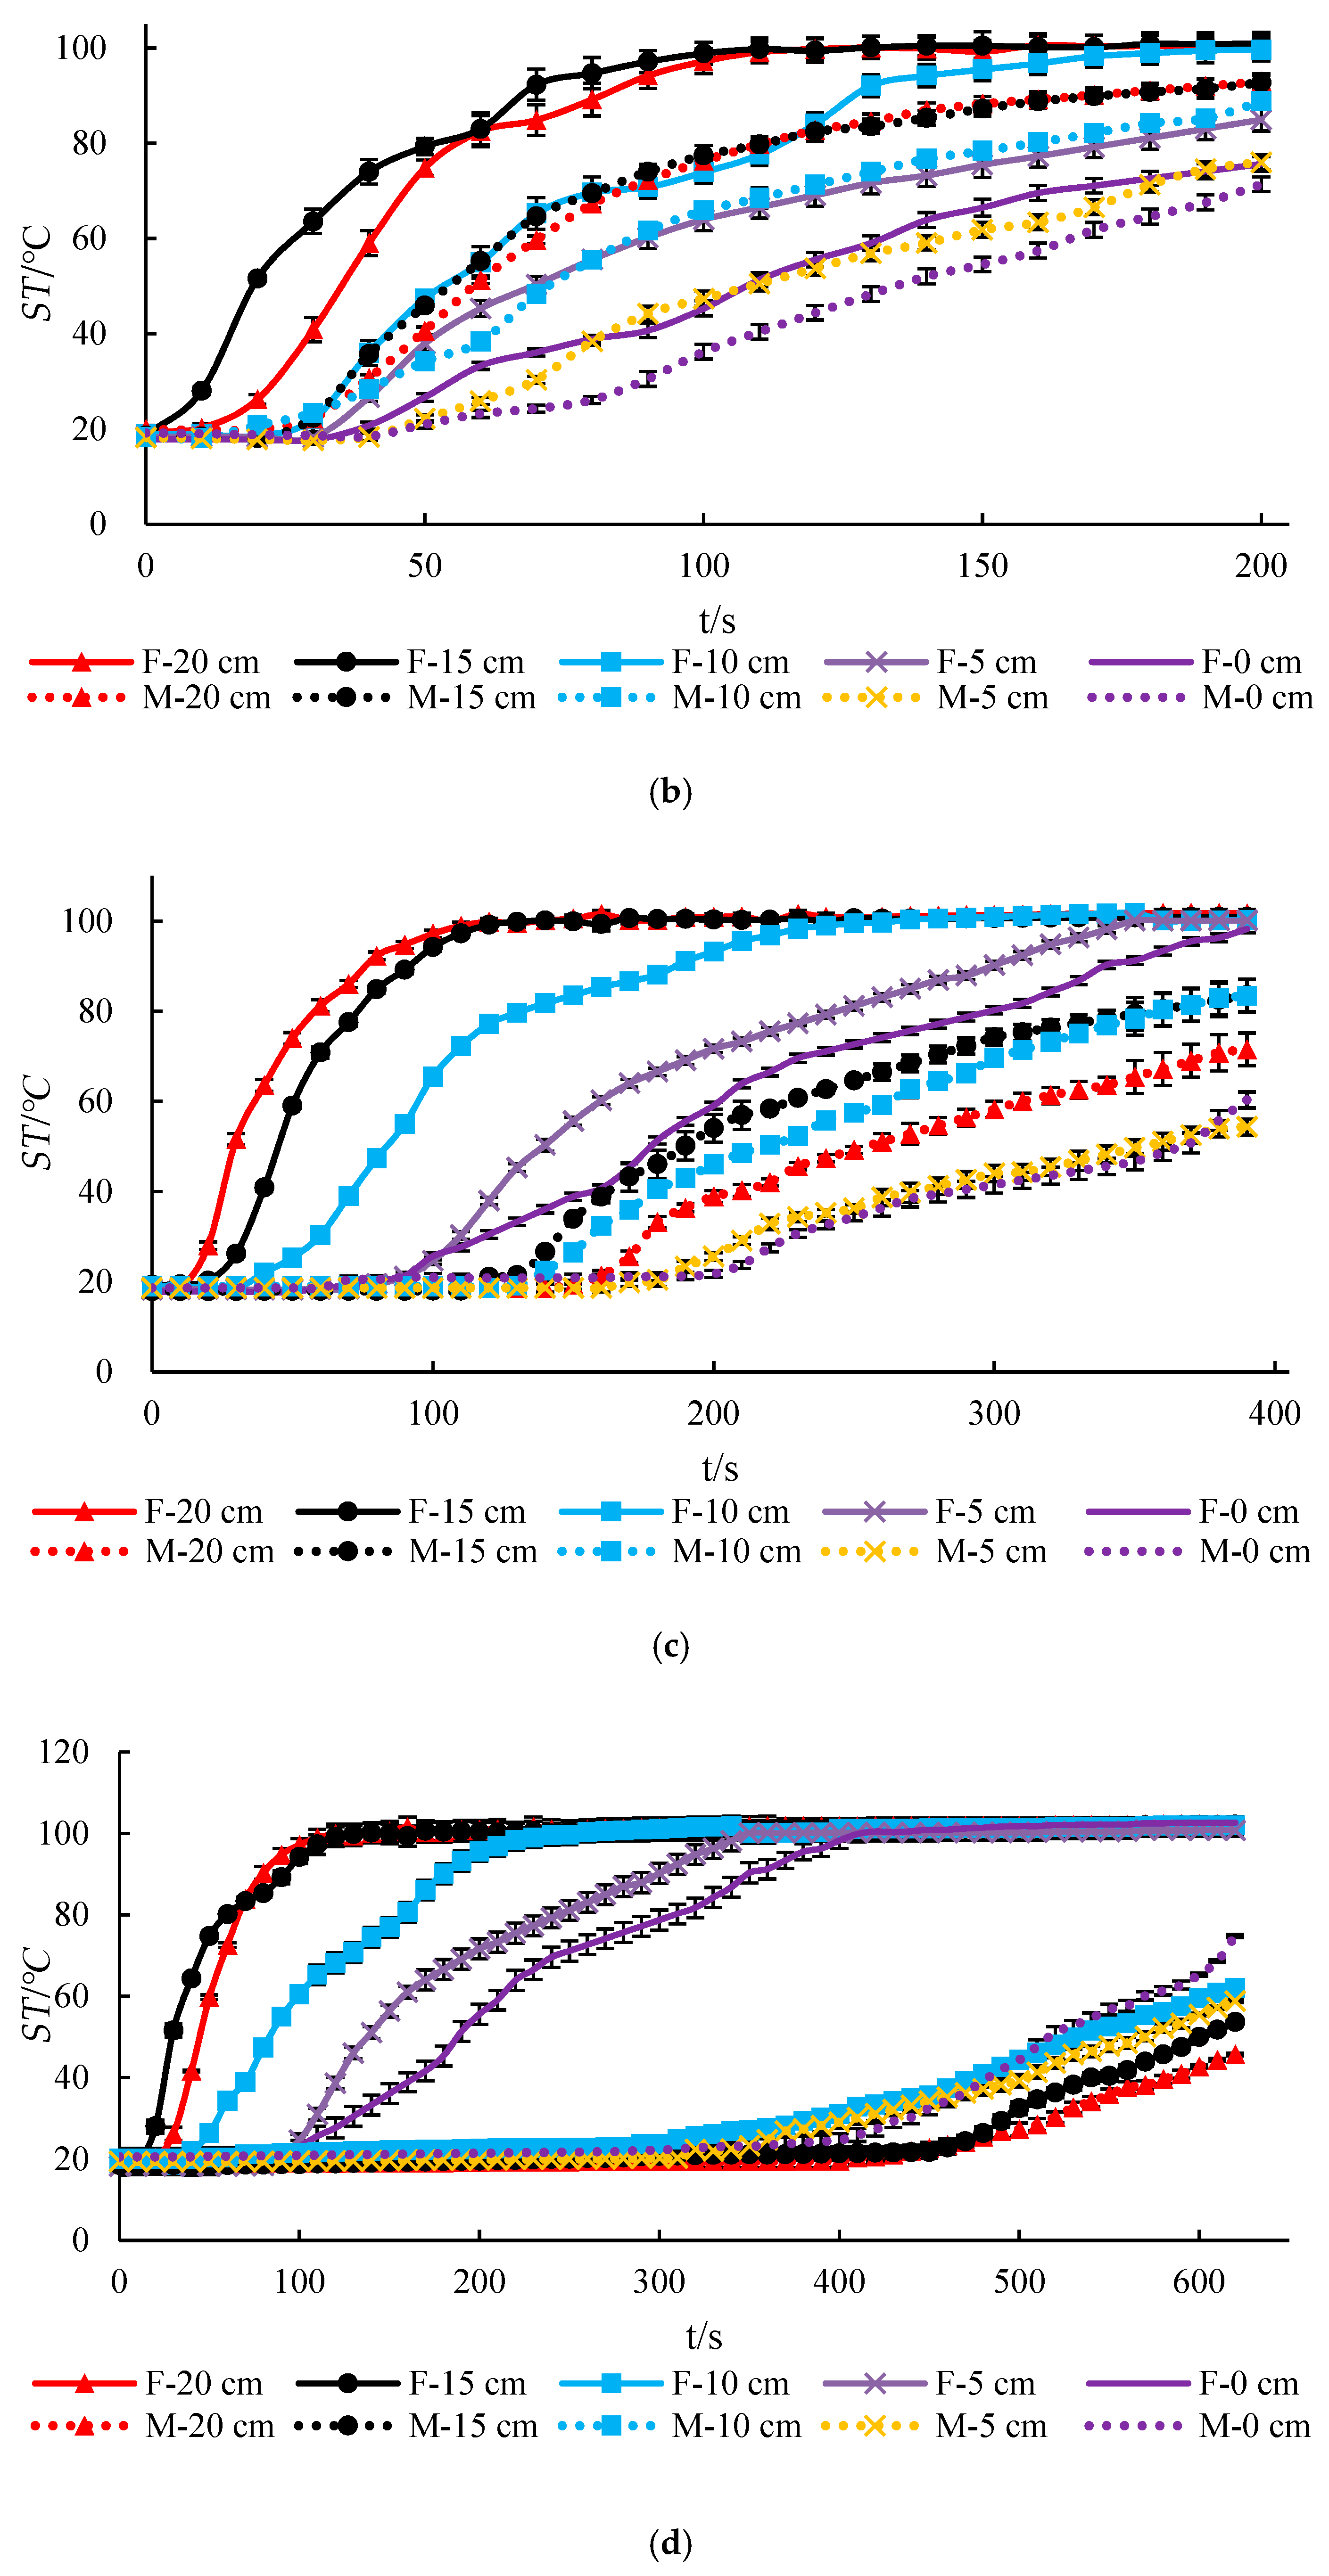
A comparison of Figure 10a,b indicates that the ST curves at F (3 cm) and M (6 cm) for SPS = 12 cm are similar to the ST curves of F (3 cm) and M (9 cm) for SPS = 18 cm, where the locations of F and M can be found in Figure 6. In other words, the slope of the ST curve at SLD = −10–−20 cm is much steeper than that at SLD = 0–−5 cm, which indicates that the deep soil is directly heated by the high-temperature steam and that the heat is mainly concentrated at SLD = −10–−20 cm, which is the same observation as that of Gay for the gas phase [6]. Figure 10a,b also shows that the soil at SLD = 0–−5 cm after disinfection for 60 s gradually starts to heat at SPS = 18 cm, only 15 s behind that at SPS = 12 cm, which indicates that the heat transfer modes in the cases with SPS = 12 and 18 cm are basically the same. However, the ST was increased more uniformly when SPS = 18 cm; for this SPS treatment, at the end of the disinfection process, the surface ST was maintained between 71 and 85 °C, while the surface ST at SPS = 12 cm was maintained between 69 and 81 °C.
Figure 10c,d shows that with SPS = 24 and 30 cm, at the F (3 cm) position, the ST at SLD = −15–−20 cm is still higher than that at SLD = 0–−5 cm. After disinfection for 390 s, the soil surface temperature can exceed 100 °C and form a superheated area. The corresponding heat transfer mode is mainly steam convection heat transfer. At point M, the ST curve with SPS = 24 cm is shifted right, and after 130 s and 190 s of disinfection, the soil depth and surface temperature increase gradually, indicating that the heat transfer mode of the soil at L = 12 cm (point M) changes. The ST at SLD = −10–−15 cm is higher than that at SLD = 0–−5 and −20 cm, which indicates that the steam heat is concentrated in the soil layer at a depth of −10–−15 cm, while for SPS = 30 cm, the ST at the M position (15 cm) slowly increases after disinfection for 300 s, which indicates that the soil at L = 15 cm mainly relies on condensed hot water for conduction heating. After 510 s of disinfection, the surface ST gradually increases. By the end of the disinfection, the surface ST can exceed 74 °C, which indicates that the steam heat can be transferred to the soil surface, where the heat transfer mode can become steam convection heat transfer.
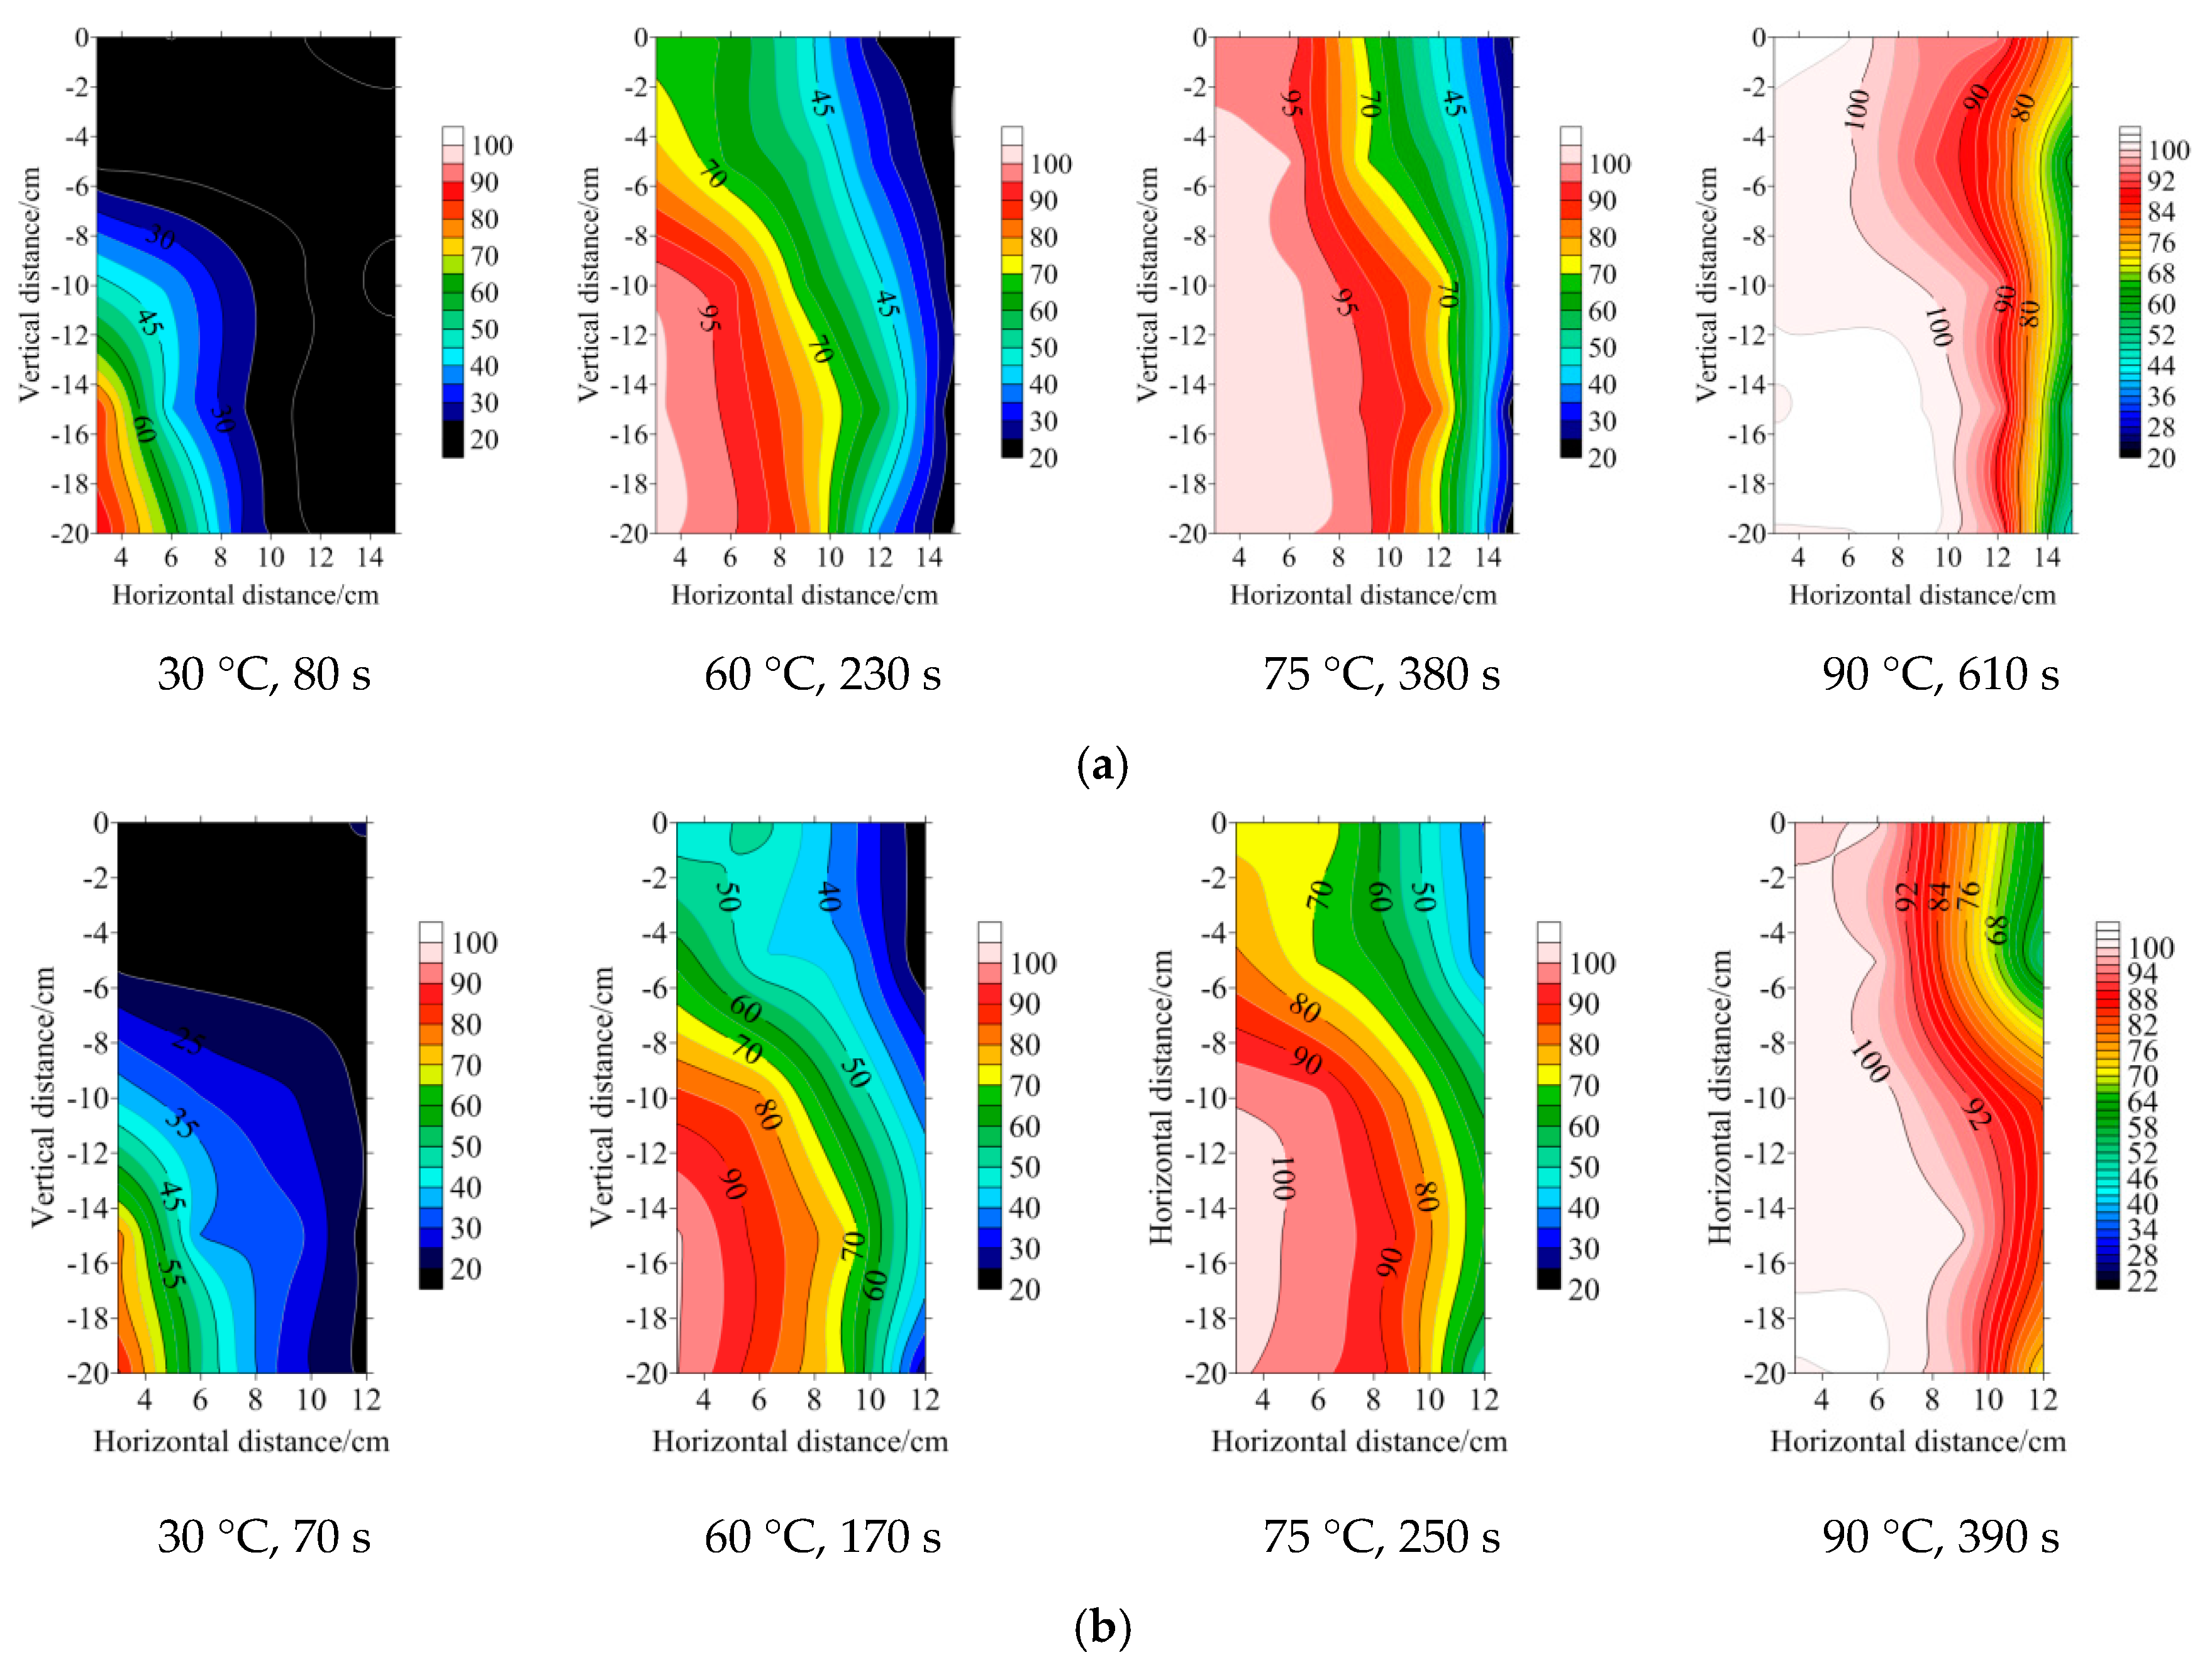
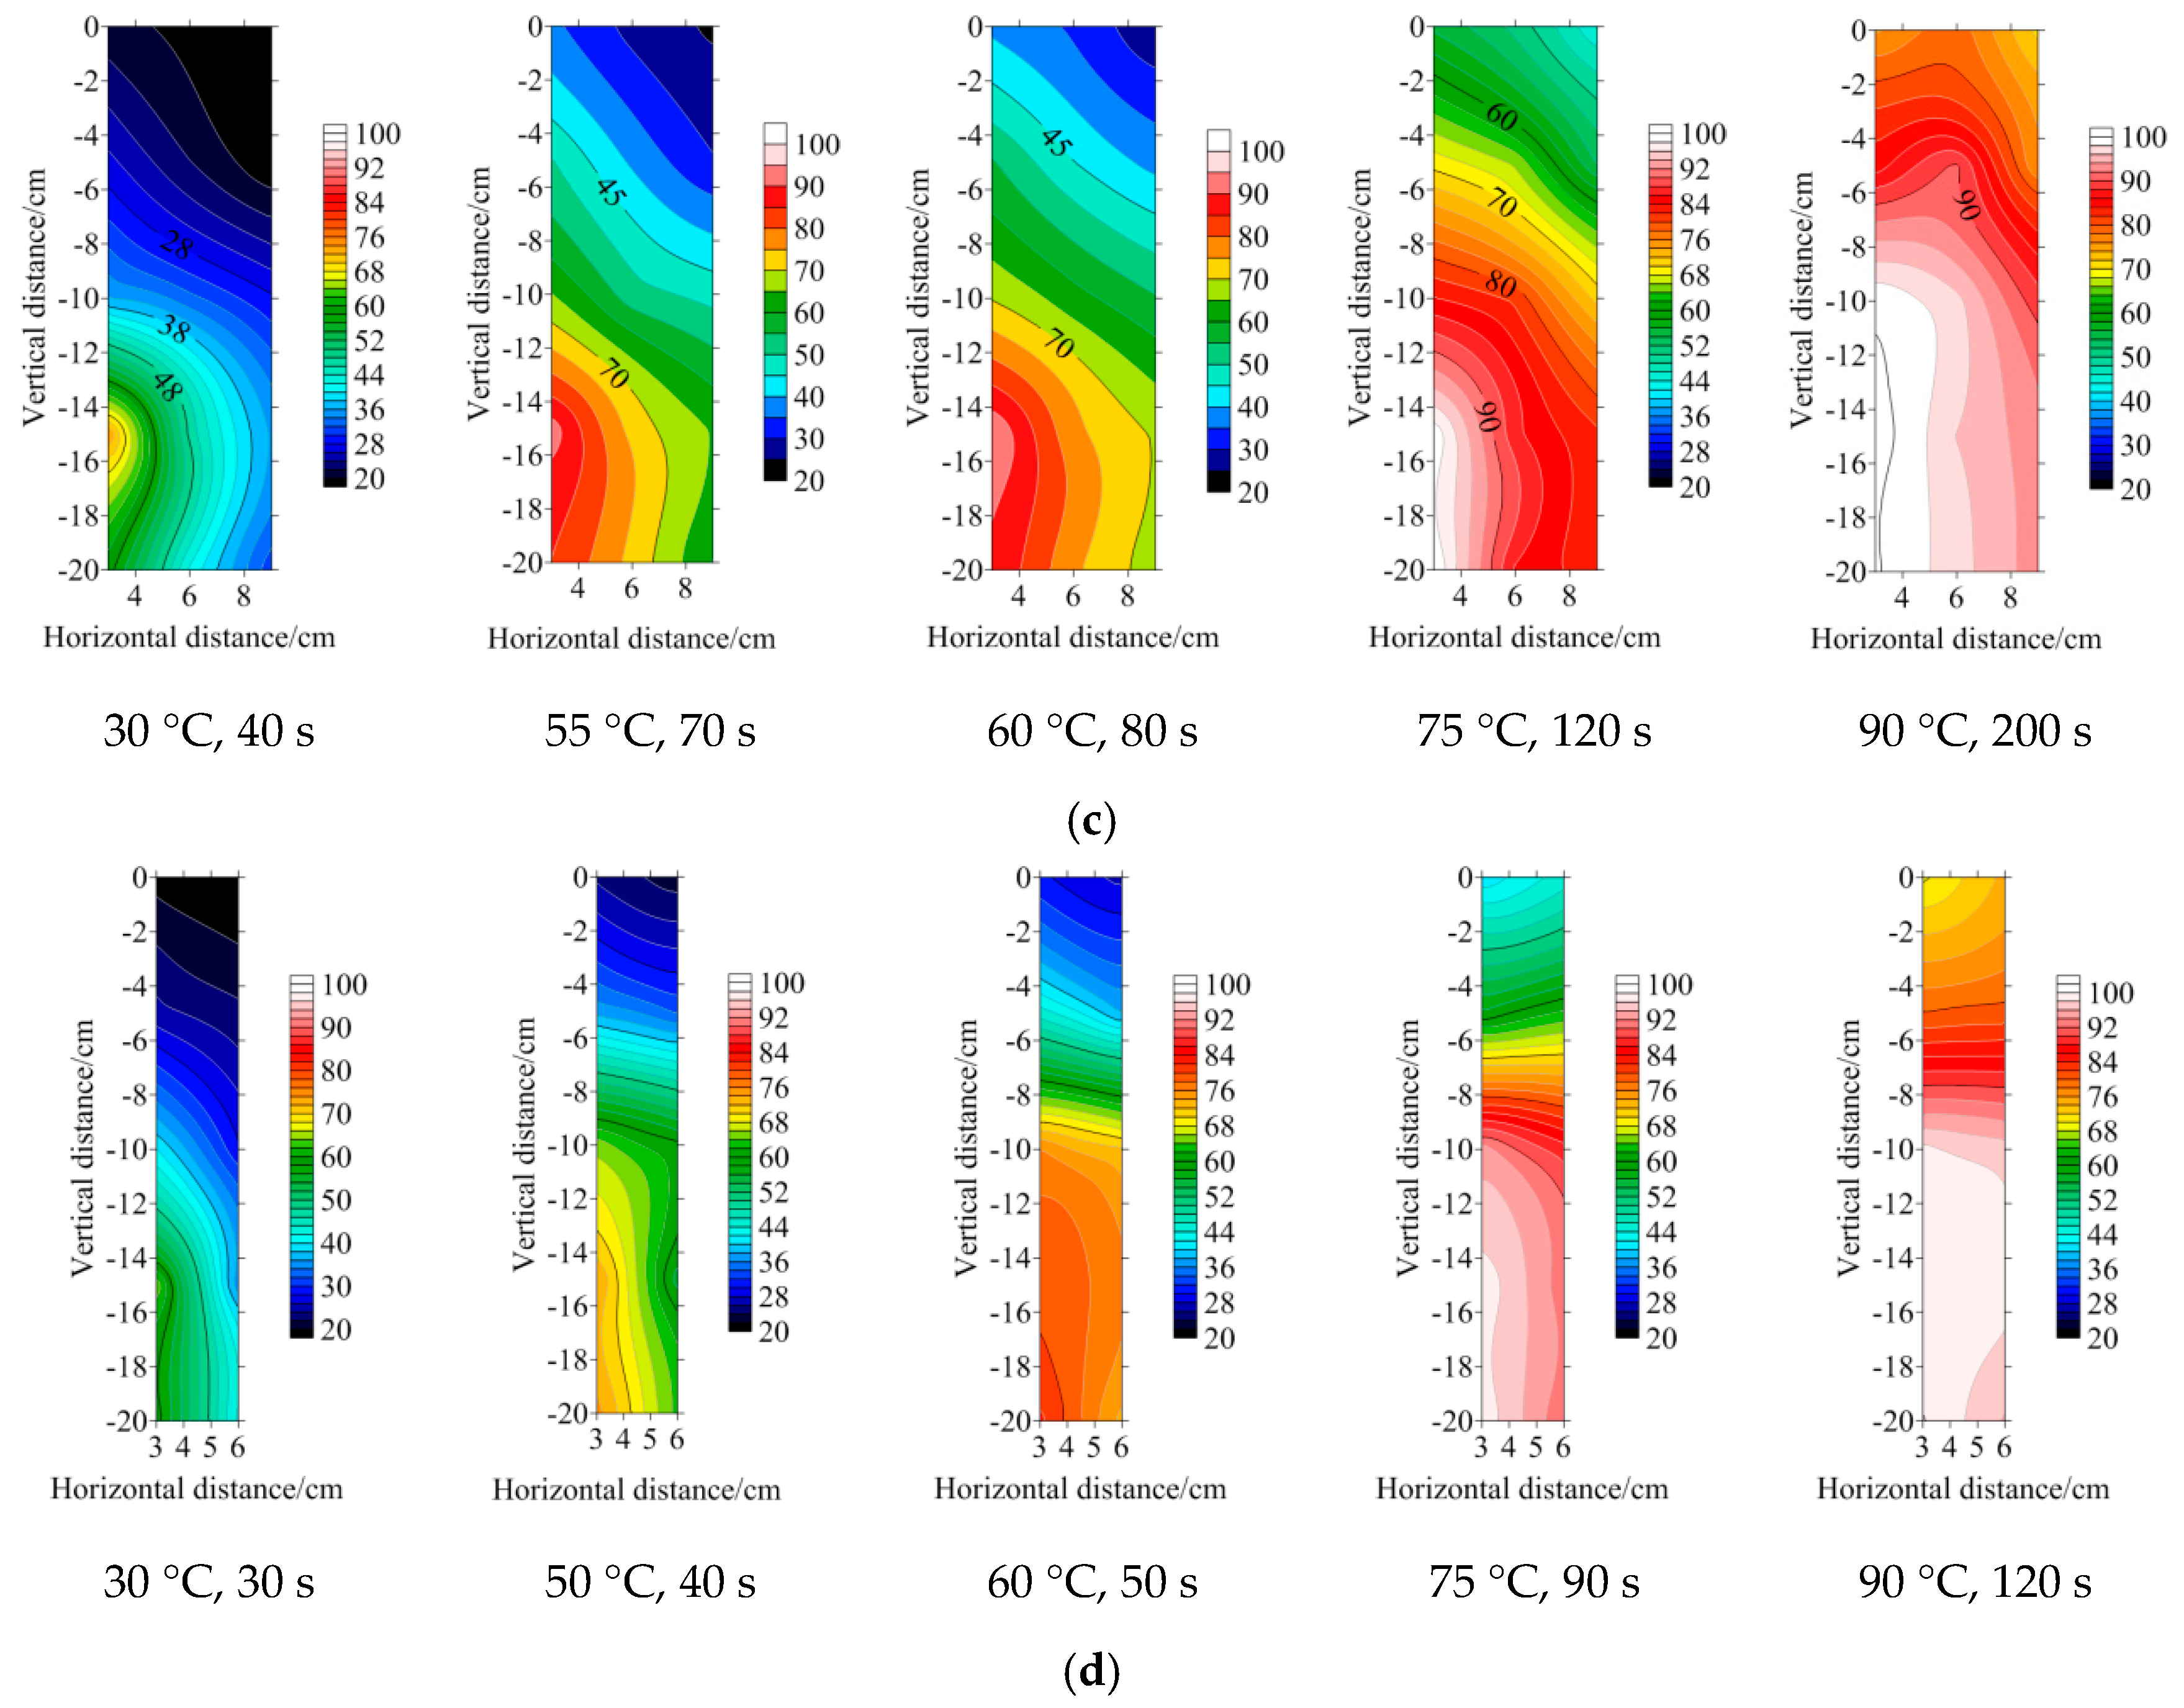
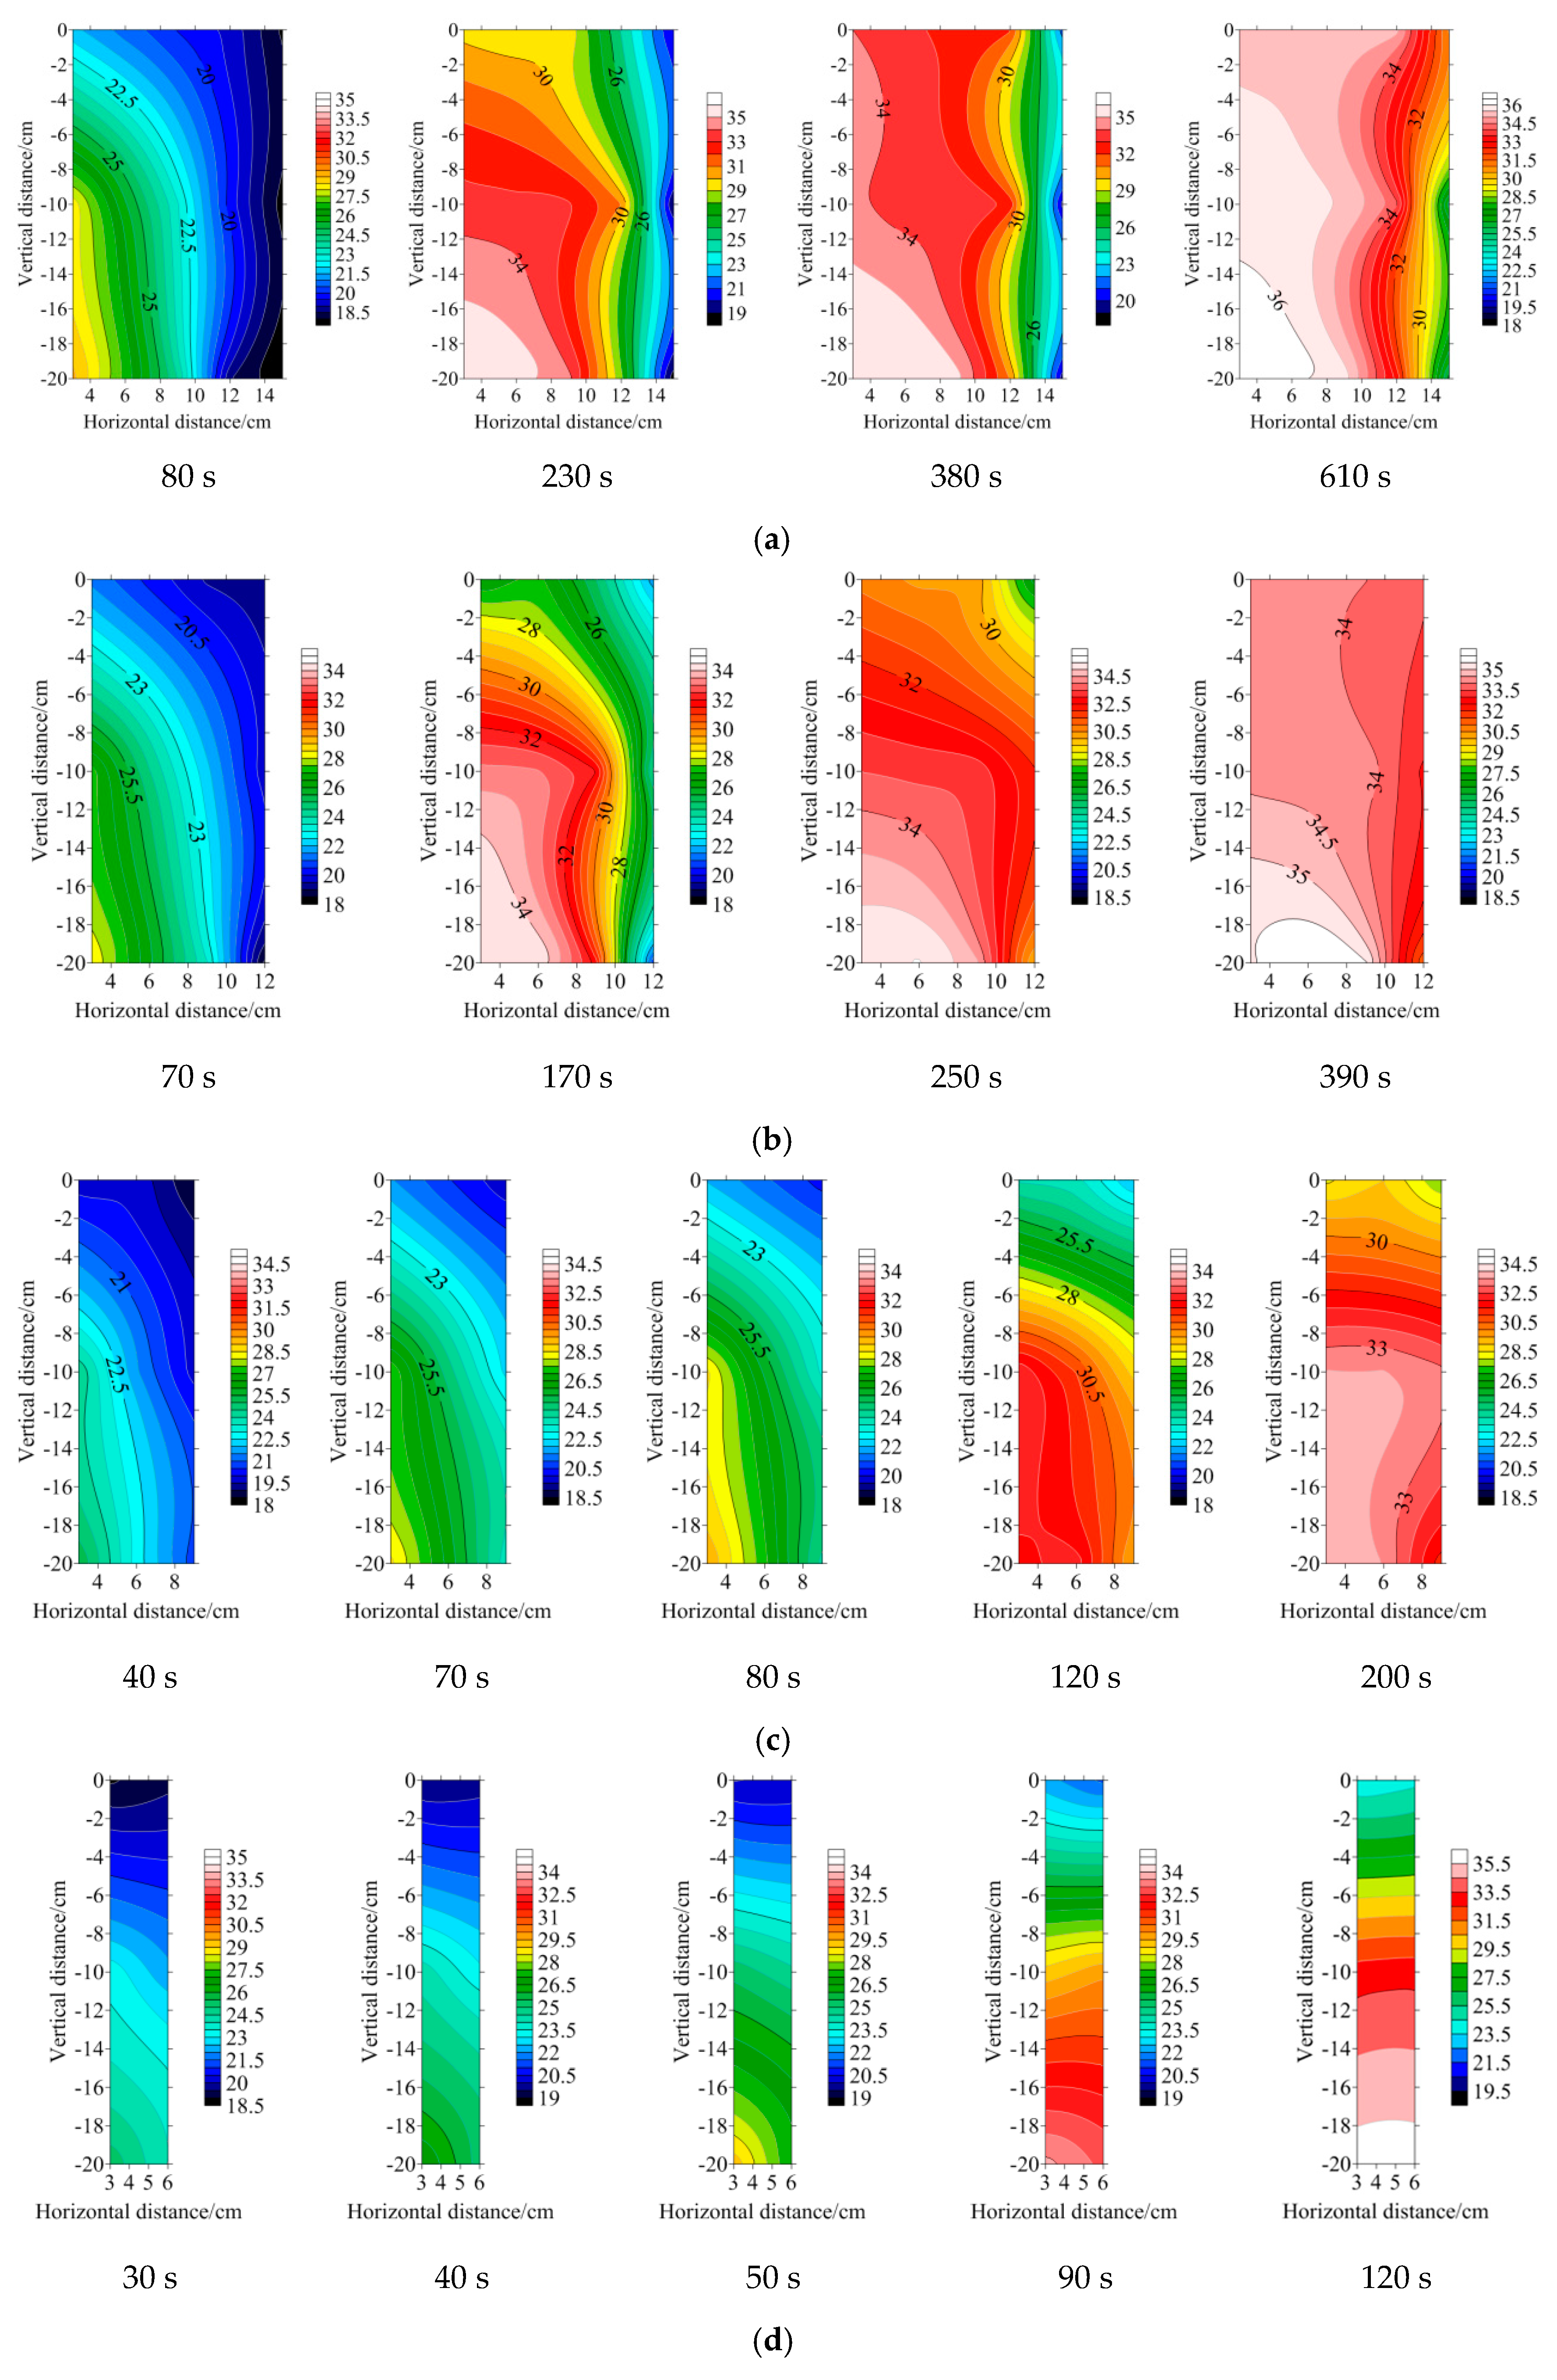
The ST distribution in Figure 11 shows that at the beginning of the disinfection process, the high-ST area in the soil is basically 1/4 of an ellipse (Xh to Yh = 0.63); at the end of disinfection, the soil high-ST area is rectangular (Xh = 0–11 cm, Yh = 0–−20 cm). For example, the SPS = 30 cm results in Figure 11a show that the high-ST area formed during disinfection for 230 s is 1/4 of an ellipse with Xh = 3–9 cm and Yh = −6–−20 cm, while at 380 s, the high-ST area is rectangular, with Xh = 3–10.5 cm and Yh = 0–−20 cm. The SPS = 24 cm results in Figure 11b show that after disinfection for 250 s, the 1/4-ellipse high-ST area is expanded to Xh = 10 cm and Yh = −4 cm, whereas at the end of disinfection (390 s), the high-ST area of SPS = 24 cm is rectangular, with Xh = 3–11 cm and Yh = 0–−20 cm.
Under the same disinfection time, the smaller the SPS is, the greater the Xh, especially for SPS = 12 and 18 cm, because the SPS decreases, resulting in the accumulation of steam heat between the pipes, enhancing the horizontal thermal range [16,17]. Figure 11a,b shows that when disinfected for 80 s, the moderate-ST area with SPS = 30 cm is concentrated at Xh = 4–6 cm; however, when disinfected for 70 s, the moderate-ST area with SPS = 24 cm is concentrated at Xh = 4–5.5 cm. Compared with the cases for SPS = 24 and 30 cm, the SPS = 18 cm results in Figure 11c show that with disinfection for 70–80 s, the moderate-ST area can reach the horizontal point M (Xh = 9 cm). Figure 11c,d also shows that the moderate-ST area with SPS = 18 cm is concentrated at Xh = 3–4 cm at 40 s of disinfection; the moderate-ST area can be expanded to the horizontal point M (Xh = 6 cm) because of the minimum SPS = 12 cm.
The ST distribution in Figure 11 also shows that as the SPS is gradually reduced, the temperature contours change from vertical to horizontal; that is, the variation in the ST in the horizontal direction gradually decreases, and the variation in the ST in the vertical direction gradually increases. Figure 11a,b shows that at the end of the disinfection, the soil surface with SPS = 30 and 24 cm is included in the high-ST area, the temperature contours are vertically distributed, and the ST of each layer is unevenly distributed in the horizontal direction. For example, at the end of disinfection (610 s), the ST for SPS = 30 cm at Xh = 3–13 cm is maintained at 80–100 °C, while the ST of Xh = 13–15 cm and Yh = −2–−20 cm is maintained at 45–68 °C, and the high-ST area does not reach Xh = 15 cm. For SPS = 24 cm, at the end of the disinfection (390 s), the high-ST area can reach point M in the horizontal direction, where Xh = 12 cm and Yh = −10–−15 cm; additionally, the ST horizontal distribution of this area is more uniform than that for SPS = 30 cm, and only the ST within Yh = 0–5 cm and Xh = 3–12 cm is maintained at 58–100 °C for SPS = 24 cm. When the SPS is reduced to 18 cm (Figure 11c), the high-ST area extends to point M (Xh = 9 cm) within only 120 s, and the ST difference decreases in the horizontal direction. At the end of the disinfection (200 s), the maximum ST in the deep layer of the soil can exceed 100 °C, while the lowest ST on the surface of the soil is 71 °C; the ST contours indicate a horizontal distribution. The Xh = 12 cm results in Figure 11d show that after disinfection for 50–90 s, the high-ST area gradually expands to point M (Xh = 6 cm), and the contours all become horizontal, that is, the STs within the same SLD are basically the same. At the end of disinfection (120 s), the high-ST area is mainly concentrated at depths of Yh = −5–−20 cm; in particular, the STs at Yh = −10–−20 cm are above 100 °C, and the lowest surface ST is 69 °C. The horizontal change in ST changes less than the vertical change in ST.
4.3. Soil Water Content Distribution Analysis
From the SWC distribution profile, the steam diffusion law can be observed, and the heat transfer mode of each stage in the steam injection disinfection process is studied in combination with the ST distribution profile.
The SPS = 30 cm results in Figure 12a show that at the beginning of the disinfection process, the steam spreads in the soil in a 1/4 ellipse, that is, the vertical diffusion speed is greater than the horizontal diffusion speed. The heat transfer mode of Xh = 3–11 cm is steam convection heat transfer. At the end of disinfection, soil forms a rectangular high-SWC area, that is, the diffusion velocity of the steam in the horizontal direction is gradually weakened, and the diffusion velocity in the vertical direction is gradually enhanced, causing the contours of the SWC to indicate a vertical distribution. The heat transfer mode of Xh = 13–15 cm is condensed water heat conduction. For example, when the disinfection time is 80 s, the wetting front can reach Xv = 3–11 cm and Yv = 0–−20 cm. At this time, the steam spreads through the soil in the form of gas–liquid two-phase flow, heating the soil. During the disinfection process from 80–230 s, the moderate-SWC area forms between two 1/4-ellipses from Xv = 3–8 cm and Yv = −6–−20 cm to Xv = 13 cm and Yv = 0 cm, and the high-SWC area can reach Xv = 3–11 cm and Yv = −1–−20 cm. After 150 s, a large amount of water vapour diffuses from the deep layer of the soil to the surface layer to form a rectangular region of high SWC, which is concentrated in the Xv = 3–12.5 cm and Yv = 0–−20 cm area. At the end of disinfection (610 s), the area with Xv = 13–15 cm and Yv = −5–−20 cm is also the moderate-SWC area, and the high-SWC area does not form at point M, but the SWC of the soil surface can exceed 30%. Therefore, the SWC of the soil surface layer diffuses in the form of gas–liquid two-phase flow, and the heat transfer mode is steam heat convection. However, the SWC of Xv = 13–15 cm migrates in the form of liquid water, and the heat transfer mode is condensed water heat conduction. The SPS = 24 cm results in Figure 12b also show that when disinfected for 70 s, the wetting front migration distance is the same as that for SPS = 30 cm. When disinfected for 170 s, the high-SWC area expands to Xv = 9.5 cm and Yv = −5 cm; the moderate-SWC area expands to Xv = 12 cm and Yv = 0 cm, which indicates that Yv is 20 cm when Xv is 12 cm. The results obtained for SPS = 30 cm are basically the same as those for SPS = 24 cm. After 80 s, the high-SWC area reaches Xv = 12 cm and Yv = −4.5–−18 cm, which indicates that the steam from the two pipes converges at a moderate SLD. At the end of disinfection (390 s), a large amount of steam accumulates in the soil surface, forming a high-SWC area. At this time, the high-SWC area is distributed in a rectangular shape with a dimension of Yv = 0–−20 cm; the SWC of the deep soil can reach 35.5%, and the SWC of the soil surface can reach 34%. The SWC contours with SPS = 24 cm also indicate a vertical distribution, that is, the variation in SWC in the horizontal direction is greater than that the vertical direction.
The results for SPS = 18 cm in Figure 12c show that the SPS is reduced to better allow the steam to reach point M (Xv = 9 cm). The steam coalescence also enhances the horizontal thermal interaction, and the heat transfer method is steam convection heat transfer. At the end of disinfection, the SWC contours indicate a horizontal distribution and show that the variation in SWC in the vertical direction is greater than that in the horizontal direction. For example, during disinfection for 70–80 s, compared with the treatments of SPS = 24 and 30 cm, the moderate-SWC area with SPS = 18 cm can expand to Xv = 8.5 cm and Yv = 5.5 cm. Similarly, at 120 s of disinfection, the steam from the two pipes converge at Xv = 9 cm and Yv = −10–−20 cm to form a rectangular high-SWC area. At the end of disinfection (200 s), the SWC of the deep soil can reach 34%, the SWC of SLD = −3 cm is 30%, and the SWC at the surface (SLD = 0 cm) is only 27.5%. The SPS = 12 cm also shows that because the SPS is reduced to 12 cm, steam can coalesce at point M (Xv = 6 cm) to form a moderate-SWC area when the soil is disinfected for 40 s, resulting in a more pronounced steam heat interference effect between the pipes; with disinfection for 90 s, the high-SWC area formed by the steam coalesce is mainly concentrated in the area described by Xv = 3–6 cm and Yv = −12–−20 cm, while the SWC of the surface is only 23.5%, and the water diffusion rate to the surface is slow, which indicates that the steam ejected from both pipes concentrates in the deep layer of the soil and that the heat transfer method is steam convection heat transfer. At the end of disinfection (120 s), the SWC of the deep soil can be 36% greater than the field water holding capacity, and the high-SWC area is mainly concentrated at Yv = −7–−20 cm, while the surface soil exhibits mostly moderate- and low-SWC areas, which also indicates that the soil water migrates to the surface slowly and the magnitude of change in the SWC in the vertical direction is greater than that in the horizontal direction.
4.4. Soil Temperature Distribution Analysis
Table 4 shows that the SPS has a significant effect on the disinfection time ratio and that the disinfection time ratio of SPS = 18 cm is 0.85; that is, the ratio of the actual to the theoretical disinfection times is close to 1, which indicates that the heat loss in the soil is small and that the steam heating efficiency is high. The disinfection time ratio for SPS = 12 cm is only 0.58, which is the lowest disinfection time ratio observed. The steam flow has no significant effect on the disinfection time ratio.
Table 4 shows that the SPS has a significant effect on the relative energy consumption. The relative energy consumption for SPS = 18 cm is 2 kJ/(kg·°C), and the relative energy consumption for SPS = 12 cm is 2.94 kJ/(kg·°C). The relative energy consumption for SPS = 24, 30, and 12 cm increased by 7.84, 10.3 and 46.8%, respectively, compared to that for SPS = 18 cm. The effect of the steam flow on the relative energy consumption is not significant.
In summary, analogous to the sheet method [6,28], the area around the injection method can also be divided into a dry zone, gas phase zone, gas–liquid two-phase zone, and wet zone. The soil is dry before being disinfected. After the disinfection starts, saturated dry steam is sprayed from the outlet of the disinfection pipe into a 1/4-elliptical area and diffuses in the soil [6]. The heat flux diffusion rate is in accordance with qX < qY, and the area where the wetting front reaches is the gas phase zone. As the disinfection progresses, the saturated dry steam in the soil pores condenses to form a gas–liquid two-phase flow. At this stage, the air in the soil pores is gradually replaced by water vapour, and the SWC gradually increases to form a gas–liquid two-phase zone, which is mainly concentrated in Xv = 0–10 cm and Yv = 0–−20 cm. The ST rise rate in this area is basically the same or higher than those in other areas. The heat transfer mode is steam and soil convection heat transfer. As the SWC increases, the deep layer of the soil forms a wet zone. When the SPS is greater than 24 cm [13], the gas–liquid upflow diffuses to the soil surface to form a high-temperature, high-water-content rectangular region [27]. With the increase in condensed hot water and the expansion of the wet zone, when the SWC exceeds the maximum water holding capacity, the condensed hot water migrates to a deep layer of the soil because of the gravity potential, causing deep water leakage and heat transfer. For SPS = 12 cm [15], because this SPS is too small, the wet zone formed by the steam convergence is mainly concentrated near the air outlet of the disinfection pipe. Therefore, the liquid water formed by the steam condensation migrates to a deep layer of the soil because of the gravity potential, and finally, the water drains from the soil bin holes, making it difficult to spread heat to the soil surface. Therefore, when the SPS is too large or too small, it is necessary to extend the theoretical disinfection time and increase the amount of steam to ensure that the soil is fully heated. The disinfection time ratios for SPS = 12, 24, and 30 cm are thus smaller than that for SPS = 18 cm, and the relative energy consumption values are higher.
5. Discussion
There are many types of steam soil disinfection methods used throughout the world, but there is a great need to find a steam disinfection method that provides a suitable heat distribution pattern and is energy-efficient. Keeping this factor in mind, the current study focused on using different values of the SPS in the clay loam unique to southern China to find a suitable SPS under which the injection method forms a continuous uniform soil disinfection zone and the control steam heat loss is kept to a minimum. Therefore, the distribution of the temperature field of a single steam pipe should be analysed before determining a reasonable SPS. According to the CFD numerical calculation of single steam pipe in the SSD process, when the Xv of a single steam pipe is less than 11 cm, the corresponding Yv will be less than 20 cm, and the steam will not overflow. The ST field shape of the numerical simulation is basically consistent with the test results. Therefore, the SPS should be less than 22 cm. Under this SPS condition, the steam between the pipes can be completely diffused in the soil and will not be lost to the air to cause heat loss. The test results also showed that the relative energy consumptions for SPS = 30, 24, and 12 cm were above 2.18 kJ/(kg·°C), and the SPS = 18cm had high heating efficiency with minimum energy consumption because of the uniform accumulation of steam between the pipes in the various SLDs. Therefore, when the SPS is in the range of 18 to 22 cm, the steam can diffuse completely at a SLD = 0–20 cm with an efficient heat transfer rate.
Although the injection method can effectively remove the condensed water blocked in the soil pores to promote the diffusion of steam in the soil, when the soil to be disinfected is clay or clay-loam soil with excessive clay content, the steam will be more difficult to diffuse in dense soil [16,17]. Therefore, it is necessary to appropriately reduce the SPS, which can promote the coalescence of steam between pipes to form a uniform high temperature zone. If the SPS is not reduced, it will be difficult for the steam to diffuse horizontally in the dense soil, and most of the steam will diffuse vertically into the air, which will cause the loss of steam heat. As the study by Minuto and Runia showed that vapor was difficult to diffuse in the dense soil [18,19]. By comparing previous studies, under the same soil bulk density, sandy-loam soil has better permeability than clay-loam soil because of its dense structure. Thus, in the SSD process, when the soil to be disinfected is sandy-loam soil [6,13], because of the high content of sand, the soil pores are relatively large, which is conducive to the horizontal diffusion of steam. So, the SPS can be appropriately increased, and the soil can be heated evenly with minimum energy consumption [13]. For the clay-loam soil that is unique to the Yangtze River delta in China, the SPS of steam disinfection mechanism designed in the clay-loam soil needs to be smaller than the SPS of the sand-loam soil, which ensures that the inter-tube steam just gathers together evenly in the case of low SSD system energy consumption.
For the different soil types, if the SPS is too large, the steam will be lost to the air to cause an ineffective loss of heat for the cultivated layer (0–−20 cm), or it may accumulate on the soil surface to form a superheated area [6,13], resulting in uneven ST distribution. To increase the ST of the deep soil, the SPS must be further reduced, which promotes the coalescence of steam in a deep layer of the soil to reduce heat loss and ensure that the deep soil can be completely heated [15]. However, if the SPS is too small, a large amount of steam will accumulate in the hole of the steam pipe, causing heat to accumulate and resulting in a serious excessive accumulation of steam heat in the deep layer of the soil, and the deep leakage of the condensed hot water will also cause heat loss. As Jiang [15] found, when the SPS is less than 14 cm, although the ST rise rate is fast and the heat transfer effect improves, the energy consumption increases, and work efficiency decreases. Therefore, in order to obtain the best results in the injection SSD process, it is necessary to ensure that when the steam diffuses in the soil, the inter-tube steam just gathers together and is evenly distributed in the soil layers. Remember this principle, we can get an appropriate SPS which not only ensures a uniform distribution of ST, but also reduces system energy consumption for static disinfection operations in different soils for the cultivated layer.
6. Conclusions
In this paper, a CFD numerical calculation is used to determine that when the Yh is 20 cm, the Xh of a single pipe is 13 cm, and the high-ST area is elliptical (short radius to long radius = 0.65). In the SPS test, when the Xh of the 1/4-elliptical high-temperature zone reaches 9–10 cm, the corresponding Yh is 14–16 cm (short radius to long radius = 0.63), which is basically consistent with the simulation results. Analogous to the sheet method, under steam injection, the soil can be divided into a dry zone, gas phase zone, gas–liquid two-phase zone, and wet zone.
At the same SPS, as the steam flow rate increases (4–8 kg/h), the ST rise rate increases, and the time required for disinfection decreases. Under different flow rates, the ST distributions and heat transfer modes of the same SPS are basically the same. Under the same flow conditions, as the SPS decreases, the thermal range between pipes increases gradually in the horizontal direction. The variations in the ST and SWC are gradually decreasing in the horizontal direction and gradually increasing in the vertical direction. The areas of high ST and high SWC at the soil surface decrease, while those in the deep soil increase. The SSD area with SPS = 18 cm corresponds to gas phase and gas–liquid two-phase zones. The heat transfer mode is steam convection heat transfer, the soil heating rate is fast, and the temperature distribution is uniform. The relative energy consumption is only 2 kJ/(kg∙°C), and the disinfection time ratio is 0.85, so the steam heating efficiency is high.
In summary, under a two-pipe flow rate = 4–8 kg/h for the cultivated layer (0–−20 cm), because of the steam thermal interaction between the pipes under the soil surface, the soil disinfection area with an appropriate SPS = 18–22 cm can form a continuous and complete uniform temperature distribution zone, which has a high heating efficiency and low energy consumption for the cultivated layer. In actual operation, If the soil is dense clay, the SPS can be appropriately reduced to less than 18 cm. If the soil is looser sandy-loam, the SPS can be increased to more than 22 cm.
Author Contributions
Conceptualization, Z.Y.; methodology, Z.Y.; software, Z.Y.; validation, Z.Y., X.W., and M.A.; formal analysis, Z.Y.; data curation, Z.Y.; writing—original draft preparation, Z.Y.; writing—review and editing, M.A.; visualization, M.A.; supervision, X.W.; project administration, X.W.; funding acquisition, X.W. and Z.Y.
Funding
This research was funded by the Jiangsu Province Science and Technology Support Plan-funded project CX(16)1002 and the Graduate Student Scientific Research Innovation Projects in Jiangsu Province KYCX17_0648.
Acknowledgments
We thank Hongyou Sun and Gang Li for helping with the work.
Conflicts of Interest
The authors declare no conflicts of interest.
Nomenclature
| ST | soil temperature (°C) |
| SSD | soil steam disinfection |
| SPS | steam pipe spacing (cm) |
| SLD | soil layer depth (cm) |
| qX | horizontal heat flux diffusion velocity (cm/s) |
| qY | vertical heat flux diffusion velocity (cm/s) |
| Xv | horizontal diffusion distance of the vapour (cm) |
| Yv | vertical diffusion distance of the vapour (cm) |
| Xh | horizontal heat transfer distance of the vapour (cm) |
| Yh | vertical heat transfer distance of the vapour (cm) |
| SWC | soil water content (%) |
| Qs | total amount of steam (kg) |
| Cv | coefficient of variation |
| Vt | soil temperature rise rate (°C/s) |
| Subscripts | |
| X | horizontal direction |
| Y | vertical direction |
| v | vapour |
| h | heat transfer |
| s | steam |
| t | temperature |
References
- Weiland, J.E.; Littke, W.R.; Browning, J.E.; Edmonds, R.L.; Davis, A.; Beck, B.R.; Miller, T.W. Efficacy of reduced rate fumigant alternatives and methyl bromide against soilborne pathogens and weeds in western forest nurseries. Crop Prot. 2016, 85, 57–64. [Google Scholar] [CrossRef] [Green Version]
- Yang, Y.T.; Hu, G.; Zhao, Q.L.; Guo, D.Q.; Gao, Q.S.; Guan, C.S. Research progress of soil physical disinfection equipment. Agric. Eng. 2015, 5, 43–48. (In Chinese) [Google Scholar]
- Cao, A.; Zheng, J.; Wang, Q.; Li, Y.; Yan, D. Advances in soil disinfection technology worldwide. China Veg. 2010, 21, 17–22. (In Chinese) [Google Scholar]
- Cao, A.; Zheng, J.; Guo, M.; Wang, Q.; Li, Y. Soil disinfection technology and key points. Vegetables 2011, 4, 41–44. [Google Scholar]
- Nishimura, A.; Asai, M.; Shibuya, T.; Kurokawa, S.; Nakamura, H. A steaming method for killing weed seeds produced in the current year under untilled conditions. Crop Prot. 2015, 71, 125–131. [Google Scholar] [CrossRef]
- Gay, P.; Piccarolo, P.; Aimonino, D.R.; Tortia, C. A high efficiency steam soil disinfestation system, Part I: Physical background and steam supply optimisation. Biosyst. Eng. 2010, 107, 74–85. [Google Scholar] [CrossRef]
- Peruzzi, A.; Raffaelli, M.; Ginanni, M.; Fontanelli, M.; Frasconi, C. An innovative self-propelled machine for soil disinfection using steam and chemicals in an exothermic reaction. Biosyst. Eng. 2011, 110, 434–442. [Google Scholar] [CrossRef]
- Khan, K.S.; Müller, T.; Dyckmans, J.; Joergensen, R.G. Development of ergosterol, microbial biomass c, n, and p after steaming as a result of sucrose addition, and sinapis alba cultivation. Biol. Fertil. Soils 2010, 46, 323–331. [Google Scholar] [CrossRef]
- Fennimore, S.A.; Miller, T.C.; Broome, J.C.; Dorn, N.; Greene, I. Evaluation of a mobile steam applicator for soil disinfestation in california strawberry. Hortscience 2014, 49, 1542–1549. [Google Scholar] [CrossRef]
- Roux-Michollet, D.; Dudal, Y.; Jocteur-Monrozier, L.; Czarnes, S. Steam treatment of surface soil: How does it affect water-soluble organic matter, c mineralization, and bacterial community composition. Biol. Fertil. Soils 2010, 46, 607–616. [Google Scholar] [CrossRef]
- Hoyos, E.P.; Gálvez, R.B. Influence of grafting and stem disinfection methods on the yield of greenhouse-grown spanish cucumbers. Acta Hortic. 2012, 927, 455–460. [Google Scholar] [CrossRef]
- Egli, M.; Mirabella, A.; Kägi, B.; Tomasone, R.; Colorio, G. Influence of steam sterilisation on soil chemical characteristics, trace metals and clay mineralogy. Geoderma 2006, 131, 123–142. [Google Scholar] [CrossRef]
- Gay, P.; Piccarolo, P.; Aimonino, D.R.; Tortia, C. A high efficiency steam soil disinfestation system, part II: Design and testing. Biosyst. Eng. 2010, 107, 194–201. [Google Scholar] [CrossRef]
- Van Loenen, M.C.A.; Turbett, Y.; Mullins, C.E.; Feilden, N.E.H.; Wilson, M.J.; Leifert, C.; Seel, W.E. Low temperature-short duration steaming of soil kills soil-borne pathogens, nematode pests and weed seeds. Eur. J. Plant Pathol. 2003, 109, 993–1002. [Google Scholar] [CrossRef]
- Jiang, X.S.; Yang, D.D.; Pan, S.P.; Chen, Q.; Li, P.P.; Zhou, H.P. Design and numerical simulation of steam transfer device for soil disinfector. J. Agric. Mech. Res. 2019, 5, 111–120. (In Chinese) [Google Scholar]
- Li, D.C.; Zhang, T.L. Fractal features of particle size distribution of soils in China. Soil Environ. Sci. 2000, 9, 263–265. (In Chinese) [Google Scholar]
- Ding, R.X.; Liu, Y.Z.; Sun, Y.H. Reference of soil system classification in subtropical humid region of China. Soils 1999, 2, 97–109. (In Chinese) [Google Scholar] [CrossRef]
- Minuto, G.; Gilardi, G.; Kejji, S.; Gullino, M.L.; Garibaldi, A. Effect of physical nature of soil and humidity on stream disinfestation. Acta Hortic. 2005, 698, 257–262. [Google Scholar] [CrossRef]
- Runia, W.T. A recent development in steam sterilization. Acta Hortic. 1983, 152, 195–200. [Google Scholar]
- Liu, Y.; Huang, G.; Lu, J.; Yang, X.; Zhuang, C. Simulation analysis and verification of heat transfer characteristics of truncated cone helix energy pile. Trans. CSAE 2018, 34, 227–234. [Google Scholar] [CrossRef]
- Luo, Z.; Du, J. Heat exchange scheme simulation optimization for ground source heat pump system with buried pipes by thermal equilibrium analysis. Trans. CSAE 2018, 34, 246–254. [Google Scholar] [CrossRef]
- Wang, X.; Zhang, H.; Zhang, L.; Sun, C. Infrared radiation drying characteristics and mathematical model for carrot slices. Trans. Chin. Soc. Agric. Mach. 2013, 44, 199–202. [Google Scholar] [CrossRef]
- Ju, H.; Xiao, H.; Bai, J.; Xie, L.; Lou, Z.; Gao, Z. Moderate and Short Wave Infrared Drying Characteristics and Color Changing of Apple Slices. Trans. Chin. Soc. Agric. Mach. 2013, 44, 187–191. [Google Scholar] [CrossRef]
- Zhang, X.; Liu, S.; Wu, Q.; Zeng, E.; Wang, G. Drying kinetics and parameters optimization of sludge drying at low temperature. Trans. CSAE 2017, 33, 217–223. [Google Scholar] [CrossRef]
- Diamante, L.M.; Patindol, R. Effects of temperature on drying rates and sensory qualities of sweetened maturing coconut meat (coco-crisps). Ann. Trop. Res. 2000, 22, 105–118. [Google Scholar]
- Topuz, A.; Gur, M.; Gul, M.Z. An experimental and numerical study of fluidized bed drying of hazelnuts. Appl. Therm. Eng. 2004, 24, 1535–1547. [Google Scholar] [CrossRef]
- Philip, J.R.; De Vries, D.A. Moisture movement in porous materials under temperature gradients. Eos Trans. Am. Geophys. Union 1957, 38, 222–232. [Google Scholar] [CrossRef]
- Bergins, C.; Crone, S.; Strauss, K. Multiphase flow in porous media with phase change. Part II: Analytical solutions and experimental verification for constant pressure steam injection. Transp. Porous Media 2005, 60, 275–300. [Google Scholar] [CrossRef]
- Bear, J.; Bachmat, Y. Introduction to Modeling of Transport Phenomena in Porous Media, 1st ed.; Springer: Dordrecht, The Netherlands, 1990; ISBN 978-0-7923-1106-5. [Google Scholar]
- Minkowycz, W.J.; Haji-Sheikh, A.; Vafai, K. On departure from local thermal equilibrium in porous media due to a rapidly changing heat source: The Sparrow number. Int. J. Heat Mass Transf. 1999, 42, 3373–3385. [Google Scholar] [CrossRef]
- Amiri, A.; Vafai, K. Transient analysis of incompressible flow through a packed bed. Int. J. Heat Mass Transf. 1998, 41, 4259–4279. [Google Scholar] [CrossRef]
- Li, X.; Zhu, L.; Wang, L.; Wang, J. Optimization of thermally enhanced SVE process for remediation of hydrocarbon contaminated soil by response surface methodology. Chin. J. Environ. Eng. 2018, 12, 914–922. [Google Scholar] [CrossRef]
- Weishaupt, K.; Bordenave, A.; Atteia, O.; Class, H. Numerical investigation on the benefits of preheating for an increased thermal radius of influence during steam injection in saturated soil. Transp. Porous Media 2016, 114, 601–621. [Google Scholar] [CrossRef]
Figure 1.
Custom-made soil steam disinfection (SSD) machine: (a) SSD machine; (b) steam disinfection pipe layout. 1. Steam disinfection mechanism. 2. Rotary tiller. 3. Control box. 4. Tractor. 5. Steam pipe. 6. Steam pipe spacing (SPS).
Figure 1.
Custom-made soil steam disinfection (SSD) machine: (a) SSD machine; (b) steam disinfection pipe layout. 1. Steam disinfection mechanism. 2. Rotary tiller. 3. Control box. 4. Tractor. 5. Steam pipe. 6. Steam pipe spacing (SPS).

Figure 2.
Steam disinfection model. (a) steam diffusion principle; (b) steam injection model. Note: qX is the horizontal heat flux diffusion velocity (cm/s); qY is the vertical heat flux diffusion velocity (cm/s); Xv is the horizontal diffusion distance of the vapour (cm); Yv is the vertical diffusion distance of the vapour (cm).

Figure 3.
Simulation results. (a) Xh = 0.13 m; (b) Xh > 0.13 m.
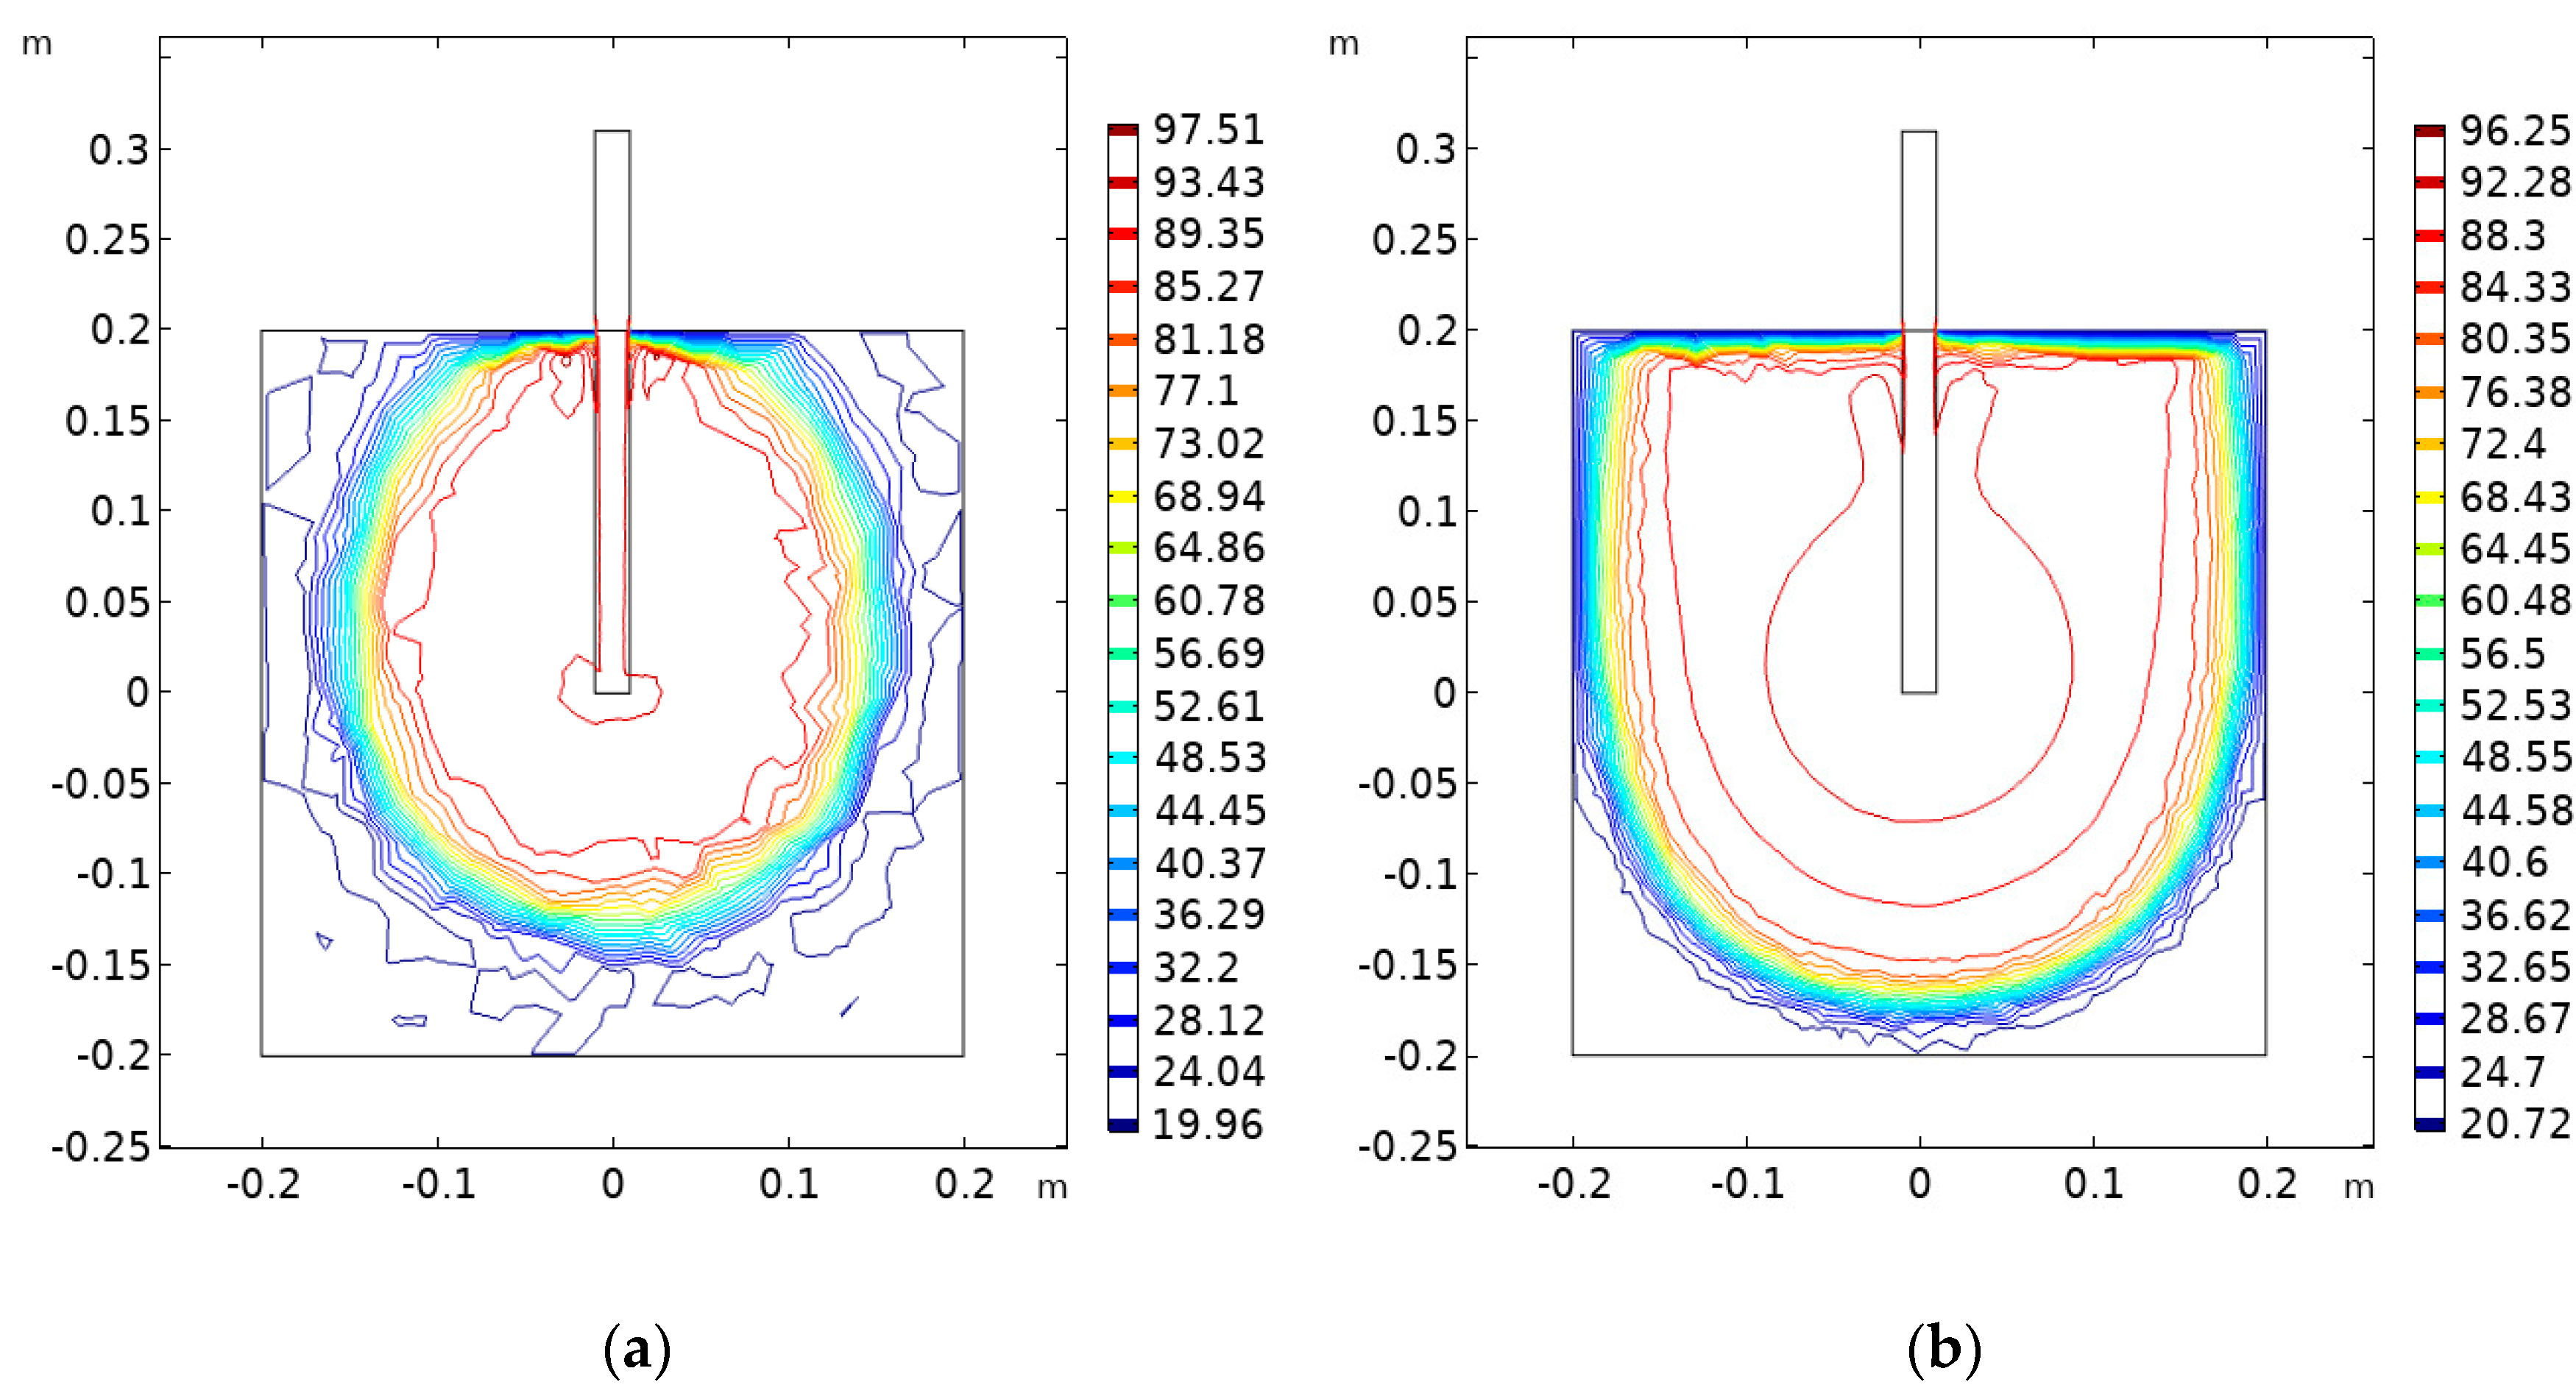
Figure 4.
SSD test bench: 1. flow valve; 2. flow meter; 3. boiler thermometer; 4. boiler burner; 5. boiler pressure controller; 6. boiler control box; 7. boiler; 8. control box screen; 9. ST and SWC control box; 10. data transmission line; 11. SWC sensor; 12. ST sensor; 13. soil bin; 14. steam pipe; 15. steam transport tube. (a) components of the SSD test bench; (b) SSD test.
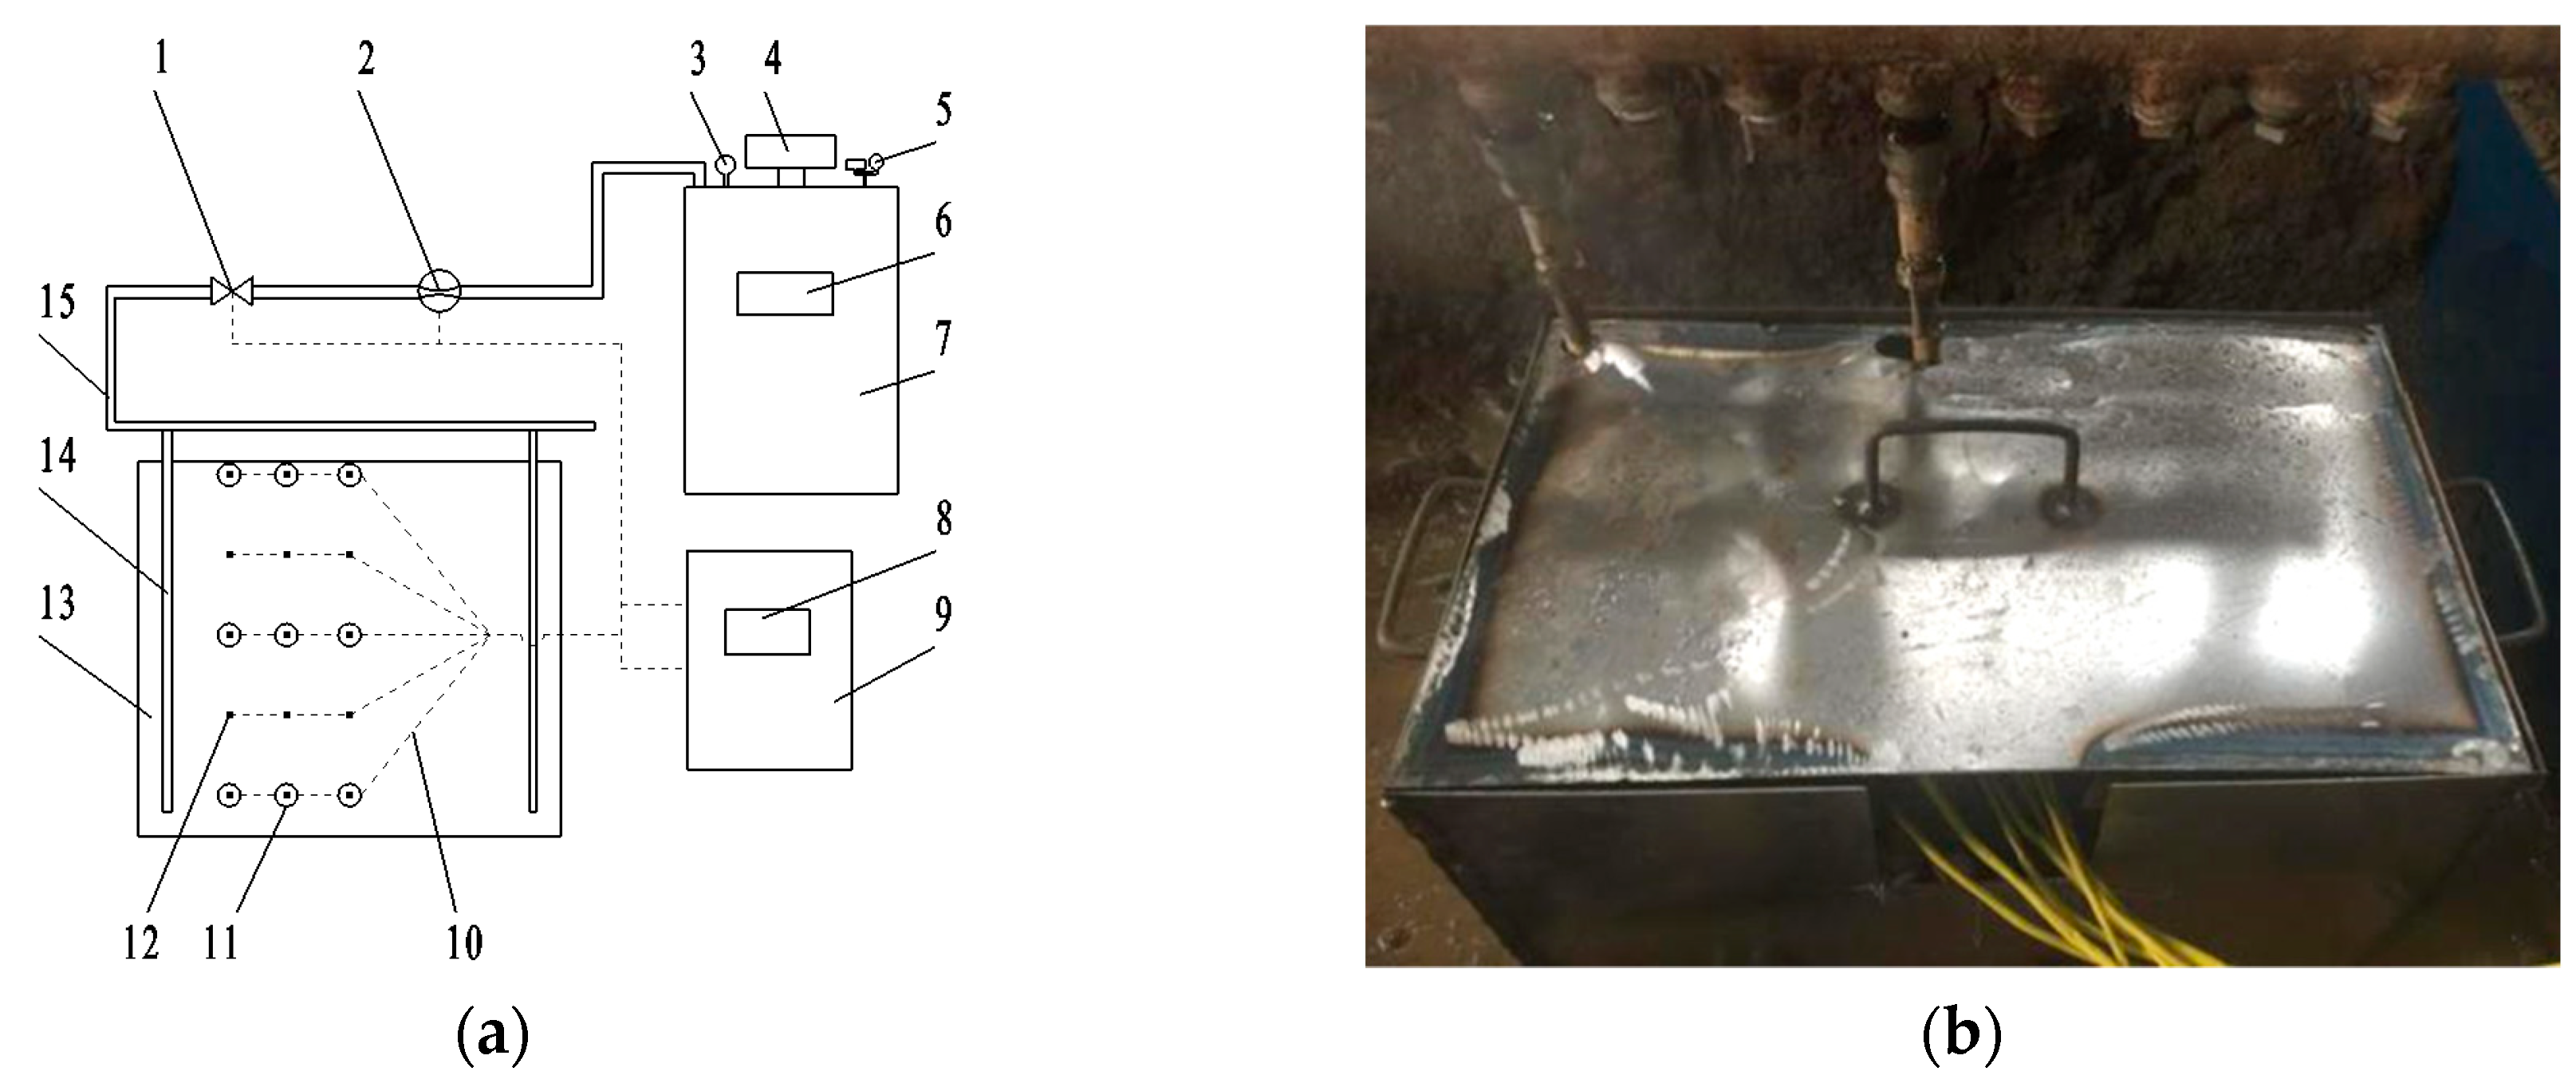
Figure 5.
Soil temperature-soil water content (ST-SWC) test system. (a) ST-SWC interface; (b) steam flow control interface.
Figure 5.
Soil temperature-soil water content (ST-SWC) test system. (a) ST-SWC interface; (b) steam flow control interface.
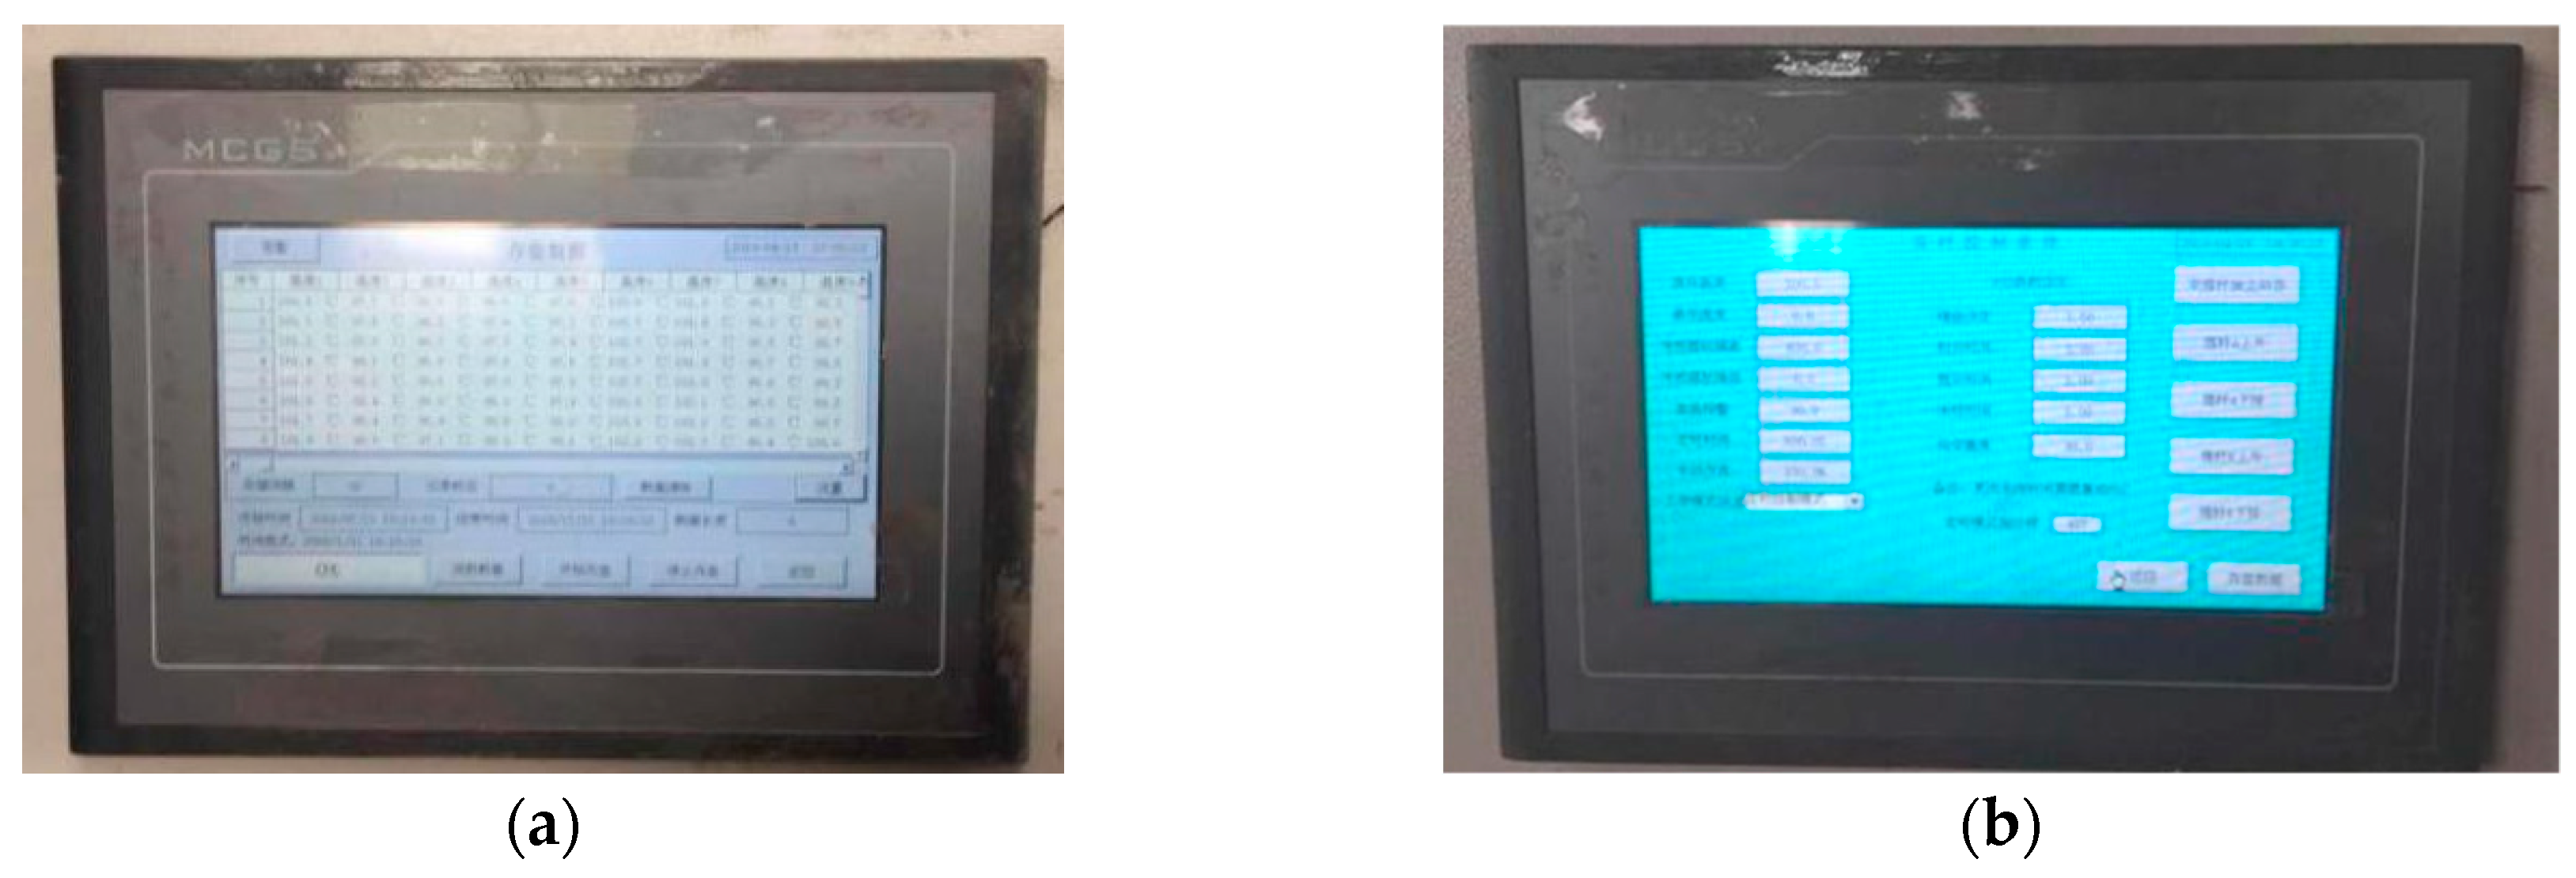
Figure 6.
ST-SWC test layout. Note: The large circle represents the steam pipe position, and the small circles represent the ST and SWC sensor positions.
Figure 6.
ST-SWC test layout. Note: The large circle represents the steam pipe position, and the small circles represent the ST and SWC sensor positions.

Figure 7.
Mean ST with time. Note: For example, 4–30 represents the treatment group with a steam flow of 4 kg/h and an SPS of 30 cm, 8–12 represents the treatment group with a steam flow of 8 kg/h and an SPS of 12 cm, etc.
Figure 7.
Mean ST with time. Note: For example, 4–30 represents the treatment group with a steam flow of 4 kg/h and an SPS of 30 cm, 8–12 represents the treatment group with a steam flow of 8 kg/h and an SPS of 12 cm, etc.

Figure 8.
Variation in mean ST rise rate and disinfection time. (a) 4kg/h; (b) 6kg/h; (c) 8kg/h

Figure 9.
Variation in the mean ST variation coefficient with disinfection time. (a) 4 kg/h; (b) 6 kg/h; (c) 8 kg/h.
Figure 9.
Variation in the mean ST variation coefficient with disinfection time. (a) 4 kg/h; (b) 6 kg/h; (c) 8 kg/h.


Figure 10.
Variation diagram of ST and disinfection time in each layer. (a) 12 cm; (b) 18 cm; (c) 24 cm; (d) 30 cm. Note: 12 cm, 18 cm, 24 cm, and 30 cm represent the SPS treatment; the position of each treatment point F is L = 3 cm; the positions of treatment point M are L = 6, 9, 12, and 15 cm, respectively; F − 20 cm represents that SLD = −20 cm at point F, and so on; M − 0 cm represents that SLD = 0 cm at point M, etc.


Figure 11.
ST distribution. (a) 30 cm; (b) 24 cm; (c) 18 cm; (d) 12 cm. Note: The legend indicates ST, °C; 30 °C, 80 s means that the average temperature of the soil is 30 °C and the corresponding disinfection time is 80 s, while 90 °C, 120 s means that the average ST is 90 °C and the corresponding disinfection time is 120 s, etc.


Figure 12.
SWC distribution. (a) 30 cm; (b) 24 cm; (c) 18 cm; (d) 12 cm. Note: The legend is in SWC, %; 80 s means disinfection time is 80 s, 120 s means the disinfection time is 120 s, etc.
Figure 12.
SWC distribution. (a) 30 cm; (b) 24 cm; (c) 18 cm; (d) 12 cm. Note: The legend is in SWC, %; 80 s means disinfection time is 80 s, 120 s means the disinfection time is 120 s, etc.


Table 1.
Soil steam disinfection time.
| Steam Temperature/°C | Steam Flow Rate/(kg/h) | Steam Enthalpy/(kJ/kg) | Heat of Evaporation/(kJ/kg) | Disinfection Time/min |
|---|---|---|---|---|
| 120 | 2 | 2708.9 | 2332.09 | 56.3 |
| 120 | 3 | 2708.9 | 2332.09 | 37.6 |
| 120 | 4 | 2708.9 | 2332.09 | 28.2 |
| 140 | 2 | 2737.8 | 2360.99 | 55.6 |
| 140 | 3 | 2737.8 | 2360.99 | 37.1 |
| 140 | 4 | 2737.8 | 2360.99 | 27.8 |
| 160 | 2 | 2762.9 | 2386.09 | 55.1 |
| 160 | 3 | 2762.9 | 2386.09 | 36.7 |
| 160 | 4 | 2762.9 | 2386.09 | 27.5 |
Table 2.
Physical properties of soil.
| Soil Types | Field Capacity/% | Bulk Density/ (g/cm3) | Soil Particle Compositions/% | ||
|---|---|---|---|---|---|
| Clay (<0.002 mm) | Silt (≥0.002–0.02 mm) | Sand (≥ 0.02–2 mm) | |||
| Clay-loam | 32.3 | 1.15 | 53.3% | 23.3% | 23.3% |
Table 3.
Test components and manufacturers.
| Test Components | Manufacturer |
|---|---|
| LSS0.1-0.7-Y boiler | Jiangsu Yueheng Special Equipment Manufacturing Co., Ltd. |
| LYK-10 boiler pressure controller | Changzhou Liping Electronic Equipment Co., Ltd. |
| Y60 pressure gauge | Hongsheng Instrument Factory Co., Ltd. |
| Q911F flow valve | Nanjing Meiyue Valve Co., Ltd. |
| LUGB-20 flow meter | Nanjing Lantewan Electronic Technology Co., Ltd. |
| ST-SWC control box | / |
| two steam disinfection pipes | / |
| soil bin (30 cm × 30 cm × 30 cm) | / |
| DE-WEINI steam conveying pipe | Shanghai Jiyou Pipe Co., Ltd. |
Table 4.
Disinfection time ratio and relative energy consumption.
| SPS (cm) | Flow Rate (kg/h) | Time Ratio | Relative Energy Consumption kJ/(kg·°C) |
|---|---|---|---|
| 12 | 4 | 0.637 ± 0.05d | 2.68 ± 0.20b |
| 6 | 0.565 ± 0.03e | 3.02 ± 0.18a | |
| 8 | 0.548 ± 0.05e | 3.13 ± 0.32a | |
| 18 | 4 | 0.857 ± 0.04ab | 1.99 ± 0.09cd |
| 6 | 0.798 ± 0.02bc | 2.13 ± 0.06cd | |
| 8 | 0.905 ± 0.06a | 1.89 ± 0.14d | |
| 24 | 4 | 0.781 ± 0.02bc | 2.18 ± 0.05cd |
| 6 | 0.774 ± 0.01c | 2.20 ± 0.03cd | |
| 8 | 0.794 ± 0.03bc | 2.15 ± 0.09cd | |
| 30 | 4 | 0.767 ± 0.01c | 2.22 ± 0.03c |
| 6 | 0.769 ± 0.02c | 2.21 ± 0.04c | |
| 8 | 0.772 ± 0.01c | 2.20 ± 0.03cd |
Note: The data are given as the mean ± standard deviation (n = 3); different lowercase letters indicate significant differences in the same flow rate (P < 0.05).
© 2019 by the authors. Licensee MDPI, Basel, Switzerland. This article is an open access article distributed under the terms and conditions of the Creative Commons Attribution (CC BY) license (http://creativecommons.org/licenses/by/4.0/).
Share and Cite
MDPI and ACS Style
Yang, Z.; Wang, X.; Ameen, M. Influence of the Spacing of Steam-Injecting Pipes on the Energy Consumption and Soil Temperature Field for Clay-Loam Disinfection. Energies 2019, 12, 3209. https://doi.org/10.3390/en12173209
AMA Style
Yang Z, Wang X, Ameen M. Influence of the Spacing of Steam-Injecting Pipes on the Energy Consumption and Soil Temperature Field for Clay-Loam Disinfection. Energies. 2019; 12(17):3209. https://doi.org/10.3390/en12173209
Chicago/Turabian StyleYang, Zhenjie, Xiaochan Wang, and Muhammad Ameen. 2019. "Influence of the Spacing of Steam-Injecting Pipes on the Energy Consumption and Soil Temperature Field for Clay-Loam Disinfection" Energies 12, no. 17: 3209. https://doi.org/10.3390/en12173209
Note that from the first issue of 2016, this journal uses article numbers instead of page numbers. See further details here.