Fast Modelling of nZEB Metrics of Office Buildings Built with Advanced Glass and BIPV Facade Structures

1
Laboratory for Sustainable Technologies in Buildings, Faculty of Mechanical Engineering, University of Ljubljana, Aškerčeva 6, 1000 Ljubljana, Slovenia
2
Trimo d.o.o., Prijateljeva cesta 12, 8210 Trebnje, Slovenia
*
Author to whom correspondence should be addressed.
Energies 2019, 12(16), 3194; https://doi.org/10.3390/en12163194
Submission received: 18 July 2019
/
Revised: 2 August 2019
/
Accepted: 17 August 2019
/
Published: 20 August 2019
(This article belongs to the Section G: Energy and Buildings)
Abstract
:The planning process of nearly Zero Energy Buildings (nZEB), as defined in Energy Performance of Buildings Directive (EPBD), requires that designers check their solutions at all stages of planning. In the initial design phase, methods and tools for which only basic design knowledge of the modelling of energy efficiency indicators is required are often sufficient. With the introduction of fast modelling techniques, designers’ work can be simplified. A method and software for the fast modelling of nZEB energy efficiency indicators of buildings constructed with advanced multi-layer glass and building integrated photovoltaics facade (BIPV) structures are presented. The computer tool for fast modelling combines (i) upgraded national certificated software for energy performance of buildings (EPB) evaluation, which is used for performing auto-repeating numerical calculations based on the design of experiments (DOE) and (ii) software for the determination of multiple linear regression models and the presentation of results. The case studies made for different buildings and climate conditions show the variety of options offered by the developed fast modelling approach. It can be seen that buildings with a large proportion of advanced glassed facade and even all-glass buildings can fulfil nZEB requirements via the on-site production of electricity with BIPV facade structures.
1. Introduction
Nearly Zero Energy Buildings were introduced by the Energy Performance of Buildings Directive (EPBD) recast [1] as energy efficient buildings with high shares of the utilization of on-site or near-by renewable energy sources [2]. EU member states have introduced nearly Zero Energy Buildings (nZEB) metrics. By introducing nZEB requirements, the design of the building becomes more complex because energy efficiency evaluation must be part of the design in each planning phase. The earlier the design phase is, fewer details about the building are known, and only general knowledge of building modelling is typical for building designers. Nevertheless, inadequate solutions in the early design phases most often cannot be compensated by dynamic modelling by experts in the following phases, and any fixes are often very expensive. That is why the evolution of simplified buildings’ energy efficiency in early design phases remain useful and commonly used despite the various software for dynamic building thermal response modelling available on the market. Quasi-steady state modelling of yearly or monthly energy balances is characteristic for such calculation methods [3,4].
Fast modelling is based on regression models. Regardless of whether the regression models are designed to optimize the architectural and technical properties of a building or to predict the future response of the building, fast modelling consists of several phases. In the first step, the procedure consists of the determination of independent variables, which could be architectural parameters, such as building shape factor [5,6,7], indoor climate, comfort parameters [8,9], occupancy schedules [9], thermal properties of building envelope [10,11,12,13], or building service parameters [12]. In the second step, the type of the regression model must be defined. The most common models are single or multiple linear regression models, auto-regression models and auto-regression with exogenous models [10]. Single linear regression models predict dependent variable using a linear model with one independent parameter; multiple linear regression models include several, predefined independent parameters. Auto-regression models include historical values (time-dependent) of one or more independent variables. If transient processes are modelled, such models are more accurate. In autoregression with an exogenous model, a multiple linear model is combined with an auto-regression model to improve the accuracy of the prediction. In the case of monthly or yearly energy demand modelling, multiple linear or polynomial regression models are commonly used [5,14,15,16]. In the next step, the coefficients in a regression model are determined with statistical methods using sets of values of dependent parameters (e.g., monthly energy needs for heating), which are determined using detailed (hourly data) or simplified (monthly or yearly data) numerical energy balance modelling using software [16,17,18,19,20] or historical measured data. The procedure for developing regression models ends with validation, comparing predicted values with numerically determined ones.
Several statistical indicators can be used to determine how well a regression model fits the numerical data. Ruiz and Bandera [21] published an overview of statistical indices used in energy modelling in 58 studies. One commonly used statistical index is the Coefficient of Determination R2, which indicates how close the values predicted by the regression model are to the numerically determined values of energy efficiency indicators. Two other frequently used statistical indices are Normalized Mean Bias Error (NMBE) and the Coefficient of Variation of the Root Mean Square Error (CV(RMSE)) [9,22]. ASHRAE Guideline 14 [23] states the threshold for monthly regression models as NMBE ± 5% and CV(RMSE) 15%.
Fast modelling is a useful approach in the case of parametric studies of the energy efficiency of prefabricated buildings [24] or in the case of energy renovation planning [25]. In the latter case, parameters such as the thermal transmittance (U) of building envelope structures or total solar energy transmittance (gg) of glazing can be optimized instantaneously, according to the architectural design of the building, taking into account thermal comfort requirements and climate conditions. Domjan et al. [24] use fast modelling for the evaluation of the energy demand of new and renovated buildings, implementing a design of experiments (DOE) approach and a Taguchi matrix for life cycle impact and life cost assessment of new and renovated buildings.
Commercial buildings are responsible for 32% of all electricity consumption worldwide and more than 30% in EU countries [26]. Due to specific architectural and usage patterns, the evaluation of energy demand and on-site energy production of such buildings in the early design stages will be crucial for the fulfilment of nZEB requirements. Among the on-site production solutions, photovoltaic systems are the most promising electricity generators. Photovoltaic systems can be integrated in buildings as BAPV (Building Applied Photovoltaics), or BIPV (Building Integrated Photovoltaics). In the case of BAPV, PV modules are installed on the building envelope by supporting structures. Meanwhile in the case of BIPV, PV cells are integrated in facade or roof structures themselves, which means that such technologies gain advantages in multi-functionality, and maintenance costs [27]. In most cases, BIPV are in the form of double-skin facades or BIPV in the form of insulating glazing [28]. BIPV facade structures can be transparent or opaque [29,30,31], built with a-Si, p-Si, or m-Si silicon PV cells with or without a ventilation cavity [32,33] or even as colored dye-sensitized solar cells (DSC), to ensure architectural diversity [34]. In the case of integration in glazed facade, BIPV significantly influences heating, cooling, and lighting energy demand [35]. Besides that, pre-defined tilt and orientation of facade integrated BIPV, as well as shading by surrounding objects and enlarged reflective solar irradiation, have a significant influence on electricity production [36].
In this paper, the developed fast modelling tool for the evaluation of nZEB metrics of office buildings built with advanced glass and advanced building integrated photovoltaic facade structures [35,37,38] is shown. The paper shows (i) how the energy performance of buildings (EPB) labelling tool, following the EPBD requirements, was upgraded to generate a set of simulation results of monthly values of building energy efficiency indicators using a Taguchi matrix, (ii) how the evaluation tool for the determination of nZEB criteria based on multi-parametric regression models was developed and combined with the EPB tool, and (iii) case studies of fast modelling of energy efficiency performance of office buildings.
Through the paper it will be seen that the most pronounced advantage of the fast modelling of energy efficiency of the building is not decrease of computational time, rather the limited number of input data needed and that can be used by designers with no deep expert knowledge on numerical simulations.
2. Subject of Research
The subject of the research is the energy efficiency indicators of office buildings with an extended area of advanced glass [39] or advanced BIPV facade structures. Such facade structures can be classified as the best available technology (BAT), because they have extremely low thermal transmittance and total solar energy transmittance, which significantly decrease the energy use for cooling and also have sufficient high visual light transmittance to enable quality daylighting. Facade structures are constructed as multi-layer glass structures with up to seven panes of glass. Table 1 shows the thermal and radiative properties of the product range. Other thermal and radiative properties are presented in [35,37,38,39]. By replacing the outer glass pane with glass BIPV modules, a BIPV facade structure can be made. To maintain a good quality of the natural lighting, PV cells are installed in the BIPV glass facade structure in a chessboard layout so that the area of PV does not exceed 60% of the total area of the facade structure. The thermal transmittances shown in Table 1 are average U-values, taking into account spacers as well as thermal bridges and joints. It is assumed that there is no difference in thermal transmittance of a glazed facade structure if PV cells are installed in the outer glass panes.
3. Design of the Software for Fast Modelling of Energy Efficiency and nZEB Indicators
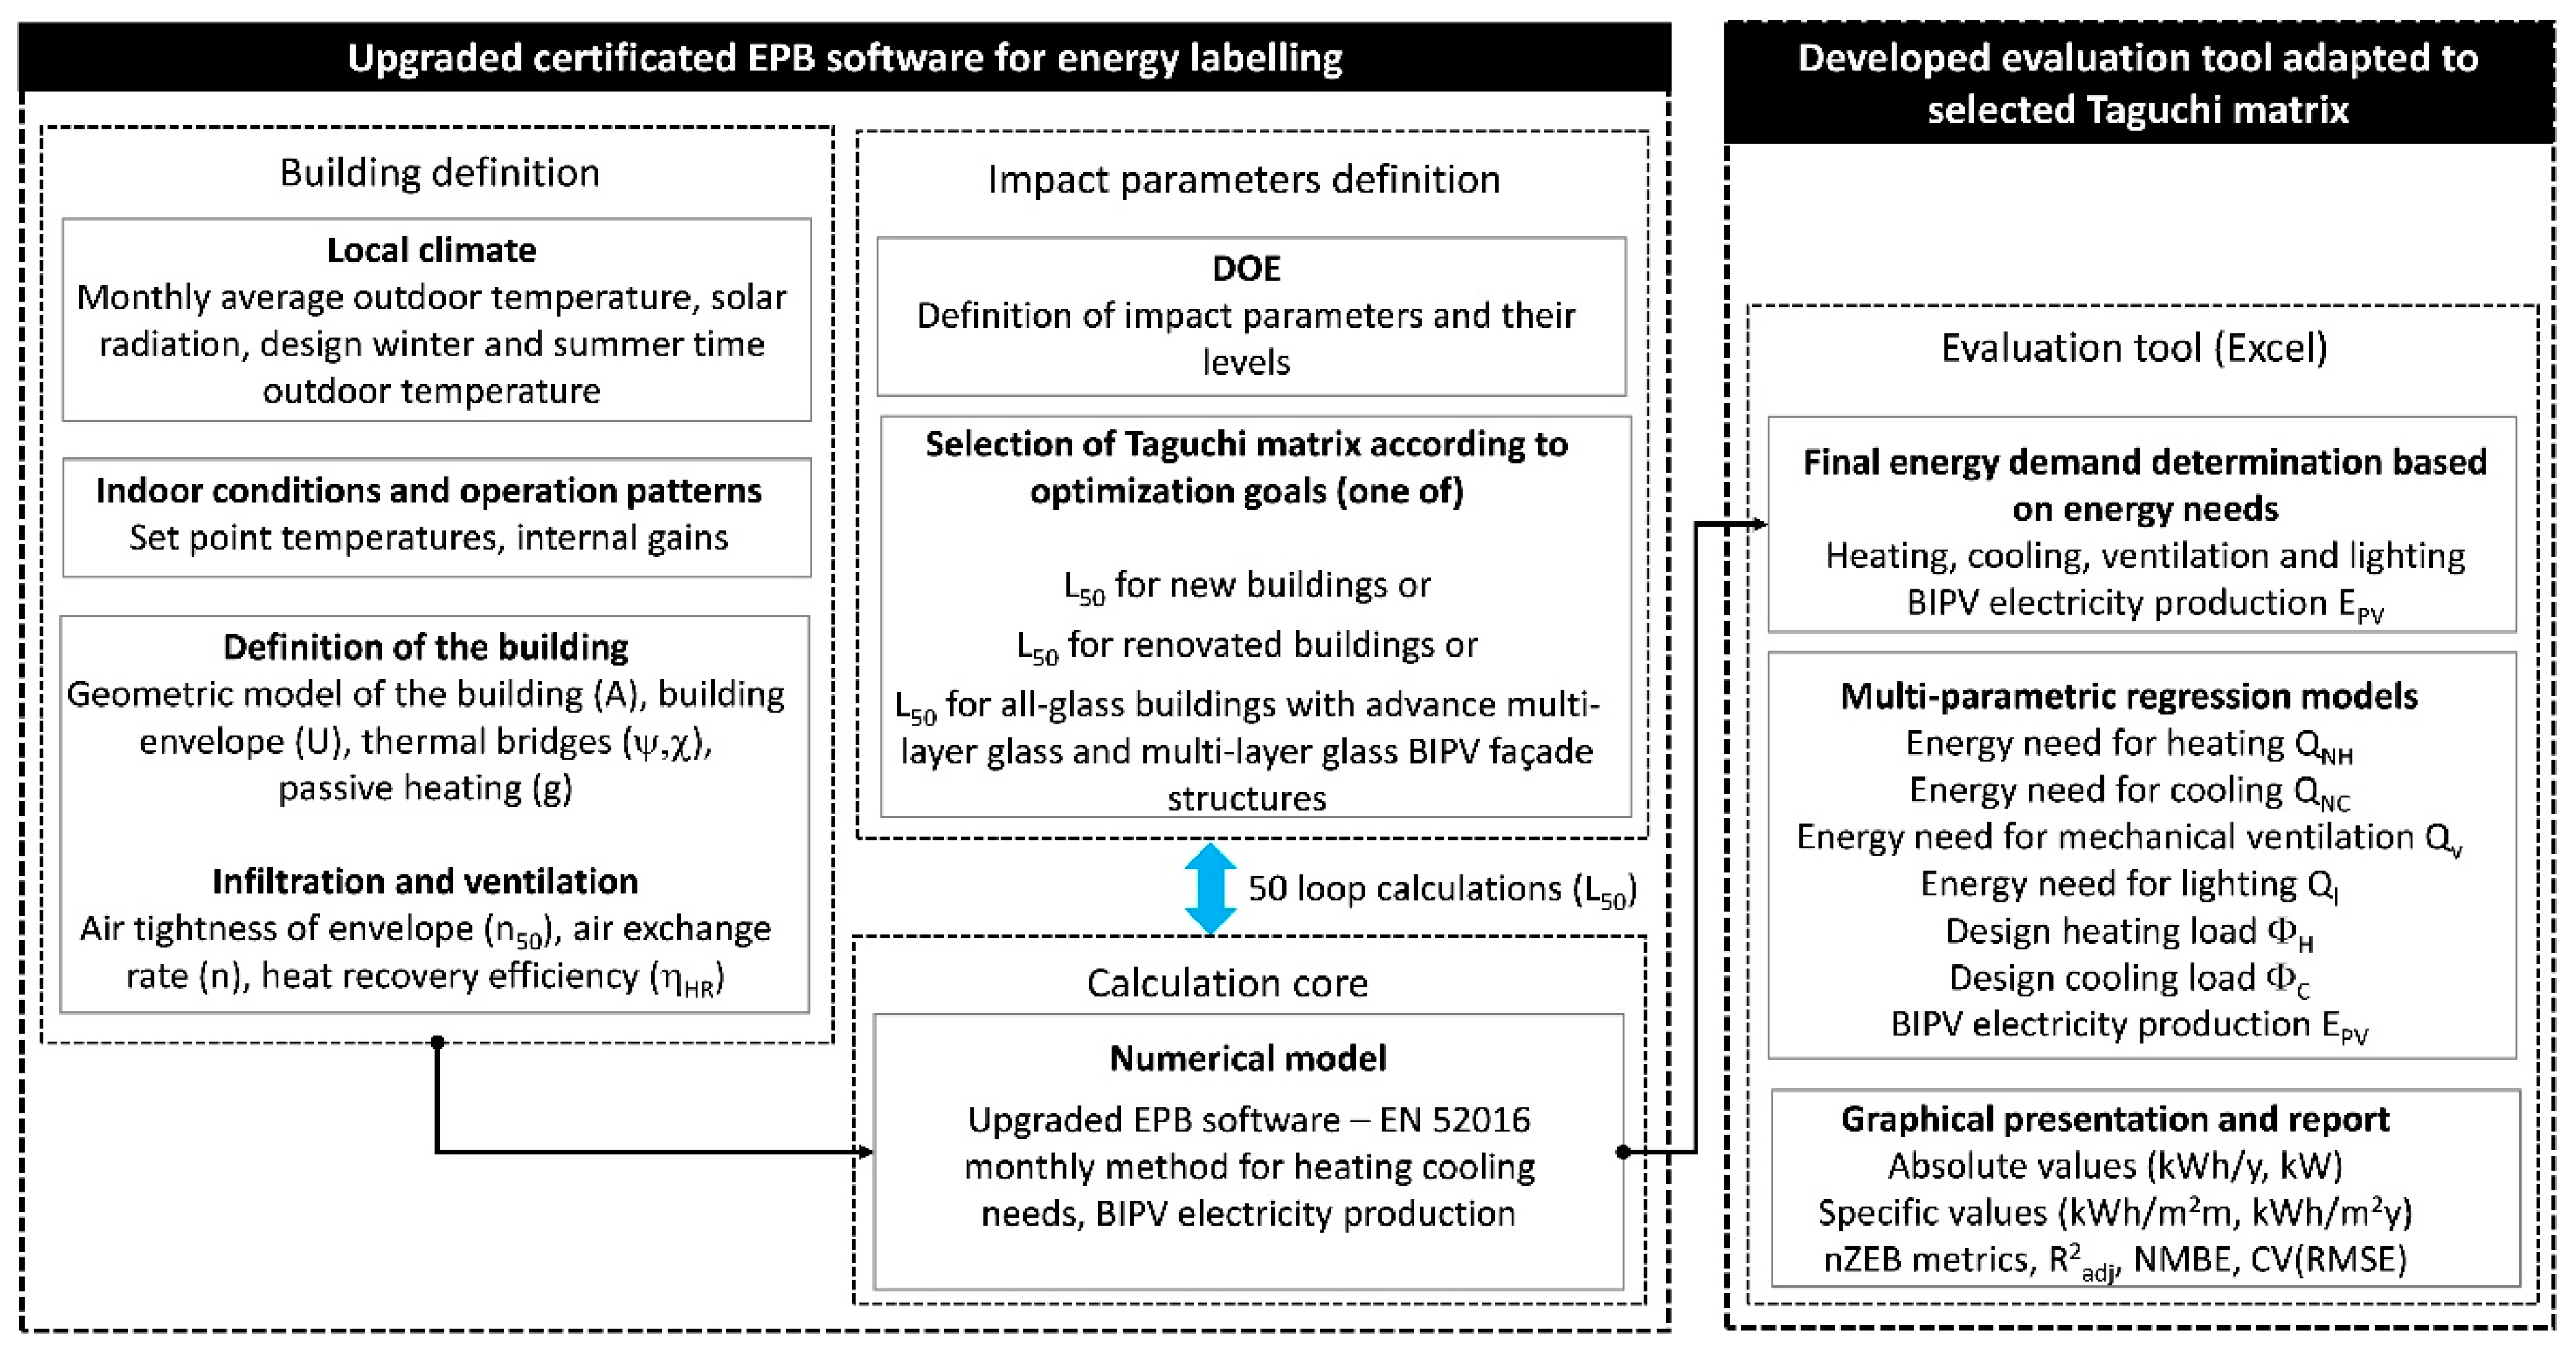
The developed software combines the upgraded certificated EPB software [19] which is widely used in engineering practice for the energy labelling of buildings and the newly developed evaluation tool for the determination of a building’s energy efficiency indicators and the evaluation of compliance with nZEB requirements. The monthly method for the determination of energy needs and final energy demand for heating, cooling, and mechanical ventilation is used; yearly final energy demand is determined for lighting. The structure of the software is shown in Figure 1.
3.1. Upgraded EPB Software
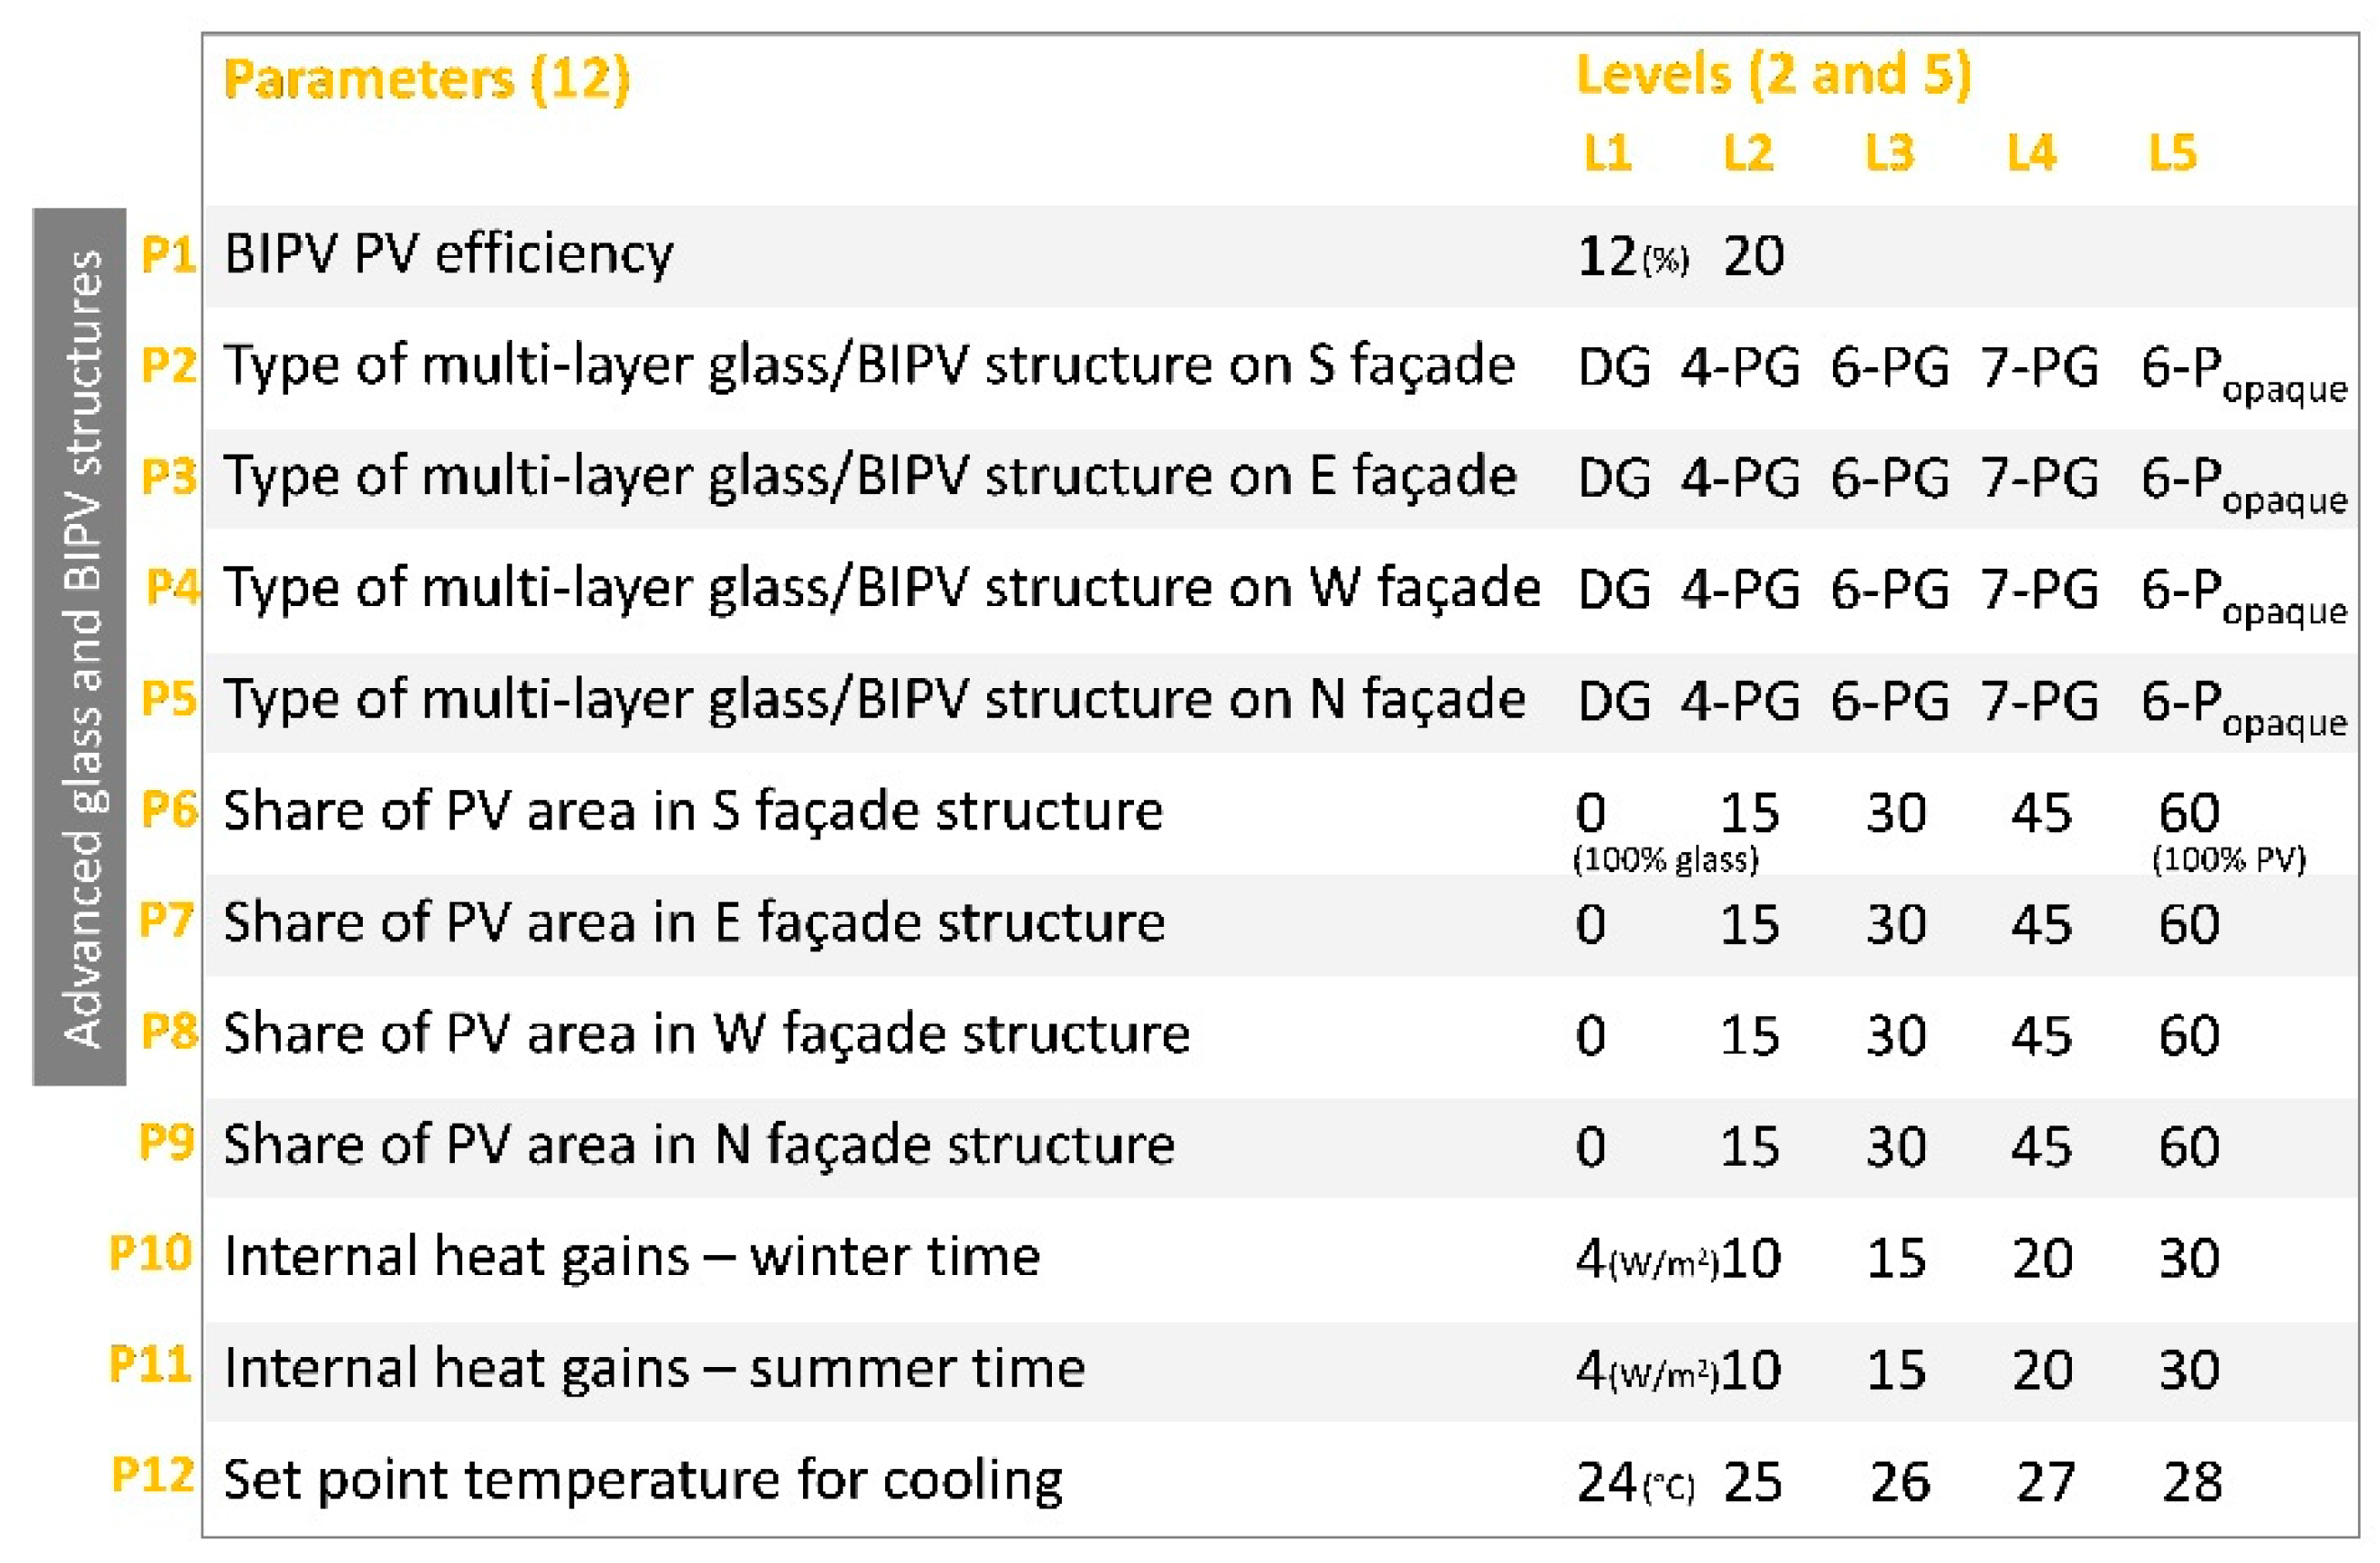
For the evaluation of nZEB requirements and the optimization of the design of buildings constructed with advanced glass and BIPV facade structures, the EPB software was upgraded. In addition to the definition of climate conditions, indoor comfort condition, the definition of building structures including heat bridges, infiltration and ventilation data, including heat recovery, which is done with common EPB tools, users can define any number and size of advanced glass and BIPV facade structures as generic elements in the upgraded EPB tool. For those elements, only a description of the area, the orientation, and outdoor shading are needed. Another upgrade of the EPB software was done to enable loop calculations of energy needs of the building by implementing the Design of Experiments (DOE) approach using a Taguchi matrix, which contains optimum combinations of pre-defined influence-independent variables (parameters) and their values (levels). The method was developed in the 1960s by Genichi Taguchi as an engineering tool for planning robust processes with a large number of influential parameters. Based on our previous research [25,31], it can be concluded that a set of 11 influential parameters with five levels and one with two levels each is adequate for the quick modelling of contemporary buildings’ energy needs, based on the thermal and radiative properties of opaque and transparent facade structures, infiltration and ventilation data, as well as heating and cooling indoor climate requirements and internal gains. In such a case, the L50 Taguchi matrix is used for defining optimum combinations of parameters’ levels that lead to the minimum number of numerical calculations and the most statistical relevant results. This means that only 50 numerical experiments must be performed for each study case to obtain a sufficient number of values of each building energy efficiency indicator for fast modelling in the step that follows. The same form of the Taguchi matrix was used for the evaluation of nZEB metrics of buildings constructed with advance glazed and BIPV facade structures, but with different influential parameters and their values. Pre-selected parameters and values are shown in Figure 2. The first parameter, P1, with two levels, defines the efficiency of BIPV modules for on-site electricity production. Parameters P2 to P5 are used for the description of the type of the advanced glazing structure with the features that are shown in Table 1. Different types of glazed facade structures can be assumed on various orientated facades. Nevertheless, SW- and S-oriented facade structures are combined as S-oriented structures; solar gains are calculated, taking into account the real orientation of the facade structure. In the same way, SE and E as E, NW and W as W, and NE and N as N facade structures are combined. The level of each of the P2 to P5 parameters includes data about thermal transmittance (U), total solar radiation transmittance (gg), and light transmittance (τvis) as background data.
As each of advanced glazed facade structures can be upgraded to BIPV, the shares of PV cell area in the total area of a BIPV facade structure are defined by parameters P6 to P9. The levels of these parameters are in the range between 0% (glass-only structure) and 60% for BIPV with a maximum proportional area of PV cell in the facade structure to enable natural lighting. In the EPB software, the simplified method [3] is used for prediction of shading objects’ impact on each glazed facade structure to determine the decrease of electricity production of BIPV. Internal gains in general, but even more significantly in the case of the buildings constructed with advanced glass facade structures, have an important influence on energy efficiency indicators; therefore, they are represented with parameters P10 and P11. The values of parameters were selected so that residential, as well as office and other public buildings, can be analyzed. As we focused on the fast modelling of the buildings with extended areas of glass facade structures, the energy demand for cooling has a significant influence on nZEB metrics and, therefore, the set point temperature for cooling was selected as a P12 parameter. In this way, an adaptive indoor thermal comfort model can also be analyzed. Fifty loop calculations of energy balance are performed, and the data of each loop step are stored and transferred on demand into the evaluation tool developed in MS Excel environment. The export file consists of two sets of data:
- A matrix that includes yearly energy needs for heating QNH,y and cooling QNC,y, monthly energy needs for heating QNH,m and cooling QNC,m, design heating ΦH and cooling load ΦC and yearly production of electricity EPV determined for each of the 50 numerical experiments; heating design load, energy needs for heating and cooling are determined by the method presented in Reference [3]; the production of electricity is determined with the empirical model presented in Reference [38] based on the reference efficiency of the PV cells;
- Structural properties of the building, including useful area, area of advance glass structures, area of all other envelope building structures, ventilation air flow rate of natural or mechanical ventilation; data needed for calculation of electricity demand for lighting: light reflectance of all building structures, light transmitivity of conventional windows glazing, specific power of electrical lighting, and latitude of the site of the building.
3.2. Evaluation Software
The upgraded EPB software is coupled with the evolution tool through an export data file, as shown in Figure 1. The evaluation tool was developed in the MS Excel environment because of built-in statistical functions needed for the design of multi-parametric regression models and the simple selection of parameters’ values in the process of building design evaluation.
3.2.1. Regression Models for Fast Modelling
For the fast modelling of energy efficiency indicators and nZEB metrics, multiple linear regression parametric models were developed for each indicator determined with auto-repeating numerical calculations in the upgraded EPB software (QNH, QNC, ΦH, ΦC, and EPV). In the first step, a general model that includes all influence parameters (from Taguchi matrix) as regressors was set up in the following form:
Regression coefficients bi,j were obtained using an MS Excel built-in LINEST function, which fits the data using the least squares method. The selection of predictors was tested using the T.DIST.2T function to determine the p-values of regression coefficients bi,j [40]. The p-values lower than 0.05 indicate the significance of selected predictor variables. Based on the statistical evaluation of the obtained multiple linear regression model, some of the anticipated predictors (independent variables set in Taguchi matrix as parameters and their higher powers) were rejected and/or replaced with other logarithms or predictor interactions. After adjustment of the general regression model, the following regression models were developed:
Note: in monthly regression models, regression coefficients bi,j are determined for each month in the year.
The adequacy of the prediction of each regression model was tested with the adjusted Coefficient of Determination R2adj, the Normalized Mean Bias Error (NMBE) that indicates the total sum of the difference between the numerically determined and predicted energy efficiency indicator, and the Coefficient of Variation of the Root Mean Square Error CV(RMSE) that represents a normalized measure of variability among numerically determined and predicted energy efficiency indicator [9,21]:
3.2.2. Validation of Regression Models
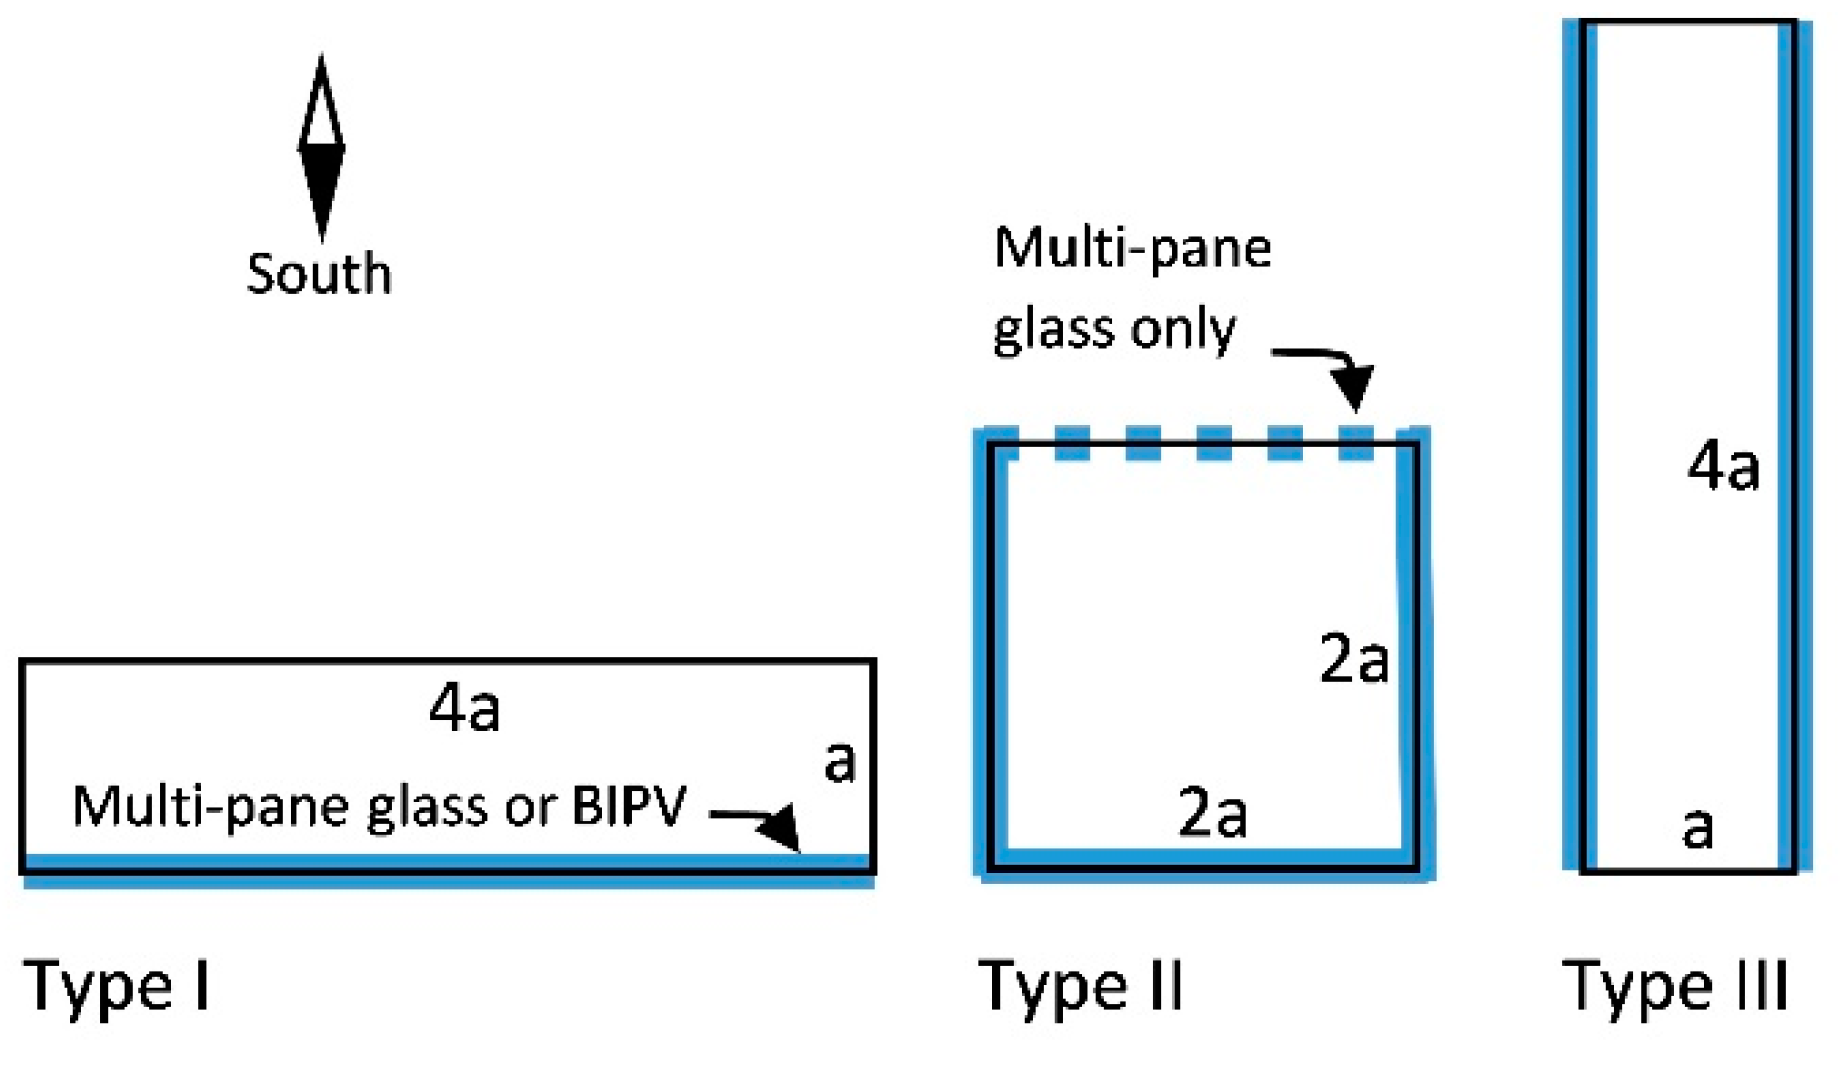
Regression models were validated on the case of office buildings built with advanced glass and BIPV facade structures and Helsinki site climate conditions (Φ 60°10’10’’, λ 24°56’07’’, Dfb Koppen–Geiger classification). This site was chosen to increase the energy demand for heating. Buildings with different architectural layouts (Figure 3) have the same total useful area of 4800 m2 (equal to 20 m) in three floors. All unglazed walls have thermal transmittance of 0.25 W/m2K, roofs with thermal transmittance of 0.2 W/m2K and thermal transmittance of slab on ground of 0.3 W/m2K. The buildings are mechanically ventilated (n = 0.7 h−1) with heat recovery efficiency 65% and constant internal gains (as average daily value during the heating and cooling period) of 8 W/m2 as a default value.
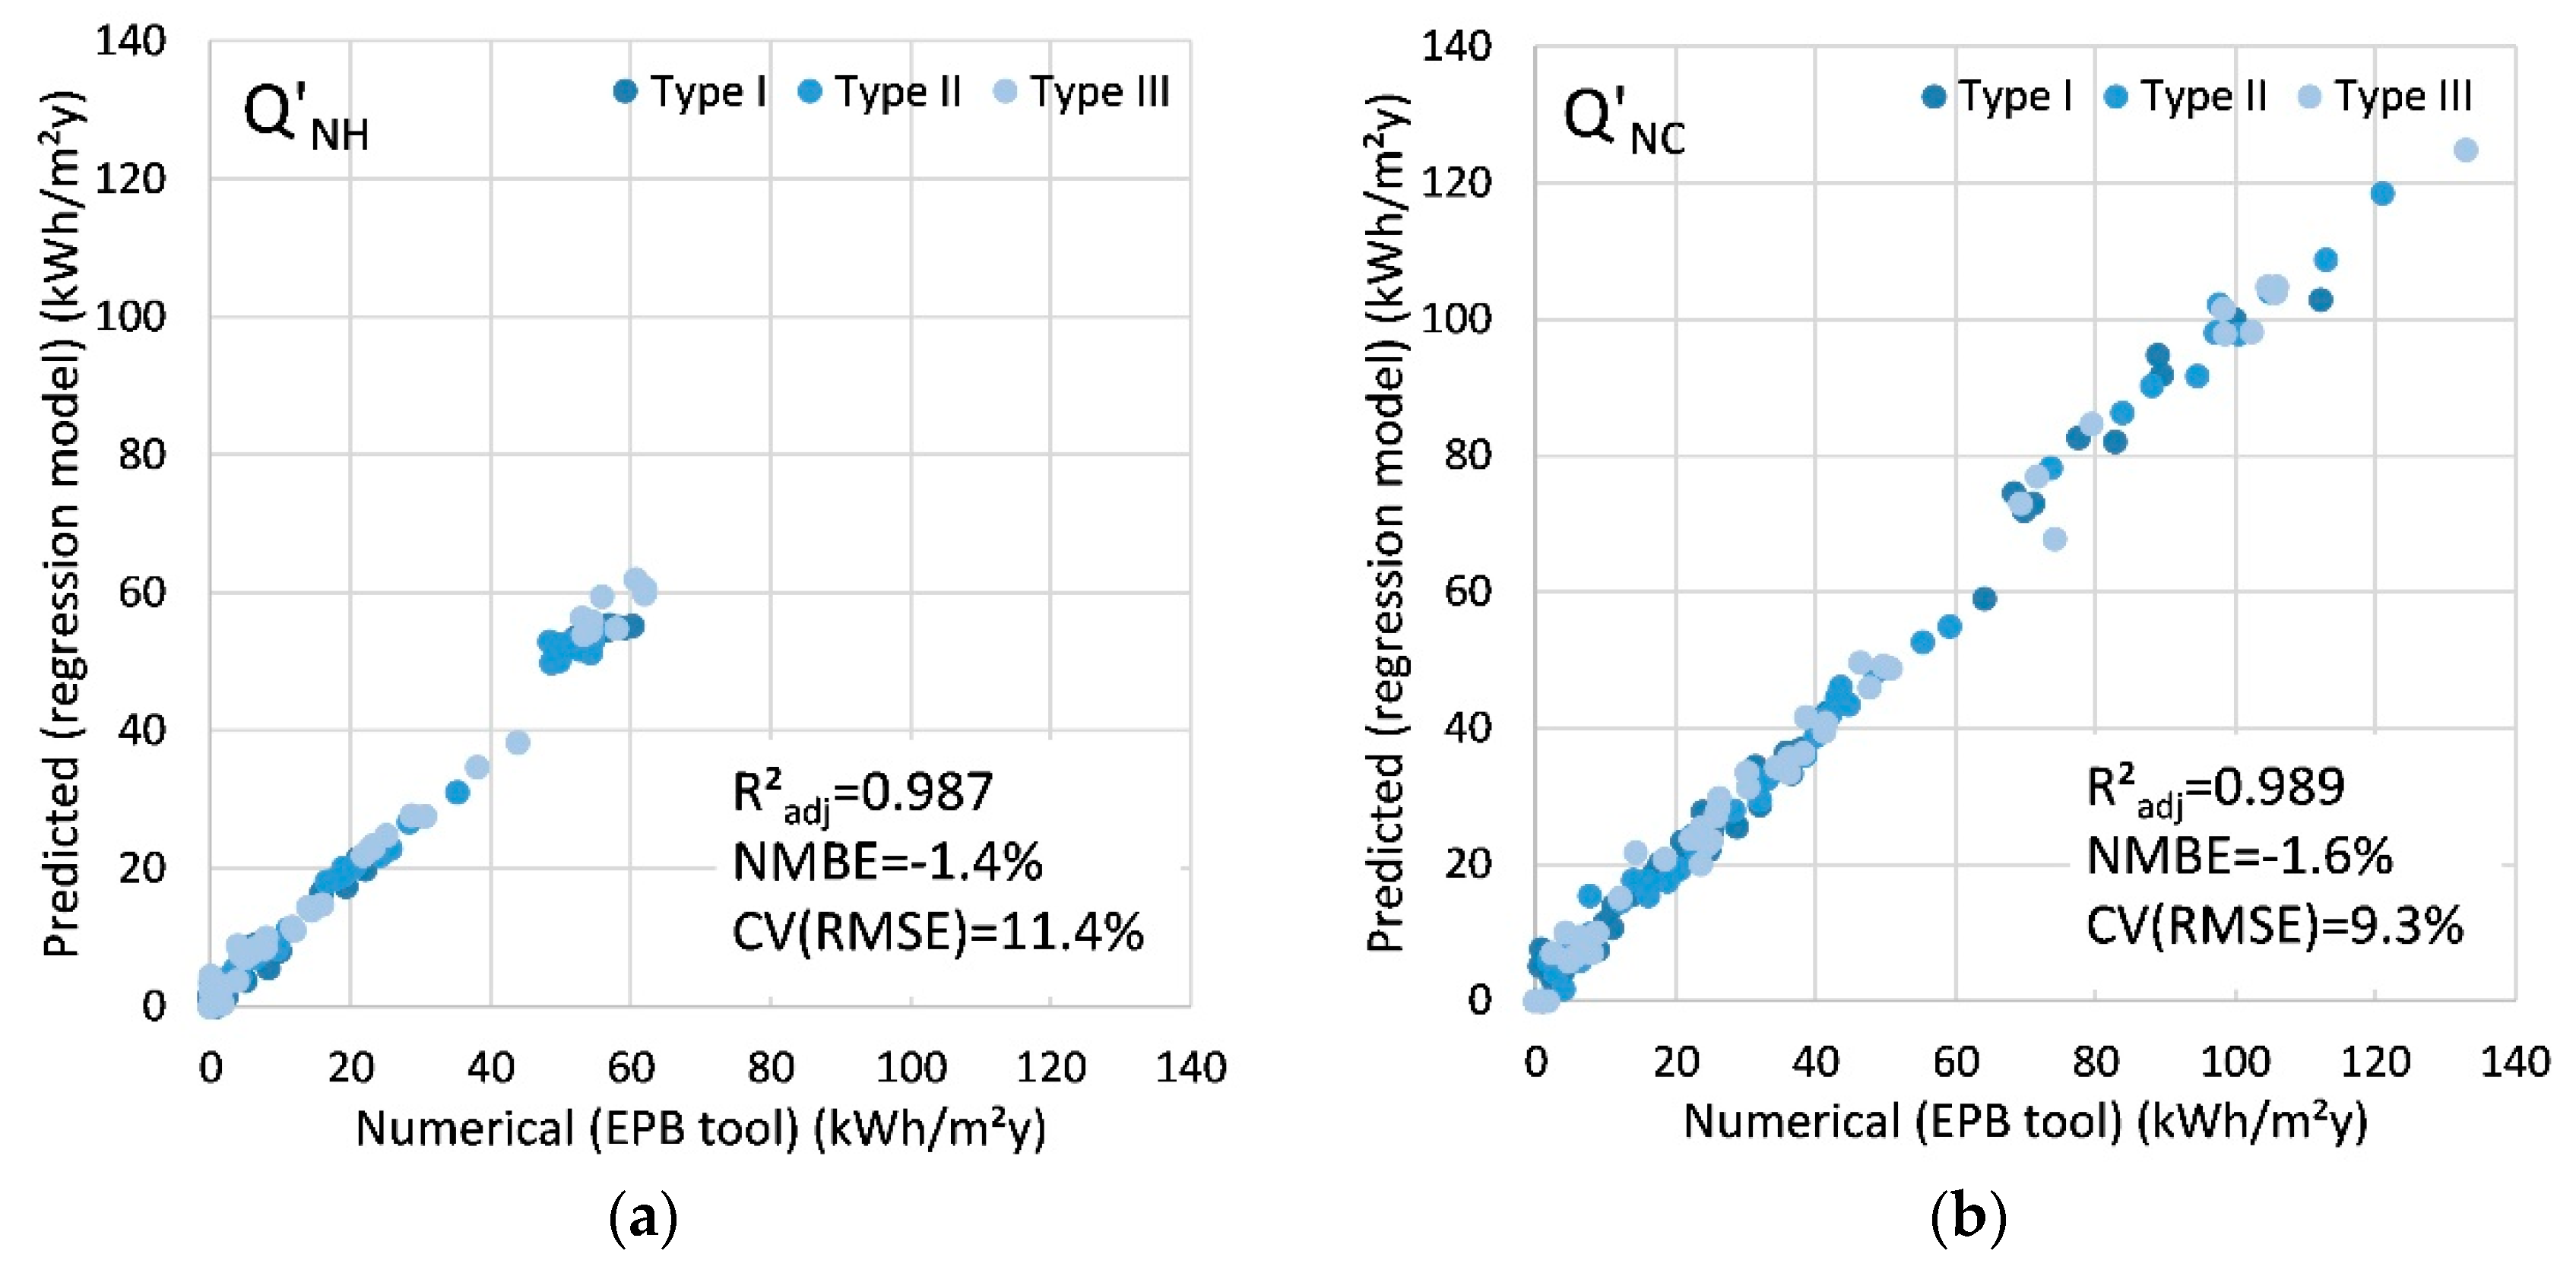
Figure 4 shows numerical modelled and predicted yearly specific energy needs for heating Q’NH and cooling Q’NC as well as statistical indicators of regression models. Data for all three reference buildings (meaning 150 cases) are shown. It can be concluded that the regression models are adequate because all statistical indicators are in compliance with the requirements according to [23].
3.2.3. Final Energy Demand and nZEB Metrics
Final energy for the operation of the building is determined for space heating and cooling, as well as the operation of mechanical ventilation and lighting. The final energy for space heating and cooling is modelled with regression models of energy needs (QNH,y, QNC,y) and by user-defined inputs: (i) average yearly efficiency of heat or cold generator, (ii) efficiency of heat and cold distribution system indicating non-recovered energy losses, (iii) efficiency of end heat exchangers and controlling and (iv) auxiliary energy demand (electricity by default) defined as the percentage of energy needs. In this way, the optimization of building design in the early design phase is easier for designers and more flexible, yet with an acceptable error level taking into account the high requirements regarding systems’ compound efficiency typical for contemporary buildings. Despite the consideration of default values, the optimization results will provide a very solid basis for more complex design through the design stages.
Final energy demand for mechanical ventilation is determined by the specific fan power (PSFP) value [39], which defines the supply and extract fan specific power per unit of ventilation air flow rate in W/(m3/s). It is quite common that national EPB regulations define the maximum allowed PSFP class. Additional elements, such as filters and heat exchangers, can be evaluated through extended PSFP [41]. Yearly energy electricity demand is determined using the ventilation air exchange rate, which is defined in the adapted EPB software as a design property of the building.
The final energy for lighting is determined using the standardized method presented in Reference [4]. As electricity demand for lighting depends on the quality of the natural lighting evaluated with average daylighting factor DFav, it must be recalculated at each change of advanced glass and BIPV facade structure types or a share of PV in BIPV facade structures, made by the designer in evaluation tool. DFav is determined with the CIBSE model [42] taking into account areas (Ag,j, Aadv,i) of any glazed facade structure that were defined in upgraded EPB software:
The evaluation of final energy demand for lighting includes adjustment of the day-time and night-time duration intervals (yearly number of hours) according to the type of the building and the latitude of the site of the buildings; the data are automatically transferred from the EPB evaluation tool. Duration intervals are taken as default values from table F1 in Reference [4] according to site latitude. For evaluation of electricity demand for lighting, the designer defines specific installed electrical power of luminaires.
Electricity production by BIPV is determined on the basis of designer selected reference PV cell efficiency (P1), temperature correction factors, as presented in [38], developed based on average monthly outdoor air temperature and local solar radiation on BIPV. While shading objects are selected in EPB software and analyzed in auto-repeating numerical calculations, the regression coefficients developed in the evaluation tool already contain information about decreased electricity production.
As nZEB metrics, the following indicators were analyzed: yearly specific energy needs for heating (Q’NH), or alternatively annual delivered energy for operation of heating, cooling, ventilation, and lighting (Q’f), yearly specific non-renewable primary energy needed for the operation of the building (Q’p,nren), and the ratio of renewable energy sources (RER) of energy carriers needed for the operation of the building. Q’p,nren is determined with the final energy demand Q’f and non-renewable primary energy factors of all energy carriers while RER is the ratio between primary renewable energy and total primary energy needed. Values are determined with equations:
3.2.4. Graphical User Interfaces
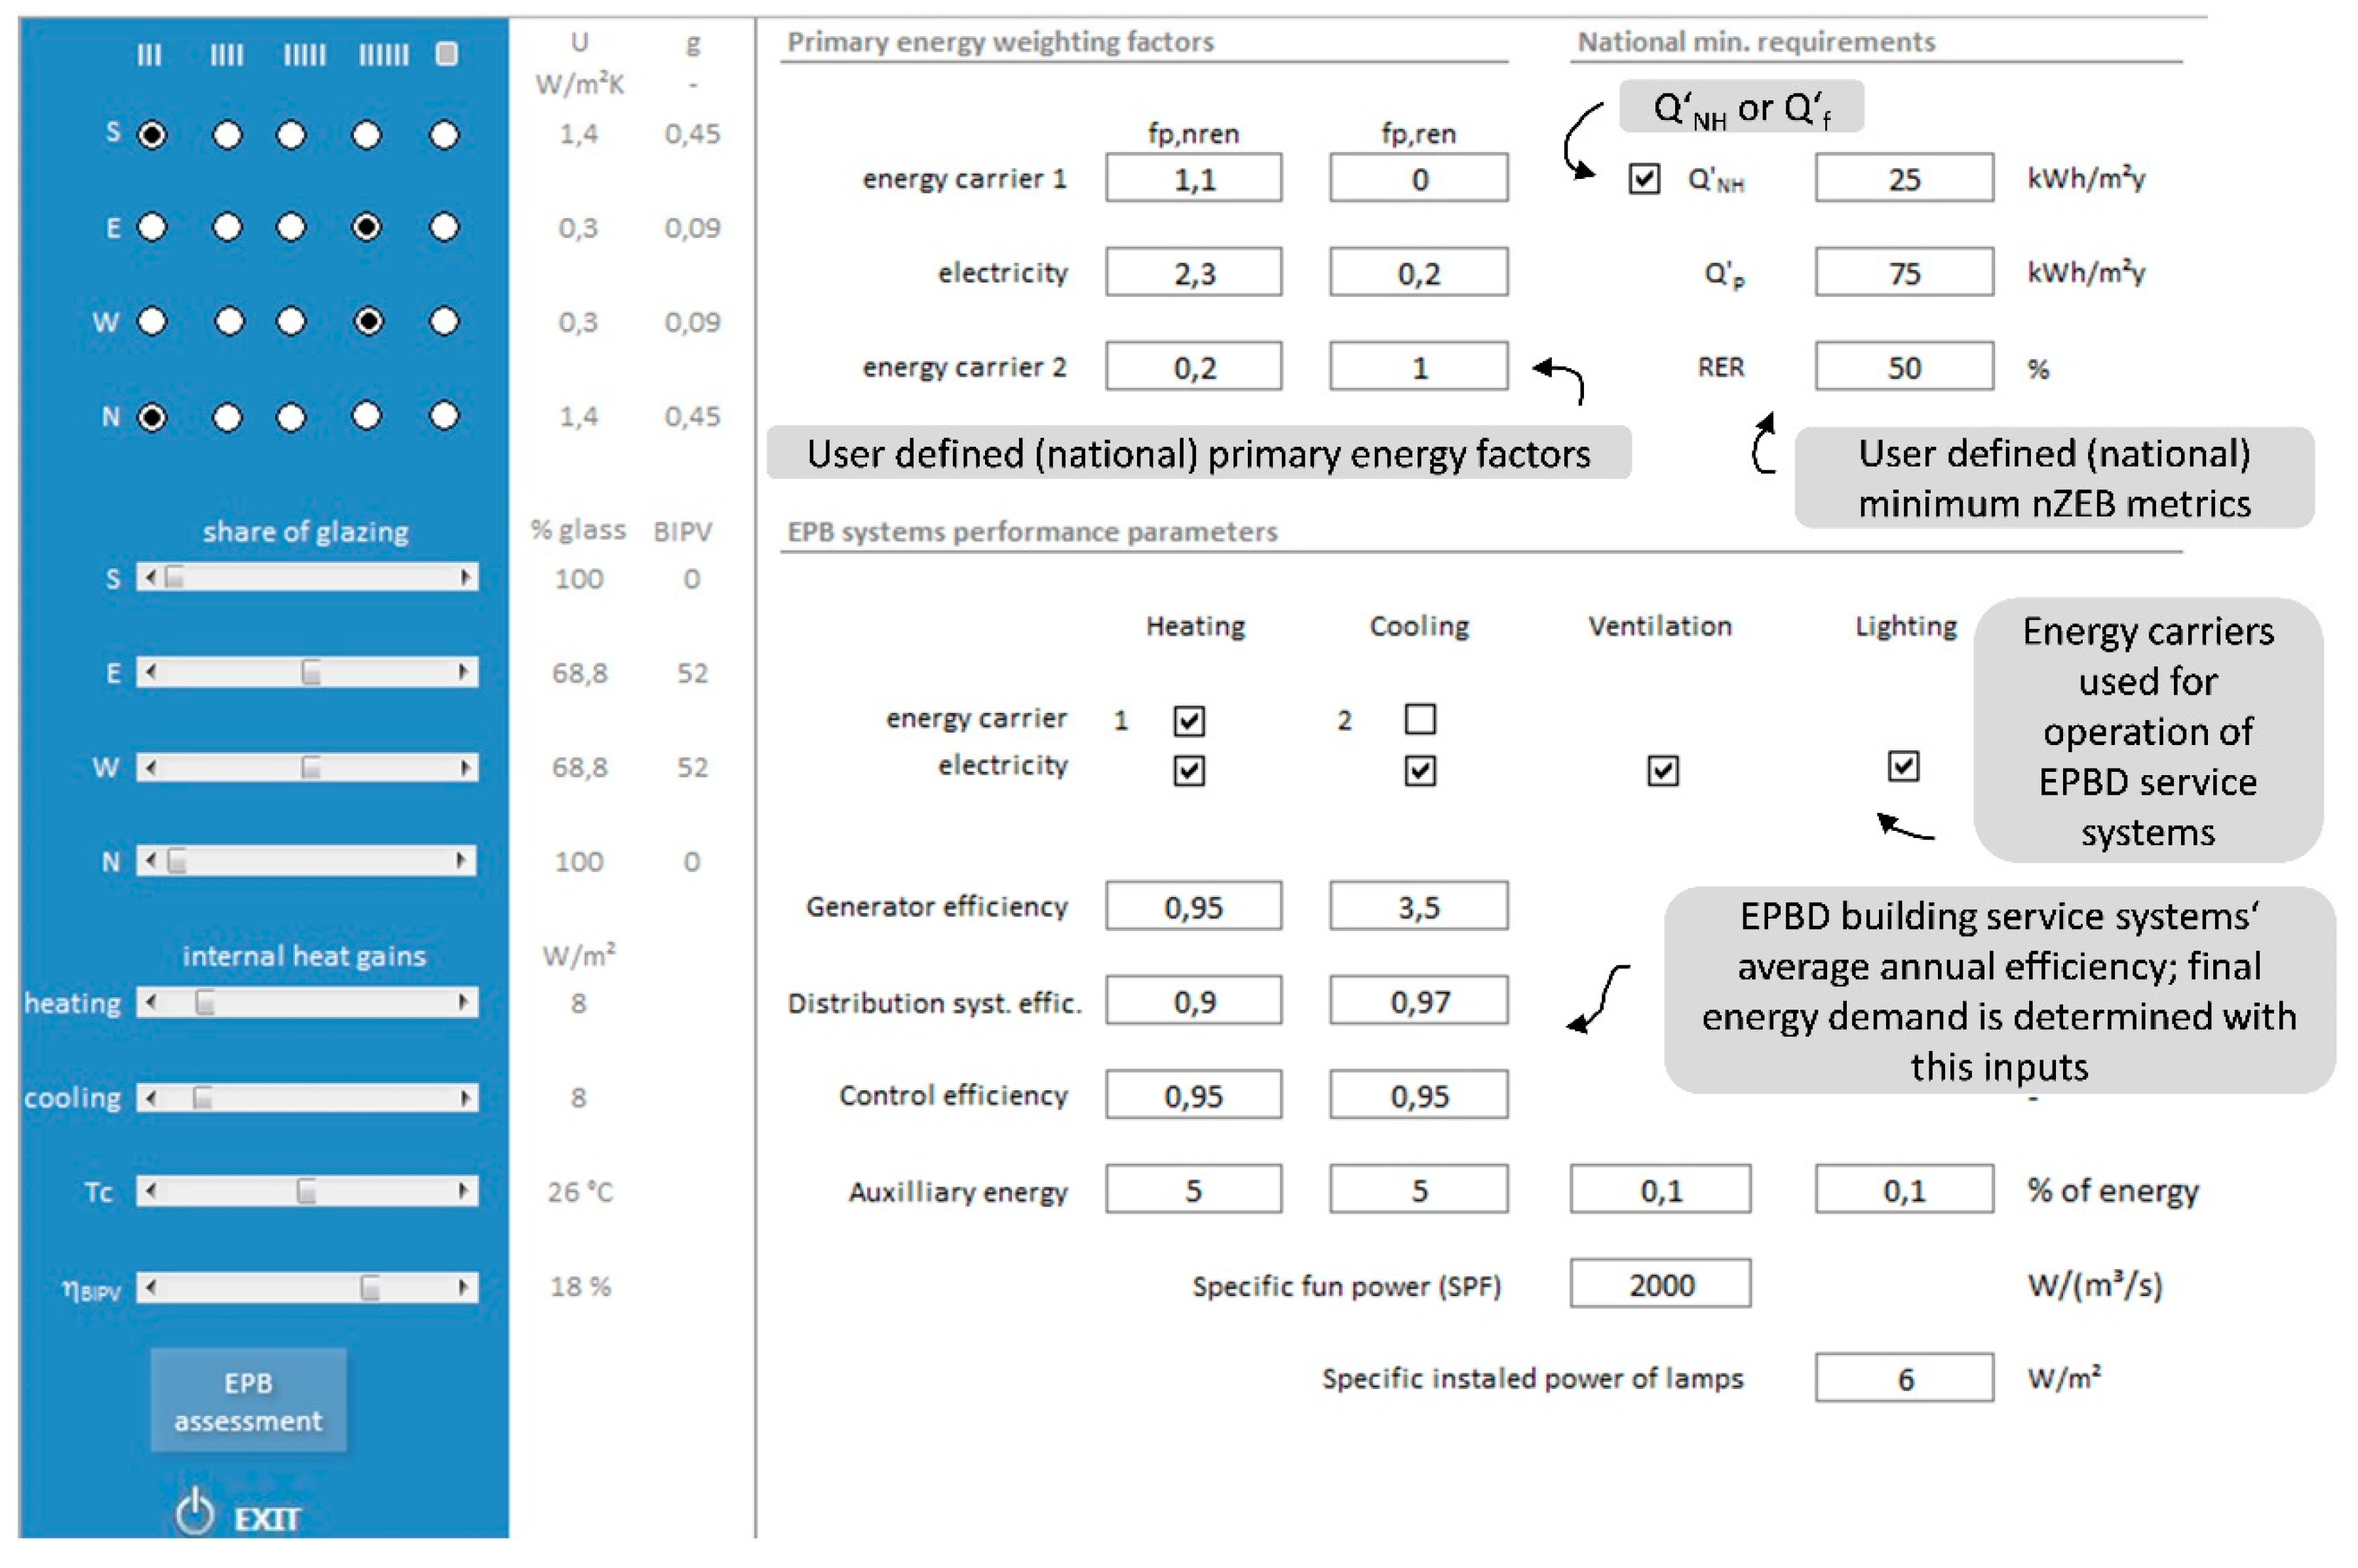
Two graphical user interfaces (GUI) are integrated into the evaluation tool. The first one, Data GUI, shown in Figure 5, enables designers to specify energy efficiency indicators and nZEB requirements to national regulations. This includes minimum requirements and primary energy factors. Further on, energy carriers used for the operation of each of the building service systems can be selected. The third group of input data consists of a description of building service systems, as presented in Section 3.2.3.
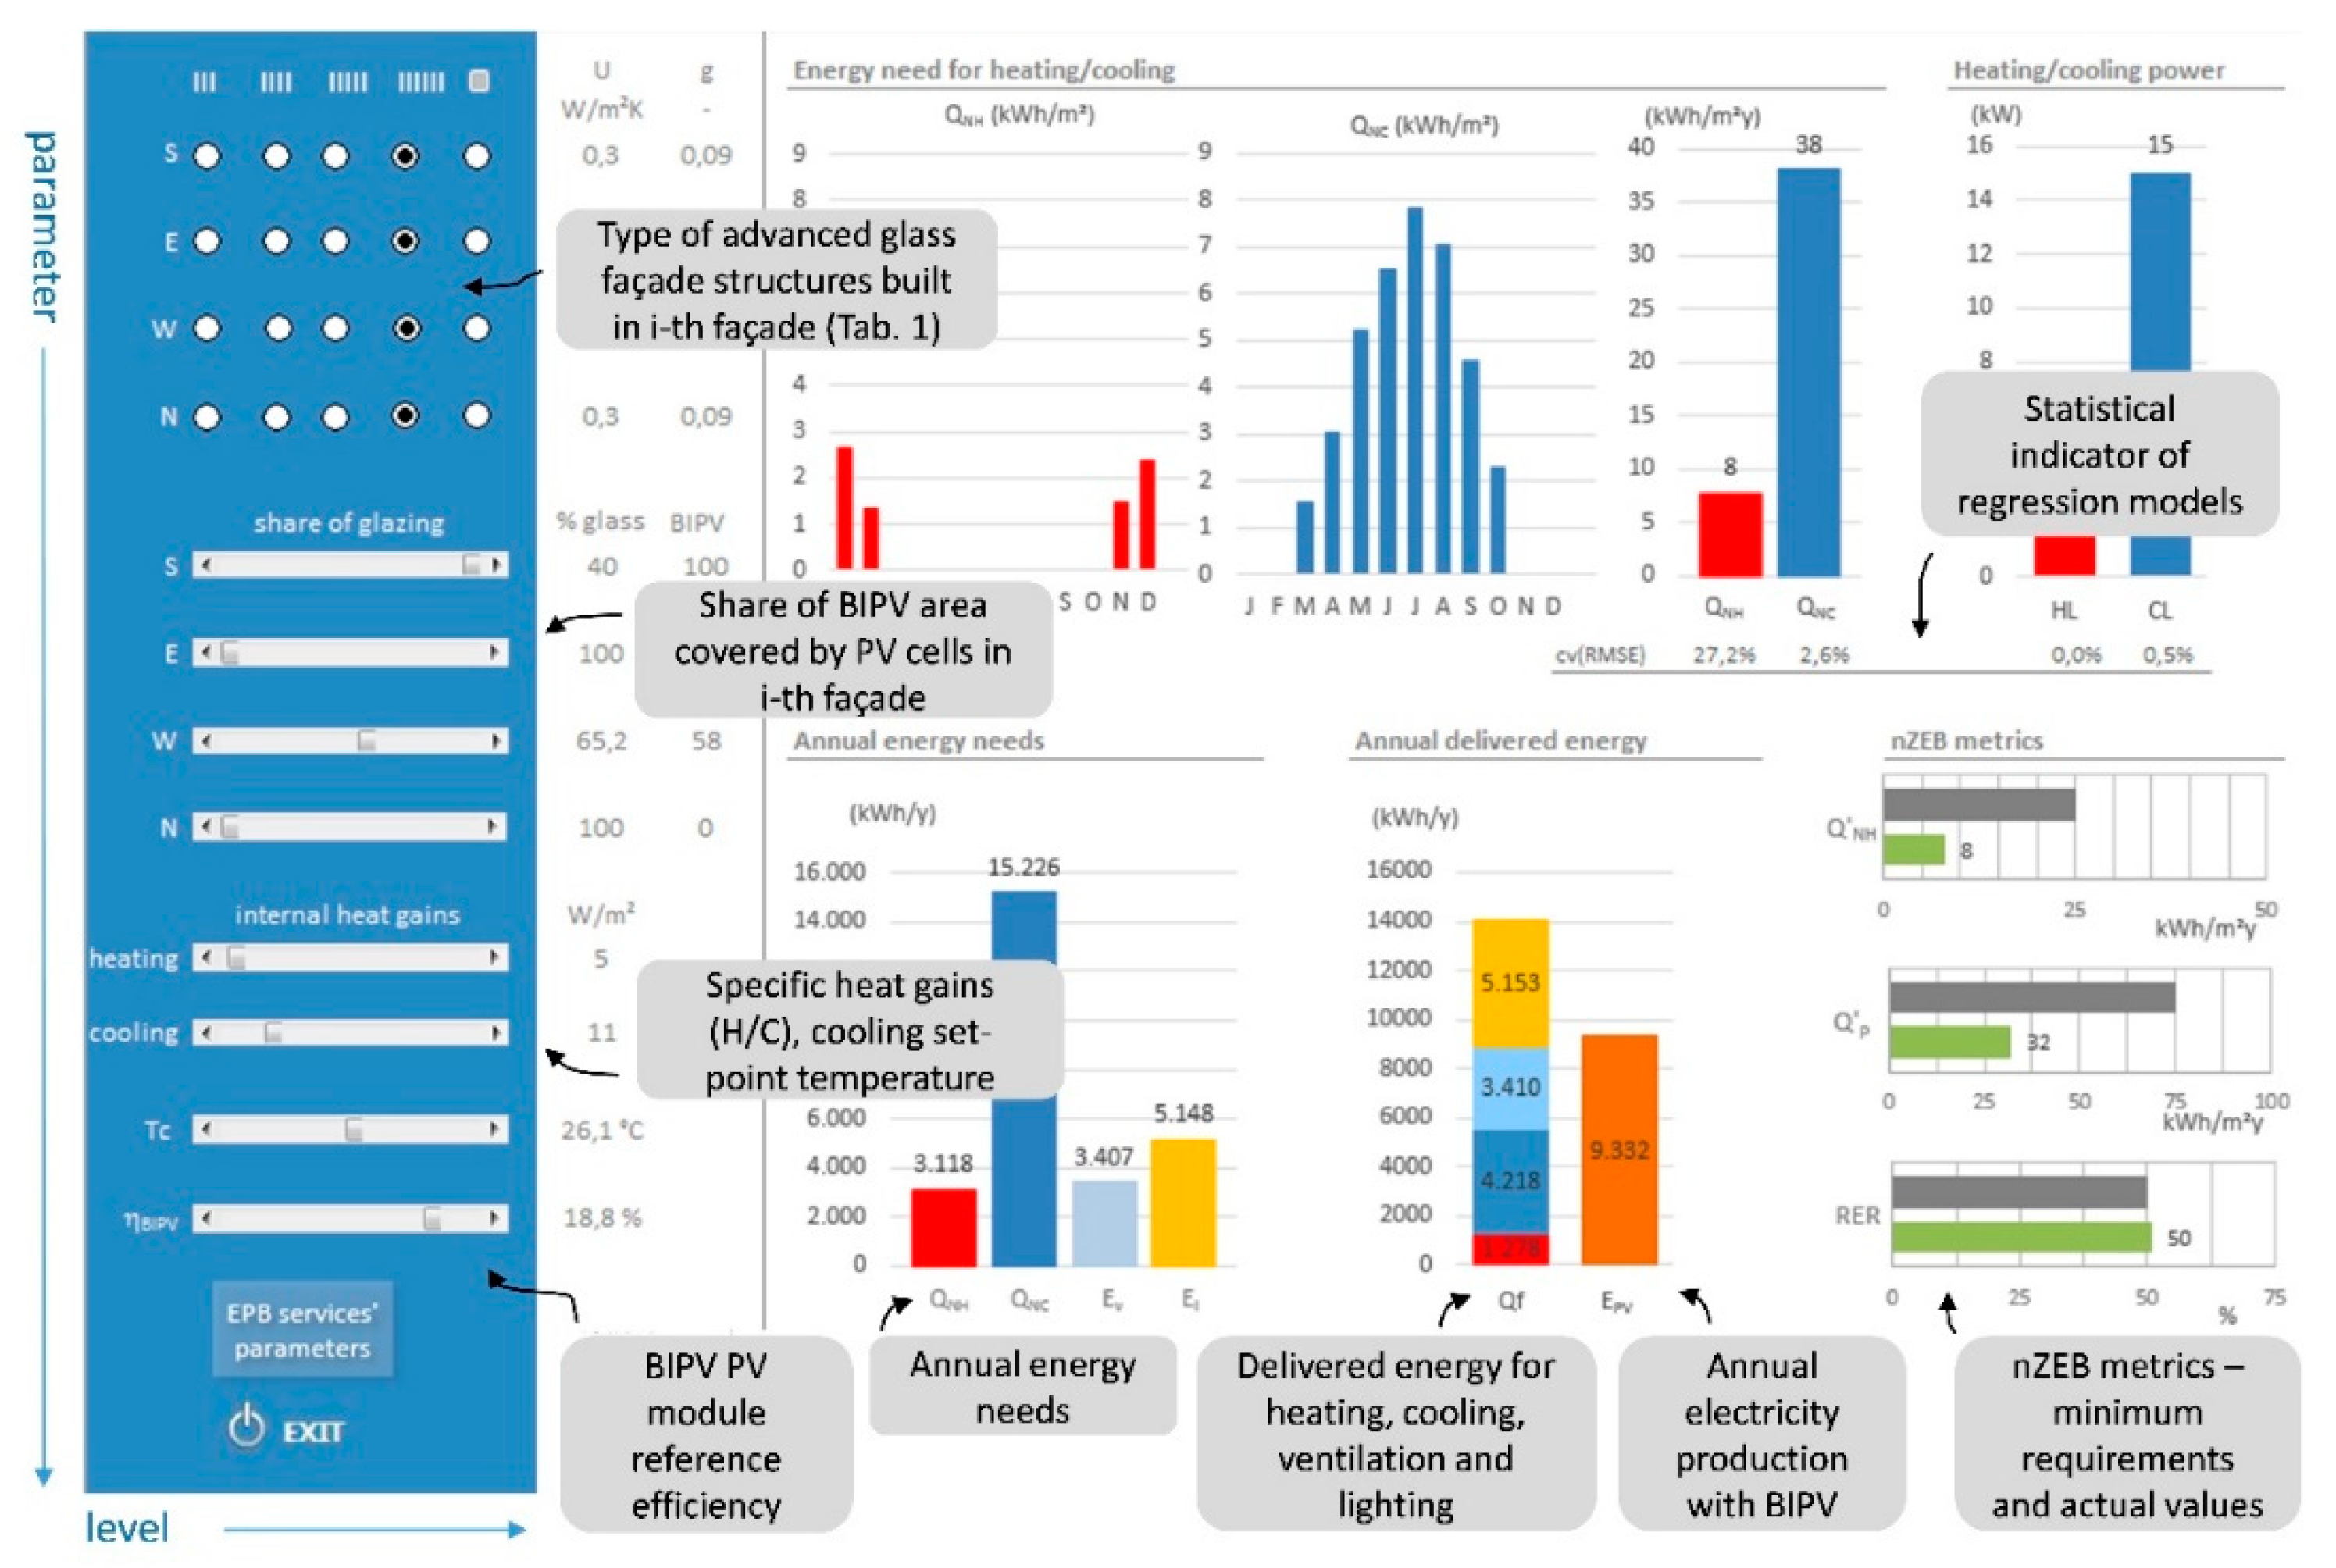
The second evaluation GUI consists of input fields that enable the setting of influence parameters and the presentation of results. Input fields are defined according to the content of the Taguchi matrix in the upgraded EPB tool. Consequently, the type of glazed facade structures defined in the upgraded EPB tool as ‘advanced glazing’ can be selected. Each of these structures can also be BIPV if a share of glazing lower than 100% is specified. As the results of the fast modelling of building’s energy efficiency indicators, nZEB metrics, and statistical indicators of regression models are shown. The evaluation GUI is presented in Figure 6.
4. Case Studies with Discussion
Four case studies were developed to demonstrate the early design phase optimization using the fast modelling approach. Results are shown for reference buildings presented in Figure 3 in different climate conditions. Meteorological data was taken from METEONORM [43]. No shading of surrounding objects was assumed. In all cases, nZEB indicators are presented for a double glazed facade and four-, six-, and seven-pane advanced glass or BIPV facade structures. If it is not stated differently, all-year internal (as average 24/365 value) heat gains were 8 W/m2; the constant set point temperatures for heating at 22 °C and for cooling at 26 °C were assumed. The buildings are ventilated (24/365) with an air-exchange rate of 0.7 h−1, and the buildings’ airtightness is n50 2 h−1. As the thermal properties of advanced glasses facade structures shown in Table 1 also apply to spacers’ and joint thermal bridges, an additional correction factor 0.01 W/mK was added to the overall thermal transmittance of the envelope of reference buildings. Specific fan power of ventilation system 1400 W/(m3/s), heat recovery efficiency of 65%, and specific lighting electrical power 8 W/m2 were taken into account. Other inputs that were set in the Data GUI are shown in Table 2.
General conclusions are given according to the following target values of nZEB indicators: Q′NH equal to 25 kWh/m2y, Q′p,nren equal to 75 kWh/m2y, and RER equal to 50%. Values were defined taking into account contemporary trends in energy conservation (corresponds to Q’NH), cost-effectiveness based the target of buildings’ energy efficiency measures (Q’p,nren) adopted (or close to) in several EU countries, and global climate change mitigation plans, which predict a significant increase of renewable energy use (RER). In addition to nZEB indicators, specific energy needs for heating Q’NH and cooling Q’NC and specific final energy demand Q’f for the operation of installed building service systems are presented.
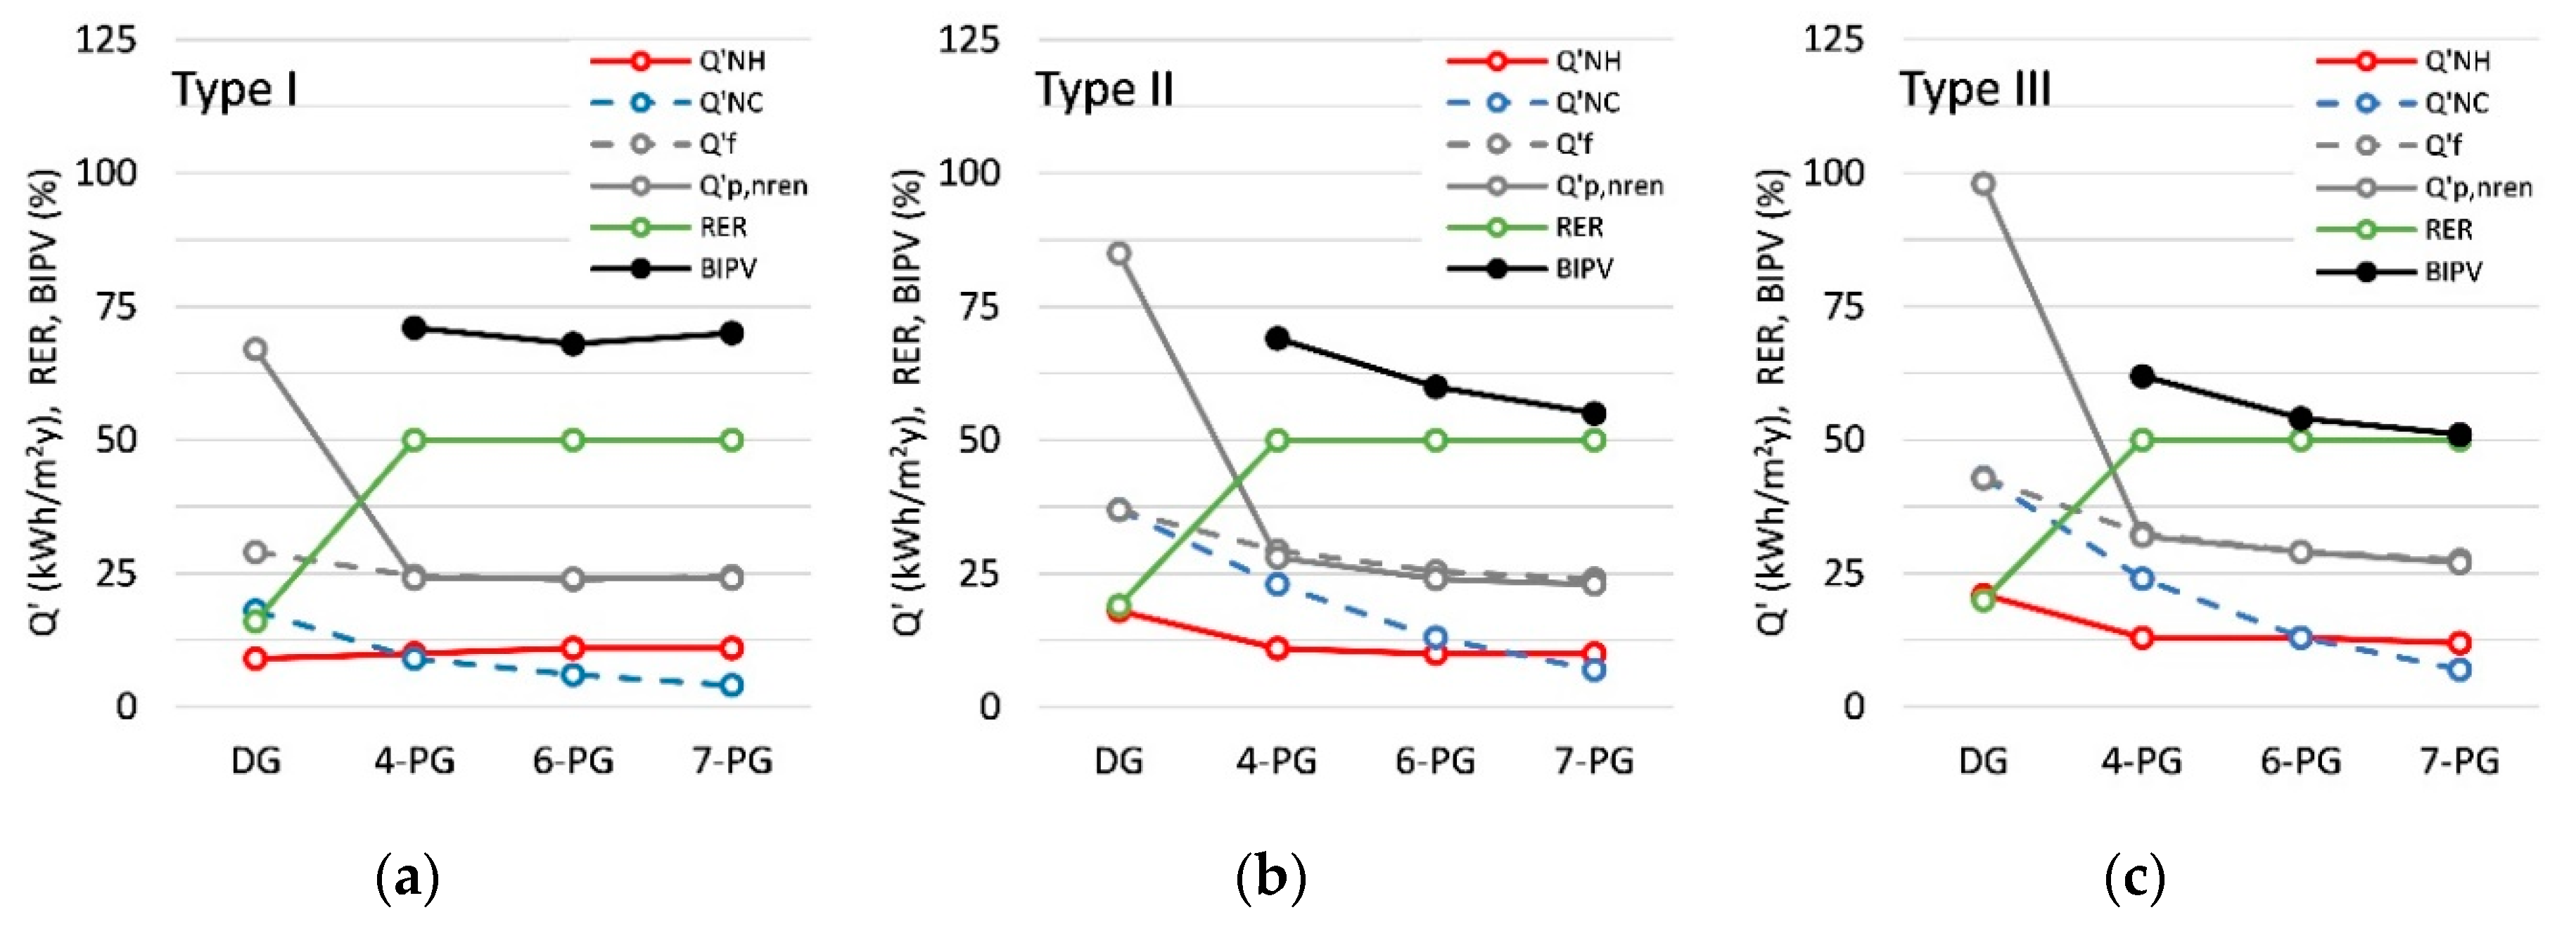
The first case shows the influence of the type of advanced multi-layer glass facade structures on building energy efficiency indicators and nZEB metrics in the case of biomass district heating and cooling in Helsinki (Φ 60°10’10’’, λ 24°56’07’’, Dfb Koppen–Geiger classification). The results are shown in Figure 7.
The Type I reference building has the lowest energy needs for cooling as only one facade is glazed and fulfils the target of Q’NH regardless of glazing technology. There is probably no need to install advanced multi-layer glazing, except if the goal is to reduce the cost of energy. If the most advanced multi-layer facade will be installed, the final energy demand will decrease by one third, in comparison to the double glazed facade. In contrast, target nZEB indicators can be reached in the case of an all-glass building (Type II) and in the case of a Type III reference building only if an advanced four- or six-pane glazed facade structure will be built. In both reference building types, significant decreases of final energy demand can be noted in the case of six-pane glazed facades and a reduction of Q’f by almost 50%. The most evident decrease of final energy demand can be noted if four-pane glazing is replaced by six-pane glazing, regardless of the type of reference building.
The second case study showed the share of BIPV facade structures in the total glass facade area needed to achieve RER equal to 50%. In this case, buildings are located in Zurich (Φ 47°22’00’’, λ 8°33’00’’, Csa Koppen–Geiger classification). A heat pump (air-water) is used as a heat generator and as cold generator. Other inputs are shown in Table 2. The results are shown in Figure 8 for reference buildings with different BIPV facade structures and are compared to buildings with double-glazed facades without BIPV.
From the results, it can be concluded that all buildings with advanced glazing can meet the target values of nZEB indicators. The most demanding indicator is RER; 65% (Type I) to 50% (Type III) of total glassed facade areas need to be built with BIPV facade structures to fulfil target values. Expressed in the area of BIPV facade structures, it is found that 650 m2 of BIPV structures are needed to achieve RER equal to 50% in the case of Type I buildings, 790 m2 in the case of Type II buildings, and 990 m2 of BIPV structures in the case of Type III buildings. As in the previous case, energy needs for heating are below the target value of energy needs for heating Q’NH in all cases, regardless if double glazing or advanced multi-pane glass facade structures are installed. The energy needs for heating correspond to energy efficiency class A of Type I buildings in all cases, while four-pane multi-layer BIPV facade structures must be installed in the case of Type II and Type III buildings. Advanced facade structures significantly decrease the non-renewable primary energy Q’p,nren needed for the operation of all building types in comparison to double-glazed facades, but also in this case, no significant decrease of Q’p,nren or a decrease of final energy demand can be seen in the case of six-pane and seven-pane BIPV facade structures.
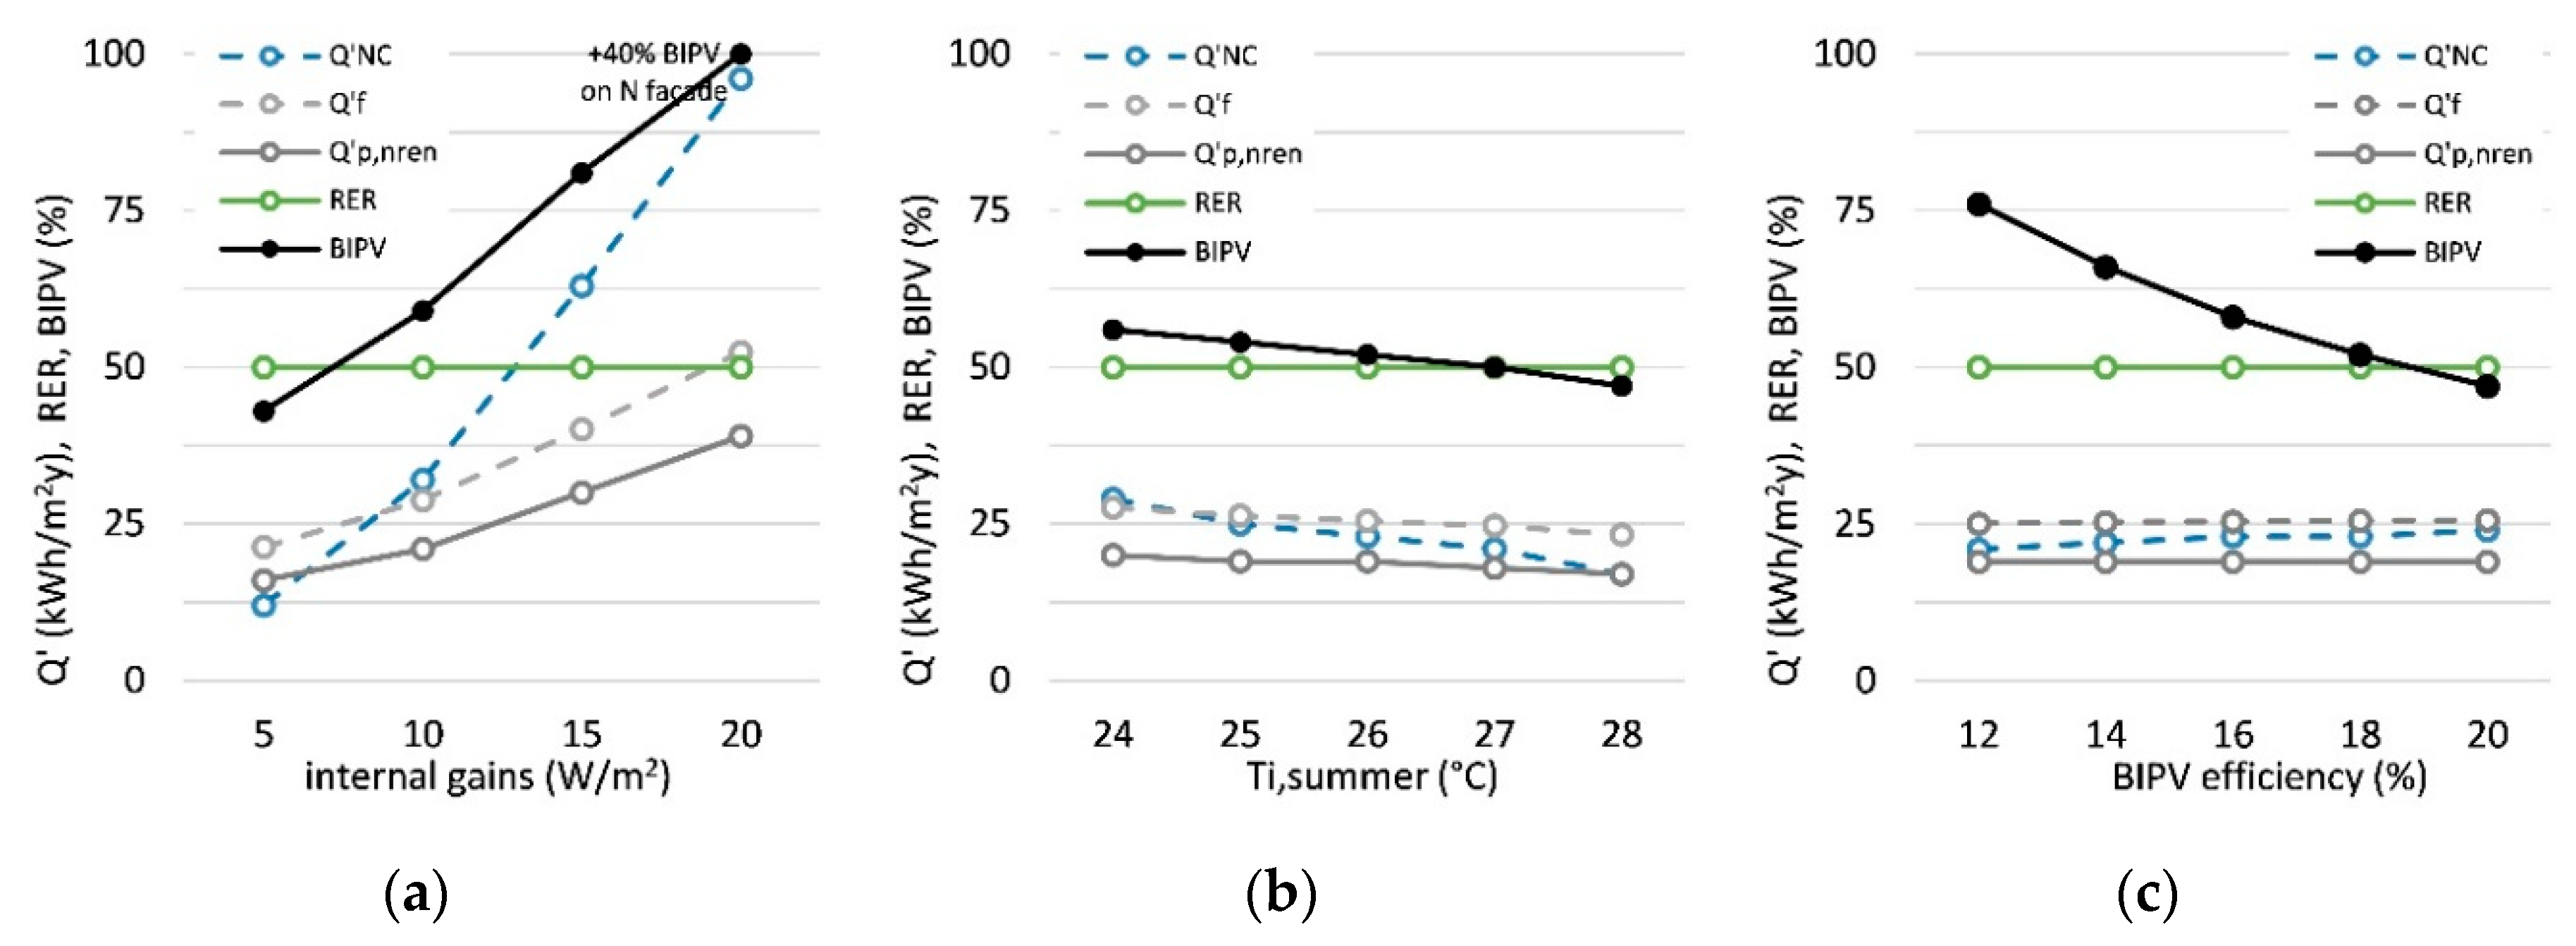
The third case study shows a parametric study of building Type II as an all-glass building built in Barcelona (Φ 41°23’20’’, λ 2°09’32’’, Dfb Koppen–Geiger classification). The building is equipped with a condensate gas boiler and cooling aggregate (HP) with the specifications presented in Table 2. In all cases, facades are built with seven-pane BIPV facade structures. The results of fast modelling are shown in Figure 9. In all cases, the shares of BIPV structures were determined to achieve the target values of the nZEB indicators.
From Figure 9a, it can be seen that internal gains have a significant impact on the size of BIPV facade structures because of increased energy needs for cooling and electrical lighting as transparent areas of facades decrease with increased shares of BIPV structures. Nevertheless, nZEB indicators’ target values can be met in all ranges of internal gains, but BIPV structures must be installed on north facades as well in the case of the highest value of internal gains. As specific energy demand for cooling is dominant, the case also indicates that all techniques for passive and free cooling should be considered to decrease energy needs for cooling in the early design phase. The required area of BIPV facade structures slightly decreases with increased cooling set-point temperature (Figure 9b). If the set-point temperature is increased from 25 to 27 °C, 50% instead of 54% of east, south, and west facades must be built with BIPV facade structures, and installing of 60 m2 of BIPV facade structures can be avoided. The high level of importance of PV cell efficiency can also be observed (Figure 9c) as only 50% of east, south, and west facade should be built with BIPV facade structures (in the case of 18.8% efficiency [44]), which is significantly less in comparison to 77% in the case of 12% PV cell efficiency. This result represents a solid basis for cost efficiency determination of BIPV facade structures in the early building design phase.
The fourth case (Figure 10) shows the specific yearly non-renewable primary energy needed for the operation of the reference buildings and share of BIPV facade structures required to achieve the range of RER between 30% and 50%. Different climate conditions were considered. It was assumed that glass facades are built with six-pane glass facade structures. The gas boiler is used as a heat generator and HP for cooling.
With the exception of three sites in the case of the Type I building, it can be seen that reference buildings can fulfil the target range of RER. The share of BIPV facade structures’ area to achieve RER equal to 50% is in the range from 97% to 59% in the case of Type I, 92% to 47% in the case of Type II, and in the range from 83% to 39% in the case of Type III reference buildings. In all climate conditions and all types of reference buildings, the yearly specific non-renewable primary energy needed is much lower than the target value (75 kW/m2y): in the range between 16 and 32 kWh/m2y at RER 50% and between 23 and 46 kWh/m2y at RER equal to 30%. This indicates that on the national level the requirements for RER must be set very carefully and that Q’p,nren could be set significantly lower (than the assumed target value) in order to promote efficient use of energy.
5. Conclusions
Different methods for evaluation of the energy performance of buildings are used at different phases of building design in terms of their complexity. The later the design phase is, the more complex are the methods used, which require specialized software and extended knowledge of users. Nevertheless, as it is commonly recognised, the early design phase is the most crucial from the point of view of the added value of the project. A fast modelling approach based on basic engineering knowledge and widely used software is, therefore, (still) a useful approach despite the Building Information Management process’ implementation.
In this paper, the procedure of development of software for the fast modelling of energy efficiency and nZEB evaluation is presented. For the purpose of fast modelling, linear multi parametric regression models were developed for the prediction of building energy efficiency indicators. Regression models were developed based on statistical evaluation of 50 numerically determined energy balances data. Numerical simulations were performed, taking into account 12 preselected influential parameters, according to thermal and radiative properties of advanced glazed facade structures in office buildings. The combination of influential parameters values in each numerical simulation was determined using a L50 Taguchi matrix. The statistical indicators show the adequacy of regression models. Despite the fact that the software is adapted for the evaluation of buildings constructed with advanced four-, six- or seven-pane facade structures and those structures upgraded in BIPV, the fast modelling approach can be implemented for the evaluation of all building types, new or renovated, by adapting the parameters of the Taguchi matrix and the evaluation GUI.
It can be concluded that the limitation of the proposed fast modelling method and developed tools is in the monthly energy balance model rather than accuracy of the regression models.
From case study examples, it can be seen that RER is the most crucial nZEB indicator and must be defined in national regulations with great caution. Meanwhile, the non-renewable primary energy nZEB indicator is less demanding. It has been proven that office buildings in different architectural forms can meet nZEB requirements if advanced glazing technology and on-site electricity production with BIPV technology, as studied in the paper, is implemented regardless of the wide range of local climate conditions.
In the further development of fast modelling tools, other building service systems can be included, such as humidification and dehumidification of the air, as well as free cooling and hybrid ventilation of office buildings. It will be also interesting to compare cost analysis of advanced glass and BIPV structures to the energy performance indicators.
Author Contributions
Conceptualization, S.M., C.A. and S.D.; methodology, S.M.; software, C.A.; validation, S.D., C.A. and B.Č.; writing—original draft preparation, S.D. and C.A.; writing—review and editing, S.M.
Funding
This work was supported by the European Regional Development Fund, Research and development programmes (TRL 3-6), Programme: ‘Sustainable and innovative construction of smart buildings – TIGR4smart’ (C3330-16-529003). The authors also acknowledge the financial support from the Slovenian Research Agency (research core funding No. P2-0223 (C)).
Conflicts of Interest
The authors declare no conflict of interest.
Nomenclature
| Variables and parameters | |
| A | Area (m2) |
| a | Reference dimension (m) |
| b | Regression coefficient |
| CV(RMSE) | Coefficient of Variation of the Root Mean Square Error (%) |
| DFav | Average daylight factor (%) |
| E | Electric energy (kWh/m, kWh/y) |
| f | Share of transparent area in BIPV, primary energy factor (-) |
| g | Total solar energy transmittance (-) |
| M | Numerically modelled value of dependent variable |
| NMBE | Normalized Mean Bias Error (%) |
| n | Number of numerical experiments, air exchange rate (h−1) |
| P | Predicted value of dependent variable |
| PSFP | Specific fan power (W/(m³/s)) |
| p | Degree of freedom (number of regressors in regression model) |
| Q’f | Specific yearly final energy demand (kWh/m2y) |
| QNC,y, QNC,m | Yearly or monthly energy need for cooling (kWh/y or kWh/m) |
| Q’NC,y, Q’NC,m | Specific yearly or monthly energy need for cooling (kWh/m2y or kWh/m2m) |
| QNH,y, QNH,m | Yearly or monthly energy need for heating (kWh/y or kWh/m) |
| Q’NH,y, Q’NH,m | Specific yearly or monthly energy need for heating (kWh/m2y or kWh/m2m) |
| Q’p | Specific yearly primary energy needed for operation of the building (kWh/m2y) |
| R2 | Coefficient of determination (-) |
| RER | Renewable energy ratio (%) |
| U | Thermal transmittance (W/m²K) |
| η | Efficiency (%) |
| θI,C | Set-point indoor air temperature in cooling period (°C) |
| Θ | Sky obstacle angle (by default 80°) |
| ρ | Area averaged inner surface reflectivity (-) |
| τvis | Light transmissivity (-) |
| ФH, ФC | Design heating/cooling load (W) |
| Ф’int,H | Specific internal gains in heating period (W/m2) |
| Ф’int,C | Specific internal gains in cooling period (W/m2) |
| Subscripts and superscripts | |
| adj | Adjusted |
| adv | Advanced |
| env | Envelope |
| g | Glazing |
| i | Facade orientation counter index, counter |
| nren | Non-renewable |
| PV | PV cell, BIPV |
| ren | Renewable |
References
- EPBD (recast). Directive (EU) 2018/844 of the European Parliament and of the Council amending Directive 2010/31/EU on the Energy Performance of Buildings and Directive 2012/27/EU on Energy Efficiency. Available online: https://eur-lex.europa.eu/legal-content/EN/TXT/PDF/?uri=CELEX:32018L0844&from=EN (accessed on 12 March 2019).
- Medved, S.; Domjan, S.; Arkar, C. Sustainable Technologies for Nearly Zero Energy Buildings, Design and Evaluation Methods, 1st ed.; Springer: Cham, Switzerland, 2019. [Google Scholar]
- EN ISO 52016-1:2017. Energy Performance of Buildings—Energy Needs for Heating and Cooling, Internal Temperatures and Sensible and Latent Heat Load—Part 1: Calculation Procedures; CEN 2017. Available online: https://standards.cen.eu/dyn/www/f?p=204:110:0::::FSP_PROJECT,FSP_ORG_ID:41815,6072&cs=1CDDF3099A2B5E3E329ED8C99B3FE1ADC (accessed on 22 April 2019).
- EN 15193-1:2017. Energy Performance of Buildings—Energy Requirements for Lighting—Part 1—Specifications; CEN 2017. Available online: https://standards.cen.eu/dyn/www/f?p=204:110:0::::FSP_PROJECT,FSP_ORG_ID:39019,6150&cs=1E83B40B86B05B853CC927E7317344F32 (accessed on 22 April 2019).
- Catalina, T.; Virgone, J.; Blanco, E. Development and validation of regression models to predict monthly heating demand for residential buildings. Energy Build 2008, 40, 1825–1832. [Google Scholar] [CrossRef]
- Asadi, S.; Amiri, S.S.; Mottahedi, M. On the development of multi-linear regression analysis to assess energy consumption in the early stages of building design. Energy Build 2014, 85, 246–255. [Google Scholar] [CrossRef]
- Premrov, M.; Žigart, M.; Leskovar, V.Z. Influence of the building shape on the energy performance of timber-glass buildings located in warm climatic regions. Energy 2018, 149, 496–504. [Google Scholar] [CrossRef]
- Yildiz, B.; Bilbao, J.I.; Sproul, A.B. A review and analysis of regression and machine learning models on commercial building electricity load forecast. Renew. Sustain. Energy Rev. 2017, 73, 1104–1122. [Google Scholar] [CrossRef]
- Tronchin, L.; Manfren, M.; James, P.A.B. Linking design and operation performance analysis through model calibration: Parametric assessment on a Passive House building. Energy 2018, 165, 26–40. [Google Scholar] [CrossRef] [Green Version]
- Sarwar, R.; Cho, H.; Cox, S.J.; Mago, P.J.; Luck, R. Field validation study of a time and temperature indexed autoregressive with exogenous (ARX) model for building thermal load prediction. Energy 2017, 119, 482–496. [Google Scholar] [CrossRef]
- Attanasio, A.; Piscitelli, M.S.; Chiusano, S.; Capozzoli, A.; Cerquitelli, T. Towards an Automated, Fast and Interpretable Estimation Model of Heating Energy Demand: A Data-Driven Approach Exploiting Building Energy Certificates. Energies 2019, 12, 1273. [Google Scholar] [CrossRef]
- Jaffal, I.; Inard, C.; Bozonnet, E. Toward integrated building design: A parametric method for evaluating heating demand. Appl. Therm. Eng. 2012, 40, 267–274. [Google Scholar] [CrossRef]
- Al Gharably, A.; DeCarolis, J.F.; Ranjithan, S.R. An enhanced linear regression-based building energy model (LRBEM+) for early design. J. Build. Perform. Simul. 2016, 9, 115–133. [Google Scholar] [CrossRef]
- Lam, J.C.; Wan, K.K.W.; Liu, D.; Tsang, C.L. Multiple regression models for energy use in air-conditioned office buildings in different climates. Energy Convers Manag. 2010, 51, 2692–2697. [Google Scholar] [CrossRef]
- Catalina, T.; Iordache, V.; Caracaleanu, B. Multiple regression model for fast prediction of the heating energy demand. Energy Build 2013, 57, 302–312. [Google Scholar] [CrossRef]
- Lin, Y.; Zhou, S.; Yang, W.; Shi, L.; Li, C.-Q. Development of Building Thermal Load and Discomfort Degree Hour Prediction Models Using Data Mining Approaches. Energies 2018, 11, 1570. [Google Scholar] [CrossRef]
- TRNSYS 17.2 Solar Energy Laboratory; University of Wisconsin-Madison: Madison, WI, USA, 2014.
- IDA Indoor Climate and Energy Simulation Tool 4.8.; EQUA Simulation AB: Solna, Sweden, 2018.
- Medved, S.; Arkar, C.; Šuklje, T.; Domjan, S. TrimoExpert; EPB Certification Tool. 2014. Available online: https://www.trimo-group.com/en/downloads/design-tools/trimo-expert (accessed on 20 April 2018).
- Kamel, E.; Memari, A.M. Automated Building Energy Modeling and Assessment Tool (ABEMAT). Energy 2018, 147, 15–24. [Google Scholar] [CrossRef]
- Ruiz, G.R.; Bandera, C.F. Validation of Calibrated Energy Models: Common Errors. Energies 2017, 10, 1587. [Google Scholar] [CrossRef]
- Fabrizio, E.; Monetti, V. Methodologies and Advancements in the Calibration of Building Energy Models. Energies 2015, 8, 2548–2574. [Google Scholar] [CrossRef] [Green Version]
- ASHRAE Guideline 14-2002. Measurement of Energy and Demand Savings; ASHRAE Inc.: Atlanta, GA, USA, 2002. [Google Scholar]
- Košir, M.; Iglič, N.; Kunič, R. Optimisation of heating, cooling and lighting energy performance of modular buildings in respect to location’s climatic specifics. Renew Energy 2018, 129, 527–539. [Google Scholar] [CrossRef]
- Domjan, S.; Arkar, C.; Medved, S. Computer-aided decision supporting tool for nearly Zero Energy Building renovation. In Proceedings of the OIKONET conference “Global Dwelling”, Manchester, UK, 23 September 2016. [Google Scholar]
- International Energy Agency. 2015. Available online: www.iea.org (accessed on 3 March 2019).
- Ceron, I.; Caamano-Martin, E.; Neila, F.J. State of the art of building integrated photovoltaic products. Renew. Energy 2013, 58, 127–133. [Google Scholar] [CrossRef]
- Wang, M.; Peng, J.; Li, N.; Yang, H.; Wang, C.; Li, X.; Lu, T. Comparison of energy performance between PV double skin facades and PV insulating glass units. Appl. Energy 2017, 194, 148–160. [Google Scholar] [CrossRef]
- Skandalos, N.; Karamanis, D. Investigation of thermal performance of semi-transparent PV technologies. Energy Build. 2016, 124, 19–34. [Google Scholar] [CrossRef]
- Kapsis, K.; Athienitis, A.K. A study of the potential benefits of semi-transparent photovoltaics in commercial buildings. Solar Energy 2015, 115, 120–132. [Google Scholar] [CrossRef]
- Sustainable and Innovative Construction of Smart Buildings—TIGR4smart (C3330-16-529003). Final Report, Supported by European Regional Development Fund, Research and Development Programmes (TRL 3-6). Available online: http://www.ee.fs.uni-lj.si/LOTZ/programTIGR4smart.pdf (accessed on 15 April 2019).
- Skandalos, N.; Karamanis, D. PV glazing technologies. Renew. Sustain. Energy Rev. 2015, 49, 306–322. [Google Scholar] [CrossRef]
- Zhang, W.; Lu, L.; Peng, J.; Song, A. Comparison of the overall energy performance of semi-transparent photovoltaic windows and common energy-efficient windows in Hong Kong. Energy Build. 2016, 128, 511–518. [Google Scholar] [CrossRef]
- Morini, M.; Corrao, R. Energy optimization of BIPV glass blocks: A multi-software study. Energy Procedia 2017, 111, 982–992. [Google Scholar] [CrossRef]
- Domjan, S.; Arkar, C.; Begelj, Ž.; Medved, S. Evolution of all-glass nearly Zero Energy Buildings with respect to the local climate and free cooling techniques. Build. Environ. 2019, 160, 106183. [Google Scholar] [CrossRef]
- Costanzo, V.; Yao, R.; Essah, E.; Shao, L.; Shahrestani, M.; Oliveira, A.C.; Araz, M.; Hepbasli, A.; Biyik, E. A method of strategic evaluation of energy performance of Building Integrated Photovoltaic in the urban context. J. Clean. Prod. 2018, 184, 82–91. [Google Scholar] [CrossRef]
- Kralj, A.; Drev, M.; Žnidaršič, M.; Černe, B.; Hafner, J.; Jelle, B.P. Investigation of 6-pane glazing: Properties and possibilities. Energy Build. 2019, 190, 61–68. [Google Scholar] [CrossRef]
- Medved, S.; Begelj, Ž.; Domjan, S.; Šuklje, T.; Černe, B.; Arkar, C. Dynamic thermal response model and energy performance of a multi-layer glass and BIPV façade structures. Energy Build. 2019, 188–189, 239–251. [Google Scholar] [CrossRef]
- TRIMO: Q-Air—New Generation of Glass Façades. 2019. Available online: https://www.trimo-group.com/en/products/facades-and-walls/q-air (accessed on 15 April 2019).
- Darabi-Golestan, F.; Hezarkhani, A. Intensification of the polymetallic vein exploration by multivariate analysis and staged LINEST function at Glojeh deposit, NW Iran. J. Afr. Earth Sci. 2018, 147, 190–198. [Google Scholar] [CrossRef]
- EN 16798-3:2017. Energy Performance of Buildings—Ventilation for Buildings—Part 3: For Non-Residential Buildings—Performance Requirements for Ventilation and Room-Conditioning Systems; CEN 2017. Available online: https://standards.cen.eu/dyn/www/f?p=204:110:0::::FSP_PROJECT,FSP_ORG_ID:41423,6138&cs=1008930A04FE15B27C208D95F9C255127 (accessed on 25 April 2019).
- CIBSE Application Manual AM11 Building Performance Modelling; CIBSE Building Simulation: London, UK, 2015.
- Meteonorm. Global Meteorological Database for Solar Energy and Applied Climatology; Version 5.1: Edition 2005; Software and Data on CD-ROM; Meteotest AG: Bern, Switzerland, 2005. [Google Scholar]
- Union Glass High-Technology Glass, S.r.l. 2019. Available online: http://unionglass.it/index.php (accessed on 3 May 2019).
Figure 1.
The structure of the software for fast modelling of buildings’ energy efficiency and nearly Zero Energy Buildings (nZEB) indicators based on multi-parametric regression models.
Figure 1.
The structure of the software for fast modelling of buildings’ energy efficiency and nearly Zero Energy Buildings (nZEB) indicators based on multi-parametric regression models.

Figure 2.
Chosen influential parameters and their levels for evaluation of building constructed with advanced glass and building integrated photovoltaics facade (BIPV) facade structures.
Figure 2.
Chosen influential parameters and their levels for evaluation of building constructed with advanced glass and building integrated photovoltaics facade (BIPV) facade structures.

Figure 3.
Reference buildings used for validation of regression models.

Figure 4.
Numerical modelled (with upgraded energy performance of buildings (EPB) tool) and predicted (with regression models) specific yearly energy needs for heating (a) and cooling (b) of reference buildings presented in Figure 3.
Figure 4.
Numerical modelled (with upgraded energy performance of buildings (EPB) tool) and predicted (with regression models) specific yearly energy needs for heating (a) and cooling (b) of reference buildings presented in Figure 3.

Figure 5.
Data GUI for the description of energy carriers, specific national requirements for evaluation of building’s energy efficiency and nZEB metrics, and specifications of Energy Performance of Buildings Directive (EPBD) building service systems.
Figure 5.
Data GUI for the description of energy carriers, specific national requirements for evaluation of building’s energy efficiency and nZEB metrics, and specifications of Energy Performance of Buildings Directive (EPBD) building service systems.

Figure 6.
Evaluation GUI with parameter input fields and energy efficiency indicators and nZEB metrics of an analyzed building.
Figure 6.
Evaluation GUI with parameter input fields and energy efficiency indicators and nZEB metrics of an analyzed building.

Figure 7.
Energy efficiency and nZEB indicators of the buildings built with advanced glass and BIPV facade structures in Type I (a), Type II (b), and Type III (c) buildings in Helsinki.
Figure 7.
Energy efficiency and nZEB indicators of the buildings built with advanced glass and BIPV facade structures in Type I (a), Type II (b), and Type III (c) buildings in Helsinki.

Figure 8.
Energy efficiency and nZEB indicators for the buildings constructed with advanced glazed and BIPV facade structures in Type I (a), Type II (b), and Type III (c) buildings in Zurich; note that the area of PV cells in the BIPV glassed facade structure is 60% of the total facade structure area.

Figure 9.
Parametric study of energy efficiency and nZEB indicators for Type II (all-glass) building in Barcelona according to internal gains (a), indoor air temperature set-point (b), and reference efficiency of BIPV (c).
Figure 9.
Parametric study of energy efficiency and nZEB indicators for Type II (all-glass) building in Barcelona according to internal gains (a), indoor air temperature set-point (b), and reference efficiency of BIPV (c).

Figure 10.
Yearly specific non-renewable primary energy needed for the operation of reference buildings and required shares of BIPV structures in Type I (a), Type II (b), and Type III (c) buildings built in different sites to achieve renewable energy use (RER) in the range between 30% and 50%.
Figure 10.
Yearly specific non-renewable primary energy needed for the operation of reference buildings and required shares of BIPV structures in Type I (a), Type II (b), and Type III (c) buildings built in different sites to achieve renewable energy use (RER) in the range between 30% and 50%.


Table 1.
Thermal and radiative properties of advance glazed facade structures [39].
Table 1.
Thermal and radiative properties of advance glazed facade structures [39].
| Product | DG (Reference Double Glass Curtain Wall) | 4-PG (Four-Pane Glazing) | 6-PG (Six-Pane Glazing) | 7-PG (Seven-Pane Glazing) | 6-Popaque (Six-Pane Glazing with Thermal Insulation Core) |
|---|---|---|---|---|---|
| Transparent | Transparent | Transparent | Transparent | Opaque | |
| U (W/m2K) | 1.4 | 0.62 | 0.43 | 0.30 | 0.19 |
| gg (-) | 0.45 | 0.34 | 0.18 | 0.09 | 0.02 |
| τvis (-) | 0.65 | 0.56 | 0.35 | 0.12 | 0.00 |
Table 2.
Parameters considered in the analysis.
| EPBD Systems’ Parameters | Biomass District Heating | Biomass District Cooling | Heat Pump Heating | Heat Pump Cooling | Gas Heating |
|---|---|---|---|---|---|
| ηgenerator | 0.95 | 0.5 | 3 | 3.5 * | 0.95 |
| ηdistribution | 0.9 | 0.97 | 0.9 | 0.97 | 0.9 |
| ηcontrol | 0.99 | 0.99 | 0.95 | 0.95 | 0.95 |
| Aux.energy | 5% | 10% | 5% | 5% | 5% |
| Primary Energy Factors | Biomass | Environm. | Grid el. | Gas | PV el. |
| fp,ren | 1 | 1 | 0.2 | 0 | 1 |
| fp,nren | 0.2 | 0 | 2.3 | 1.1 | 0 |
* Value taking into account cooling at low outdoor temperatures and operation of cold generator in passive mode.
© 2019 by the authors. Licensee MDPI, Basel, Switzerland. This article is an open access article distributed under the terms and conditions of the Creative Commons Attribution (CC BY) license (http://creativecommons.org/licenses/by/4.0/).
Share and Cite
MDPI and ACS Style
Domjan, S.; Medved, S.; Černe, B.; Arkar, C. Fast Modelling of nZEB Metrics of Office Buildings Built with Advanced Glass and BIPV Facade Structures. Energies 2019, 12, 3194. https://doi.org/10.3390/en12163194
AMA Style
Domjan S, Medved S, Černe B, Arkar C. Fast Modelling of nZEB Metrics of Office Buildings Built with Advanced Glass and BIPV Facade Structures. Energies. 2019; 12(16):3194. https://doi.org/10.3390/en12163194
Chicago/Turabian StyleDomjan, Suzana, Sašo Medved, Boštjan Černe, and Ciril Arkar. 2019. "Fast Modelling of nZEB Metrics of Office Buildings Built with Advanced Glass and BIPV Facade Structures" Energies 12, no. 16: 3194. https://doi.org/10.3390/en12163194
Note that from the first issue of 2016, this journal uses article numbers instead of page numbers. See further details here.