On the Robustness of Active Wake Control to Wind Turbine Downtime


TNO, ECN Wind Energy, Westerduinweg 3, 1755LE Petten, The Netherlands
Energies 2019, 12(16), 3152; https://doi.org/10.3390/en12163152
Submission received: 12 July 2019
/
Revised: 8 August 2019
/
Accepted: 15 August 2019
/
Published: 16 August 2019
(This article belongs to the Special Issue Optimal Control of Fuel Cells and Wind Turbines)
Abstract
:Active wake control (AWC) is an operational strategy for wind farms that aims at reducing the negative effects of wakes behind wind turbines on the power production and mechanical loads at the wind turbines’ downstream. For a given wind direction, the strategy relies on collaborative control of the machines within each row of turbines that affect each other through their wakes. The vast amount of research performed during the last decade indicates that the potential upside of this technology on the annual energy production of a wind farm can be as high as a few percentage points. Although these predictions on the potential benefits are quite significant, they typically assume full availability of all turbines within a row operating under AWC. However, even though the availability of offshore wind turbines is nowadays quite high (as high as 95%, or even higher), the availability of a whole row of turbines is shown to be much lower (lower than 60% for a row of ten turbines). This paper studies the impact of turbine downtime on the power production increase from AWC, and concludes that the AWC is robust enough to be kept operational in the presence of turbines standing still.
1. Introduction
Within wind farms, wind turbines interact with each other through their wakes. The wakes feature reduced wind velocity and increased turbulence levels, and cause reduced power production and increased fatigue loading at downstream wind turbines. To reduce these negative effects on power and loads, the concept of active wake control (AWC) has been developed in the beginning of this century [1,2]. AWC is a cooperative approach to operate wind farms that aims at maximizing the power production of the whole farm, while at the same time trying to reduce the fatigue loading on the wind turbines.
There are two main classes of AWC approaches, both of which share the common feature that upstream wind turbines will reduce their power capture to allow downstream turbines to produce more power. The first one, called induction control, relies on down-regulation of upstream wind turbines, which results in increased wind velocity in their wakes and, therefore, higher power production at the wind turbines that stand in these wakes [3,4]. The second class of AWC methods, called wake redirection, is based on operating the upstream turbines with yaw misalignment in order to generate a transverse force on the air flow and steer the wakes away from downstream turbines [5,6]. Wake redirection, also known as wake steering, is typically the more beneficial strategy in terms of potential power production increase. Current model predictions indicate a potential upside in terms of annual energy production (AEP) increase by a few percentage points [7,8], which is quite significant. Recent wind tunnel tests [4] and initial field experiments [9,10,11] with wake redirection support the conclusions made by modeling.
Although these predictions on the potential benefits are quite significant, they typically assume full availability of all turbines. Up to now, the author is unaware of any work that pays attention on the impact of wind turbine downtime (resulting from failures, or during maintenance and repair activities) onto the benefits from AWC. During downtime, non-operational turbines downstream could potentially destroy the upsides from AWC as they will be unable to regain the lost power production upstream due to down-regulation or intentional yaw misalignment. As AWC fully relies on collaborative action of a group of turbines (typically a row of turbines), even one single turbine being down may negatively affect the operation of the whole row of turbines run in AWC mode. Without proper understanding of the impact of downtime on AWC, in trying to to avoid any risk of production losses one may choose to deactivate AWC for any row of turbines in which there is one or more non-operational turbine(s).
Such a hard measure to avoid power losses due to AWC during turbine standstill may, however, give rise to a quite significant reduction of the upside from AWC on yearly basis, i.e., in terms of AEP increase. This becomes clear by realizing that, even though nowadays, the availability of offshore wind turbines is quite high (as high as 95%, or even higher), the availability of a whole row of turbines as a group is much lower (around 60% for a row of ten turbines), as shown later on in this paper. This will practically destroy a substantial portion of the AEP gain from AWC, which might be unnecessary. This motivates the purpose of this paper, which studies the impact of turbine downtime on the benefits from AWC, and answers the question of whether AWC needs to be kept operational, deactivated, or reconfigured, during turbine down time. The study is limited to the wake redirection concept only.
2. Results and Discussion
2.1. Background on AWC by Wake Redirection
Wake redirection is an approach to control the wakes in a wind farm, which is based on intentional yaw misalignment, i.e., yawing the rotors of the upstream wind turbines away from the wind. As a result of that, two things happen: the power production of the yawed wind turbines decreases because the effective rotor area affected by the incoming wind flow becomes smaller, and the wakes behind these turbines is redirected aside from the downstream wind turbines. Due to the fact that the wake is being diverted, the downstream turbines can get (a larger portion of) the undisturbed wind field, which can increase of the total power production of the wind farm. To determine the optimal yaw misalignment setpoints for each wind turbine, an optimization procedure is used. The optimization criterion is the total power production of the wind farm. More specifically, given a wind farm consisting of N wind turbines, for an ambient wind speed V and wind direction , the yaw misalignment setpoints of the wind turbines, , , are determined by solving the following optimization problem
wherein is a vector containing the yaw misalignment angles for all turbines, and is the power production of the i-th turbine. To determine the power productions , a wake model will be used (explained later on).
This optimization is typically performed off-line for the whole range of relevant wind speeds V and wind directions . The relevant wind directions are those for which there exist wake interactions. The relevant wind speeds are those for which the wind farm produces less power than its rated power. As a result, the output from the AWC optimization is a lookup table containing the optimal yaw misalignment settings for each wind turbine in the farm and for each considered wind direction bin (wind direction bins of 1 degree are used). For more detailed explanation of the AWC optimization process, the reader is referred to [7].
Numerous simulation studies with wake redirection indicate the large potential for energy increase. Even for a row of just three turbines, an energy yield increase of more than 10% can be realized by wake redirection, see [12,13]. For long rows containing many wind turbines, this gain in energy can even reach up to 30%! Recently, tunnel tests [4] and field tests [9] confirm that the technology can be very beneficial for reducing wake effects on the power production.
2.2. Description of the Setup Used in this Study
The purpose of this study is to investigate the impact of wind turbine downtime on the performance, in term of power increase, of AWC by wake redirection. Generally, the power gain by AWC depends on many factors: the wind farm layout, wind conditions (wind speed and direction distributions, turbulence intensity), the spacings between the wind turbines, the rotor characteristics (nominal thrust coefficient), atmospheric stability, etc. Clearly, performing an exhaustive study including all possible variations of these parameters is prohibitive in terms of computation time. Therefore, the analysis here is focused on a subset of the possible parameter variations, which is carefully chosen to cover a large portion of the conditions met in offshore wind farms nowadays. These farms often have regular, grid-like layout, and have turbine spacings typically in the range of 5D to 10D. Here D denotes the rotor diameter so that, for example, 5D indicates a distance equal to 5 rotor diameters. Offshore wind conditions are typically with lower turbulence levels (often around 6% in the wind speed region around 7–8 m/s).
For a given sector of wind directions, for which the turbines within a row affect each other through their wakes, the wake redirection control strategy is optimized to maximize the power yield of that row [7]. For the sake of simplicity, a layout consisting of one single row of turbines is considered here, and the study is limited to the impact of turbine downtime on the operation of AWC for that specific row. Even though neighbouring rows do affect each other to some extent, when the wind direction is aligned with the row orientation the wake losses within that row are primarily influenced by the turbines of that row. This is due to the fact that, for a given turbine, the distance to its nearest upstream turbine within that row is a much shorter, and therefore the wake effect is much more pronounced, than the distance to turbines from neighbouring rows. Moreover, only the outer part of the wakes from neighbouring rows will reach the turbine in question, where the wake deficit is much weaker than that of the full wake(s) being case by the upstream turbines within the same row.
The following variations are considered in this study:
- Number of turbines: 4, 7 and 10. These are representative values for many offshore wind farms of moderate size. Even though large wind farms do have much longer rows, it will become clear from the analysis later on that considering more than 10 turbines won’t add value to the analysis and conclusions from this study. This is due to the fact that as the number of turbines in a row further increases, the impact from turbine standstill onto the AWC benefits from that row gets more and more insignificant.
- Distances between turbines: 5D, 7D, 10D. As pointed out above, these cover typical offshore spacings.
- Wind direction: 274 deg at 5D, 273 deg at 7D and 272 deg at 10D. These are chosen so as to get approximately half-wake situations downstream, because under such conditions the optimal yaw misalignments, and hence the impact from turbine standstill, are highest.
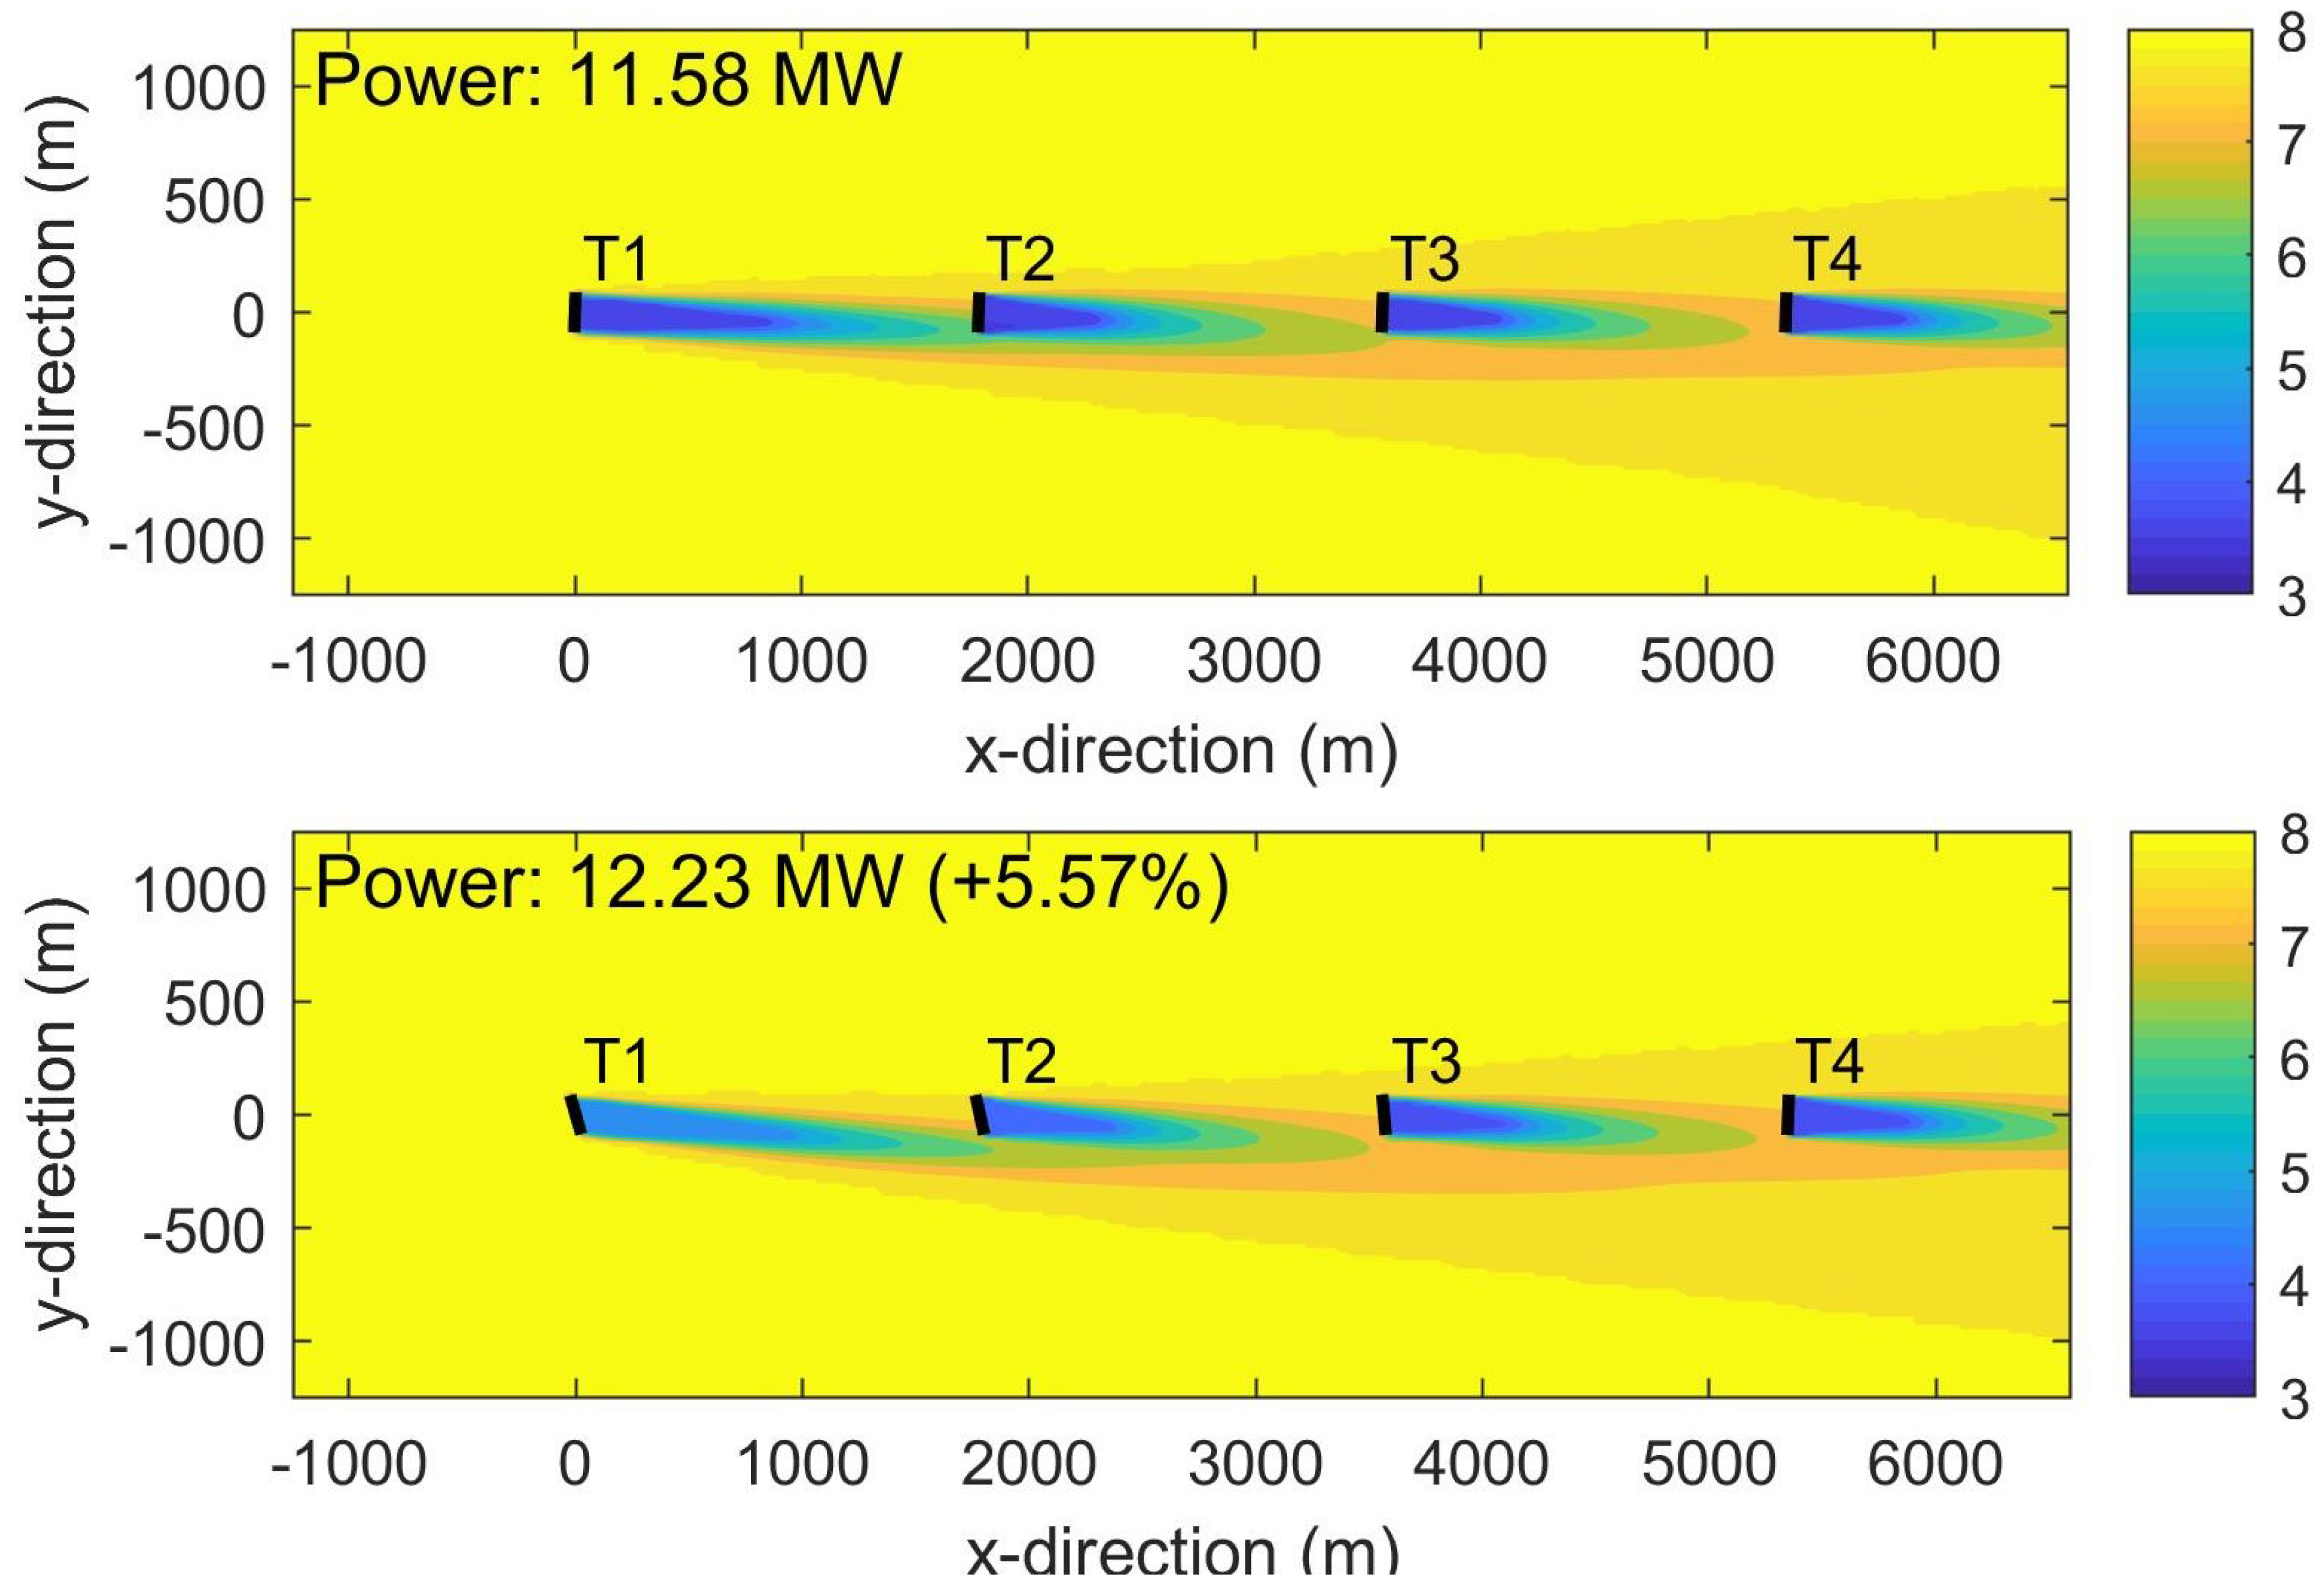
The number of wind turbines and the distances between those are varied independent on each other, while the wind direction depends on the distance between the turbines. This results in a total of nine cases. Wind direction from the North is denoted as zero, increasing clockwise. The row of turbines is oriented from west to east, i.e., 270 deg–90 deg, and the wind directions are chosen to result in approximately half wake situation at the downstream turbines in all cases. The top plot on Figure 1 illustrates the case of a row of four turbines spaced at a distance of 10D, and wind direction of 274 deg, where the color represents the wind velocity. The plots in Figure 1 are generated using the FLORIS model, see Section 3.
The wind turbine type, selected in this study, is the DTU 10 MW reference wind turbine [14], which has a rotor diameter of 178.3 m. A wind speed of 8 m/s, and a turbulence intensity of 6% are used in all cases. For each of the above-mentioned cases, the wake redirection control has been applied by optimizing the yaw misalignment angles of all turbines but the last one. The optimization criterion is to maximize the power production of the row. As an illustration, the bottom plot in Figure 1 shows the wakes behind the turbines under wake redirection control for the case of 4 turbines spaced at 10D. The relative power increase in this case is 5.57% and increases as the distance gets shorter (for reference, at 5D the relative power gain is 10.91%). The relative power increase, or power gain, is computed as [%], wherein is the power production of the whole row under AWC, and is the nominal power production. As an indication, the optimal yaw misalignment angles for the different turbines vary in the range of 10–25 deg in all considered cases. These will be discussed in more detail later on.
In the sequel, the impact of wind turbine(s) being out of operation (e.g., due to failures, or maintenance/repair activities) on the power gain by AWC will be analysed. Before that, however, first a few words are dedicated on the probability that one, or more, turbines within the row being down.
2.3. Availability of a Row of Wind Turbines
The availability of offshore wind turbines, , is nowadays as high as 95% and even higher. Even if one single turbine is standing still due to failures, maintenance or repair activities, it will affect the AWC operation of the whole row it is part of. As a row consists of a number of turbines, say N, the row availability as a whole will be . As an example, for a row of ten turbines and a turbine availability of 95%, the row availability is approximately . Since the standstill of even a single turbine might negatively effect the performance of the AWC algorithm, and given the relatively high period of time that this situation is expected to be in place, it seems important to understand the implications of standstill on AWC. To this end, simulations will be performed for the layouts and conditions, described in the previous section.
In these simulations, one or several wind turbines should be modelled as not operational, while the other wind turbines should be simulated with their yaw misalignment. The total number of combinations of wind turbines standing still, equal to , is too large to consider through simulations. To limit the number of simulations to a reasonable number, we need restrict the study to just a few turbines being down at the same time. It seems reasonable to base this choice on the probability that a given number of wind turbines, say , will be not-operational at the same time. Assuming that turbine availabilities are independent on each other, the probability that exactly r turbines are down at a the same time equals
Here, is the probability that one specific set of r turbines is down, and gives the number of possible such sets. As an illustration, Table 1 lists these probabilities for any number r of turbines standing still for the three different lengths of rows chosen above. A single turbine availability of is used. It can be observed from the table that the probability that all turbines are available at the same time (first data column) is rapidly decreasing with the row getting longer, so for large wind farms the chances are high that, for any given row of turbines, AWC will often operate with at least one turbine being shut down. However, the second and the third data columns indicate that the chances that one or two wind turbines are down are also considerable and can’t be neglected. The probability for three or more turbines being out of operation, however, gets too small to necessitate consideration in the analysis. Even for the longest row considered, this situation will happen just about 1% of the time, so the impact on AWC will be insignificant.
Based on the discussion above, it is decided to limit the analysis here to simulations with no more than 2 turbines down, which still results in a large, though manageable, number of cases. As an indication, in the ten turbine row case, the number of combinations of no more than two turbines being not operational is 56. Below, the results from the analysis of the impact of turbine unavailability on AWC are presented, first for the case of one single turbine down, and later on for two turbines down at the same time.
2.4. Impact of One Turbine down on AWC
Let us first consider the case that one single turbine (any one) in the row is not operational, and study the effect on the relative power gain by wake redirection AWC. This is to investigate the consequences of keeping the nominal AWC strategy running when one turbine is down. By nominal AWC is meant operating the row with the nominal yaw misalignment angles, optimized for a fully operational row.
To this end, simulations are performed for all cases in terms of row length and inter-turbine spacing, described in Section 2.2, both for the nominal case with all turbines being operational as well as with any individual turbine being down. The simulations are conducted using the FLORIS wind farm model [6]. Figure 2 depicts the results in terms of relative power gain, calculated as the percentual ratio between the power production of the operational turbines with and without AWC. These gains are depicted for:
- the considered three cases of row lengths: top plot corresponding to row length of 4 turbines, the middle plot for row of 7 turbines, and the bottom one—for a row of 10 turbines.
- the considered distances between the turbines in each row: blue (left within each stack) bars corresponding to a distance of 5D, red (middle) bars for distance of 7D, and orange (right) bars—for 10D. It can be observed that, as expected, in most cases the power gain is higher for the shortest distance of 5D and gets lower as the distance increases. This is due to the fact that the wake effects decrease with the distance getting larger, and the lower the wake effects the less can be gained back by AWC.
- normal operation of all turbines of each row (nominal case): these are represented by the left-most stacks of three bars in each plot, labelled “All normal”. These bars represent the relative power gain by AWC when all turbines are operating normally.
- operation with one turbine down: these are represented by the remaining clusters of bars, labelled “T1 down”, “T2 down”, etc. These represent the relative gain by AWC when one single wind turbine (T1, or T2, etc.) is out of operation. Here, the wide bars (with colors blue, red and orange) represent the gain with AWC using the nominally calculated yaw misalignment angles, i.e., these indicate what would happen if, after a turbine is shut down, AWC is kept operational without modifications to the yaw misalignment angles. If the yaw misalignment angles would be re-optimized for each specific case of a turbine down (which might be quite complicated in a real-life application), then the relative gains increase to the levels indicated by the narrow grey bars.
The most important observation from Figure 2 is that the relative gains remain positive in all cases of a single turbine down. This implies that when a single turbine is shut down, the row of turbines to which it pertains can still be operated using the nominally computed yaw misalignment angles and there will still be power increase with respect to the case without AWC. This implies a certain level of robustness to a single turbine unavailability.
Notice that the robustness argument does not imply that the nominal yaw misalignment angles, optimized for the case when all turbines are operational, also remain optimal during turbine standstill. This is not the case, as can be seen from the narrow grey bars in Figure 2 that depict the maximal achievable gain after re-optimization of the yaw misalignment angles. However, the to be won additional gain through reconfiguration of AWC seems quite limited in most cases, especially for the rows of 7 and 10 turbines. For the 4 turbine row case, the shutdown of a single turbine has a more pronounced effect on the relative gain than for the longer rows, which is of course expected.
Also interesting to observe in Figure 2 is that the second turbine in each row, , has the largest impact on the achievable relative power gain. This suggests that a simple reconfiguration scheme, that is activated only when is shut down, and that switches the AWC operation to yaw misalignment angles optimized (off-line) for that specific situation, may seem interesting to consider. Figure 3 depicts the yaw misalignment angles for the case of being down, both the nominal ones (wide blue, red and orange bars) and the reoptimized ones (the narrow grey bars). The most significant change is observed at the first turbine, , where the yaw misalignment angles drop by approximately factor 2. This is not surprising as the distance to the first turbine downstream doubles with being not operational. Hence, switching to reoptimized yaw angles after shuts down, or maybe even just decreasing the yaw misalignment to 50% of its nominal value, may lead to some interesting improvement of the power gain by AWC, especially for shorter rows of turbines. However, given the probability for this situation taking place (4.3% for the 4 turbine row), the impact on the annual energy production (AEP) is expected to remain rather limited. In all other cases of a single turbine down, the nominal yaw misalignment angles can just be kept unchanged, as the very limited potential power gain improvement does not seem to weigh enough against the increased complexity of implementing an AWC reconfiguration mechanism in real-life.
2.5. Impact of Two Turbines down on AWC
In the previous subsection, the impact of a single wind turbine standstill on the power gain by AWC was studied. Besides this case, in Section 2.3 it was argued that the probability of two turbines standing still at the same time is also not negligible and needs to be considered in the analysis. This is done here.
Again, a range of simulations are performed for all cases in terms of row length and inter-turbine spacing, described in Section 2.2, including standstill of any pair of wind turbines being out of operation. Figure 4, Figure 5 and Figure 6 depict the results in terms of relative power gain, calculated as the percentual ratio between the power production of the operational turbines with and without AWC. These figures are constructed in a similar manner as Figure 2, with the only difference that there are now much more combinations of pairs of turbines down. Each figure represents one particular number of turbines in a row (4, 7, and 10), and the thick colored bars represent the results for the three different turbine distances considered (5D, 7D, and 10D). The pair are labelled with the respective turbine numbers, e.g., in Figure 4 represent the case of the first two turbines of the row of four turbines are down, while the remaining turbines ( and ) are operational. The narrow grey bars, where visible, indicate the maximal achievable power gain by reoptimization of the yaw misalignment angles for the specific situation in place.
Contrary to the case with a single turbine down, there are a few situations now where the relative power gain by AWC gets close to zero or even becomes negative. These situations all happen at the shortest row considered (Figure 4), and involve at least turbine or , with the worst case (power loss) not surprisingly happening when both and are down.
The impact of a pair of turbines not operational onto the AWC power gain is less pronounced for the longer rows of turbines (Figure 5 and Figure 6). There, no power loss is observed in any situation, implying that for rows of turbines longer than just a few turbines, AWC is quite robust with respect to any pair of turbines being not operational. This is an important observation, as it indicates that in modern offshore wind farms, consisting of long rows of turbines, the nominal yaw misalignment angles could be kept unmodified even when two turbines are down, and still have close to optimal power gain in most cases. Still, there is some improvement possible by AWC reconfiguration in a number of cases, especially being not operational. However, given the low probability of occurrence of these cases (an order of magnitude lower than the probability for any two turbines being not operational, listed in Table 1), the impact of any such reconfiguration strategy on the AEP will be insignificant and will not weigh against the increased complexity.
3. Materials and Methods
The simulations performed in this study are done using the MatLab implementation of the FLORIS wind farm model [6,15], developed by the TU-Delft. The code is open source and freely available through the TU-Delft GitHub repository https://github.com/TUDelft-DataDrivenControl/FLORISSEunderlinetag|M. The FLORIS software includes code for optimizing the yaw misalignment angles to maximize the power production. The FLORIS input settings used in this study are listed in Table 2.
The turbine model, used in the study, is the DTU 10 MW reference wind turbine [14].
4. Conclusions
This paper presents a study on the impact of wind turbine downtime on the operation of AWC by wake redirection. It is argued that, even though the availability of offshore wind turbines nowadays is quite high, the probability of one single turbine, or a pair of turbines, being not operational is high enough to require investigation of the impacts on AWC. To this end, the study is performed by simulating a wide range of realistic scenarios encountered in current offshore wind farms.
The general conclusion from the study is that the AWC is quite robust to wind turbine standstill. It is shown that in most considered cases the nominal yaw misalignment angles, optimized for the situation of all turbines in a row being operational, deliver significant power gains even when one or two turbines from the row are down. The only case where power loss was observed was in the case when the second and the third turbine within a small row of four wind turbines are down. This is not surprising since in this case the distance from the first turbine to the next operational turbine downstream (the last, forth one) is three times larger than in the nominal case. At that distance the wake deficit is much smaller, as the corresponding power gain does not outweigh the power loss at the first turbine due to the large yaw misalignment. While a simple AWC reconfiguration strategy is easily constructable in this case, the very low probability for this situation actually taking place (around 0.2%) indicates that the actual impact on the AEP will be negligible.
The study was limited to at most two turbines down at the same time. When three, or more turbines from a given row operating with AWC are down, the impact on the power gain by AWC might be more pronounced in some cases. For instance, in the 4 turbine case there will be a power loss in all cases in which the single operational turbine is misaligned, as there is no turbine downstream that could compensate for this power loss. However, the probability analysis performed here indicates that these situations are quite unusual. Altogether, it can be concluded that the nominal AWC, designed for a fully operational wind farm, is robust enough to be used in the presence of turbines standing still, without power production loss. In fact, power increase is expected with respect to the situation when AWC is deactivated during turbine downtime.
Finally, it needs to be pointed out that this study was limited to a layout consisting of one single row of turbines, and a wind direction resulting in a half-wake situation for the downstream turbines. While these conditions have been carefully chosen to ensure that the conclusions are as generic as possible, future research should extend the study to more complex layouts, and broader range of wind conditions (wind velocities, wind directions, turbulence intensities). Additionally, it would be useful to cross-validate these conclusions with other, higher fidelity wake models, such as e.g., FarmFlow [16].
Funding
This research has received funding from the European Union’s Horizon 2020 research and innovation programme under grant agreement No 691732, and from the Topsector Energy by the Ministry of Economics, the Netherlands, under grant number TEHE116127.
Conflicts of Interest
The author declares no conflict of interest.
Abbreviations
The following abbreviations are used in this manuscript:
| AWC | Active wake control |
| AEP | Anual energy production |
References
- Corten, G.; Schaak, P. Method and Installation for Extracting Energy from a Flowing Fluid. International WO 2004/111446 A1, 23 December 2004. [Google Scholar]
- Corten, G.; Lindenburg, K.; Schaak, P. Assembly of Energy Flow Collectors, Such as Windpark, and Method of Operation. European WO 2004/011799 A1, 2 May 2004. [Google Scholar]
- Annoni, J.; Gebraad, P.; Scholbrock, A.; Fleming, P.; van Wingerden, J.W. Analysis of axial-induction-based wind plant control using an engineering and a high-order wind plant model. Wind Energy 2016, 19, 1135–1150. [Google Scholar] [CrossRef]
- Campagnolo, F.; Petrović, V.; Bottasso, C.; Croce, A. Wind Tunnel Testing of Wake Control Strategies. In Proceedings of the American Control Conference, Boston, MA, USA, 6–8 July 2016; pp. 513–518. [Google Scholar]
- Fleming, P.; Gebraad, P.; Lee, S.; van Wingerden, J.; Johnson, K.; Churchfield, M.; Michalakes, J.; Spalart, P.; Moriarty, P. Simulation comparison of wake mitigation control strategies for a two-turbine case. Wind Energy 2015, 18, 2135–2143. [Google Scholar] [CrossRef]
- Gebraad, P.; Teeuwisse, F.; van Wingerden, J.; Fleming, P.; Ruben, S.; Marden, J.; Pao, L. Wind plant power optimization through yaw control using a parametric model for wake effects—A CFD simulation study. Wind Energy 2014, 19, 95–114. [Google Scholar] [CrossRef]
- Kanev, S.; Savenije, F.; Engels, W. Active wake control: An approach to optimize the lifetime operation of wind farms. Wind Energy 2018, 21, 488–501. [Google Scholar] [CrossRef]
- Fleming, P.; Ning, A.; Gebraad, P.; Dykes, K. Wind plant system engineering through optimization of layout and yaw control. Wind Energy 2016, 19, 329–344. [Google Scholar] [CrossRef]
- Fleming, P.; Annoni, J.; Shah, J.J.; Wang, L.; Ananthan, S.; Zhang, Z.; Hutchings, K.; Wang, P.; Chen, W.; Chen, L. Field test of wake steering at an offshore wind farm. Wind Energy Sci. 2017, 2, 229–239. [Google Scholar] [CrossRef] [Green Version]
- Fleming, P.; King, J.; Dykes, K.; Simley, E.; Roadman, J.; Scholbrock, A.; Murphy, P.; Lundquist, J.K.; Moriarty, P.; Fleming, K.; et al. Initial Results From a Field Campaign of Wake Steering Applied at a Commercial Wind Farm: Part 1. Wind Energy Sci. Discuss. 2019, 4, 273–285. [Google Scholar] [CrossRef]
- Ennis, B.L.; White, J.R.; Paquette, J.A. Wind turbine blade load characterization under yaw offset at the SWiFT facility. J. Phys. Conf. Ser. 2018, 1037. [Google Scholar] [CrossRef]
- Gebraad, P.; Teeuwisse, F.; van Wingerden, J.; Fleming, P.; Ruben, S.; Marden, J.; Pao, L. A Data-Driven Model for Wind Plant Power Optimization by Yaw Control. In Proceedings of the American Control Conference, Portland, OR, USA, 4–6 June 2014. [Google Scholar]
- Fleming, P.; Gebraad, P.; Lee, S.; van Wingerden, J.; Johnson, K.; Churchfield, M.; Michalakes, J.; Spalart, P.; Moriarty, P. High-fidelity simulation comparion of wake mitigation control strategies for a two-turbine case. In Proceedings of the ICOWES2013 Conference, Lyngby, Denmark, 17–19 June 2013. [Google Scholar]
- Bak, C.; Zahle, F.; Bitsche, R.; Kim, T.; Yde, A.; Henriksen, L.C.; Natarajan, A.; Hansen, M. Description of the DTU 10 MW Reference Wind Turbine; Technical Report DTU Wind Energy Report-I-0092; DTU Wind Energy: Lyngby, Denmark, 2013. [Google Scholar]
- Teeuwisse, F.W. Cooperative Wind Farm Control. Master’s Thesis, TU-Dellft, Delft, The Netherlands, 2013. [Google Scholar]
- Bot, E. FarmFlow Validation Against Full Scale Wind Farms; Technical Report ECN-E--15-045; Energy Research Center of the Netherlands: Petten, The Netherlands, 2015. [Google Scholar]
Figure 1.
Illustration of the wakes through a row of four turbines spaced at 10D: (top) nominal operation without AWC. (bottom) operation with AWC by wake redirection.
Figure 1.
Illustration of the wakes through a row of four turbines spaced at 10D: (top) nominal operation without AWC. (bottom) operation with AWC by wake redirection.

Figure 2.
Relative power gain by AWC when one single turbine is not operational, (middle) row of 7 wind turbines, (bottom) row of 10 wind turbines.
Figure 2.
Relative power gain by AWC when one single turbine is not operational, (middle) row of 7 wind turbines, (bottom) row of 10 wind turbines.

Figure 3.
Nominal (thick bars) and re-optimized yaw misalignment angles (narrow bars) for the case when the second turbine T2 is not operational, (middle) row of 7 wind turbines, (bottom) row of 10 wind turbines.
Figure 3.
Nominal (thick bars) and re-optimized yaw misalignment angles (narrow bars) for the case when the second turbine T2 is not operational, (middle) row of 7 wind turbines, (bottom) row of 10 wind turbines.

Figure 4.
Relative power gain by AWC when 2 out of the 4 wind turbines in a row are not operational.
Figure 4.
Relative power gain by AWC when 2 out of the 4 wind turbines in a row are not operational.

Figure 5.
Relative power gain by AWC when 2 out of the 7 wind turbines in a row are not operational.
Figure 5.
Relative power gain by AWC when 2 out of the 7 wind turbines in a row are not operational.

Figure 6.
Relative power gain by AWC when 2 out of the 10 wind turbines in a row are not operational.
Figure 6.
Relative power gain by AWC when 2 out of the 10 wind turbines in a row are not operational.


Table 1.
Probabilities for standstill of a number of wind turbines within a row, based on standalone turbine availability of .
Table 1.
Probabilities for standstill of a number of wind turbines within a row, based on standalone turbine availability of .
| Nr. r of Turbines in Standstill | 0 | 1 | 2 | 3 | 4 | 5 | 6 | 7 | 8 | 9 | 10 |
|---|---|---|---|---|---|---|---|---|---|---|---|
| Row of turbines | |||||||||||
| Probability [%] | 81.45 | 17.15 | 1.35 | 0.05 | 0.00 | ||||||
| Row of turbines | |||||||||||
| Probability [%] | 69.83 | 25.73 | 4.06 | 0.36 | 0.02 | 0.00 | 0.00 | 0.00 | |||
| Row of turbines | |||||||||||
| Probability [%] | 59.87 | 31.51 | 7.46 | 1.05 | 0.10 | 0.01 | 0.00 | 0.00 | 0.00 | 0.00 | 0.00 |
Table 2.
FLORIS model settings and parameters used in the study.
| FLORIS Parameter | Value |
|---|---|
| Atmospheric inflow | Uniform |
| Wake deficit model | Porté-Agel |
| Wake deflection model | Porté-Agel |
| Wake mixing model | Katic |
| Turbine-induced turbulence model | Porté-Agel |
| Air density | 1.226 kg/m |
| Turbulence intensity | 0.08 |
| Ambient wind velocity | 8 m/s |
© 2019 by the author. Licensee MDPI, Basel, Switzerland. This article is an open access article distributed under the terms and conditions of the Creative Commons Attribution (CC BY) license (http://creativecommons.org/licenses/by/4.0/).
Share and Cite
MDPI and ACS Style
Kanev, S. On the Robustness of Active Wake Control to Wind Turbine Downtime. Energies 2019, 12, 3152. https://doi.org/10.3390/en12163152
AMA Style
Kanev S. On the Robustness of Active Wake Control to Wind Turbine Downtime. Energies. 2019; 12(16):3152. https://doi.org/10.3390/en12163152
Chicago/Turabian StyleKanev, Stoyan. 2019. "On the Robustness of Active Wake Control to Wind Turbine Downtime" Energies 12, no. 16: 3152. https://doi.org/10.3390/en12163152
Note that from the first issue of 2016, this journal uses article numbers instead of page numbers. See further details here.