Optimum Design of a Transportation Scheme for Healthcare Supply Chain Management: The Effect of Energy Consumption


1
Department of Industrial Engineering, Hanyang University, Seoul 04763, Korea
2
Department of Industrial & Management Engineering, Hanyang University, Ansan, Gyeonggi-do 15588, Korea
*
Author to whom correspondence should be addressed.
Energies 2019, 12(14), 2789; https://doi.org/10.3390/en12142789
Submission received: 1 June 2019
/
Revised: 8 July 2019
/
Accepted: 16 July 2019
/
Published: 19 July 2019
(This article belongs to the Special Issue Application of Renewable Energy in Production and Supply Chain Management)
Abstract
:The perishability of blood platelets complicates the management of their supply chain. This paper studies the impact of energy consumption and carbon emissions of transportation activities in a blood platelet supply chain. Energy consumption and carbon emissions vary significantly, and the effective location-allocation of blood facilities is a key strategy for the optimal use of energy. The total cost of the supply chain for perishable products is minimized when energy consumption is optimized. The proposed model is too complex to be solved with existing methodologies; therefore, mathematical tools are used to solve it. A numerical experiment is carried out to validate the proposed model, and graphical representations are presented for better visualization of the study’s outcomes. The results of the numerical studies confirm that the selected locations of blood facilities are optimal for the maximization of energy efficiency and minimization of the total cost.
1. Introduction
The operational management of any healthcare sector is becoming one of the most widely explored research fields. There has been an increasing demand for more systematic and efficient planning in order to meet the high standards of the healthcare sector. Platelets, a blood component with a high perishability rate, are considered to be a life-saving and valuable resource, and many patients’ lives are dependent on their availability. Platelets are needed daily in almost every hospital as a life-saving measure for patients suffering from serious diseases and conditions, such as cancer, low platelet levels, bone marrow transplants, etc. Platelets can be collected from a donor by two different methods. The first is the traditional technique in which whole blood is drawn, and platelets must then be separated from other blood components within five hours of the donation. The second method is the “apheresis method”. This technique not only saves time but also allows the other blood components to be returned to the donor’s body immediately after isolating and collecting the platelets. Compared with the traditional technique, this method can be costly, but it is more efficient and can produce 6–10 times the number of platelets. Therefore, fewer donors are needed to produce the same number of platelets as the traditional method. Using the “apheresis method” can reduce the time interval between donations: donating whole blood is allowed every 56 days, while donors whose platelets are extracted using the “apheresis method” are eligible to donate platelets every seven days. In platelet supply chain management, the first step is to transfer donor platelets from blood facilities to a blood center. The latter not only tests, processes, stores, and distributes platelets to their demand points but also serves as a potential site for platelet donation. Blood platelets collected from different blood facilities must be transported to a blood center for the required tests before they are delivered to hospitals. Figure 1 shows the flow of the supply chain network of blood platelets.
A major challenge that complicates the supply chain management of platelets is their high perishability compared with other blood components. It has been proved that the lifespan of blood platelets ranges from five to seven days (Michael [1]); thus, their inventory must be managed efficiently. The limited shelf life of platelets is the reason that donors are always needed. The importance of platelet donation can be illustrated by the fact that one platelet donation can save the lives of three adults or 12 children, while 4–6 whole blood units can save only one patient (according to the NHSBT).
The objective of this paper is to develop a healthcare supply chain model that minimizes the total cost and energy consumption of the network by determining the optimal locations of mobile and fixed blood facilities to fulfill the demand of the demand points. The remainder of the paper is arranged as follows. Section 2 provides a brief literature review of the prior research pertinent to sustainable supply chain networks and problems encountered in the design of a blood supply chain network. Section 3 includes the problem definition and model formulation. In Section 4, a solution methodology is discussed, and numerical experiments are presented. Finally, conclusions and future research of the proposed model are given in Section 5.
2. Literature Review
Recently, the development of mathematical models to optimize the supply chain of blood platelets has drawn the attention of many researchers, and the number of studies in this field has increased significantly.
2.1. Healthcare Supply Chain Management
One of the main reviews with a focus on supply chain management in healthcare is the work of Nahmias [2]. This paper was the first to examine the relevant literature on the challenges faced when determining suitable ordering policies for both fixed-life perishable inventory and inventory characterized by continuous exponential decay. However, the review did not address the supply chain for blood and its components. Sha et al. [3] proposed an emergency blood supply scheduling model that primarily provides decision-making support for emergency blood supply without considering the effect of energy consumption. Jabbarzadeh et al. [4] specified a robust model of network design with a cost objective function of blood supply during and after disasters. Issues related to energy consumption were not studied in their paper. Using a real case study, Katsaliaki et al. [5] considered a game-based decision-making approach for delivering perishable products from donors to patients using the UK blood supply chain, but energy consumption and its related issues were not considered.
Duan and Liao [6] implemented a blood supply chain simulation-optimization framework with the objective of minimizing the outdate rate of blood, but they did not incorporate the effects of energy consumption. Arvan et al. [7] formulated a model for optimizing the blood supply chain network. They took several products and deterministic parameters into account and used the CPLEX solver to solve the model by using GAMS. Giannakis and Papadopoulos [8] addressed the operational perspective to achieve a sustainable supply chain by considering the risk management process, although energy-related concepts were not investigated. Osorio et al. [9] considered an integrated simulation-optimization model to take into account uncertain supply and demand, blood group rate, duration of validity constraints, and blood supply chain collection and production methods. Zahiri et al. [10] focused on the development of a healthcare supply chain network that accounts for blood group compatibility but excludes the effect of energy.
Ramezanian et al. [11] applied a mixed-integer linear model to the design of a blood supply chain network. They assumed that different social factors, such as distance, advertisement cost, and experience, affect the process of the decisions made by donors. The energy consumption factor was not included among the considered factors. Paydar et al. [12] provided a robust optimization model to design a bi-objective multi-period blood supply chain network for implementation during a disaster. They incorporated three echelons, namely, supply, processing, and delivery. The concept of energy consumption was not included in this study. Najafi et al. [13] looked at the uncertainty of blood demand and supply and the possibility of blood transshipment, but they did not consider the perishability factor or the effect of energy. Ensafian et al. [14] considered a platelet supply chain in which the demand is age-differentiated by the type of patient. Considering the apheresis method and the traditional method of platelet production, two mixed-integer programming models based on First In First Out and Last In First Out policies were developed.
Hosseinifard and Abbasi [15] focused on the design of a two-echelon blood supply chain with inventory centralization in the second echelon. They showed that centralizing hospital inventory is a key factor that can improve the sustainability and resilience of the blood supply chain, but the concept of energy consumption was neglected. Samani et al. [16] proposed a blood supply chain for disaster relief using a multi-objective mixed-integer linear programming model, which did not include the influence of energy consumption. Eskandari et al. [17] formulated a possible optimization model for a sustainable blood supply chain with multi-period and multi-objective data to address the uncertain conditions that exist during and after a disaster. The concept of energy consumption was not included in this study, and the perishability factor was not a part of the developed model. A two-stage stochastic programming problem for red blood cells was introduced by Hamdan and Diabat [18]. It simultaneously accounted for production, inventory, and location decisions, but the effect of energy consumption was not considered. Furthermore, healthcare supply chain management was not studied. The main optimization model of this paper is formulated on the basis of the mathematical formulation of Eskandari et al. [17], who designed a possibilistic model for multi-objective and multi-period sustainable blood supply chain in the presence of uncertainty due to unforeseeable conditions during and after a disaster.
2.2. Sustainable Energy-Efficient Supply Chain Management (SEESCM)
Beamon [19] studied the opportunities and challenges, such as energy availability and environmental protection, that might face the supply chain in the future, as well as their effects on the management, design, and integration of the supply chain. The author studied the supply chain from a general perspective without specifying the type of supply chain. Rentizelas et al. [20] addressed the logistics of biomass, which is a renewable energy source, and the storage problem in a multi-biomass supply chain. In this paper, the authors focused only on the biomass supply chain. Halldórsson and Kovács [21] designed logistics solutions to the issue of climate change to determine a sustainable supply chain while accounting for energy efficiency. However, the supply chain of a perishable product for healthcare was not discussed in this paper. Gold and Seuring [22] conducted a literature review of logistics issues and supply chains in bioenergy production. Healthcare supply chain management was not considered in this review. Although Pan et al. [23] reviewed some implementation strategies of a waste-to-energy (WTE) supply chain in a circular economic system, they did not study the healthcare supply chain management of perishable products.
Luthra et al. [24] used Analytical Hierarchy Process to evaluate the obstacles that may be faced when adopting sustainable production and energy consumption in a supply chain. However, they did not include healthcare supply chain management in this study. Hong et al. [25] conducted a multi-regional structural analysis of the consumption of energy in a construction supply chain. They focused only on the impact of energy consumption in the construction industry in China and did not consider any healthcare issues. Marzband et al. [26] evaluated energy management systems in real-time for smart hybrid home microgrids but did not assess the supply chain of perishable products in the healthcare sector. Aziziankohan et al. [27] investigated the impact of queuing theory on the reduction of waiting times, the optimization of energy consumption in a green supply chain, and the decrease in pollution. Issues related to healthcare were not explored. Centobelli et al. [28] conducted a review of energy efficiency and environmental sustainability in the context of supply chain management to identify research gaps and research trends; however, healthcare supply chain management was not mentioned.
Singh et al. [29] investigated the performance of a food supply chain and its dependence on the performance of the participants to achieve an energy-efficient and sustainable supply chain; the topic of healthcare supply chain management was not studied. Sarkar et al. [30] evaluated the effect of energy and the failure rate in a multi-product smart production system. However, healthcare supply chain management of perishable products was not explored. Sarkar et al. [31] worked on developing a multi-objective optimization model. Their objectives were to minimize total costs, carbon emissions, and the cost of energy consumption, although they did not include issues related to healthcare supply chain management. Marchi et al. [32] formulated a two-stage model while considering the opportunity to invest in new energy-efficient solutions with better performance and better financial conditions, and members of the supply chain exerted an important influence. Healthcare supply chain management was not a part of this study. Fontes et al. [33] identified the latest dynamic system contributions and trends in a renewable energy supply chain without studying the healthcare supply chain of perishable products.
2.3. Green Supply Chain Management
Zhu et al. [34] presented a study on green supply chain management in the automobile industry of China but did not cover the healthcare sector. Srivastava [35] reviewed the literature on green supply chain management; however, the healthcare sector was not addressed, and the effect of energy was not introduced. Yeh and Chuang [36] developed an optimum model for the selection of green partners. The study had four metrics: cost, time, product quality, and appraisal score. The effect of energy was not considered in this study, and the healthcare sector was not examined. Hua et al. [37] investigated possible methods for managing carbon footprints in inventory with a carbon emissions technique. Kumar et al. [38] focused on green supply chain practices that could be adopted by electrical and electronics manufacturing industries. The authors specified the field of application of the study. The optimum consumption of energy was not considered, and the healthcare sector was not studied.
Pan et al. [39] provided an optimization model to reduce greenhouse gas emissions from freight transport. Neither the effect of energy nor healthcare supply chain management were applied. Bazan et al. [40] introduced two models of greenhouse gas emissions from production and transportation activities. They included energy consumption and examined different decisions but did not study any healthcare-related issues. Ahmed et al. [41] focused on the effect of carbon emissions in a sustainable second-generation supply chain of biofuel with a cost minimization objective. However, the effect of energy consumption was not included, nor was the healthcare supply chain management of perishable product studied.
2.4. Traditional Supply Chain Management with a Single Objective
Sarkar [42] developed a model of product inventory for a deteriorating product in a two-echelon supply chain in which he assumed only probabilistic deterioration with multiple distributions, but he did not consider healthcare or energy issues. In another study, Sarkar et al. [43] developed a mathematical model with the aim of reducing the total cost of the supply chain while considering the variable costs of transportation and carbon emissions due to multiple shipments. Energy consumption was not considered in the model, and healthcare supply chain management of perishable product was not studied. Habib and Sarkar [44] designed a location-allocation model composed of a two-phase framework for sustainable debris management during disasters given an uncertain environment. The concepts of healthcare and energy consumption were not considered in the study. Sarkar et al. [45] developed an integrated inventory model that was based on variable transportation costs to maintain a single-setup multi-delivery policy for the reduction of transportation costs. However, healthcare and energy consumption were not investigated.
Feng et al. [46] studied an integrated inventory model consisting of a single supplier and several buyers with shared warehouse capacity via transshipment. They did not consider healthcare or energy issues in this study. Sarkar et al. [47] analyzed multi-level delay-in-payment, variable transportation costs, and variable carbon emission costs in order to minimize the total costs of a sustainable supply chain under a policy of single-setup multi-delivery without mentioning specific products. The effects of energy consumption and healthcare supply chain management were not included in the study. Shi et al. [48] incorporated the development of a supply chain with demand uncertainty in different power structures to investigate the effect of sustainable investment on profit and emissions. Energy and healthcare issues were not addressed.
Iqbal et al. [49] analyzed two types of supply chains. The objective was to minimize total cost per unit time in the network. In the first supply chain, the products of both systems were deteriorated; in the second one, the products of the first supply chain were deteriorated. Neither the impact of energy consumption nor healthcare issues were studied. Mishra et al. [50] provided a mathematical model for a sustainable electricity supply chain with the assumption of linear price-dependent customer demands. In the proposed model, price was a decision variable for carbon emissions and setup costs, but energy consumption was not a studied factor. They did not consider healthcare supply chain management in their research.
From reviewing the literature, a research gap is apparent. The following main research contributions are presented to close some of these gaps in the study of blood supply chain network design. The presented paper contributes in two different ways. First, the proposed model includes various characteristics that were not considered in previous research on blood platelet supply chain management. This paper presents the design of a comprehensive blood supply chain model in which (1) the limited shelf life of blood platelets is considered, (2) the distance between nodes in the network is determined in order to maintain efficient energy consumption and reduce carbon emissions during transportation activities, and (3) decision-making related to the determination of the optimal facility location-allocation is included, with the aim of minimizing the total cost of the supply chain. Furthermore, the presented model includes other aspects that have been rarely examined by studies on the blood supply chain; these topics include methods of collecting blood platelets in mobile blood facilities and the blood diffusion process between the blood center and demand points, with multi-delivery mapping a considered factor.
- Not Applicable (NA) means that the concept was not studied in the specified paper;
- Applicable means that the concept was covered by the specified paper.
Table 1 illustrates the novelty of the presented research. The listed studies were found by using the following keywords: supply chain management and optimum energy, blood collection, platelets, location, and perishability. Each research paper presented in the above literature review was studied while considering these keywords. The investigation of each research paper aimed to verify whether each concept was applicable or not applicable to identify gaps in the literature. To the best of the authors’ knowledge, no research has combined the five concepts in one paper.
3. Problem Definition, Notation, and Assumptions
This section defines the problem and provides the notation and assumptions of the proposed model.
3.1. Problem Definition
The supply chain under study consists of fixed blood facilities, mobile blood facilities, blood centers, and demand points (hospitals). Depending on the working hours of the employees and the daily demand for platelets, the location of mobile blood facilities varies from one period to another. Platelets can be donated at a mobile blood facility (MBF), a fixed blood facility (FBF), or even at a blood center. The platelets collected in mobile blood facilities are delivered by the mobile facility itself to the designated blood center in the region once the daily demand is met or the employees’ working hours end. Efficient location-allocation of mobile blood facilities that considers the distance between candidate locations and the blood center can have a significant positive effect on energy consumption and can thus lead to cost reduction. On the other hand, the location of fixed blood facilities is an important decision that must be made carefully in order to guarantee the sustainability of the healthcare supply chain and ensure that transportation activities between fixed blood facilities and the blood center are carried out with consideration given to energy consumption. Blood platelets collected in a fixed blood facility are transported to the assigned blood center by specific vehicles with optimal energy consumption and known capacities. These vehicles must return to their starting point after completing their mission to prepare for the next mission. The platelets received by the blood center are subjected to several tests for a maximum of two days to verify that the blood is free from diseases. The blood is then classified according to its age, followed by storage and preparation for distribution to demand points. Blood centers then have to meet the demands of each hospital by assigning one energy-efficient vehicle to each route to visit one or more demand points in each trip during the planning period t. By the end of the planning period t, these vehicles must return to their starting points (the blood center). A method used to draw platelets is the “apheresis method”, which is able to produce more platelets than the traditional method; thus, fewer donors are needed to produce the daily demand for platelets.
The proposed model for platelet supply chain management that incorporates the effect of energy, therefore, aims to minimize the overall cost of the supply chain. The notation in the model’s formulation consists of indices, decision variables, and parameters and is given in Appendix A. The assumptions of this problem are specified in Section 3.3. The flow diagram of healthcare supply chain management with optimal consumption of energy is given in Figure 2.
3.2. Notation
The notation used in this paper is provided in Appendix A.
3.3. Assumptions
To structure the proposed model, the following assumptions were made to specify boundaries in the formulation of the model.
- The effect of energy is considered with optimal energy consumption in a healthcare supply chain [51] for blood platelets.
- The speed of each vehicle is considered to be fixed [57]. Thus, energy consumption is maintained, and each vehicle starts and ends its trip at the starting point [58]. The distances between the nodes of the supply chain are known, and the number, locations, and capacities of the MBF, FBF, blood center, and delivery vehicles for optimal energy consumption are known [59].
- Only blood platelets are considered in this study, and their lifetime L is known and limited [60]. The age a of the platelet units is known (less than three days: young; more than three days: old) [61]. Only a mobile blood facility is able to move from one site to another in the next planning period t, and its movement to another site depends on the working hours of the employees and whether the required quantity is achieved [62].
- The transportation costs, including carbon emissions and energy consumption [63], are proportional to the distance traveled.
- Blood wastage refers to the rate of lost blood during the testing process. Thus, wastage costs are incurred. The expired quantity of blood ( and in blood centers and fixed blood facilities, respectively) imposes extra costs. It is assumed that the volume of 1 unit of blood platelets is fixed and equal to 180 mL.
4. Model Formulation
The main objective of the proposed mathematical model is to minimize the total cost of the blood platelet supply chain by incorporating the effect of the energy expended by delivery activities between network nodes. Minimizing the total cost of a supply chain is always a central focus. The main objective of the proposed model is an economic objective in which the total cost of the supply chain is minimized, and the optimal locations of mobile blood facilities and fixed blood facilities are determined.
4.1. Transportation Costs Due to the Effect of Energy
Minimizing transportation costs can lower the total cost of the supply chain by a considerable amount. Transportation costs are considered to have a significant role in supply chain management. The overall transportation cost determines the costs related to the transportation activities between nodes in the network.
Transportation costs from a fixed blood facility to a blood center with optimal energy consumption
The fixed transportation costs due to the effect of energy consumption per km with the optimal consumption of energy is multiplied by the distance between the fixed blood facility and the blood center to determine the total fixed costs. The total carbon emission costs are determined by multiplying the cost of CO per km by the total distance between the fixed blood facility and the blood center . Thus, the following expression is determined:
Transportation costs from a mobile blood facility to a blood center with efficient energy consumption
To determine the transportation costs required during the delivery of blood platelets collected from the location of a mobile blood facility to the blood center, the fixed transportation costs due to the effect of energy per km are multiplied by the total distance between two nodes in the network . The carbon emission cost is obtained by multiplying the total distance by the cost of CO per km, i.e., . Thus, the below expression is obtained:
Transportation costs due to energy efficiency from a blood center to hospital
The fixed transportation costs per km with optimal consumption of energy are multiplied by the total distance between the blood center and the hospitals , and the total carbon emission costs are determined by multiplying the carbon emission cost per km and the total distance covered during the delivery process . By the implied summation, the total transportation costs are calculated by the following expression:
Moving costs of a mobile blood facility
A mobile blood facility can change its location in each planning period. To determine the moving costs of a mobile blood facility, the fixed transportation costs per km with optimal energy consumption are multiplied by the total distance that a mobile blood facility covers when moving from one location to another during planning periods . The carbon emitted by the mobile blood facility is calculated by multiplying the carbon emission cost per km by the distance ; thus, the following summation is formulated:
4.2. Inventory Holding Costs
Inventory holding costs are the costs associated with storing the blood platelets that remain undistributed. These costs represent one component of the total inventory costs, along with shortage costs and ordering costs.
Inventory holding costs at a blood center
Holding costs are incurred to keep platelets in the blood center’s inventory. The holding costs of blood units in the blood center are based on the inventory level. Thus, the unit holding cost at a blood center is multiplied by the inventory level of blood platelets in the blood center. Consequently, the inventory holding costs at the blood center are calculated by the expression below:
Inventory holding costs at a fixed blood facility
Similar to inventory holding costs at the blood center, fixed blood facilities have inventory costs that are obtained by the following expression:
4.3. Shortage Costs
The shortage cost is calculated by multiplying the cost of one unit of shortage in blood with age a by the quantity of the shortage in blood during the planning period t. Thus, the following expression is obtained.
4.4. Wastage Costs
The wastage cost represents the quantity of blood consumed during the testing process. This cost is calculated by first summing the quantity of the blood delivered from the blood facilities to the blood center and the quantity of blood platelets collected at the blood center ; then, this sum is multiplied by the production costs for one unit of blood platelets at the blood center. Thus, the following expression is obtained:
4.5. Perishable Blood Costs
Because blood platelets are perishable products, after a certain time, they cannot be used to save lives and will be deteriorated. Thus, the costs related to outdated blood platelets are regarded as perishability costs. Blood platelets can be stored in the inventory of either the blood center or the fixed blood facility. Therefore, perishability costs apply to both locations.
Perishable blood costs at a blood center
The costs of expired blood are obtained by multiplying the cost of one expired blood unit by the total quantity of expired blood units , where is the perishability rate at the blood center. Thus, the following expression is obtained:
Perishable blood costs at a fixed blood facility
The costs of outdated blood are obtained by multiplying the cost of one expired blood unit with the total quantity of expired blood units , where is the perishability rate at a fixed blood facility. Thus, the following equation is used:
4.6. Operational Costs
Operating costs are the expenses related to the operation of each blood facility and blood center in order to produce and collect blood platelets. Thus, operational costs at mobile blood facilities, fixed blood facilities, and blood centers are calculated using the expressions defined below.
Operational costs at a mobile blood facility
Blood platelets are drawn using the apheresis method, so the costs of producing platelets at a mobile blood facility are obtained by multiplying the quantity collected by the unit operational cost at the mobile blood facility in one period. Thus, the following expression is obtained:
Operational costs at a fixed blood facility
The operational costs of producing blood platelets through the apheresis method at a fixed blood facility are obtained by the below expression, in which is the quantity of platelets collected using the apheresis method at the fixed blood facility during the planning period t, and is the unit operational cost at the fixed blood facility in period t.
Operational costs at a blood center
Operational costs refer to the costs of producing platelets through the apheresis method at a blood center, and they are calculated by multiplying the quantity of platelets by the unit operational cost at the blood center. The operational costs at the blood center are calculated by the expression below:
Production costs at a blood center
The collected blood platelets must undergo several tests in the blood center for a period of two days to confirm that the platelets are disease-free before being transferred to the patient’s body. Thus, the production costs are calculated by multiplying the unit operational cost at the blood center by the quantity of blood platelets collected from donors at mobile and permanent blood facilities and the blood center in planning period t, where . Thus, the below expression is applied:
4.7. Establishment Costs
Establishment costs or setup costs are the costs related to establishing fixed blood facilities at candidate locations and setting up mobile blood facilities to collect blood platelets from different sites. These costs also include the setup costs of the delivery vehicles needed to distribute the blood platelets between nodes in the supply chain.
Fixed costs of opening a fixed blood facility
The costs of establishing a fixed blood facility are obtained by multiplying the costs of establishment by the binary variable , which is equal to 1 if a fixed blood facility is opened at location k and 0 otherwise. The summation of the establishment costs is represented below.
Fixed costs of setting up a mobile blood facility
The costs of establishing a mobile blood facility are obtained by multiplying the costs of establishment by the binary variable , which is equal to 1 if a mobile blood facility is opened at location and 0 otherwise. The summation of the establishment costs is represented below.
Fixed costs of setting up delivery vehicles
To deliver the blood, vehicles with specific equipment must be available, and the costs of setting up such vehicles are calculated as shown in the expression below, i.e., by multiplying the costs of setting up the delivery vehicles by a binary variable that is equal to 1 if a vehicle with capacity is set up and 0 otherwise.
4.8. Constraints
The constraints of the designed model are presented in this subsection.
The first constraint is that only one blood center of size is open at location j. is a binary variable that is equal to 1 if a blood center with capacity is established at site j.
Constraint (19) states that one fixed blood facility can be established at location k with capacity .
Constraints (20) and (21) stipulate that each blood facility, whether mobile or fixed, is assigned to one blood center.
Constraint (22) indicates that only one mobile blood facility can move from location to location in each period t.
Constraint (23) ensures that a mobile facility cannot move to a location where a mobile blood facility has already been located.
Constraints (24) and (25) state that the collected blood from each mobile and fixed blood facility should be appropriate given their maximum capacities and , respectively.
Constraint (26) specifies that the blood collected in each mobile and fixed blood facility for delivery to the blood center should not exceed the maximum capacity of the blood center.
Constraint (27) indicates that the amount of wasted blood should be included when determining the amount of blood produced in the blood center at site j.
Constraint (28) ensures that hospitals can be allocated to blood centers only if a blood center is open.
Constraint (29) stipulates that each hospital can be assigned to only one blood center.
Constraint (30) shows that shortage is allowed but should not exceed the maximum shortage permitted for blood with age a in blood center j during planning period t.
Constraint (31) addresses the number of blood centers that can be assigned to hospitals; specifically, one blood center can be assigned to more than one hospital.
Constraint (34) indicates that the total produced quantity of blood platelets in period t must fulfill the total demand in period t.
Constraint (35) specifies that the demand of hospital must be fulfilled by a single vehicle.
Constraint (36) ensures that the demand of the blood center can cover the demand of all the demand points in time period t.
Constraint (37) states that the blood platelets collected from all facilities can cover the demand of the blood center in time period t.
Constraints (38)–(40) demonstrate the relation between the inventory level, the perishability rate, the wastage rate, and the total quantity of collected blood platelets.
Constraint (41) is a maximization function that restricts the costs of outdated platelets to be equal to the number of platelet units in the inventory at L minus the amount of consumption in that period. The FIFO policy is applied to minimize the perishability rate. This constraint is valid for every period beyond the lifespan of the unit.
Constraints (42) and (43) calculate the blood platelet inventory level constraints at the fixed blood facilities and blood centers, respectively.
Constraints (44) and (45) specify that the inventory level of a blood center and fixed blood facilities should not exceed their maximum capacities and , respectively.
Constraints (46) and (47) represent the binary and non-negativity restrictions on the decision variables.
4.9. Objective Function
The mathematical model was developed with the objective of reducing the total cost of healthcare supply chain management by optimizing the energy consumption, which includes the minimization of transportation costs, holding costs, wastage costs, expired blood costs, and establishment costs of blood facilities and blood centers. Thus, the following expression is obtained.
4.10. Solution Methodology
To solve this model, an approach that can manage a large number of variables is required, and using classical approaches and methodologies is a time-consuming task. Thus, several mathematical techniques were deployed to obtain the optimal solution of the objective function and thus minimize the total costs by focusing on the optimum location-allocation of the blood facilities. To solve the proposed model quickly, the Lingo solver and the Facility Location Problem solver were used to generate the data and obtain the optimal results. Numerical experiments were conducted, and the results are reported in the following section.
4.11. Numerical Experiments
To validate the proposed model, the case of the city of Ansan, South Korea, was studied. In this scenario, two mobile blood facilities ( and ), two fixed blood facilities ( and ), one blood center (BC), seven hospitals, and five delivery vehicles were considered, as presented in Table 2.
The model was run on Lingo version 17.0 on an Intel(R) Core(TM) i7-3770 [email protected] GHz 3.40 GHz with a 64-bit operating system and 8 GB of RAM. The determination of candidate locations that can be visited by an MBF during a planning period is a strategic decision that should be made carefully in order to meet the daily demand of blood platelets. Thus, to ensure optimal distribution, location-allocation of the mobile blood facilities was assessed according to the population of each region, the location of hospitals, and historical data. The locations are defined by geographic coordinates (longitude and latitude). The FLP solver with Bing Maps was used to calculate the actual distances between candidate locations in the network and determine the optimal location for each mobile and fixed blood facility. For MBFs, each candidate location can be visited only once. Specifying the optimal locations at which to establish a blood facility is a critical decision and includes the consideration of many conditions, such as the population of each region, the location of hospitals, and the history of donation in each region. Table 3 shows the candidate locations of the blood facilities (MBFs and FBFs) and the fixed locations of the blood center and hospitals in the city of Ansan, South Korea.
A map is presented in Figure 3 to visualize the candidate locations of the mobile blood facilities and the fixed blood facilities, as well as the fixed location of the blood center.
Analyses were carried out to determine the optimal locations of the fixed blood facilities, and the results indicate that locations 1 and 5 are the best sites for establishing fixed blood facilities as shown by Figure 4.
Table 4 presents details of the FBF1 and FBF2 locations and their distances from the blood center. The optimum locations of the fixed blood facilities (FBF1 and FBF2) prove to be location 1 and location 5. Consequently, no mobile blood facilities are allowed to visit these locations because the maximum capacity of each candidate location is one facility, either fixed or mobile. Since the locations of the two fixed blood facilities are determined, mobile blood facilities cannot be assigned to these locations.
The results of analyses reveal that the optimal location for the first mobile blood facility (MBF1) is location 3. In the next planning period, MBF1 can move from location 3 to locations 4, 6, 7, and 8, in that order. An MBF does not have to visit all candidate locations if the required quantity of platelets is met or if the working hours of the employees are over. Once the required quantity of blood platelets is collected, a mobile blood facility can deliver the collected blood platelets directly to the assigned blood center. Table 5 represents the details related to the allocation of the first mobile blood facility, MBF1.
The optimal location of the second mobile blood facility (MBF2) is determined to be location 2. MBF2 can move from location 2 to location 9 in the next planning period. Similar to MBF1, if the needed quantity of platelets is collected or if the working hours of the employees are over, MBF2 moves to the designated blood center to deliver the collected platelets. Table 6 represents the details related to the allocation of the second mobile blood facility, MBF2.
The optimal locations and navigation paths of the mobile blood facilities (MBF1 and MBF2) are presented in Figure 5.
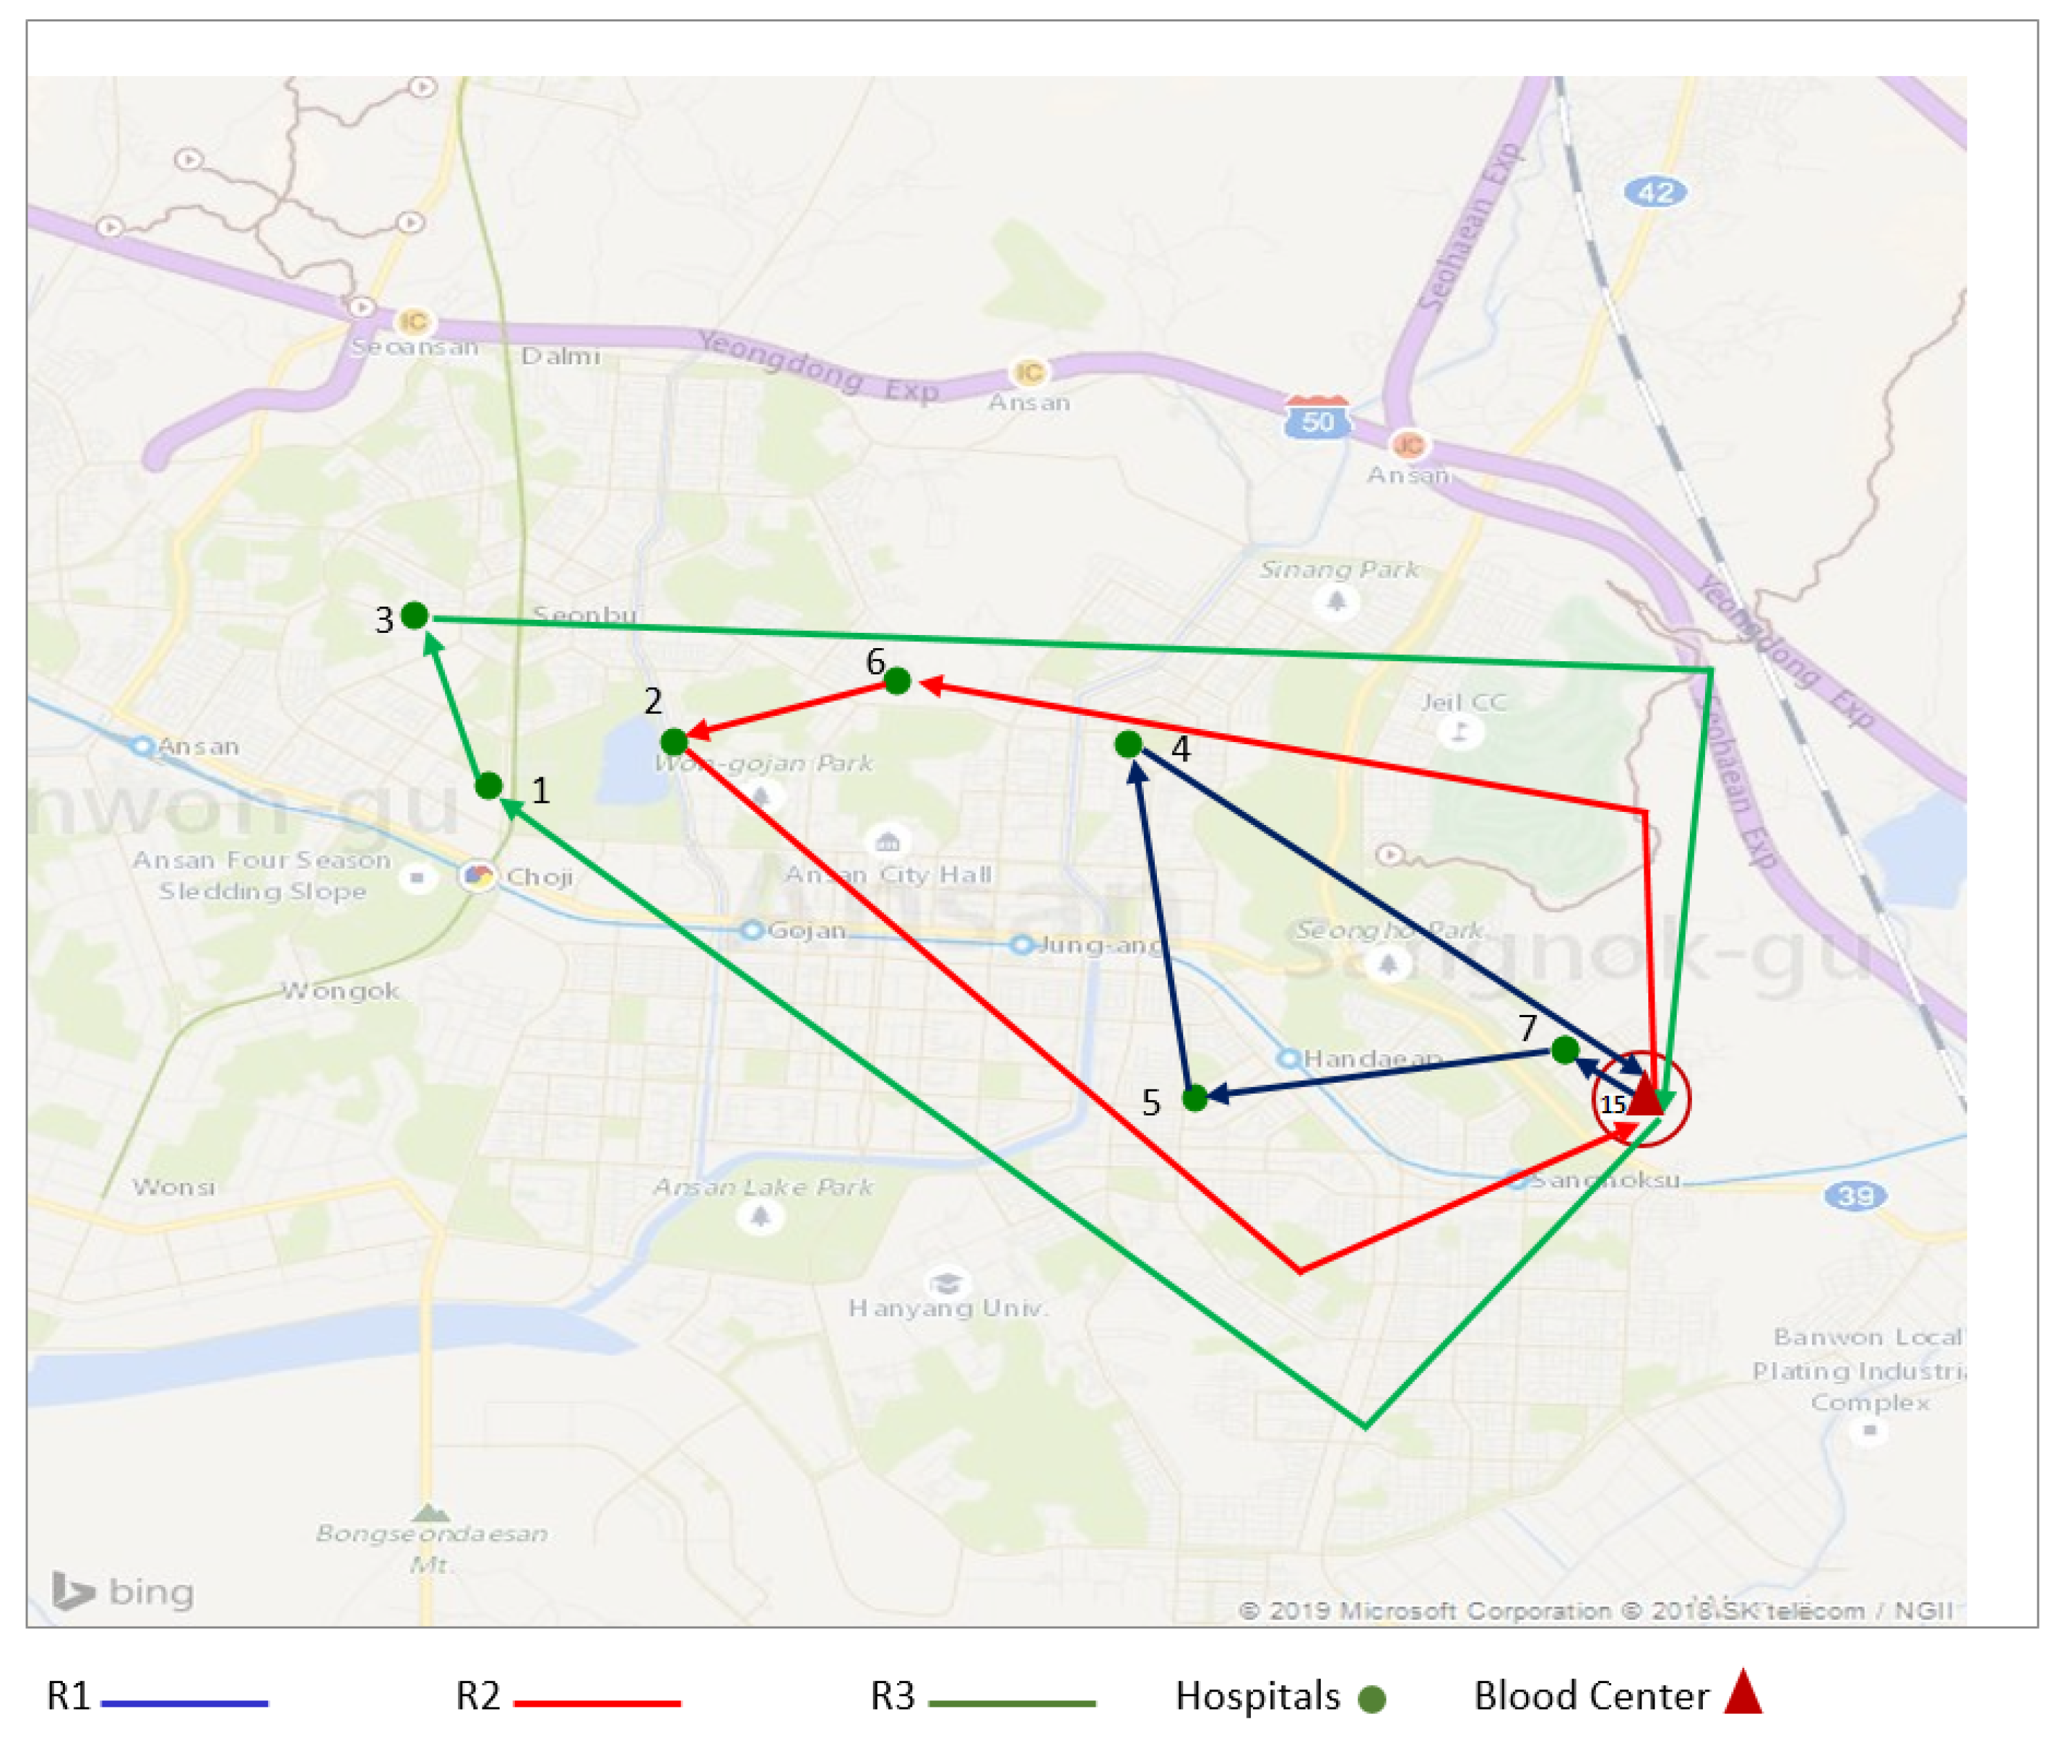
In the proposed problem, seven hospitals must be served each day to fulfill their daily demand for blood platelets. The results show that three different routes can be considered to guarantee efficient supply chain management while ensuring optimal energy consumption. In the first route (R1), three hospitals (h1, h2, and h3) must be served by one vehicle. Two hospitals need to be visited in the second route (R2), and two hospitals are also served in the third route (R3). The locations of the hospitals are fixed, and the calculated distances between all nodes of the routes are reported in Table 7.
The optimum shipping routes represent the best balance between costs and energy consumption. The shipping routes determined to be optimal are presented in Figure 6.
The values of the parameters used in the test problems are presented in Table 8.
Numerical experiments were carried out for different delivery scenarios to validate the proposed model. Ten scenarios were considered in this study to determine the best shipping route and the best scenario with the most efficient results in terms of costs and energy consumption. Table 9 shows the obtained results for the different tested scenarios.
Scenario 7 represents the optimal solution to the proposed model, with total costs equal to $144,687.69. The first mobile blood facility (MBF1) has to visit location 3 first, as it was concluded to be its optimal location. Then, it moves to location 4, collects the required quantity of blood platelets to satisfy the daily demand, and returns to the blood center, where the trip started, to deliver the collected quantity of blood platelets. The second mobile blood facility (MBF2) starts at its optimal site of location 2, moves to location 9 in the next planning period, and then returns to the assigned blood center with the collected quantity of blood platelets. The fixed blood facilities (FBF1 and FBF2) reside at their optimal locations, location 1 and location 5, respectively. The blood platelets collected at FBF1 and FBF2 are transported to the blood center. Donors can donate platelets in the blood center as well; thus, the blood center acts not only as a testing, production, storage, and diffusion facility but also as a potential collection site of more blood platelets. The final quantity of blood platelets produced is determined by the summation of all collected platelets while accounting for the wastage rate and the outdate rate of platelets in time period t. The demand volume is delivered to demand points by three different routes. In the first route, three hospitals are visited; in the second route, two hospitals are visited; and in the third route, two hospitals are served. Thus, the optimum shipping route is given by scenario 7, which represents the best shipping route in terms of efficient energy consumption and minimum costs.
5. Conclusions
This study was conducted to identify an optimal delivery approach by accounting for the effect of optimal energy consumption using objective functions to reduce the total costs of the network. The proposed strategy is demonstrated for the city of Ansan in South Korea. Energy efficiency plays a key role in the strategy to reduce the costs of healthcare supply chain management. The total cost was minimized with the optimal energy consumption, and an optimal transportation scheme for blood platelet supply chain management was developed. A mathematical model was designed with the objective of enhancing the efficiency of healthcare service. The decision-making related to the location-allocation of blood facilities plays an important role in reducing the energy consumed by transportation activities between all nodes in the network. Thus, the total cost was minimized to assure the sustainability of the healthcare supply chain. As a result of the high perishability rate, platelets are a life-saving product in constant demand, and managing the healthcare supply chain is both a major priority and a complicated task. The proposed formulation ensures the optimal location-allocation of mobile and fixed blood facilities. The model determines the optimal path to ensure the efficiency of the supply chain, the reduction of energy consumption, and the efficient flow of blood platelets at required quantities through the network. Further, an objective of the model is the minimization of the total cost of the supply chain (establishment cost of FBFs, setup cost of MBFs and delivery vehicles, production costs, operation costs, transportation costs due to the effect of energy, carbon emission costs, perishability costs, holding costs, and wastage costs). The main output of this model, with respect to the optimal energy, is optimized healthcare supply chain management with a minimized total cost. A set of different scenarios were considered to determine the optimal solution and the best scheme to deliver blood platelets. In addition, data from a real case study was applied to prove the validity of the proposed model. To the best of the authors’ knowledge, this is the first study that combines the concept of energy consumption and healthcare supply chain management.
Because of the complexity of the formulated problem, potential future research includes developing efficient solution algorithms that can solve the problem within a reasonable time. The model can be enhanced by adding more objective functions to be minimized or maximized to foster and boost the efficiency of the healthcare supply chain. In future research, the outdating of blood platelet units can be considered as a deterioration linear function or higher-order polynomial, which could allow the model to give priority to younger units of platelets over the old units.
Author Contributions
Conceptualization, J.J. and B.S.; methodology, J.J. and B.S.; software, J.J.; validation, J.J. and B.S.; formal analysis, J.J.; investigation, J.J. and B.S.; resources, J.J. and B.S.; data curation, J.J. and B.S.; writing–original draft preparation, J.J.; writing–review and editing, B.S.; visualization, J.J. and B.S.; supervision, B.S.; project administration, B.S.; funding acquisition, B.S.
Funding
This work was supported by the research fund of Hanyang University (HY-2019-N) (Project number: 201900000000419).
Conflicts of Interest
The authors declare no conflicts of interest.
Abbreviations
The following abbreviations were used in this paper:
| MBF | Mobile Blood Facility |
| FBF | Fixed Blood Facility |
| BC | Blood Cenetr |
Appendix A
Sets
| I | mobile blood facilities, |
| K | fixed blood facilities, |
| J | blood center, |
| H | hospitals, |
| V | vehicles indexed by |
| C | capacities |
| T | planning periods, |
| R | routes indexed by with |
| A | age of platelets, |
Parameters
| capacity with | |
| i | |
| fixed transportation costs under efficient-energy consumption per km ($/km) | |
| L | lifetime of platelets (days) |
| carbon emission costs ($/gr of CO) | |
| holding costs of the blood with age a in the blood center during the planning | |
| period t ($/unit/unit time) | |
| holding costs at fixed blood facilities during the planning period t ($/unit/unit time) | |
| penalty costs for shortage in blood age a at the blood center during the planning | |
| period t ($/unit/unit time) | |
| unit cost of expired blood at a blood center ($/unit/unit time) | |
| cost of one expired blood unit at a fixed blood facility ($/unit/unit time) | |
| unit production costs of platelets at blood center ($/unit) | |
| operational cost of platelets at mobile blood facility ($/unit) | |
| operating cost of platelets at fixed blood facility ($/unit) | |
| cost of operating the apheresis machine at blood center ($/unit) | |
| establishment costs of a fixed blood facility ($/setup) | |
| establishment costs of a mobile blood facility ($/setup) | |
| setup costs of delivery vehicle with capacity ($/setup) | |
| quantity of carbon emitted by the vehicle per km (gr of CO / km) | |
| distance between a fixed blood facility and blood center (km) | |
| total distance a mobile blood facility travel during the planning period t to collect the platelets (km) | |
| and deliver them to the blood center (km) | |
| total distance a vehicle travel during the planning period t in order to diffuse the platelets to all the | |
| demand points (km) | |
| distance between location and location (km) | |
| wasted blood platelets rate at blood center during production process | |
| outdated blood platelets rate at blood center | |
| expired blood platelets rate at a fixed blood facility | |
| quantity of demand of hospitals (unit/unit time) | |
| demand of blood center (unit/unit time) | |
| M | very large number |
Decision variables
| transported quantity of blood from a fixed blood facility to a blood center in period t (unit/unit time) | |
| collected quantity of blood in a fixed blood facility in period t (unit/unit time) | |
| shipped quantity of blood from a mobile blood facility to a blood center (unit/unit time) | |
| collected quantity of blood in a blood center in period t (unit/unit time) | |
| quantity of blood to be transported from the blood center to the demand points (unit/unit time) | |
| shortage quantity of blood age a at the blood center during the planning period t (unit/unit time) | |
| maximum quantity of shortage allowed (unit/unit time) | |
| wasted quantity of blood (unit/unit time) | |
| expired quantity of blood at blood center (unit/unit time) | |
| quantity of expired blood units at fixed blood facility (unit/unit time) | |
| produced quantity of blood at the blood center during the planning period t (unit/unit time) | |
| inventory level at a fixed blood facility during the planning period t (unit/unit time) | |
| inventory level at a blood center during the period t (unit/unit time) |
Binary variables
References
- Holinstat, M. Normal platelet function. Cancer Metastasis Rev. 2017, 36, 195–198. [Google Scholar] [CrossRef] [PubMed]
- Nahmias, S. Perishable inventory theory: A review. Oper. Res. 1982, 30, 680–708. [Google Scholar] [CrossRef] [PubMed]
- Sha, Y.; Huang, J. The multi-period location-allocation problem of engineering emergency blood supply systems. Syst. Eng. Procedia 2012, 5, 21–28. [Google Scholar] [CrossRef]
- Jabbarzadeh, A.; Fahimnia, B.; Seuring, S. Dynamic supply chain network design for the supply of blood in disasters: A robust model with real world application. Trans. Res. Part E Logist. Transp. Rev. 2014, 70, 225–244. [Google Scholar] [CrossRef]
- Katsaliaki, K.; Mustafee, N.; Kumar, S. A game-based approach towards facilitating decision making for perishable products: An example of blood supply chain. Exp. Syst. Appl. 2014, 41, 4043–4059. [Google Scholar] [CrossRef] [Green Version]
- Duan, Q.; Liao, T.W. Optimization of blood supply chain with shortened shelf lives and ABO compatibility. Int. J. Prod. Econ. 2014, 153, 113–129. [Google Scholar] [CrossRef]
- Arvan, M.; Tavakkoli-Moghaddam, R.; Abdollahi, M. Designing a bi-objective and multi-product supply chain network for the supply of blood. Uncertain Supply Chain Manag. 2015, 3, 57–68. [Google Scholar] [CrossRef]
- Giannakis, M.; Papadopoulos, T. Supply chain sustainability: A risk management approach. Int. J. Prod. Econ. 2016, 171, 455–470. [Google Scholar] [CrossRef]
- Osorio, A.F.; Brailsford, S.C.; Smith, H.K.; Forero-Matiz, S.P.; Camacho-Rodríguez, B.A. Simulation-optimization model for production planning in the blood supply chain. Healthc. Manag. Sci. 2017, 20, 548–564. [Google Scholar] [CrossRef]
- Zahiri, B.; Pishvaee, M.S. Blood supply chain network design considering blood group compatibility under uncertainty. Int. J. Prod. Res. 2017, 55, 2013–2033. [Google Scholar] [CrossRef]
- Ramezanian, R.; Behboodi, Z. Blood supply chain network design under uncertainties in supply and demand considering social aspects. Trans. Res. Part E Logist. Transp. Rev. 2017, 104, 69–82. [Google Scholar] [CrossRef]
- Paydar, M.M.; Babaveisi, V.; Safaei, A.S. An engine oil closed-loop supply chain design considering collection risk. Comput. Chem. Eng. 2017, 104, 38–55. [Google Scholar] [CrossRef]
- Najafi, M.; Ahmadi, A.; Zolfagharinia, H. Blood inventory management in hospitals: Considering supply and demand uncertainty and blood transshipment possibility. Oper. Res. Health Care 2017, 15, 43–56. [Google Scholar] [CrossRef]
- Ensafian, H.; Yaghoubi, S. Robust optimization model for integrated procurement, production and distribution in platelet supply chain. Trans. Res. Part E Logist. Transp. Rev. 2017, 103, 32–55. [Google Scholar] [CrossRef]
- Hosseinifard, Z.; Abbasi, B. The inventory centralization impacts on sustainability of the blood supply chain. Comput. Oper. Res. 2018, 89, 206–212. [Google Scholar] [CrossRef]
- Samani, M.R.G.; Torabi, S.A.; Hosseini-Motlagh, S.M. Integrated blood supply chain planning for disaster relief. Int. J. Disaster Risk Reduct. 2018, 27, 168–188. [Google Scholar] [CrossRef]
- Eskandari-Khanghahi, M.; Tavakkoli-Moghaddam, R.; Taleizadeh, A.A.; Amin, S.H. Designing and optimizing a sustainable supply chain network for a blood platelet bank under uncertainty. Eng. Appl. Artif. Intell. 2018, 71, 236–250. [Google Scholar] [CrossRef]
- Hamdan, B.; Diabat, A. A two-stage multi-echelon stochastic blood supply chain problem. Comput. Oper. Res. 2019, 101, 130–143. [Google Scholar] [CrossRef]
- Beamon, B.M. Sustainability and the future of supply chain management. Oper. Supply Chain Manag. 2008, 1, 4–18. [Google Scholar] [CrossRef]
- Rentizelas, A.A.; Tolis, A.J.; Tatsiopoulos, I.P. Logistics issues of biomass: The storage problem and the multi-biomass supply chain. Renew. Sustain. Energy Rev. 2009, 13, 887–894. [Google Scholar] [CrossRef] [Green Version]
- Halldórsson, Á.; Kovács, G. The sustainable agenda and energy efficiency: Logistics solutions and supply chains in times of climate change. Int. J. Phys. Distrib. Logist. Manag. 2010, 40, 5–13. [Google Scholar] [CrossRef]
- Gold, S.; Seuring, S. Supply chain and logistics issues of bio-energy production. J. Clean. Prod. 2011, 19, 32–42. [Google Scholar] [CrossRef]
- Pan, S.Y.; Du, M.A.; Huang, I.T.; Liu, I.H.; Chang, E.; Chiang, P.C. Strategies on implementation of waste-to-energy (WTE) supply chain for circular economy system: A review. J. Clean. Prod. 2015, 108, 409–421. [Google Scholar] [CrossRef]
- Luthra, S.; Mangla, S.K.; Xu, L.; Diabat, A. Using AHP to evaluate barriers in adopting sustainable consumption and production initiatives in a supply chain. Int. J. Prod. Econ. 2016, 181, 342–349. [Google Scholar] [CrossRef]
- Hong, J.; Shen, Q.; Xue, F. A multi-regional structural path analysis of the energy supply chain in China’s construction industry. Energy Policy 2016, 92, 56–68. [Google Scholar] [CrossRef]
- Marzband, M.; Ghazimirsaeid, S.S.; Uppal, H.; Fernando, T. A real-time evaluation of energy management systems for smart hybrid home Microgrids. Electr. Power Syst. Res. 2017, 143, 624–633. [Google Scholar] [CrossRef]
- Aziziankohan, A.; Jolai, F.; Khalilzadeh, M.; Soltani, R.; Tavakkoli-Moghaddam, R. Green supply chain management using the queuing theory to handle congestion and reduce energy consumption and emissions from supply chain transportation fleet. J. Ind. Eng. Manag. 2017, 10, 213–236. [Google Scholar] [CrossRef]
- Centobelli, P.; Cerchione, R.; Esposito, E. Environmental sustainability and energy-efficient supply chain management: A review of research trends and proposed guidelines. Energies 2018, 11, 275. [Google Scholar] [CrossRef]
- Singh, R.; Centobelli, P.; Cerchione, R. Evaluating Partnerships in Sustainability-Oriented Food Supply Chain: A Five-Stage Performance Measurement Model. Energies 2018, 11, 3473. [Google Scholar] [Green Version]
- Sarkar, M.; Sarkar, B.; Iqbal, M. Effect of Energy and Failure Rate in a Multi-Item Smart Production System. Energies 2018, 11, 2958. [Google Scholar] [CrossRef]
- Sarkar, B.; Omair, M.; Choi, S.B. A multi-objective optimization of energy, economic, and carbon emission in a production model under sustainable supply chain management. Appl. Sci. 2018, 8, 1744. [Google Scholar] [CrossRef]
- Marchi, B.; Zanoni, S.; Ferretti, I.; Zavanella, L. Stimulating investments in energy efficiency through supply chain integration. Energies 2018, 11, 858. [Google Scholar] [CrossRef]
- Fontes, C.H.d.O.; Freires, F.G.M. Sustainable and renewable energy supply chain: A system dynamics overview. Renew. Sustain. Energy Rev. 2018, 82, 247–259. [Google Scholar]
- Zhu, Q.; Sarkis, J.; Lai, K.h. Green supply chain management: Pressures, practices and performance within the Chinese automobile industry. J. Clean. Prod. 2007, 15, 1041–1052. [Google Scholar] [CrossRef]
- Srivastava, S.K. Green supply-chain management: A state-of-the-art literature review. Int. J. Manag. Rev. 2007, 9, 53–80. [Google Scholar] [CrossRef]
- Yeh, W.C.; Chuang, M.C. Using multi-objective genetic algorithm for partner selection in green supply chain problems. Exp. Syst. Appl. 2011, 38, 4244–4253. [Google Scholar] [CrossRef]
- Hua, G.; Cheng, T.; Wang, S. Managing carbon footprints in inventory management. Int. J. Prod. Econ. 2011, 132, 178–185. [Google Scholar] [CrossRef]
- Kumar, S.; Chattopadhyaya, S.; Sharma, V. Green supply chain management: A case study from Indian electrical and electronics industry. Int. J. Soft Comput. Eng. 2012, 1, 275–281. [Google Scholar]
- Pan, S.; Ballot, E.; Fontane, F. The reduction of greenhouse gas emissions from freight transport by pooling supply chains. Int. J. Prod. Econ. 2013, 143, 86–94. [Google Scholar] [CrossRef]
- Bazan, E.; Jaber, M.Y.; Zanoni, S. Supply chain models with greenhouse gases emissions, energy usage and different coordination decisions. Appl. Math. Model. 2015, 39, 5131–5151. [Google Scholar] [CrossRef]
- Ahmed, W.; Sarkar, B. Impact of carbon emissions in a sustainable supply chain management for a second generation biofuel. J. Clean. Prod. 2018, 186, 807–820. [Google Scholar] [CrossRef]
- Sarkar, B. A production-inventory model with probabilistic deterioration in two-echelon supply chain management. Appl. Math. Model. 2013, 37, 3138–3151. [Google Scholar] [CrossRef]
- Sarkar, B.; Ganguly, B.; Sarkar, M.; Pareek, S. Effect of variable transportation and carbon emission in a three-echelon supply chain model. Trans. Res. Part E Logist. Transp. Rev. 2016, 91, 112–128. [Google Scholar] [CrossRef]
- Habib, M.S.; Sarkar, B. An integrated location-allocation model for temporary disaster debris management under an uncertain environment. Sustainability 2017, 9, 716. [Google Scholar] [CrossRef]
- Sarkar, B.; Shaw, B.K.; Kim, T.; Sarkar, M.; Shin, D. An integrated inventory model with variable transportation cost, two-stage inspection, and defective items. J. Ind. Manag. Opt. 2017, 13, 1975–1990. [Google Scholar] [CrossRef]
- Feng, X.; Moon, I.; Ryu, K. Warehouse capacity sharing via transshipment for an integrated two-echelon supply chain. Trans. Res. Part E Logist. Transp. Rev. 2017, 104, 17–35. [Google Scholar] [CrossRef]
- Sarkar, B.; Ahmed, W.; Kim, N. Joint effects of variable carbon emission cost and multi-delay-in-payments under single-setup-multiple-delivery policy in a global sustainable supply chain. J. Clean. Prod. 2018, 185, 421–445. [Google Scholar] [CrossRef]
- Shi, X.; Zhang, X.; Dong, C.; Wen, S. Economic performance and emission reduction of supply chains in different power structures: Perspective of sustainable investment. Energies 2018, 11, 983. [Google Scholar] [CrossRef]
- Iqbal, M.W.; Sarkar, B. Recycling of lifetime dependent deteriorated products through different supply chains. RAIRO Oper. Res. 2019, 53, 129–156. [Google Scholar] [CrossRef]
- Mishra, U.; Wu, J.Z.; Chiu, A.S.F. Effects of Carbon-Emission and Setup Cost Reduction in a Sustainable Electrical Energy Supply Chain Inventory System. Energies 2019, 12, 1226. [Google Scholar] [CrossRef]
- Sarkar, B.; Mahapatra, A.S. Periodic review fuzzy inventory model with variable lead time and fuzzy demand. Int. Trans. Oper. Res. 2017, 24, 1197–1227. [Google Scholar] [CrossRef]
- Sarkar, B.; Ullah, M.; Kim, N. Environmental and economic assessment of closed-loop supply chain with remanufacturing and returnable transport items. Comput. Ind. Eng. 2017, 111, 148–163. [Google Scholar] [CrossRef]
- Malik, A.I.; Sarkar, B. Coordinating Supply-Chain Management under Stochastic Fuzzy Environment and Lead-Time Reduction. Mathematics 2019, 7, 480. [Google Scholar] [CrossRef]
- Shin, D.; Guchhait, R.; Sarkar, B.; Mittal, M. Controllable lead time, service level constraint, and transportation discounts in a continuous review inventory model. RAIRO Oper. Res. 2016, 50, 921–934. [Google Scholar] [CrossRef]
- Sarkar, B.; Tayyab, M.; Kim, N.; Habib, M.S. Optimal production delivery policies for supplier and manufacturer in a constrained closed-loop supply chain for returnable transport packaging through metaheuristic approach. Comput. Ind. Eng. 2019. [Google Scholar] [CrossRef]
- Taleizadeh, A.A.; Babaei, M.S.; Sana, S.S.; Sarkar, B. Pricing Decision within an Inventory Model for Complementary and Substitutable Products. Mathematics 2019, 7, 568. [Google Scholar] [CrossRef]
- Noh, J.; Kim, J.S.; Sarkar, B. Two-echelon supply chain coordination with advertising-driven demand under Stackelberg game policy. Eur. J. Ind. Eng. 2019, 13, 213–244. [Google Scholar] [CrossRef]
- Wook Kang, C.; Ullah, M.; Sarkar, M.; Omair, M.; Sarkar, B. A Single-Stage Manufacturing Model with Imperfect Items, Inspections, Rework, and Planned Backorders. Mathematics 2019, 7, 446. [Google Scholar] [CrossRef]
- Kim, S.J.; Sarkar, B. Supply chain model with stochastic lead time, trade-credit financing, and transportation discounts. Math. Prob. Eng. 2017, 2017, 6465912. [Google Scholar] [CrossRef]
- Sarkar, B.; Tayyab, M.; Choi, S.B. Product Channeling in an O2O Supply Chain Management as Power Transmission in Electric Power Distribution Systems. Mathematics 2019, 7, 4. [Google Scholar] [CrossRef]
- Sarkar, B.; Ullah, M.; Choi, S.B. Joint Inventory and Pricing Policy for an Online to Offline Closed-Loop Supply Chain Model with Random Defective Rate and Returnable Transport Items. Mathematics 2019, 7, 497. [Google Scholar] [CrossRef]
- Bhuniya, S.; Sarkar, B.; Pareek, S. Multi-Product Production System with the Reduced Failure Rate and the Optimum Energy Consumption under Variable Demand. Mathematics 2019, 7, 465. [Google Scholar] [CrossRef]
- Sarkar, B.; Guchhait, R.; Sarkar, M.; Cárdenas-Barrón, L.E. How does an industry manage the optimum cash flow within a smart production system with the carbon footprint and carbon emission under logistics framework? Int. J. Prod. Econ. 2019, 213, 243–257. [Google Scholar] [CrossRef]
- Heidari-Fathian, H.; Pasandideh, S.H.R. Green-blood supply chain network design: Robust optimization, bounded objective function & Lagrangian relaxation. Comput. Ind. Eng. 2018, 122, 95–105. [Google Scholar]
Figure 1.
Platelet supply chain network with the effect of energy consumption.

Figure 2.
Flow diagram of healthcare supply chain management with optimal energy consumption.
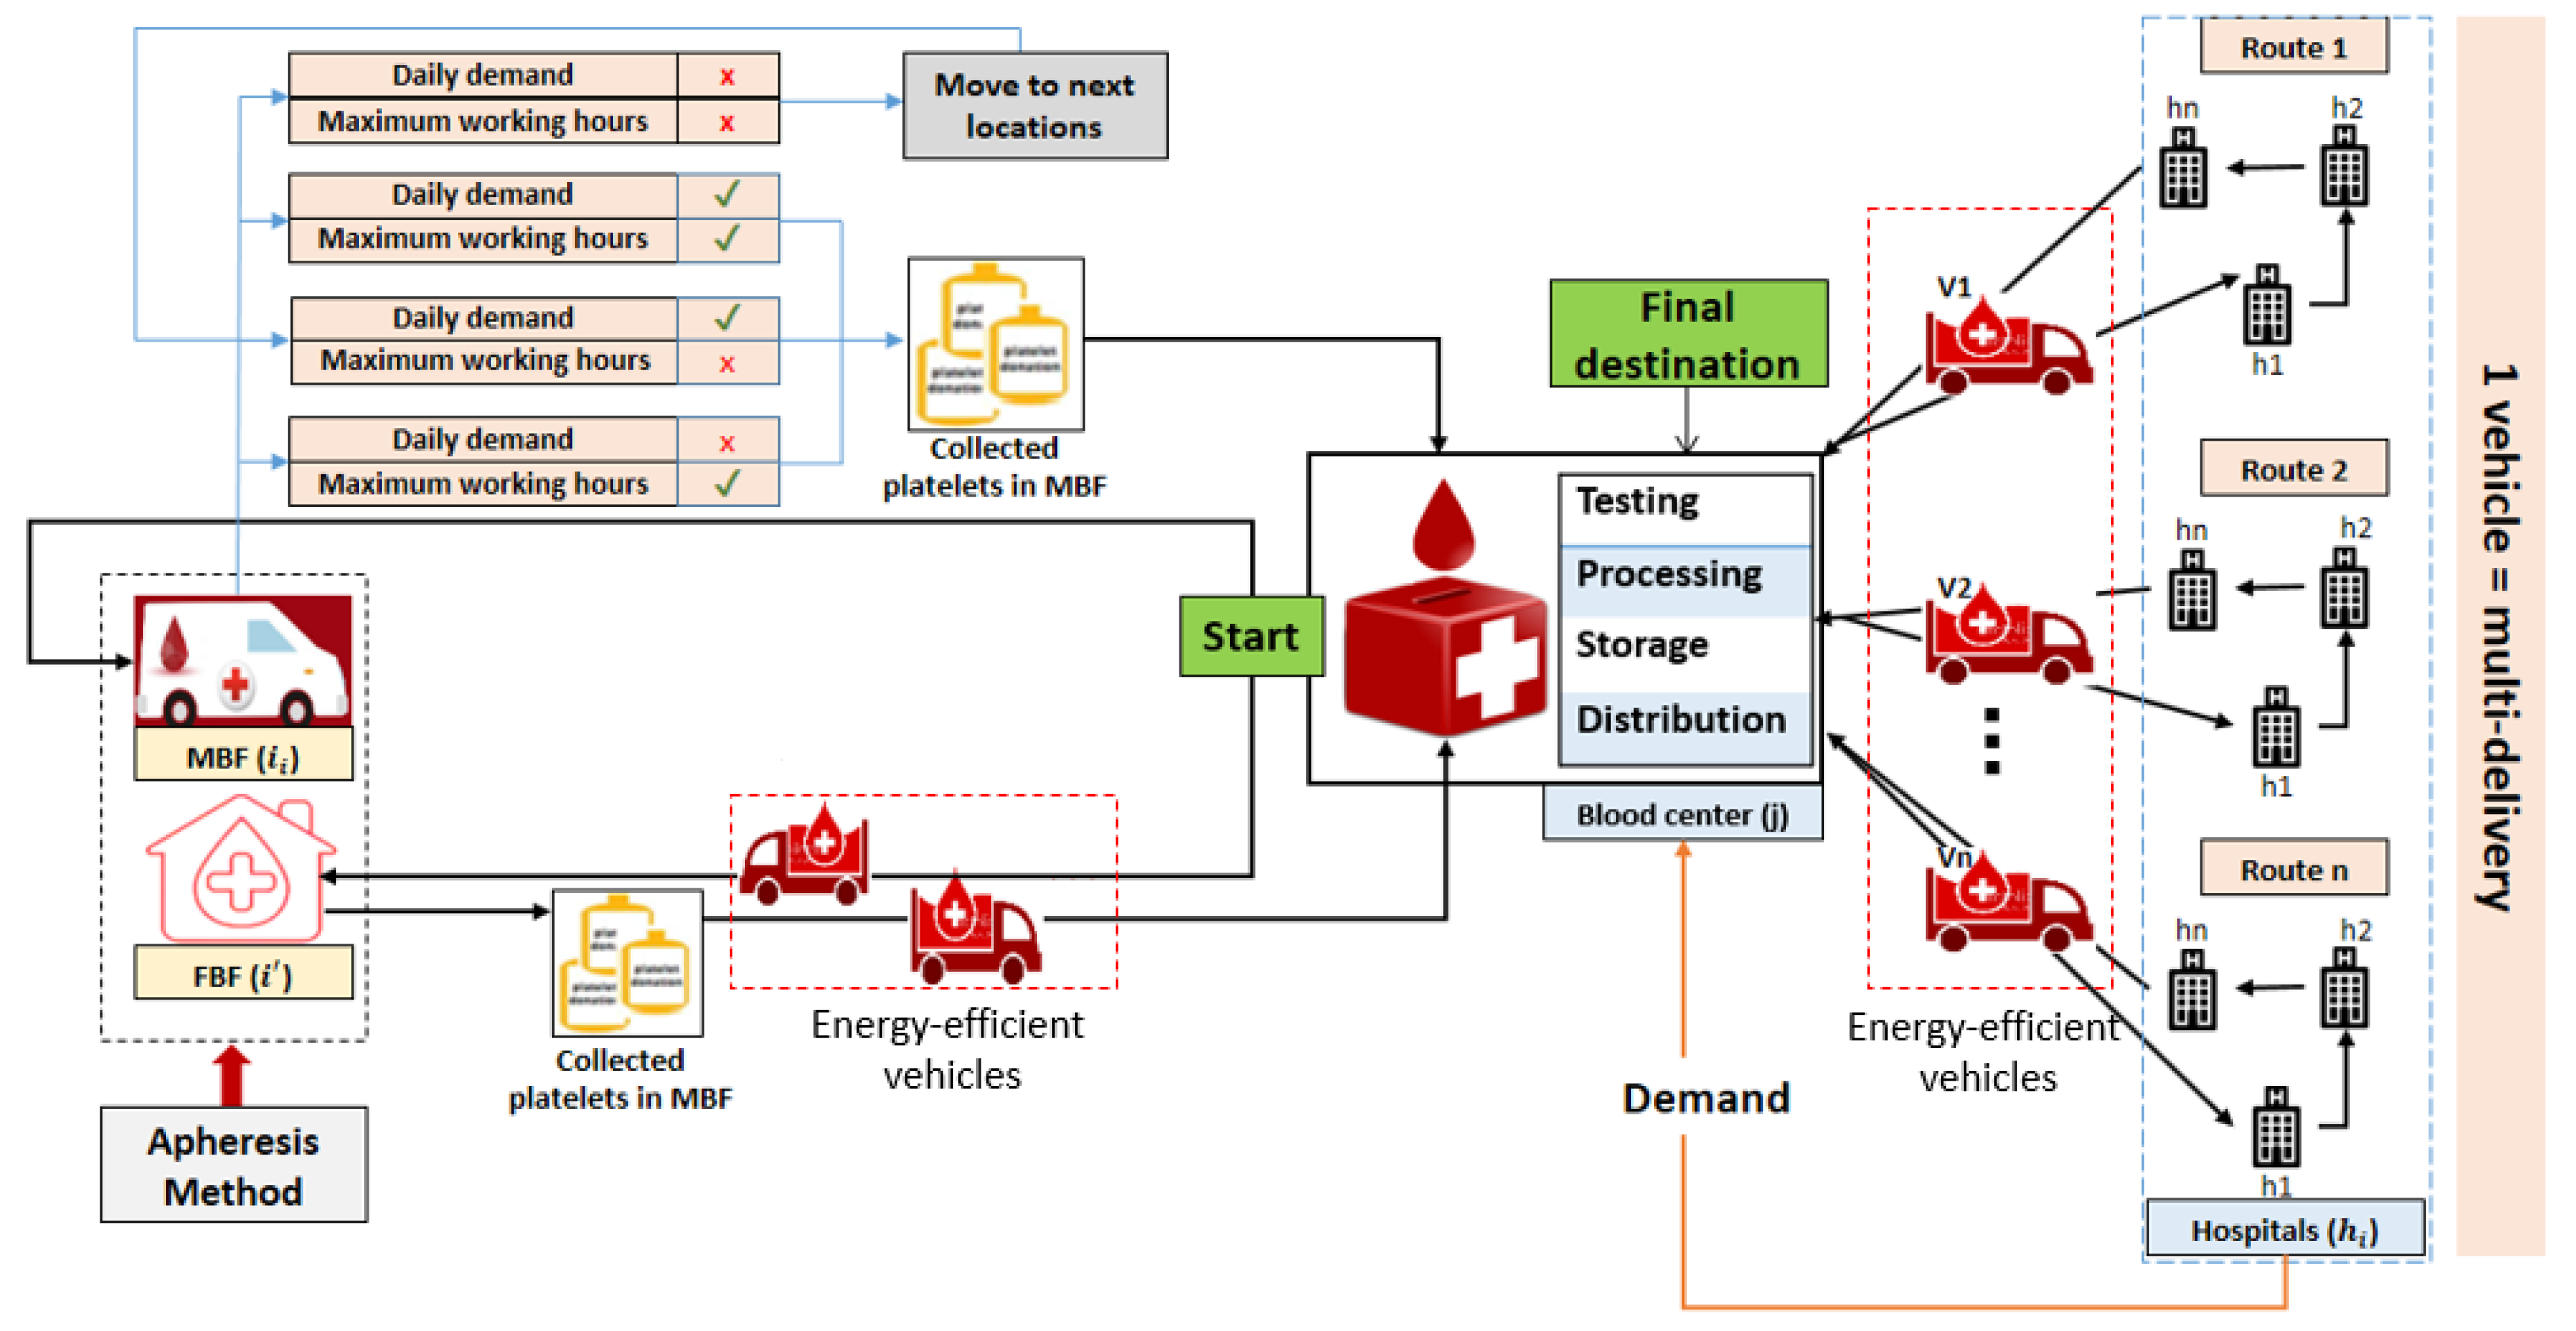
Figure 3.
Candidate locations of mobile and fixed blood facilities.

Figure 4.
Optimal locations of the fixed blood facilities.

Figure 5.
Optimal locations of mobile blood facilities 1 and 2.
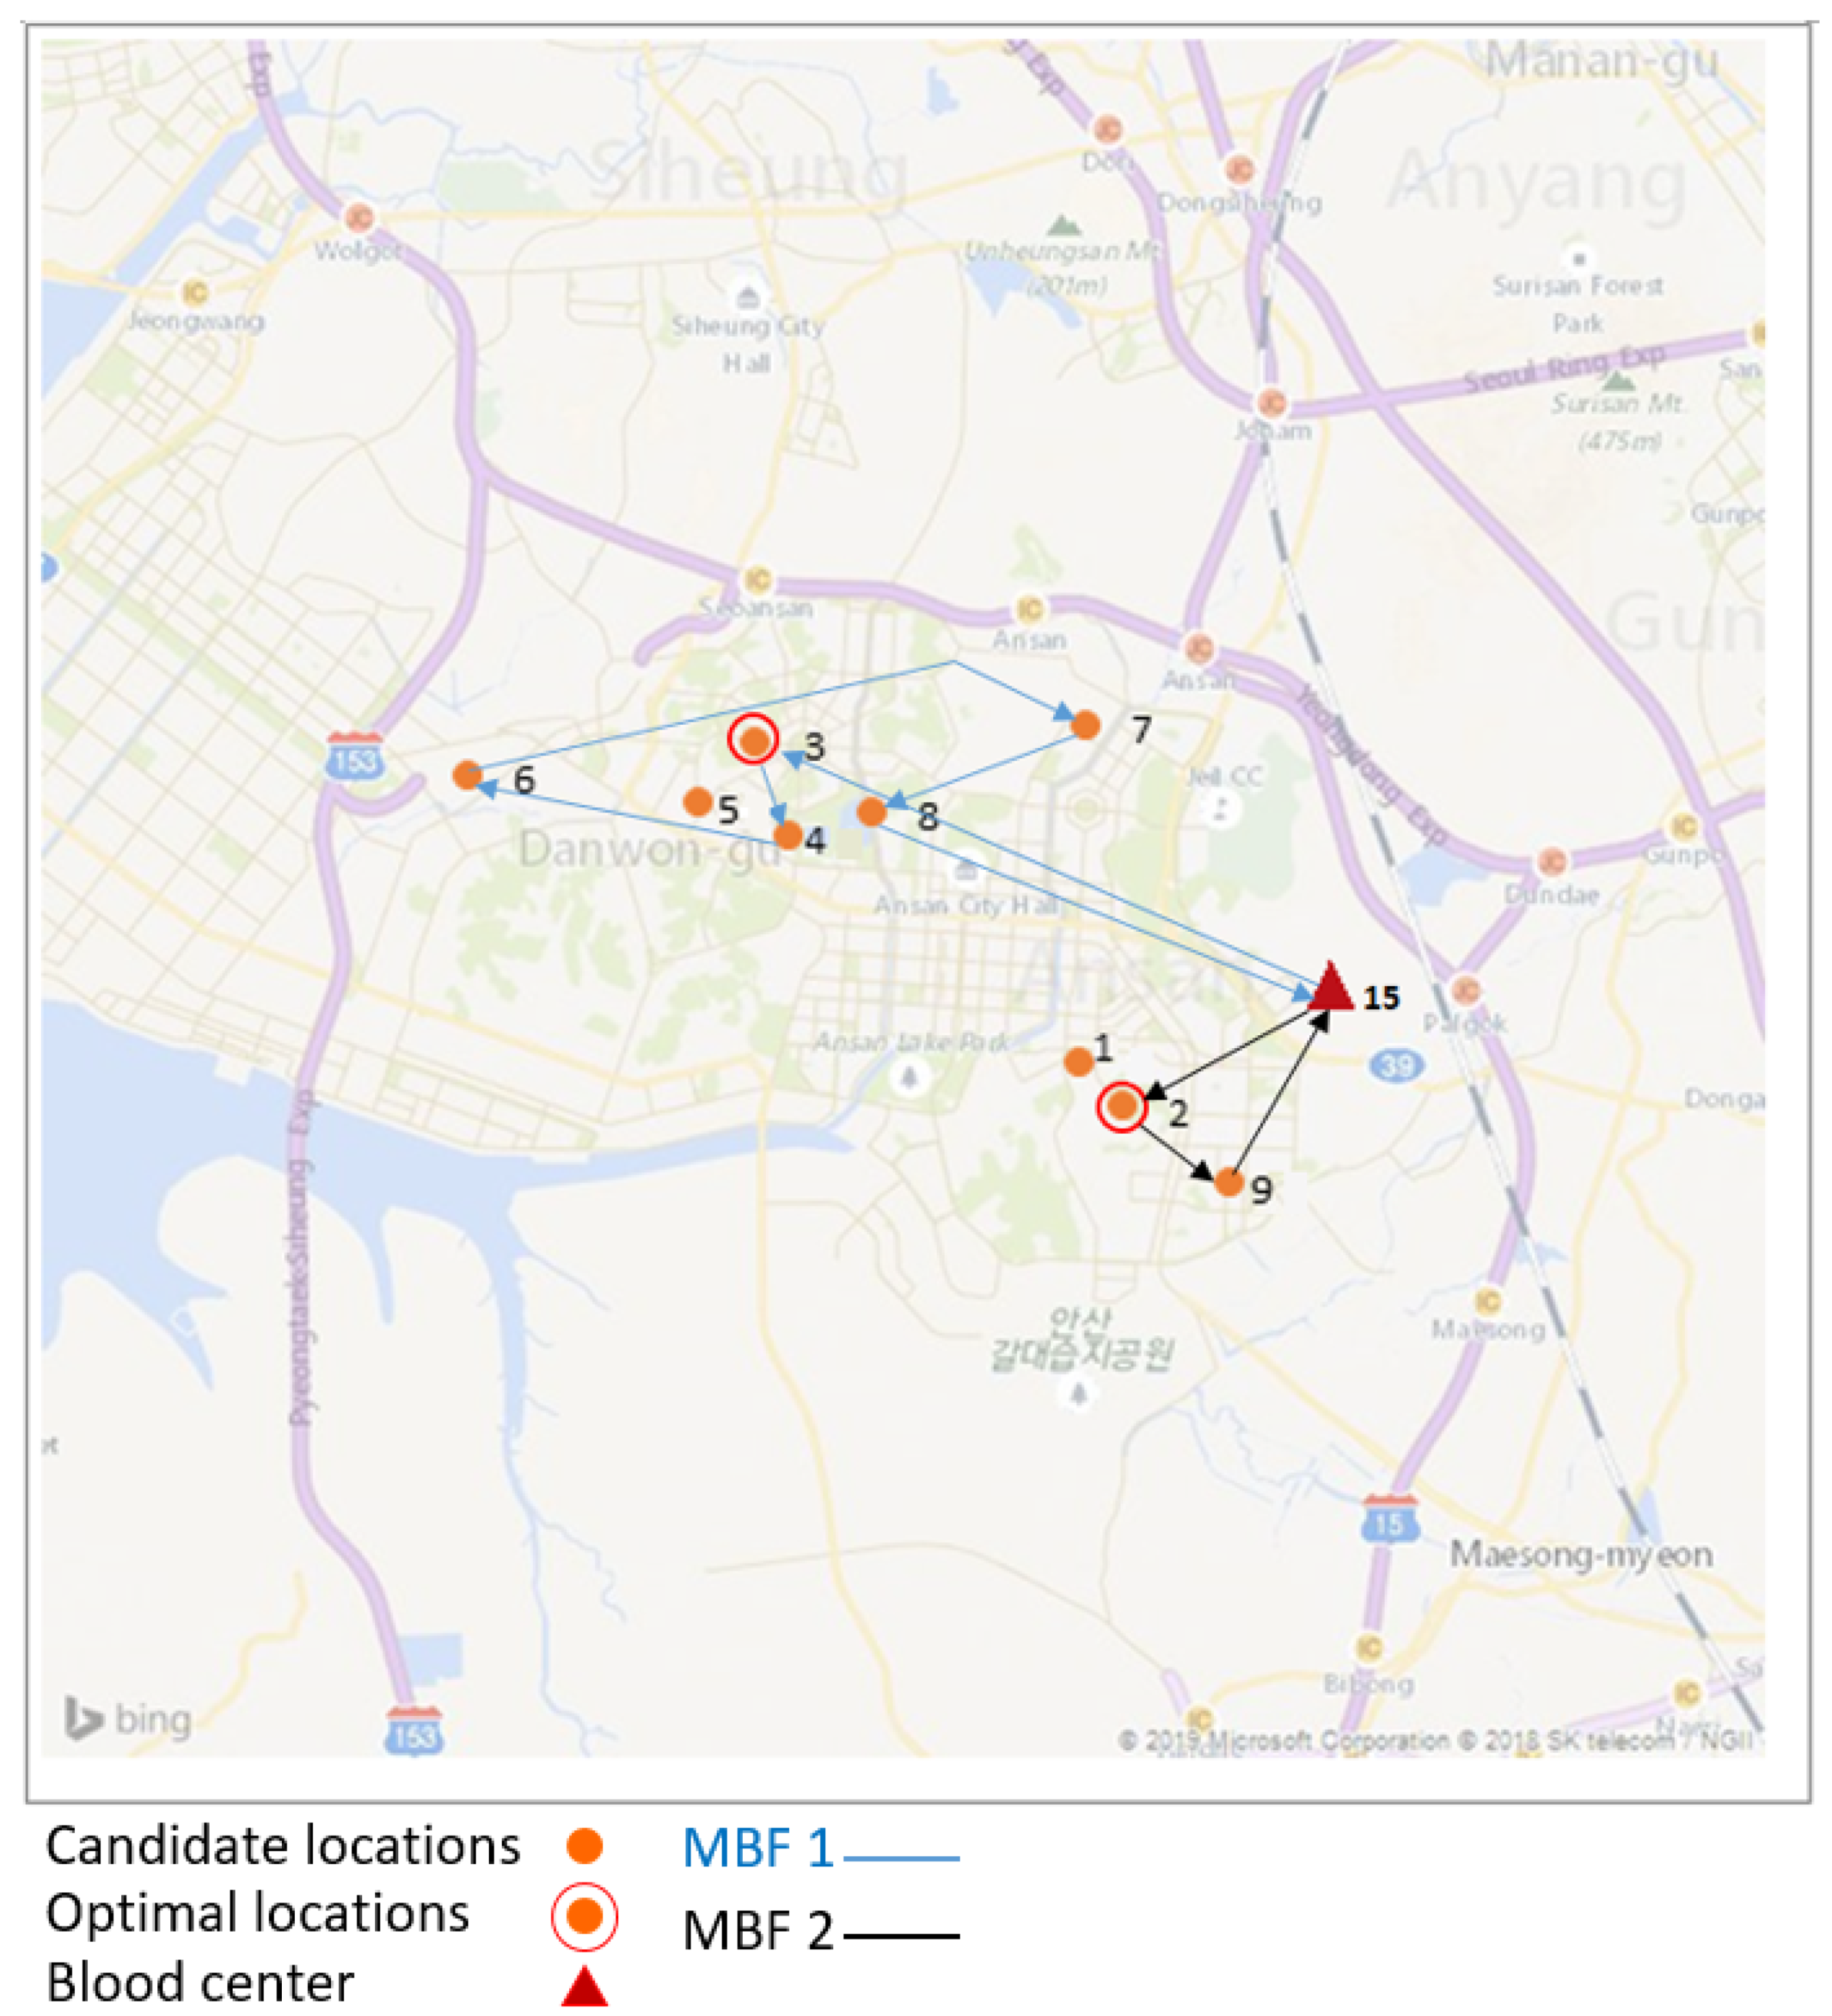
Figure 6.
Optimal routes between hospitals and the blood center.

Table 1.
Contributions of different authors.
| Authors | SCM and the Optimum Energy (OE) | Blood Collection | Platelets | Location | Perishability |
|---|---|---|---|---|---|
| Nahmias [2] | SCM | NA | NA | NA | Applicable |
| Sha et al. [3] | SCM | NA | NA | NA | NA |
| Sarkar et al. [42] | SCM | NA | NA | NA | Applicable |
| Jabbarzadeh et al. [4] | SCM | Applicable | NA | NA | NA |
| Katsaliaki et al. [5] | SCM | Applicable | NA | NA | Applicable |
| Duan and Liao [6] | SCM | Applicable | NA | NA | NA |
| Bazan et al. [40] | SCM | NA | NA | NA | NA |
| Arvan et al. [7] | SCM | Applicable | NA | NA | NA |
| Hong et al. [25] | SCM | NA | NA | NA | NA |
| Habib and Sarkar [44] | SCM | NA | NA | Allocated | NA |
| Zahiri et al. [10] | SCM | Applicable | NA | Allocated | Applicable |
| Ramezanian et al. [11] | SCM | Applicable | NA | NA | NA |
| Paydar et al. [12] | SCM | Applicable | NA | NA | Applicable |
| Osorio et al. [9] | SCM | Applicable | NA | Allocated | Applicable |
| Najafi et al. [13] | SCM | Applicable | NA | NA | NA |
| Ensafian et al. [14] | SCM | Applicable | Applicable | NA | Applicable |
| Ahmed et al. [41] | SCM | NA | NA | Allocated | NA |
| Sarkar et al. [30] | SCM | NA | NA | NA | NA |
| Hosseinifard and Abbasi [15] | SCM | Applicable | NA | NA | NA |
| Singh et al. [29] | SCM | NA | NA | NA | NA |
| Samani et al. [16] | SCM | Applicable | NA | NA | NA |
| Eskandari et al. [17] | SCM | Applicable | Applicable | NA | NA |
| Hamdan and Diabat [18] | SCM | Applicable | NA | Allocated | NA |
| Mishra et al. [50] | SCM | NA | NA | NA | NA |
| Iqbal et al. [49] | SCM | NA | NA | NA | Applicable |
| Proposed model | SCM & OE | Applicable | Applicable | Allocated | Applicable |
Table 2.
Size of the problem.
| MBF | FBF | BC | Hospitals | Vehicles |
|---|---|---|---|---|
| 2 | 2 | 1 | 7 | 5 |
Table 3.
Candidate locations of blood facilities and the fixed locations of the blood center and hospitals in Ansan, South Korea.
Table 3.
Candidate locations of blood facilities and the fixed locations of the blood center and hospitals in Ansan, South Korea.
| Candidate Locations of the Blood Facilities (MBFs and FBFs). | |||||
|---|---|---|---|---|---|
| ID | Location | Address | Latitude (x) | Longitude (y) | Demand |
| 1 | L1 | Sangnok-gu, Ansan, South Korea | 37.30 | 126.84 | MBF/FBF |
| 2 | L2 | Sa-dong, Ansan, South Korea | 37.29 | 126.85 | MBF/FBF |
| 3 | L3 | Seonbu-dong, Ansan, South Korea | 37.33 | 126.80 | MBF/FBF |
| 4 | L4 | Choji-dong, Ansan, South Korea | 37.32 | 126.80 | MBF/FBF |
| 5 | L5 | Wongok-dong, Ansan, South Korea | 37.32 | 126.79 | MBF/FBF |
| 6 | L6 | Singil-dong, Ansan, South Korea | 37.33 | 126.76 | MBF/FBF |
| 7 | L7 | Wolpi-dong, Ansan, South Korea | 37.33 | 126.84 | MBF/FBF |
| 8 | L8 | Gojan-dong, Ansan, South Korea | 37.32 | 126.81 | MBF/FBF |
| 9 | L9 | Bono-dong, Ansan, South Korea | 37.28 | 126.86 | MBF/FBF |
| 10 | L10 | Wonsi-dong, Ansan, South Korea | 37.30 | 126.79 | FBF |
| 11 | L11 | Mongnae-dong, Ansan, South Korea | 37.30 | 126.77 | FBF |
| 12 | L12 | Wa-dong, Ansan, South Korea | 37.34 | 126.82 | FBF |
| 13 | L13 | Hosu-dong, Ansan, South Korea | 37.32 | 126.77 | FBF |
| 14 | L14 | Seongpo-dong, Ansan, South Korea | 37.32 | 126.84 | FBF |
| Location of the blood center in Ansan, South Korea. | |||||
| ID | Location | Address | Latitude (x) | Longitude (y) | |
| 15 | L15 | Ansan blood center, Ansan, South Korea | 37.31 | 126.87 | |
| Locations of the hospitals at Ansan, South Korea | |||||
| ID | Location | Address | Latitude (x) | Longitude (y) | |
| 1 | H1 | Danwon Hospital, Choji-dong, Ansan, South Korea | 37.32 | 126.80 | |
| 2 | H2 | Korea University Ansan Hospital, 69 516 Gojan-dong, Danwon-gu, Ansan-si, Gyeonggi-do, South Korea | 37.32 | 126.81 | |
| 3 | H3 | Duson Hospital, Seonbu-dong, Ansan-si, South Korea | 37.33 | 126.80 | |
| 4 | H4 | Sarang Hospital, 69 Yesulgwangjang-ro, Seongpo-dong, Sangnok-gu, Ansan-si, Gyeonggi-do, South Korea | 37.32 | 126.84 | |
| 5 | H5 | Hansarang Hospital, 345 Gwangdeok 1 (il)-ro, I-dong, Sangnok-gu, Ansan-si, Gyeonggi-do, South Korea | 37.30 | 126.84 | |
| 6 | H6 | Anshan 21st Century Hospital, 50 Bohwa-ro, Gojan 1 (il)-dong, Danwon-gu, Ansan-si, Gyeonggi-do, South Korea | 37.33 | 126.83 | |
| 7 | H7 | Ansan Hospital, Korea Labor Welfare Corporation, 95 Il-dong, Sangnok-gu, Ansan-si, Gyeonggi-do, South Korea | 37.30 | 126.86 | |
Table 4.
Candidate and optimal locations of the fixed blood facilities.
| Facilities | Candidate Locations | Optimal Location | Distance Between BC and FBF (km) |
|---|---|---|---|
| FBF1 | Location 1 | Location 1 | 5.5 |
| Location 2 | |||
| Location 7 | |||
| Location 9 | |||
| Location 14 | |||
| FBF2 | Location 5 | Location 5 | 9.3 |
| Location 3 | |||
| Location 4 | |||
| Location 6 | |||
| Location 8 | |||
| Location 10 | |||
| Location 11 | |||
| Location 12 | |||
| Location 13 |
Table 5.
The optimal location and navigation path of MBF1.
| MBF1 | Optimal Location | Address | Candidate Locations | Possible Visited Locations |
|---|---|---|---|---|
| 1 | Location 3 | Seonbu-dong, Ansan, South Korea | 9 | 6 |
| No. | Path | Distance (km) | Demand | Transportation Costs ($) |
| 1 | BC to Location 3 | 9.4 | 1 | 5.64 |
| 2 | Location 3 to Location 4 | 1.5 | 1 | 0.88 |
| 3 | Location 4 to Location 6 | 5 | 1 | 3 |
| 5 | Location 6 to Location 7 | 9.1 | 1 | 5.47 |
| 6 | Location 7 to Location 8 | 3.2 | 1 | 1.91 |
| 7 | Location 8 to BC | 7 | - | 4.2 |
Table 6.
The optimal location and navigation path of MBF2.
| MBF2 | Optimal Location | Address | Candidate Locations | Possible Visited Locations |
|---|---|---|---|---|
| 1 | Location 2 | Sa-dong, Ansan, South Korea | 9 | 3 |
| No. | Path | Distance (km) | Demand | Transportation Costs ($) |
| 1 | BC to Location 2 | 5 | 1 | 3 |
| 2 | Location 2 to Location 9 | 2.4 | 1 | 1.44 |
| 4 | Location 9 to BC | 3.5 | - | 2.1 |
Table 7.
The total distance of each route.
| Route | Path | Locations | Distance (km) | Total Distance (km) |
|---|---|---|---|---|
| R1 | BC to h1 h1 to h2 h2 to h3 h3 to BC | L15 to L7 L7 to L5 L5 to L4 L4 to L15 | 2.4 4 2.6 5.8 | 14.8 |
| R2 | BC to h1 h1 to h2 h2 to BC | L15 to L6 L6 to L2 L2 to L15 | 5.9 1.6 6.4 | 13.9 |
| R3 | BC to h1 h1 to h2 h2 to BC | L15 to L1 L1 to L3 L3 to L15 | 7.6 4.5 7.2 | 19.3 |
Table 8.
Values of the parameters in the test problem (for references, see Khanghahi et al. [17], Heidari et al. [64], Hamdan and Diabat [18], Arvan et al. [7], and Samani et al. [16]).
| Parameters | Values | Parameters | Values |
|---|---|---|---|
| [300, 400] | [1, 2] | ||
| [1000, 2000] | [20,000, 40,000] | ||
| [3000, 8000] | [15,000, 30,000] | ||
| [300, 400] | [10,000, 15,000] | ||
| Tc | [0.5, 0.7] | [60, 150] | |
| L | [5, 7] | d_{kj} | [1, 20] |
| d_{i_njt} | [1, 20] | ||
| d_{jh_it} | [1, 60] | ||
| d_{i_{n-1}i_n} | [0, 10] | ||
| [0.01, 0.05] | [0.1, 0.2] | ||
| [0.1, 0.2] | [0.5, 0.8] | ||
| Cu | [0.015, 0.018] | [1, 2] | |
| Uc | [0.01, 0.02] | [1, 210] | |
| [1, 2] | [1, 30] |
Table 9.
Results of different delivery scenarios.
| Facilities | Scenario 1A | Scenario 2A | Scenario 3A | Scenario 4A | Scenario 5A |
|---|---|---|---|---|---|
| MBF1 | BC to L3 to BC | BC to L3 to L4 to BC | BC to L3 to L4 to L6 to BC | BC to L3 to L4 to L6 to L7 to BC | BC to L3 to L4 to L6 to L7 to L8 to BC |
| Scenario 1B | Scenario 2B | ||||
| MBF2 | BC to L2 to BC | BC to L2 to L9 to BC | |||
| FBF1 | Scenario 1C: BC to L1 to BC | ||||
| FBF2 | Scenario 1D: BC to L5 to BC | ||||
| Routes | R1: BC to L7’ to L5’ to L4’ to BC | R2: BC to L6’ to L2’ to BC | R2: BC to L1’ to L3’ to BC | ||
| TEST | |||||
| Scenarios | Runs | Path | Total costs ($/cycle) | ||
| Scenario 1 | Run 1 | Scenario 1A + Scenario 1B + Scenario 1C + Scenario 1D + R1 +R2 +R3 | 145245.37 | ||
| Scenario 2 | Run 2 | Scenario 2A + Scenario 1B + Scenario 1C + Scenario 1D + R1 +R2 +R3 | 144787.76 | ||
| Scenario 3 | Run 3 | Scenario 3A + Scenario 1B + Scenario 1C + Scenario 1D + R1 +R2 +R3 | 145746.94 | ||
| Scenario 4 | Run 4 | Scenario 4A + Scenario 1B + Scenario 1C + Scenario 1D + R1 +R2 +R3 | 146874.67 | ||
| Scenario 5 | Run 5 | Scenario 5A + Scenario 1B + Scenario 1C + Scenario 1D + R1 +R2 +R3 | 147379.21 | ||
| Scenario 6 | Run 6 | Scenario 1A + Scenario 2B + Scenario 1C + Scenario 1D + R1 +R2 +R3 | 145188.31 | ||
| Scenario 7 * | Run 7 * | Scenario 2A + Scenario 2B + Scenario 1C + Scenario 1D + R1 +R2 +R3 | 144687.69 * | ||
| Scenario 8 | Run 8 | Scenario 3A + Scenario 2B + Scenario 1C + Scenario 1D + R1 +R2 +R3 | 145471.87 | ||
| Scenario 9 | Run 9 | Scenario 4A + Scenario 2B + Scenario 1C + Scenario 1D + R1 +R2 +R3 | 146793.61 | ||
| Scenario 10 | Run 10 | Scenario 5A + Scenario 2B + Scenario 1C + Scenario 1D + R1 +R2 +R3 | 147196.15 | ||
* represents the indicator of the optimum values.
© 2019 by the authors. Licensee MDPI, Basel, Switzerland. This article is an open access article distributed under the terms and conditions of the Creative Commons Attribution (CC BY) license (http://creativecommons.org/licenses/by/4.0/).
Share and Cite
MDPI and ACS Style
Jemai, J.; Sarkar, B. Optimum Design of a Transportation Scheme for Healthcare Supply Chain Management: The Effect of Energy Consumption. Energies 2019, 12, 2789. https://doi.org/10.3390/en12142789
AMA Style
Jemai J, Sarkar B. Optimum Design of a Transportation Scheme for Healthcare Supply Chain Management: The Effect of Energy Consumption. Energies. 2019; 12(14):2789. https://doi.org/10.3390/en12142789
Chicago/Turabian StyleJemai, Jihed, and Biswajit Sarkar. 2019. "Optimum Design of a Transportation Scheme for Healthcare Supply Chain Management: The Effect of Energy Consumption" Energies 12, no. 14: 2789. https://doi.org/10.3390/en12142789
Note that from the first issue of 2016, this journal uses article numbers instead of page numbers. See further details here.