Abstract
State of charge (SOC) estimation is of vital importance for the battery management system in electric vehicles. This paper proposes a new fuzzy logic sliding mode observer for SOC estimation. The second-order resistor-capacitor equivalent circuit model is used to describe the discharging/charging behavior of the battery. The exponential fitting method is applied to determine the parameters of the model. The fuzzy logic controller is introduced to improve the performance of sliding mode observer forming the fuzzy logic sliding mode observer (FLSMO). The Federal Urban Driving Schedule (FUDS), the West Virginia Suburban Driving Schedule (WUBSUB), and the New European Driving Cycle (NEDC) schedule test results show that the average SOC estimation error of FLSMO algorithm is less than 1%. When the initial SOC estimation error is 20%, the FLSMO algorithm can converge to 3% error boundary within 2400 s. Comparison test results show that the FLSMO algorithm has better performance than the sliding mode observer and the extended Kalman filter in terms of robustness against measurement noise and parameter disturbances.
1. Introduction
In recent years, with the intensification of environmental pollution problem and energy shortage crisis, countries around the world have increased the development and utilization of clean energy [1]. In the field of transportation, the promotion of electrical vehicles has been favored. To some countries, it is regarded as one essential part of national strategy. The battery management system (BMS) plays a great important role in electrical vehicles. Specifically, the function of BMS mainly includes battery status detection, battery status analysis, battery safety protection, and energy control management. Battery status analysis is the basic of BMS and it includes state of charge estimation, state of health estimation, state of power estimation, and state of energy estimation. State of charge (SOC) estimation is the basis of battery status analysis. Unlike voltage or temperature, it can’t be measured directly. Usually SOC is estimated using discharging current, terminal voltage, temperature information, and so on. There are a lot of research about SOC estimation, yet no method can meet all SOC estimation performance indicators.
A lot of SOC estimation methods have been proposed in recent literature. Generally speaking, they can fall into two categories: non-model based method and model based method. Non-model based methods include the coulomb counting method, the open circuit voltage method, the discharging experiment method, the load voltage method, and so on. The procedure of discharging experiment method is as follows: Discharge the tested battery with small constant current to the cut-off voltage, then multiply current value with time and take the product as the remaining charge of the tested battery. The principle of this method is simple and easily implemented in hardware. It can be very precise if the precision of the equipment is sufficient. It is often taken as a standard for verifying the accuracy of other SOC estimation methods. The coulomb counting method [2,3,4] is another commonly used SOC estimation method. By integrating the current with time, this method takes the integral value as the amount of charge change during discharging or charging process and the SOC is obtained by subtracting the charge change from initial SOC. Being vulnerable to current noise and lack of dealing with initial SOC error problem make it unsuitable for practical application. The open circuit voltage method [5,6,7] performs SOC estimation based on the correspondence between open circuit voltage and battery state of charge. The biggest drawback of this method is that it requires the battery to stand for a long time so that its terminal voltage can equal to open circuit voltage. This is unpractical for electric vehicles.
Model based methods include Kalman filter (KF), observer-based methods, neural network, and so on. Kalman filter [8], which is also known as linear quadratic estimation, is an algorithm that uses a series of measurements of system to produce estimates of unknown state variables. The traditional Kalman filter can only deal with estimation problem for linear system. To extend its application to nonlinear system, various adjustments are introduced to Kalman filter. The extended Kalman filter (EKF) [9,10,11,12,13,14] computes the Jacobian matrix of nonlinear part (process model or observation model or both) of the system at each timestep. Then the matrix can be used in linear Kalman filter. For highly non-linear system, the unscented Kalman filter [15,16,17,18] introduces a deterministic sampling technique called unscented transformation (UT) to pick a set of sigma points around the mean. Then a new mean and covariance are formed through propagating the former sigma points. Under certain condition, the UKF method has been proven to be more accurate than EKF. Other improved Kalman filters include the cubature Kalman filter [19], the adaptive Kalman filter [20], and so on. Kalman-based filters have significant drawbacks. First, they contain a large number of matrix operations, which is almost impossible to implement for the BMS system with limited computing power. Second, they require a full understanding of noise characteristics in advance, which is not realistic in practice. Besides, the performance of Kalman filter is sensitive to the initial setting of the covariance matrix. The estimation result may diverge if the parameters isn’t properly selected. Observer-based methods include the Luenberger observer [21,22], the sliding mode observer [23,24,25,26,27,28,29,30,31,32]. The advantage of observer-based methods is that the parameters of these methods are designed to let the observer be stable. Since there are no complex matrix operations in the estimation process. The computation cost of observer-based methods is far less than the Kalman-based filters, while the drawback of observer-based methods is that the parameters are difficult to designed.
This paper improves the performance of sliding mode observer by introducing the fuzzy logic controller, to form the new fuzzy logic sliding mode observer (FLSMO) for SOC estimation. A series of tests are implemented to verify the performance of FLSMO algorithm. The test results show that the FLSMO algorithm has high SOC estimation accuracy and considerable convergence rate. It has better performance than the sliding mode observer and the extended Kalman filter in terms of robustness against current, voltage noise, and parameter disturbance.
The remainder of the paper is organized as follows. In Section 2, the second order equivalent circuit model is introduced. Besides, this section presents the test bench and parameter identification method used in this paper. Section 3 details the design of the fuzzy logic sliding mode observer. Section 4 discuss the results of FLSMO performance tests. And Section 5 summarizes the paper.
2. Battery Model
2.1. Battery Equivalent Circuit Model
The battery performs complex redox reactions during charging and discharging process. And this process is reflected by external changes in characteristic parameters, such as changes in the open circuit voltage of the battery, an increase in the surface temperature of the battery. The role of a battery model is to describe the correspondence between the redox reaction occurring inside and the external characteristic parameters. Different battery models are usually established according to different user requirements. For example, the thermal model has an important application in the thermal analysis of the battery BMS system. The battery model not only helps us understand the battery reaction mechanism, but also helps us make better use of battery. As for SOC estimation, the accuracy of the battery model directly affects the accuracy of SOC estimation. The internal polarization phenomenon of lithium battery has obvious delay effect in the change of terminal voltage during charging and discharging. And this hysteresis effect is similar to the hysteresis effect of the resistance-capacitance network of the circuit. Therefore, researchers have proposed several equivalent circuit models with different structures to simulate the external characteristics of the battery. Equivalent circuit models are composed of common electronic components such as resistors, capacitors, inductors, voltage sources, and so on. Common equivalent circuit models include the Rint model, the PNGV model, and the Thevenin equivalent circuit model. Usually model accuracy can be improved by adding resistor-capacitor networks, while this will inevitably increase the complexity of model. Weighing model accuracy and complexity, this paper chooses the second-order resistor-capacitor (RC) network ECM to simulate the external characteristic of battery. The schematic diagram of second-order RC model is show in Figure 1. It consists of a voltage source, a resistor, and two resistor-capacitor networks. A huge advantage of this model is that every component in this model has specific meaning correspond to the Li-ion battery. The voltage source UOC(SOC) represents the nonlinear relationship between the open circuit voltage (OCV) and SOC. R0 represents the ohmic resistance of the battery. R1 and C1 denote the electrochemical polarization resistance and capacitances, respectively. R2 and C2 stand for concentration polarization resistance and capacitance, respectively.
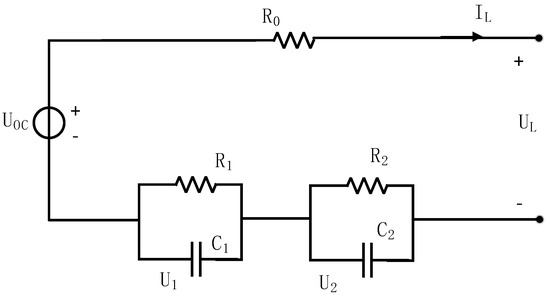
Figure 1.
Schematic diagram of second-order resistor-capacitor (2RC) equivalent circuit model.
This paper chooses U1, U2, and SOC as state variable and terminal voltage UL as the observed variable. Then the state space equation can be derived as follows,
In Equation (1), the QN is the capacity of the battery which could be obtain by capacity test. IL represents the load current. Positive IL represents discharging process and negative IL represents charging process. The observation equation is as follows
Let x = [U1, U2, SOC], then Equation (1) can be rewritten as
In Equation (3), the value of A and B is
2.2. The Test Bench
The tested battery is Lithium Cobalt Oxide battery (ICR18650-22P SAMSUNG SDI). Details about the battery and test conditions are listed in Table 1. The discharging and charging process is performed in Arbin BT-5HC battery test system. The current and voltage measurement accuracy of the equipment is 0.02% full scale range (FSR). The sampling time is 1 s. The Mits Pro is used to make charging/discharging strategy, send control signals and receive data from the equipment. After the charging/discharging process finishes, the data is imported to MATLAB 2016a for analysis. Figure 2 is the schematic diagram of the test bench.

Table 1.
Specifications of the tested battery.
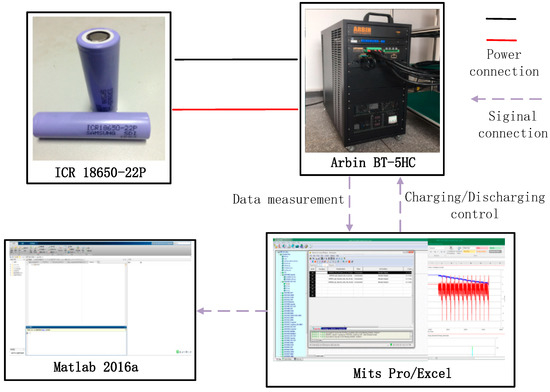
Figure 2.
Schematic diagram of the test bench.
2.3. OCV-SOC Calibration Test and Fitting
The correspondence between open circuit voltage and state of charge is one of the most important characteristics of a lithium battery. Unlike battery capacity, the OCV-SOC relationship is less affected by discharge rate, temperature, and battery aging. Therefore, it can be used to determine SOC of the battery. Here the following steps are used to measure OCV of the battery: (1) Fully charge the battery with CC-CV method and set aside for 2 h; (2) Measure the terminal voltage and record it as the OCV of the battery at 100% SOC; (3) Discharge the battery to 95% SOC at 0.2C and set aside for 2 h; (4) Measure the terminal voltage of the battery and record it as the OCV of the battery at 95% SOC; (5) repeat step (3) and step (4) to get the OCV of the battery at 90%, 80%, 70%, 60%, 50%, 40%, 30%, 20%, 10%, 5%, 0% SOC, separately. The measured data are listed in Table 2.
Table 2.
Measured OCV at different state of charges (SOCs).
This section uses piecewise linear fitting method to outline the correlation between OCV and SOC. In order to ensure continuous change of OCV with SOC, the fitting interval is consistent with the measurement interval, and the measured data at endpoint is used to determine the line expression directly. the calculation results of the slope k and the intercept b are shown in Table 3, Figure 3 shows comparison between the fitting lines and measured data, in which we can see the piecewise line fitting method is effective.
Table 3.
Piecewise linear fitting results.
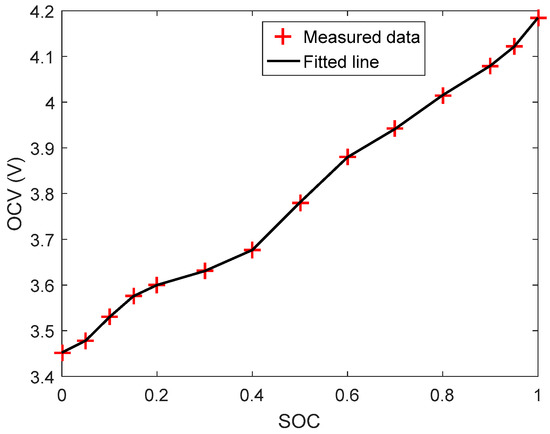
Figure 3.
Measured and fitted OCV vs. SOC.
2.4. Parameter Identification
The parameters of 2RC equivalent circuit model can be determined by exponential fitting method. To be more specific, the transient response of terminal voltage when the discharging process stops can be expressed as Equation (6) according to circuit principle. t represents transition time variable in Equation (6). At the same time, the transient response can be fitted by exponential expression shown in Equation (7). k0, k1, k2, λ1, λ2 represent parameters of exponential function that need to be determined.
considering Equations (6) and (7) refer to the same process, the corresponding coefficient should be the same, then we can determine the parameters as Equation (8).
R0 represents the ohmic internal resistance. The voltage difference caused by R0 is instantaneous. Therefore, the voltage change in a short time after stopping discharge can be used to determine R0. Here, The R0 value is calculated as Equation (9). In Equation (9), the interval is 1 s.
The parameters of 2RC equivalent circuit model varies with SOC. Here the parameters result under different SOCs are listed in Table 4.
Table 4.
Parameters of the 2RC equivalent circuit model under different SOCs.
3. Fuzzy Logic Sliding Mode Observer
Design of Fuzzy Logic Sliding Mode Observer for SOC Estimation
Sliding mode observer is a successful application of variable structure control theory in the field of state observer. The core idea is to force the system state to move to the artificially designed trajectory by introducing a discontinuous control signal into the state observer [33], Once the state enters the sliding mode zone, it will maintain a small amplitude, high frequency up and down motion along a specified state trajectory. The traditional SMO with constant switching gains has been proven effective against model errors and parameter disturbance [34]. But inappropriate gain values may lead to poor track performance or chattering phenomenon. This paper introduces a sliding factor, which is optimized by a fuzzy logic controller, to solve this problem.
Considering the model errors and parameter disturbance, state space Equation (3) can be rewritten as
In Equation (10), denotes the model errors and parameter disturbance, T is noise input matrix and is assumed to be bound , in which is constant. , is the slope of the line which has been determined in Section 2.3. the sliding mode observer is designed as follow:
in which Luenberger feedback matrix K and sliding mode gain h need to be designed carefully to make sure that the observer is stable. is ideal switching function defined as follows:
The value of K can be determined using pole place method. For real symmetrical positive definite (SPD) matrix Q, there exists an SPD matrix P as the only solution to the Lyapunov Equation (13).
At the same time, it is assumed that the Lyapunov pair (P, Q) satisfies Equation (1). For lithium battery model, this assumption is always true [3],
State estimation error is defined as . By substituting Equations (10) and (11) into , we can get:
In which is defined as . The Lyapunov function is chosen as:
Since , is true when . By substituting Equation (15) into , we can get:
Since Q is SPD, the first item of is negative, for the second item of , it can be easily proved that, when , Equations (18) and (19) is true.
Therefore, we have proved the sliding mode observer is stable. Here, substitute the values of the parameters into the above formula, and let the pole of is vector R = [−0.01, −0.001, −0.1], using place() in MATLAB, we can get the Luenberger matrix . T is selected as and h is selected as 0.1.
Figure 4 show SOC estimation result with the SMO algorithm under Federal Urban Driving Schedule (FUDS) condition. From Figure 4a, we can see that the estimation process is stable. The average SOC estimation error is 1.4% and the max SOC estimation error is 3.6%. But the drawback of the SMO is very obvious. From the partial enlargement in Figure 4a,b, the SOC estimation error is enlarged because of the “chattering” reason. In this paper, we introduce a sliding factor to weak the “chattering” influence and the fuzzy logic controller is designed to determine the value of .
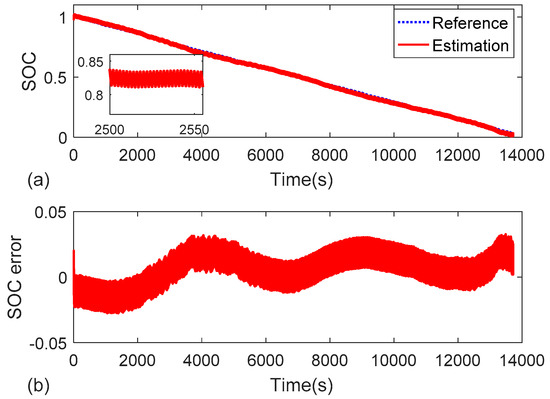
Figure 4.
SOC estimation result with sliding mode observer (SMO) under Federal Urban Driving Schedule (FUDS) condition. (a) SOC; (b) SOC error.
The crisp input variables of the fuzzy logic controller are the observation error and variation in observation error . The crisp output variable is the value of . Usually, is bounded in ±0.2 V, and is bounded in ±0.05 V. reflects the proportion of sliding mode feedback in the entire feedback amount. It is bounded in 0 to 1. The domain of can be discretized into [−4, −3, −2, −1, 0, 1, 2, 3, 4]. The domain of can be discretized into [−2, −1, 0, 1, 2]. And the domain of output variable can be discretized into [−4, −3, −2, −1, 0, 1, 2, 3, 4]. We use the linguistic variable E to represent , and EC stands for . U stands for . The term set of fuzzy input E is designed as {“Positive Big” (PB), ”Positive Small” (PS), “Zero” (ZO), “Negative Small” (NS), “Negative Big” (NB)}. Considering that EC varies more slowly than E, The term set of fuzzy input EC is designed as {“Positive Big” (PB), ”Zero” (ZO), ”Negative Big” (NB)}. And the term set of fuzzy output U is designed as {“Positive Big” (PB), ”Positive Small” (PS), “Zero” (ZO), “Negative Small” (NS), “Negative Big” (NB)}. From the corresponding relation between crisp domain and discretized domain, we can calculate the values of quantization factor KE, KEC, and scale factor KU.
The membership functions of E, EC, and U take the form of trigonometric function. Figure 5 shows the details about the functions.
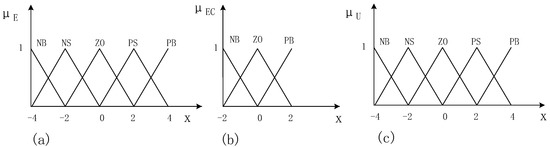
Figure 5.
Membership function of linguistic variable: (a) E; (b) EC; (c) U.
According to the characteristics of lithium battery model, the fuzzy control rules can be established as Table 5.
Table 5.
Fuzzy control rule.
Fuzzy inference is one of the most important part in the fuzzy logical controller. In this paper, the fuzzy relation matrix R can be derived from Table 5, then we can calculate the fuzzy output set according to Equation (20). In Equation (20), e represents the vector composed of fuzzy input E and EC. And the calculating sign denotes fuzzy relational synthesis.
After getting the fuzzy output of U, we need to convert it to crisp value with specific defuzzification rule. In this paper, we adopt the Max-Membership method to defuzzify the result. That is to say, we take the term U* from the fuzzy set with the highest membership as the final fuzzy output result. If there are several terms with the same membership, then the average value is calculated. The crisp value of can be derived from Equation (21).
So, the fuzzy logic sliding mode observer for SOC estimation is designed as Equation (22),
In Equation (22), is updated by the fuzzy logic controller designed as above.
4. Discussion
4.1. Estimation Accuracy Test
The FUDS schedule is applied in this test. First, we used the test bench to discharge the tested battery to obtain voltage data and current data during the discharging process. Then we used the FLSMO algorithm to estimate the SOC of battery. The SOC estimation result and terminal voltage estimation result are shown in Figure 6 and Figure 7, separately.
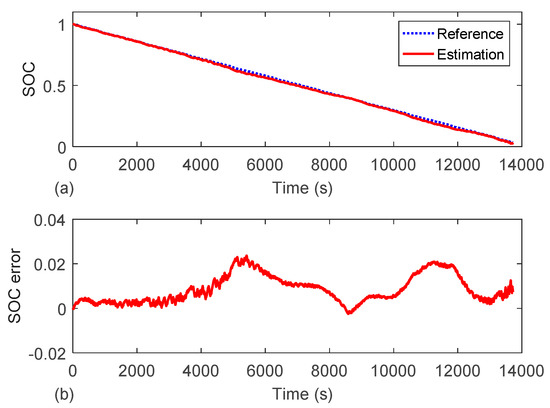
Figure 6.
SOC estimation result under FUDS condition: (a) SOC; (b) SOC error.
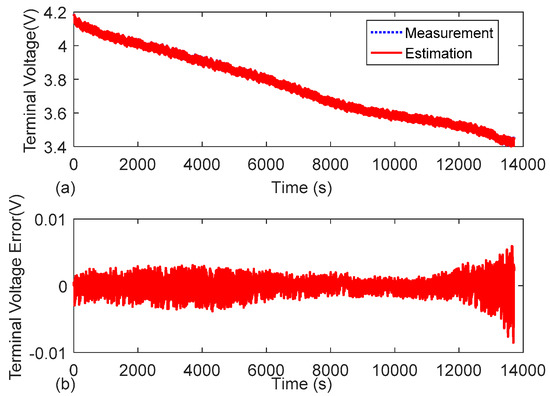
Figure 7.
Terminal voltage estimation result: (a) Terminal voltage; (b) Estimation error.
From Figure 6 and Figure 7, we can see that the FLSMO algorithm can track the terminal voltage relatively accurately, with voltage estimation error less than 0.1V. The average SOC estimation error is 0.86%, and the maximum estimation error is 2.37%. The estimation accuracy of the FLSMO algorithm can well meet the need of practical application.
4.2. Convergence Rate Test
One of the biggest drawbacks of the coulomb counting method is that it cannot tackle problems caused by inaccurate initial SOC. In practice, this problem is quite common because of the self-discharge effect of lithium battery. So, it is of vital importance for the SOC estimation algorithm to have a high convergence speed. In this test, the FUDS schedule is applied. We set the initial SOC value as 80%, while the true SOC is 100%. The SOC estimation result is shown in Figure 8. From Figure 8, we can see that the FLSMO algorithm can converge to 3% error boundary within 2400s. The estimation process is stable and the convergence performance of FLSMO algorithm can be optimized by further research.
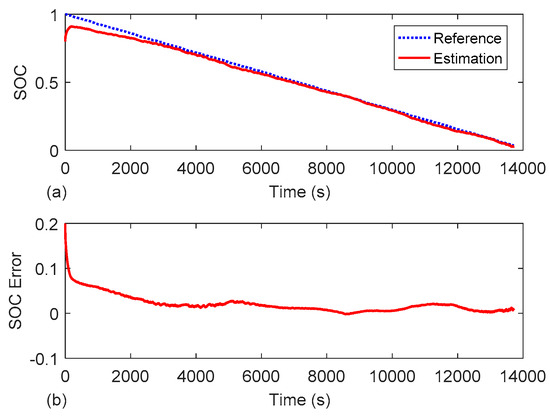
Figure 8.
SOC estimation result with 20% initial error under FUDS schedule: (a) SOC; (b) SOC error.
4.3. Robustness Against Current and Voltage Noise
In practical application, the voltage and current data are inaccurate because of sensor error and electromagnetic interference and so on. The Arbin battery test equipment used in this paper has a high estimation accuracy. In order to test the robustness against current and voltage noise of the FLSMO algorithm, the offset noise and random noise are used. To contrast, the SMO algorithm and the EKF algorithm are also applied in this test. To be more specific, the current noise includes 0.1 A offset, 0.5 A offset, and 0.1 A random noise. The voltage noise includes 0.02 V offset, 0.05V offset, and 0.01 V random noise. The WUVSUB schedule is applied. The estimation result of different method under different noise condition is shown in Figure 9. The mean of absolute error (MAE), maximum error (MaxE), and root mean square error (RMSE) are recorded in Table 6. From Figure 9 and Table 6, it is clear that the FLSMO algorithm has better performance than the SMO algorithm and EKF algorithm in terms of robustness against current and voltage noise.
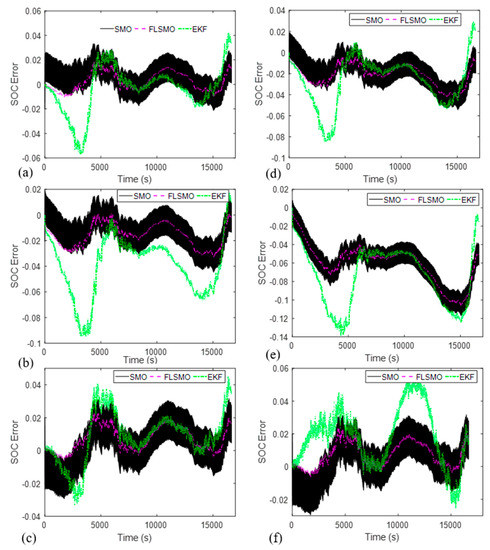
Figure 9.
SOC estimation error under different noise type: (a) 0.1 A current offset; (b) 0.5 A current offset; (c) 0.1 A current random; (d) 0.02 V voltage offset; (e) 0.05 V voltage offset; (f) 0.01 V voltage random.
Table 6.
SOC estimation error under different noise.
4.4. Robustness Against Parameter Disturbance
To verify robustness against parameter disturbance of the FLSMO algorithm, the New European Driving Cycle (NEDC) schedule test is implemented under 5, 25, and 45 °C, separately. The SOC estimation results are shown in Figure 10 and Table 7. In different temperature, the parameters of 2RC equivalent circuit model varies greatly. The SOC estimation error becomes larger under 5 and 45 °C, compared with 25 °C, while the FLSMO algorithm has a smaller estimation error than the SMO algorithm and EKF algorithm under all temperature conditions. This test result shows that the FLSMO has better performance than the SMO algorithm and EKF algorithm in terms of robustness against parameter disturbance.
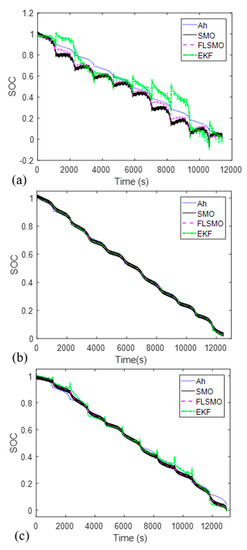
Figure 10.
SOC estimation results under different temperature: (a) 5 °C; (b) 25 °C; (c) 45 °C.
Table 7.
SOC estimation error under different temperature.
5. Conclusions
This paper proposes a novel fuzzy logic sliding mode observer for SOC estimation. First, the second-order RC equivalent circuit model is introduced to describe the dynamic behavior of the battery. The parameters of the model are derived by exponential fitting method. This paper uses piecewise linear fitting method to denotes the correspondence between the battery OCV and SOC. The fuzzy logic controller is used to improve the performance of traditional sliding mode observer. The discharging test results show that the FLSMO algorithm has high SOC estimation accuracy, considerable convergence rate. Compared with sliding mode observer and the extended Kalman filter, the FLSMO algorithm has better performance with regard to robustness against measurement noise and parameter disturbance.
Author Contributions
B.X. and W.Z. proposed the fuzzy logic sliding mode observer algorithm. W.W. and Y.L. prepared the necessary equipment for the test. M.W. and H.W. gave constructive suggestions for the test. W.Z. wrote the paper.
Funding
This research received no external funding.
Acknowledgments
This research was funded by the Shenzhen Economic, Trade and Information Commission of Shenzhen Municipality Strategic Emerging Industries and Future Industrial Development “Innovation Chain + Industrial Chain” Project (2017) and National Natural Science Foundation of China (Grant No. 51877120).
Conflicts of Interest
The authors declare that there is no conflict of interest.
References
- Zou, C.; Manzie, C.; Nešić, D.; Kallapur, A.G. Multi-time-scale observer design for state-of-charge and state-of-health of a lithium-ion battery. J. Power Sources 2016, 335, 121–130. [Google Scholar] [CrossRef]
- Ng, K.S.; Moo, C.-S.; Chen, Y.-P.; Hsieh, Y.-C. Enhanced coulomb counting method for estimating state-of-charge and state-of-health of lithium-ion batteries. Appl. Energy 2009, 86, 1506–1511. [Google Scholar] [CrossRef]
- Zhao, L.; Lin, M.; Chen, Y. Least-squares based coulomb counting method and its application for state-of-charge (soc) estimation in electric vehicles. Inter. J. Energy Res. 2016, 40, 1389–1399. [Google Scholar] [CrossRef]
- Misyris, G.S.; Doukas, D.I.; Papadopoulos, T.A.; Labridis, D.P.; Agelidis, V.G. State-of-charge estimation for li-ion batteries: A more accurate hybrid approach. IEEE Trans. Energy Convers. 2019, 34, 109–119. [Google Scholar] [CrossRef]
- Dang, X.; Yan, L.; Xu, K.; Wu, X.; Jiang, H.; Sun, H. Open-circuit voltage-based state of charge estimation of lithium-ion battery using dual neural network fusion battery model. Electrochim. Acta 2016, 188, 356–366. [Google Scholar] [CrossRef]
- Xing, Y.; He, W.; Pecht, M.; Tsui, K.L. State of charge estimation of lithium-ion batteries using the open-circuit voltage at various ambient temperatures. Appl. Energy 2014, 113, 106–115. [Google Scholar] [CrossRef]
- Lee, S.; Kim, J.; Lee, J.; Cho, B.H. State-of-charge and capacity estimation of lithium-ion battery using a new open-circuit voltage versus state-of-charge. J. Power Sources 2008, 185, 1367–1373. [Google Scholar] [CrossRef]
- Barbarisi, O.; Vasca, F.; Glielmo, L. State of charge kalman filter estimator for automotive batteries. Control. Eng. Pract 2006, 14, 267–275. [Google Scholar] [CrossRef]
- Plett, G.L. Extended kalman filtering for battery management systems of lipb-based hev battery packs—part 1. Background. J. Power Sources 2004, 134, 252–261. [Google Scholar] [CrossRef]
- Plett, G.L. Extended kalman filtering for battery management systems of lipb-based hev battery packs—part 2. Modeling and identification. J. Power Sources 2004, 134, 262–276. [Google Scholar] [CrossRef]
- Plett, G.L. Extended kalman filtering for battery management systems of lipb-based hev battery packs—part 3. State and parameter estimation. J. Power Sources 2004, 134, 277–292. [Google Scholar] [CrossRef]
- Sepasi, S.; Ghorbani, R.; Liaw, B.Y. Improved extended kalman filter for state of charge estimation of battery pack. J. Power Sources 2014, 255, 368–376. [Google Scholar] [CrossRef]
- Vasebi, A.; Partovibakhsh, M.; Bathaee, S.M.T. A novel combined battery model for state-of-charge estimation in lead-acid batteries based on extended kalman filter for hybrid electric vehicle applications. J. Power Sources 2007, 174, 30–40. [Google Scholar] [CrossRef]
- Hongwen, H.; Rui, X.; Xiaowei, Z.; Fengchun, S.; JinXin, F. State-of-charge estimation of the lithium-ion battery using an adaptive extended kalman filter based on an improved thevenin model. IEEE Trans. Veh. Technol. 2011, 60, 1461–1469. [Google Scholar] [CrossRef]
- Sun, F.; Hu, X.; Zou, Y.; Li, S. Adaptive unscented kalman filtering for state of charge estimation of a lithium-ion battery for electric vehicles. Energy 2011, 36, 3531–3540. [Google Scholar] [CrossRef]
- Meng, J.; Luo, G.; Gao, F. Lithium polymer battery state-of-charge estimation based on adaptive unscented kalman filter and support vector machine. IEEE Trans. Power Electr. 2016, 31, 2226–2238. [Google Scholar] [CrossRef]
- Tian, Y.; Xia, B.; Sun, W.; Xu, Z.; Zheng, W. A modified model based state of charge estimation of power lithium-ion batteries using unscented kalman filter. J. Power Sources 2014, 270, 619–626. [Google Scholar] [CrossRef]
- He, W.; Williard, N.; Chen, C.; Pecht, M. State of charge estimation for electric vehicle batteries using unscented kalman filtering. Microelectron. Reliab. 2013, 53, 840–847. [Google Scholar] [CrossRef]
- Chen, L.; Xu, L.; Wang, R. State of charge estimation for lithium-ion battery by using dual square root cubature kalman filter. Math. Prob. Eng. 2017. [Google Scholar] [CrossRef]
- Sepasi, S.; Ghorbani, R.; Liaw, B.Y. A novel on-board state-of-charge estimation method for aged Li-ion batteries based on model adaptive extended Kalman filter. J. Power Sources 2014, 245, 337–344. [Google Scholar] [CrossRef]
- Zheng, L.; Jiang, J.; Wang, Z.; Zhao, T.; He, T. Embedded implementation of soc estimation based on the luenberger observer technique. In Proceedings of the 2014 IEEE Conference and Expo Transportation Electrification Asia-Pacific (ITEC Asia-Pacific), Beijing, China, 31 August–3 September 2014. [Google Scholar]
- Lievre, A.; Pelissier, S.; Sari, A.; Venet, P.; Hijazi, A. Luenberger observer for soc determination of lithium-ion cells in mild hybrid vehicles, compared to a kalman filter. In Proceedings of the 2015 Tenth International Conference on Ecological Vehicles and Renewable Energies (EVER), Monte Carlo, Monaco, 31 March–2 April 2015. [Google Scholar]
- Chen, X.; Shen, W.; Cao, Z.; Kapoor, A. Adaptive gain sliding mode observer for state of charge estimation based on combined battery equivalent circuit model. Comput. Chem. Eng. 2014, 64, 114–123. [Google Scholar] [CrossRef]
- Du, J.; Liu, Z.; Wang, Y.; Wen, C. An adaptive sliding mode observer for lithium-ion battery state of charge and state of health estimation in electric vehicles. Control. Eng. Pract. 2016, 54, 81–90. [Google Scholar] [CrossRef]
- Chen, X.; Shen, W.; Cao, Z.; Kapoor, A. A novel approach for state of charge estimation based on adaptive switching gain sliding mode observer in electric vehicles. J. Power Sources 2014, 246, 667–678. [Google Scholar] [CrossRef]
- Huangfu, Y.; Xu, J.; Zhao, D.; Liu, Y.; Gao, F. A novel battery state of charge estimation method based on a super-twisting sliding mode observer. Energies 2018, 11, 1211. [Google Scholar] [CrossRef]
- Chen, Q.; Jiang, J.; Liu, S.; Zhang, C. A novel sliding mode observer for state of charge estimation of ev lithium batteries. J. Power Electron. 2016, 16, 1131–1140. [Google Scholar] [CrossRef]
- Kim, I.S. The novel state of charge estimation method for lithium battery using sliding mode observer. J. Power Sources 2006, 163, 584–590. [Google Scholar] [CrossRef]
- Chen, X.; Shen, W.; Dai, M.; Cao, Z.; Jin, J.; Kapoor, A. Robust adaptive sliding-mode observer using rbf neural network for lithium-ion battery state of charge estimation in electric vehicles. IEEE Trans. Veh. Technol. 2016, 65, 1936–1947. [Google Scholar] [CrossRef]
- Kim, D.; Koo, K.; Jeong, J.; Goh, T.; Kim, S. Second-order discrete-time sliding mode observer for state of charge determination based on a dynamic resistance li-ion battery model. Energies 2013, 6, 5538–5551. [Google Scholar] [CrossRef]
- Ning, B.; Xu, J.; Cao, B.; Wang, B.; Xu, G. A sliding mode observer soc estimation method based on parameter adaptive battery model. Energy Procedia 2016, 88, 619–626. [Google Scholar] [CrossRef]
- Zhong, Q.; Zhong, F.; Cheng, J.; Li, H.; Zhong, S. State of charge estimation of lithium-ion batteries using fractional order sliding mode observer. ISA Trans. 2016. [Google Scholar] [CrossRef]
- Utkin, V.I. Variable structure systems with sliding modes. Ieee T Automat. Contr 1977, 22, 212–222. [Google Scholar] [CrossRef]
- Zhang, F.; Liu, G.; Fang, L.; IEEE. A battery state of charge estimation method using sliding mode observer. In Proceedings of the 2008 7th World Congress on Intelligent Control and Automation, Chongqing, China, 25–27 June 2008. [Google Scholar]
© 2019 by the authors. Licensee MDPI, Basel, Switzerland. This article is an open access article distributed under the terms and conditions of the Creative Commons Attribution (CC BY) license (http://creativecommons.org/licenses/by/4.0/).