Article

Analysis of Building Electricity Use Pattern Using K-Means Clustering Algorithm by Determination of Better Initial Centroids and Number of Clusters

Department of Architecture, Chubu University, 487-8501 Kasugai, Japan
*
Authors to whom correspondence should be addressed.
Energies 2019, 12(12), 2451; https://doi.org/10.3390/en12122451
Submission received: 6 May 2019 / Revised: 31 May 2019 / Accepted: 23 June 2019 / Published: 25 June 2019
(This article belongs to the Section G: Energy and Buildings)

Abstract

:
Energy demands in the building sector account for more than 30% of the total energy use and more than 55% of the global electricity demand. Efforts to develop sustainable buildings are progressing but are still not keeping pace with the growing building sector and the rising demand for energy. Analyzing the energy use pattern of buildings and planning for energy conservation in existing buildings are essential. In this research, we propose a method to analyze the energy use pattern in a building using the K-means clustering method. Initial centroids in K-means clustering are chosen randomly so that the clustering result changes every time. This instability is removed in the proposed method by the selection of initial centroids using a percentile method based on empirical cumulative distribution. The results from the proposed method have better accuracy, and the internal cohesion and separation between clusters are better than the random initialization method. Analyzing yearly electricity use using the proposed clustering method, the daily pattern of electricity use can be categorized according to the operation of buildings. For this purpose, in this research, electricity use pattern was analyzed for three to six clusters. In comparison with the university schedule, six clusters were found to be appropriate and the accuracy was 89.3%. Once daily electricity use are categorized, base electricity consumption, electricity consumption by human activities, and electricity consumption by air-conditioning can be determined. As energy consumption by usage is clarified, measures for energy consumption in university buildings can be proposed.

1. Introduction

The energy demand of the building sector accounts for more than 30% of the total energy consumption and more than 55% of the global electricity demand. Efforts to develop sustainable buildings are progressing but are still not keeping pace with the increasing size of the building sector and the rising demand for energy [1]. Energy use pattern analysis and energy conservation planning are essential for the improvement of the energy conservation of existing buildings. Here, we propose an analytical method for the determination electricity use patterns in buildings using K-means clustering.
Clustering is a process of partitioning data objects into groups, or clusters, so that the objects within a cluster are similar to one another and dissimilar from the objects in other clusters [2]. Cluster analysis is an unsupervised learning method that acts as a cornerstone in intelligent data analysis processes. It is used for the exploration of interrelationships among a collection of patterns by organizing them into homogeneous clusters [3].
Clustering has a variety of applications in different domains, visualization, data mining and knowledge discovery, data compression and vector quantization, optimization, finance, manufacturing, and medical organizations [4]. Due to the improvement in sensors, data loggers, detection, and storage technology, and the remarkable progress in Internet searches, digital imaging, and video surveillance, an enormous amount of data are generated on a daily basis. This rapid increase in both the volume and types of data has necessitated the development of methodologies that can automatically understand, process, and summarize data. To address this problem, clustering techniques are helpful.
Among various clustering techniques, K-means, developed by MacQueen, is the most widely used. The simplicity of K-means means that the algorithm has been adopted in many fields. It is popular because it is able to quickly and efficiently cluster large amounts of data, including outliers. It remains a basic framework for developing numerical or conceptual clustering through various possibilities of distance and prototype choices.
Figure 1 represent the Aerial photograph of Chubu University, a private university in Japan located in the Aichi prefecture. It has seven departments and around 10,000 students studying in both science and non-science departments. Chubu University is located where yearly energy saving is required under the energy saving law in Japan.
In this research, a time series of building electricity use data was analyzed by a K-means clustering technique to study the building electricity use pattern of Chubu University. The results of K-means are not unique because it produces different results from randomly chosen initial centers. The K-means algorithm results can only be improved when the initial partitions that are chosen are close to the final solution [5]. Thus, in this research, a new method is introduced for the selection of better initial centroids in case of building energy time series data. The proposed method was used to analyze the electricity use pattern of Chubu University. Analyzing building energy time series data and abstracting useful information are time consuming processes. To conserve energy in university buildings, it is necessary to know when and how much electricity is being consumed. In this research, we show that selecting a proper number of clusters can provide information about electricity use patterns in university buildings. Since clustering is a machine learning process, this method is useful for considering efficiency, requiring significantly less time in comparison to manual pattern analysis. A better understanding of electricity use pattern can be obtained, which helps with choosing and implementing measures for energy conservation in university buildings.

Related Works

Several attempts have been made to try and solve the cluster centroid initialization problem. Amri et al. used K-means clustering to analyze the electricity use pattern of 370 clients collected from 2011 through 2014. Using a dimension reduction technique, whole data were reduced to four attributes. Each attribute represented the sum of the values of the four seasons: spring, summer, autumn, and winter. Then, the data were classified into five clusters using K-means clustering. As a result, the highest and lowest energy use in summer and spring were determined [6]. Damayanti et al. used the K-harmonic clustering technique for grouping a one-year electric load profile. One whole year of electrical use data were divided into two clusters. An electrical load profile was generated for both clusters. The first cluster pattern had an irregular load pattern dominated by holidays, whereas the second load profiles described the burden on weekdays due to the higher load demand of offices and industries [7]. Santamouris et al. used the intelligent fuzzy clustering technique to classify the energy performance of school buildings. Five energy clusters for both the total and the heating energy use were calculated. The clustering method was compared with the frequency rating procedure. The fuzzy clustering technique was found to produce more robust classes and classify the buildings according to existing similarities [8]. Arai and Barakbah proposed a hierarchical method to optimize the initial centroids for the K-means algorithm. This algorithm uses the clustering result of the K-means algorithm and then transforms all the centroids of the clustering result by combining with the hierarchical algorithm to determine the initial centroids for K-means. This method is better for complex clustering with large data sets and many attributes. However, this method takes advantage of the K-means algorithm for speed and precision [9]. Yedla et al. proposed a new method for finding better initial centroids and provided an efficient process of assigning data points to suitable clusters with reduced time complexity. In this method, the initial centroid is chosen by calculating the distance of each data point from the origin, then the data points are sorted and divided into k equal parts. Then, the middle point of each data point is taken as the initial centroid. This method was found to produce better initial centroids and provides an efficient method of assigning the data points to the suitable cluster [10]. Shakti and Thanamani proposed a method Kernel Principal Component Analysis (KPCA) for reducing the time complexity and improving the accuracy of K-means algorithm. For the dimension reduction technique, principle component analysis (PCA) is used and KPCA is an extended form of PCA. The time complexity of the K-means algorithm is high if a large dataset is used for clustering. Thus, before applying the K-means algorithm, the dimensions of the data are reduced using KPCA. This method is able to overcome the problem of the K-means algorithm for high-dimensional data [11]. Huang et al. proposed an automatic variable weighing method in the K-means algorithm that can automatically estimate the variable weights. The variable weights created by this approach estimate the significance of the variables in clustering and can be deployed in variable selection in various data mining applications where large and complex real data are often used. Identification and removal of insignificant variables according to the weight values was found to improve the clustering result [12]. Fahim et al. proposed a method for enhancing the performance of the K-means algorithm. In the original K-means algorithm, the distance between each point and cluster centroid is calculated in each iteration so the computational time is high. In this method, from the second iteration, distance is measured for only those points whose distance increased, decreasing computation time. However, the initial centroids are selected randomly so this method is sensitive to the initial centroid and also does not produce a unique result [13]. Prahastono et al. explained various clustering techniques (e.g., hierarchical, K-means, fuzzy K-means, follow the leader, and fuzzy relation) and their characteristics for the classification of customers and the generation of electric load profiles. Each clustering algorithm has its own peculiarities, so selection of the clustering algorithm depending on the data is essential [14]. Moliana-Solana et al. reviewed developments in information technologies and their influence on building energy management. Various aspects of data science for building energy management and techniques, like smart metering, the Internet of Things, and cloud computing that have been applied or could be applied to solve the energy problem, were discussed [15].
The literature summarized above proposed new methodologies for the selection of better initial centroids; however, regarding the selection of initial centroids for time series energy use data, little research has been conducted. The methodology used in this research for the determination of better initial centroids for building electricity use data has two major benefits: (1) the uncertainty of the K-means algorithm is removed because the results produced by the proposed method are the same irrespective of the number of trials and (2) the accuracy of proposed method is better than that of the K-means random initialization method.

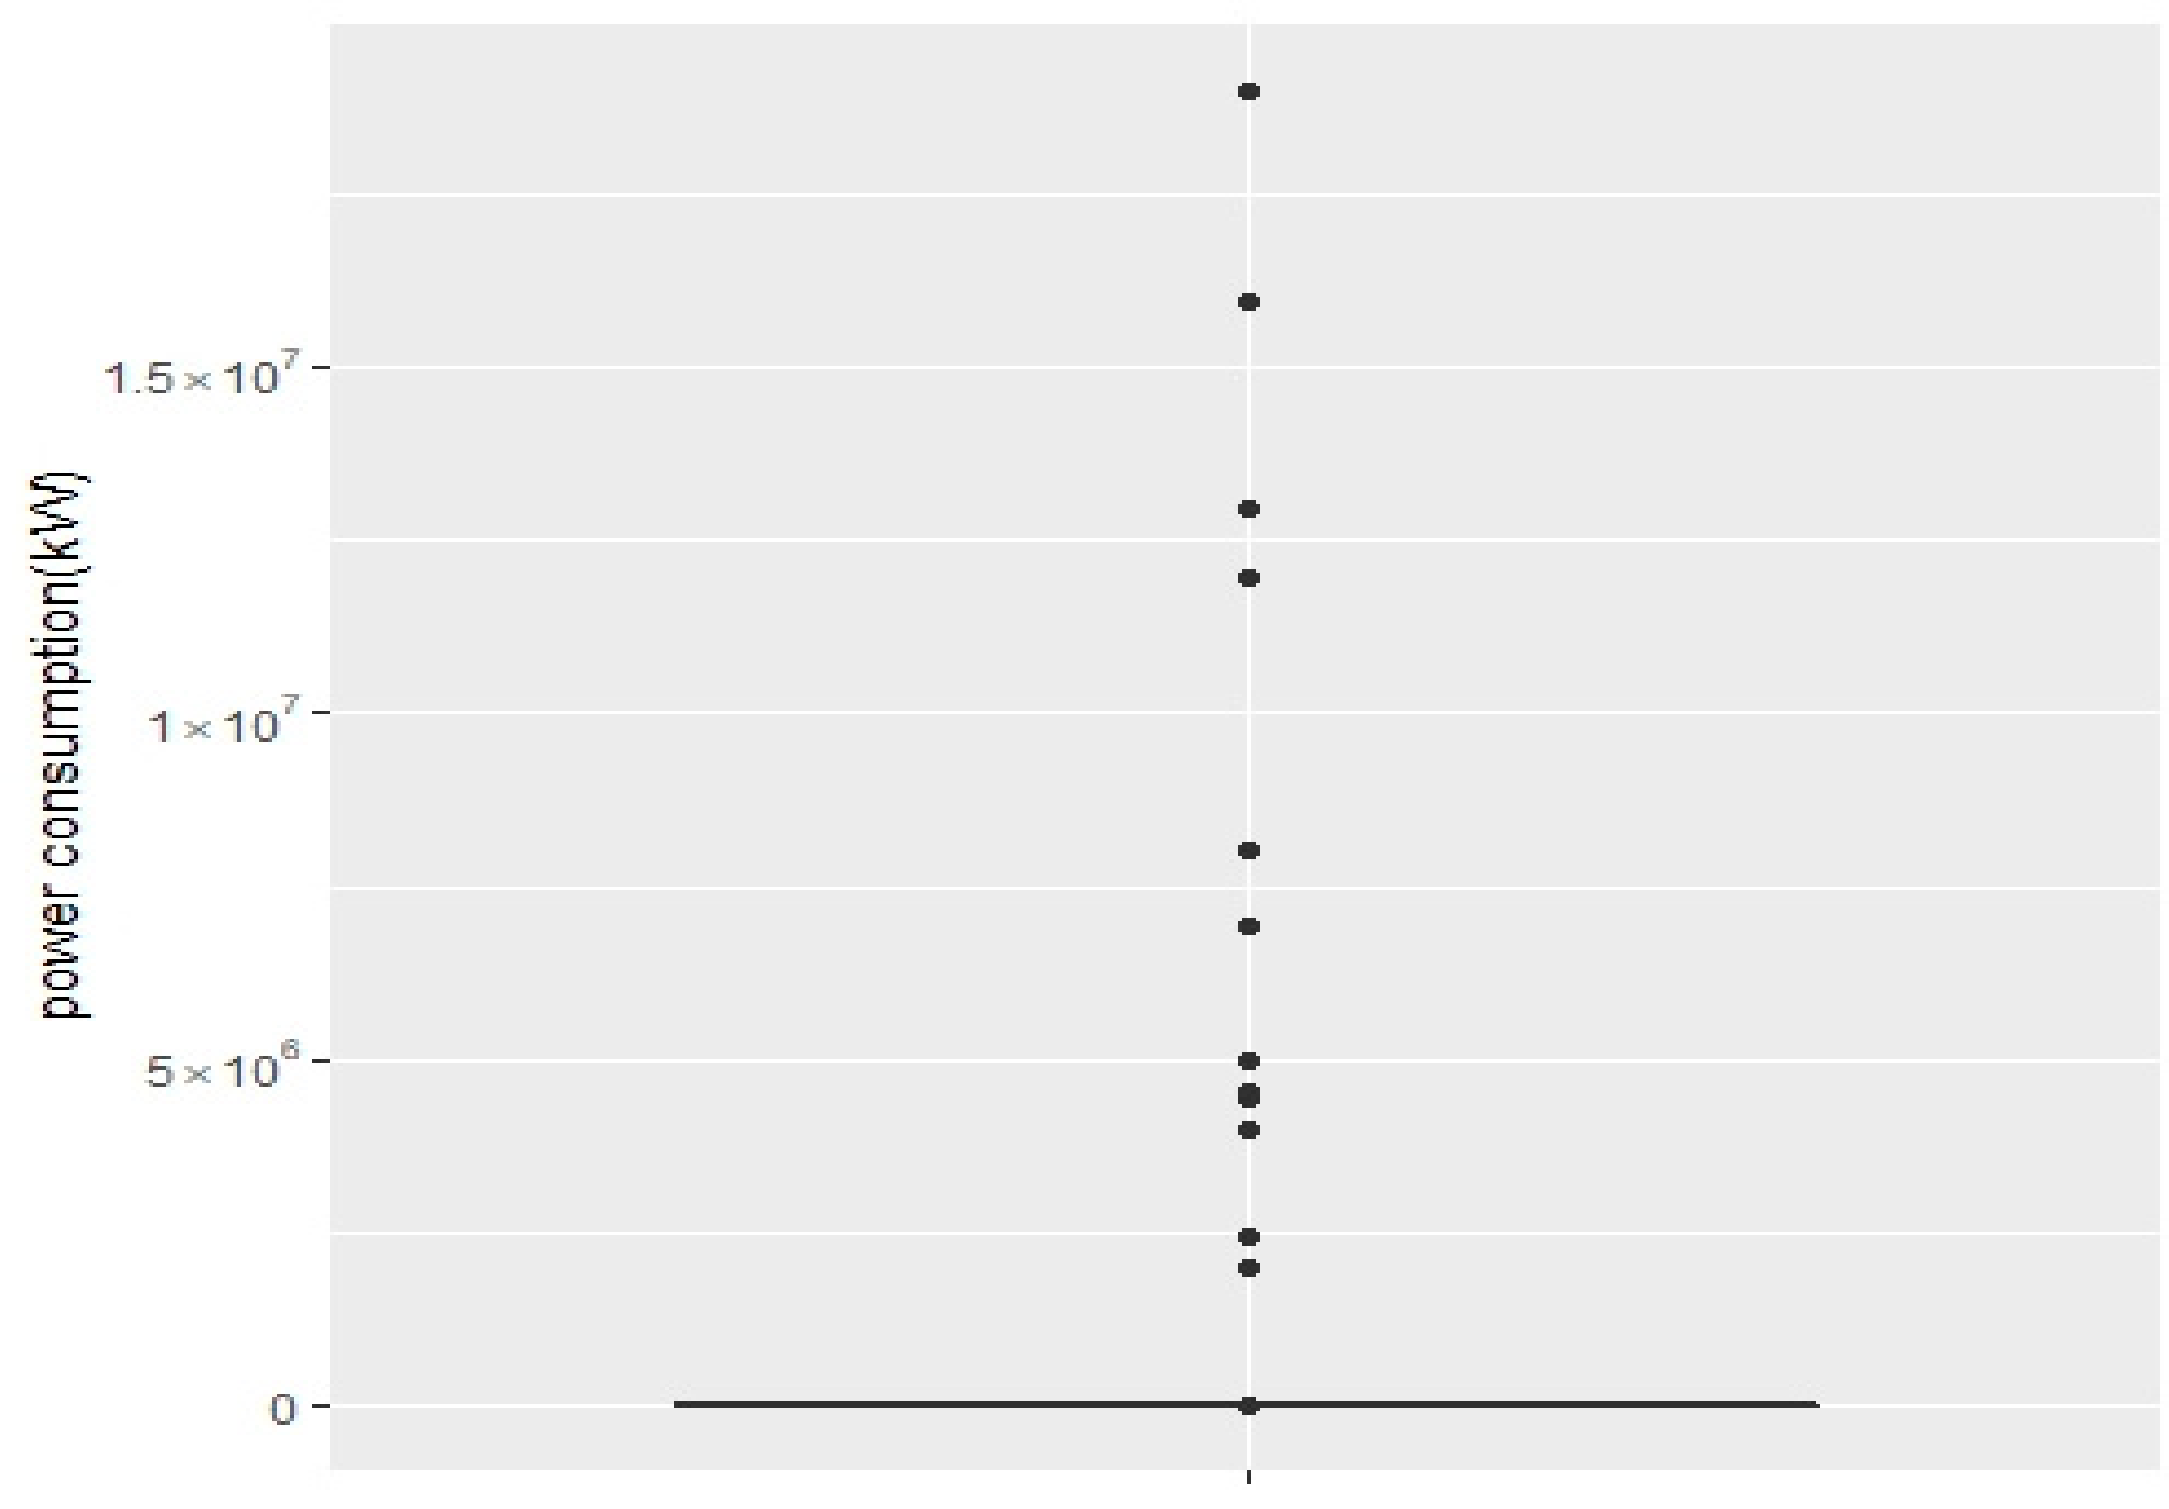
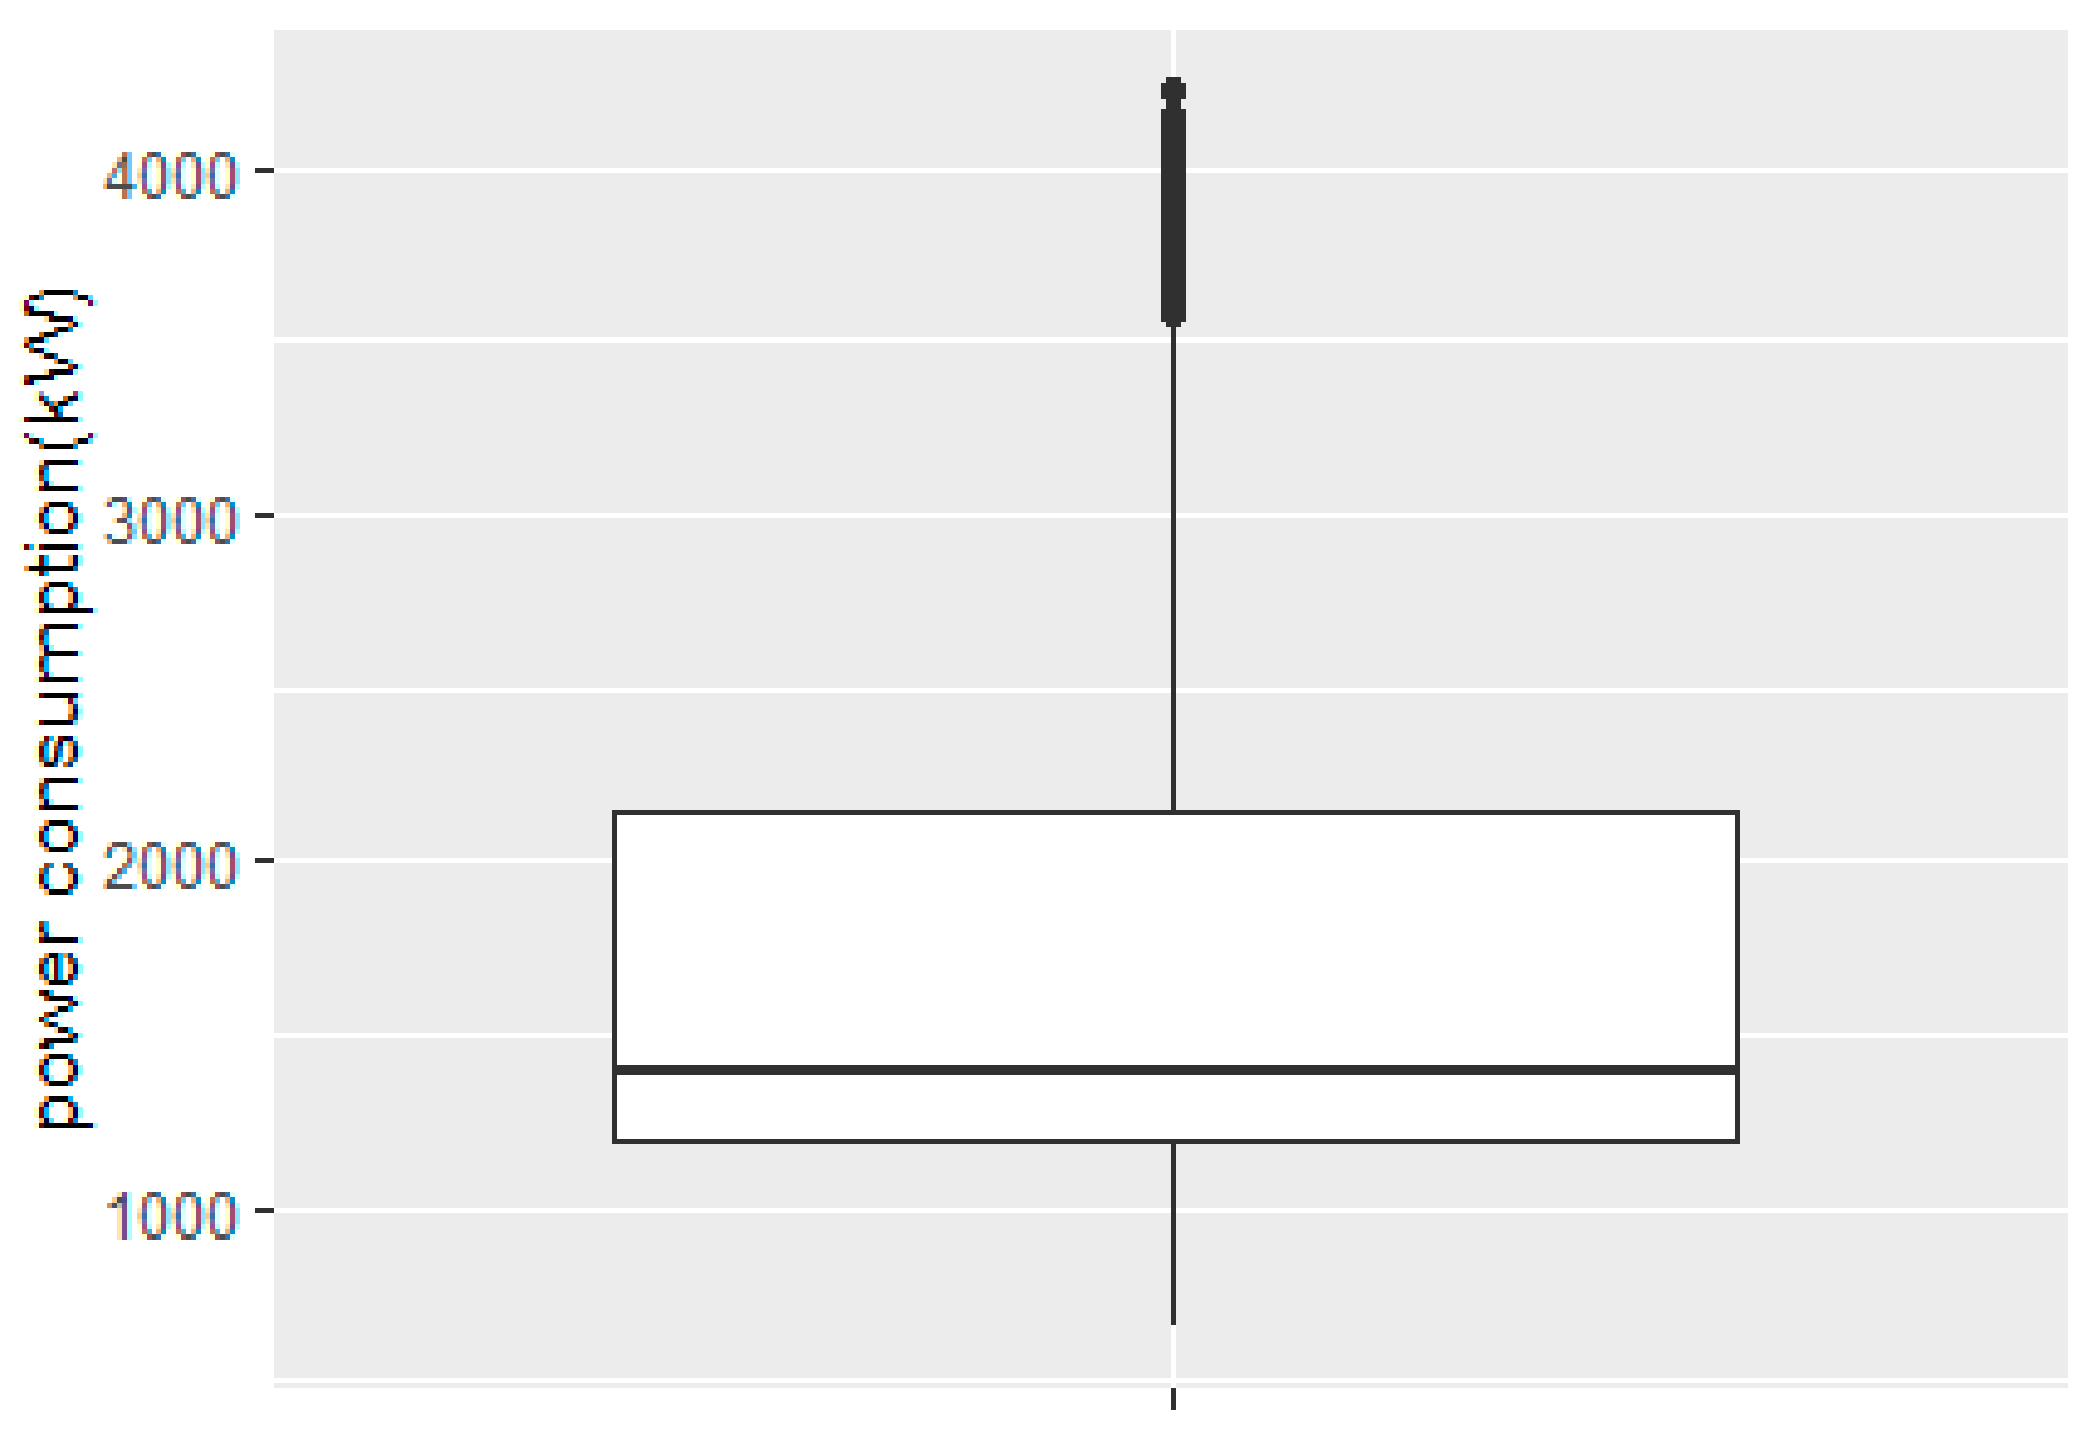
2. Outlier Detection and Imputation of Missing Values

An outlier is an observation that deviates from other observations to arouse suspicion that it was generated by a different mechanism; it may also be a noisy observation that does not fit the assumed model of the data [16]. Outliers commonly occur in building electricity use measurements. The presence of an outlier in clustering data may lead to an inappropriate result. If there are missing values in the clustering data, then clustering becomes impossible. However, simply dropping the fixed number of values as outliers may inadvertently cause the loss of important observations. Thus, in this research, to detect the outliers, the data were normalized to [0,1] using a min-max normalization technique. Outliers present in the data used in this research contain some extreme values thus, Tukey’s method, which uses quartiles for the detection of outliers, was preferred in this research. Normalization of the data using the min-max normalization technique was performed as shown in Equation (1):
x = x x m i n x m a x x m i n x m a x x m i n + x m i n
where x m a x and x m i n are the original maximum and minimum values of x, respectively. By using min-max normalization, the original values (x) are transformed to x in the range [ x m i n , x m a x ] = [0,1].
Tukey’s method [17] is less sensitive to extreme values because it uses quartiles that are resistant to extreme values. The interquartile range (IQR) is the distance between the lower (Q1) and upper (Q3) quartiles. The inner fence = [Q1 − 1.5 IQR, Q3 + 1.5 IQR], and the outer fence = [Q1 − 3 IQR, Q3 + 3 IQR]. The values that lie beyond the inner and outer fences are considered possible outliers, whereas the extreme values that lie beyond the outer fence are considered probable outliers. The data used in this research contained some extreme values compared to remaining data; as a result, not all were detected by inner fence so the outer fence was used for outlier detection. The outliers beyond the outer fence were converted into not available (NA) values. Then, the NA values were imputed with appropriate values using linear interpolation using the zoo package of R programming language.
Figure 2 depicts a boxplot with outliers. Due to the presence of extreme values, the box plot is in the form of a line. Figure 3 depicts the boxplot after outlier removal using Tukey’s method. Some values are seen above the inner fence, which are not outliers but actual values that occur in electricity use data during summer and winter air-conditioning peak days.

3. Methodology

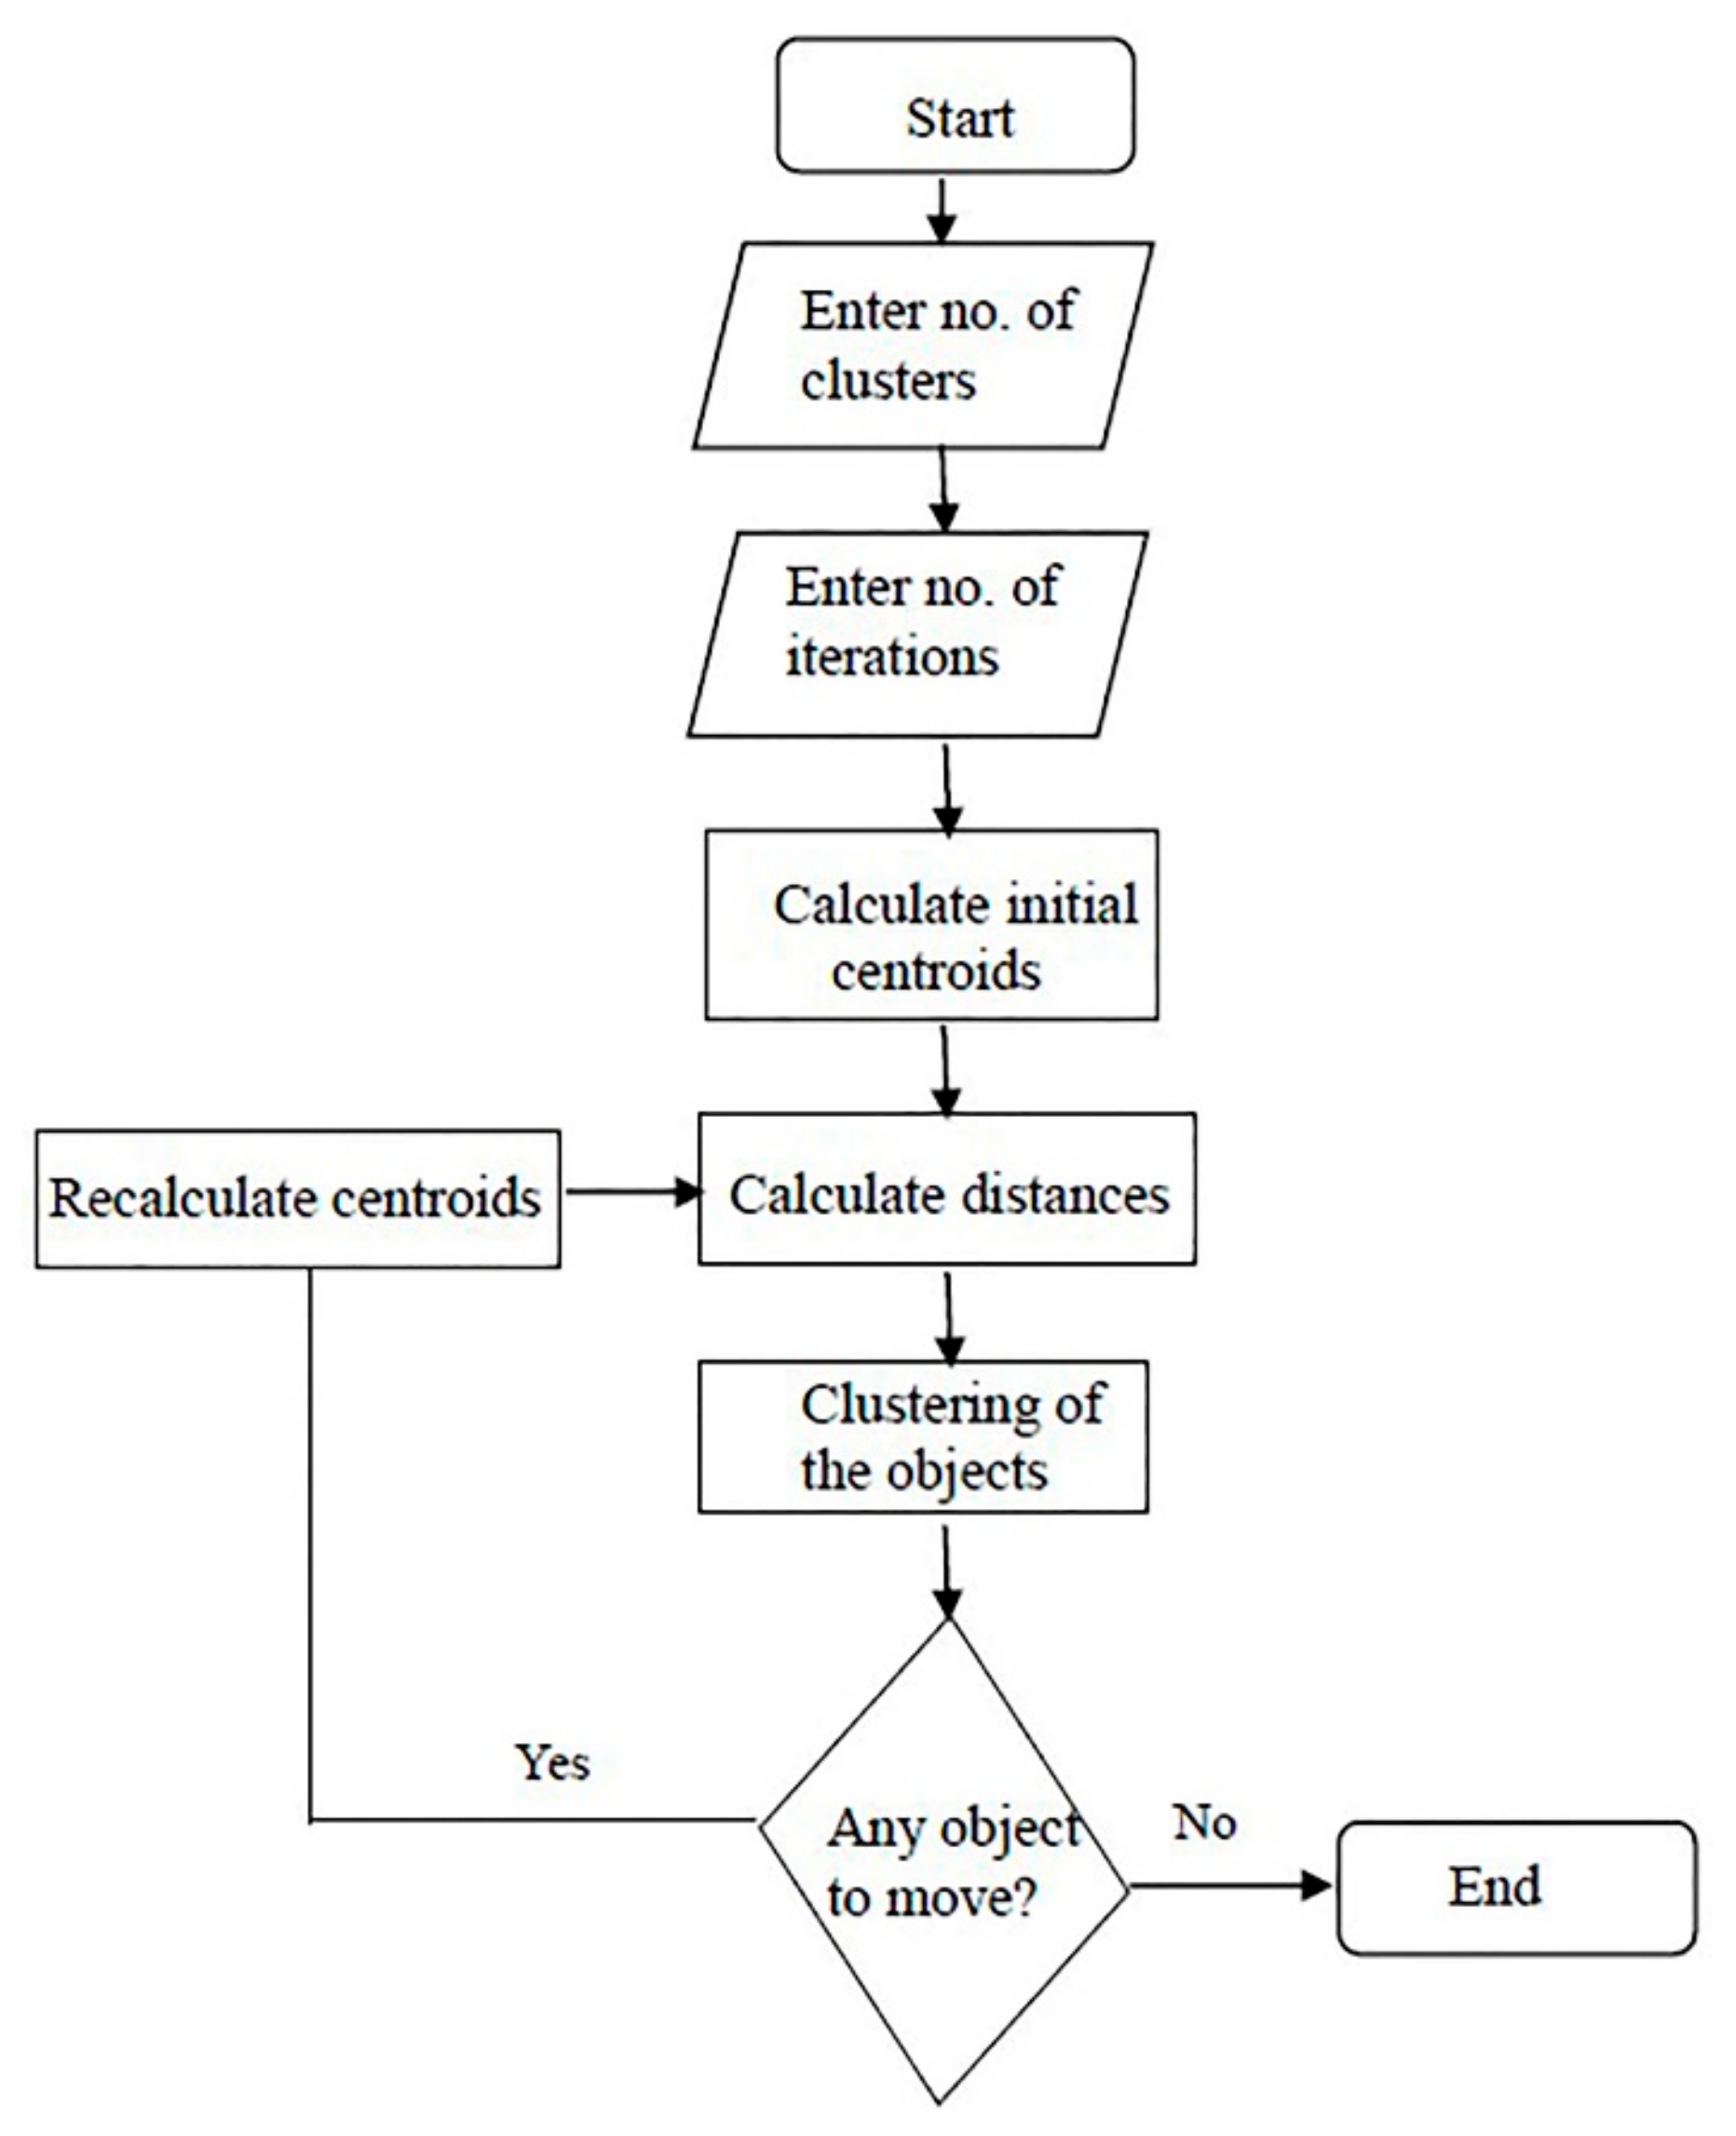
3.1. Overview of K-Means Clustering Algorithm

K-means uses Euclidean distance formula to find the correlation between two objects:
dist   ( x , y )   =   i = 1 n x i y i 2
where x i and y i are the attributes of a given object, and i varies from 1 to n.
Initial centroids are determined randomly using K-means clustering. The steps are as follows:
(1)
Determine the desired value of k, where the value of k is the number of the desired clusters.
(2)
Determine the initial centroids. The initial centroid is assigned randomly from the existing data, and the number of clusters is equal to the number of initial centroids.
(3)
Find the nearest centroid of each data point by calculating the distance to each centroid using the Euclidean distance formula.
(4)
Group the data by the minimum distance. A data point will be part of a cluster if it is the closest from its cluster center.
(5)
Find new centroids based on the average of the data for each cluster.
(6)
Return to step 3.
(7)
Stop if there are no data changes in the cluster assignment.
Above steps are clarified using flow chart in Figure 4.
The data used in this research were a time series of building electricity data, and the shape of the input vectors had features that were arranged by time. Time series data are commonly used for forecasting. Ricardo et al. [18] and Michelangelo et al. [19] used time series data for solar power forecasting and renewable energy forecasting, respectively.
Time series clustering is divided into two groups: (1) feature-based or model-based and (2) raw data-based. In the case of feature-based clustering, raw data are summarized or transformed by means of feature extraction or parametric models, e.g., dynamic regression, Autoregressive Integrated Moving Average (ARIMA), and neural networks, to facilitate the clustering. Raw data-based clustering is directly applied over time series vectors without any space transformation prior to the clustering phase [20]. In the method reported here, we use with raw data-based clustering.

3.2. Proposed Method

K-means clustering selects initial centroids randomly, so the result of the clustering algorithm changes every time. It is desirable to have a clustering algorithm that produces a unique result irrespective of the clustering run time. We propose a method for enhancing the performance of the K-means algorithm by selecting better initial centroids. This method produces a unique clustering result, and the clustering accuracy is better than the K-means random initialization method.
To show the variation in the electricity use pattern at Chubu University, six sets of graphs in different electricity use periods were plotted, as shown in Figure 5. Except Sunday and holidays, the patterns of electricity use in Chubu University were almost similar. Electricity use increases sharply around 8:00 a.m. and reaches to a peak in the afternoon around 12:00–1:00 p.m. In the evening and early morning, electricity use was low, representing the base electricity consumption of the university. Differences were mainly observed in the hourly electricity use. Thus, we decided to select the initial centroids based on the hourly distribution of one-year electricity use.
The initial cluster centroids of the K-means algorithm were determined using the percentile method based on the empirical cumulative distribution function. In the case of k clusters, cumulative density was divided into (k + 2) equally separated percentiles. Then, the value of the electricity consumption data corresponding to the percentiles in empirical cumulative distribution was chosen. The minimum and maximum initial values were neglected to reduce the effect of maximum and minimum values and possible outliers, and to prevent an empty cluster. Thus, the final k values out of k + 2 values were taken as the initial centroids for K-means.
Figure 6 shows the determination of the initial centroids in an empirical cumulative distribution using the percentile method. In Figure 6, the distribution of data at 11:00 p.m. is shown. Other initial centroids for the remaining time stamps were also calculated similarly. For k clusters, (k + 2) equally separated percentile values were chosen, and (k + 2) values from the empirical cumulative distribution corresponding to the percentile values were obtained.
The requirements of the approach are as follows:
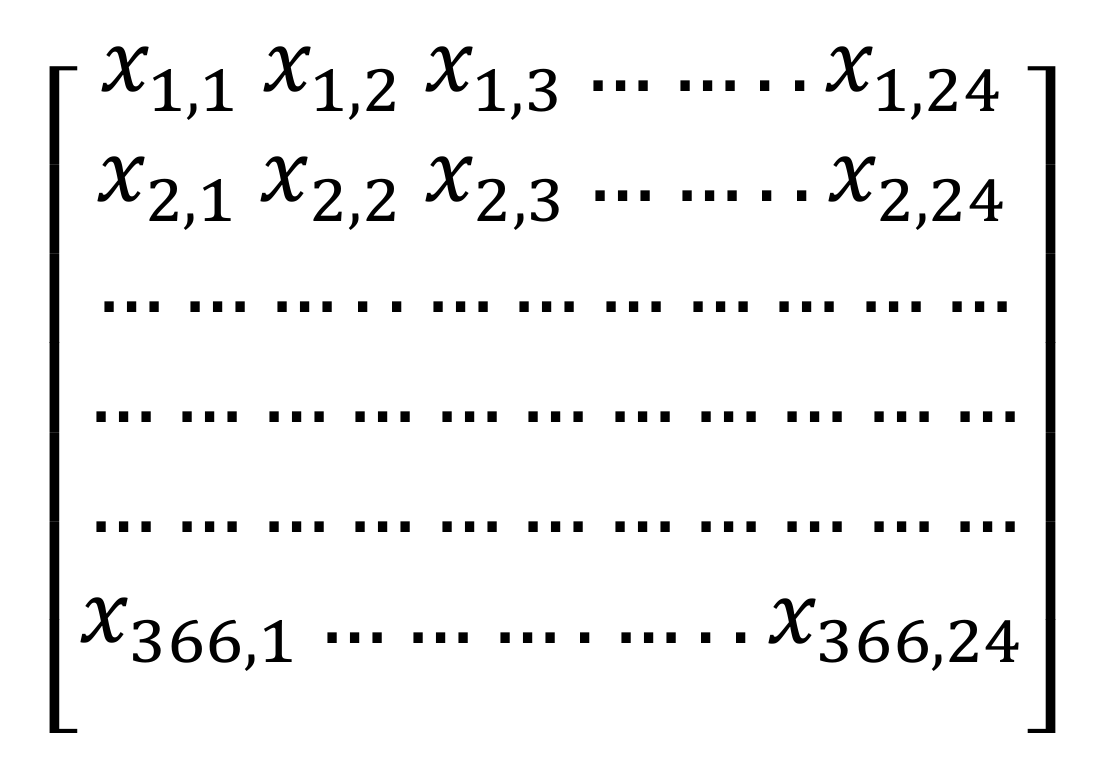
  • Dat = {d1, d2, d3,…di,…dn}, a set of n data points.
  • di = {x1, x2, x3,...xi,….xm}, a set of attributes of one data point.
  • F = {f1, f2,…fl,…..fk}, a set of k centroids
The following steps are required to ensure a set of k desired clusters:
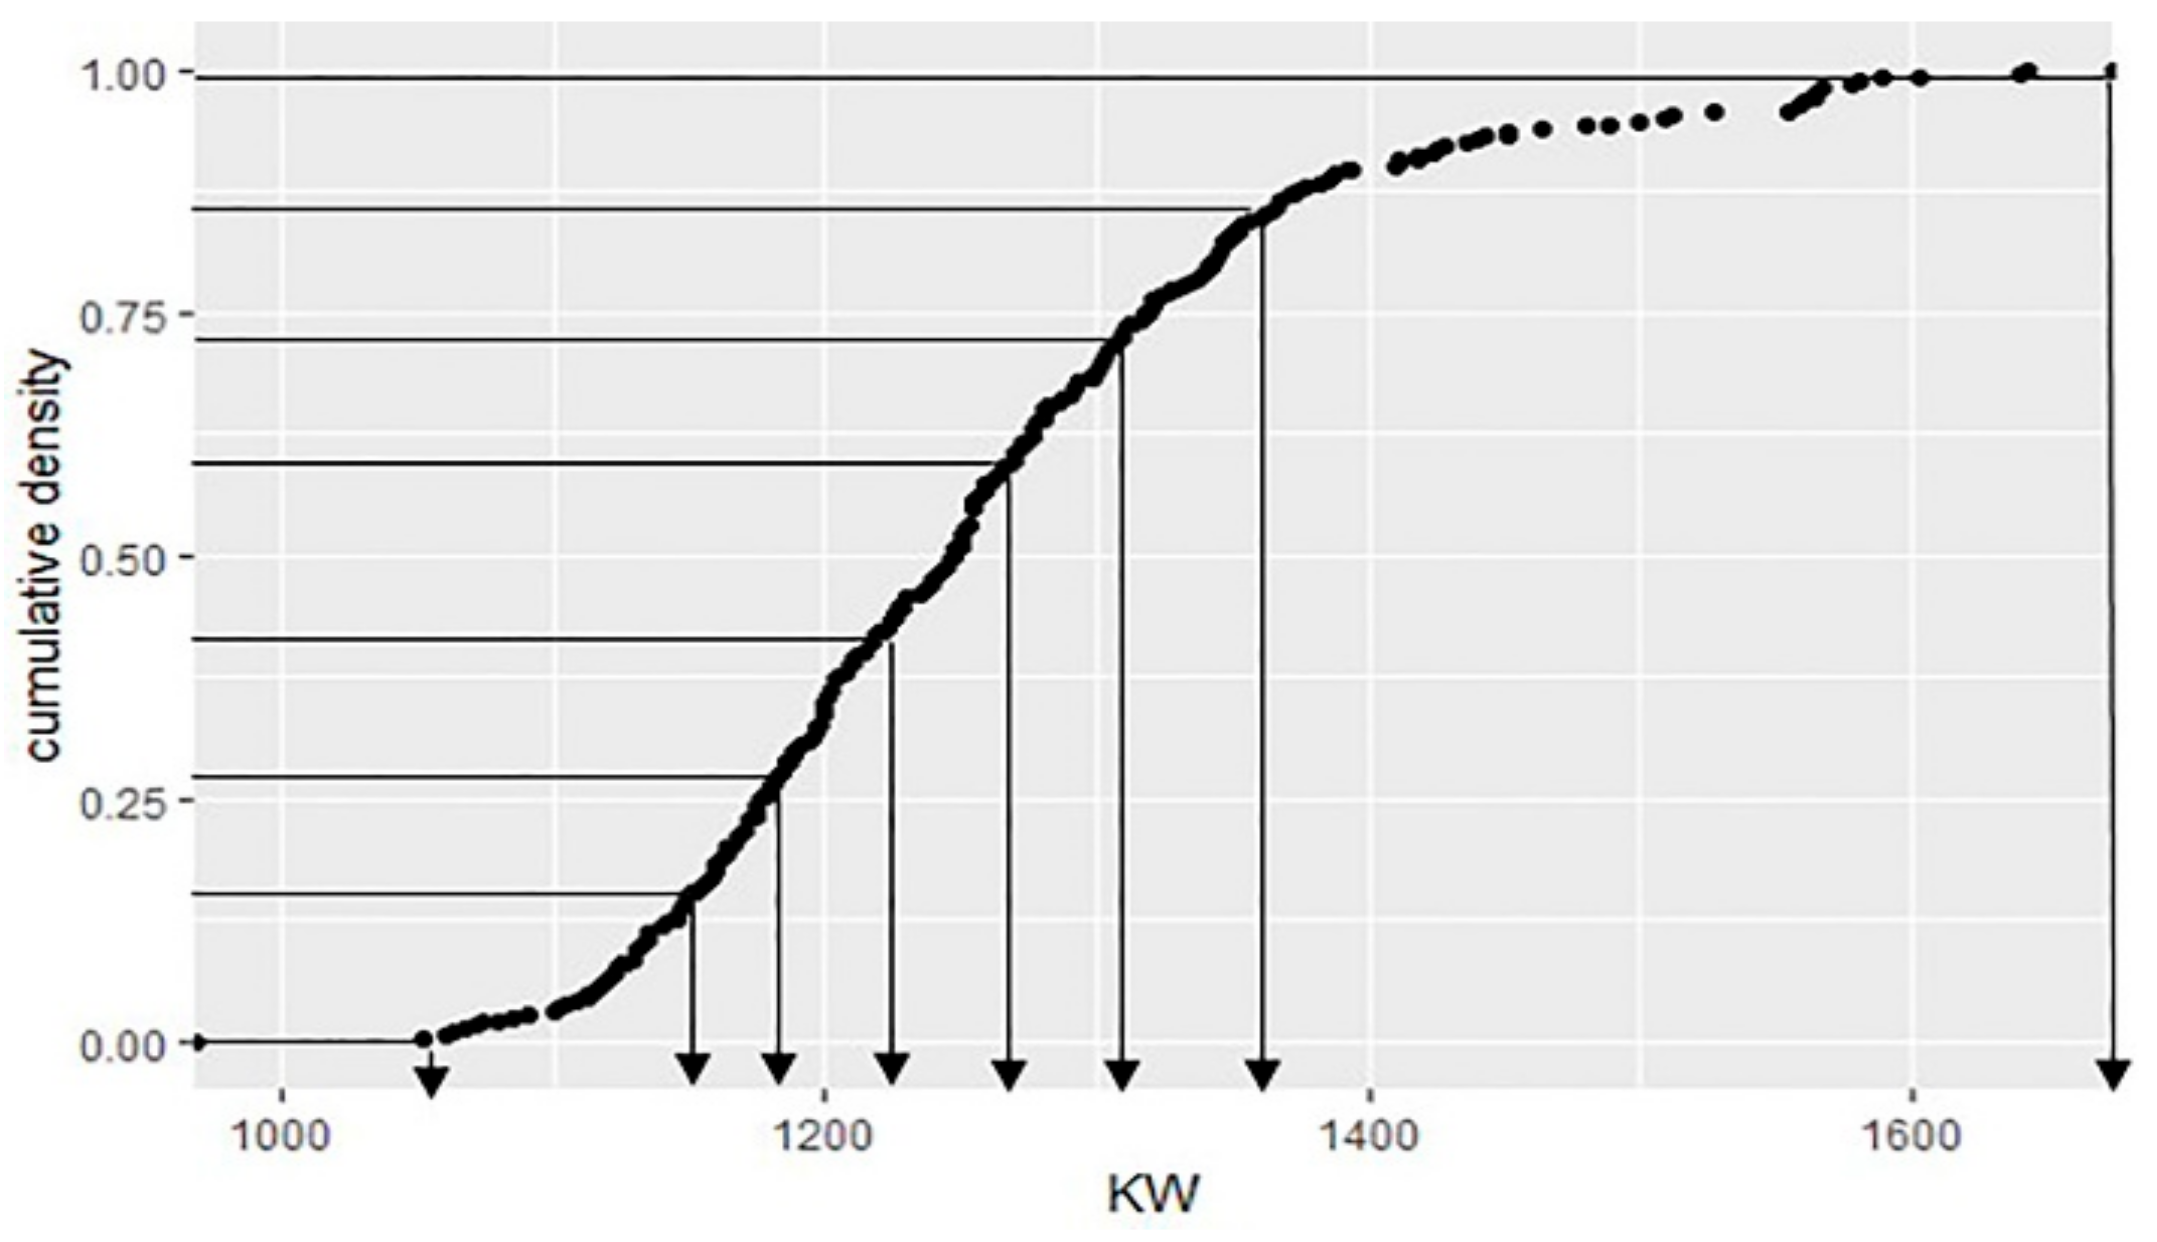
  • Step 1: For k clusters, divide the cumulative probability equally into (k + 2) parts using the percentile method.
  • Step 2: Find (k + 2) values corresponding to the percentile in an empirical cumulative distribution.
  • Step 3: Compute the distance between each data pointdi (1 ≤ in) to all the initial centroids.
  • Step 4: Find the data points di closest to the centroid fl and assign the data di to cluster l.
  • Step 5: For each cluster l, recalculate the new centroids.
  • Step 6: Compute the distance between the new centroids and each data di.
  • Step 7: Continue this process until the data points change in the cluster assignment.
The “kmeans” function built in R programming language was used for the K-means algorithm. The used libraries of R used included dplyr, plyr, readr, reshape2, and ggplot2.

4. Experiments and Results

4.1. Accuracy Verification

4.1.1. Accuracy Verification Using Real World Datasets

To determine the accuracy of the proposed method, an experiment was conducted on four different real world datasets: Iris, Wine, Ruspini, and New Thyroid. The Iris, Wine, and New-Thyroid datasets were downloaded from the UCI Machine Learning Repository [21]. Ruspini data are included in the R package “cluster”. These datasets are typical tests for many classification techniques.
We represent the accuracy percentage (r) as a performance measure of the experiment. It is calculated as r = 1 − e, where e is the clustering error and is defined as [5]:
e   =   Number   of   misclassified   pattern Total   no .   of   patterns × 100 %
Maximum, minimum, and average accuracy of 100 trials obtained using K-means and the proposed method are shown in Table 1. The accuracy of proposed method is noticeably higher than average accuracy for 100 trials using the K-means algorithm with random initialization.
The within-cluster sum of square distance of the proposed method, as shown in Table 2, was smaller, whereas the between-cluster sum of square distance of the proposed method was greater than the K-means with random initialization method for all four datasets. This shows that the proposed algorithm produces better clustering than the K-means random initialization method.

4.1.2. Cluster Quality Comparison Using University Data

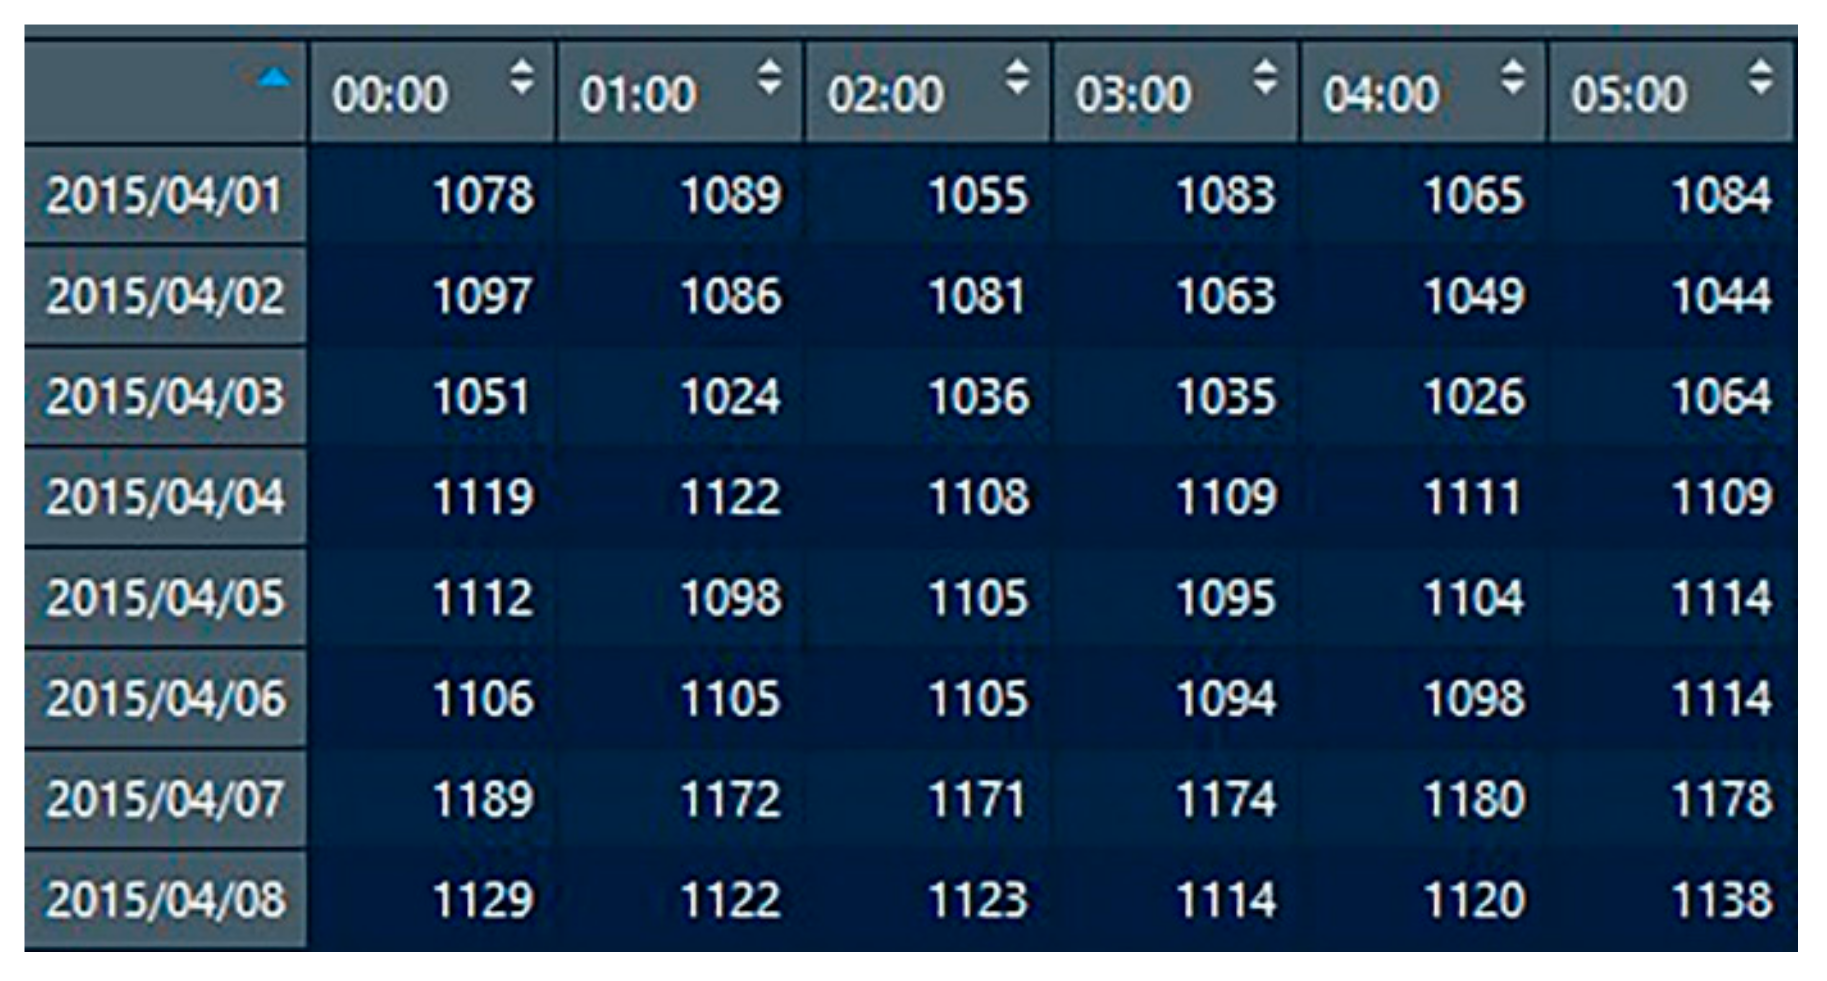
Description of University Data

The proposed method was used to analyze the building electricity time series data. The data used in this research were the electric use data from Chubu University. The electricity consumed in each building of the university was measured using the Building Energy Management System (BEMS), and the data were collected by the BEMS server every minute. These data were summed to create hourly electricity use data; thus, one year of data from each building consisted of 8760 data points. The electricity use data represent whole electricity use data of the buildings at the university
The raw data were arranged in the order of days starting from 1 April 2015, until 31 March 2016. Each day included 24 h of data from 12:00 a.m. to 11:00 p.m. The data in this form were not suitable for clustering, so it was necessary to convert the data into a 366 × 24 order matrix as shown in Figure 7. Figure 8 represents the part of the data frame of the 366 × 24 order matrix used in this research.

Cluster Quality Comparison Using Proposed Method and K-Means

To determine the quality of the clusters, we determined the total within-cluster and between-cluster sum of squared distances for the K-means algorithm and the proposed method. Small within-cluster distances and a large between-cluster sum of squared distances are preferred for better clustering. The values obtained from K-means with random initialization, shown in Table 3, were the average of the values obtained from 10 runs of K-means clustering. The run time of the proposed method was only one because it produced the same result. As seen in Table 3, in each of the cases from clusters 4 to 7, the total within-cluster sum of squared distance of the proposed method was smaller than K-means with random initialization, whereas the sum of squared distance between the cluster centroids of the proposed method was greater than the random initialization method. The proposed method was in agreement with the definition of a good clustering algorithm, i.e., small within-cluster sum squared distances and large sum squared distances between cluster centroids. Thus, the proposed algorithm is better than the K-means with random initialization method.

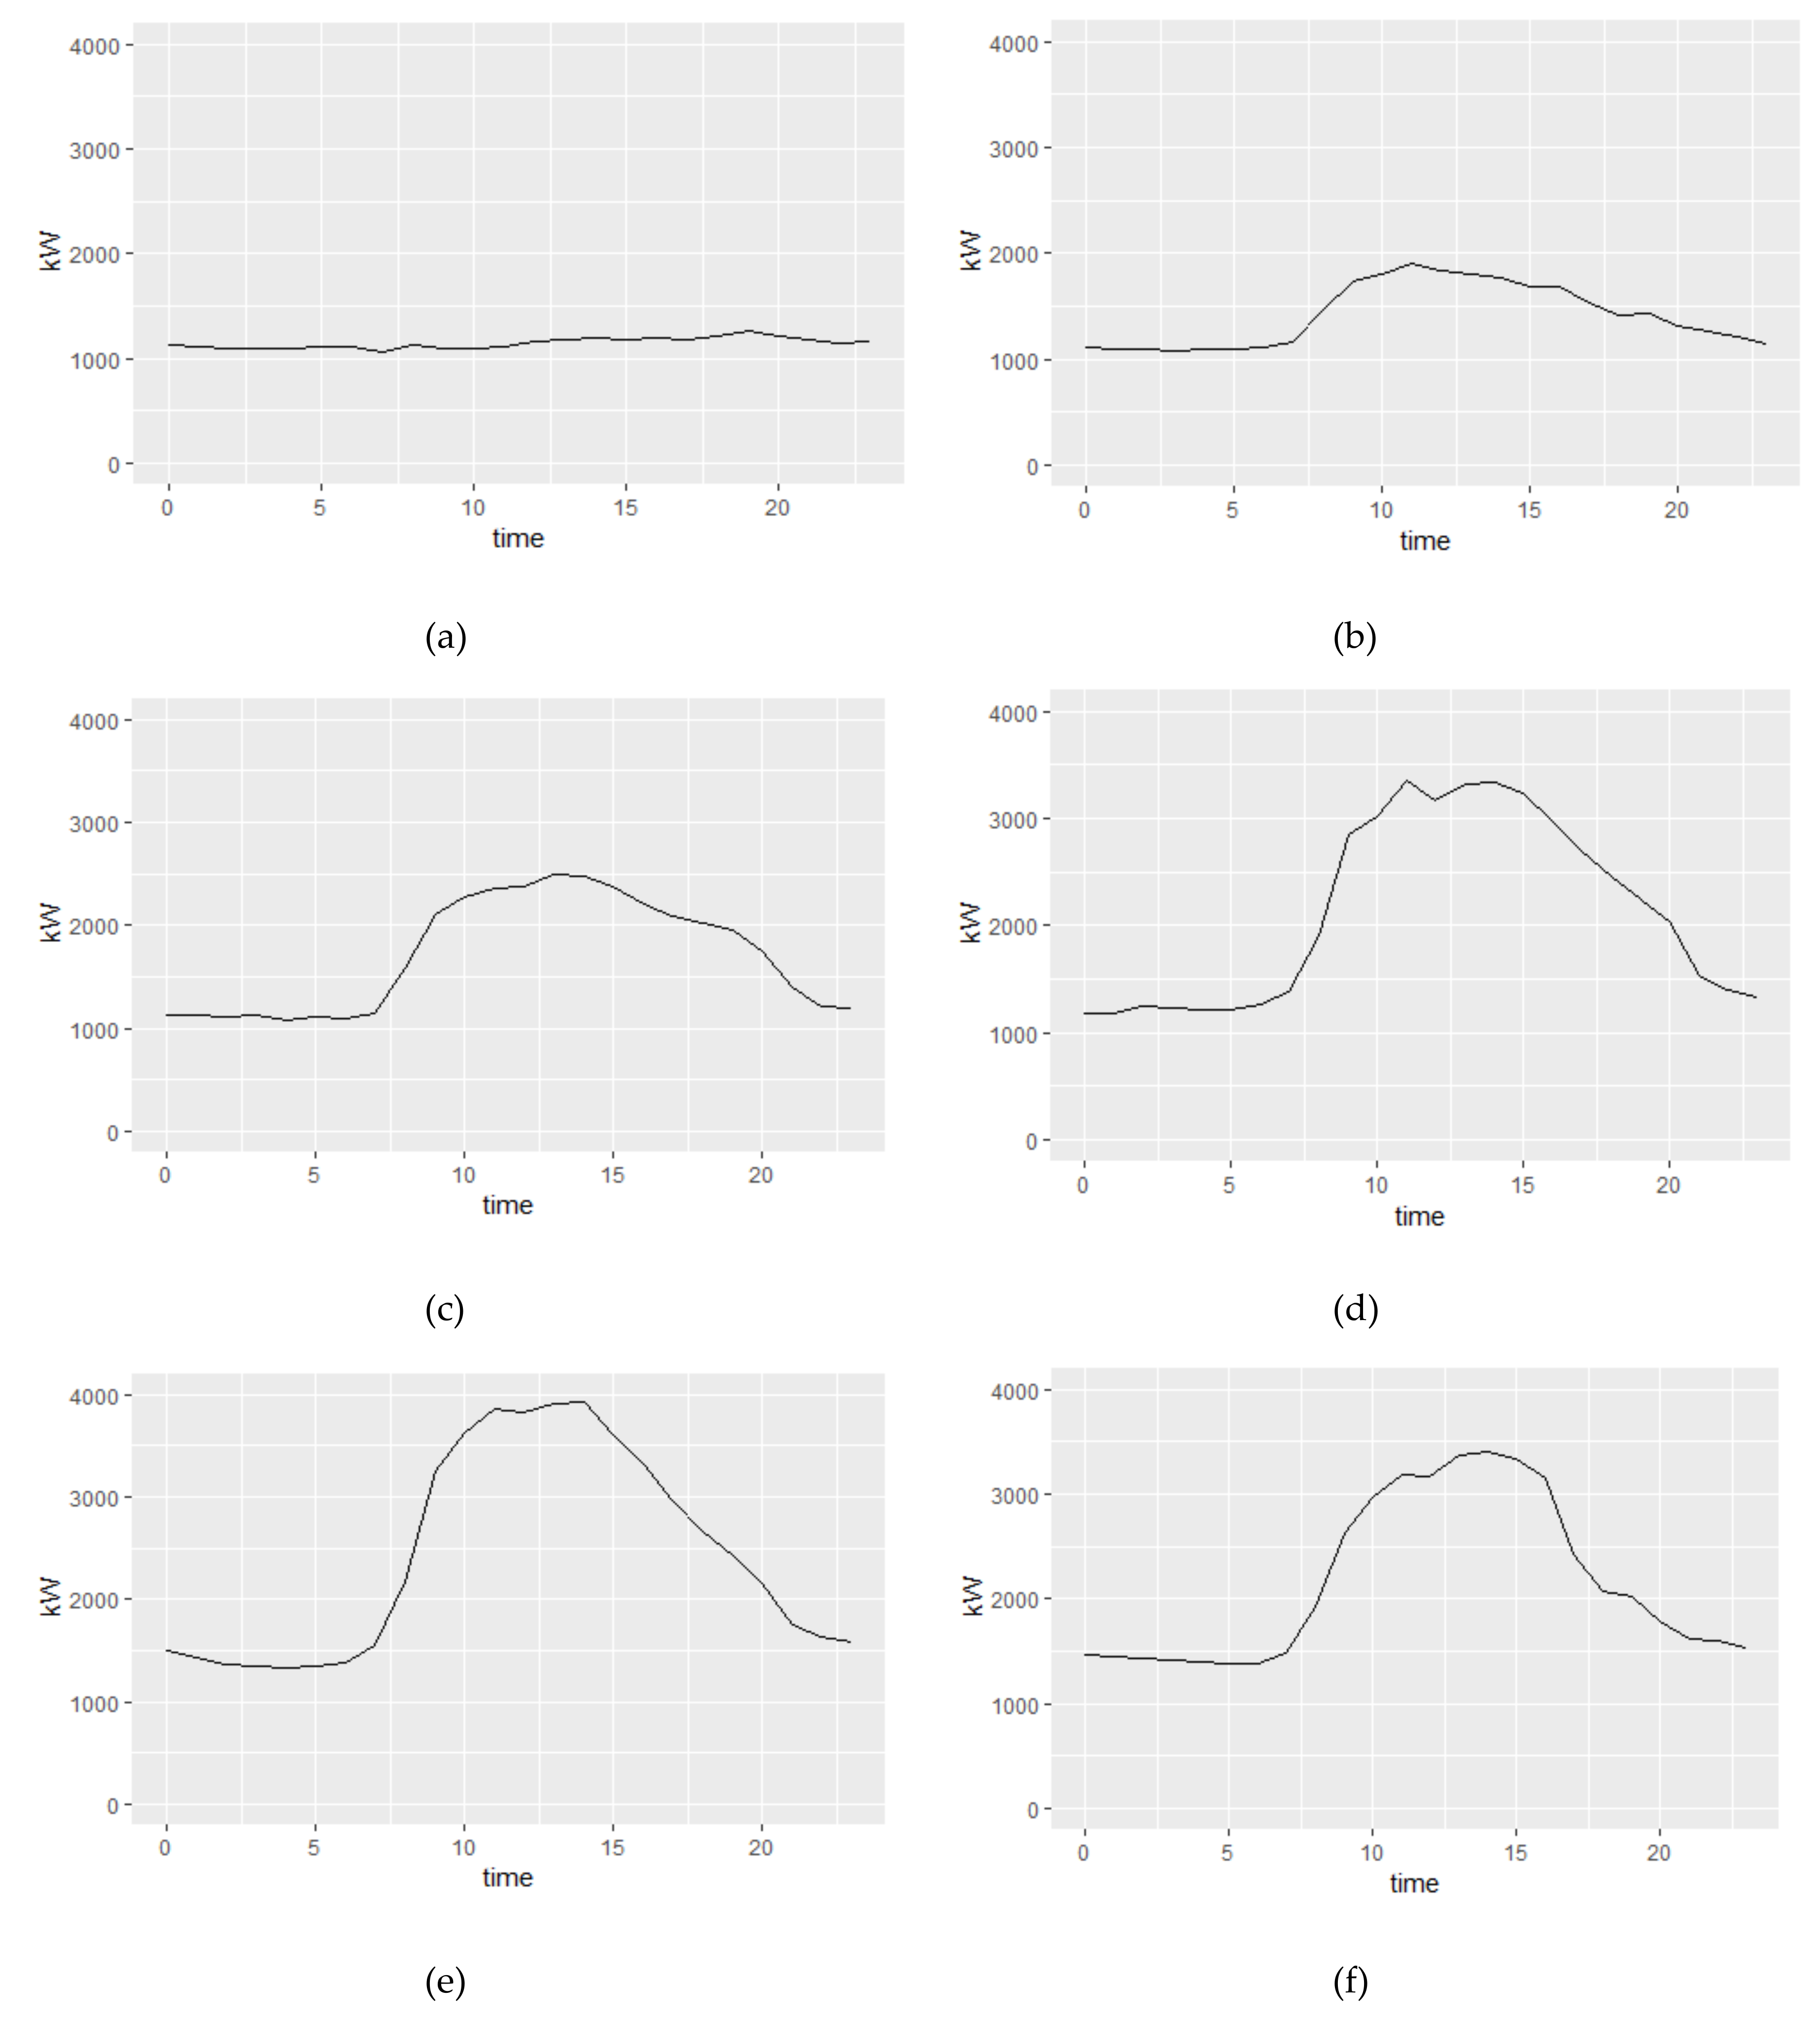
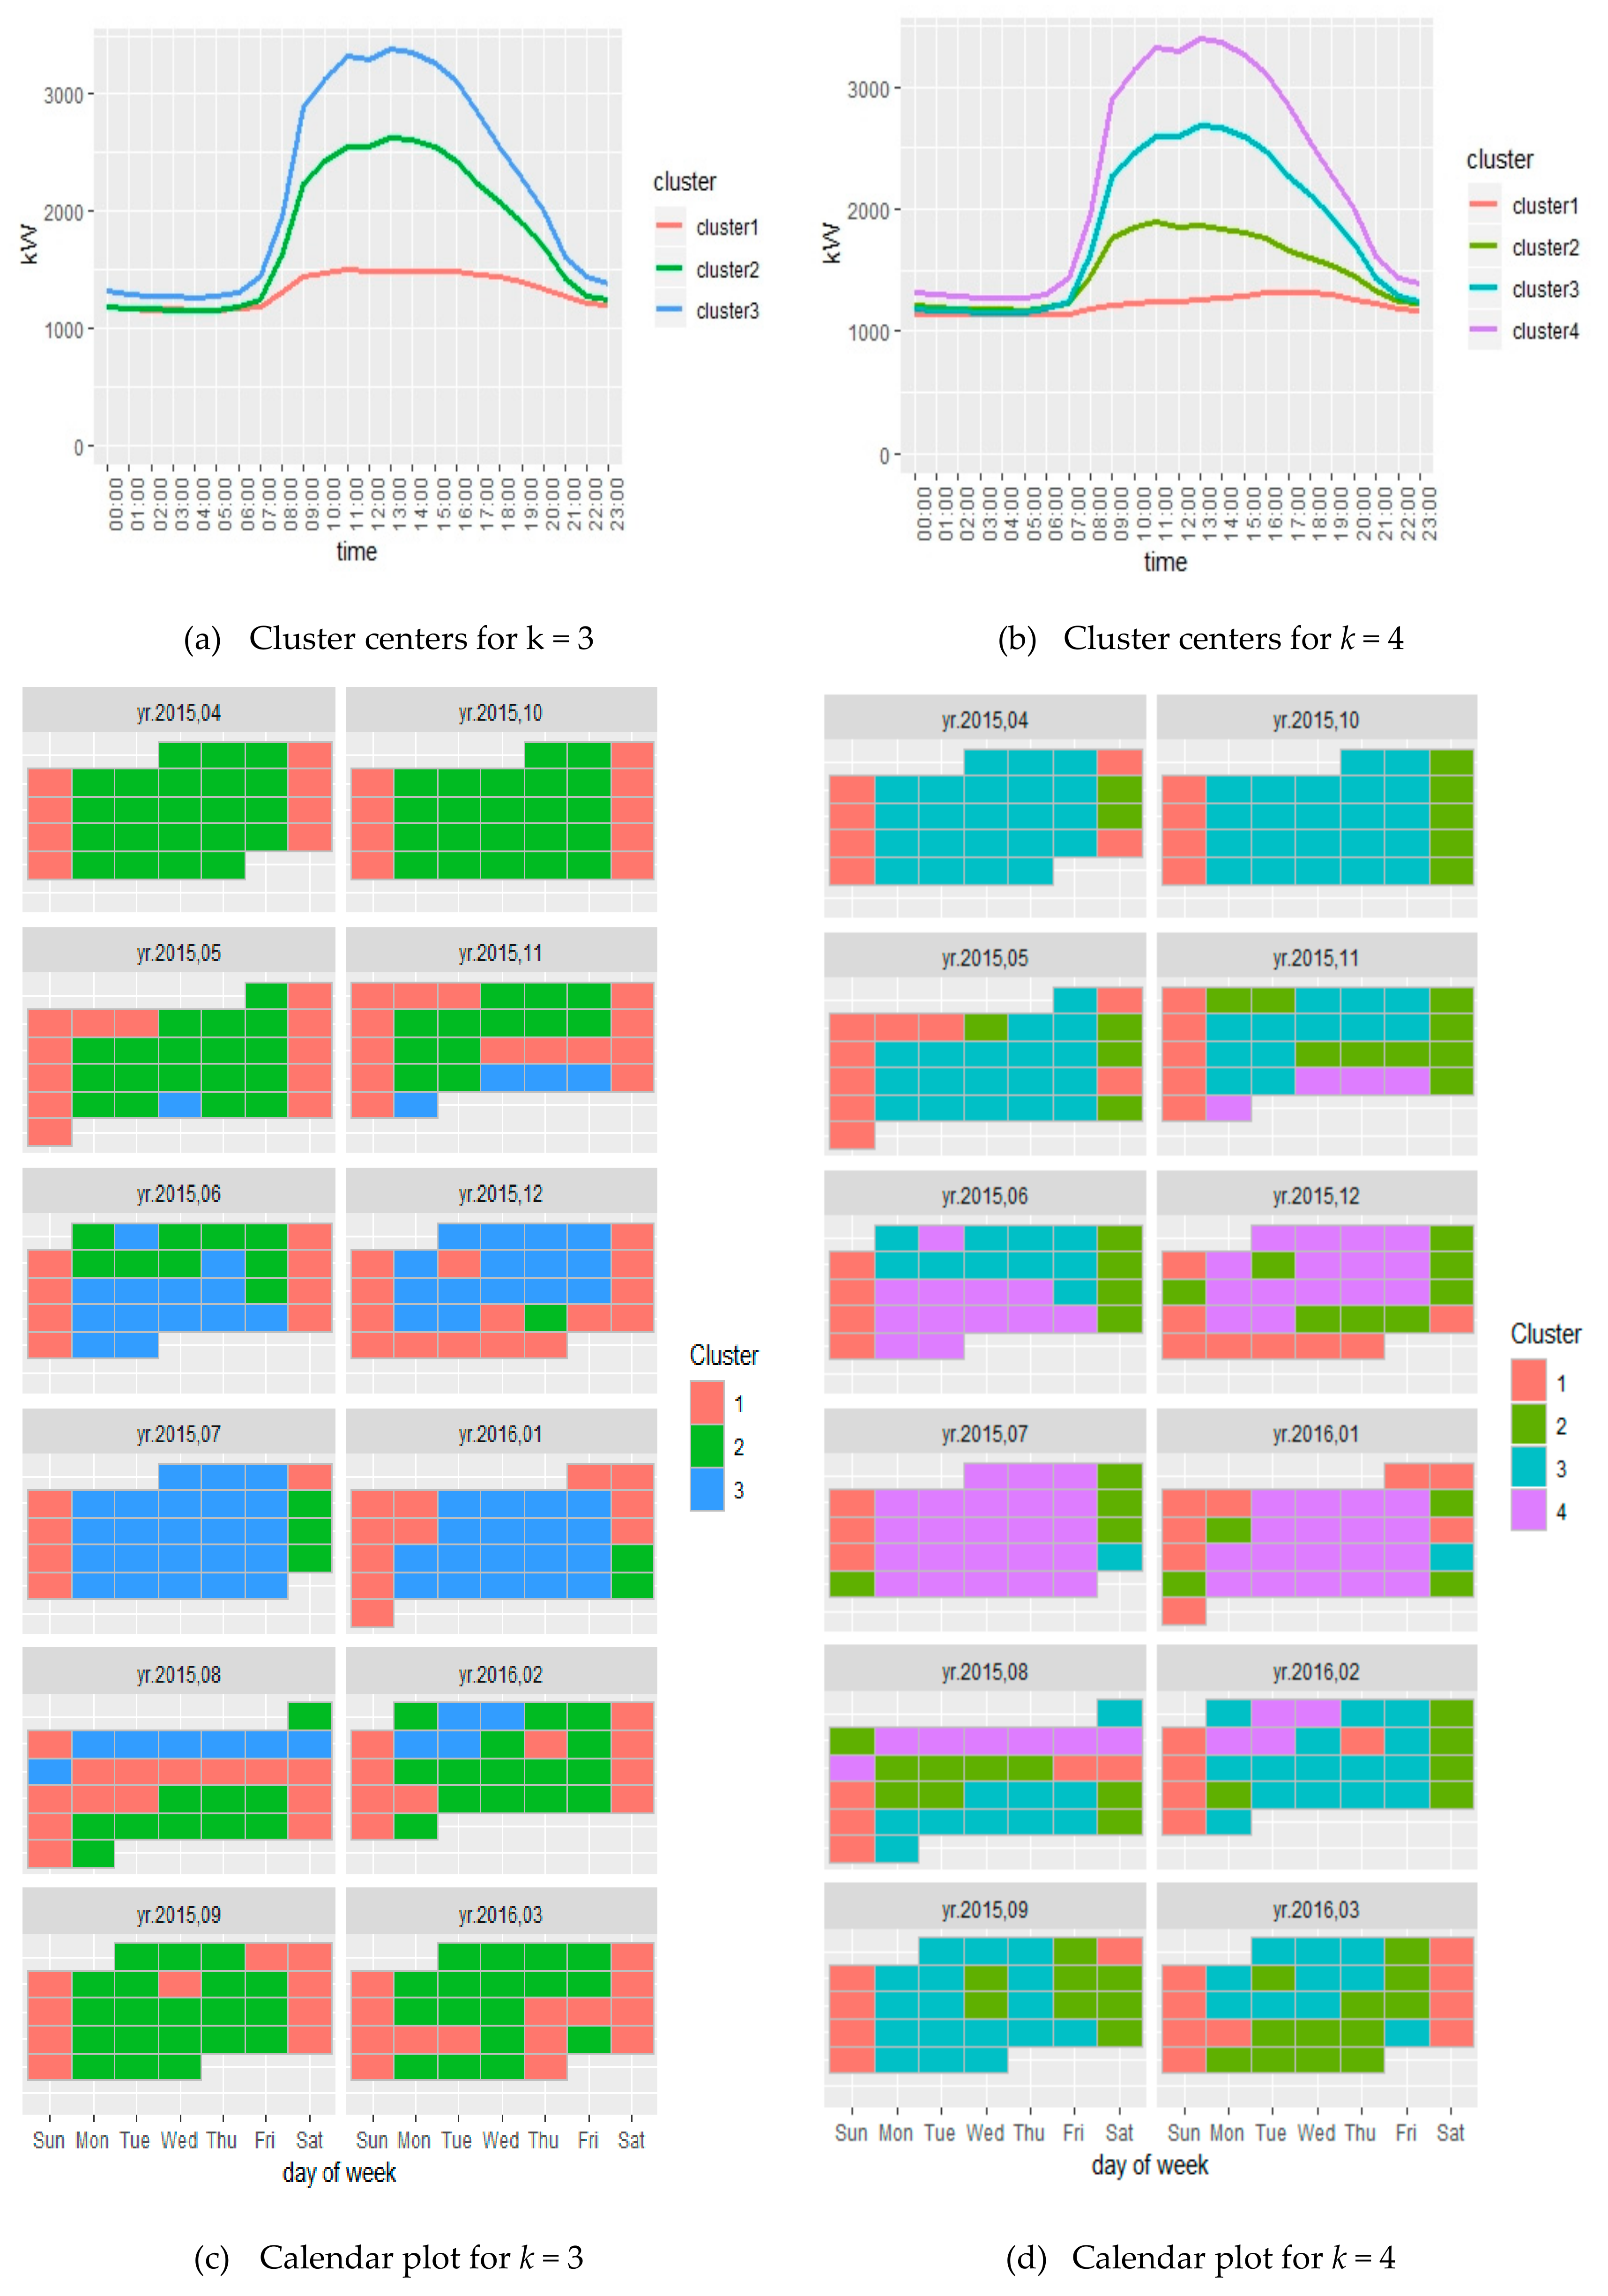
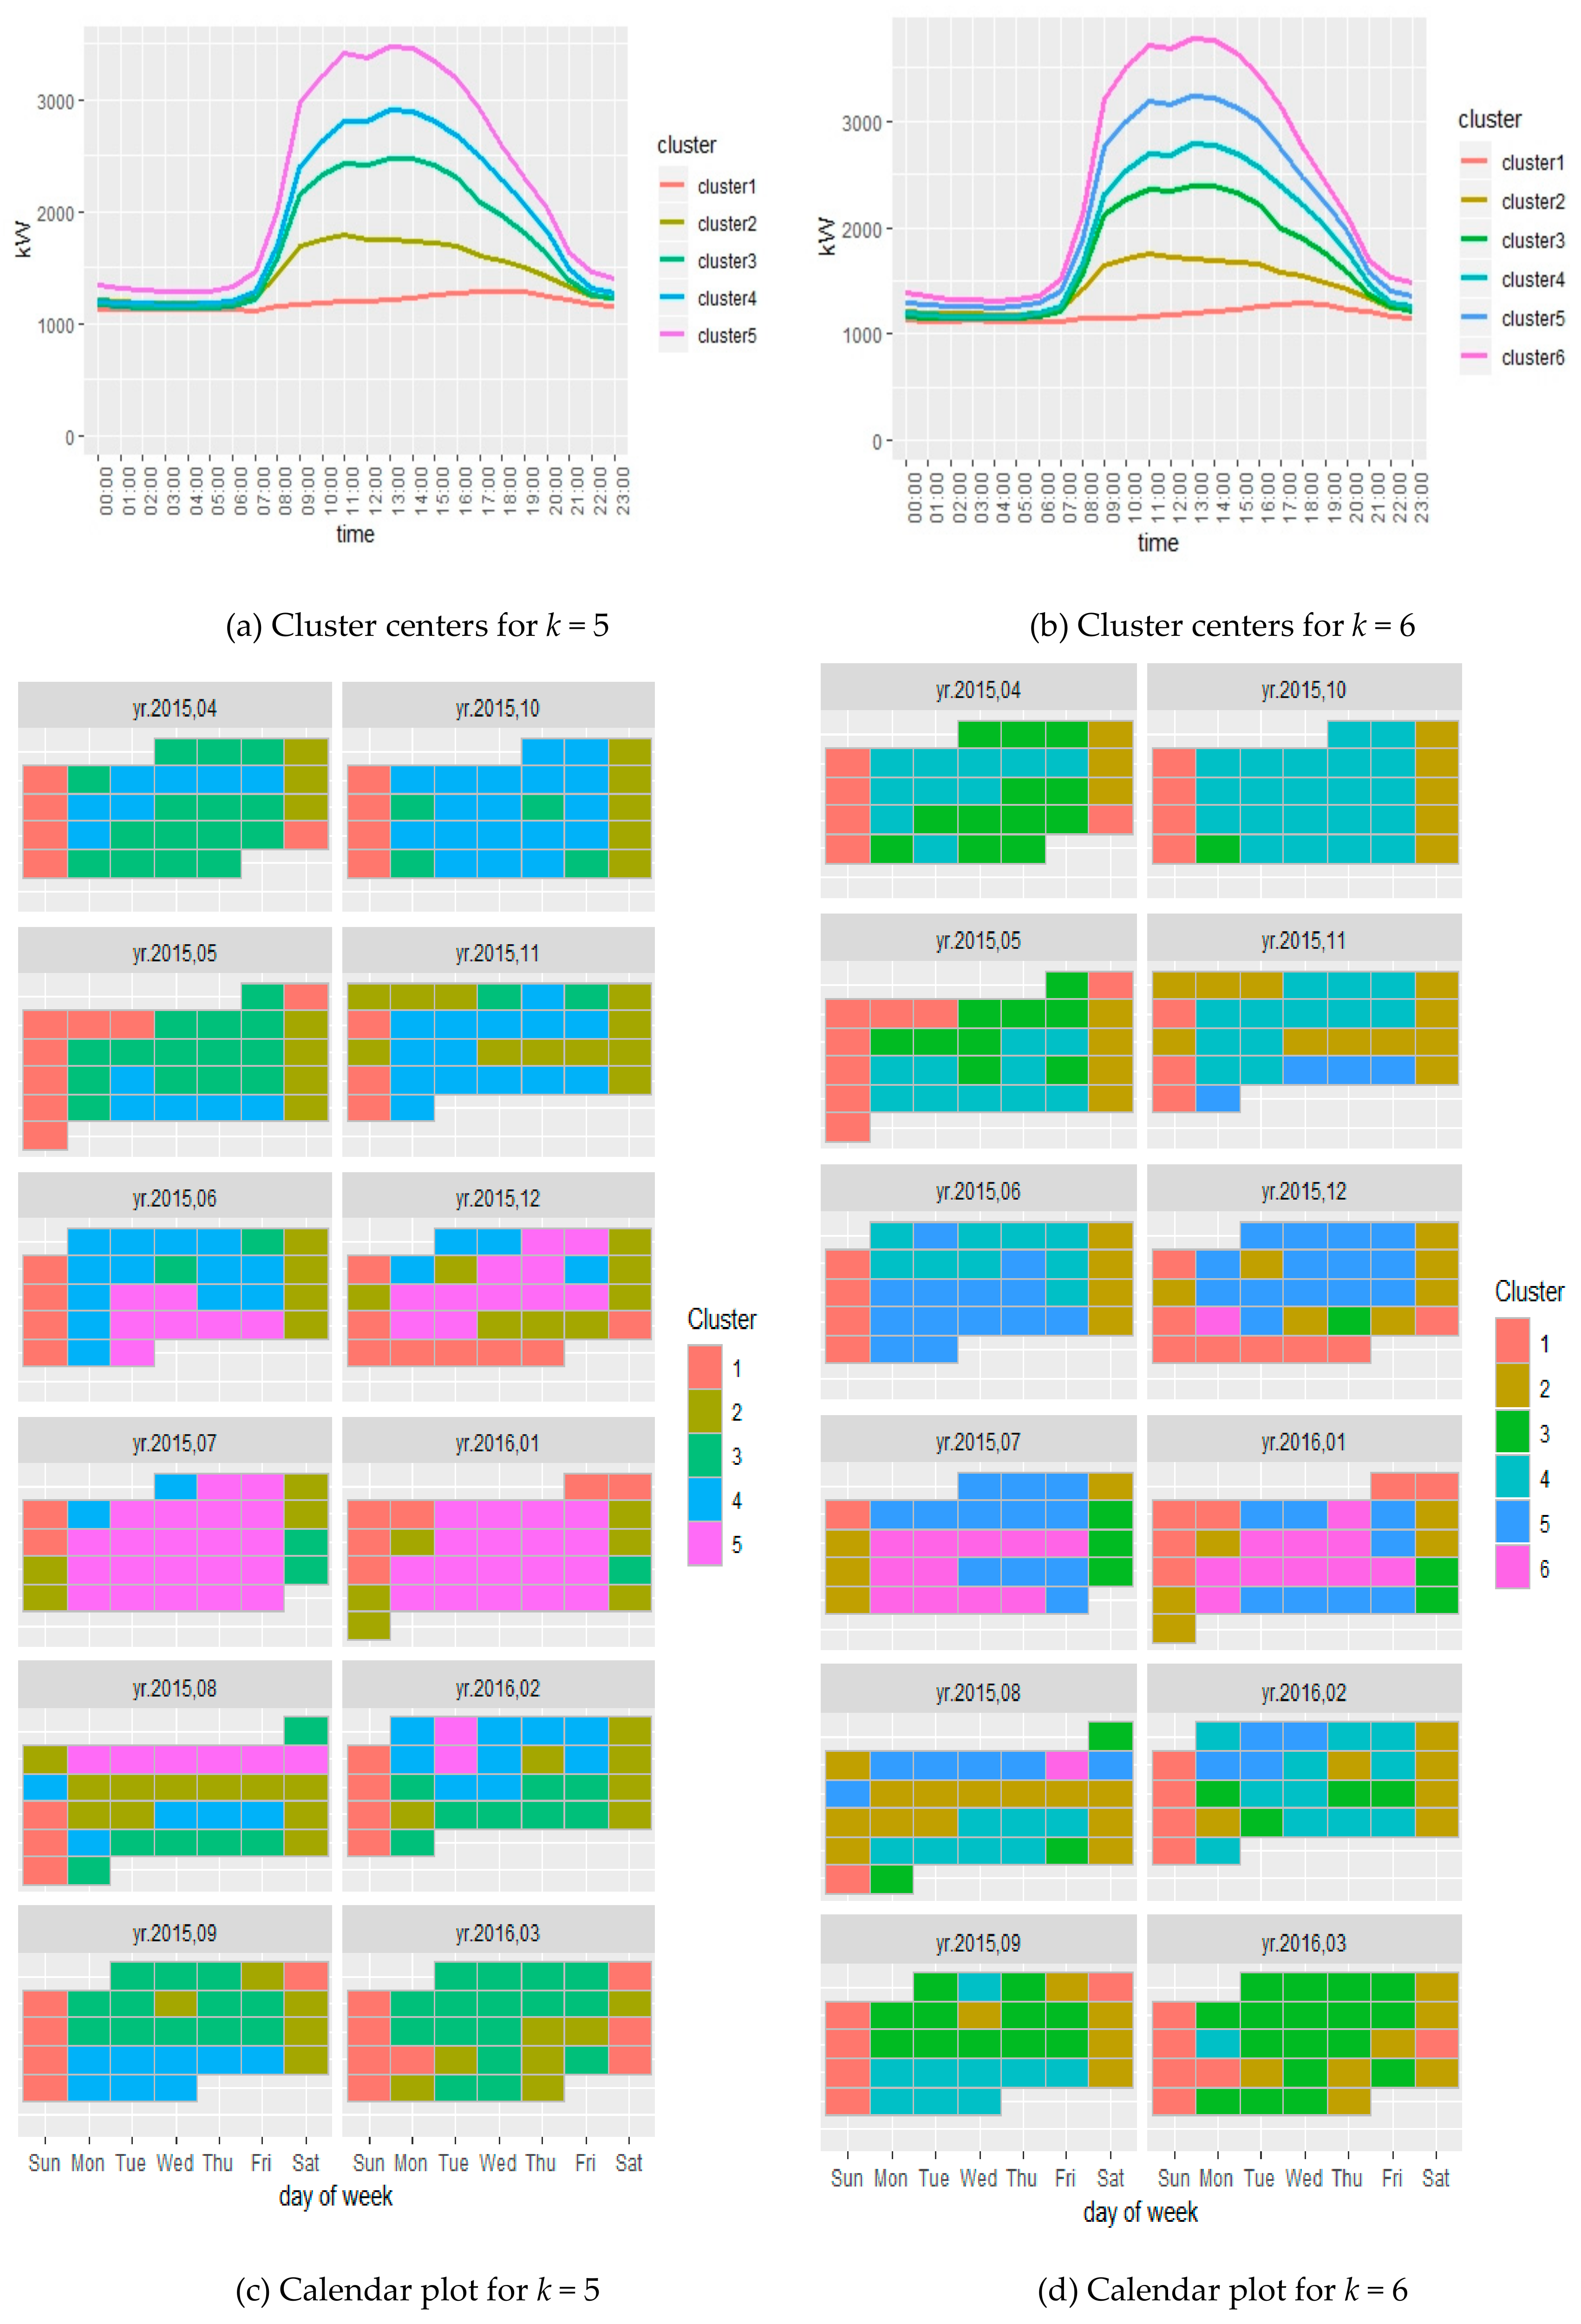
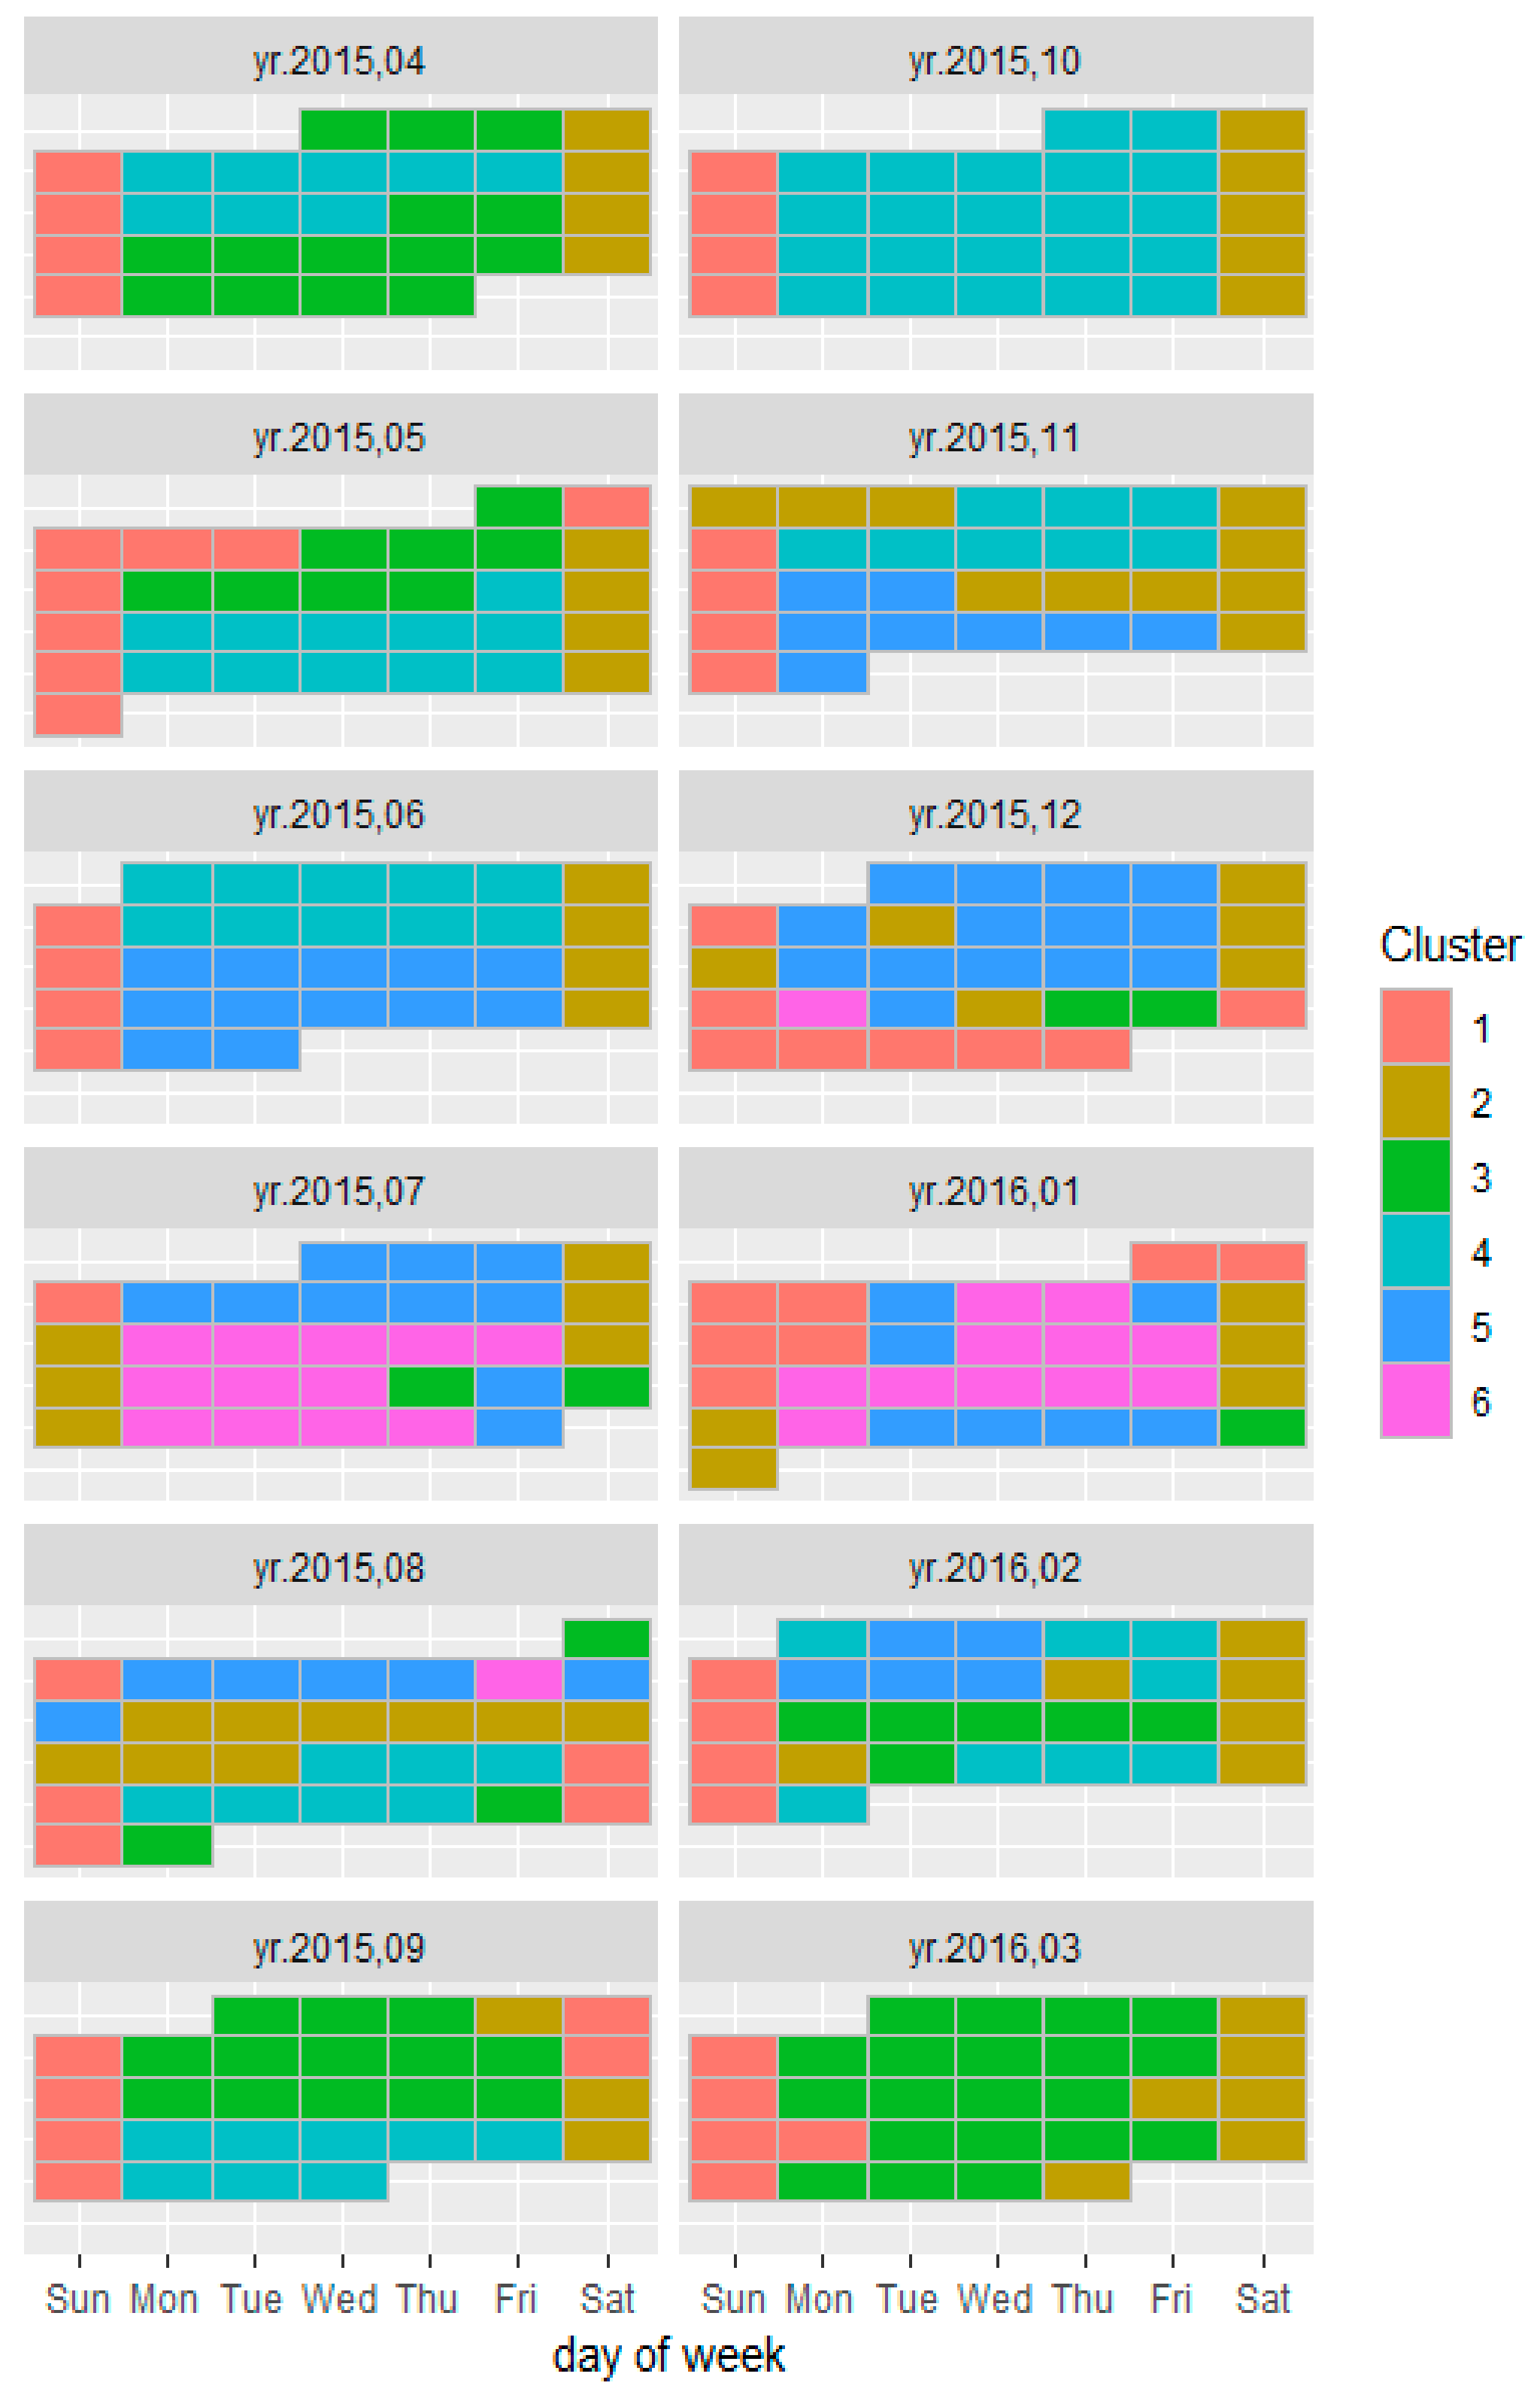
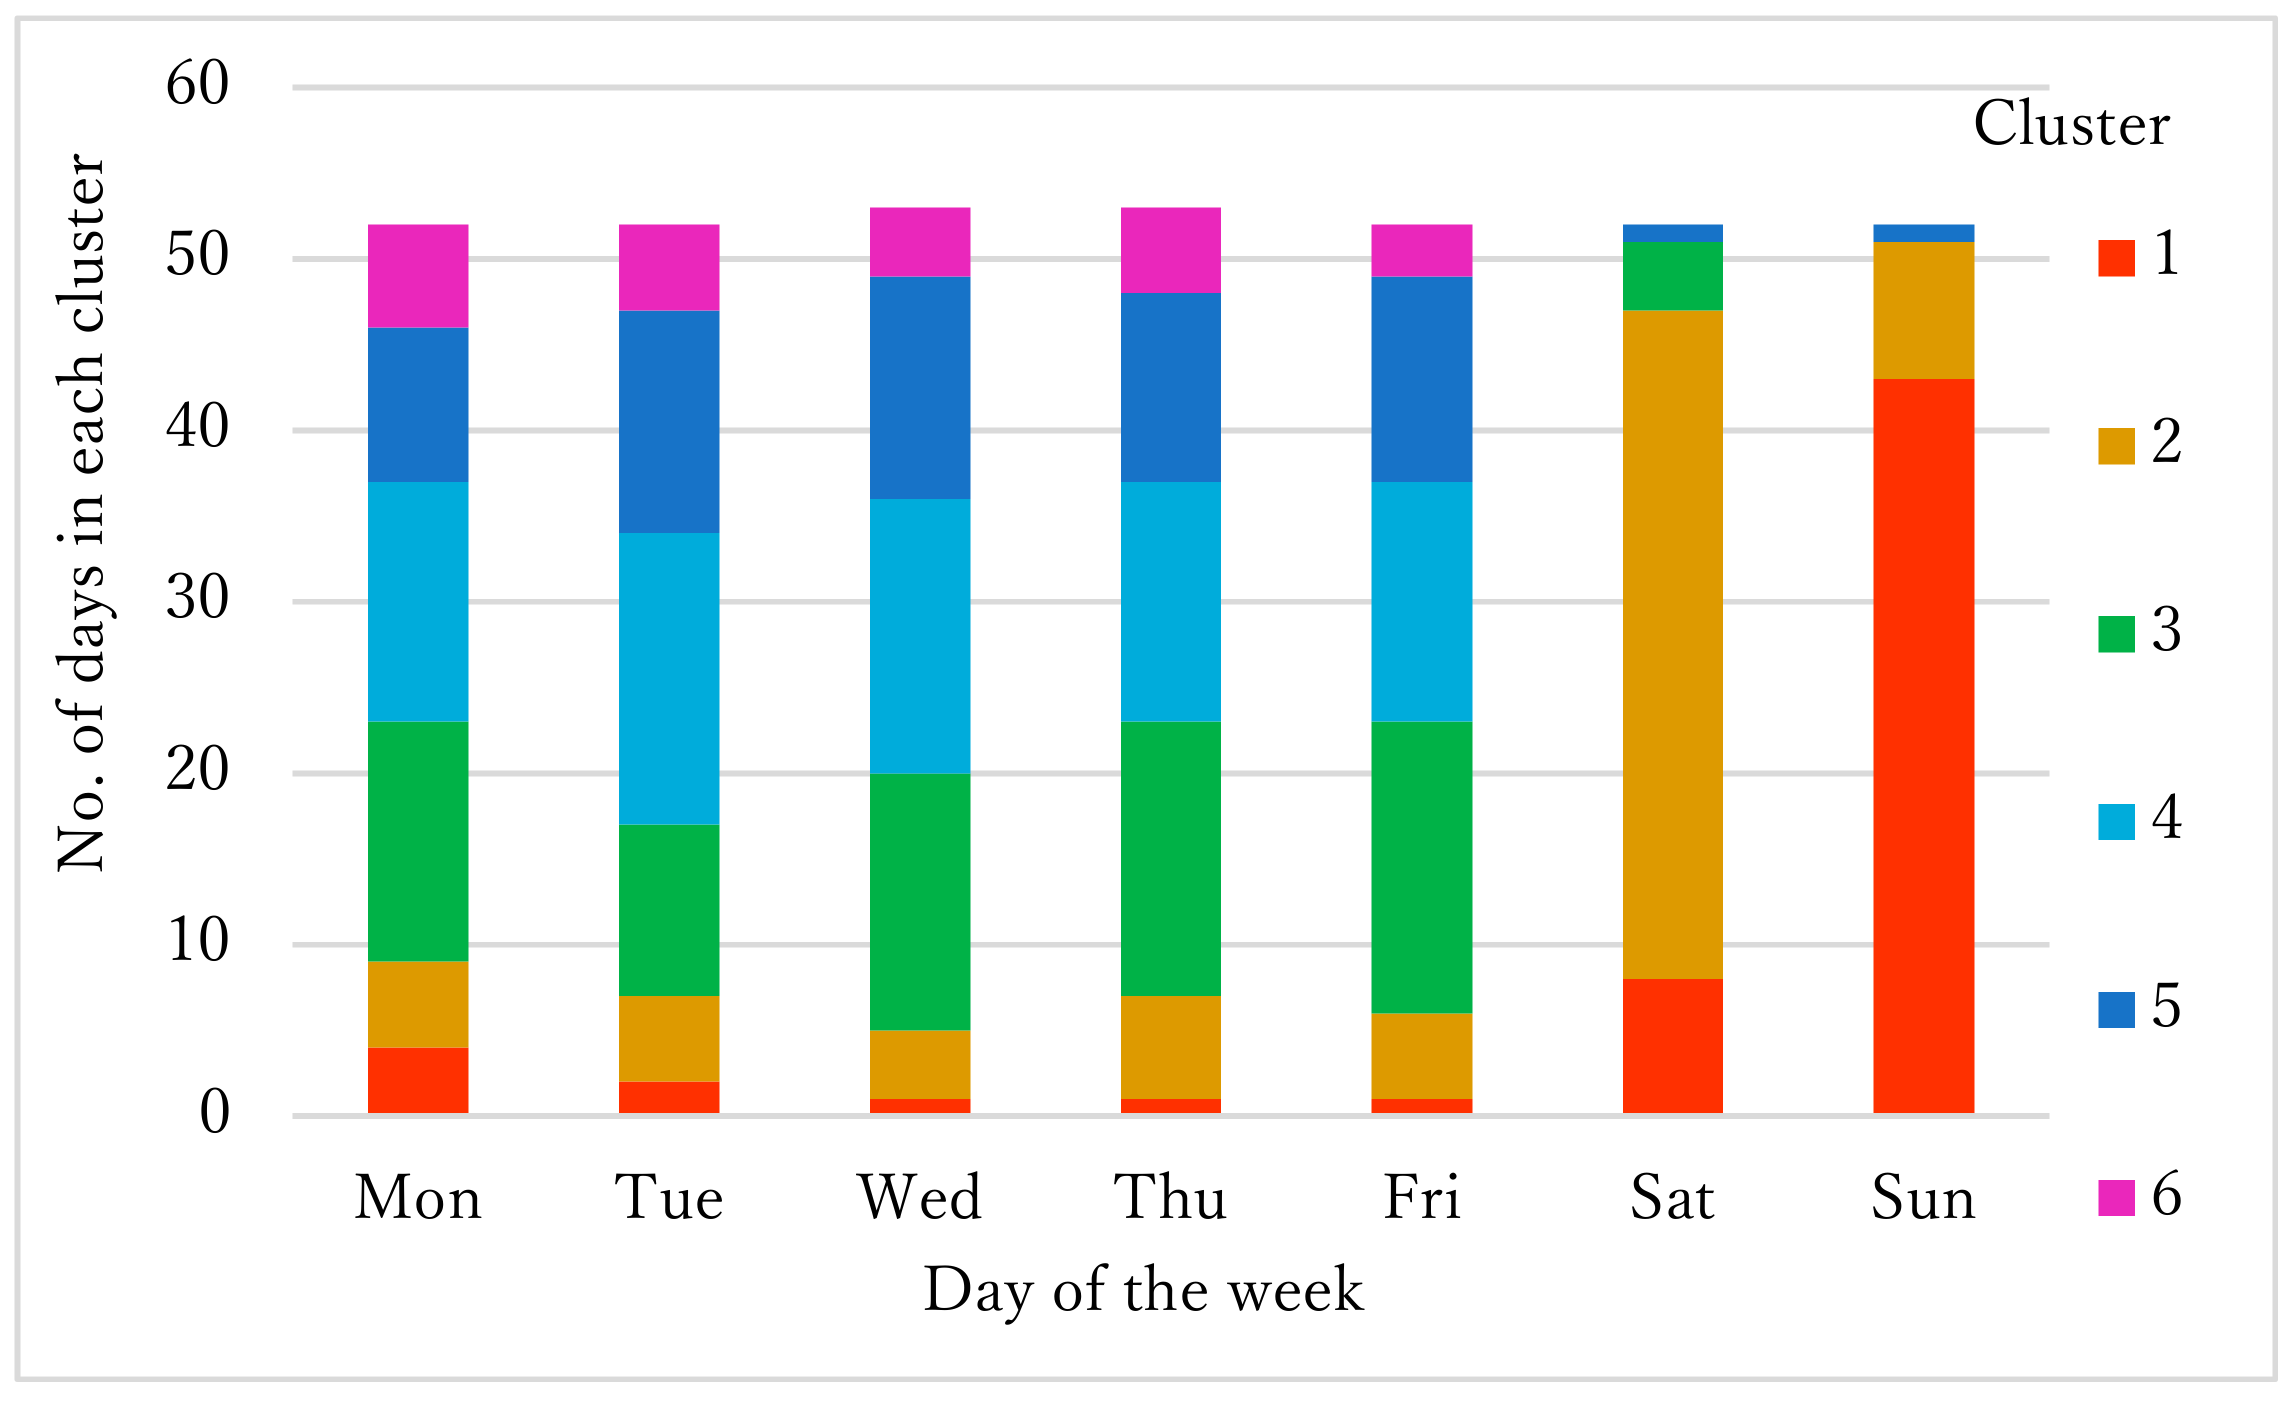
4.2. Electricity Use Pattern Analysis by the Determination of Number of Clusters

Many factors affect the use of electricity in a university. On Sundays and holidays, there are no lectures and no lighting, no air-conditioning or Office Automation (OA) equipment are used, so the electricity use can be considered the base energy use of the university. Base energy is the electrical energy consumption of equipment that runs 24 h, like servers, refrigerators, emergency exit lights, research equipment, etc. At Chubu University, Saturday is not a holiday, but the number of students present, the numbers of lectures and activities at the university are small compared to the normal weekdays, so the electricity use pattern on Saturday is different in comparison to Sundays, holidays, and weekdays. The usage of air-conditioning at Chubu University is managed by the periods. Excluding exceptional conditions, like sudden changes in whether condition, usage of air-conditioning in the interim period is not allowed. Air-conditioning on non-lecture days usually occurs during the university vacation period. Air-conditioning on lecture days can be divided into two parts: normal air-conditioning lecture days and lecture days with air-conditioning peak. At universities in Japan, contracts are usually made with the electric power company and the electric power demand is fixed for the universities. In summer and winter with air-conditioning peaks, if the electricity use exceeds the electric power demand, the university needs to pay more on their electricity bill so universities authorities attempt to not exceed the electric consumption beyond the electric power demand. Thus, when analyzing the electricity use pattern of universities, air-conditioning peak periods should also be considered.
As shown in Table 4, the electricity use of Chubu University can be categorized into six types depending on the presence or absence of lectures, presence or absence of air-conditioning, and presence or absence of holidays.
For analyzing the building electricity use pattern, it is necessary to know on which day and how much electricity is being used. So, it is essential to select the proper number of clusters (k) that properly describes the electricity use pattern. For this purpose, we performed K-means clustering analysis by selecting the cluster numbers from three to six and compared the accuracy with the actual calendar plot created using the university schedule. Figure 9 and Figure 10 represent the clustering result of Chubu University for three to six clusters.
For Chubu University in 2015, the air-conditioning cooling period was from June 15 to September 15, whereas the heating period was from November 15, 2015 to April 15, 2016. It is possible that in some of the days, the cluster number stated in Table 4 changed. For example, Sunday most likely falls into cluster no. 1, but occurrences of events, like open campus, university festivals, etc., can change the cluster number on the particular day from cluster 1 to 2, 3, or even higher clusters, so in addition to Table 4, it was necessary to analyze the electricity use of each day to determine the cluster number of each day. Thus, by considering Table 4 and analyzing the electricity use of each day, a calendar plot for Chubu University, Figure 11 was created. We consider this calendar plot as the actual calendar plot and used this to compare the accuracy of the clustering result.
When comparing the actual calendar plot of Chubu University with the calendar plot of clustering result for three clusters, Sunday and Saturday were not separated, and air-conditioning and non-air-conditioning periods were not separated. For four clusters, the air-conditioning and interim non-air-conditioning periods were not separated. For five clusters, the air-conditioning peak started prior than the actual period compared to the university schedule. Thus, three to five clusters were unable to represent the actual electricity use pattern of Chubu University. With six clusters, air-conditioning and non-air-conditioning interim periods were separated, and the peak electricity use period also matched the university schedule.
The accuracy of the clustering result for six clusters was determined by comparing the calendar plot produced by the clustering with the university schedule. The accuracy (r) of the clustering result was defined as the total number of accurately classified patterns per total number of patterns:
r =   Ap Tp × 100 %
where Ap is the number of accurately classified patterns and Tp is the total number of patterns.
As there were 366 days, we considered Tp as 366. Of the total number of patterns, 327 patterns in the clustering result were found to match the university schedule, so the total number of accurately classified patterns was 327. Using Equation (4), the accuracy of the clustering result was 89.34%. Thus, six clusters were appropriate for Chubu University. This method can also be used for other universities in Japan that follow a similar electricity use pattern as Chubu University.
Figure 12 represents the clustering result of all the Chubu University data with six clusters in the bar graph with x- and y-axes representing the day the of week and number of days in each cluster, respectively. We found that cluster 1 was mainly concentrated on Sundays, Saturdays, and days without lectures. Cluster 2, which represented the electricity use on non-lecture days, was mainly due to electricity consumption of lighting and OA equipment and was mainly concentrated on Saturdays. Air conditioning days were almost always concentrated on weekdays.
Using cluster centers and the above pattern, univariate electricity consumption in the university can be classified into three types: (1) base electricity consumption, (2) electricity consumption due to human activities, and (3) electricity consumption due to air-conditioning.
Base electricity consumption is the minimum amount of energy that is consumed by the university buildings without actual human activities. It is mainly due to the energy use of research equipment that runs 24 h, energy use due to sleep mode of computers, OA equipment, refrigerators, servers, etc. The energy use of cluster 1 can be considered the base energy.
Electricity consumption due to human activities is the energy consumption due to lighting, computers, OA equipment, elevators, etc. This energy use can be obtained by subtracting the base energy from the energy consumption on non-air-conditioning days.
Electricity consumption due to air-conditioning is determined by subtracting energy use on air-conditioning days with energy consumption due to human activities. Adding gas energy use for air-conditioning will provide the final energy consumption due to air-conditioning.

5. Discussion

In this research, we introduced a method to analyze the electricity use pattern of university buildings using the K-means clustering method. K-means clustering is popular because it is able to cluster large amounts of data both quickly and efficiently. It remains a basic framework for developing numerical or conceptual clustering through various possibilities of distance and prototype choice. However, K-means clustering has one disadvantage: the number of clusters must be chosen before the analysis is conducted. The result of the clustering algorithm depends on the value of the initial centroids chosen for clustering. So, in this research, we proposed a method to select better clustering centroids using the percentile method based on empirical cumulative distribution. Building electricity use in universities show similar patterns of increasing during the day time and decreasing at the night; so, in this research, the initial centroids were chosen based on the hourly distribution of one year of electricity use. The proposed method was tested for accuracy in terms of number of accurately classified patterns in case of four different real world datasets. In all the datasets, the proposed method was found to be more accurate. The within-cluster sum of squared distance was found smaller and the between-cluster sum of squared distance was found to be larger in the proposed method compared to the K-means random initialization method. This proved that the proposed method produces a unique clustering result regardless of the number of trials, with better clustering than the K-means method.
For conservation of energy in buildings, it is necessary to know when and how much electricity is consumed. Analyzing the electricity use pattern manually is a time consuming process. Since clustering is a machine learning process, building electricity use analysis using clustering techniques can improve the efficiency of the work. Without analyzing the electricity consumption of each day, peak electricity use, base electricity use, days with unusual electricity use, etc., can be extracted easily using clustering, saving the analyst’s time. Deciding the proper number of clusters is important for obtaining accurate results. In this research, when analyzing the clustering result using three to six clusters, six clusters was found to be appropriate. Thus, K-means clustering using six clusters could analyze the electricity use pattern of Chubu University. The cluster center and calendar plot information regarding when and how much electricity is consumed can be obtained without concerning the university schedule with noticeably good accuracy. Once daily electricity use has been categorized, base electricity consumption, electricity consumption by human activities, and energy consumption by air-conditioning can be determined. As energy consumption by usage is clarified, measures for energy consumption in university buildings can be proposed.

6. Conclusions

This paper presented a method that can be used to increase the performance of the K-means algorithm by choosing better initial centroids and number of clusters. Initial centroids chosen using the percentile method from empirical cumulative distribution were found to be more accurate than the random initialization method and empty clusters were removed. The proposed method was also found to produce better clusters in the case of building energy time series data, which was supported by the clusters produced by the proposed method having small within-cluster sum of squared distances and large between-cluster sum of squared distances. The uncertainty of the K-means algorithm is removed by the proposed method because the results produced by the proposed method were the same irrespective of the number of trials.
For the conservation of energy in university buildings it is necessary to know when and how much electricity is being consumed. To analyze this using the clustering technique, it is necessary to select the proper number of clusters. To determine the proper number of clusters for Chubu University, we analyzed the electricity use pattern for three to six clusters. The calendar plot for three to five clusters using K-means clustering did not match the university schedule. For six clusters, the clustering result was similar to the university schedule with an accuracy of 89.3%. So, we found that six clusters were appropriate for Chubu University. With this method, it is possible to determine electricity consumption due to base consumption, human activities, and due to air-conditioning, which can lead to a better understanding of university energy use and can help with planning the conservation of energy in these buildings.

Author Contributions

Investigation, M.Y. and B.N.; Conceptualization, M.Y.; Methodology, M.Y. and B.N.; Supervision, M.Y.; Validation, M.Y. and B.N., Software, H.S. and B.N.; Visualization, H.S. and B.N.; Formal analysis, A.Y. and B.N.; Resources, A.Y. and B.N., Data curation, B.N.; Writing—original draft, B.N.; Writing—review & editing, M.Y., B.N. and H.S.

Funding

This research was funded by Chubu University Grand D.

Acknowledgments

The authors extend their appreciation to the Facility Administration Department of Chubu University for providing data and advices regarding building energy analysis.

Conflicts of Interest

The authors declare no conflict of interest.

References

  1. Energy Technology Perspectives. 2017. Buildings. Available online: http://www.iea.org/buildings (accessed on 3 May 2019).
  2. Han, J.; Kamber, M.; Pie, J. Data Mining Concepts and Techniques; Academic Press; Morgan Kaufmann Publisher: Waltham, MA, USA, 2012. [Google Scholar]
  3. Kotsiantis, S.B.; Pintelas, P.E. Recent Advances in Clustering: A Brief Survey. WSEAS Trans. Inf. Sci. Appl. 2004, 1, 73–81. [Google Scholar]
  4. Khan, S.S.; Ahmad, A. Cluster Centre Initialization Algorithm for K-means clustering. Pattern Recognit. Lett. 2004, 25, 1293–1302. [Google Scholar] [CrossRef]
  5. Jain, A.K. Algorithm for Clustering Data; Prentice-Hall: Englewood Cliffs, NJ, USA, 1988. [Google Scholar]
  6. Amri, Y.; Fadhilah, A.L.; Setani, N.; Rani, S. Analysis Clustering of Electricity Usage Profile Using K-Means Algorithm. In IOP Conference Series: Materials Science and Engineering; IOP Publishing: Bristol, UK, 2016; Volume 105, p. 012020. Available online: https://iopscience.iop.org/article/10.1088/1757-899X/105/1/012020 (accessed on 12 April 2019).
  7. Damayanti, R.; Abdullah, A.G.; Purnama, W.; Nandiyanto, A.B. Electricity Load Profile Analysis Using Clustering Techniques. In IOP Conference Series: Materials Science and Engineering; IOP Publishing: Bristol, UK, 2017; Volume 180, p. 012081. Available online: https://iopscience.iop.org/article/10.1088/1757-899X/180//012081 (accessed on 26 March 2019).
  8. Santamouris, M.; Mihalakakou, G.; Patargias, P.; Gaitani, N.; Sfakianaki, K.; Papaglastra, M.; Pavlou, C.; Doukas, P.; Primikiri, E.; Geros, V.; et al. Using Intelligent Clustering Technique to Classify the energy performance of School Buildings. Energy Build. 2007, 39, 45–51. [Google Scholar] [CrossRef]
  9. Arai, K.; Barakbah, A.R. Hierarchial K-means: An Algorithm for Centroids Initialization for K-means. Rep. Fac. Sci. Eng. Saga Univ. 2007, 36, 25–31. [Google Scholar]
  10. Yedla, M.; Pathakota, S.R.; Srinivasa, T.M. Enhancing K-means Clustering Algorithm with Improved Initial Center. Int. J. Comput. Sci. Inf. Technol. 2010, 1, 121–125. [Google Scholar]
  11. Shakti, M.; Antony, S.T. An Effective Determination of Initial Centroids in K-means Clustering Using Kernel PCA. Int. J. Comput. Sci. Inf. Technol. 2011, 2, 955–959. [Google Scholar]
  12. Huang, J.Z. Automated Variable Weighing in K-Means Type Clustering. IEEE Trans. Pattern Anal. Mach. Intell. 2005, 27, 657–668. [Google Scholar] [CrossRef] [PubMed]
  13. Fahim, A.M. An Efficent Enhanced k-means Clustering algorithm. J. Zhejiang Univ. Sci. A 2006, 7, 1626–1633. [Google Scholar] [CrossRef]
  14. Prahastono, I.; King, D.J.; Ozveren, C.S. A review of Electricity Load Profile Classification methods. In Proceedings of the 42nd Universities Power Engineering Conference, Brighton, UK, 4–6 September 2007; pp. 1187–1191. [Google Scholar]
  15. Molina-Solana, M.; Ros, M.; Ruiz, M.D.; Gómez-Romero, J.; Martin-Bautista, M.J. Data Science for Building Management: A review. Renew. Sustain. Energy Rev. 2017, 70, 598–609. [Google Scholar] [CrossRef]
  16. Kim, S.S. Variable Selection and Outlier Detection for Automated K-means clustering. Commun. Stat. Appl. Methods 2015, 22, 55–67. [Google Scholar] [CrossRef]
  17. Yu, Z.J.; Haghighat, F.; Fung, B.C.; Morofsky, E.; Yoshino, H. A Methodology for Identifying and Improving Occupant Behavior in Residential Buildings. Energy 2011, 36, 6596–6608. [Google Scholar] [CrossRef]
  18. Bessa, R.J.; Trindade, A.; Mirinda, V. Spatial-Temporal Solar Power Forecasting for Smart Grids. IEEE Trans. Ind. Inform. 2014, 11, 232–241. [Google Scholar] [CrossRef]
  19. Ceci, M.; Corizzo, R.; Malerba, D.; Rashkovska, A. Soatial Autocorrelation and Entropy for Renewable Energy Forecasting. Data Min. Knowl. Discov. 2019, 33, 698–729. [Google Scholar] [CrossRef]
  20. Iglesias, F.; Kastner, W. Analysis of Similarity Measures in Time Series Clustering for the Discovery of Building Energy Patterns. Energies 2013, 6, 579–597. [Google Scholar] [CrossRef]
  21. UCI Machine Learning Repository. Available online: https://archive.ics.uci.edu/ml/dataset.php (accessed on 6 April 2019).
Figure 1. Aerial photograph of Chubu University, Japan.
Energies 12 02451 g001
Figure 2. Boxplot with outliers.
Energies 12 02451 g002
Figure 3. Boxplot after outliers were removed.
Energies 12 02451 g003
Figure 4. Flow chart of the K-means algorithm.
Energies 12 02451 g004
Figure 5. Electricity use at Chubu University for different electricity use periods: (a) Sundays and holidays, (b) Saturdays, (c) lecture days without air conditioning, (d) lecture days with air-conditioning, (e) lecture days with air-conditioning peak, and (f) non-lecture days with air-conditioning.
Energies 12 02451 g005
Figure 6. Selection of the initial centroid using the percentile method.
Energies 12 02451 g006
Figure 7. Model of 366 × 24 order matrix.
Energies 12 02451 g007
Figure 8. Part of the data frame of the 366 × 24 order matrix.
Energies 12 02451 g008
Figure 9. Clustering result of Chubu university. The cluster centers for (a) k = 3 and (b) k = 4. The calendar plot for (c) k = 3 and (d) k = 4.
Energies 12 02451 g009
Figure 10. Clustering result for Chubu University. The cluster centers for (a) k = 5 and (b) k = 6. The calendar plots for (c) k = 5 and (d) k = 6.
Energies 12 02451 g010
Figure 11. Actual calendar plot of Chubu University.
Energies 12 02451 g011
Figure 12. The number of days per cluster by day of the week.
Energies 12 02451 g012
Table 1. Resulting accuracy of different datasets.
Name of
Data
No. of
Clusters
K-Means (100 Trials)Proposed Method
Accuracy (%)
Max (%)Min (%)Average (%)
Iris389.35880.989.3
Wine370.395665.870.39
Ruspini4947989.2100
New-Thyroid386.0479.182.1386
Table 2. Comparison of K-means algorithms with different datasets. Dist = distance.
Data SetNo. of
Clusters
K-Means (100 Trials)
Average
Proposed Method
Between-Cluster Sum of Square Dist.Within-Cluster Sum of Square Dist.Between-Cluster Sum of Square Dist.Within-Cluster Sum of Square Dist.
Iris3585.895.46602.578.85
Wine315,146,2222,445,69115,221,6072,370,690
Ruspini4218,10826,226231,49312,881
New Thyroid334,679.229,009.835,204.828,876.7
Table 3. Comparison of K-means clustering with random initialization and proposed method.
No.
Clusters
(K)
Within-Cluster Sum of Squared DistanceBetween-Cluster Sum of Squared Distance
K-Means with Random InitializationProposed MethodK-Means with Random InitializationProposed
Method
42.28 × 1082.08 × 1081.66 × 1091.68 × 109
51.65 × 1081.65 × 1081.72 × 1091.72 × 109
61.36 × 1081.30 × 1081.75 × 1091.76 × 109
71.16 × 1081.09 × 1081.59 × 1091.82 × 109
Total6.45 × 1086.14 × 1086.74 × 1096.95 × 109
Table 4. Characteristics of electricity use at Chubu University.
Cluster
No.
LectureAir-ConditioningUniversityGeneral Occurrences
1XXclosedSundays, holidays
2XXpartially openSaturdays, holidays with events
3Xopenvacations
4XopenSpring and autumn
5openSummer and winter
6openSummer and winter peak period
* X represents absence and ✓ represents presence.

