Natural Ventilation Effectiveness of Awning Windows in Restrooms in K-12 Public Schools


1
Department of Creative Design, National Yunlin University of Science and Technology, Douliu 640, Taiwan
2
Department of Civil Engineering, National Cheng Kung University, Tainan 701, Taiwan
*
Author to whom correspondence should be addressed.
Energies 2019, 12(12), 2414; https://doi.org/10.3390/en12122414
Submission received: 8 April 2019
/
Revised: 8 June 2019
/
Accepted: 17 June 2019
/
Published: 23 June 2019
(This article belongs to the Special Issue Building Thermal Envelope)
Abstract
:Using computational fluid dynamics (CFD), this study explores the effect of a different number of awning windows and their installation locations on the airflow patterns and air contaminant distributions in restrooms in K-12 (for kindergarten to 12th grade) public schools in Taiwan. A representative restroom configuration with dimensions of 10.65 m × 9.2 m × 3.2 m (height) was selected as the investigated object. Based on the façade design feasibility, seven possible awning window configurations were considered. The results indicate that an adequate number of windows and appropriate installation locations are required to ensure the natural ventilation effectiveness of awning windows. The recommended installation configuration is provided.
1. Introduction
In Taiwan, restrooms in K-12 public schools (kindergarten (K) and the 1st through the 12th grade (1-12)) are frequently accessed and are open to the public, which hinders their management. In particular, restrooms that have been in service for more than 20 years often exhibit problems, such as poor ventilation, inadequate lighting, outdated layouts and designs and limited toilet spaces. Thus, these restrooms have become a nuisance for school environment management. Poor-quality restrooms create fear of using the restroom among teachers and students, which increases incidents in which teachers and students are affected by acute or chronic diseases that can adversely affect their physical and mental health.
There are few studies on bathroom and restroom ventilation that address the ventilation efficiency of entire bathrooms and restrooms as well as the ventilation efficiency of their components (e.g., toilets and fans). Investigating the ventilation of an entire bathroom and restroom, Tung et al. [1] analyzed a new negative pressure wall-exhaust ventilation system (that differs from the traditional ceiling-exhaust system) installed in a residential bathroom and restroom using a full-scale test. In the test, toilets were deployed in several different patterns and positions. The test results indicated that the restroom ventilation system could take advantage of a negative pressure difference to prevent the escape of restroom malodor to an adjacent room. Increasing the ventilation volume or decreasing the distance between vent and toilet could improve both the indoor pollutant removal rate and the ventilation rate. From the perspective of energy efficiency, an air change rate of 8.5 h−1 was the optimal value. Tung et al. [2] analyzed the effectiveness of three ventilation strategies for residential bathroom malodor removal: (1) forced ceiling-supply and wall-exhaust systems, (2) natural window-inlet and forced ceiling-exhaust systems and (3) forced ceiling-supply and ceiling-exhaust systems. The first strategy achieved the best malodor removal. Yang and Kim [3] employed computational fluid dynamics (CFD) to analyze the effect of changing the glass partition shape in an apartment bathroom on the bathroom ventilation. Their study provides a glass partition design for a bathroom (with a shower and restroom) that can maintain excellent household hygiene.
Regarding the effectiveness of bathroom and restroom components, Seo and Park [4] designed a new toilet ventilation system, in which a ring opening for odor suction was included under the toilet seat. Malodor at the source was directly sucked out to reduce the escape of malodor into the restroom. The effectiveness of this ventilation system was validated via testing and CFD simulation. The test and numerical simulation results were essentially consistent. Dual openings at the rear of the toilet with 4 mm2 × 4 mm2 odor suction holes represented the optimal design. The ventilation system draws outdoor fresh air into the restroom via door opening. Sato et al. [5] analyzed the amounts of volatile substances of human waste malodor (i.e., feces and urine). The substances were collected via Tenax-TA, and their concentrations were determined by thermal-desorption cold-trap injector/gas chromatography/mass spectrometry (TCT/GC/MS). The results revealed that approximately 90% of malodor substances were fatty acids: acetic acid (65%), propionic acid (15%), butyric acid (6.5%), i-Valeric acid and n-Valeric acid. Approximately 8% of these substances were N-containing compounds: ammonia (6.5%), pyridine, pyrrole, indole, skatole and trimethylamine.
Kim and Yang [6] analyzed the ventilation effectiveness of exhaust fans installed in a residential bathroom in Korea via field measurement. In the paper, construction and design methods were revised to enhance the bathroom ventilation. Yin et al. [7] analyzed the effect of increasing the operational pressure of a residential bathroom ventilation fan on the ventilation effectiveness. The survey objects were more than 80 families who used AC-motor ventilation fans. The results revealed that the performance of the exhaust fan was significantly penalized by an increase in external static pressure. Choi et al. [8] provided statistics from bathroom ventilation fan tests from 2005 to 2013 and interpreted these statistics based on the development trend of residential ventilation standards and guidelines.
Numerous studies have examined natural ventilation for buildings. Comprehensive reviews on natural ventilation studies, including effects of building façade and ventilation opening, ventilation shaft design, shape of louvered windows, apertures and vernacular element, the representative air change rates, applications in multi-story buildings, the effect of thermal energy storage on night ventilation efficiency, night ventilation effectiveness and design, etc., are found in the literature [9,10,11,12,13,14,15]. However, studies of the natural ventilation of restrooms, particularly restrooms in K-12 public schools, are limited. In this study, restrooms in these schools in Taiwan are selected as the study subjects. The effect of the installation quantity, position and opening angle of awning windows on the flow pattern and air pollutant (NH3) distribution in restrooms with various wind speeds and directions are analyzed via CFD.
2. Materials and Methods
2.1. Study Subject
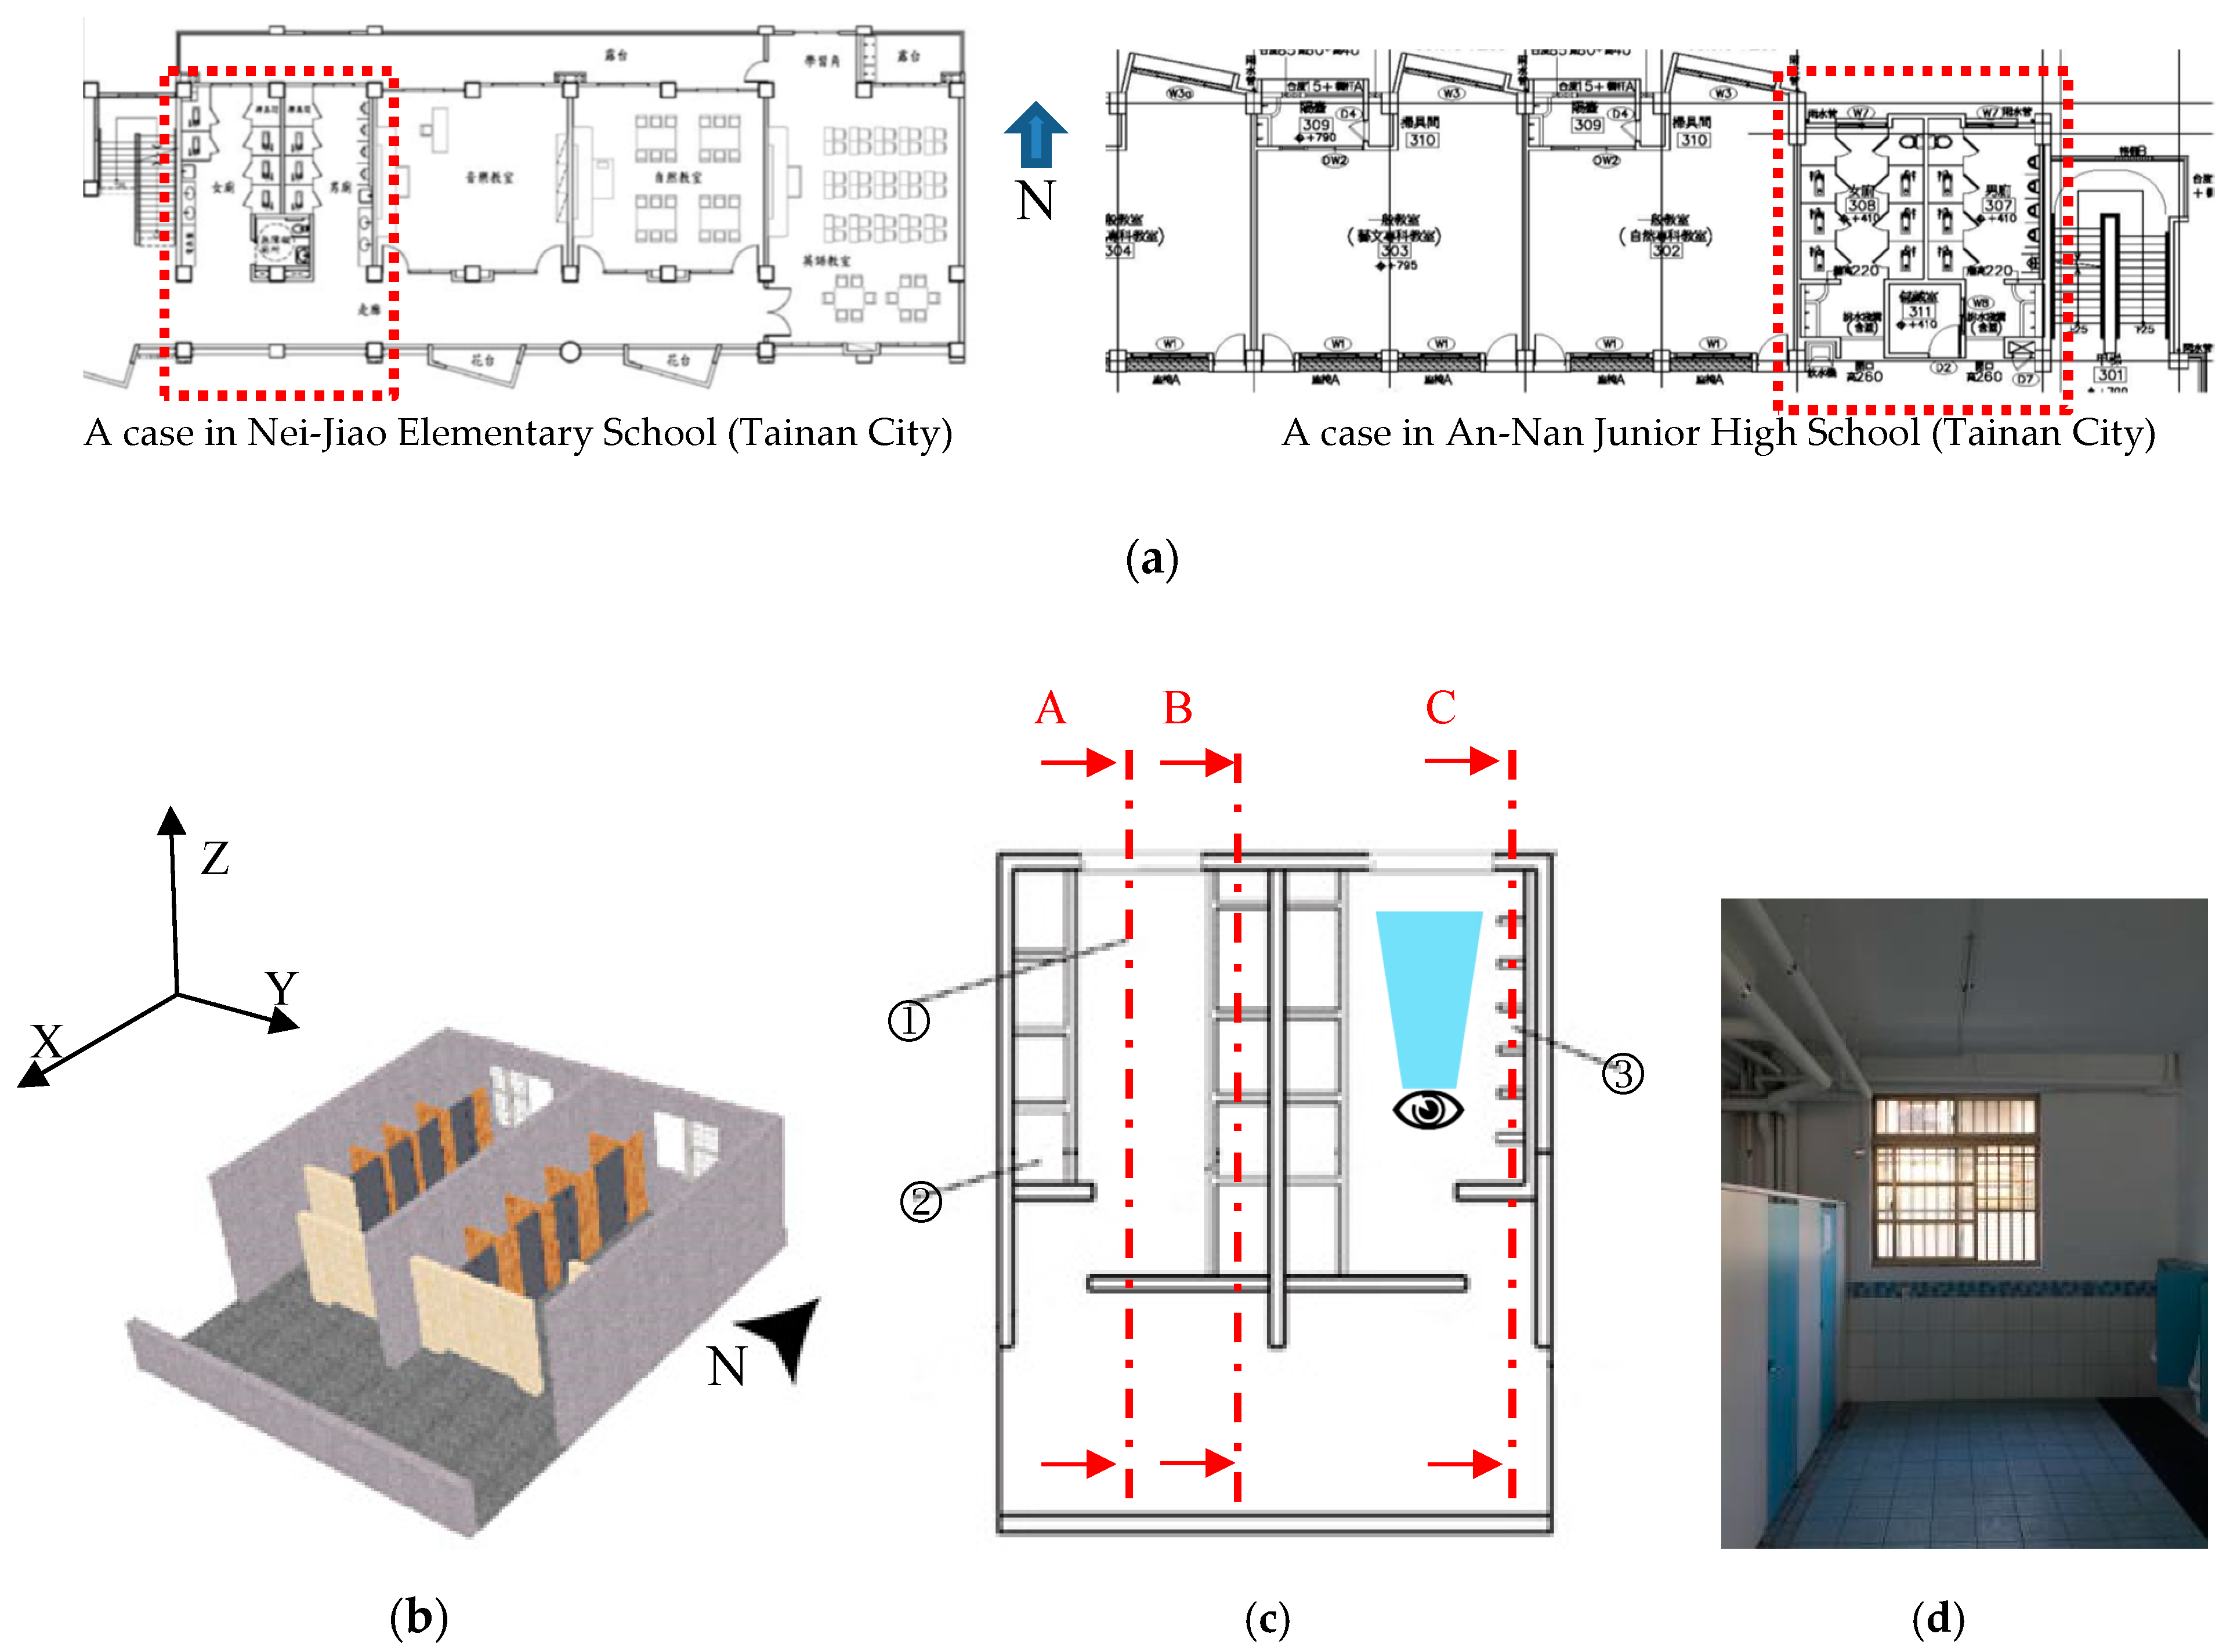
Restroom indoor configurations differ due to their position, site area, orientation, and building design. It is very common for public school buildings to have east-west orientation (facing the south and the north) with restrooms at the opposite two ends under the requirement of the building code of Taiwan, as illustrated in Figure 1a. After analyzing restrooms in 140 K-12 public schools in Taiwan, a representative model restroom with the following dimensions is selected as the study subject: 10.65 m × 9.2 m × 3.2 m (height) (Figure 1). In Figure 1c, ① indicates the aisle in the restroom, ② is the squatting toilet area in the women’s restroom, and ③ is the urinal area in the men’s restroom.
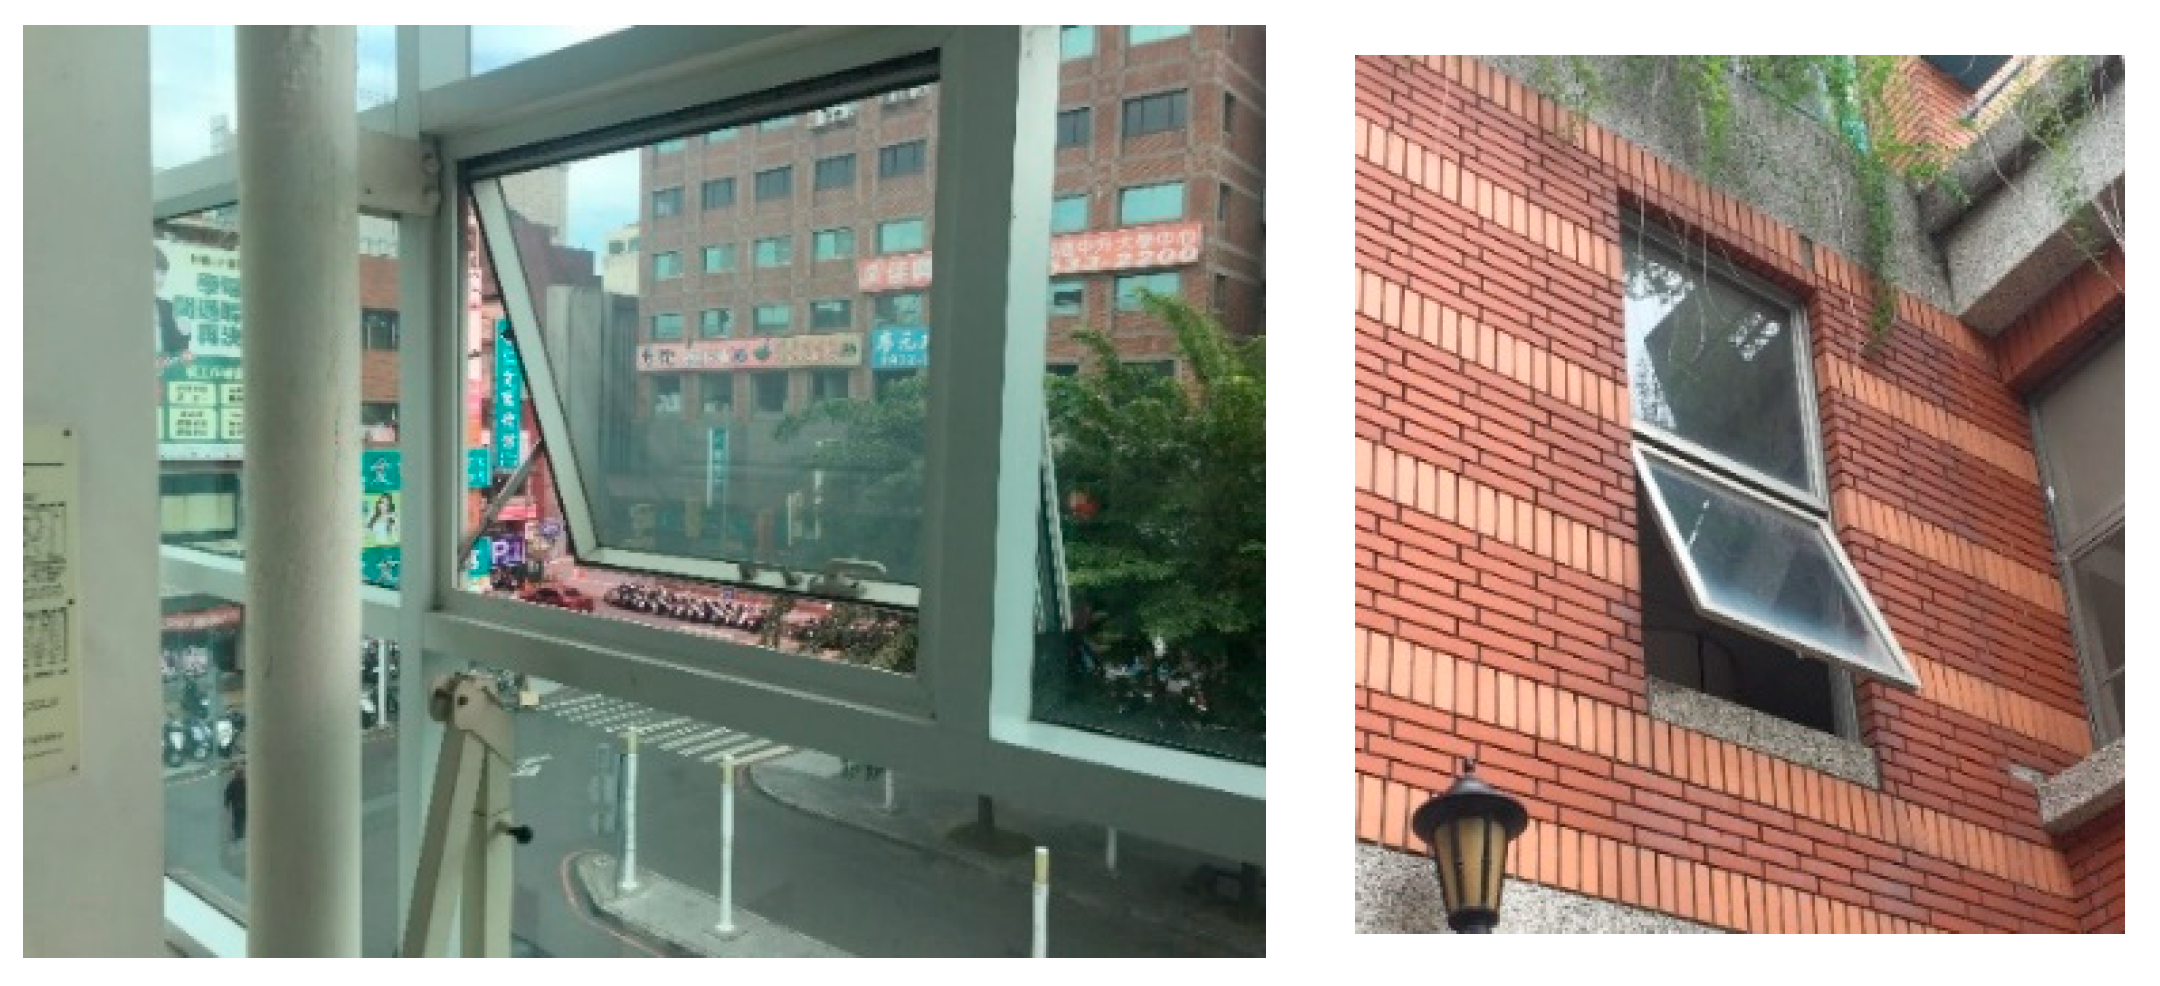
Currently, the windows that are commonly employed in school restrooms include horizontal push windows, awning windows and blinds. In this study, based on Figure 1, a preliminary study of the effect of the window configuration on the natural ventilation performance of a restroom (0.5 m/s north wind) is conducted using CFD (discussed in a subsequent section). The results indicate that an awning window has the best ventilation effect, followed by blinds. The order of ventilation effectiveness is described as follows: awning window > blinds > horizontal push window (data not shown). The awning window has the following advantages: sufficient ventilation area and an adjustable opening angle to control the ventilation area and deflect rain (which is particularly suitable for the typhoon and rainy season in Taiwan). Therefore, the awning window (as illustrated in Figure 2) is selected as the window configuration for the subject.
The dimensions of the awning windows that are available in the market vary in the range of 0.4 m × 0.4 m–1.4 m × 1.0 m. The dimensions of the awning window that is investigated in this study are 1.0 m × 0.9 m. The position of the restroom window is varied. In this study, the awning window configuration is based on the north façade (Table 1), which is located on a certain floor and has seven window configurations (W1–W7). The windows for men’s and women’s restrooms are installed symmetrically. Whether a window frame is listed as a CFD simulation object affects the number of grids in the simulation and may significantly increase computing time. Therefore, the glazing dimensions are used as the dimensions of the ventilation opening; i.e., the window frame is ignored here. The installation of four awning windows comprises three designs (the black blocks in Table 1b–d). The installation of eight awning windows consists of three designs (Table 1e–g). In addition, the installation of 12 awning windows has one design (Table 1h). The opening angles θ for the awning windows are 30°, 45° and 60°. The approaching wind speeds are 0.5 m/s, 1 m/s and 2 m/s. In Taiwan, the weather and climate are greatly affected by monsoons. In summer, the prevailing wind is a southwesterly or southerly monsoon, while in winter it is northeasterly or northerly monsoon. Thus, the wind directions set in the CFD simulation include south and north winds. There is no heat source in the restroom, and the toilet doors are closed to simulate the scenario when the restroom is in use. Geometric data for the model under investigation are listed in Table 2.
The major cause of poor air quality in restrooms is the malodor of feces and urine. The smell of feces and urine is primarily the smell of ammonia. In contrast, sewer malodor consists of mixed chemical substances, such as hydrogen sulfide, methyl mercaptan, trimethylamine, dimethyl disulfide, indole and methyl indole. This study focuses on the restroom flow field and the malodor concentration field. Because the irritating odor of ammonia is believed to be a major contributor to the offensive odor of human waste [5], the NH3 concentration in the malodor is analyzed. To simulate the very worst condition, the generation rate of unpleasant odors (represented by NH3) was assumed to be 0.3 L/min (0.2 g (NH3)/min) in this study. The pollution source area is set to 0.1 m × 0.1 m.
A modified odor removal efficiency (ORE) [2,16,17] was employed to express the ventilation performance of the whole restroom. A higher ORE indicates a lower concentration level, thus indicating better ventilation efficiency for odor removal. The ORE is defined as:
where Ce is the odor concentration at the exhaust, C0 is the indoor background concentration and Cp is the average concentration at the height of the breathing zone.
2.2. Numerical Methods
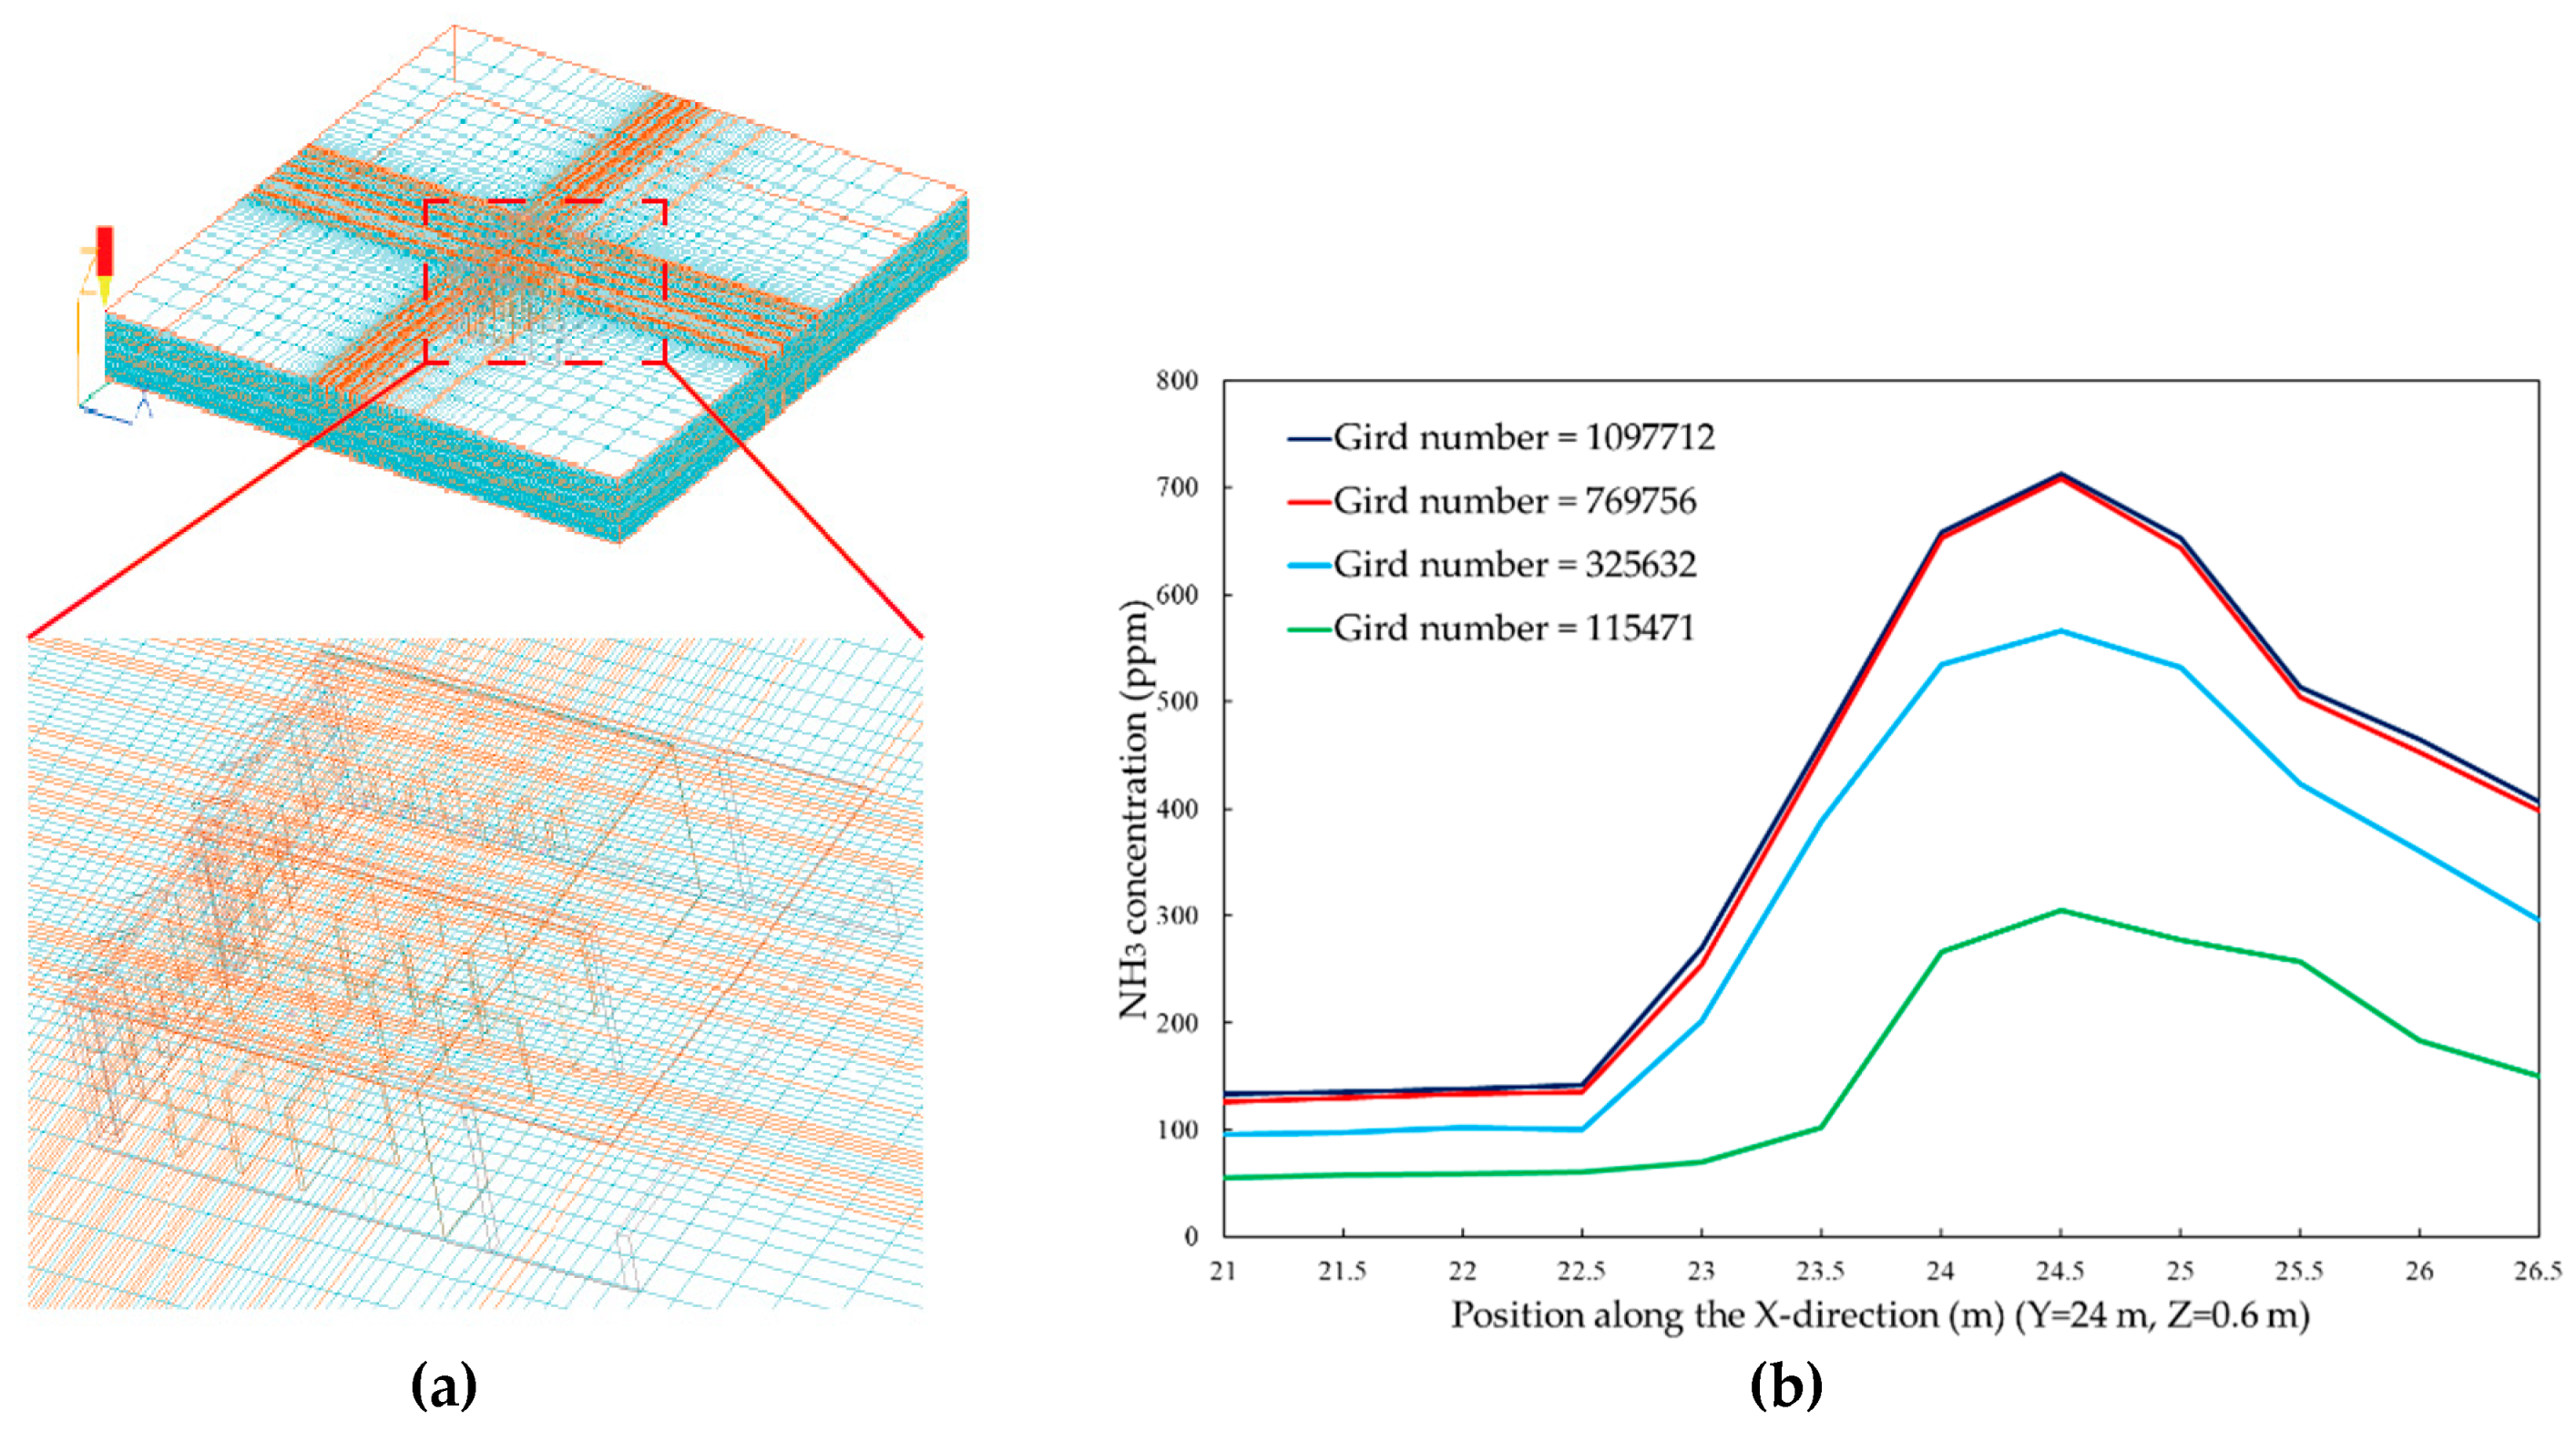
Numerical simulations of the problem that is being investigated are performed via a finite volume method to solve the governing equations with the previously discussed boundary conditions (Table 3). The calculation domain (50 m × 50 m × 3.2 m) is shown in Figure 3a. The commercial CFD code PHOENICS is used to simulate the airflow and NH3 distributions. The governing equations solved by PHOENICS include a three-dimensional time-dependent incompressible Navier-Stokes equation, a time-independent convection diffusion equation and a k-ε turbulence equation. The formulations of these equations can be found in the PHOENICS manual [18] and in most CFD textbooks; thus, they are not provided here. The empirical turbulence coefficients for the k-ε turbulence equation are assigned as follows: σk = 1.0, σε = 1.22, σε1 = 1.44, σε2 = 1.92 and Cμ = 0.09. These values are widely accepted in CFD k-ε models. To bridge the steep gradients of dependent variables near a solid surface, a general wall function is employed. Iterative calculation continues until a prescribed relative convergence of 10−3 is satisfied for all field variables of this problem.
When testing the grid independence of a mesh domain, the NH3 distribution at the user’s squatting position (X = 0.925 m, Y = 1.2 m), which is based on different grid points, is used to calculate the deviation percentages and determine a suitable grid point system for the calculation (Figure 3b). Numerical simulation accuracy depends on the resolution of the computational mesh. A finer grid produces more accurate solutions. In this study, a grid system with approximately 131 × 113 × 52 (769,756) cells is used for numerical simulations. Each cell in the investigated restroom is about 0.1 m × 0.15 m × 0.06 m. An increase in the number of cells provides better information. However, such an increase is accompanied by a significant increase in computational resources.
2.3. Model Validation
In this study, a reduced-scale model of the investigated restroom shown in Figure 1 is constructed (Figure 4a). The material used for the model is 3-mm-thick gray hard cardboard and foam core board. The model scale is 1:45. The opening in the model is simply an opening without an installed window. A 4-inch fan is installed at the restroom entrance to simulate a south wind, and the airflow velocity in the model was measured by a multifunction measuring instrument (Testo 435-1) with an anemometer (Testo 0635 1535). There are seven measurement locations: at the two entrances (two locations), the window opening centers (two locations), the aisle centers (two locations) and the central toilet (one point). Each measurement location measures three heights: 1 cm, 3 cm and 5 cm. Next, CFD simulation with the same method mentioned in Section 2.2 is performed based on this reduced-scale model, and the simulation result is compared with the reduced-scale test result. As shown in Figure 4b, the difference between the CFD results and the experimental results is not significant. Thus, the reliability of the simulation results was confirmed.
3. Results and Discussion
3.1. Case Study: the Effect of Wind Direction
In Taiwan, the perennial wind direction pattern is south in summer and north in winter. In this section, the indoor flow field and NH3 concentration distribution for different outdoor wind directions are investigated using a case study with the following settings: awning windows installed at the center of the exterior north wall (Table 1c, window configuration W2), an opening angle θ of 45° and an outdoor wind speed of 1 m/s.
Figure 5a shows the flow field in the aisle in the women’s restroom (Figure 1c, section A). A north wind flows from the left side of the diagram toward the awning window. Guided by the inclined window surface, outdoor air flows toward the indoor ceiling at an angle pointing to the upper right (Figure 5a, symbol ➊). Then, it flows along the ceiling to the exterior door in the south (right side of the diagram; ➋). This flow becomes the main stream that drives indoor air circulation (➌).
Figure 5b shows the flow field in the toilet area in the women’s restroom (Figure 1c, section B). Under the main stream ➍, three air circulations are formed. The clockwise circulations ➎➏ form in the toilet area. Their flow speeds are fast enough to carry NH3 to the top. After these flows merge into the main stream, they flow to the exterior door in the south. Circulation ➐ is a large-scale clockwise circulation. This circulation flows to the toilet area from the main stream, carries away NH3 and flows toward the top left ➑. Then, it merges into the main stream and flows toward the exterior door in the south (right side of diagram). Because circulation ➐ is weak, and the circulation follows a particular pattern, the flow in space ➒ at the bottom of ➑ is weak and unable to carry away NH3, which produces a higher NH3 concentration than the concentration in the other toilet areas (Figure 5c).
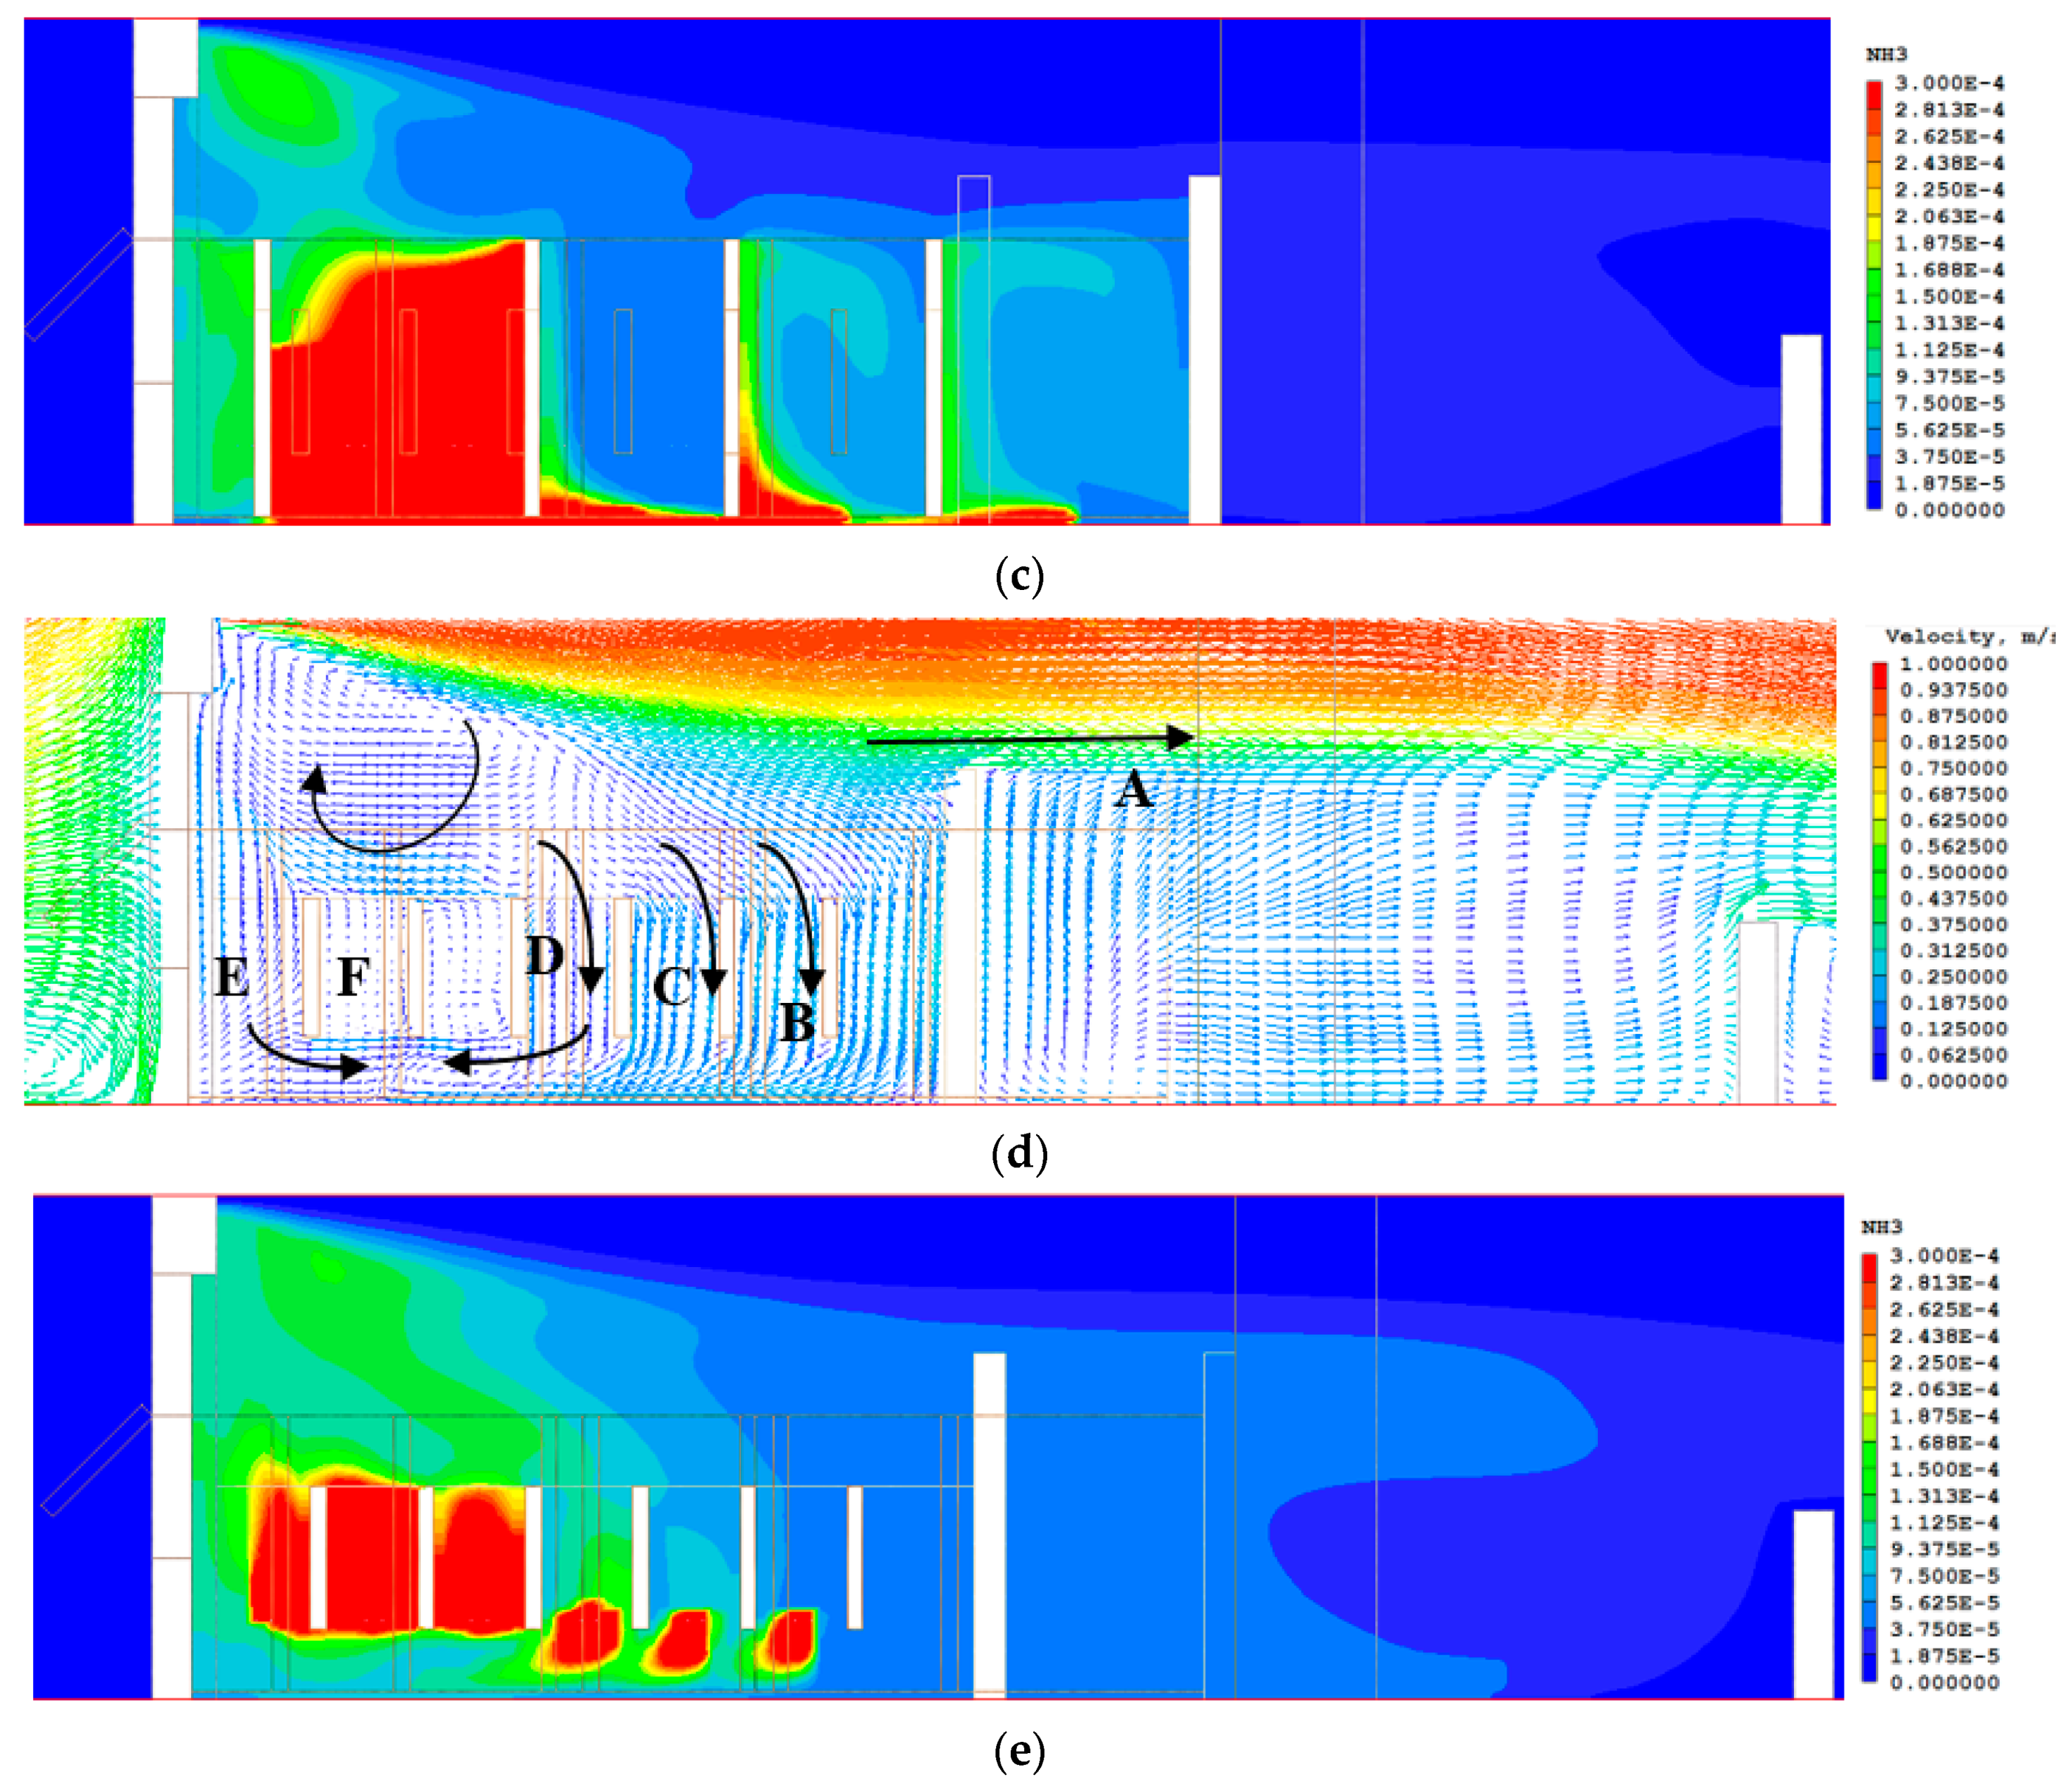
Figure 5d shows the flow field in the urinal area in the men’s restroom (Figure 1c, section C). Driven by main stream A and affected by the urinal partition board, the clockwise flows BCD (please refer to the symbols on Figure 5d) merge with the counter-clockwise flow E. As flow BCD flows through the urinal area, the NH3 concentrations in the three individual urinal areas are low (Figure 5e). Affected by the flow structure, the air in space F stagnates, which results in a higher NH3 concentration than in other locations.
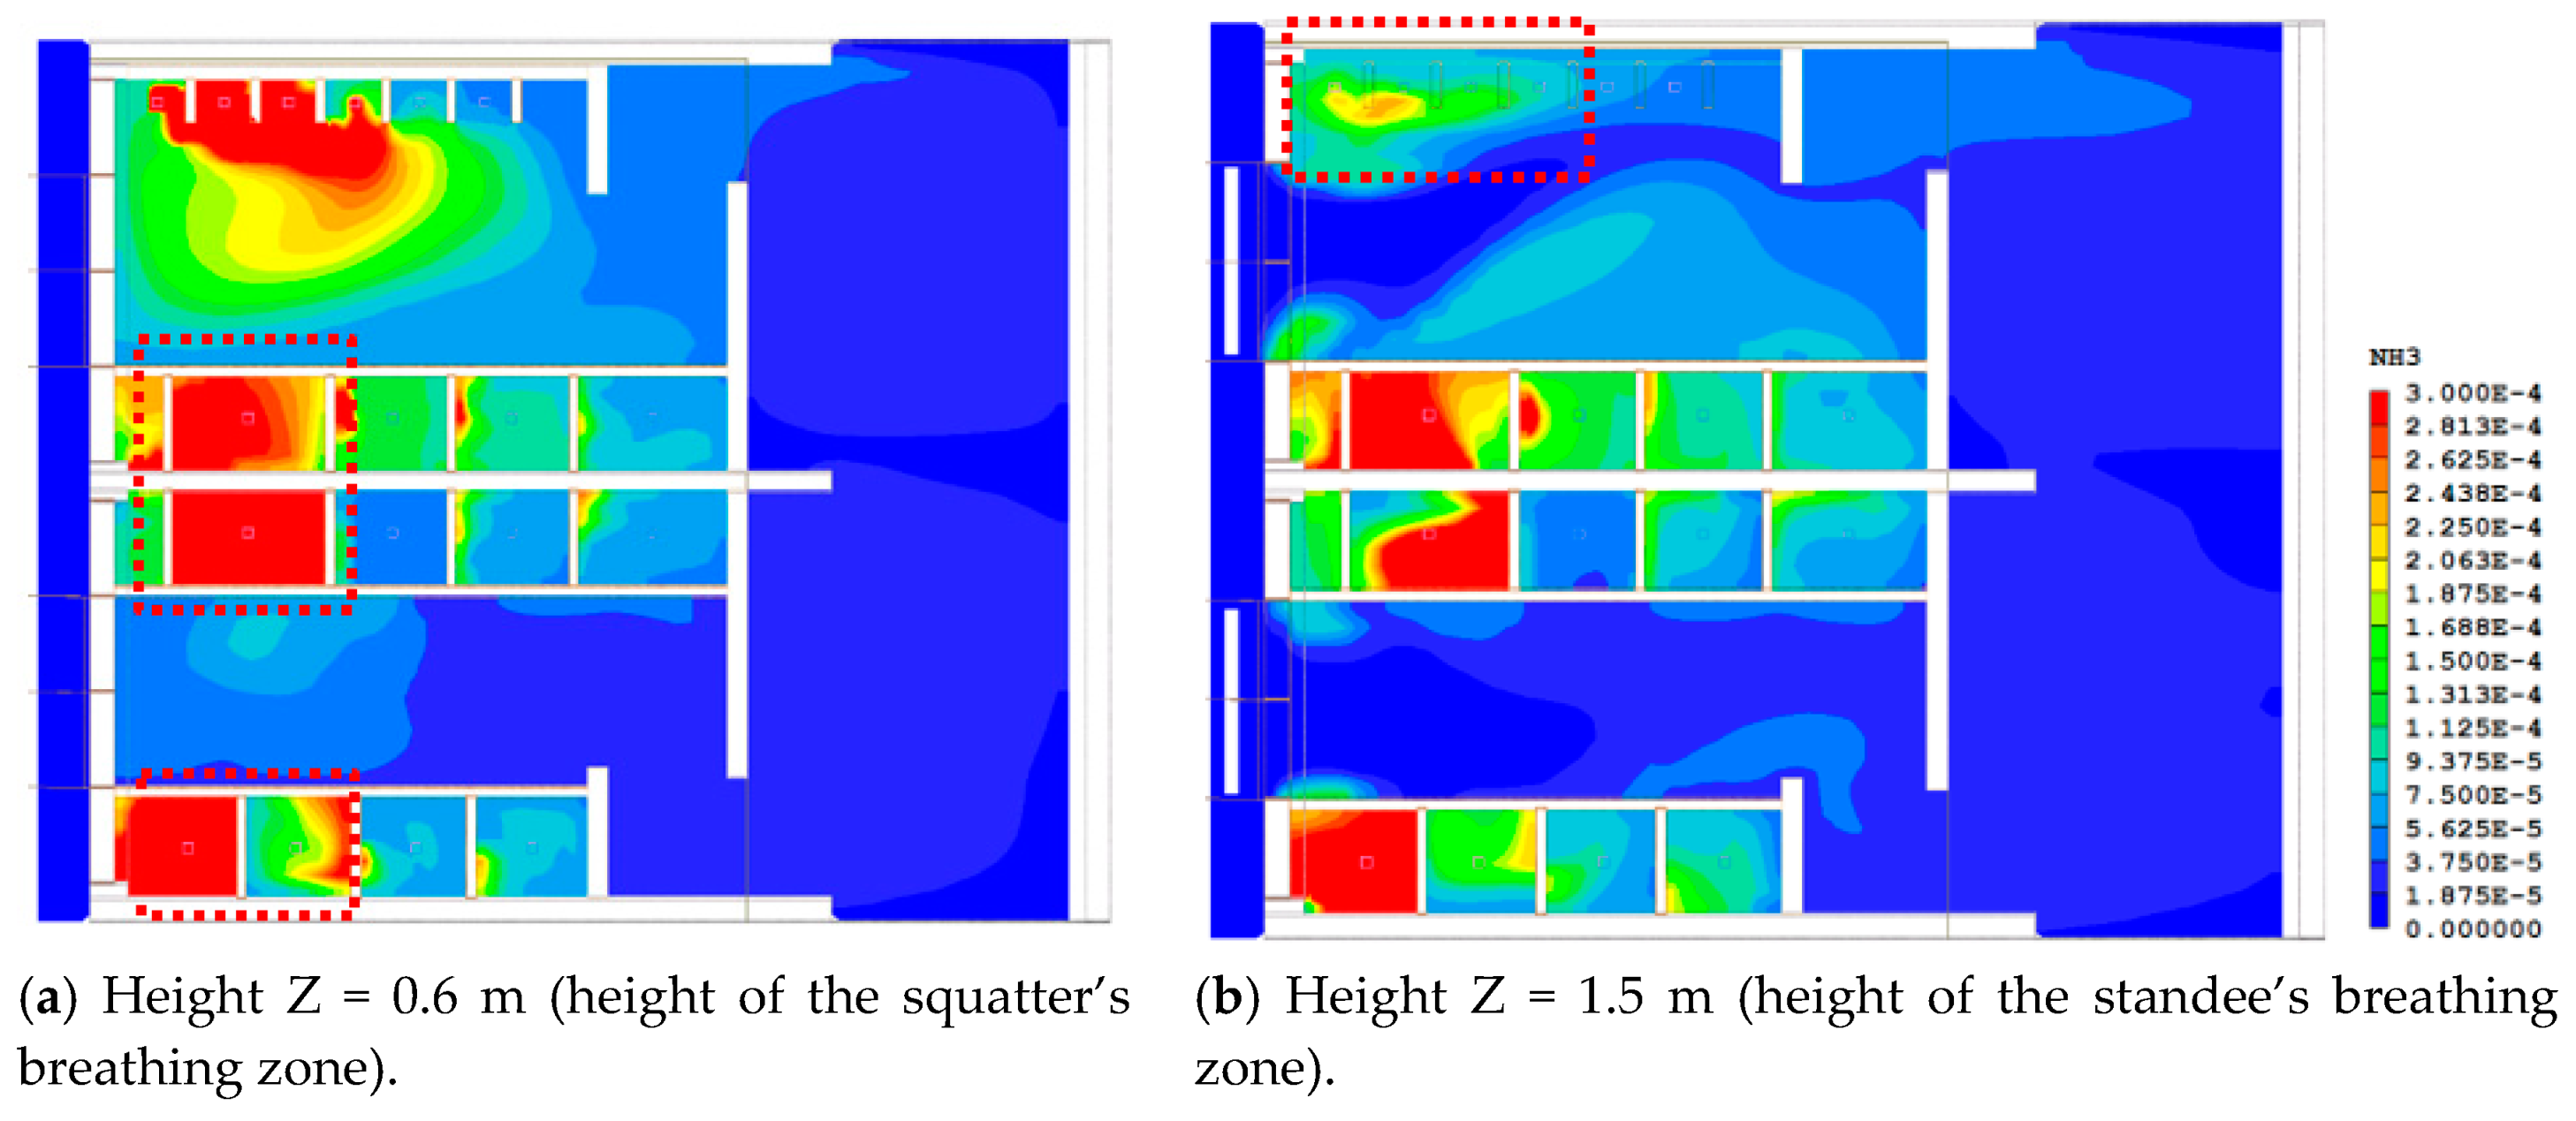
The preceding analysis and Figure 6 reveal that the toilet area and the urinal area near the exterior wall have poor ventilation due to the flow field structure. Figure 6a shows that when users defecate in a squatting position, the NH3 concentration is high at the breathing zone height, in the area marked with a red dotted line (Z = 0.6 m). When men urinate in a standing position, Figure 6b shows that the NH3 concentration is high at the breathing zone height, in the area marked with a red dotted line (Z = 1.5 m).
The Annex I 109.03 of “Information notices on occupational diseases: a guide to diagnosis (European Commission, 2009)” [19] indicates that the odor threshold of NH3 is about 20 ppm; exposure levels of NH3 that surpass 50 ppm will result in immediate irritation to the nose and throat; exposure level to 250 ppm is bearable for 30–60 min; and exposure level to 300 ppm is considered to be immediately dangerous to life and health. It is good to define an acceptable level of NH3 from which the ventilation performance of each case could be evaluated. However, the recommended values above cannot be well applied in quasi-steady-state problems raised in this study that urinating or defecating is within a limited time-period. More observation and discussion are needed. Besides, the generation rate of unpleasant odors set in this study presents the very worst condition; if a referenced threshold level was used and linked to our simulations, the results would be misleading. Such constraints limit this study to a relative comparison among cases.
Figure 7a shows flow field in the aisle in the women’s restroom (Figure 1c, section A). Affected by the partition wall (➊), the south wind flows into the room via the south exterior door (right side of the diagram) and then flows toward the top left ceiling (➋). Subsequently, it flows outdoors via the north window (left side of the diagram). This flow becomes the main stream that drives indoor circulations (➌) at the bottom zone.
Figure 7b shows the flow field in the toilet area in the women’s restroom (Figure 1c, section B). The main stream ➍ flows into the room via the south exterior door (right side of the diagram). Near the north wall (left side of the diagram), part of the flow flows out the window, but the majority of the flow moves down along the wall. When the flow enters the toilet, counter-clockwise air circulation ➎ is formed, which results in a low NH3 concentration in the restroom (Figure 7c). Because the main stream is close to the ceiling and the flow speed is low, stagnant air and high NH3 concentrations result in the spaces at the bottom ➏➐➑.
Figure 7d shows the flow field in the urinal area in the men’s restroom (Figure 1c, section C). Main stream A flows into the room via the south exterior door (right side of the diagram). Near the north wall (left side of the diagram), part of the flow flows out the window, but the majority of the flow flows downward along the wall surface (B). Affected by the partition board, flow B turns right and exhibits a pattern of horizontal flow (C). Then, it turns upward at the partition wall (D) and forms a major counter-clockwise circulation (BCD). This large circulation surrounds the urinal area, which results in a high NH3 concentration in this area (Figure 7e).
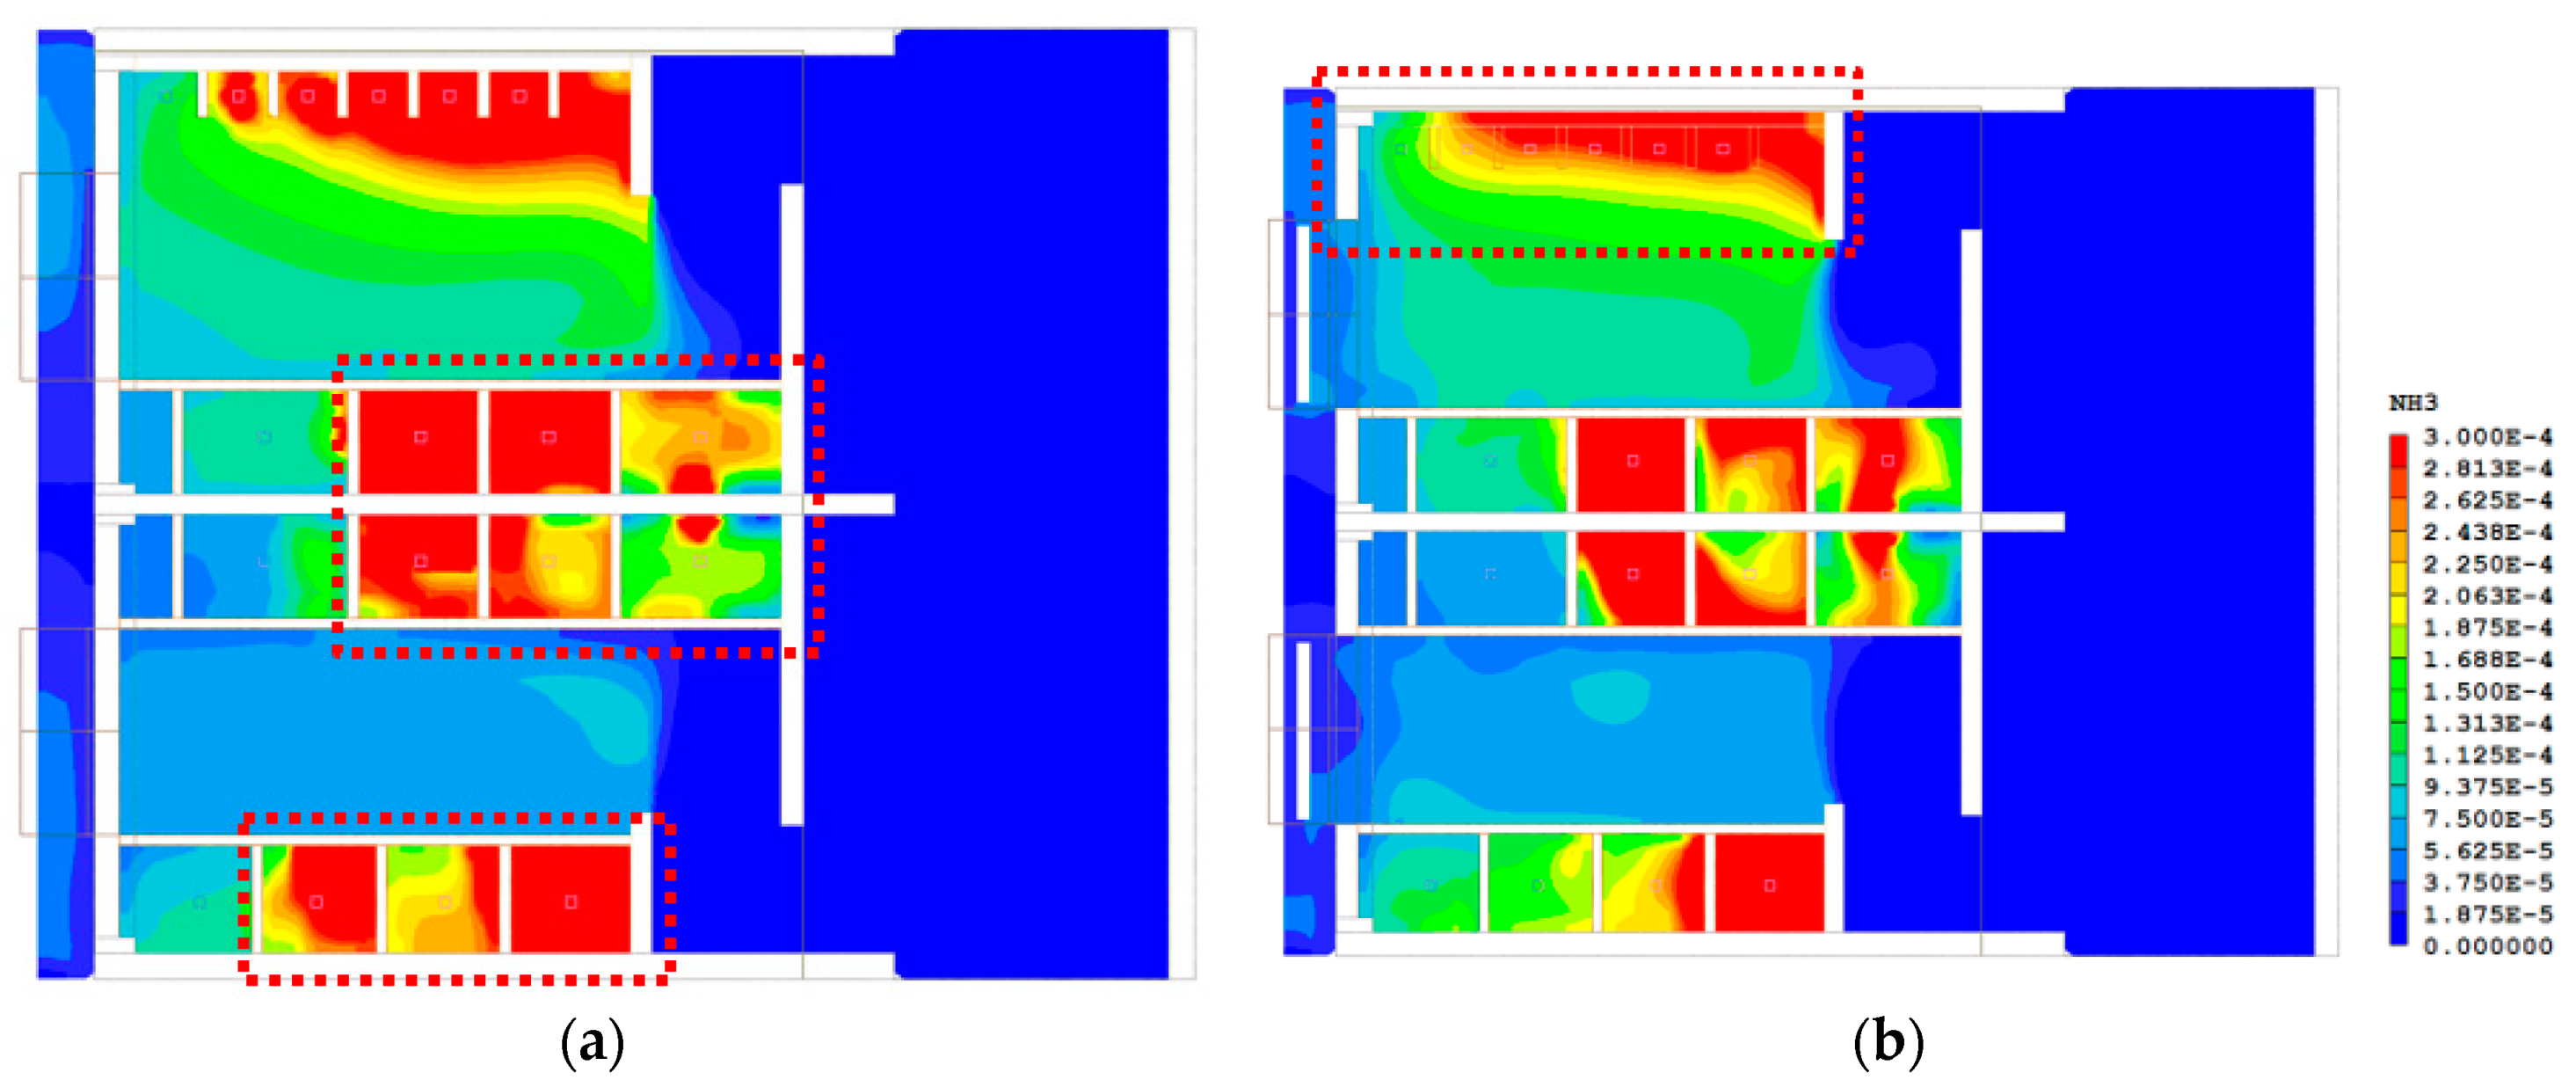
The preceding analysis and Figure 8 show that as a result of the flow structure, the toilet areas and urinal area near the indoor partition wall have inferior ventilation. Figure 8a shows that when users defecate in a squatting position the NH3 concentration is high at the breathing zone height, in the area marked with a red dotted line (Z = 0.6 m). When men urinate in a standing position, the NH3 concentration is high at the breathing zone height, in the area marked with a red dotted line (Z = 1.5 m) (Figure 8b). A possible solution is to add a vertical guiding board to the ceiling in the area with inferior ventilation (red blocks in Figure 6 and Figure 8). In this manner, part of the main stream flow is guided into an area with poor ventilation, and the NH3 is carried away. Although this issue is not the focus of this study, it warrants for future investigation.
3.2. Findings and Design Recommendation
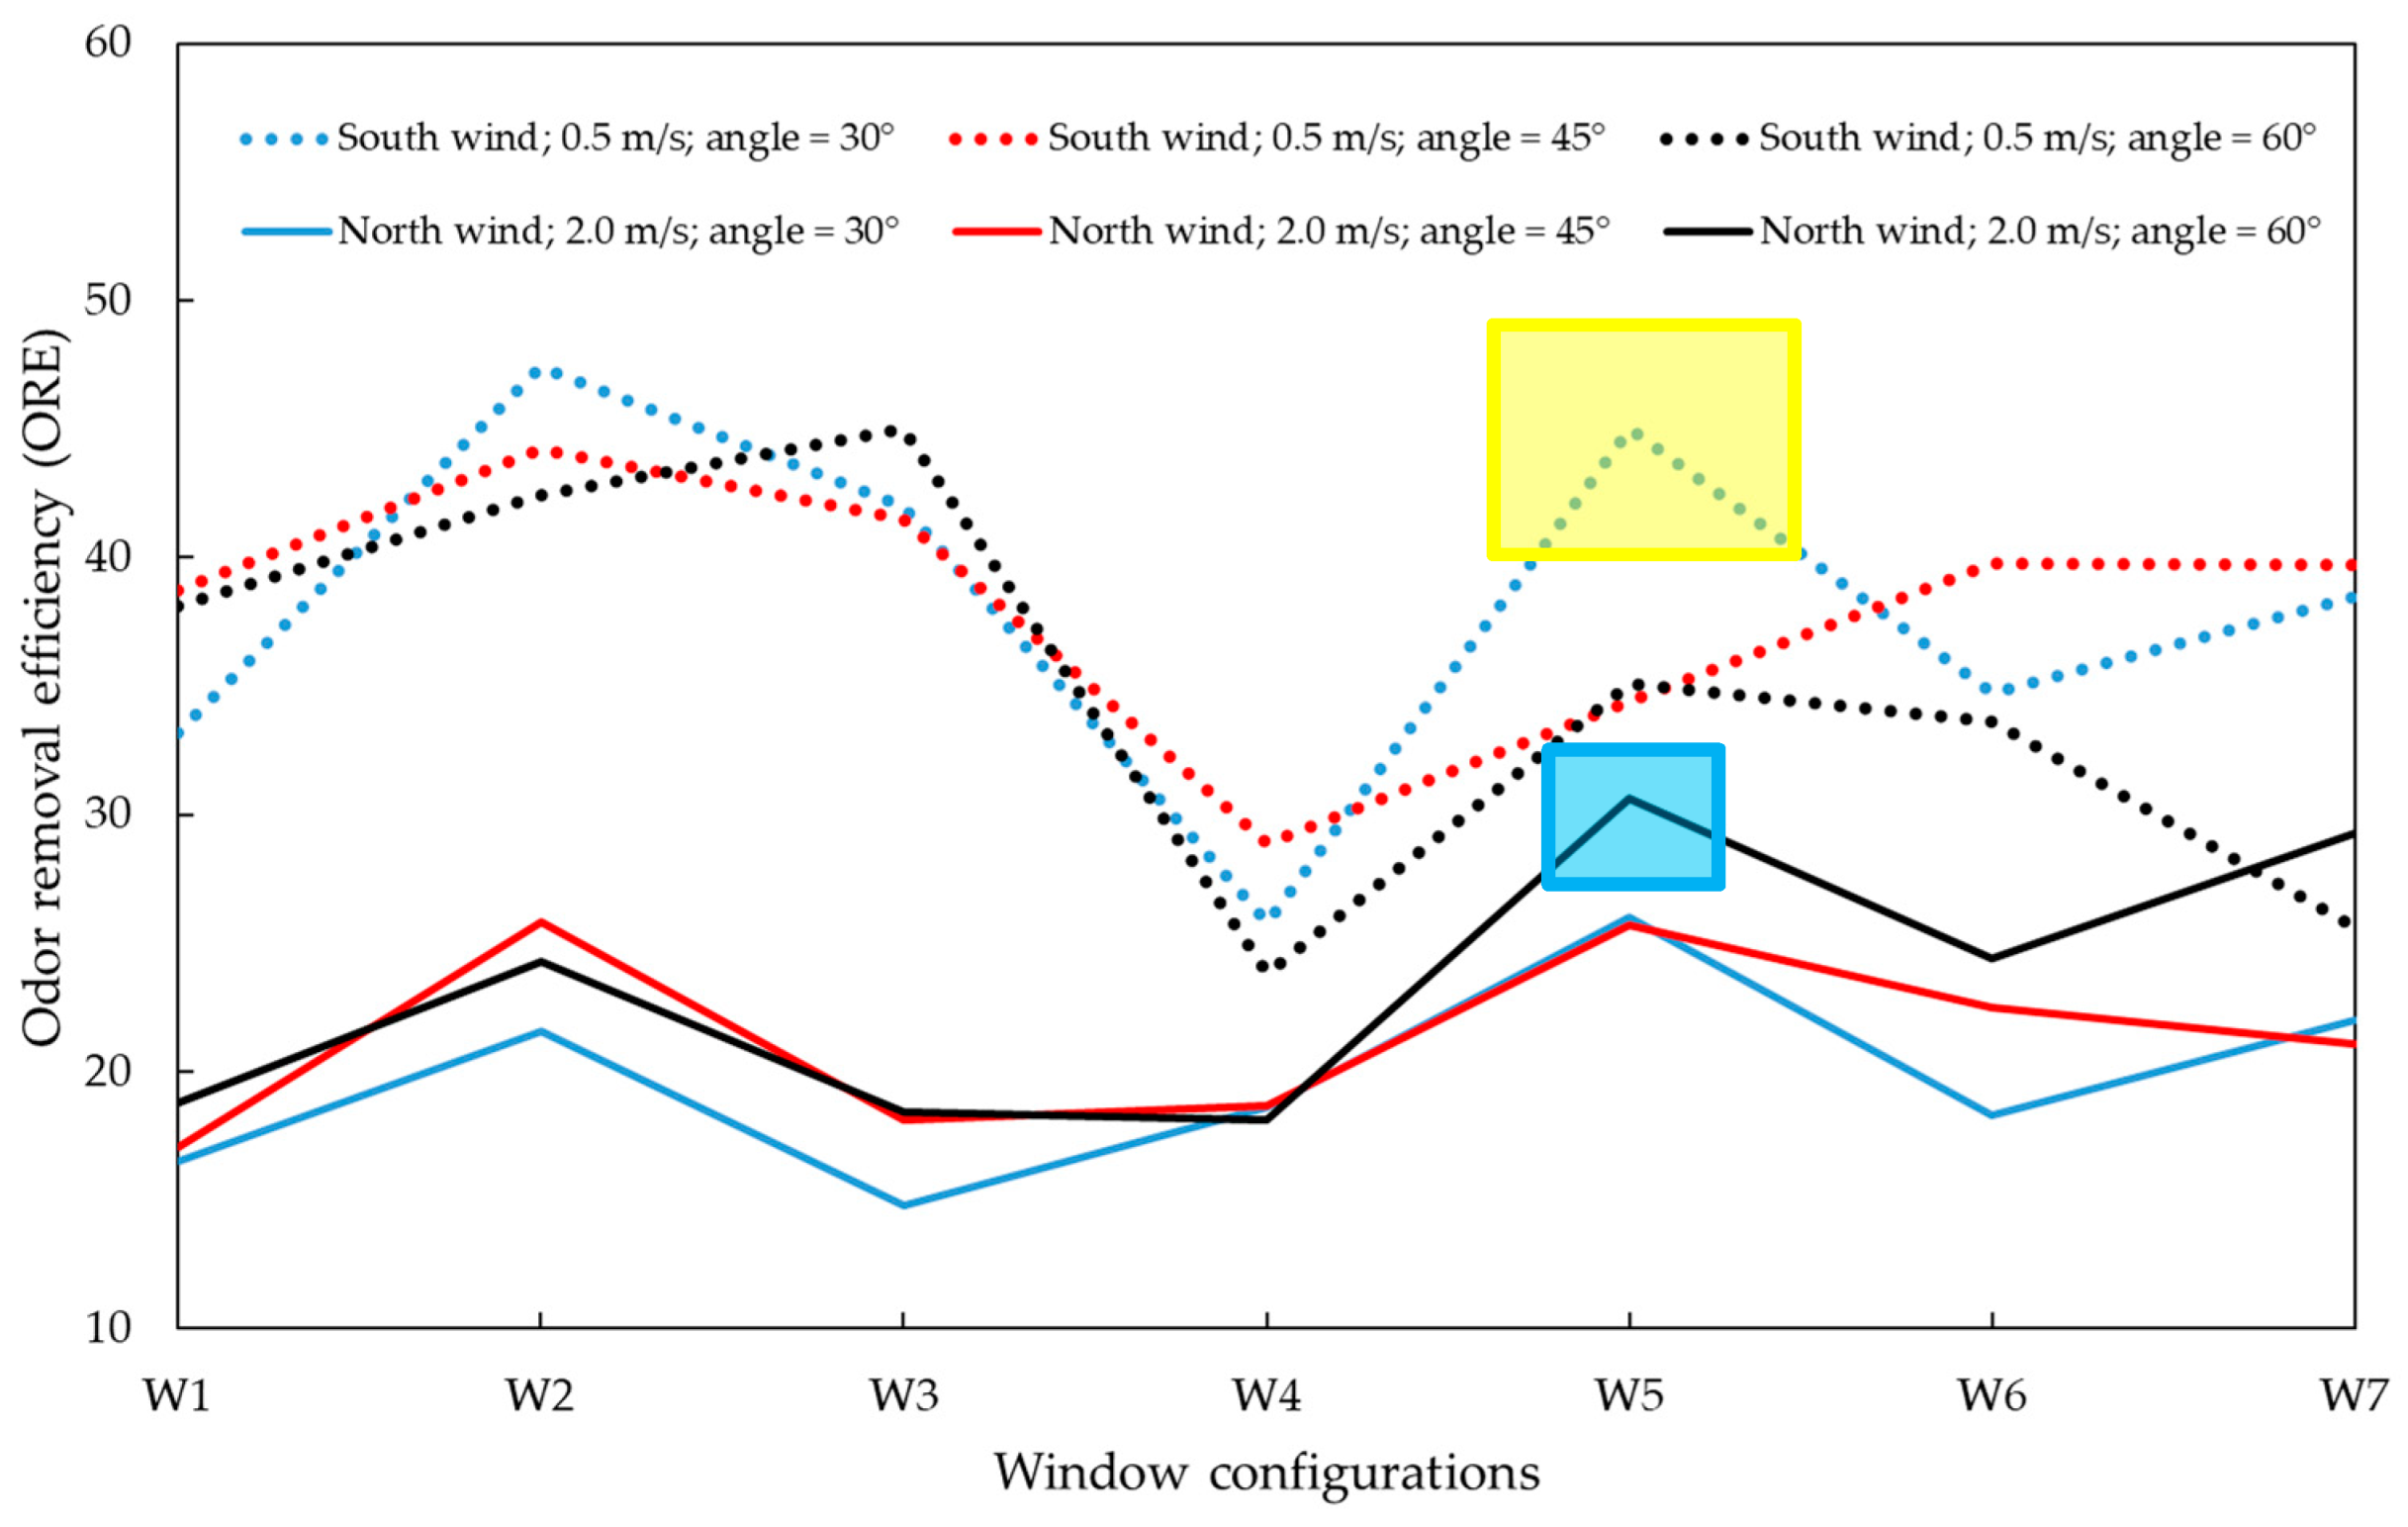
The previous section explains how the ventilation performance of each restroom is analyzed via flow pattern observation and the NH3 concentration distribution. Due to page length limitations, this paper cannot elaborate the restroom ventilation effectiveness of each window configuration. Instead, the modified odor removal efficiency (ORE) was used to investigate the ventilation effectiveness in each case. Figure 9 shows the ORE for the cases with 0.5 m/s south wind (commonly seen in spring/summer) and 2.0 m/s north wind (autumn/winter). This figure reveals that the window configuration (W1–W7) has a major impact on the ventilation of the restrooms; this impact significantly exceeds the effect of other parameters (wind speed, wind direction and opening angle). When window configuration W2 is employed, an arbitrary opening angle (30°–60°) under the two wind conditions is acceptable; opening angle 45° is proposed. When window configuration W5 is adopted, the 30° and 60° opening angle configurations are recommended for spring/summer and autumn/winter respectively (marked in light yellow and light blue in Figure 9).
Design recommendations for the installation quantity and position of awning windows are listed in Table 4. K-12 school restrooms could adopt window configuration W2 for the north walls with an opening angle of 45° for all seasons. Window configuration W5 is also recommended. However, here, different seasons require different opening angles. In spring and summer with low-speed wind, the window should be opened 30°. Such a configuration could also prevent rain from entering the room during the rainy season in summer. In autumn and winter with stronger wind, the window should be opened 60°. However, the cost of the W5 window configuration is high. In addition, some of the windows are located in high positions and are thus difficult to open. Therefore, window configuration W5 is not our first recommendation.
4. Conclusions
In this study, the restrooms in K-12 public schools in Taiwan are selected as the study subjects. The effect of awning window quantity and installation position on airflow pattern and air contaminant (NH3) distribution in the representative restroom is analyzed using CFD. The research findings are summarized as follows.
- In autumn and winter, the north monsoon wind flows into the awning window from the north. Guided by the inclined window surface, it flows toward the indoor ceiling at an angle that is oriented upwards. It then flows to the south exterior door along the ceiling. In spring and summer, a south monsoon occurs, and a reverse indoor flow pattern is observed. This north-south flow becomes the main stream that drives restroom indoor circulation at the bottom (and along both sides).
- In the toilet areas in the men’s and women’s restrooms and the urinal area in the men’s restroom, if the air flow into these areas forms a circulation pattern in the main stream and the flow speed is sufficiently high, the air circulation will carry air pollutants from the areas to the top of the space, where they flow out of the restroom after merging with the main stream. If these conditions are not satisfied, the air in the areas will stagnate, and the air pollutant concentration will be high. Under a south wind in summer, the flow at the bottom of the main stream is affected by the urinal partition board and partition wall and forms a large circulation surrounding the urinal area. This circulation causes poor ventilation in this area.
- Based on the ventilation performance analysis using the modified odor removal efficiency (ORE), we suggest that K-12 school restrooms use window configuration W2 in their north walls (as shown in Table 4). The opening angle should be set to 45° for all seasons.
The modeling and simulation results are limited to the urban and building morphologies chosen with the specific wind environments. At other conditions, recommendations given in the paper may not be applicable. The surroundings would greatly affect the magnitude and direction of the approaching wind. The interior partition design and layout would also affect the ventilation performance. Although investigation on other themes (surroundings, outside environments, interior partitioning, buoyancy effect, link to IAQ studies, etc.) are not what we are exploring in this study but is worthy of further consideration.
Author Contributions
Conceptualization, S.-C.C. and C.-M.L.; methodology, C.-M.L.; software, Y.-P.L. and C.Y.; validation, Y.-P.L. and C.Y.; formal analysis, S.-C.C., C.Y., and Y.-P.L.; investigation, S.-C.C. and C.-M.L.; resources, S.-C.C.; data curation, S.-C.C. and C.-M.L.; writing-original draft preparation, C.-M.L.; writing-review and editing, S.-C.C., Y.-P.L. and C.-M.L.; visualization, C.Y.; supervision, S.-C.C. and C.-M.L.; project administration, S.-C.C.; funding acquisition, S.-C.C.
Conflicts of Interest
The authors declare that there is no conflict of interest.
References
- Tung, Y.-C.; Hu, S.-C.; Tsai, T.-Y. Influence of bathroom ventilation rates and toilet location on odor removal. Build. Environ. 2009, 44, 1810–1817. [Google Scholar] [CrossRef]
- Tung, Y.-C.; Shih, Y.-C.; Hu, S.-C.; Chang, Y.-L. Experimental performance investigation of ventilation schemes in a private bathroom. Build. Environ. 2010, 45, 243–251. [Google Scholar] [CrossRef]
- Yang, J.-H.; Kim, O. Improvement of ventilation efficiency by changing the shape of glass partition in bathroom of apartment house. Indoor Built. Environ. 2017, 26, 1274–1291. [Google Scholar] [CrossRef]
- Seo, Y.; Park, I.S. Study for flow and mass transfer in toilet bowl by using toilet seat adopting odor/bacteria suction feature. Build. Environ. 2013, 67, 46–55. [Google Scholar] [CrossRef]
- Sato, H.; Hirose, T.; Kimura, T.; Moriyama, Y.; Nakashima, Y. Analysis of malodorous volatile substances of human waste: Feces and urine. J. Health Sci. 2001, 47, 483–490. [Google Scholar] [CrossRef]
- Kim, O.; Yang, J.-H. On the design to improve the bathroom exhaust performance in multi-unit residential buildings. J. Asian Arch. Build. Eng. 2016, 15, 349–356. [Google Scholar] [CrossRef]
- Yin, P.; Pate, M.B.; Sweeney, J.F. The impact of operating pressure on residential bathroom exhaust fan performance. J. Build. Eng. 2016, 6, 163–172. [Google Scholar] [CrossRef]
- Choi, W.; Pate, M.B.; Sweeney, J.F. Study of bathroom ventilation fan performance trends for years 2005 to 2013—Data analysis of loudness and efficacy. Energy Build. 2016, 116, 468–477. [Google Scholar] [CrossRef]
- Aflaki, A.; Mahyuddin, N.; Mahmoud, Z.A.; Baharum, M.R. A review on natural ventilation applications through building façade components and ventilation openings in tropical climates. Energy Build. 2015, 101, 153–162. [Google Scholar] [CrossRef]
- Zhai, Z.; Mankibi, M.E.; Zoubir, A. Review of natural ventilation models. Energy Procedia 2015, 78, 2700–2705. [Google Scholar] [CrossRef]
- Jomehzadeh, F.; Nejat, P.; Calautit, J.K.; Yusof, M.B.M.; Zaki, S.A.; Hughes, B.R.; Yazid, M.N.A.W.M. A review on wind catcher for passive cooling and natural ventilation in buildings, Part 1: Indoor air quality and thermal comfort assessment. Renew. Sustain. Energy Rev. 2017, 70, 736–756. [Google Scholar] [CrossRef]
- Nomura, M.; Hiyama, K. A review: Natural ventilation performance of office buildings in Japan. Renew. Sustain. Energy Rev. 2017, 74, 746–754. [Google Scholar] [CrossRef]
- Omrani, S.; Garcia-Hansen, V.; Capra, B.; Drogemuller, R. Natural ventilation in multi-storey buildings: Design process and review of evaluation tools. Build. Environ. 2017, 116, 182–194. [Google Scholar] [CrossRef] [Green Version]
- Oropeza-Perez, I.; Østergaard, P.A. Active and passive cooling methods for dwellings: A review. Renew. Sustain. Energy Rev. 2018, 82, 531–544. [Google Scholar] [CrossRef]
- Solgi, E.; Hamedani, Z.; Fernando, R.; Skates, H.; Orji, N.E. A literature review of night ventilation strategies in buildings. Energy Build. 2018, 173, 337–352. [Google Scholar] [CrossRef]
- Brohus, H. Personal exposure to contaminant sources in ventilated rooms. Ph.D. Thesis, Aalborg University, Aalborg, Denmark, 1997. [Google Scholar]
- Qian, H.; Li, Y.; Nielsen, P.V.; Hyldgaard, C.E.; Wong, T.W.; Chwang, A.T. Dispersion of exhaled droplet nuclei in a two-bed hospital ward with three different ventilation systems. Indoor Air 2006, 16, 111–128. [Google Scholar] [CrossRef] [PubMed]
- Spalding, D. The Phoenics Encyclopedia; Cham Ltd.: London, UK, 1994. [Google Scholar]
- European Commission. Information Notices on Occupational Diseases: A Guide to Diagnosis; European Commission: Luxembourg, 2009. [Google Scholar]
Figure 1.
Study subject. (a) The investigated model restroom comes from practical cases (red dotted area) (not to scale). (b) 3D diagram. (c) Plan. (d) Field image.
Figure 1.
Study subject. (a) The investigated model restroom comes from practical cases (red dotted area) (not to scale). (b) 3D diagram. (c) Plan. (d) Field image.
Figure 2.
Awning window examples.

Figure 3.
Calculation domain (a) and grid independence test results (b).

Figure 4.
Comparison between the simulation results and the measurements. (a) Reduced scale model. (b) Predicted values versus simulation results.
Figure 4.
Comparison between the simulation results and the measurements. (a) Reduced scale model. (b) Predicted values versus simulation results.
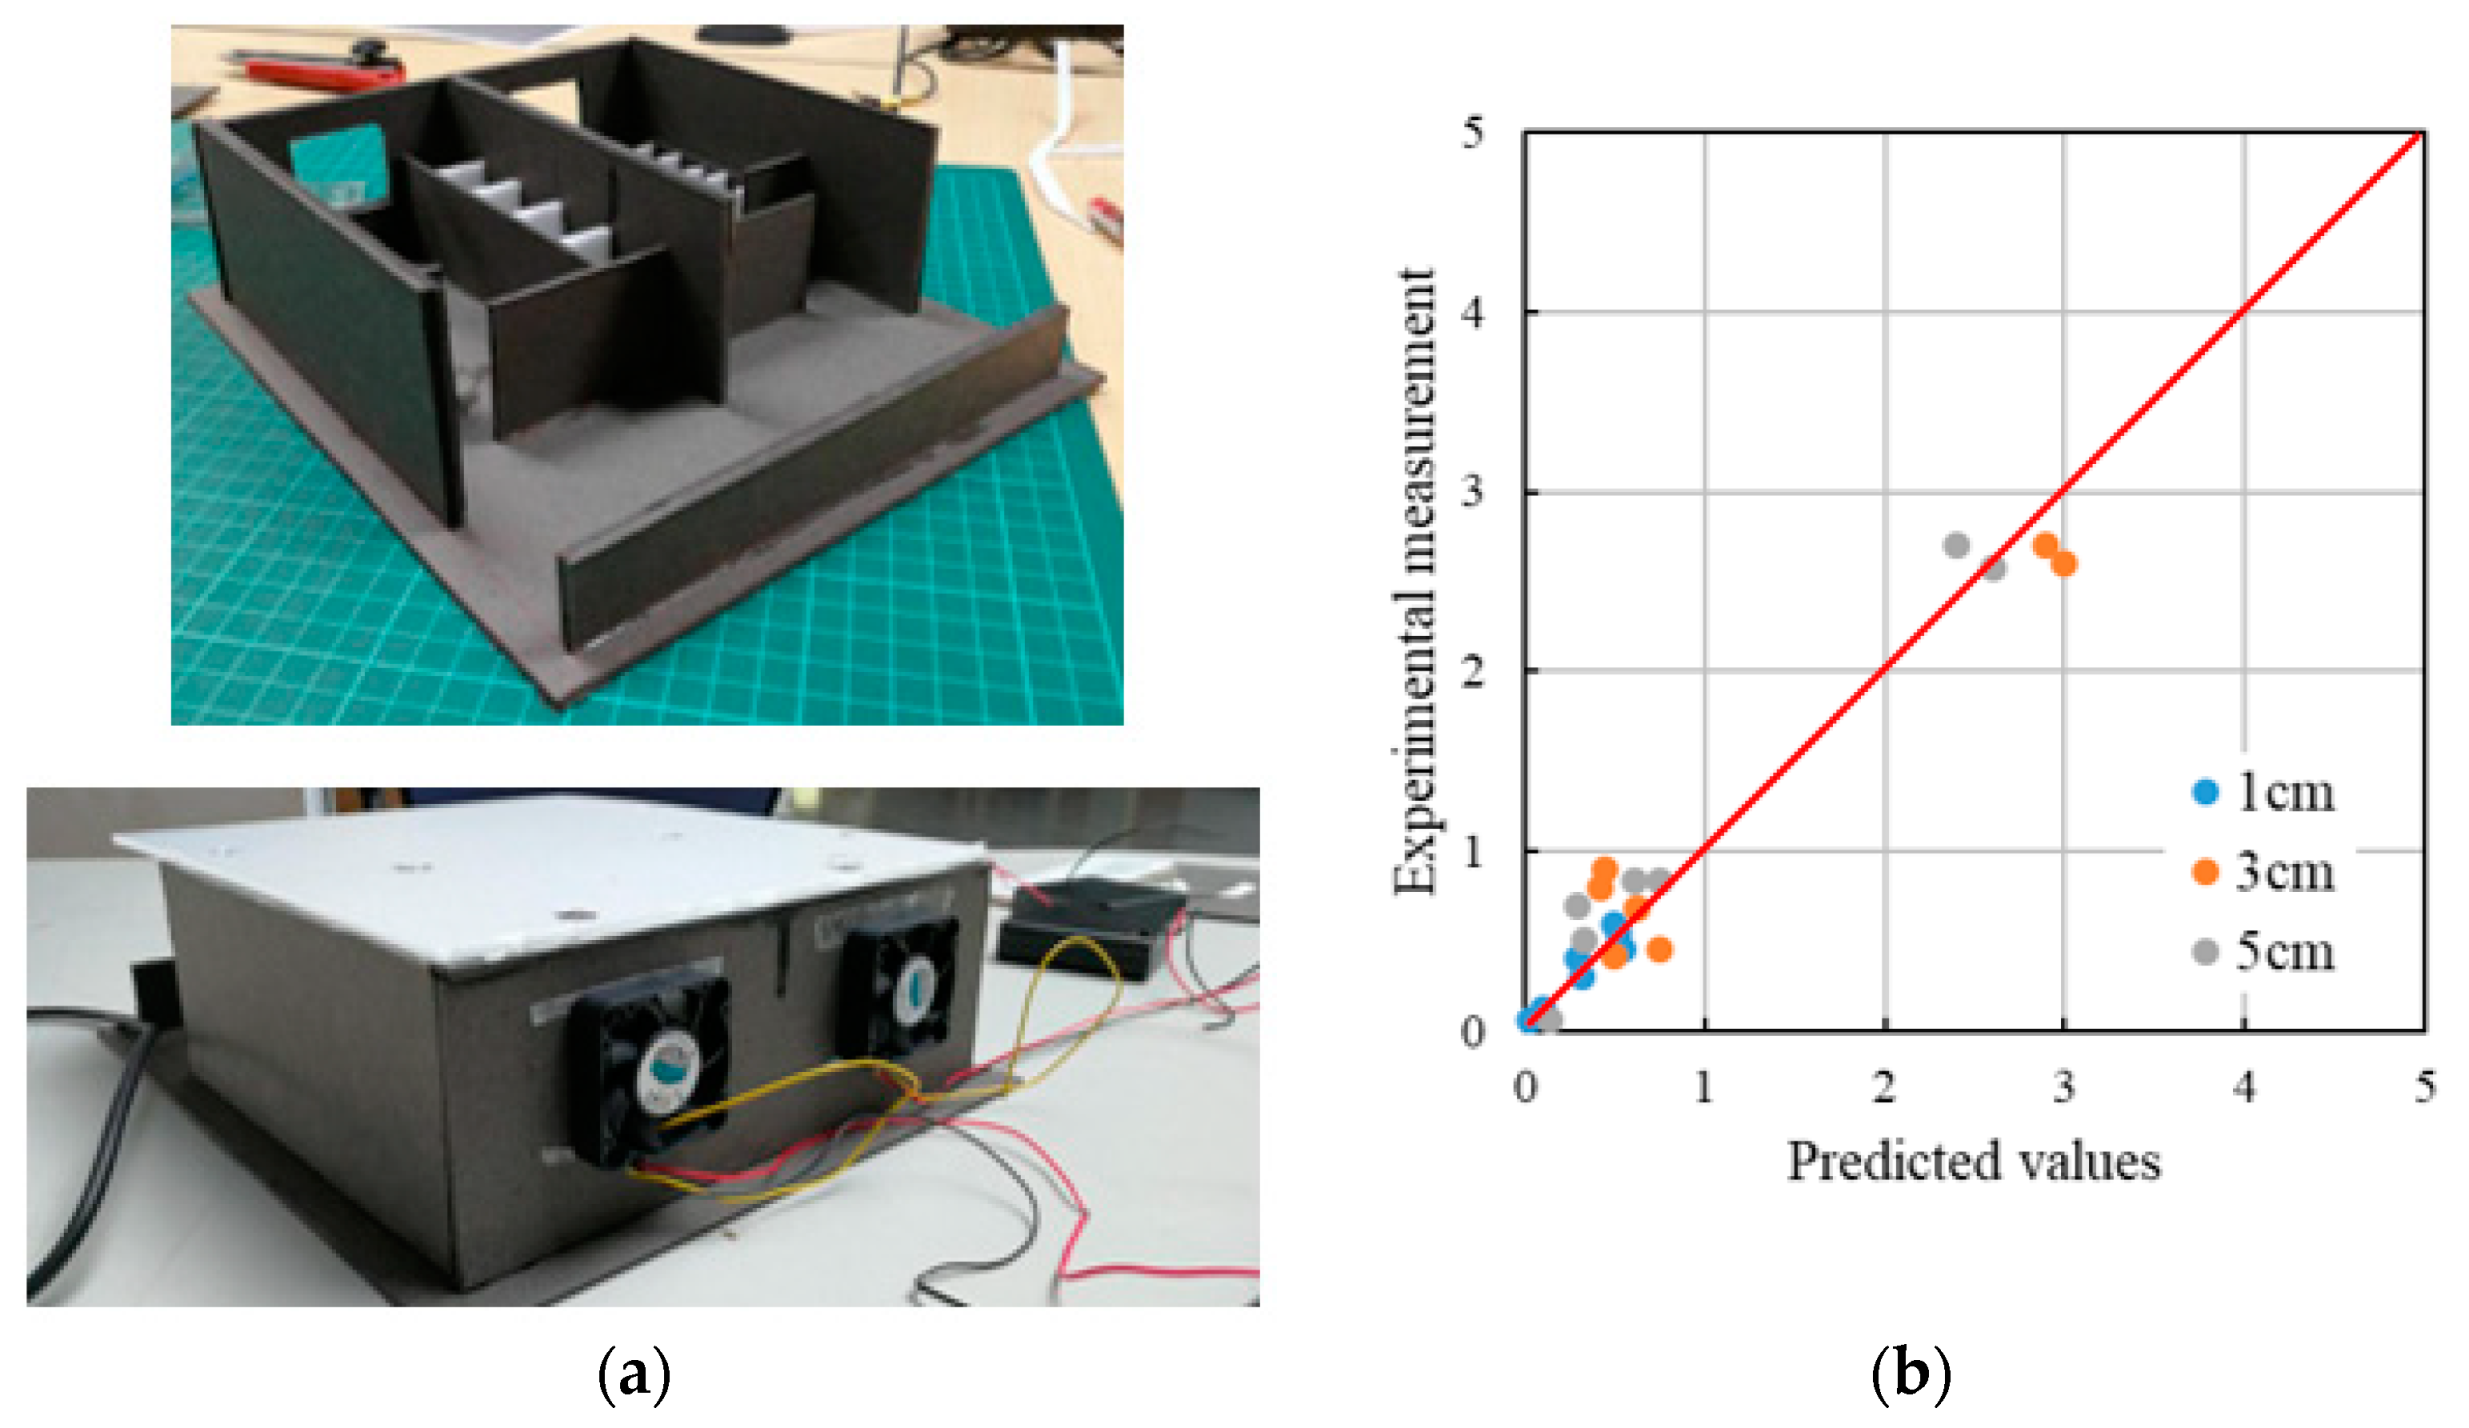
Figure 5.
Indoor flow fields and NH3 concentration (PPMV) distributions for north wind (window configuration: W2 (Table 1c); the opening angle θ is 45°; the outdoor wind speed is 1 m/s). (a) Flow field in aisle in the women’s restroom (Figure 1c, section A). (b) Flow field in toilet area in the women’s restroom (Figure 1c, section B). (c) NH3 concentration distribution in toilet area in the women’s restroom (Figure 1c, section B). (d) Flow field in urinal area in the men’s restroom (Figure 1c, section C). (e) NH3 concentration distribution in urinal area in the men’s restroom (Figure 1c, section C).
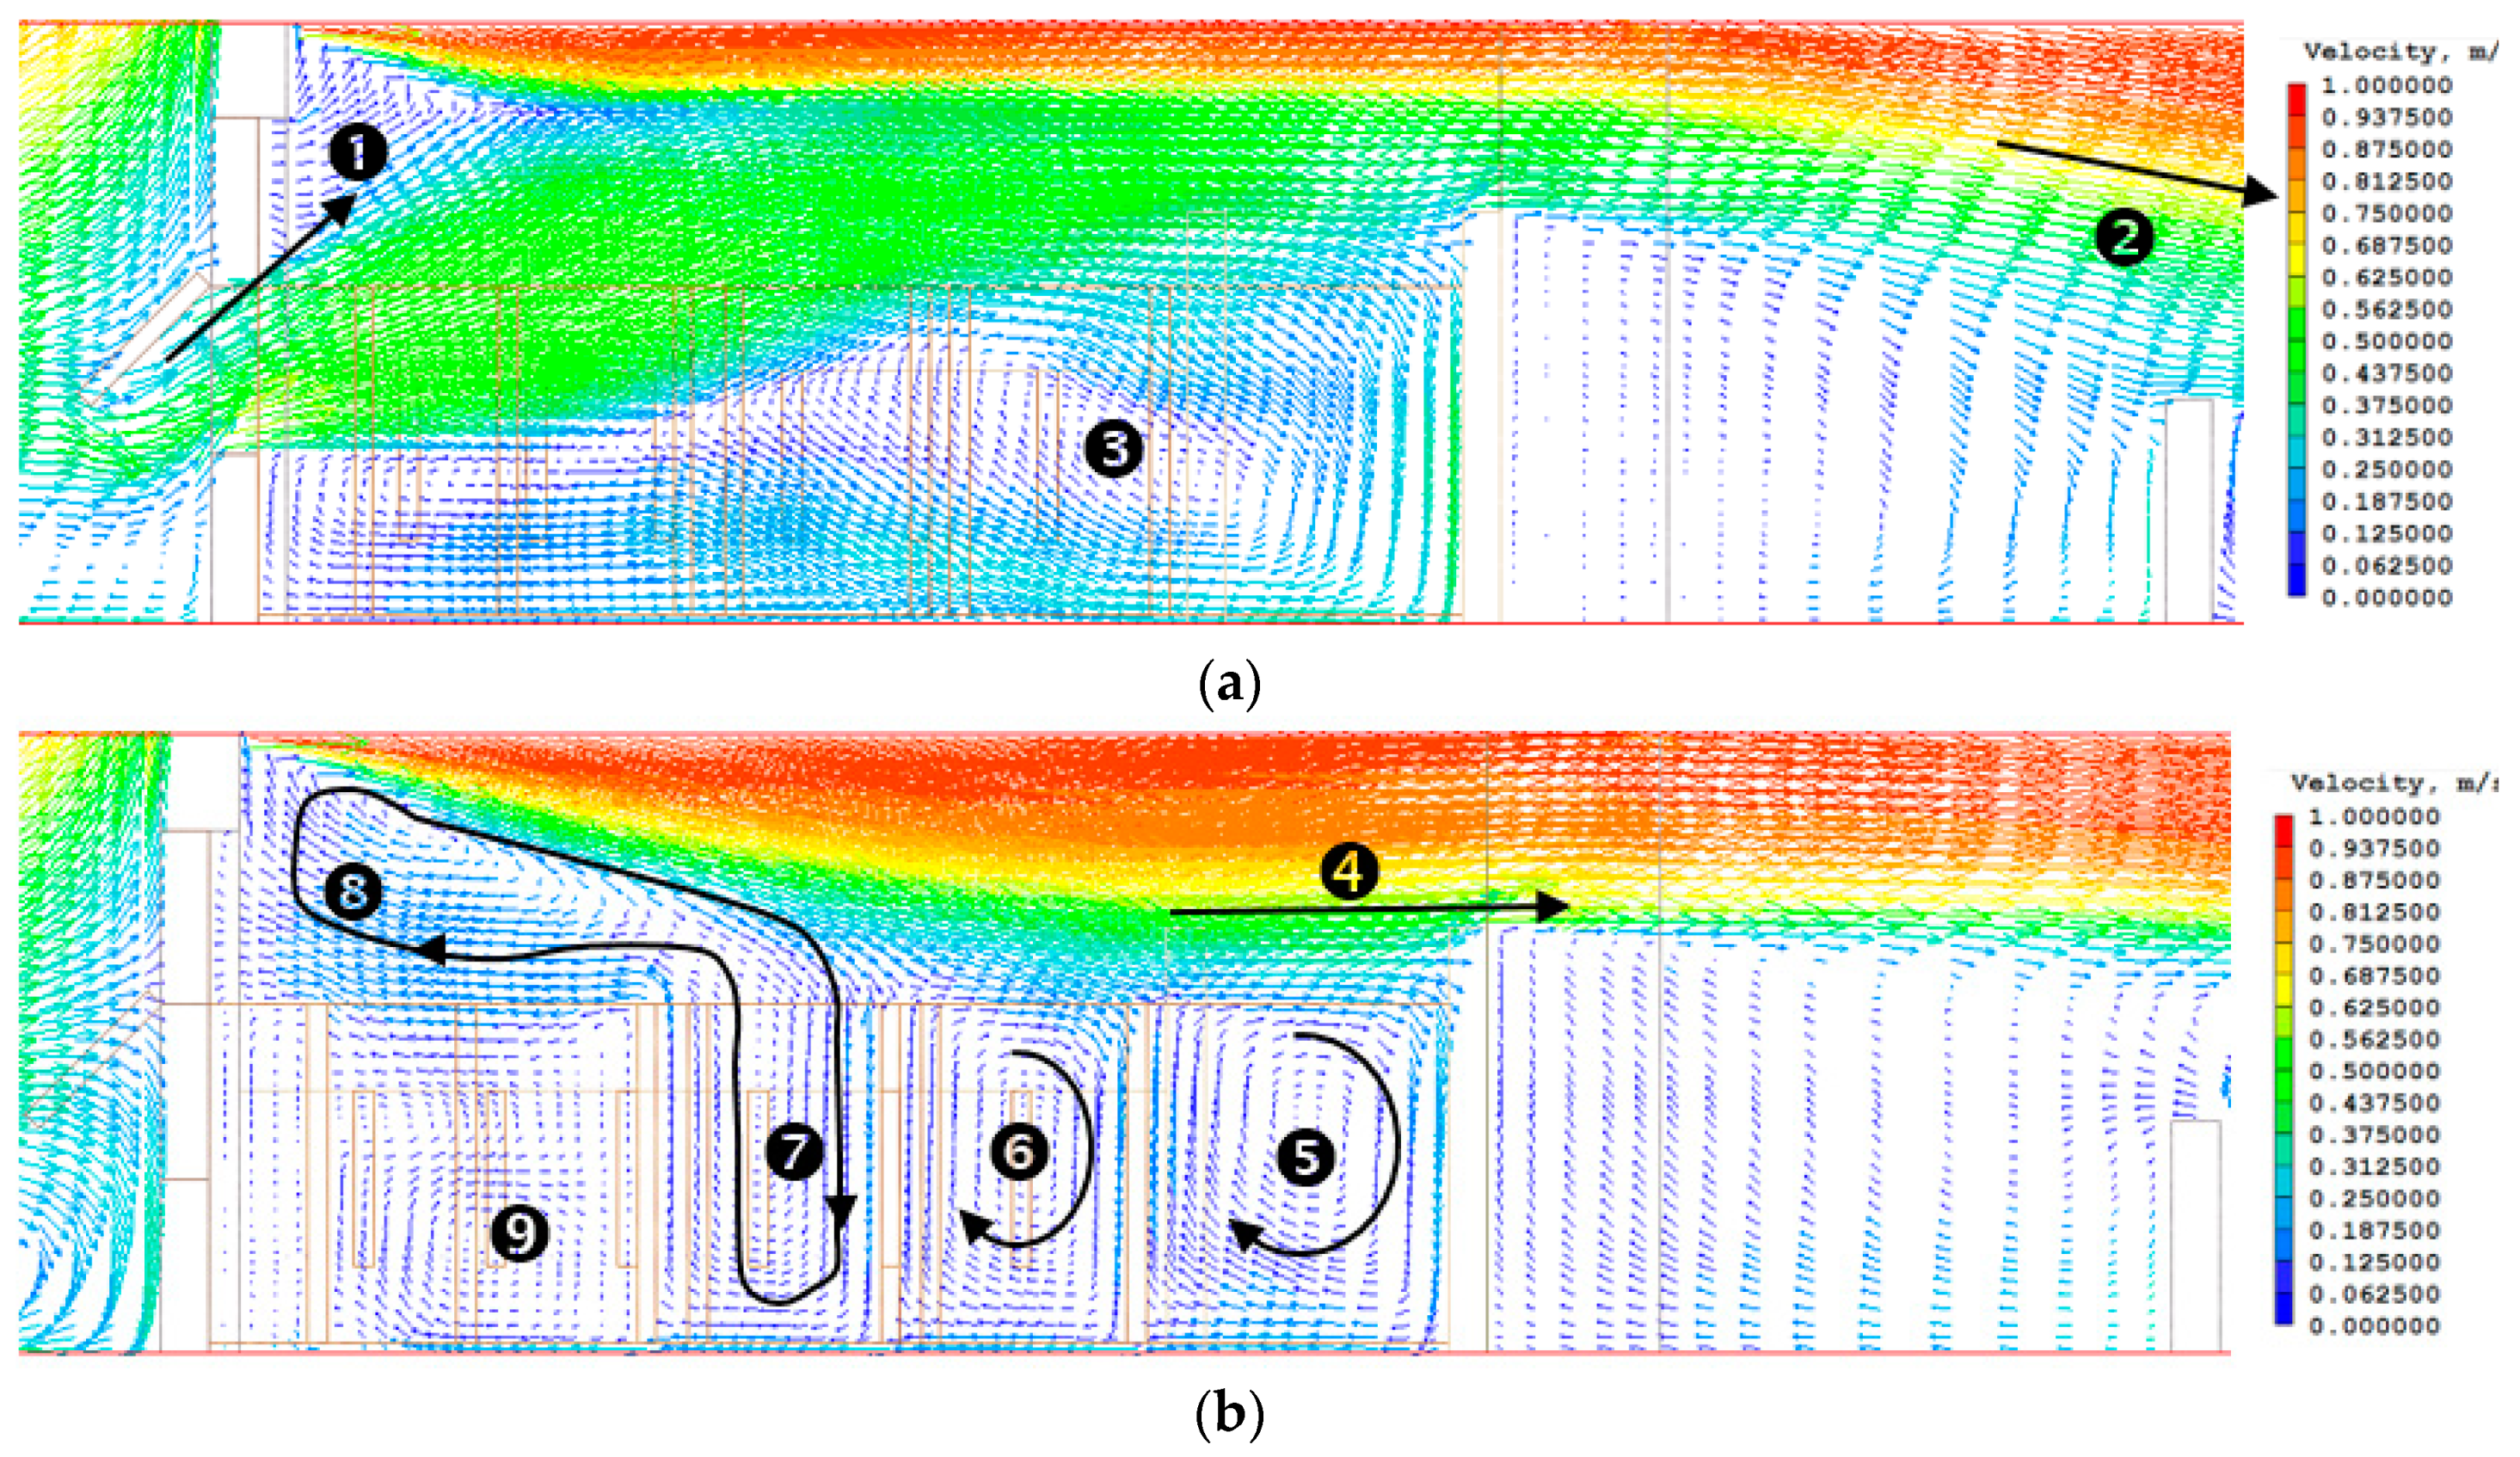

Figure 6.
NH3 concentration (PPMV) distributions at breathing zone heights for (a) squatting position and (b) standing position in north wind (window configuration: W2; the opening angle θ is 45°; the outdoor wind speed is 1 m/s).
Figure 6.
NH3 concentration (PPMV) distributions at breathing zone heights for (a) squatting position and (b) standing position in north wind (window configuration: W2; the opening angle θ is 45°; the outdoor wind speed is 1 m/s).

Figure 7.
Indoor flow field and NH3 concentration (PPMV) distribution for south wind (window configuration: W2; the opening angle θ is 45°; the outdoor wind speed is 1 m/s). (a) Flow field in aisle in the women’s restroom (Figure 1c, section A). (b) Flow field in toilet area in the women’s restroom (Figure 1c, section B). (c) NH3 concentration distribution in toilet area in the women’s restroom (Figure 1c, section B). (d) Flow field in urinal area in the men’s restroom (Figure 1c, section C). (e) NH3 concentration distribution in urinal area in the men’s restroom (Figure 1c, section C).
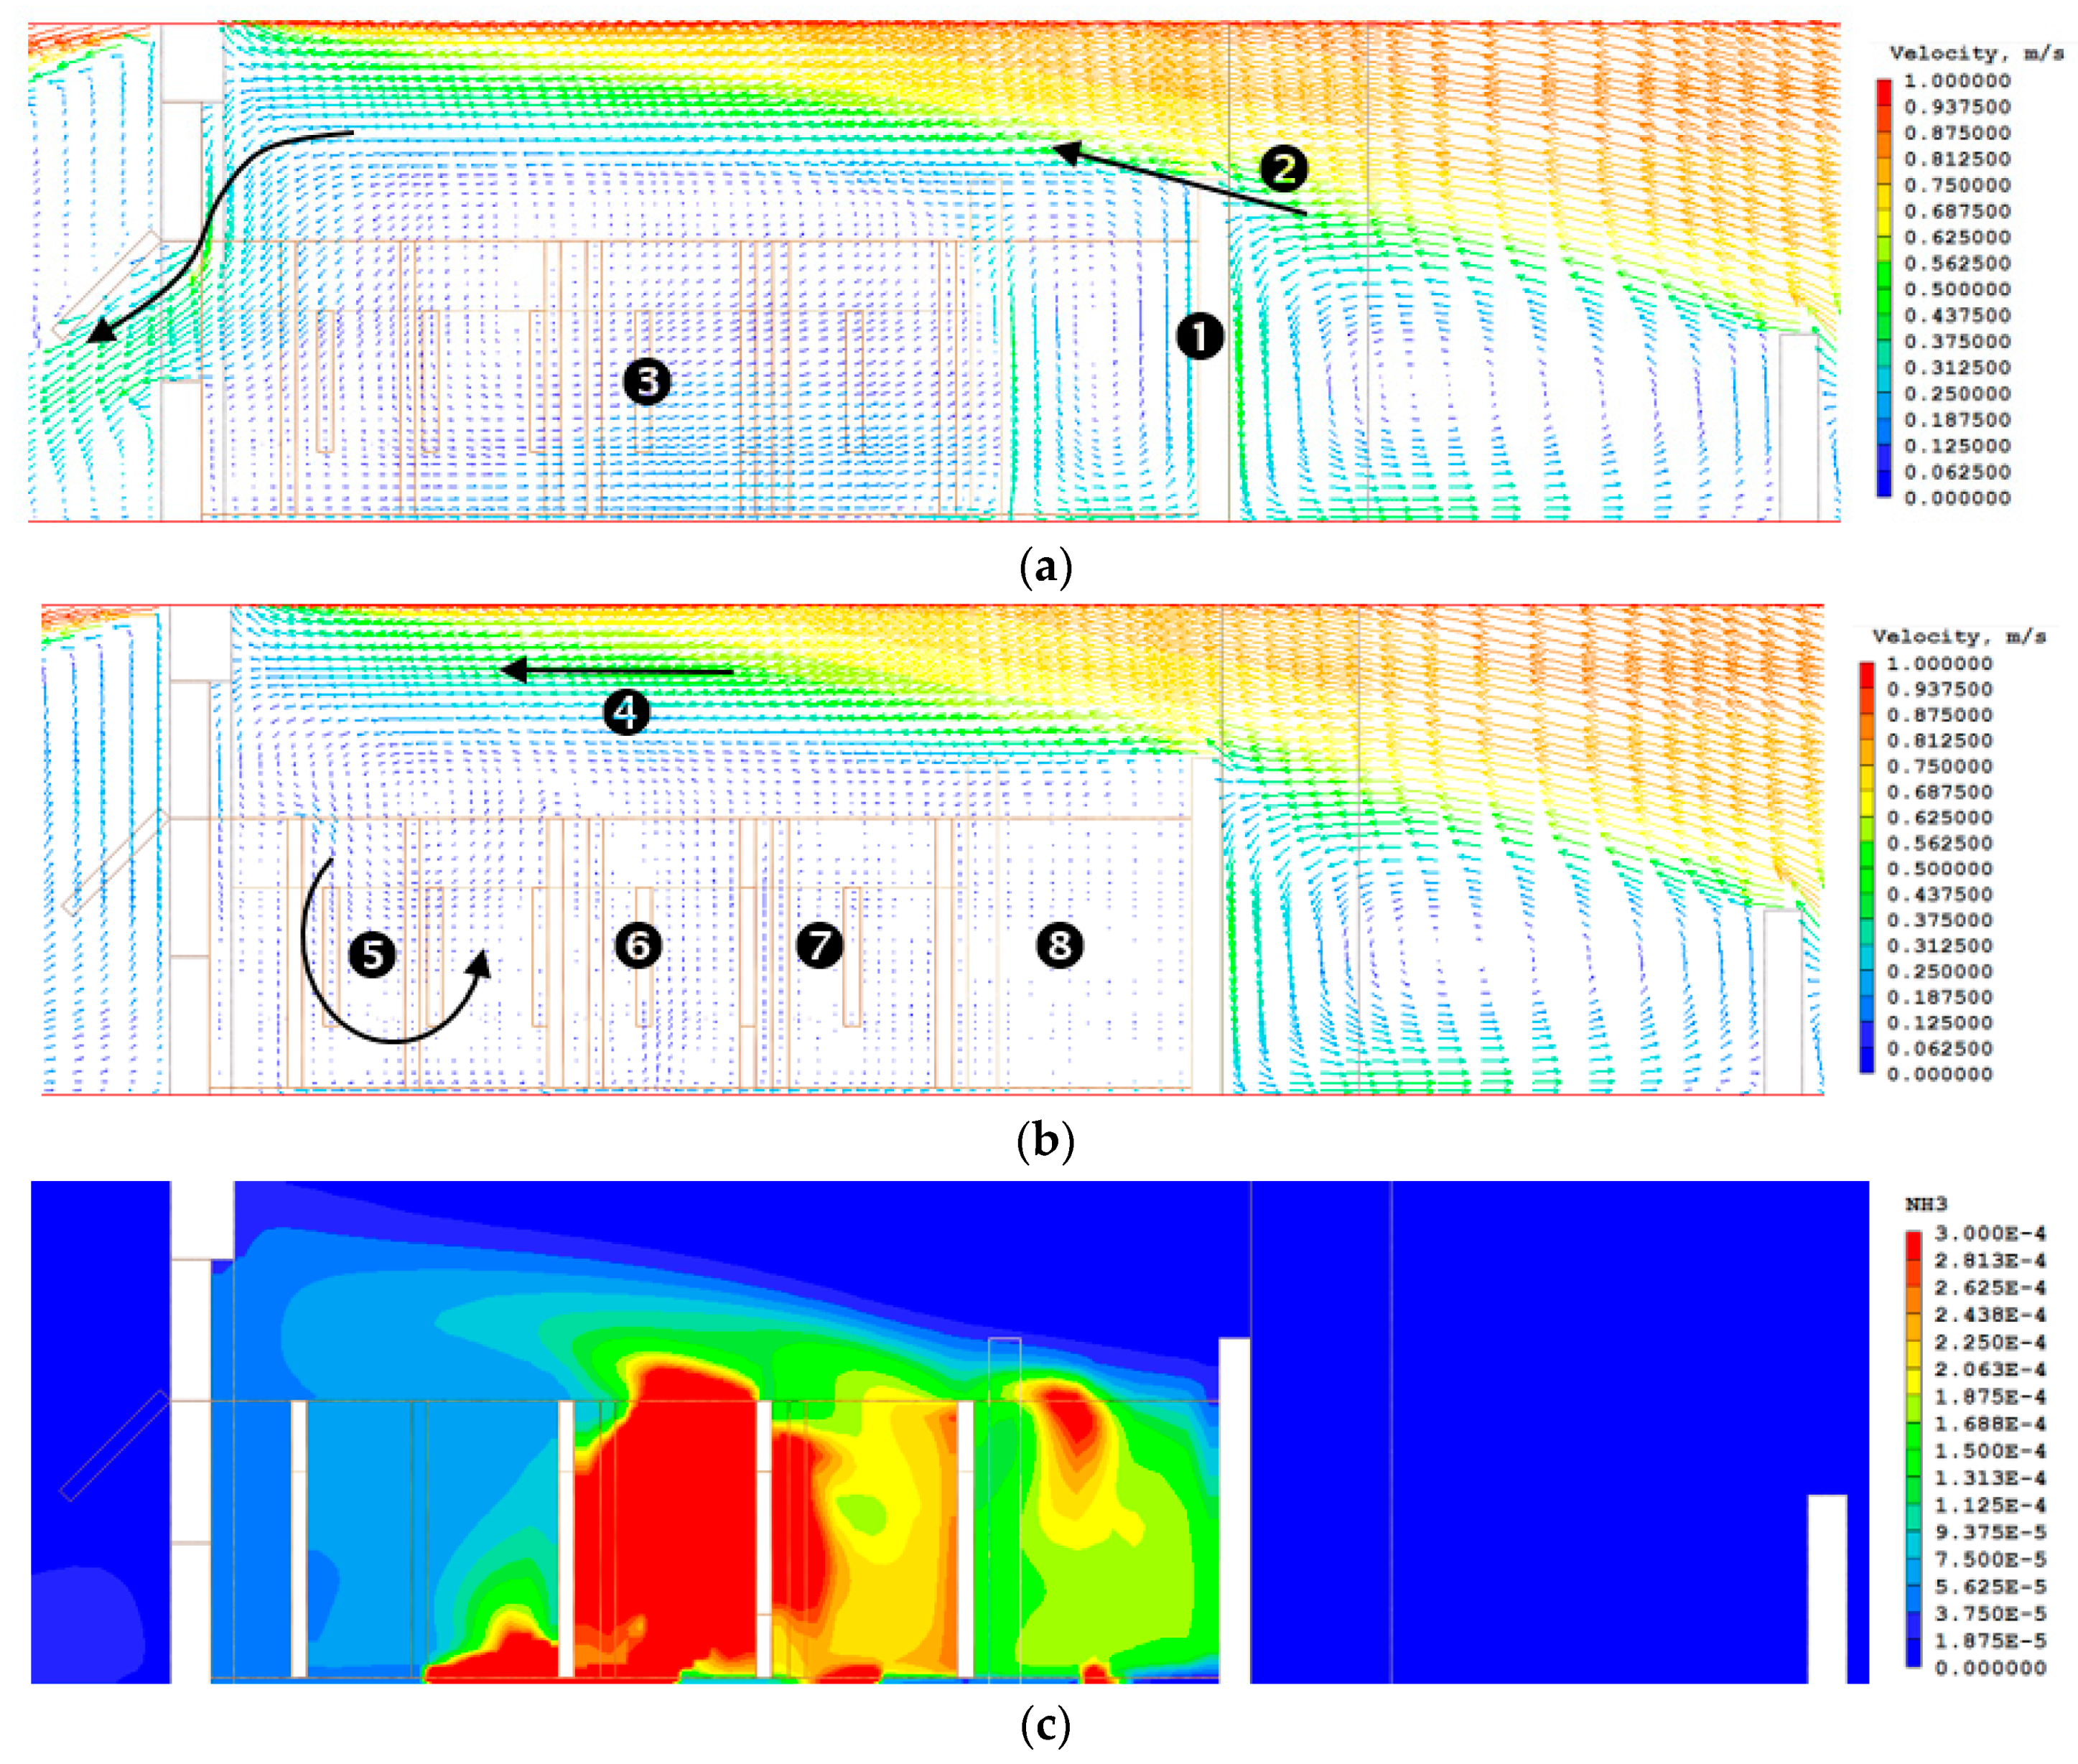
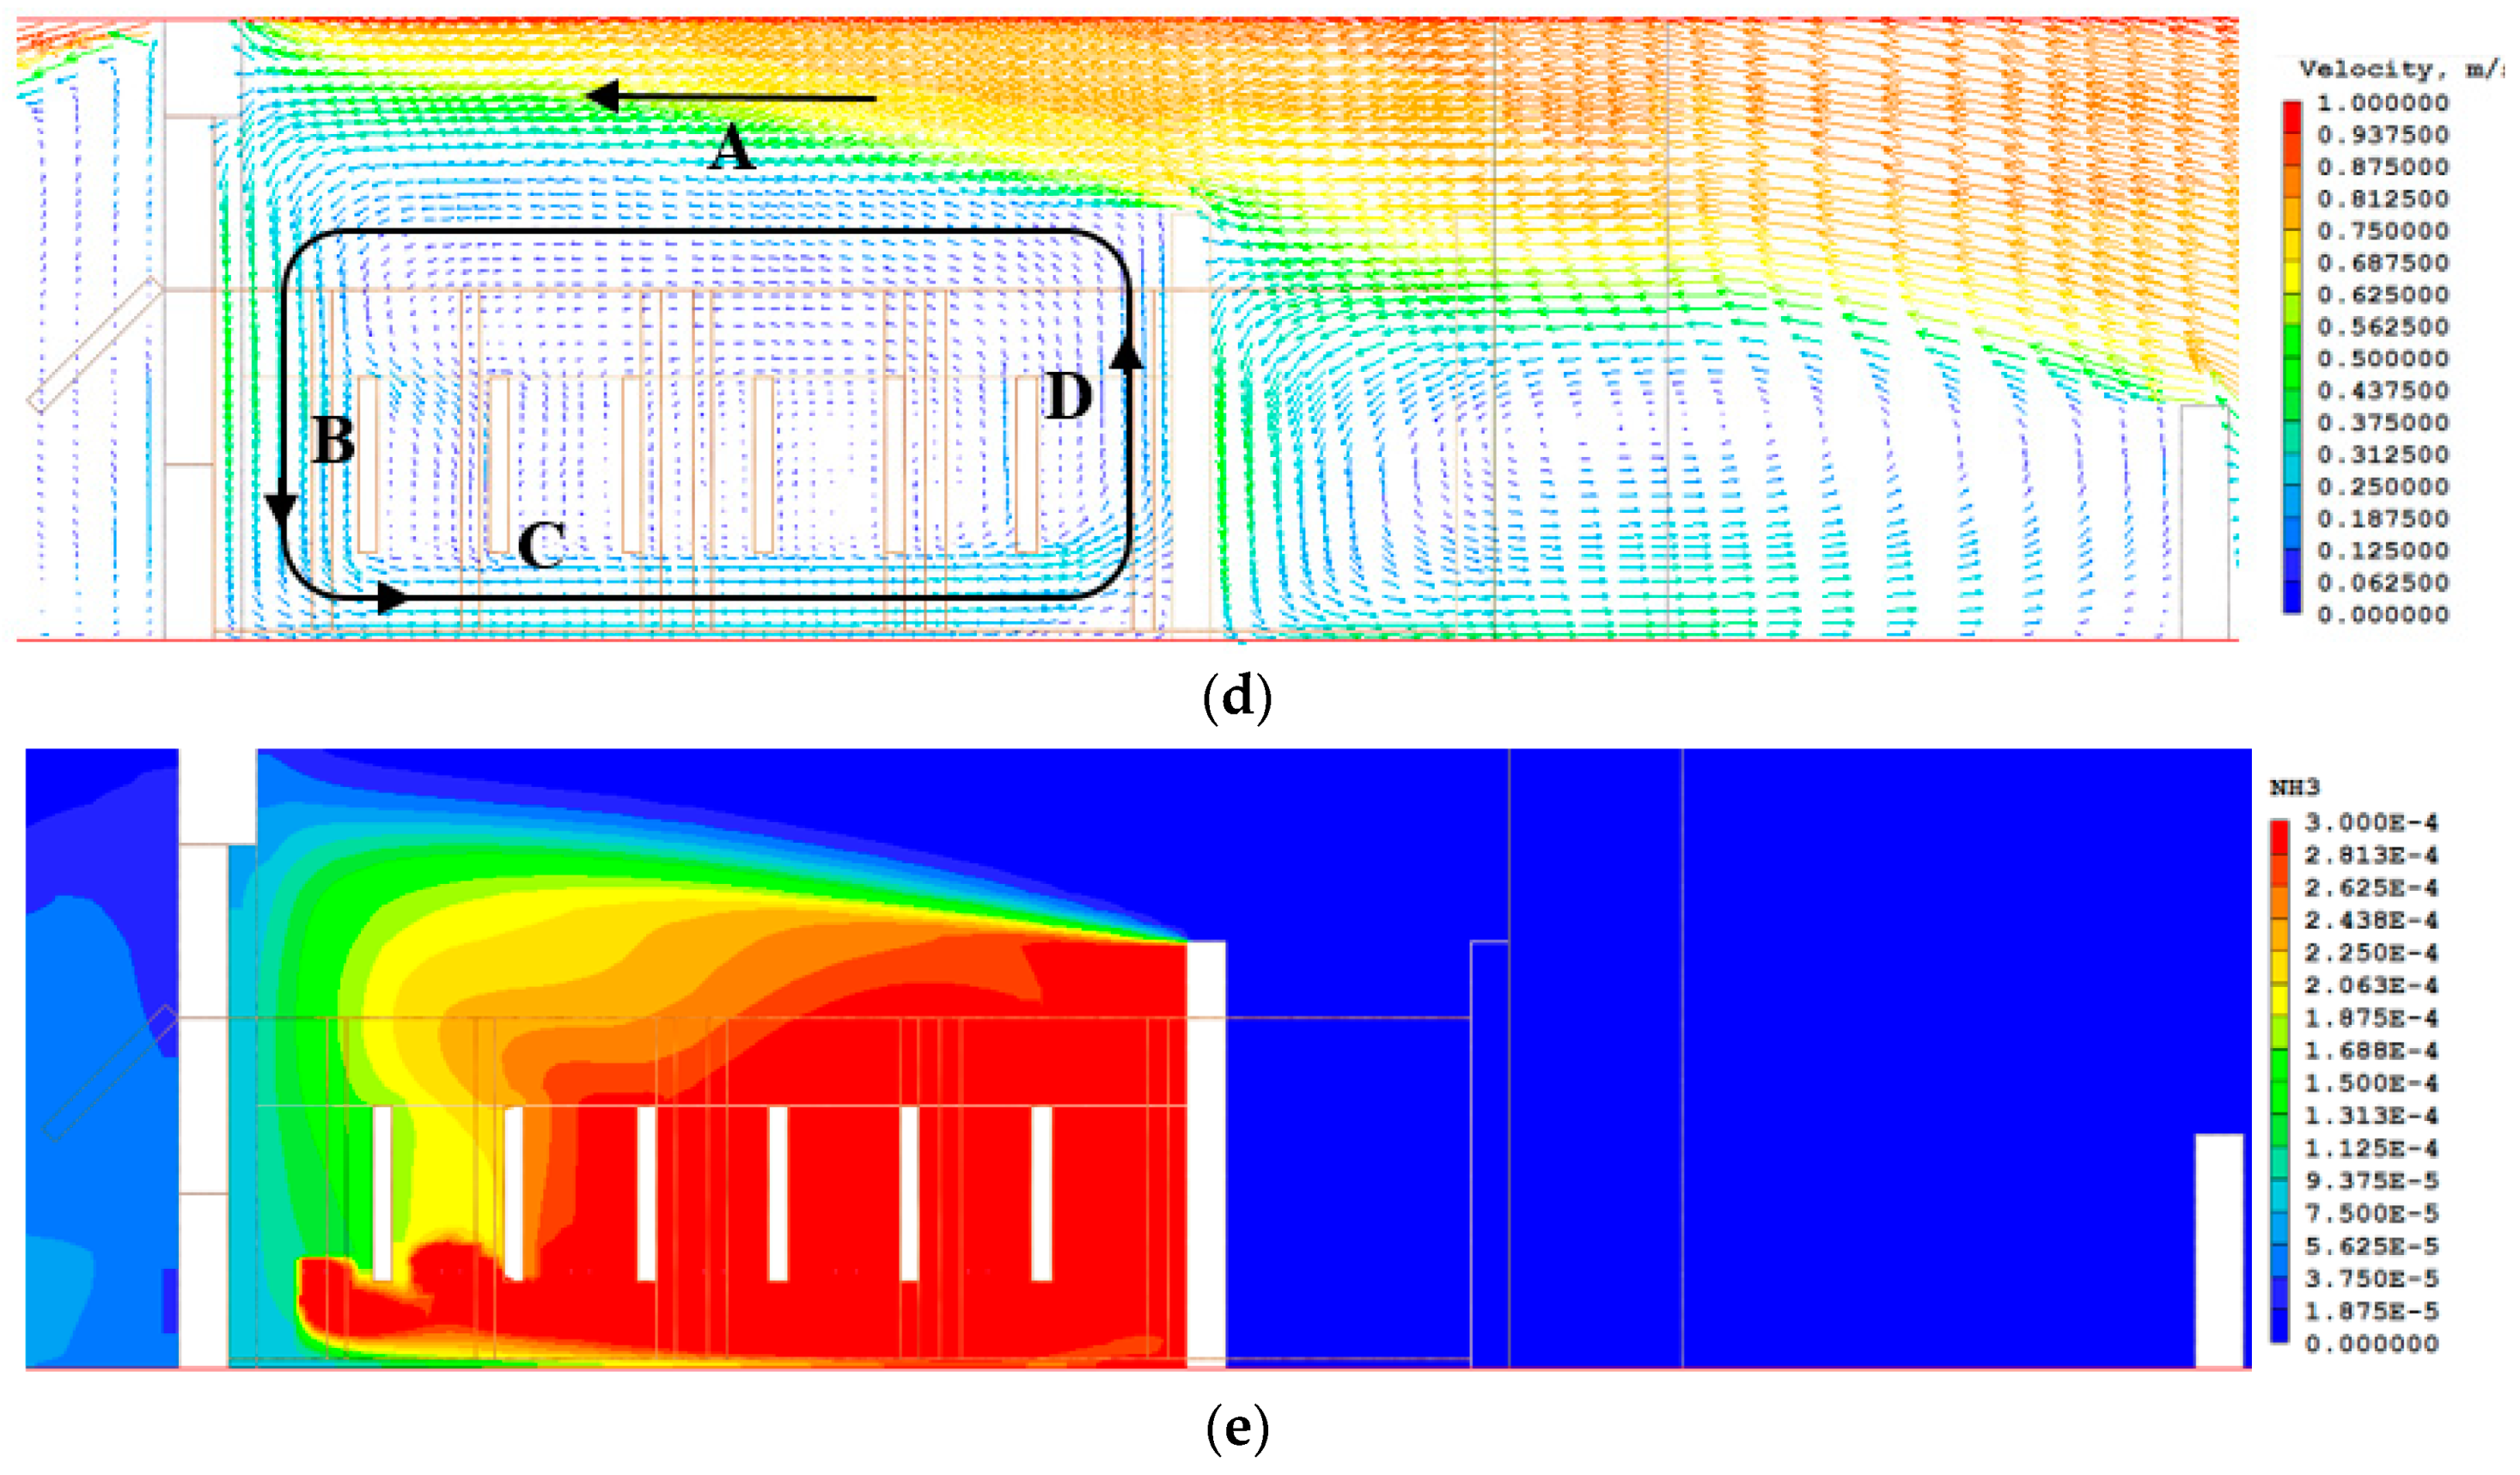
Figure 8.
NH3 concentration (PPMV) distributions at heights of squatter and standee breathing zones for south wind (window configuration: W2; the opening angle θ is 45°; the outdoor wind speed is 1 m/s). (a) Height Z = 0.6 m (height of the squatter’s breathing zone). (b) Height Z = 1.5 m (height of the standee’s breathing zone).

Figure 9.
Odor removal efficiency for the cases with 0.5 m/s south wind and 2.0 m/s north wind.

Table 1.
Quantity and position of installed awning windows (north facade).
| Windows | Configuration Legend | Windows | Configuration Legend |
|---|---|---|---|
 (a) North facade and opening angle. | 8 |  (e) Window configuration W4. | |
| 4 |  (b) Window configuration W1. | 8 |  (f) Window configuration W5. |
| 4 |  (c) Window configuration W2. | 8 | 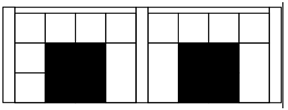 (g) Window configuration W6. |
| 4 |  (d) Window configuration W3. | 12 |  (h) Window configuration W7. |
Table 2.
Geometric data for restroom under investigation.
| Parts of the Model | Geometric Data |
|---|---|
| Investigated restroom | 10.65 m × 9.2 m × 3.2 m (height) |
| Dimensions of the awning window | 1.0 m × 0.9 m (height) |
| Net ceiling height | 3.2 m (Z direction) |
Table 3.
Parameters specified in numerical calculation.
| Walls, Ceilings, Doors, Awning Window Glazing | Adiabatic |
|---|---|
| Outlet planes | Zero static pressure |
| Quantity and position of installed awning windows | Table 1 |
| Opening angles of awning window | 30°, 45°, 60° |
| Wind directions | North wind, south wind |
| Wind speeds (with logarithmic velocity profiles, reference height = 10 m) | 0.5, 1.0, 2.0 m/s |
| Toilet door | Closed |
| Ambient air temperature | 25 °C |
| Pollution source (NH3) | Volumetric flow rate = 5 × 10⁻⁶ m3/s Mass percentage concentration of NH3 = 1 (kg NH3/kg air mixture) Flow area = 0.1 m × 0.1 m |
| Ambient NH3 concentration | 0 PPMV |
Table 4.
Recommended awning window configuration and opening angle.
| Recommendation | Window Configuration | Season | Opening Angle |
|---|---|---|---|
| First recommendation | W2 (Window number: 4) | All |  |
| Second recommendation | W5 (Window number: 8) | Spring and summer |  |
| Autumn and winter |  |
© 2019 by the authors. Licensee MDPI, Basel, Switzerland. This article is an open access article distributed under the terms and conditions of the Creative Commons Attribution (CC BY) license (http://creativecommons.org/licenses/by/4.0/).
Share and Cite
MDPI and ACS Style
Chung, S.-C.; Lin, Y.-P.; Yang, C.; Lai, C.-M. Natural Ventilation Effectiveness of Awning Windows in Restrooms in K-12 Public Schools. Energies 2019, 12, 2414. https://doi.org/10.3390/en12122414
AMA Style
Chung S-C, Lin Y-P, Yang C, Lai C-M. Natural Ventilation Effectiveness of Awning Windows in Restrooms in K-12 Public Schools. Energies. 2019; 12(12):2414. https://doi.org/10.3390/en12122414
Chicago/Turabian StyleChung, Sung-Chin, Yi-Pin Lin, Chun Yang, and Chi-Ming Lai. 2019. "Natural Ventilation Effectiveness of Awning Windows in Restrooms in K-12 Public Schools" Energies 12, no. 12: 2414. https://doi.org/10.3390/en12122414
Note that from the first issue of 2016, this journal uses article numbers instead of page numbers. See further details here.