Thermal Assessment of a Novel Drywall System Insulated with VIPs


Lab. of Heterogeneous Mixtures and Combustion Systems, School of Mechanical Engineering, National Technical University of Athens, Heroon Polytechniou 9, 15780 Zografou, Greece
*
Author to whom correspondence should be addressed.
Energies 2019, 12(12), 2373; https://doi.org/10.3390/en12122373
Submission received: 24 April 2019
/
Revised: 18 June 2019
/
Accepted: 18 June 2019
/
Published: 20 June 2019
(This article belongs to the Special Issue Sustainable Use of Energy in Buildings)
Abstract
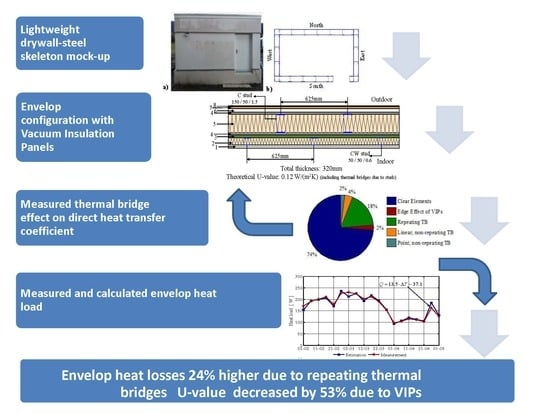
:Advanced building envelopes targeting high energy performance should combine high thermal performance with easy and fast installation. The combination of lightweight steel-framed building systems with vacuum insulation panels (VIPs) form an attractive solution toward this requirement. In the present study, a lightweight metal frame drywall building insulated with VIPs is constructed and experimentally/theoretically investigated, focusing on the impact of every type of thermal bridges on the thermal performance of the envelope and its upgrade due to the presence of the VIPs at the walls. Temperature measurements obtained at several locations of the envelope, over a period of one year, are presented and analyzed. The results are in agreement with the theoretical values and demonstrate that the VIPs can reduce the thermal transmittance of the central part of the wall by ca. 50%, limiting the impact of metal studs. The paper discusses the impact of dimensional inaccuracies and damaged panels on the thermal performance of the envelope. It is shown that VIP decreases the impact of thermal bridges and reduces the risk of condensation inside the walls.
1. Introduction
Current challenges for energy reduction and sustainability in the building sector require advanced building envelopes combining high thermal performance with easy and fast implementation, sound, seismic structural and fire resilience, and recyclability of wastes. Lightweight steel-framed (LSF) building systems meet these diverse requirements and form an attractive solution by additionally fulfilling the architectural requirements. Their rising popularity is mainly due to their cost efficiency and sustainability. More specifically, LSF buildings provide environmental benefits (less material requirements, may use recyclable materials, and reduce the wastes and pollutant emissions) and upgrade the building energy and safety performance. The combination of LSF with drywall systems offers numerous advantages. The structural performance is improved in terms of seismic resistance and fire protection. This type of construction can improve the hygrothermal performance of the buildings and offer extra sound insulation, providing a healthy and high quality indoor environment [1,2,3,4].
The main drawback of these constructions regarding their thermal performance is the strong effect of thermal bridges, introduced by the steel frame structure, reducing the overall energy efficiency of the building envelope. This is a well-known problem that has been previously studied. It has been shown [1] that the metal studs can be responsible for up to 74% increase of the thermal transmittance of a LSF wall. Therefore, one of the main challenges is the alleviation of the effect of thermal bridges.
LSF walls have been previously experimentally investigated aiming to quantify the effect of thermal bridges. Most of the studies refer to experimental tests in well-defined and controlled laboratory conditions [5,6,7,8,9]. The use of infrared thermography is the most widely known technique for the measurement of thermal bridges [10,11,12,13]. O’Grady et al. [7] introduced an in situ method of assessing heat loss through studs in lightweight walls, by means of infrared thermography under controlled conditions. The results showed that the differences between the thermal transmittance from the proposed methodology and the hot box method were up to 24%.
The most effective design strategy for the reduction of thermal bridges due to studs is the installation of a continuous insulation layer on the external side of the steel frame [14]. Martins et al. [15] investigated several solutions for the reduction of the effect of thermal bridges. They showed that the most effective way is the installation of superinsulation materials.
Vacuum insulation panels (VIPs) are currently one the most promising innovative materials belonging to the category of superinsulation materials [16,17]. Their thermal conductivity ranges from 0.003 to 0.007 W/mK, making it up to 10 times more efficient than conventional insulating materials of the same thickness [18]. Therefore, the use of VIPs in steel frame masonry can reduce the thickness of the walls and increase the net floor area of a building while maintaining or even improving its thermal performance [16,19].
The main use of VIPs at the moment is in cooling and transport [20]. The use in the building sector is still limited to a research level mainly due to their high cost and difficulty in installation into the building shell [21,22]. Generally, with the current prices, the use of VIPs can be financially viable in cold climates and for areas with high rental prices [22]. However, the development of new VIP production technologies is expected to significantly lower the production costs and offer products with better envelope barrier, ensuring a service life for a period of 30 or 50 years [21,23].
Up to date, most of the research on VIPs has focused on the service life and fragility of the panels [24], since durability and applicability issues have been recognized as the major barriers for the penetration of VIPs in the building sector [25,26]. At the same time, there is a lack of information on the in situ thermal performance of VIPs under different thermo-hygric conditions. Mukhopadhyaya et al. [27] monitored a VIP retrofitted timber-framed wall, exposed to the subarctic climate over a period of three years. They highlighted that the thermal bridges due to the timber frame was reduced after the installation of VIPs and the in situ performance of the VIPs is reduced by a rate less than 0.8% per year. Mandilaras et al. [28] investigated the in situ thermal performance of a building envelope incorporating ETICS (external thermal insulation composite systems) with VIPs and the results were compared with an Expanded Polystyrene (EPS) ETICS wall. The thermal resistance of the VIP wall was significantly higher than the EPS wall. They indicated that the models have to be validated and calibrated with the use of reliable experimental results. Johanson et al. [29] monitored the thermal and hygrothermal performance of a retrofitted wall incorporating VIPs. The results confirmed the improvement of the envelope estimating the U-value of the retrofitted wall and the temperature gradient inside the wall. VIPs have also been applied in lightweight timber-framed buildings for the insulation of the cavity between the studs [30]. Ahmad et al. [31] combined the use of VIPs with phase change materials (PCM) in a lightweight envelope, improving both the thermal inertia and the thermal resistance of the wall.
It is obvious that there is a need for reliable in situ characterization of the thermal performance of VIPs in real buildings under different conditions. Furthermore and as already explained, the application of VIPs in steel-framed lightweight envelopes appears to be an attractive solution for the reduction of thermal bridges. Addressing the above dual challenge, the present study investigates the thermal performance of a steel-framed lightweight building incorporating VIPs. For this purpose, a “mock-up” (small scale) building was constructed and monitored for a whole year. A VIP layer was installed at the internal side of the load-bearing structure in order to reduce the thermal bridges and protect from weather conditions. The properties of the incorporated VIPs were measured by means of the guarded hot plate method, calculating the edge effect.
This paper presents the theoretical analysis for the thermal performance of the lightweight building envelope by calculating and evaluating the effect of all thermal bridges. The experimental investigation focuses on the effect of the VIPs on the improvement of the thermal performance of the mock-up envelope and their impact on the thermal bridges. The thermal transmittance of the walls is measured in situ, including the effect of metal structure. Finally, a simple ARX (auto-regressive with exogenous input) model is developed for the estimation of the heat transfer coefficient of the whole envelope and compared with the theoretical values.
2. Experimental Set-Up
2.1. Test Site
The purposely built small-scale building (mock-up), located in Laupersdorf in Switzerland, was constructed using drywall materials anchored on a lightweight steel frame structure (Figure 1). The configuration and the thicknesses of the envelope components as well as the materials utilized were the same as those in full-scale buildings. The external dimensions of the mock-up building are 400 cm × 219 cm × 280 cm. The construction did not include any windows in order to permit focusing on the effect of the VIPs on the thermal performance of the opaque envelope. The only opening of the building is a wooden door with dimensions 82 × 190 cm, located at the southern wall.
Table 1 presents the specially developed configuration of the elements of the building envelope that accommodate the additional VIP layer. The 320 mm thick external walls comprise two parts: the load-bearing and the non-load bearing structure. The load-bearing structure (Figure 1b) consists of one row of C-shaped steel studs (C-studs), with dimensions 150 mm × 50 mm and 1.5 mm thickness, equally spaced at 625 mm. The gaps between the successive C-studs were filled with 150 mm thick mineral wool (MW150). Two gypsum board layers were anchored on the external and internal side of the C-studs. A ventilated façade was installed at the central part of the external side of the wall, while the upper and the bottom part was insulated with EPS coated with finishing mortar. The non-load bearing part of the wall consists of one row of C-shaped steel studs (CW-studs), with dimensions 50 mm × 50 mm and 0.6 mm thickness, located at the middle of the distance between two successive C-studs. The intermediate gaps between the CW-studs were filled with 50 mm thick mineral wool (MW50). Two gypsum board layers were located at the internal surface of the wall. One layer of vacuum insulation panel (VIP), with thickness 20mm, was located between the load-bearing and the non-load bearing structure of the wall. The VIPs covered the surfaces of the internal walls, according to a specific optimized pattern (Figure 2), obtained with the use of a dedicated software developed by the VIP manufacturer. The aim of the optimization is the maximization of the covered area by means of, as far as possible, larger size panels, reducing the edge effect. The placement of the VIPs on the wall was performed by means of the “dry installation method”, using a double-side bonding tape and building glue. Adhesive tape was used for the reduction of the thermal bridges caused by the air gaps between the joints of the adjacent panels. Due to dimensional inaccuracies and “improper” handling of the VIPs by non-trained technicians, one of the junctions between the adjacent walls was not completely covered with VIPs, as illustrated in Figure 3 and two VIPs located on the south wall lost their vacuum during installation. All uncovered areas (Figure 2) were filled with mineral wool.
The roof (Table 1) load-bearing structure was constructed with I-shaped steel studs (I-studs), with dimensions 200 mm × 100 mm and 1.5 mm thickness equally spaced at 500 mm. The intermediate gaps between the I-studs were filled with 200 mm thick mineral wool. A load panel was anchored on the external side of the metal structure, while a gypsum board layer was installed at the internal side. An EPS insulation layer, 80 mm thick, protected by finishing mortar, was applied on the external surface of the roof. The total thickness of the roof is 327 mm.
The floor (Table 1) was constructed with 1.5 mm thick, I-shaped steel studs (I-studs), with dimensions 200 mm × 100 mm, equally spaced at 500 mm. The intermediate gaps between the I-studs were filled with 200 mm thick mineral wool. A gypsum board layer was anchored on the ground side of the structure and a 160 mm thick EPS layer was installed at the bottom of the floor. A load panel, a sound insulation layer, and a floor panel were placed at the internal side of the structure. The total thickness of the floor is 455 mm.
2.2. Material Properties
The thermal properties of the materials are presented in Table 2. The thermal conductivity of the individual materials used for the construction of the walls was either measured in the laboratory using the guarded hot plate (GHP) technique or obtained from the manufacturer’s datasheets. The density and the specific heat of the materials were all obtained from the manufacturer’s datasheets or relevant standards. Particularly, the effective thermal conductivity of the VIPs, λeff, taking into account the thermal bridges at joints (edge effect) was estimated with the method described by Ghazi Wakili et al. [32]. According to this method the linear thermal transmittance, ΨVIP, at the joint of two adjacent VIPs is calculated by means of the measurement of the center-of-panel thermal conductivity (λcop) and the thermal conductivity at the joint of two panels. The VIP’s effective thermal conductivity (λeff) including the edge effect was calculated according to the following equation:
where d (m) is the thickness of the VIP, p (m) and A (m2) are the perimeter and the surface of VIP, respectively.
The measured effective thermal conductivities are presented in Table 3, for the most commonly used panel (dimensions 1000 mm × 600 mm) for two temperatures, 10 °C and 23 °C. As it is shown, the edge effect significantly increases the effective thermal conductivity, λeff, of the VIP (ca. 18%) compared to the thermal conductivity at the center of the panel (λcop). Moreover, higher temperatures result in a slightly higher λeff values.
The effective thermal conductivity was calculated for all used VIP sizes. The λeff of the panels ranges from 0.0045 to 0.0065 W/(m·K) depending on the dimensions of the panel, revealing the strong influence of the panel size on the contribution of the edge effect. Table 4 presents the λeff for the VIP layer of each wall, taking into account the VIP pattern on the walls (Figure 2). It is observed that the λeff of the south wall is ca. 4% higher than the north wall. This is due to the use of several small size panels in the south wall in order to cover the complicated geometry caused by the presence of the door. The fact is that VIP panels cannot be cut on-site into the desired sizes to cover a surface with complicated geometry. To overcome this problem, the producers produce VIPs with different sizes and provide dedicated software tools that automatically fill the highest possible surface area by combining panels of different sizes. In a complicated geometry, more small-sized panels are used. As a result, the edge effect is stronger and the effective thermal conductivity is increased. The edge effect results in a reduction of the theoretical clear thermal resistance of the wall (excluding all thermal bridges) by 8.1%, in the case of the north wall and by 9.6% in the case of the south wall.
2.3. Measuring Equipment
The data acquisition system (DAS) installed at the mock-up building was designed to collect and record the necessary data for the assessment of the thermal performance of the envelope. Time series of temperature, heat flux, and climatic data were recorded for a whole year, from February 2016 to February 2017. For the temperature measurements Micro-Betachip NTC thermistor probes (MCD 10k3MCD1) were used instead of thermocouples for increased accuracy [33]. The absolute error of measurement is less than 0.5 °C [34]. The heat flow through the elements was measured with the use of high sensitivity heat flux sensors of Hukseflux (type HFP01). A mini weather station was constructed for the measurement of outdoor temperature and humidity. Finally, the electrical power consumption was measured by a portable power/energy meter. Infrared thermography was performed by means of a portable Infrared (IR) camera (FLIR model 595). The thermal sensitivity of the IR camera is 0.1 °C at 30 °C with an accuracy of ±2 °C.
The sensors were connected to the data acquisition (DAQ) device, an Agilent 34972A digital multimeter, for signal conditioning and logging. The time interval for all the measurements was set to two minutes. The DAQ device was linked to a laptop that recorded the data continuously over the 12-month monitoring period. During the cooling season (from September to June) the indoor ambient temperature was maintained constant at 21 °C by means of a temperature control system comprising a temperature controller and a fan heater.
As explained, the aim of the monitoring campaign was the assessment of the thermal performance of the envelope focusing on the thermal behavior of the VIPs. Focus was given on the impact of the repeating and geometrical thermal bridges caused by the metal structure and the junctions, respectively. For this reason, the temperature monitoring at the central part of the envelope elements was performed in three sections: “C”, “CL”, and “CW”, as presented in Figure 4. The “C” section is a section at the location of the C-stud for the external walls or the I-stud for the roof and floor. The “CW” section, concerning only the walls, is a section at the location of the CW-stud. Finally, the “CL” section means the clear area that is the section between the C-stud and CW-stud for the walls and the section between the two I-studs for the roof and the floor. All sensors were installed at the interfaces between the layers of the envelope, following the practices proposed in ASTM C1046 standard [35].
3. Theoretical Approach
3.1. Thermal Bridges
The thermal performance of the building envelope was theoretically investigated, following the methodology described in the ISO 10211 standard [36], taking into account the repeating and non-repeating thermal bridges in the building elements. The repeating thermal bridges are the linear thermal bridges caused by the metal studs at the central part of the envelope elements. The non-repeating thermal bridges (or geometrical) are separated into linear and point thermal bridges, due to the junctions between two or three envelope elements, respectively.
The equivalent thermal transmittances of each envelope element, i, Ueq,i, taking into account all thermal bridges, are calculated according to the equation:
where Uclear,i is the thermal transmittance of the element i, excluding all thermal bridges, Ai the surface of the element i, Ψst and lst are the linear thermal transmittance and the length of the repeating thermal bridge of the studs, respectively, Ψ2D and l2D are the linear thermal transmittance and the length of the linear non-repeating thermal bridge, respectively and χ is the point thermal transmittance of the point non-repeating thermal bridge at the envelope elements. Equation (2) can be written in thermal transmittance terms, as follows:
where Urepeating, U2D_geometrical, and U3D_geometrical are the additional effect of the repeating, linear, and point non-repeating thermal bridges, respectively, expressed in thermal transmittances values (W/(m2K)).
All thermal bridge configurations were simulated by means of the commercial Computational Fluid Dynamics (CFD) software COMSOL [37] in order to calculate the linear and point thermal transmittances. The impact of the thermal bridges, involving two or three envelope elements (such as junctions between the wall and the roof), is equally distributed to the respective elements. Table 5 summarizes the surfaces and the calculated values of the equivalent thermal transmittance of each envelope element. The values in parenthesis represent the contribution of each type of thermal bridge to the total heat flow through the envelope element. For this analysis all construction details are taken into account, such as the VIP pattern, the use of polyurethane in the door junctions, the two damaged VIPs, etc.
In the walls, the repeating thermal bridges, due to the presence of the metal structure at the central part, contribute to the equivalent thermal transmittance by ca. 12–17%. The geometrical thermal bridges (linear and point) have positive effect on the thermal performance (indicated by the negative values for the north, west and east walls in Table 5) by reducing the thermal transmittance by ca. 3% to 6%, except for the south wall. On the other hand, the overall effect of the geometrical thermal bridges on the south wall is negative (indicated by positive values, ca. 12% to 15% in terms of the U-values) due to the presence of the door.
On the other hand, the thermal bridges have a strong effect on the thermal transmittance of the roof and the floor elements where no VIPs are present. The metal structures contribute by 51% to the roof and 38% to the floor element, while the non-repeating linear thermal bridges increase the thermal transmittance by ca. 5%. On the contrary, the non-repeating point thermal bridges have positive effect on the thermal performance by 1% on the roof and 5% on the floor. The thermal transmittance of the door is increased due to the non-repeating thermal bridges by 11%.
3.2. Total Heat Transfer Coefficient
The thermal performance of the whole building envelope was evaluated by means of the direct heat transfer coefficient, HD. It represents the heat flow rate through the whole building envelope divided by the temperature difference between indoor and outdoor spaces, expressed in (W/K) and defined by the following equation:
HD according to the theoretical analysis of the envelope was calculated equal to 12.57 W/K, based on the results depicted in Table 5. It is noted that the door, occupying only 3% of the total envelope surface, is responsible for more than one-third of the total HD, indicating the high thermal performance of the rest of the envelope.
The contribution of each type of thermal bridge on the calculation of the direct heat transfer coefficient, HD, is depicted in Figure 5. The contribution of “clear elements” represents the heat through the envelope elements without any thermal bridge (the edge effect of VIPs is also excluded). It is shown that all thermal bridges (edge effect, repeating non-repeating) are responsible for 26% of the HD. The largest contribution, by 18%, is due to the repeating thermal bridges at the central part of the envelope elements (metal structure), indicating the significance of these thermal bridges. The linear and point non-repeating thermal bridges, due to the junctions of the envelope, account for 4% and 2% of the total HD value, respectively. The low contribution of these thermal bridges on the HD can be associated with the presence of extra insulation on the top and the bottom part of the external wall (at the junctions with the roof and the floor) and the use of the external dimensions on the analysis of the building envelope. Finally, the edge effect of the VIPs contributes by 2% to the whole building envelope’s heat transfer coefficient.
4. Experimental Investigation
The thermal behavior of the lightweight envelope, focusing on the impact of every type of thermal bridge and the upgrade of envelope due to the presence of VIPs at the walls, was experimentally investigated. The results derived from the experimental analysis are compared with the theoretical investigation, validating the methods and the properties.
4.1. Thermal Bridges
A large amount of heat losses due to the thermal bridges are expected to be introduced by the metal structure of the lightweight steel frame building. Infrared thermography and the temperature time series data were used in order to quantify the effect of the repeating thermal bridges, caused by the metal studs at the central part of the envelope elements. The thermographic analysis follows the ASTM C1060 [38] standard. The temperature difference between the indoor/outdoor environments was approximately 25 °C (Tin = 30 °C and Tout = 5 °C).
The IR images indicate (Figure 6 top) that the surface temperature of the walls is only slightly disturbed (less than 0.2 °C) by the presence of the studs, even in the case where the indoor/outdoor temperature difference was 25 °C, during the thermography test. This low temperature disturbance is caused by the presence of the VIP layer which reduces the heat flow. Moreover, the walls are supported by two rows of metal studs at an alternating pattern creating a more uniform temperature profile. The monitoring results also indicate that temperature inhomogeneities at the surface temperature do not exceed 0.1 °C during the whole measuring period for the four walls, as presented in Figure 6a bottom. It is noted that the monitoring results in Figure 6a,b bottom correspond to 20 °C indoor temperature while during the thermography tests the indoor temperature was raised to 30 °C.
On the other hand, the metal studs have a significant effect on the thermal performance of the roof (no VIPs). As depicted in Figure 6b top, a high surface temperature disturbance, ca. 4 °C, is observed during the thermography test. The area between the studs is warmer than the stud area, by ca. 2 °C during the winter measurements, as presented in Figure 6b bottom.
The impact of small “construction inaccuracies” (resulting in a small area not covered by VIPs) on the geometrical thermal bridges between the two adjacent walls is also investigated by means of IR thermography and temperature measurements. Figure 7a illustrates the IR images of two wall junctions: one completely covered and one not covered with VIPs, as depicted in Figure 3. The absence of VIPs lowers the recorded temperatures by ca. 2 °C, during the thermography test. This significant effect on the geometrical thermal bridges is also revealed by the monitoring results. Figure 7b illustrates the temperature measurements for the two junctions at the interface between the internal gypsum board and the 50 mm thick mineral wool (MW50). It is observed that the completely covered (by VIP) junction has always a higher temperature than the one without VIP. The temperature difference reaches up to 1.5 °C during the winter, while in the summer period the difference is reduced to 0.3 °C. Related numerical investigations for the two junctions confirm the impact of “construction inaccuracies”, since the linear thermal transmittance (Ψ2D) of the uncovered junction is higher by ca. 50% than the covered one.
The thermal and hygrothermal performance of the thermal bridges of the building envelope was assessed by means of the temperature factor method. The temperature factor, f, is used as an indicator for the possibility of humidity issues at the regions of thermal bridges and it is calculated, according to the ISO 10211 [36], by the following equation:
where, Ts,in is the internal surface temperature, Tin and Tout are the indoor and outdoor temperatures, respectively. The temperature factor is calculated using the surface temperatures for different critical regions at the internal side of the envelope. As the temperature factor is a steady state indicator, the calculated values concern a five-day period with low outdoor temperature and stable indoor temperature.
The temperature factors for the nine most critical regions of the envelope are presented in Figure 8. It is shown that the f values of all regions are higher than the critical value of 0.7, at which there is a risk for mold growth, according to the DIN 4108 standard [39]. The high values of the temperature factors indicate the high thermal and hygrothermal performance of the under-investigation building envelope. The most severe thermal bridge appears to be at the junction that was not covered with a VIP; the local f value is equal to 0.77, while the f value at the covered junction is equal to 0.85. The latter is an indicator for the hygrothermal importance of the proper complete cover of the envelope with VIPs.
4.2. Wall Thermal Transmittance
The thermal transmittance of the external walls, including the effect of thermal bridges due to the metal studs at the central part of the wall, Uoverall (Uoverall = Uclear + Urepeating), was measured according to the representative point method, as introduced by Atsonios et al. [40]. According to this method, indoor/outdoor air temperatures and heat flux measurements are required for the in situ measurement of the Uoverall of the wall. Besides, the heat flux sensor has to be installed at “representative points” (RPs) where the heat flow at the internal surface is always equal to the averaged heat flow of the whole surface. The accurate position of the RPs is identified by numerical simulation of the wall. The central part of the wall was simulated by means of COMSOL software using the material properties presented in Table 2 and the λeff of the north wall (Table 4). As depicted in Figure 9, the deviation of the surface temperature is lower than 0.3%, in line with the monitoring and thermography results (Figure 6). There are several RPs on the repeated geometry of the external walls. The RP nearby the C-stud section was selected for the installation of the heat flux sensor, due to the smooth gradient of the heat flux curve. As it is observed from the variation of the heat flux at the length of wall (Figure 9 top), a random installation of the heat flux sensor may result in an overestimation of the heat flux up to 30% or an underestimation up to 15%.
The Uoverall is measured in different locations of the wall for several measuring periods during the year. The average results of the measured U-values are presented in Table 6. As it is shown the experimental Uovereall is in a very good agreement with the theoretical values, showing a difference less than 6%. The results obtained over the monitoring year are very close and provide high repeatability, since their relative standard deviation is 1%.
The thermal transmittance of the walls is increased by 27% due to the presence of studs, despite the fact that their impact on the surface temperature disturbance is almost negligible (Figure 9). The numerical analysis of the walls with and without VIPs indicates that the theoretical Uoverall of the wall without the layer of VIP is 0.2422 W/(m2·K). Hence, the VIP layer reduces the U-value at the center of the wall by ca. 52%. Moreover, the additional VIP layer reduces the linear thermal transmittance (Ψ-value) of the wall by ca. 70%.
4.3. Experimental Determination of Heat Transfer Coefficient, HD
The determination of the direct heat transfer coefficient of the envelope, HD, was based on a simplified linear model, introduced by Jimenez et al. [41,42,43,44,45,46]. According to this model, the steady state energy balance includes four terms: The heat losses due to the building envelope, the solar gains, the ventilation heat losses and the heat gains caused by the heating system, and electrical devices inside the mock-up. The energy balance can be written by the following equation:
where Q (W) is heat flow rate from the heating system and electrical devices inside the building, Tin (°C) and Tout (°C) are the indoor and outdoor temperatures, respectively, g (−) is the solar transmittance (it is negative for the above equation), Isol (W/m2) is the incoming solar radiation, Asol (m2) is the effective collecting area (solar aperture), Hve (W/K) is the wind induced ventilation heat loss coefficient, and Ws (m/s) is the wind speed.
Assuming that the air infiltration into the under-investigation mock-up is negligible (only one hermetically sealed door), the term of the ventilation can be eliminated. Moreover, due to the fact that there is no transparent surface at the envelope (windows, skylight, etc.) and a large part of the mock-up is constantly shaded by neighboring buildings, the term of the solar gains at the above equation can also be excluded introducing only a small error to the heat balance due to the diffuse radiation. Hence, the above equation is simplified as follows:
The heat load, Q, and the temperatures Tin and Tout are available from the measurements. In order to estimate the heat transfer coefficient, HD, the energy balance is reformulated into the linear static model for each time interval, t:
where ΔΤt is the temperature difference between the indoor and outdoor environment for each time interval t, c is the intercept of the linear model and εt is the error ~N (0, σ2) representing the white noise. The intercept, c, is a constant and includes all not-included heat losses (e.g., climatic, diffuse radiation, losses through the ground etc.). A linear ARX (auto-regressive with exogenous input) model has been selected to estimate the parameters using MATLAB software and its system identification toolbox [43]. As the model is a steady state model, the imposed physical constraint is that all inputs (Q, Tin, and Tout) and outputs (physical parameters) must be constant [41,42,45]. Studies have shown that an integration period of five days can fulfill the statistical criteria of the model and provide acceptable results [46].
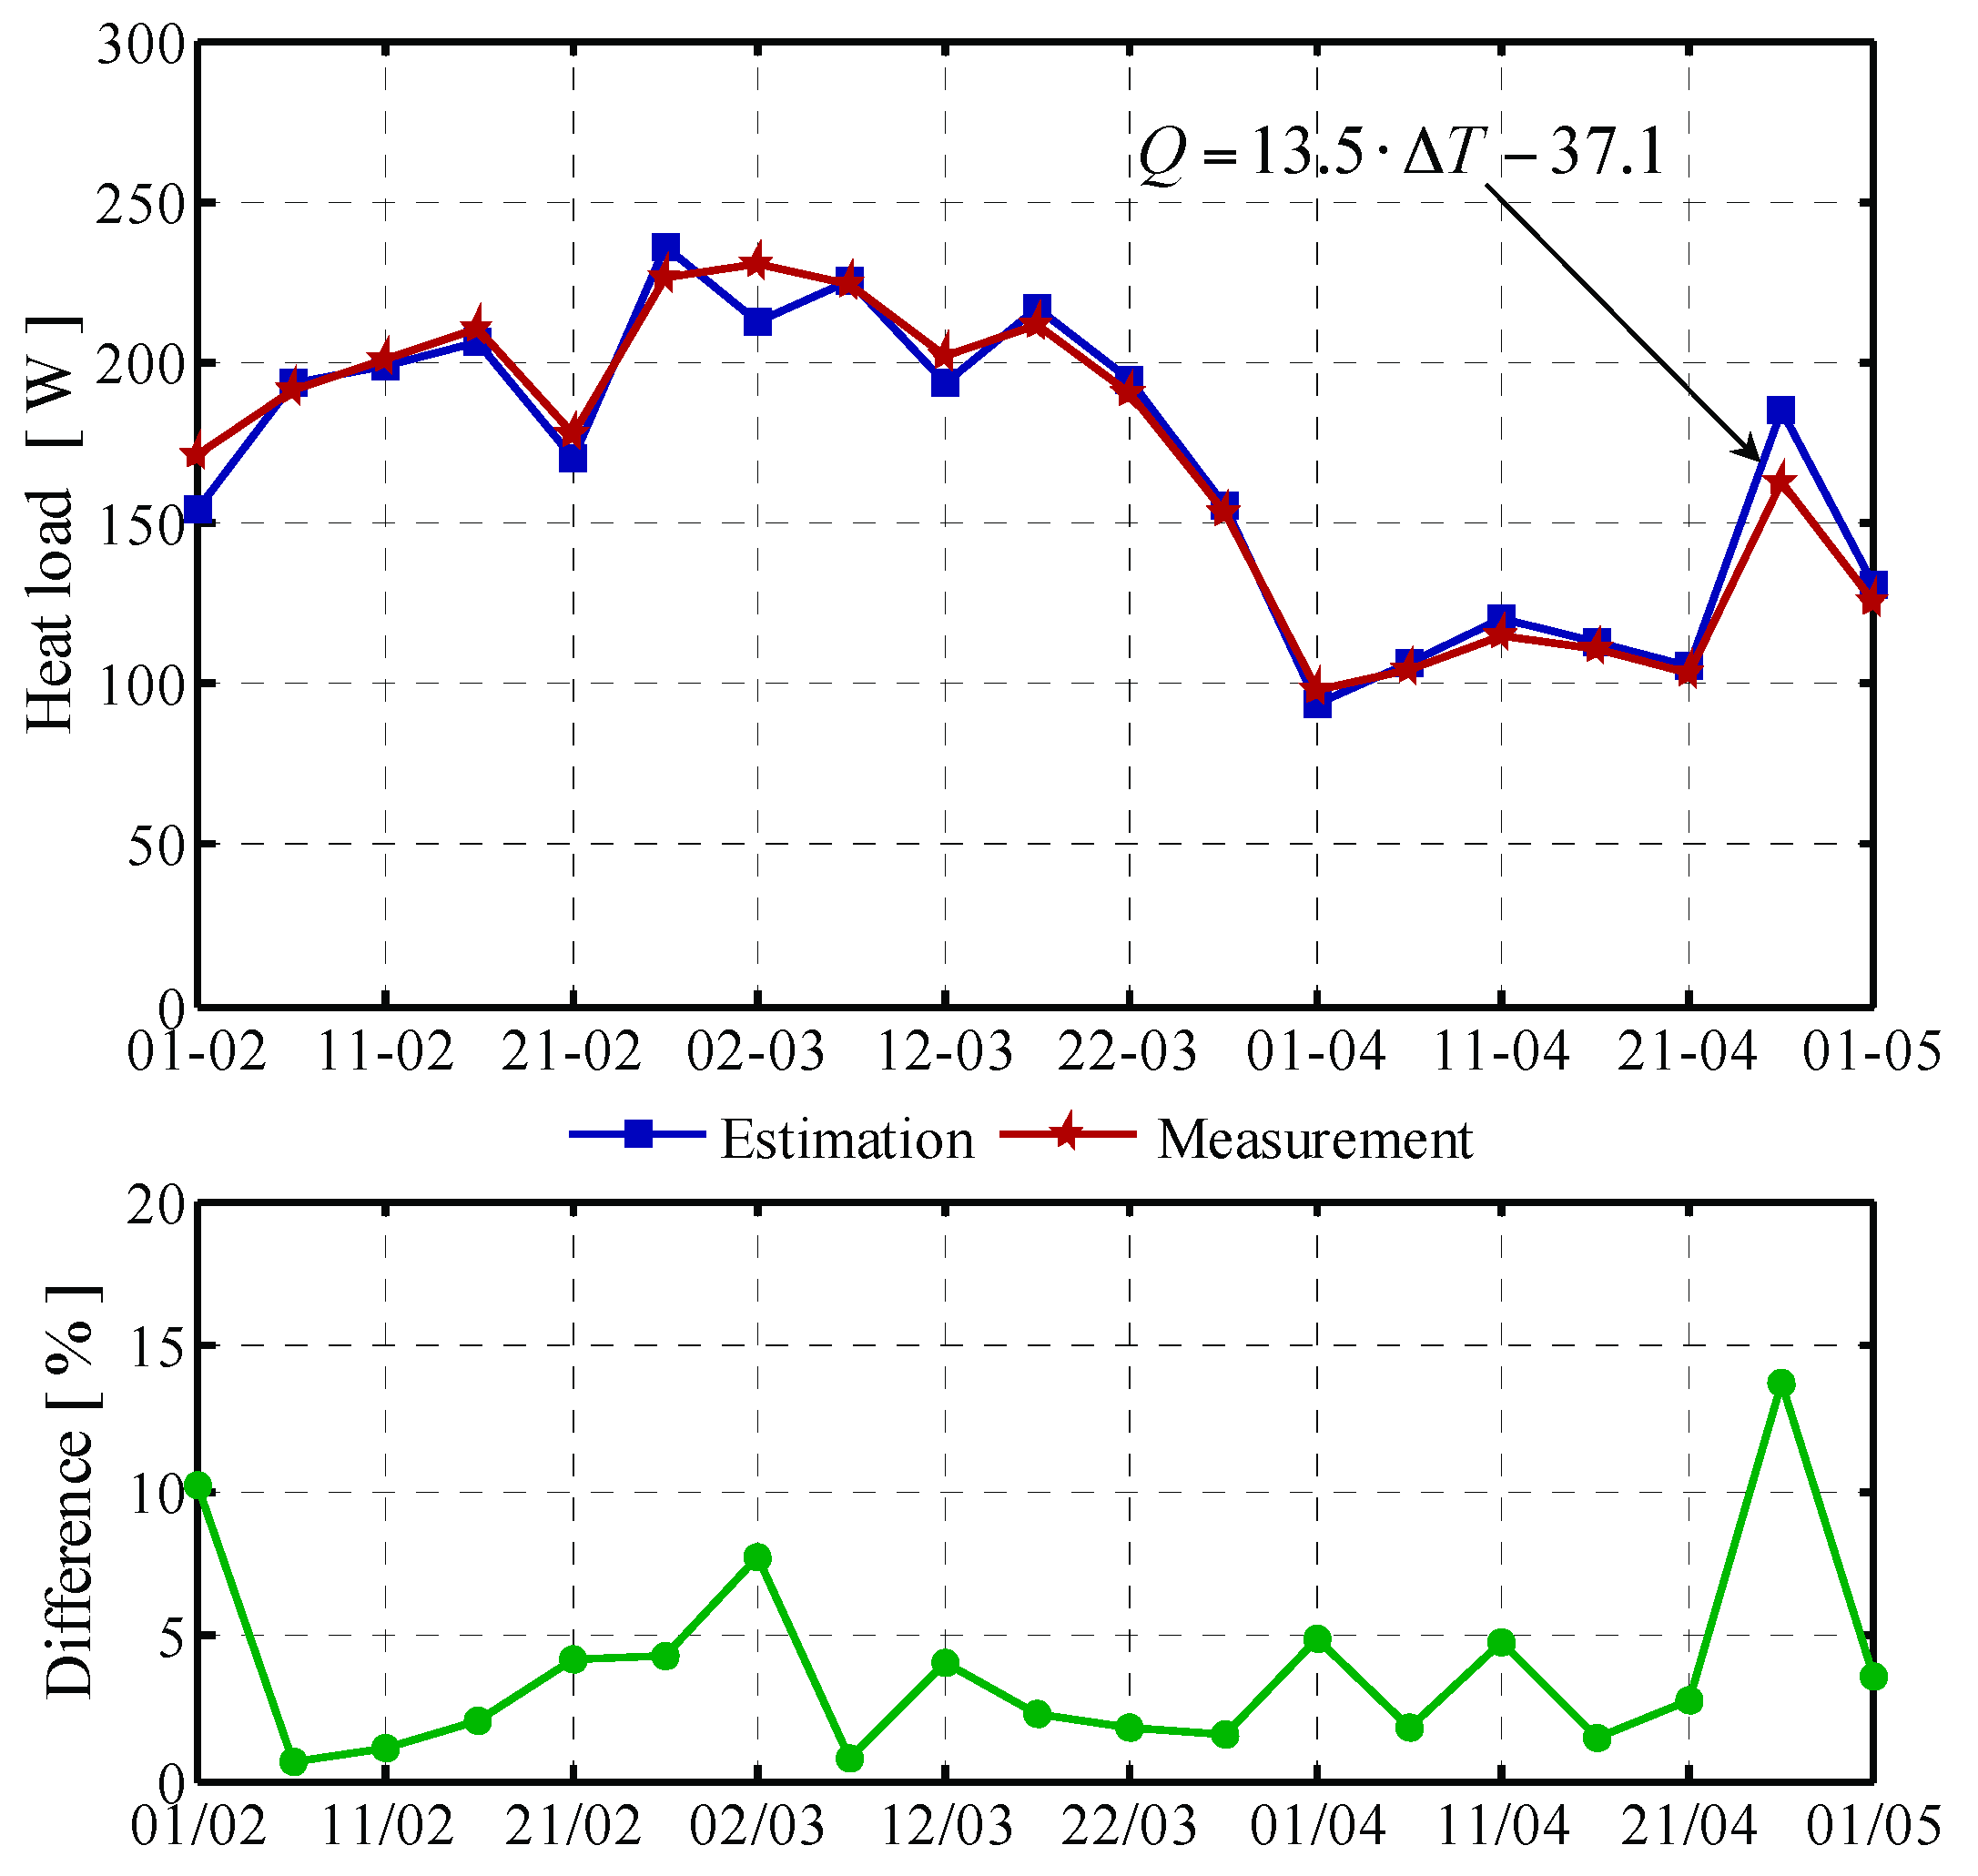
For the estimation of the heat transfer coefficient of the mock-up, the above described model was employed for a period when the temperature control system was activated and the consecutive measurements of the energy consumption were available. Figure 10 illustrates the estimate by the model and the measured heat load. It is observed that the estimations are in a good agreement with the measured values and the average error is 4%. This indicates that despite the fact that the model is simplified, the simplicity of the building envelope (no windows) allows the use of such a simple model. The results show that the estimated direct heat transfer coefficient, HD is equal to 13.5 W/K with adjusted R2 parameter equal to 0.96. This value is in agreement with the theoretical calculation of the HD, which has been estimated equal to 12.6 W/K. The difference between the experimental and theoretical approach is lower than 7%, which can be explained due to the simplicity of model, the infiltration, the effect of the ground and radiation effects, and other non-accounted parameters.
5. Conclusions
The present study carried out for the first time an experimental investigation of the thermal behavior of a steel-framed lightweight building envelope incorporating VIPs. The examined building was a purposely built mock-up building with a VIP layer installed at the intermediate of the external walls. The investigation was performed by means of thermography and temperature, heat flux and climatic monitoring results over an entire year. The analysis focused on the impact of the thermal bridges on the envelope thermal performance and highlighted how the VIPs improve the thermal behavior of the envelope.
With the use of theoretical analysis and widely accepted standardized methods the heat transfer coefficient of the envelope, HD, was determined by focusing on the impact of the different types of thermal bridges (edge effect, repeating due to studs, 2D junctions and corners). The results indicated that a large amount of heat losses are caused by the repeating thermal bridges due to the metal structure increasing the heat transfer coefficient of the whole envelope by 24%.
The VIPs were analyzed at a panel level calculating the effective thermal conductivity by means of guarded hot plate measurements. The results showed that the edge effect increases the thermal conductivity by 18% to 23%, depending on the pattern of the walls. Nevertheless, the edge effect was found to be responsible only for the 2% on the heat transfer coefficient of the envelope.
The experimental investigation validated the material properties and the theoretical analysis based on the standardized approaches. The results highlighted the importance of the VIP layer on the thermal performance of the envelope. The presence of VIP improved the thermal performance of the wall, reducing the impact of the repeating thermal bridges. The in situ measurement showed that the U-value of the walls is decreased by 53%, compared to the wall excluding the VIP layer.
Moreover, thermography and temperature time series data allowed the comparison of the thermal performance and the effect of thermal bridges between the envelope elements with and without VIPs. It was found that the VIP insulation layer reduced significantly the negative effect of the metal structure on the walls. On the other hand, the roof of the building (insulated only with conventional insulation) showed a significantly inferior thermal performance with the thermal losses due to the thermal bridges reaching 50% of the total heat through the roof.
Regarding construction and installation issues, the current study revealed some of the limitations of the VIP technology for use in buildings. Even if a dedicated software tool for the optimum coverage of the walls with VIPs was used, small dimensional inaccuracies resulted in a small uncovered area at the junction of two walls. In this area the effect of thermal bridge was strong and the risk for condensation was much higher. Also, despite of the efforts to perform a proper installation, finally some panels were damaged introducing further thermal bridges.
Overall, in this study, the use of VIPs as insulation in lightweight buildings was revealed as an attractive solution to the problem of low thermal performance associated with the steel frame of such constructions. Some weaknesses and barriers to overcome were brought to light adding to the ever-increasing experience for making the VIPs an effective solution for the insulation of buildings.
Author Contributions
Conceptualization, I.A., I.M. and M.F.; data curation, I.A. and I.M.; formal analysis, I.A. and I.M.; research, I.A., and I.M.; methodology, I.A., and I.M.; project administration, I.M. and M.F.; resources, M.F.; software, I.A.; supervision, M.F.; validation, I.A., and I.M.; visualization, I.A.; writing, original draft, I.A.; writing, review and editing, I.A., I.M. and M.F.
Funding
This research was funded by the EC grant number [609086].
Acknowledgements
The authors would like to acknowledge the financial support of the EC in the frame of the project ELISSA (FP7-NMP, 2013-2016): Energy Efficient LIghtweight-Sustainable-SAfe-Steel Construction.
Conflicts of Interest
The authors declare no conflict of interest.
References
- De Angelis, E.; Serra, E. Light Steel-frame Walls: Thermal Insulation Performances and Thermal Bridges. Energy Procedia 2014, 45, 362–371. [Google Scholar] [CrossRef] [Green Version]
- Soares, N.; Santos, P.; Gervásio, H.; Costa, J.J.; Simões da Silva, L. Energy efficiency and thermal performance of lightweight steel-framed (LSF) construction: A review. Renew. Sustain. Energy Rev. 2017, 78, 194–209. [Google Scholar] [CrossRef]
- Landolfo, R.; Holl, D. Lightweight Steel Drywall Constructions for Seismic Areas. Design, Research and Applications; KNAUF: Iphofen, Germany, 2015. [Google Scholar]
- Santos, P. Energy Efficiency of Lightweight Steel-Framed Buildings. In Energy Efficient Buildings; Yap, E.H., Ed.; InTech: Rijeka, Croatia, 2017; Chapter 03. [Google Scholar] [CrossRef]
- Gorgolewski, M. Developing a simplified method of calculating U-values in light steel framing. Build. Environ. 2007, 42, 230–236. [Google Scholar] [CrossRef]
- Zalewski, L.; Lassue, S.; Rousse, D.; Boukhalfa, K. Experimental and numerical characterization of thermal bridges in prefabricated building walls. Energy Convers. Manag. 2010, 51, 2869–2877. [Google Scholar] [CrossRef]
- O’Grady, M.; Lechowska, A.A.; Harte, A.M. Infrared thermography technique as an in-situ method of assessing heat loss through thermal bridging. Energy Build. 2017, 135, 20–32. [Google Scholar] [CrossRef] [Green Version]
- Li, Y.; Yao, J.; Li, R.; Zhang, Z.; Zhang, J. Thermal and energy performance of a steel-bamboo composite wall structure. Energy Build. 2017, 156, 225–237. [Google Scholar] [CrossRef]
- Santos, P.; Martins, C.; da Silva, L.S.; Bragança, L. Thermal performance of lightweight steel framed wall: The importance of flanking thermal losses. J. Build. Phys. 2013, 38, 81–98. [Google Scholar] [CrossRef] [Green Version]
- O’Grady, M.; Lechowska, A.A.; Harte, A.M. Application of infrared thermography technique to the thermal assessment of multiple thermal bridges and windows. Energy Build. 2018, 168, 347–362. [Google Scholar] [CrossRef] [Green Version]
- Baldinelli, G.; Bianchi, F.; Rotili, A.; Costarelli, D.; Seracini, M.; Vinti, G.; Asdrubali, F.; Evangelisti, L. A model for the improvement of thermal bridges quantitative assessment by infrared thermography. Appl. Energy 2018, 211, 854–864. [Google Scholar] [CrossRef]
- Asdrubali, F.; Baldinelli, G.; Bianchi, F. A quantitative methodology to evaluate thermal bridges in buildings. Appl. Energy 2012, 97, 365–373. [Google Scholar] [CrossRef]
- Sfarra, S.; Cicone, A.; Yousefi, B.; Ibarra-Castanedo, C.; Perilli, S.; Maldague, X. Improving the detection of thermal bridges in buildings via on-site infrared thermography: The potentialities of innovative mathematical tools. Energy Build. 2019, 182, 159–171. [Google Scholar] [CrossRef]
- Kosny, J.; Christian, J.E. Thermal evaluation of several configurations of insulation and structural materials for some metal stud walls. Energy Build. 1995, 22, 157–163. [Google Scholar] [CrossRef]
- Martins, C.; Santos, P.; da Silva, L.S. Lightweight steel-framed thermal bridges mitigation strategies: A parametric study. J. Build. Phys. 2015, 39, 342–372. [Google Scholar] [CrossRef]
- Baetens, R.; Jelle, B.P.; Thue, J.V.; Tenpierik, M.J.; Grynning, S.; Uvsløkk, S.; Gustavsen, A. Vacuum insulation panels for building applications: A review and beyond. Energy Build. 2010, 42, 147–172. [Google Scholar] [CrossRef] [Green Version]
- Brunner, S.; Ghazi Wakili, K.; Stahl, T.; Binder, B. Vacuum insulation panels for building applications—Continuous challenges and developments. Energy Build. 2014, 85, 592–596. [Google Scholar] [CrossRef]
- Simmler, H.; Brunner, S. Vacuum insulation panels for building application: Basic properties, aging mechanisms and service life. Energy Build. 2005, 37, 1122–1131. [Google Scholar] [CrossRef]
- Fricke, J.; Heinemann, U.; Ebert, H.P. Vacuum insulation panels—From research to market. Vacuum 2008, 82, 680–690. [Google Scholar] [CrossRef]
- Hammond, E.C.; Evans, J.A. Application of Vacuum Insulation Panels in the cold chain—Analysis of viability. Int. J. Refrig. 2014, 47, 58–65. [Google Scholar] [CrossRef]
- Kucukpinar, E.; Miesbauer, O.; Carmi, Y.; Fricke, M.; Gullberg, L.; Erkey, C.; Caps, R.; Rochefort, M.; Moreno, A.G.; Delgado, C.; et al. Development of Transparent and Opaque Vacuum Insulation Panels for Energy Efficient Buildings. Energy Procedia 2015, 78, 412–417. [Google Scholar] [CrossRef]
- Alam, M.; Singh, H.; Suresh, S.; Redpath, D.A.G. Energy and economic analysis of Vacuum Insulation Panels (VIPs) used in non-domestic buildings. Appl. Energy 2017, 188, 1–8. [Google Scholar] [CrossRef] [Green Version]
- Zhai, C.; Li, Z.; He, Y.; Liu, T.; Sun, M.; Liu, J. A Comprehensive Study on the Production Process and Properties of Composite Core Materials for Vacuum Insulation Panels for Construction Applications. In Proceedings of the 13th International Vacuum Insulation Symposium (IVIS), Paris, France, 20–21 September 2017; pp. 17–18. [Google Scholar]
- Uriarte, A.; Garai, I.; Ferdinando, A.; Nicolas, O.; Barreiro, E. Affordable and adaptable super-insulation solutions for energy efficient retrofitting of public buildings. In Proceedings of the 13th International Vacuum Insulation Symposium (IVIS), Paris, France, 20–21 September 2017. [Google Scholar]
- Alam, M.; Singh, H.; Brunner, S.; Naziris, C. Experimental characterisation and evaluation of the thermo-physical properties of expanded perlite—Fumed silica composite for effective vacuum insulation panel (VIP) core. Energy Build. 2014, 69, 442–450. [Google Scholar] [CrossRef]
- Brunner, S.; Stahl, T.; Ghazi Wakili, K. An example of deteriorated vacuum insulation panels in a building façade. Energy Build. 2012, 54, 278–282. [Google Scholar] [CrossRef]
- Mukhopadhyaya, P.; MacLean, D.; Korn, J.; van Reenen, D.; Molleti, S. Building application and thermal performance of vacuum insulation panels (VIPs) in Canadian subarctic climate. Energy Build. 2014, 85, 672–680. [Google Scholar] [CrossRef] [Green Version]
- Mandilaras, I.; Atsonios, I.; Zannis, G.; Founti, M. Thermal performance of a building envelope incorporating ETICS with vacuum insulation panels and EPS. Energy Build. 2014, 85, 654–665. [Google Scholar] [CrossRef]
- Johansson, P.; Hagentoft, C.-E.; Sasic Kalagasidis, A. Retrofitting of a listed brick and wood building using vacuum insulation panels on the exterior of the facade: Measurements and simulations. Energy Build. 2014, 73, 92–104. [Google Scholar] [CrossRef] [Green Version]
- Thomas, H.; Bjørn Petter, J.; Arild, G. Vacuum insulation panels in wood frame wall constructions with different stud profiles. J. Build. Phys. 2012, 36, 212–226. [Google Scholar] [CrossRef] [Green Version]
- Ahmad, M.; Bontemps, A.; Sallée, H.; Quenard, D. Thermal testing and numerical simulation of a prototype cell using light wallboards coupling vacuum isolation panels and phase change material. Energy Build. 2006, 38, 673–681. [Google Scholar] [CrossRef] [Green Version]
- Ghazi Wakili, K.; Stahl, T.; Brunner, S. Effective thermal conductivity of a staggered double layer of vacuum insulation panels. Energy Build. 2011, 43, 1241–1246. [Google Scholar] [CrossRef]
- Ahmad, M.W.; Mourshed, M.; Mundow, D.; Sisinni, M.; Rezgui, Y. Building energy metering and environmental monitoring—A state-of-the-art review and directions for future research. Energy Build. 2016, 120, 85–102. [Google Scholar] [CrossRef]
- MICRO-BETACHIP (MCD), Thermistor Probe, Specifications. Available online: https://www.digikey.com/catalog/en/partgroup/mcd-series/55560 (accessed on 20 June 2019).
- ASTM C1046-95(2013) Standard Practice for In-Situ Measurement of Heat Flux and Temperature on Building Envelope Components; ASTM International: West Conshohocken, PA, USA, 2013.
- BS EN ISO 10211:2017. Thermal Bridges in Building Construction—Heat Flows and Surface Temperatures—Detailed Calculations; The British Standards Institution: London, UK, 2017.
- COMSOL Multiphysics®. Available online: https://www.comsol.es/comsol-multiphysics (accessed on 20 June 2019).
- ASTM C1060-11a Standard. Standard Practice for Thermographic Inspection of Insulation Installations in Envelope Cavities of Frame Buildings; ASTM International: West Conshohocken, PA, USA, 2015.
- DIN 4108-2:2013. Thermal Protection and Energy Economy in Buildings—Part 2: Minimum Requirements to Thermal Insulation; German Institute for Standardization: Berlin, Germany, 2013.
- Atsonios, I.A.; Mandilaras, I.D.; Kontogeorgos, D.A.; Founti, M.A. Two new methods for the in-situ measurement of the overall thermal transmittance of cold frame lightweight steel-framed walls. Energy Build. 2018, 170, 183–194. [Google Scholar] [CrossRef]
- Jiménez, M.J.; Bloem, H. Energy Performance Assessment of Buildings and Building Components. Guidelines for Data Analysis from Dynamic Experimental Campaigns Part 1: Physical Aspects. Energy Procedia 2015, 78, 3306–3311. [Google Scholar] [CrossRef]
- Jiménez, M.J.; Madsen, H. Models for describing the thermal characteristics of building components. Build. Environ. 2008, 43, 152–162. [Google Scholar] [CrossRef]
- Jiménez, M.J.; Madsen, H.; Andersen, K.K. Identification of the main thermal characteristics of building components using MATLAB. Build. Environ. 2008, 43, 170–180. [Google Scholar] [CrossRef]
- Jimenez, M.J.; Porcar, B.; Heras, M.R. Estimation of building component UA and gA from outdoor tests in warm and moderate weather conditions. Solar Energy 2008, 82, 573–587. [Google Scholar] [CrossRef]
- Jiménez, M.J.; Porcar, B.; Heras, M.R. Application of different dynamic analysis approaches to the estimation of the building component U value. Build. Environ. 2009, 44, 361–367. [Google Scholar] [CrossRef]
- Naveros, I.; Jiménez, M.J.; Heras, M.R. Analysis of capabilities and limitations of the regression method based in averages, applied to the estimation of the U value of building component tested in Mediterranean weather. Energy Build. 2012, 55, 854–872. [Google Scholar] [CrossRef]
Figure 1.
The mock-up building. (a) Front view of the building (south wall) and (b) floor plan (section of the load-bearing structure).
Figure 1.
The mock-up building. (a) Front view of the building (south wall) and (b) floor plan (section of the load-bearing structure).
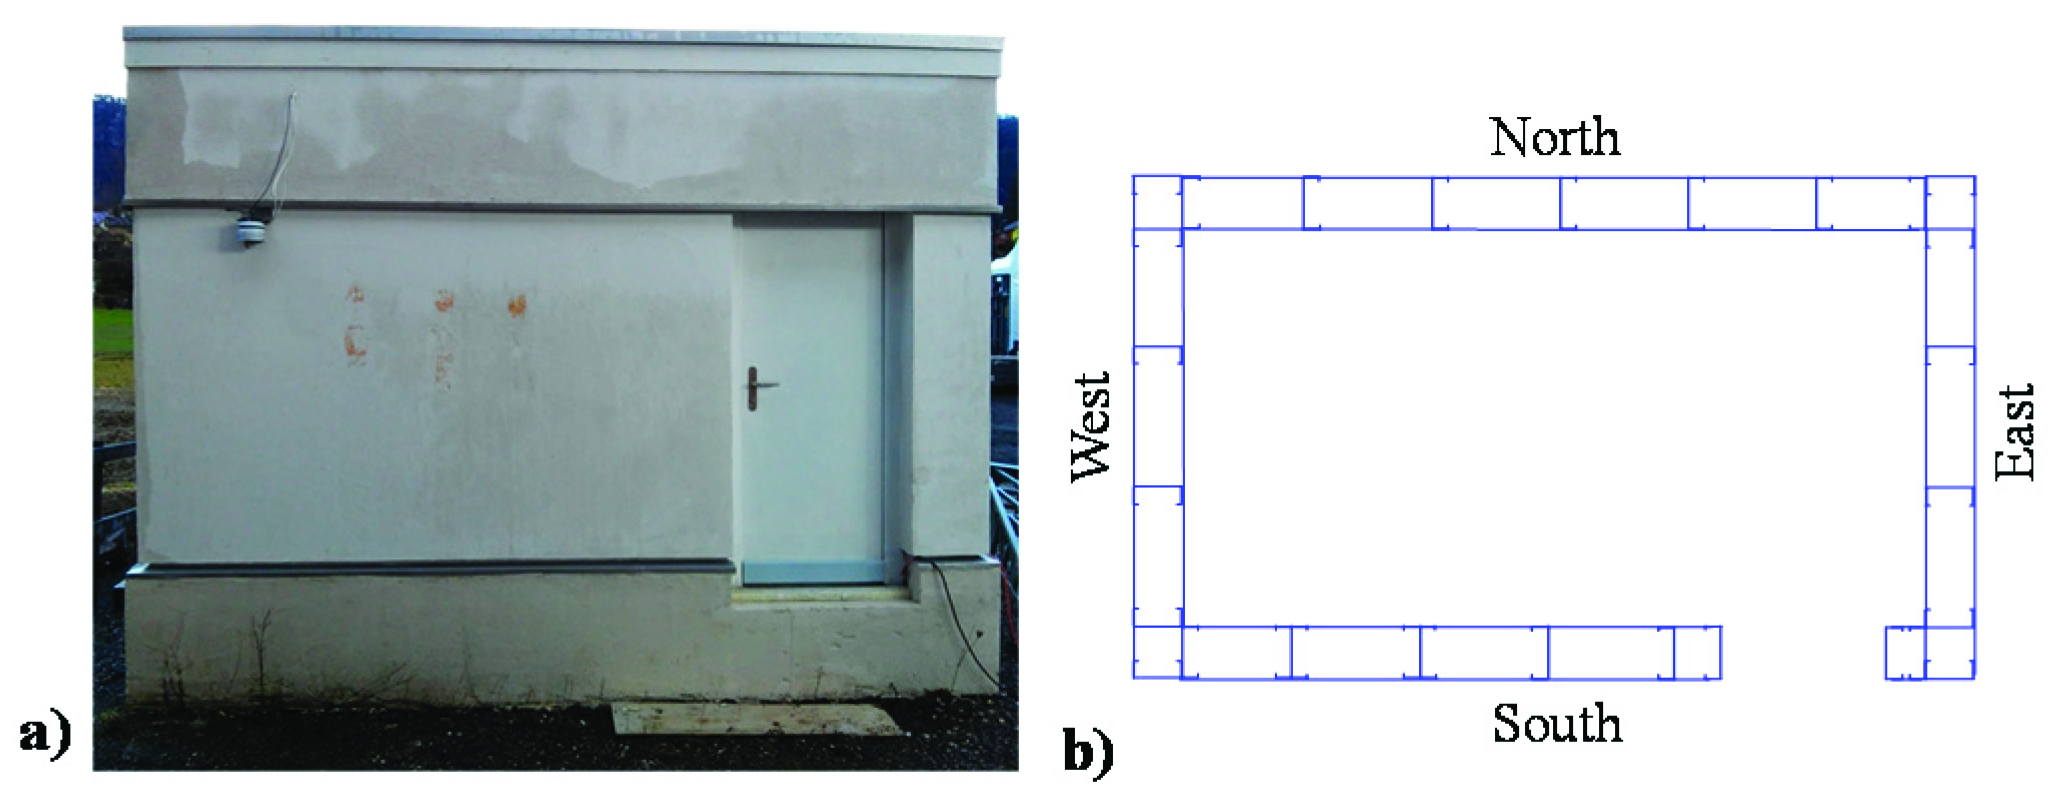
Figure 2.
Pattern of the vacuum insulation panels (VIP) for (a) the north, (b) the east and west, and (c) the south wall.
Figure 2.
Pattern of the vacuum insulation panels (VIP) for (a) the north, (b) the east and west, and (c) the south wall.
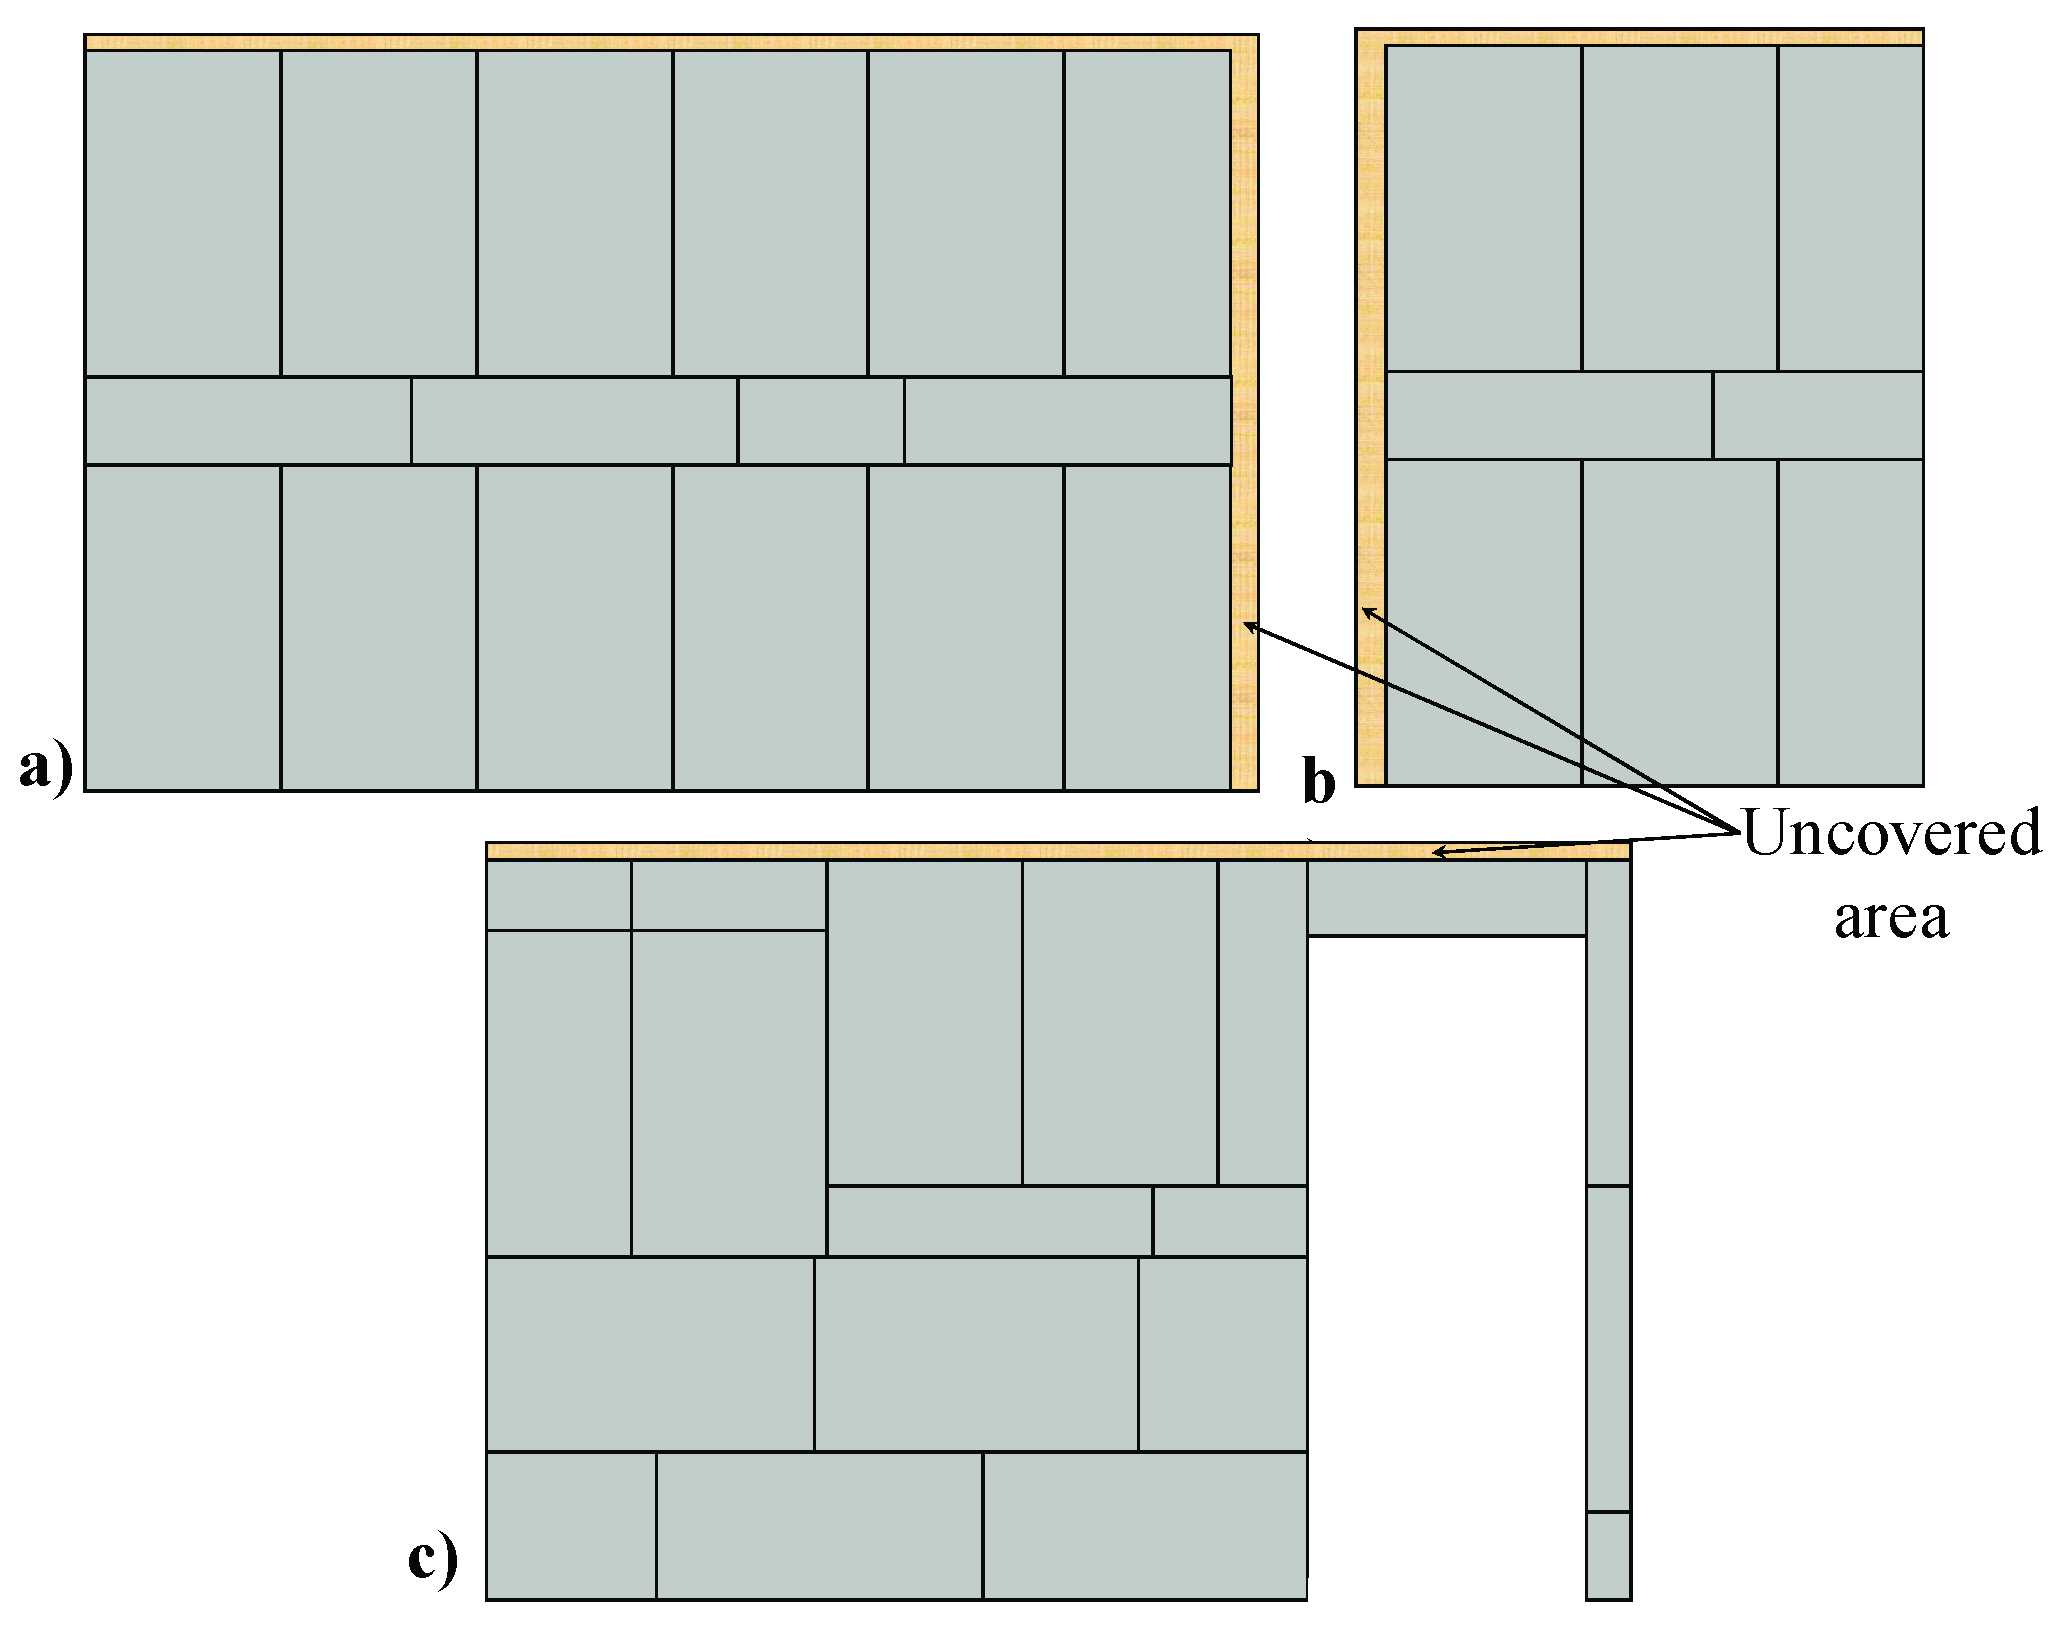
Figure 3.
The junction between the two walls: (a) proper insulation and (b) dimensional inaccuracy.

Figure 4.
Indicative locations of the sensors for (a) central part of the walls and (b) the junctions of the building envelope.
Figure 4.
Indicative locations of the sensors for (a) central part of the walls and (b) the junctions of the building envelope.
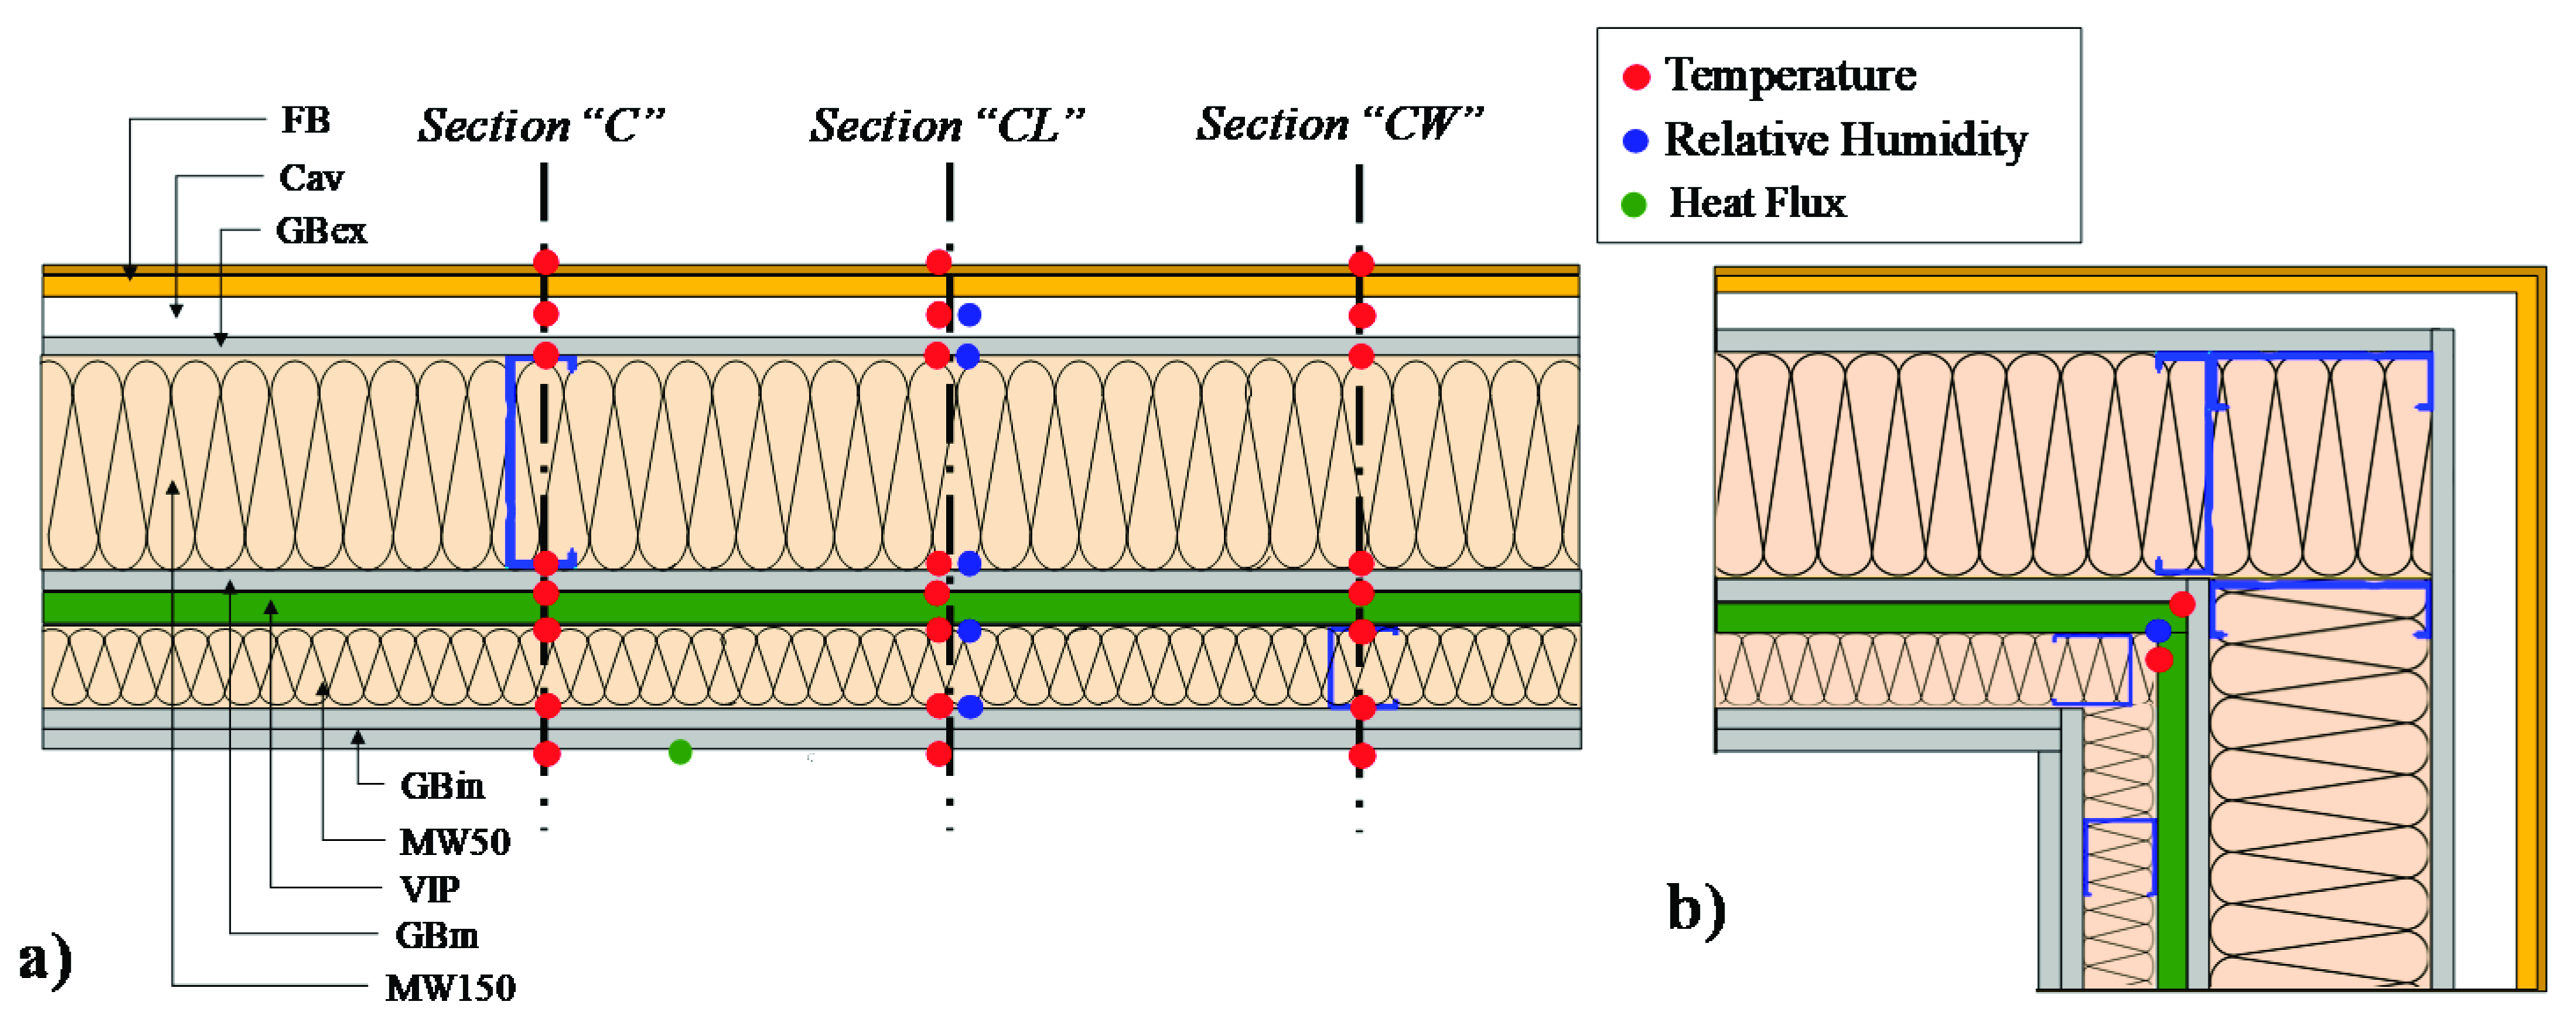
Figure 5.
Contribution of thermal bridges (TB) on the direct heat transfer coefficient, HD.
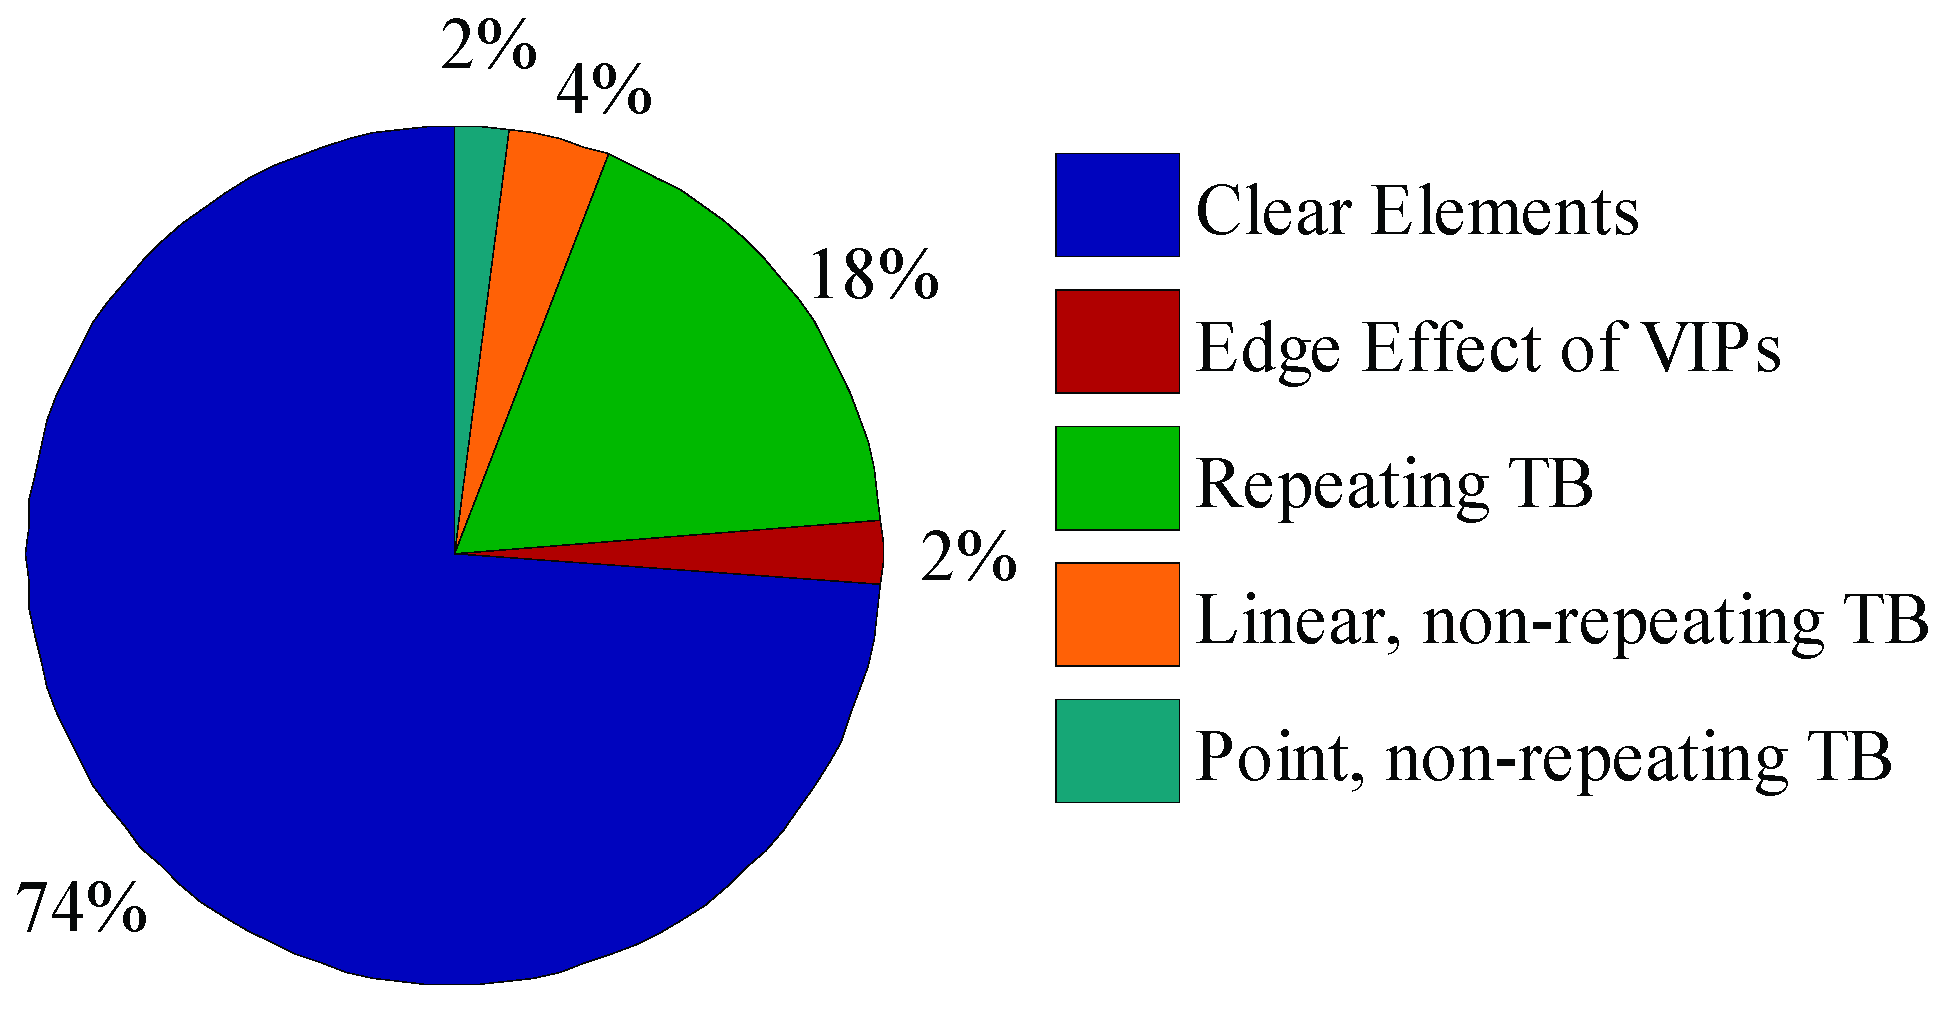
Figure 6.
Infrared (IR) images and temperature measurements during the winter days (maximum temperature differences between the “CW” and “CL” sections) at the internal surface of (a) wall and (b) roof.
Figure 6.
Infrared (IR) images and temperature measurements during the winter days (maximum temperature differences between the “CW” and “CL” sections) at the internal surface of (a) wall and (b) roof.
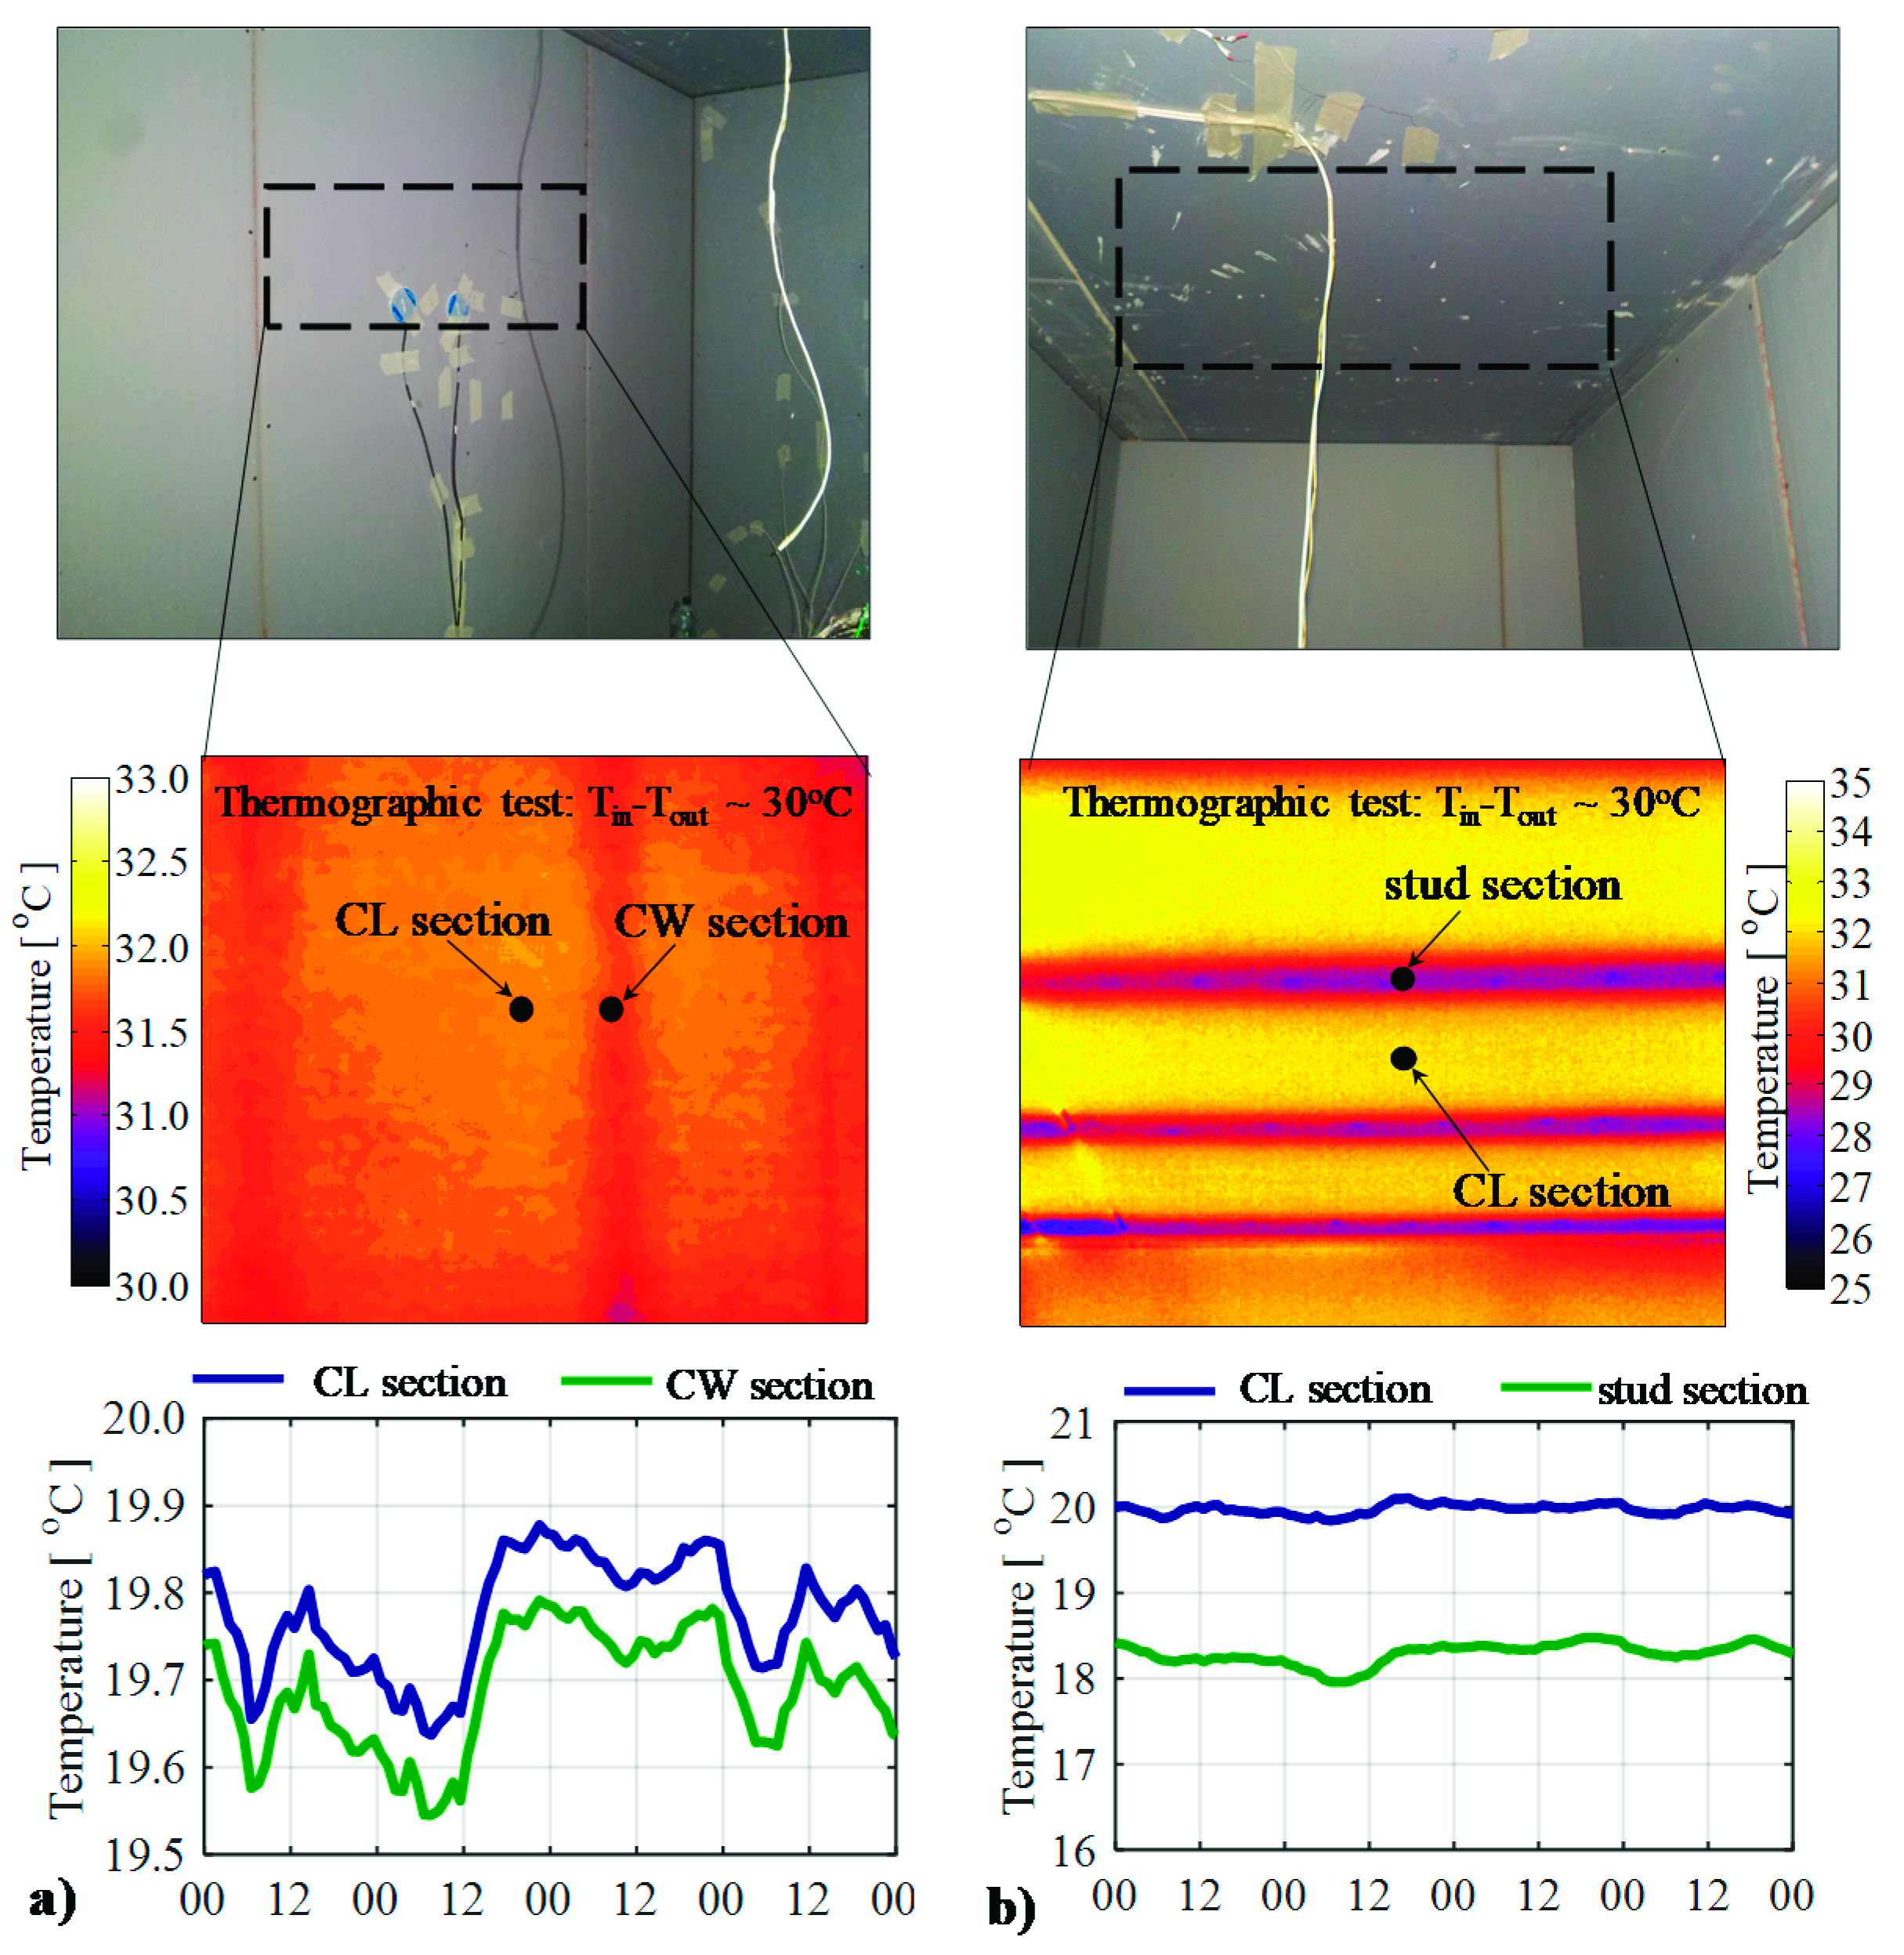
Figure 7.
Junctions covered and not covered with VIPs: (a) Infrared thermography and (b) temperatures at the interface between the internal gypsum board and the 50 mm thick mineral wool (MW50) during winter and summer.
Figure 7.
Junctions covered and not covered with VIPs: (a) Infrared thermography and (b) temperatures at the interface between the internal gypsum board and the 50 mm thick mineral wool (MW50) during winter and summer.
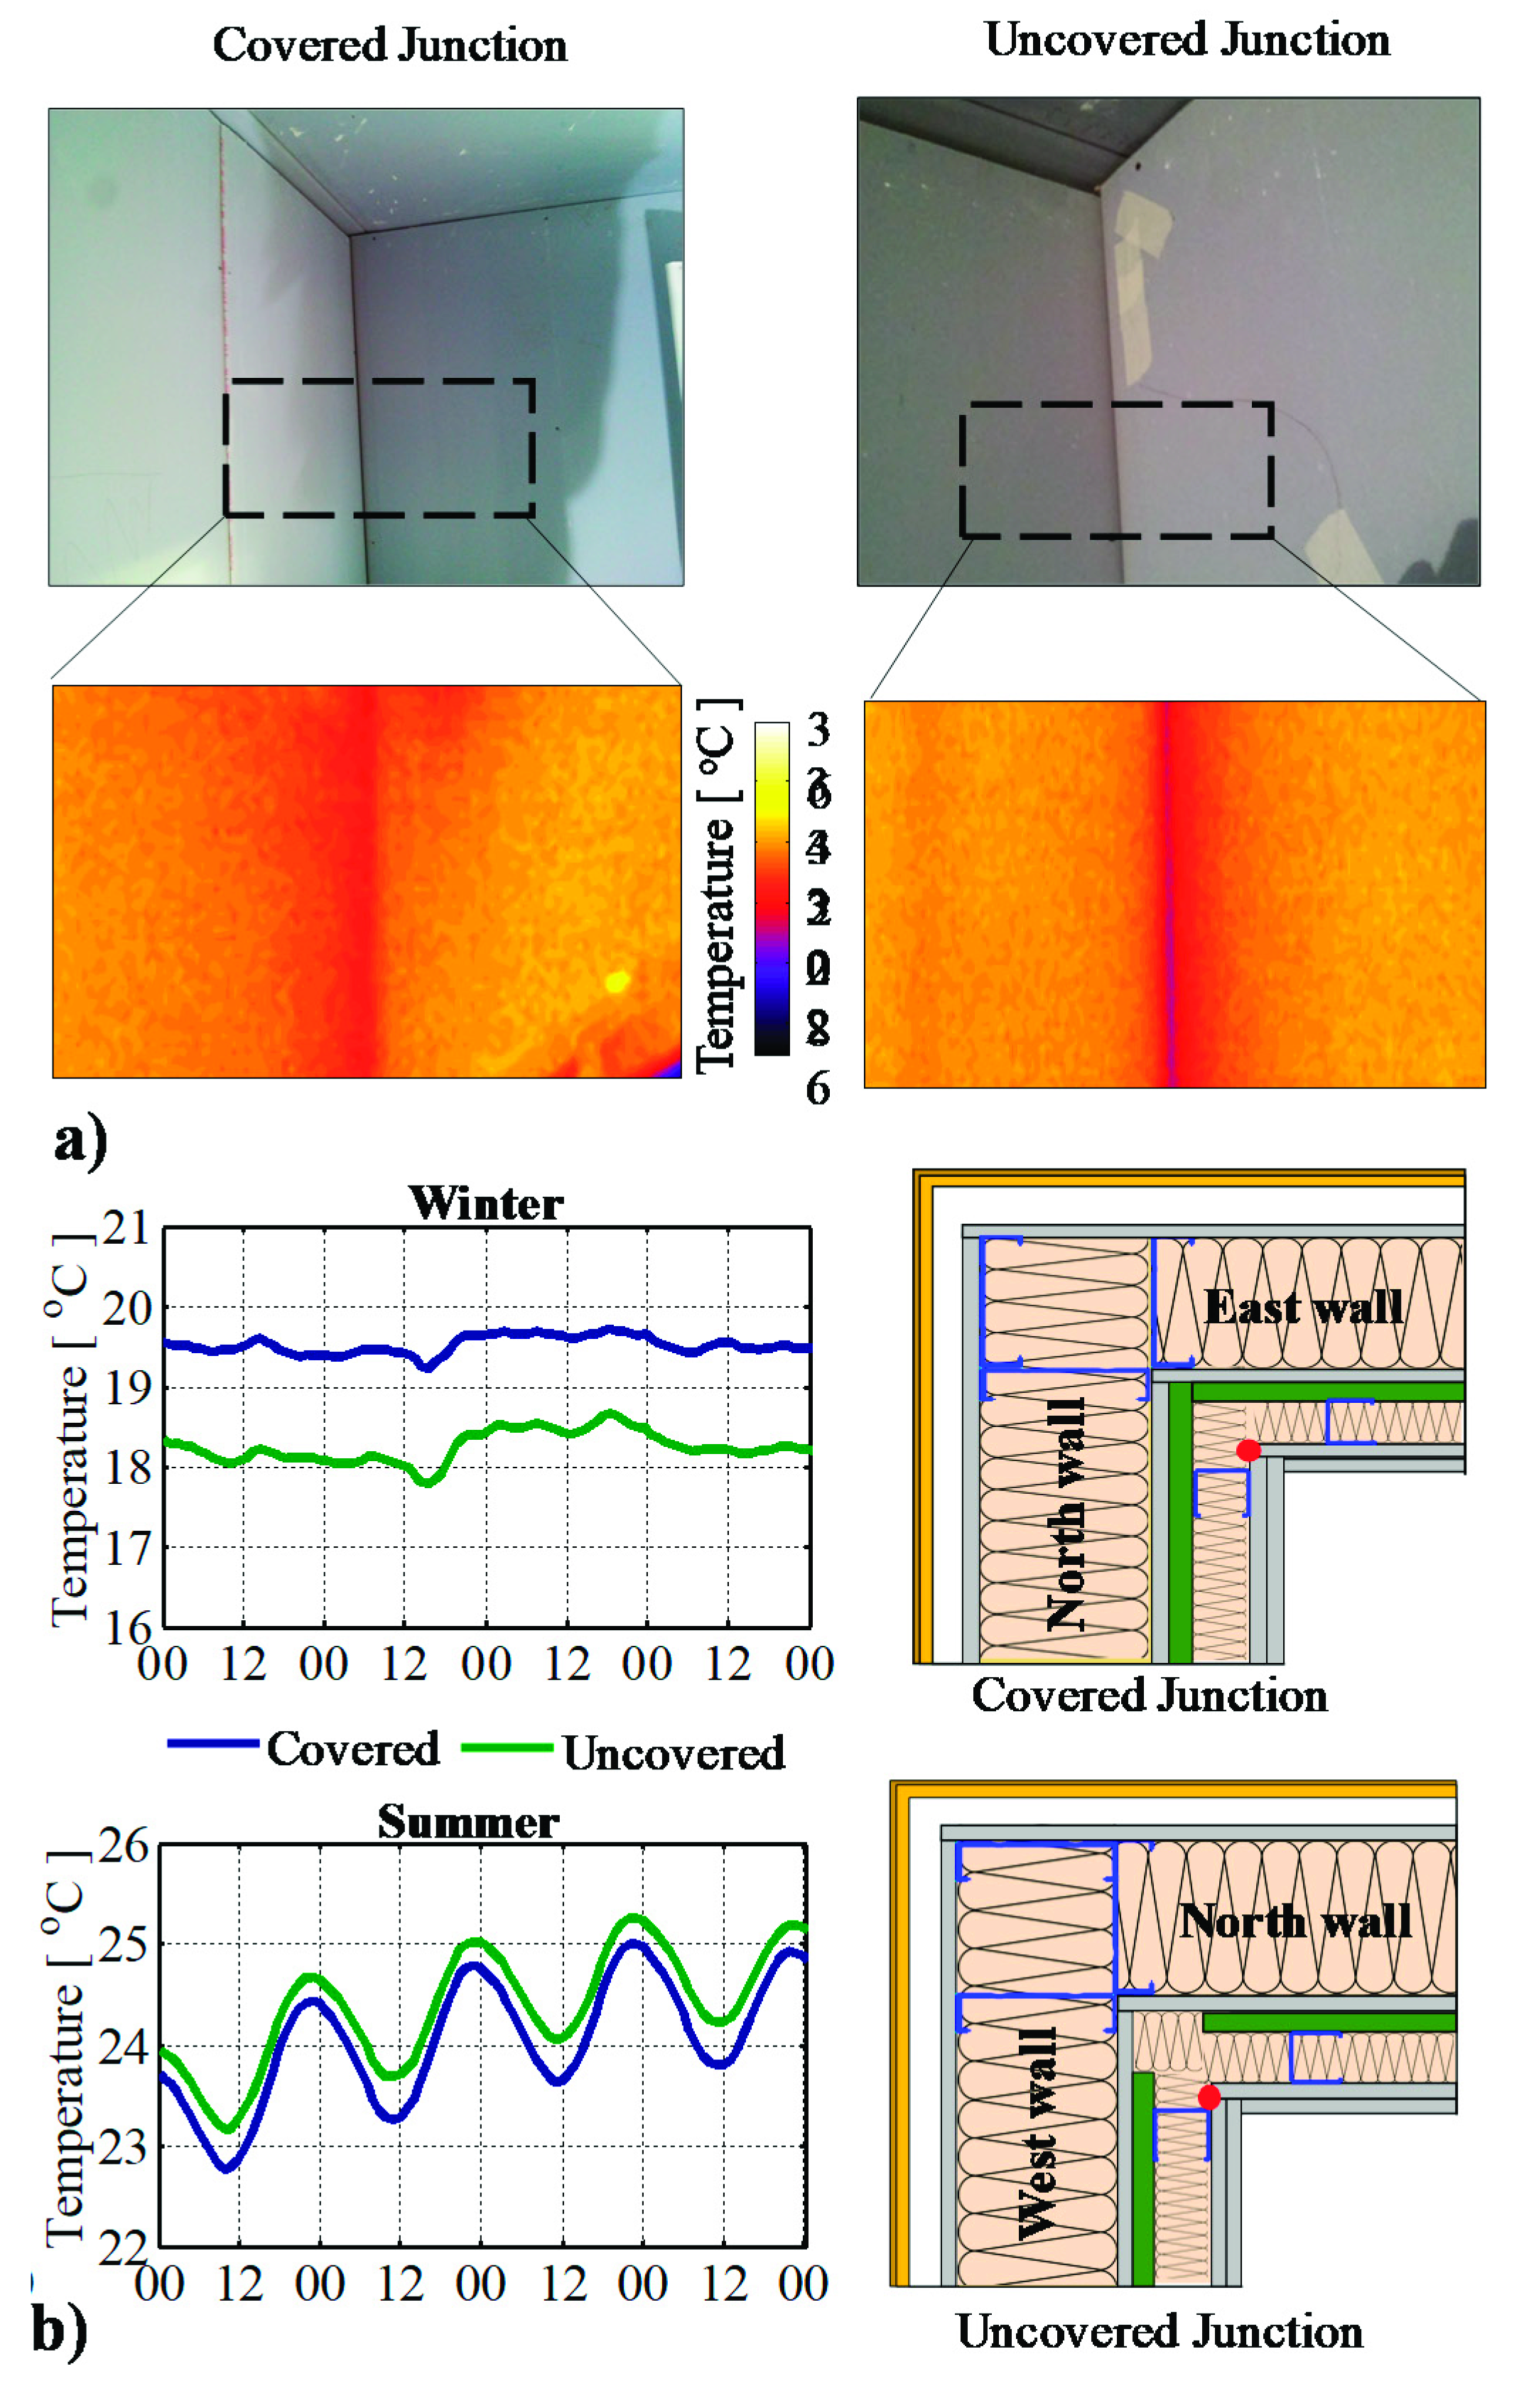
Figure 8.
Temperature factors for the nine regions of the building envelope.

Figure 9.
Identification of the representative points according to the numerical analysis.

Figure 10.
The experimental and the estimated heat load according to the simplified model.

Table 1.
The configuration of the elements of the building envelope.
| Element | Configuration of the Element | No | Materials | Thickness (mm) |
|---|---|---|---|---|
| Walls | 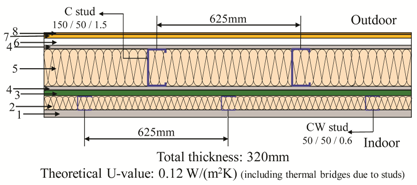 | 1 | Gypsum board | 30 |
| 2 | Mineral wool | 50 | ||
| 3 | VIP | 20 | ||
| 4 | Gypsum board | 15 | ||
| 5 | Mineral wool | 150 | ||
| 6 | Air cavity | 27 | ||
| 7 | Cement board | 12 | ||
| 8 | Finishing mortar | 1 | ||
| Roof |  | 1 | Gypsum board | 15 |
| 2 | Mineral wool | 200 | ||
| 3 | Load panel | 28 | ||
| 4 | EPS | 80 | ||
| 5 | Roof sealing | 4 | ||
| Floor | 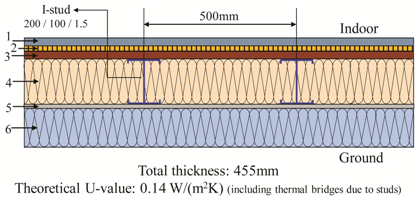 | 1 | Floor | 32 |
| 2 | Sound insulation | 20 | ||
| 3 | Load panel | 28 | ||
| 4 | Mineral wool | 200 | ||
| 5 | Gypsum board | 15 | ||
| 6 | EPS | 160 |
Table 2.
The thermal properties of the materials.
| Materials | Thermal Conductivity (W/(m·K)) | Density (kg/m3) | Specific Heat (J/(kg·K)) |
|---|---|---|---|
| Steel stud | 60.5 | 7854 | 434 |
| Gypsum board | 0.27 1 | 1033 | 990 |
| Mineral wool | 0.035 1 | 23 | 850 |
| VIP | 0.0045 1,2 | 195 | 800 |
| Cement board | 0.35 1 | 1150 | 1000 |
| Finishing mortar | 0.50 | 700 | 1000 |
| Load panel | 0.44 1 | 1500 | 1000 |
| EPS | 0.035 1 | 42 | 1400 |
| Roof sealing | 0.2 | 1000 | 1000 |
| Floor | 0.38 | 1500 | 1000 |
| Sound insulation | 0.07 | 250 | 2100 |
| Door | 0.22 1 | 850 | 900 |
1 measured by means of guarded hot plate; 2 effective thermal conductivity, λeff, of a panel with dimensions 1000 × 600 (mm).
Table 3.
Effective thermal conductivity and linear thermal transmittance values obtained by the guarded hot plate method.
Table 3.
Effective thermal conductivity and linear thermal transmittance values obtained by the guarded hot plate method.
| Temperature | λcop (W/(m·K)) | ΨVIP (W/(m·K)) | λeff (W/(m·K)) |
|---|---|---|---|
| T = 10 °C | 0.00375 | 0.00618 | 0.00444 |
| T = 23 °C | 0.00392 | 0.00616 | 0.00461 |
Table 4.
Effective thermal conductivity of the VIP layers for the four walls, taking into account the pattern of the VIPs.
Table 4.
Effective thermal conductivity of the VIP layers for the four walls, taking into account the pattern of the VIPs.
| Wall | λeff (W/(m·K)) |
|---|---|
| North | 0.0046 |
| West | 0.0046 |
| South | 0.0047 |
| East | 0.0046 |
Table 5.
The equivalent thermal transmittance and the impact of thermal bridges for each envelope element.
Table 5.
The equivalent thermal transmittance and the impact of thermal bridges for each envelope element.
| Envelope Element | A (m2) | Uclear (W/(m2·K)) | Urepeating (W/(m2·K)) | U2D_geometrical (W/(m2·K)) | U3D_geometrical (W/(m2·K)) | Ueq (W/(m2·K)) |
|---|---|---|---|---|---|---|
| North wall | 13.00 | 0.093 | 0.017 (17.0%) | −0.005 (−4.8%) | −0.003 (−3.1%) | 0.10 |
| West wall | 7.06 | 0.093 | 0.013 (13.8%) | −0.004 (−4.0%) | −0.006 (−6.1%) | 0.10 |
| South wall | 11.28 | 0.095 | 0.019 (12.1%) | 0.019 (12.1%) | 0.023 (14.8%) | 0.16 |
| East wall | 7.06 | 0.093 | 0.013 (13.8%) | −0.004 (−4.0%) | −0.006 (−6.1%) | 0.010 |
| Roof | 8.66 | 0.121 | 0.135 (50.9%) | 0.012 (4.6%) | −0.003 (−1.0%) | 0.27 |
| Floor | 8.66 | 0.091 | 0.052 (37.5%) | 0.002 (1.5%) | −0.007 (−5.0%) | 0.14 |
| Door | 1.72 | 2.407 | 0 (0%) | 0.160 (5.9%) | 0.116 (4.3%) | 2.68 |
Table 6.
Experimental Uoverall for the north wall of the building envelope.
| Period of Measurement | U-Value (W/(m2·K)) | |
|---|---|---|
| Experimental U-value | Winter | 0.117 |
| Spring | 0.117 | |
| Summer | 0.118 | |
| Autumn | 0.116 | |
| Average | 0.12 ± 0.02 | |
| Theoretical U-value | 0.11 | |
| Difference | 5.9% | |
© 2019 by the authors. Licensee MDPI, Basel, Switzerland. This article is an open access article distributed under the terms and conditions of the Creative Commons Attribution (CC BY) license (http://creativecommons.org/licenses/by/4.0/).
Share and Cite
MDPI and ACS Style
Atsonios, I.; Mandilaras, I.; Founti, M. Thermal Assessment of a Novel Drywall System Insulated with VIPs. Energies 2019, 12, 2373. https://doi.org/10.3390/en12122373
AMA Style
Atsonios I, Mandilaras I, Founti M. Thermal Assessment of a Novel Drywall System Insulated with VIPs. Energies. 2019; 12(12):2373. https://doi.org/10.3390/en12122373
Chicago/Turabian StyleAtsonios, Ioannis, Ioannis Mandilaras, and Maria Founti. 2019. "Thermal Assessment of a Novel Drywall System Insulated with VIPs" Energies 12, no. 12: 2373. https://doi.org/10.3390/en12122373
Note that from the first issue of 2016, this journal uses article numbers instead of page numbers. See further details here.