Article

Thermal Transformation of Carbon and Oxygen-Containing Organic Compounds in Sewage Sludge During Pyrolysis Treatment

1
Institute of Energy and Power Engineering, Zhejiang University of Technology, Liuhe Road 288#, HangZhou 310023, China
2
School of Environmental Science and Engineering, Tianjin University, Yaguan Road 135#, Jinnan District, Tianjin 300392, China
*
Author to whom correspondence should be addressed.
Energies 2019, 12(12), 2258; https://doi.org/10.3390/en12122258
Submission received: 7 May 2019 / Revised: 10 June 2019 / Accepted: 10 June 2019 / Published: 13 June 2019
(This article belongs to the Section B: Energy and Environment)

Abstract

:
Organic carbon (C) and oxygen (O) contained in sewage sludge strongly impact its thermal behavior during pyrolysis treatment. This study was aimed at getting an insight into the decomposition mechanism of organic compounds containing C and O during sludge pyrolysis using thermo-gravimetric Fourier transform infrared spectroscopy (TG-FTIR) and pyrolysis-gas-chromatography/mass spectrometry (Py-GC/MS) and helpfully improving energy conversion of sewage sludge. The temperature domains of transformation were determined and indications of the main compounds produced during each stage were obtained. Results showed that the volatile compounds that evolved after sludge pyrolysis were mainly distributed into six groups: alkenes, aromatic hydrocarbons, alcohols, aldehydes, phenols and carboxylic acids. Comparison in thermal behavior and composition of the evolved volatile compounds were observed. In the low temperature stage (<350 °C), compounds containing O–C=O accounted for the highest proportion in the evolved gas (55%). Over 350 °C, the production of C=C, –OH, and –C6H5 compounds gradually increased; but little was found of compounds containing O–C=O. Above 550 °C, as thermal chemical reaction involving oxygen-containing groups enhanced, compounds containing O–C=O and –OH tended to disappear, and an increasing amount of macromolecular polycyclic aromatic hydrocarbon was formed. Finally, the thermal transformation pathways of the oxygen and carbon-containing compounds were proposed.

Graphical Abstract

1. Introduction

The growing number of municipal wastewater treatment plants in China are producing ever-increasing amounts of wastewater sewage sludge as a byproduct. It is reported that the annual generation of wet sewage sludge in China was about 40.9 million tons in 2017, with a growth rate of 8-10% per-year [1]. To deal with the huge amount of sludge, its reutilization in an environmentally friendly way is increasingly becoming an urgent issue [2,3,4]. By weight, sewage sludge contains approximately 50% organic content; with the main components being hemicelluloses, cellulose, lignin, lipids, and protein. This gives sewage sludge an interesting potential to be used as a biomass resource to be converted to energy.
Pyrolysis has been attracting increasing worldwide attention due to its economic and environmentally acceptable method of sewage sludge disposal. It has large potential for the disposal of sewage sludge since it provides up to 50% reduction of sludge volume, stabilization of the organic matters [5]; and the generation of bio-char [6], bio-gas and valuable chemical feedstocks from the produced bio-oil [7,8,9].
During the last decade, the study of the pyrolysis mechanism of sewage sludge has attracted a lot of attention, with some research proposing the use of combined analyzing technologies. The complex chemical composition of sewage sludge caused significant difficulties in understanding its transformation mechanism, due to the thermal degradation of various organic compounds which often occurred concurrently or consecutively [10,11,12,13,14]. To explain in depth the pyrolysis mechanism of different organic components in sludge, pathways for thermal transformation of main organic compounds need to be formulized. Shen et al. characterized the thermo-gravimetric (TG) behavior and product yields of sludge pyrolysis under a five-temperature range using a TG analyzer coupled with Fourier transform infrared spectroscopy (FTIR) [10]. Zhou et al. focused their study on studying the key intermediates by investigating the evolution of nitrogen-containing compounds in the char, tar, and gas products using pyrolysis-gas-chromatography/mass spectrometry (Py-GC/MS) and pyrolyzer-Fourier transform infrared spectrometry (Py-FTIR) [15]. Tian et al. investigated nitrogen distribution and the evolution of nitrogen-containing functional groups in bio-oil, char and gas fractions from the pyrolysis of sludge [16]. Zhang et al. reported the release and formation of H2S during sludge pyrolysis [17]. Recent reoports on the pyrolysis of sludge mainly focused on the improvement of bio-oil and bio-char, which could provide helpful information for the utilization of the pyrolysis products. However, little investigation into the transformation behaviors of organic components has been done, especially for organic carbon and oxygen species.
The organic carbon and oxygen in sludge exist mainly in the form of hydroxyl (–OH), carbon-carbon bond (C–C), hydrocarbon bond (C–H), carbonyl (C=O), carboxyl (O–C=O), and other chemical groups (such as –CH3, –CH2 and C–Har). These compounds undergo complex thermal-chemical reaction during the pyrolysis process, often resulting in the generation of valuable and/or hazardous products. Hence, understanding the migration of the main organic constituents in the pyrolysis process is not only important for effective utilization of sludge; but also for controlling the generation of harmful gases and reducing the risk of environmental pollution.
The motivation of this investigation is, therefore, to better understand the thermal transformation of carbon and oxygen-containing organic compounds and deeply explain pyrolysis behaviors during conventional pyrolysis of sludge. The results confirmed the main oxygen-containing chemical groups in sludge and their decomposition characteristics at different temperatures. Organic compound distributions in the evolved gas fractions shown in figures confirmed a clear understanding of the properties and formation mechanism of the pyrolytic products.
The novelty of the present problems is the analysis into generation and transformation behaviors of the main carbon and oxygen-containing compounds during sewage sludge pyrolysis. This type of work has not been reported previously in the open literature. Another important aspect is the proposal of the transformation pathways of relevant reaction routes for carbon and oxygen-containing compounds in sludge pyrolysis process.

2. Materials and Methods

2.1. Materials

Sewage sludge was collected from a Hangzhou municipal wastewater treatment plant after mechanical dehydration using a filter press. The sludge was firstly dried in the open air for two days to remove moisture content, and then in a lab-scale air convection oven at 105 °C for 36 h. The dried sludge cakes were ground in a milling machine to provide feed samples smaller than 60 μm in diameter for lab-analyses. The resulting sludge samples were then kept in an airtight container to prevent re-absorption of moisture prior to experimentation.
Proximate and ultimate analysis results of the sludge on air dried basis are shown in Table 1. The volatile matter content (Vad), amount of ash (Aad), and moisture content (Mad) were measured according to the ISO 11722(1999) [18]. The fixed carbon content (FCad) was calculated on the basis of mass balance. Carbon content (C) and hydrogen content (H) values were measured according to the ISO 625(1996) [19]. Nitrogen content (N) was measured according to ISO/TS 11725(2002) [20], the Chinese standard for determination of nitrogen in fuel. The content of sulfur (S) was determined according to ISO 351(1996) [21], the standard for determination of total sulfur in coal. Amount of oxygen (O) was determined by difference based on the dry ash free basis. The net calorific value (H) was calculated based on the standard ISO 1928(1995) [22].

2.2. Thermo-Gravimetric Fourier Transform Infrared (TG-FTIR) Spectroscopy

To better understand the pyrolysis behavior of organic compounds containing carbon and oxygen, TG-FTIR experiments of sewage sludge were performed using a Diamond Thermogravimetric Analysis and Differential Thermal Analysis (TG/DTA) (PerkinElmer, US) coupled with Fourier transform infrared measurements (Nicolet 6700, US). The experimental conditions selected in this study were based on some previous literatures [23,24]. Temperature precision of the TG was ±0.5 °C with a microbalance sensitivity of ±0.1 μg. Pure N2 was used as the agent gas, with a 20 mL (STP)/min flow rate. Sample weight was determined to be 10 ± 0.5 mg to minimize heating transfer limitations.
In our pyrolysis experiments, each sample was heated from 25 °C to 850 °C with a 15 °C/min heating rate. The volatiles released during this process were detected online by FTIR spectrometer, with the ability to record spectra in the range of 4000 to 400 cm−1. FTIR analysis was carried out with 4 cm−1 resolution and 8 scans per sampling, starting when the sample temperature reached 100 °C. The transfer line and detector were kept at a constant temperature of 225 °C to prevent condensation. To eliminate background noise, blank tests were done before runs using samples. Interpretation of FTIR spectra was made by comparing the results to the National Institute of Standards and Technology (NIST) atomic spectra database.

2.3. X-ray photoelectron spectroscopy (XPS) Analysis

Surface elemental composition and chemical species of the dried sewage sludge were characterized by XPS. XPS analysis was carried out using a VG Scientific ESCALab220i-XL spectrometer of SHIMADZU-KRATOS Japan, equipped with an Al Ka monochromator X-ray source. The C1s peak at 284.6 eV was used as binding energy (BE) reference. Quantitative analysis of relative contents of organic groups is based on the linear correlation of signal intensity and element content.

2.4. Pyrolysis-Gas-Chromatography/Mass Spectrometry (Py-GC/MS) Technology

Py-GC/MS experiments were performed to investigate the distribution of organic products from sludge pyrolysis. The experimental conditions selected in this study were based on some previous literatures [15,23,24]. A CDS Pyroprobe 5000 HP pyrolyser connected to a gas chromatography/mass spectrometry (Agilent Technologies 5977A MSD) was employed to conduct these tests. All of the samples were weighed at 1 ± 0.1 mg. Pyrolysis was carried out at 250 °C, 350 °C, 550 °C, 650 °C, 750 °C, and 850 °C. The temperatures of oven and transfer line were both maintained at 300 °C. The temperature of the GC setup equipped with a HP-5MScapillary column (30 m × 0.25 mm × 0.25 μm) and its interface was held at 300 °C. The GC oven temperature was first set at 50 °C for a duration of 2.25 min. After that, the oven was heated at a rate of 15 °C/min until it reached 300 °C. Finally, the GC oven temperature was kept on 300 °C for 10 min. Pure nitrogen was used as agent gas of GC/MS with a flow rate of 1.1 mL (STP)/min and a 1:20 split ratio. Mass spectra detection covered the range of 35–500 amu. The compounds were determined by comparing the spectral reading to the NIST database library. All of the experiments mentioned above including the ultimate analysis, the proximate analysis, the yield of the resulted bio-oil, TG-FTIR analysis, and Py-GC/MS analysis were performed at least twice to ensure the repeatability of the results.

3. Results and Discussion

3.1. Distribution of Organic Carbon and Oxygen-Containing Groups in Sewage Sludge

Figure 1 shows the results from the scanning of sewage sludge by XPS analysis. It was found that the most abundant elements on the surface of sludge were C and O. Small amounts of N, Si and Al were also detected. In this study, semi-quantitative analysis was done on the basis of total content of C, O, N, Si and Al. H element was excluded from the analysis. Presence of the C1s and O1s peaks also indicated that the sludge samples contained considerable organic carbon and oxygen-containing chemical groups.
According to the results obtained by resolving overlapping peak and some previous reports [25,26,27,28], the C1s spectrum could be broken down into four peaks, as shown in Figure 2a. The electronic binding energies of the C1s spectrum was concentrated between 282 and 292 eV; indicating that the detectable organic carbon-containing chemical groups included C–C, C–O, C=O and O–C=O. The large peak at 285.0 eV belonged to C-C bond, and its proportion was 69.33%. of the total area. The C–O bond also was one of the main carbon-containing groups, and its proportion is 19.81% of total area. The peak of 287.6 eV belonged to the C=O bond with an area proportion of 6.62%. This type of bond might belong to compounds such as aldehydes, ketones, esters, carboxylic acids, and carboxylic acid derivatives. The small peak at 289.0 eV belonged to the O–C=O bond, with the lowest area proportion, at only 4.24%.
Oxygen is the second most plentiful element in sludge, after carbon. The study of oxygen-containing chemical groups is also essential to better understand the thermochemical conversion during sludge pyrolysis. Figure 2b shows the fitting results of O1s spectrum. Oxygen-containing groups can be fitted into four kinds of functional groups: inorganic oxygen such as Al2O3/SiO2 (530.4 eV); organic oxygen such C–O (531.4 eV) in alcohols and ethers; C=O (532.8 eV) in aldehydes, ketones and esters; and O–C=O (533.7 eV). C–O was the main species of organic oxygen in sludge, with an area proportion of 56.92%. The area proportions of C=O and O–C=O were 22.63% and 16.44%, respectively. Inorganic oxygen content had the least proportion, at only 4% area.

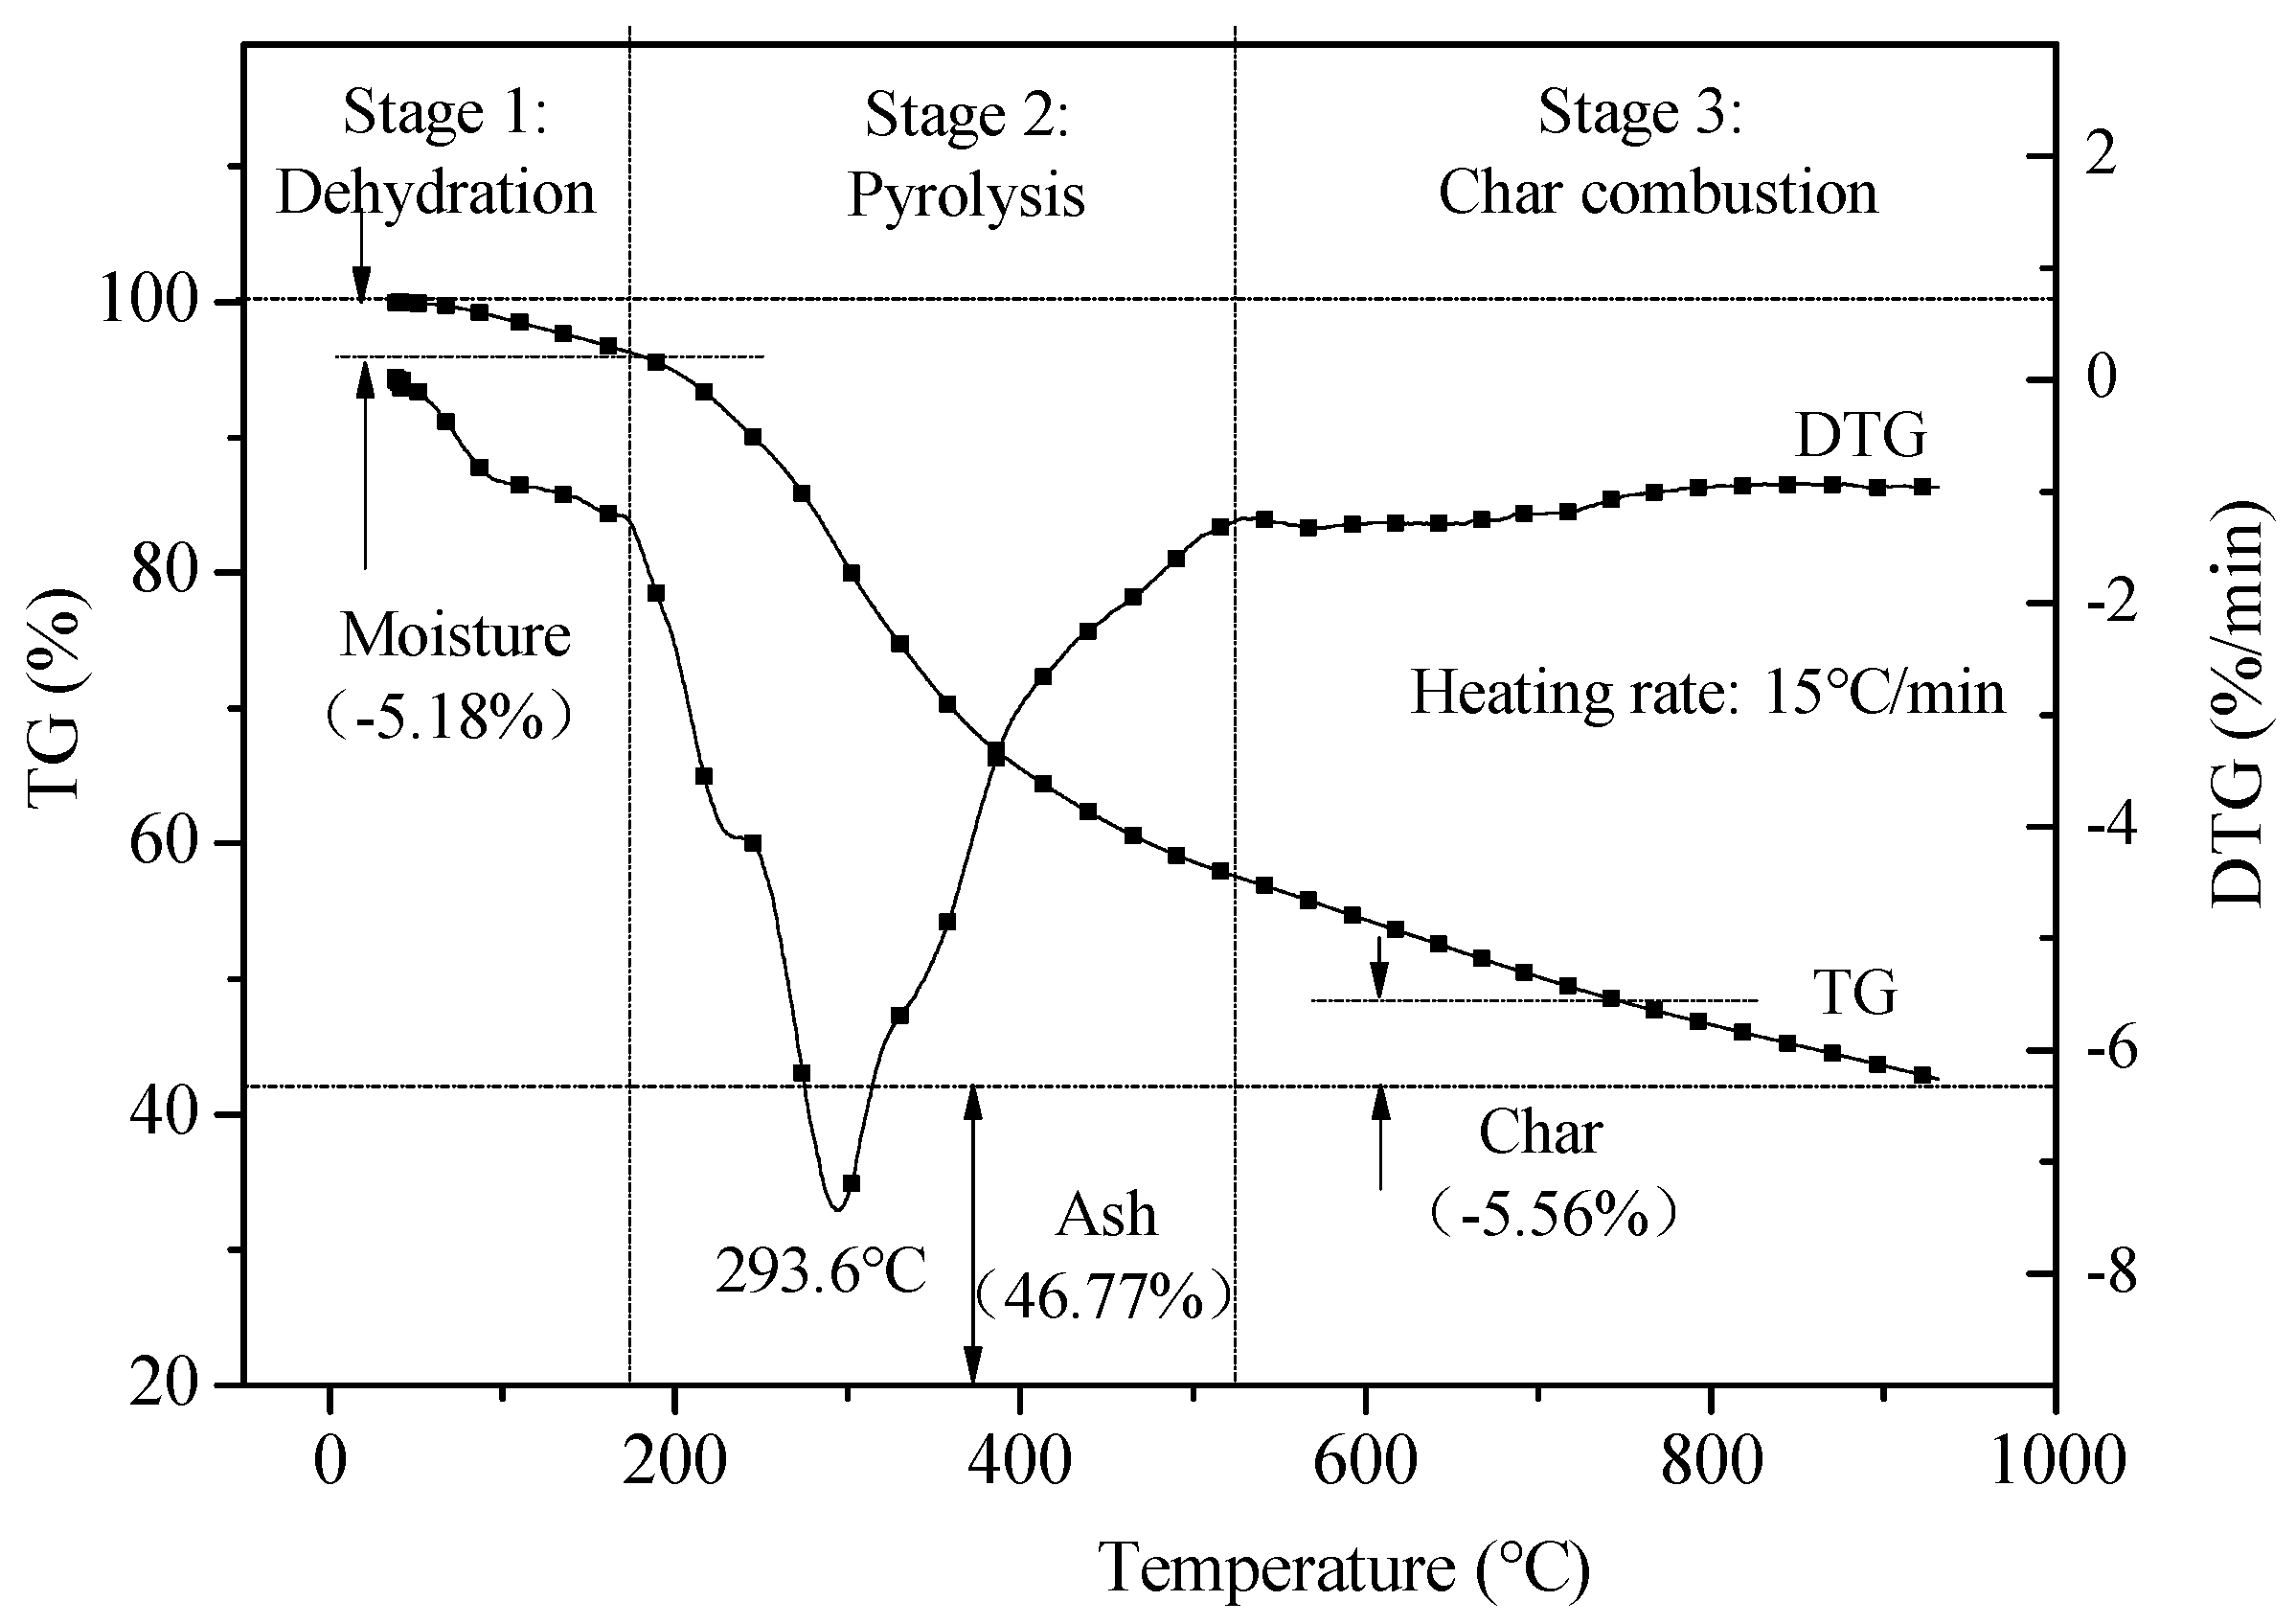
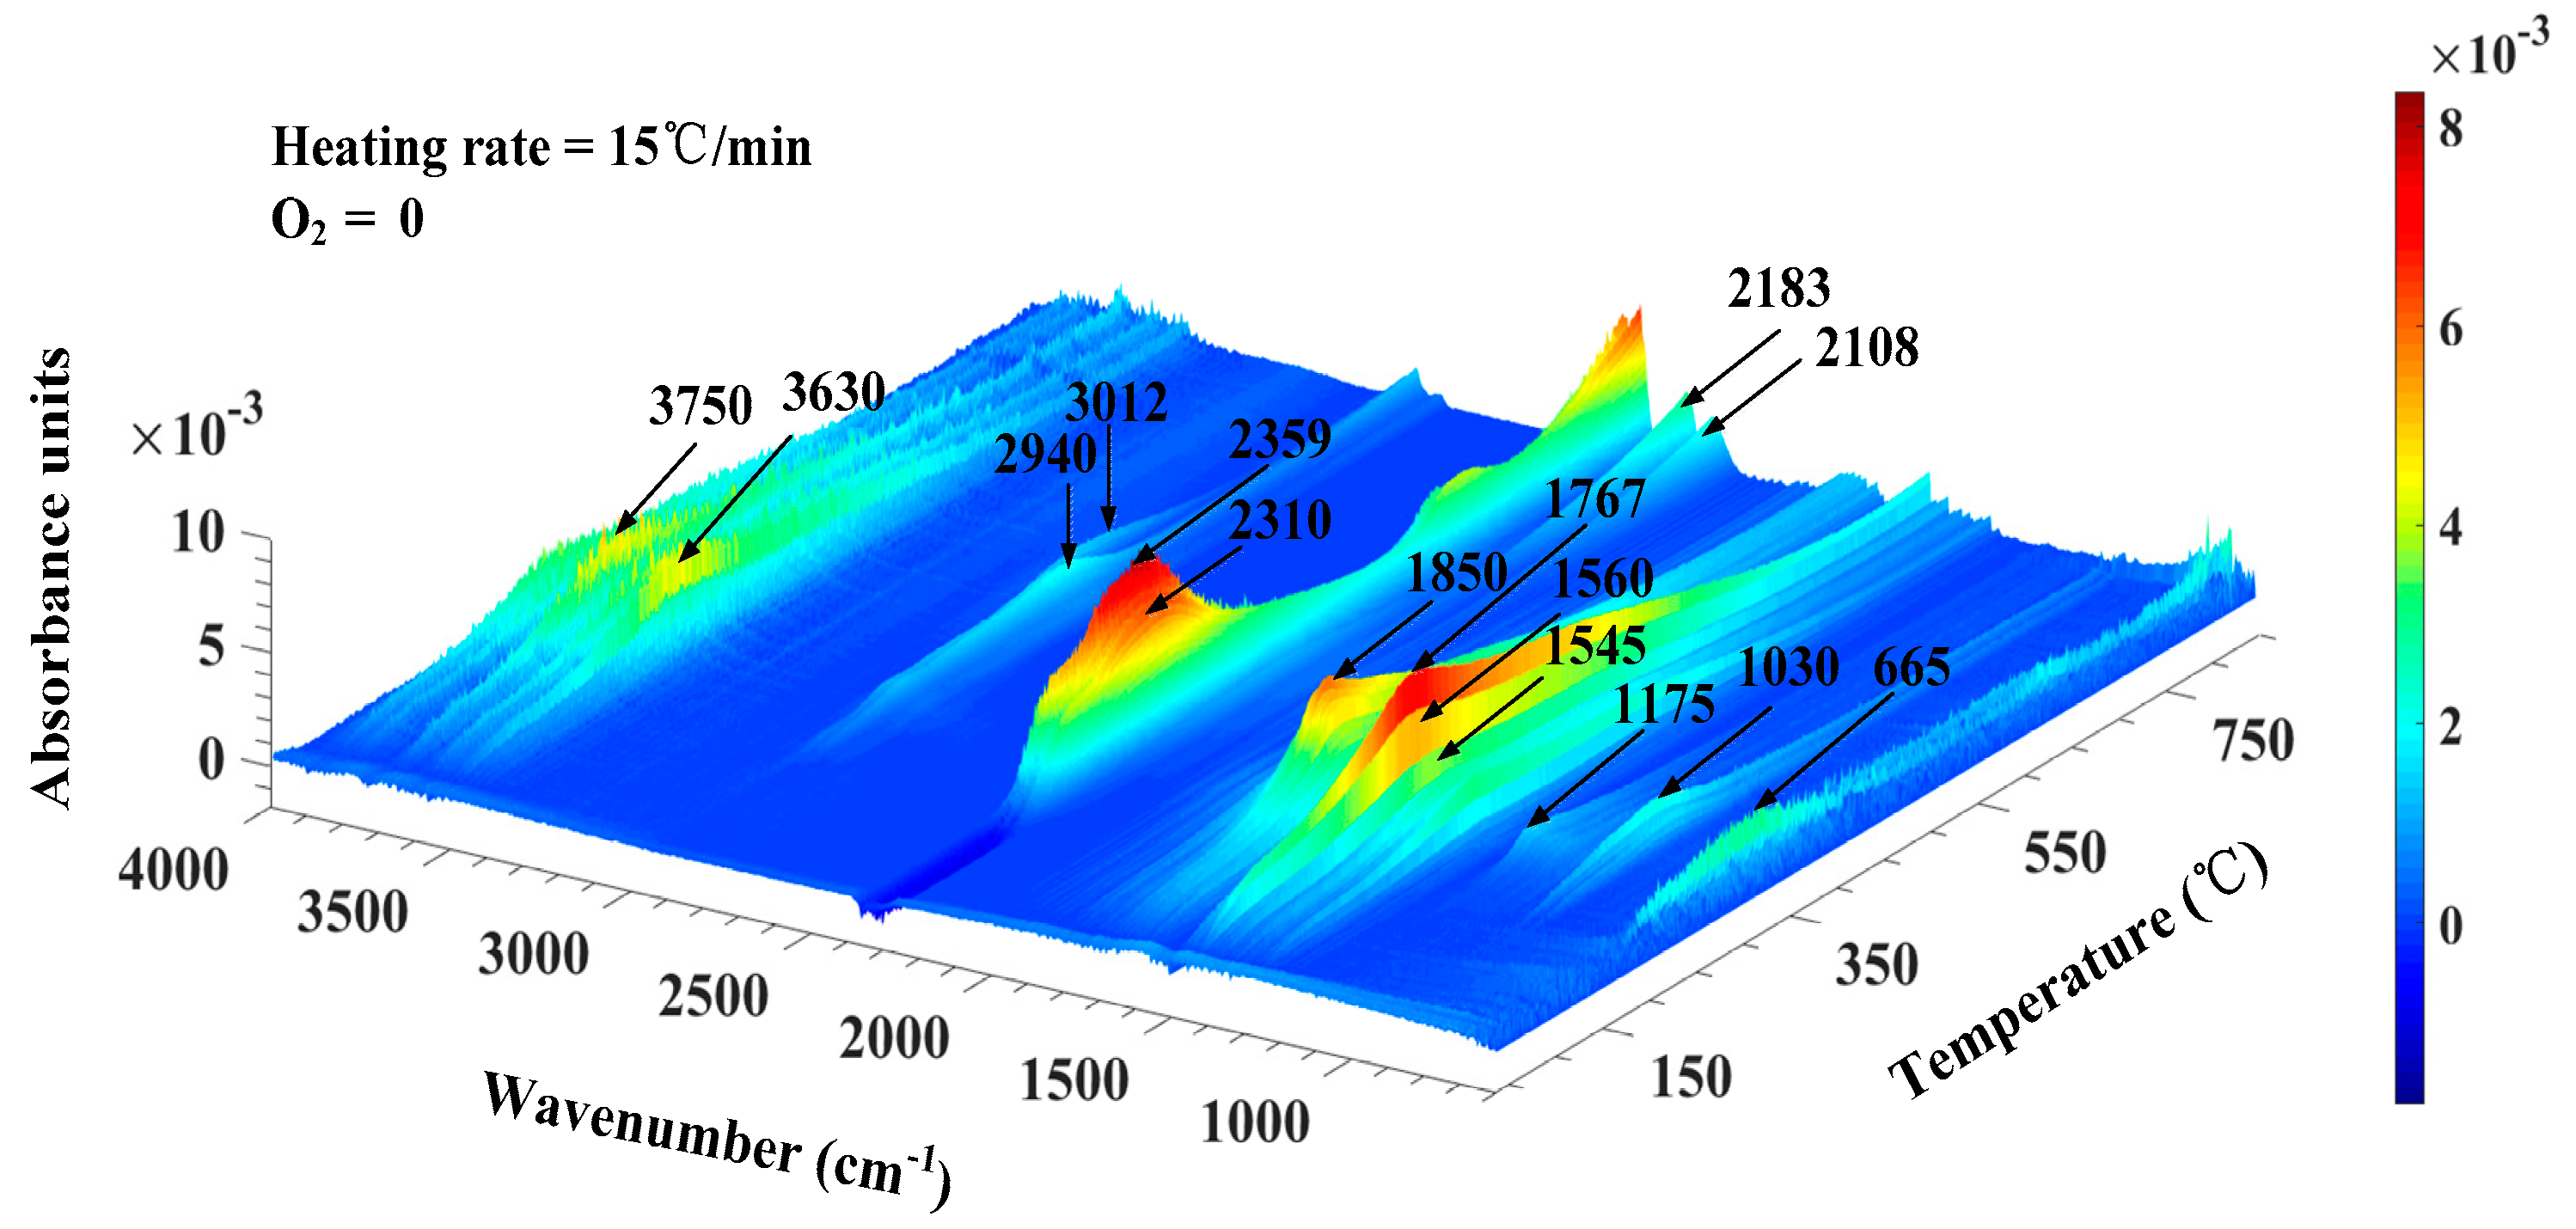
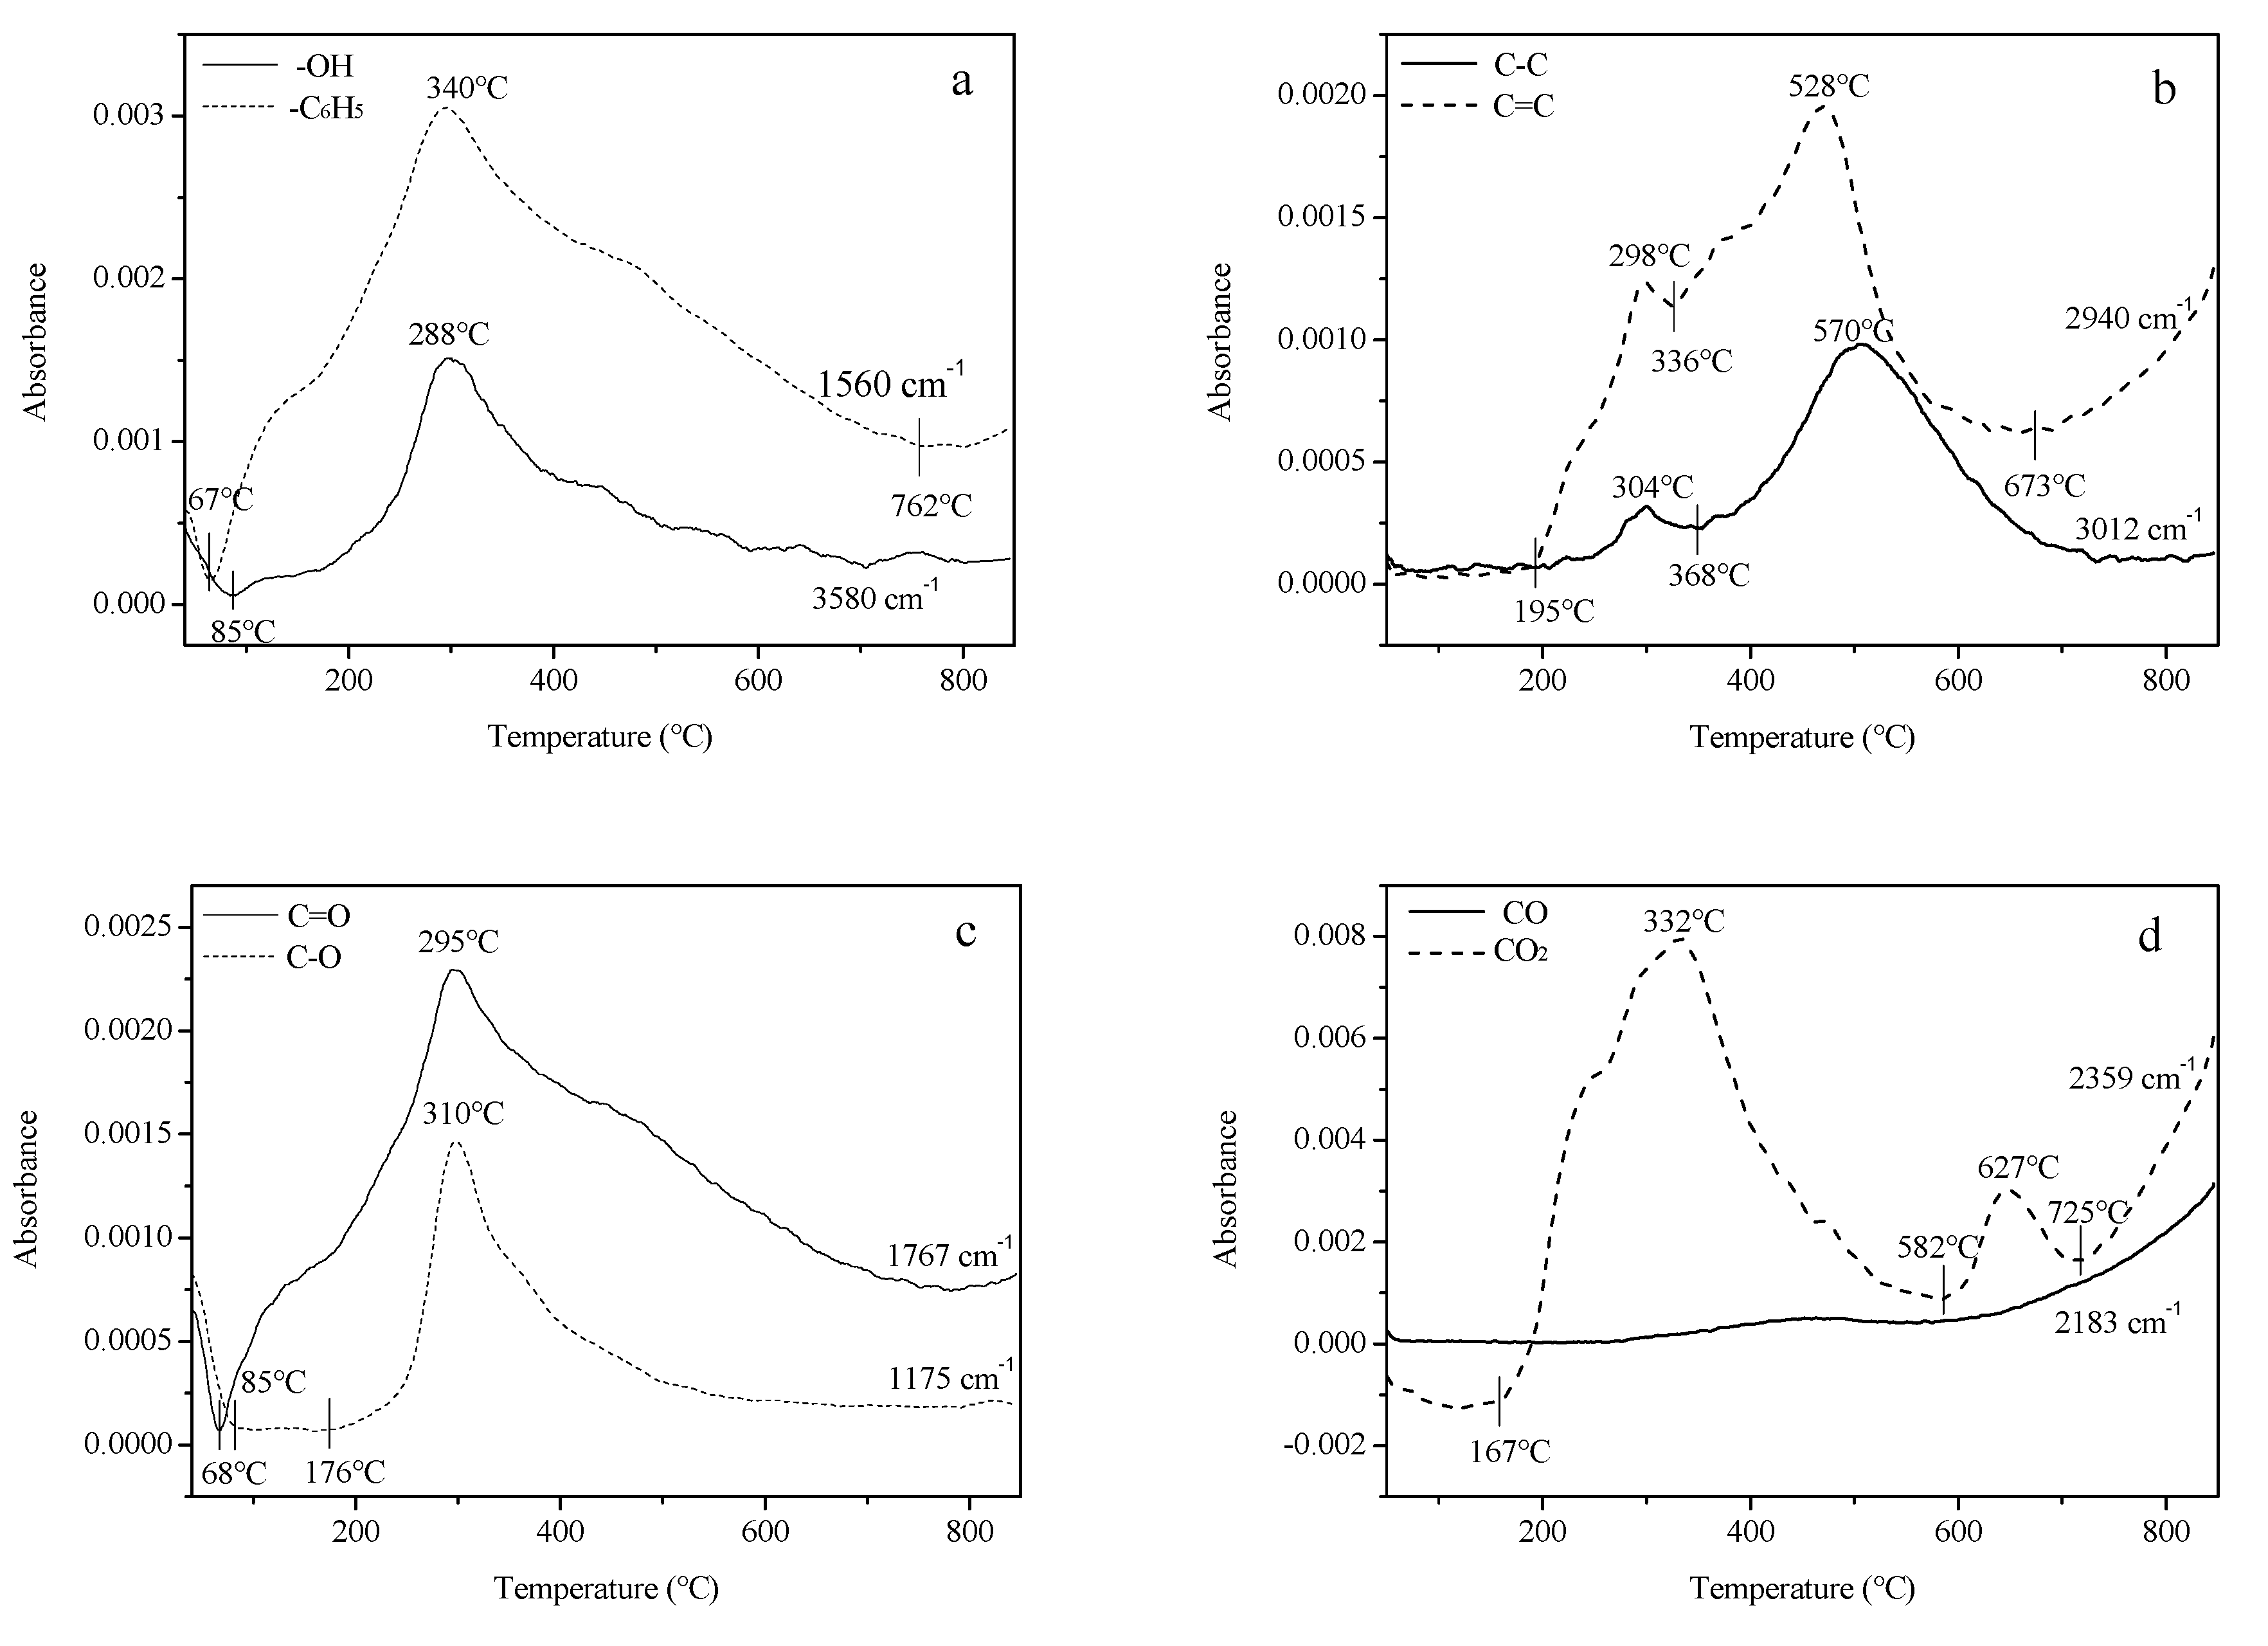
3.2. Thermo-Gravimetric Fourier Transform Infrared Spectroscopy (TG-FTIR) Analysis

TG-FTIR was used for online detection of the gas-phase products that occurred during sludge pyrolysis. Figure 3 showed that the TG and DTG profiles. From the TG curves, a plateau could be observed before 200 °C. The weight of sewage sludge decreases sharply between 200 °C and 300 °C. After 300 °C, the loss rate of weight tends to decrease up until at 500 °C. The splitting of the DTG curves is supposed to be due to the decomposition of organic matter. The decomposition of the sludge sample can, therefore, be divided into three stages The first stage below 200 °C resulted in about 5.18% weight loss from moisture evaporation and dehydration process. The sludge started to decompose at about 200 °C and the process continued in a wide temperature range. The second stage from 200 to 500 °C was the main decomposition stage with a 46.77% weight loss due to severe decomposition of organic structure. The third stage above 500 °C mainly saw the carbonization process that resulted in a 5.56% weigh loss.
The 3D infrared spectrum of the volatiles presented in Figure 4 shows the relationship between wave number, absorbance, and temperature. It was found that a non-conspicuous absorption peak appeared at the range of 3800–3500 cm−1, which was caused by the stretching vibration of –OH, indicating the presence of a small amount of H2O. Adsorption peak at the range of 3012–2940 cm−1 was related to C–C and C=C antisymmetric stretching vibration, indicating that a small number of aliphatic hydrocarbons were thermally released. The C=O stretching absorbance peaks appearing in 1900–1750 cm−1 were representative of carbonyls, including aldehyde, ketone and carboxylic acids compounds [29]. Skeleton C=C vibration absorption peaks of benzene rings was detected at the range of 1600–1440 cm−1, indicating that various forms of benzene compounds exist in the sludge. The absorption peaks of C–O occurred around 1175 cm−1, while the stronger absorption peaks near 1030 cm−1 resulted from the overlap of C–O and C–O–C, (including phenols, alcohols, ethers and esters compounds) [30]. Meanwhile, the pyrolysis of sludge also produced other gas compounds with small molecular structure, such as CO2 (2400–2250cm−1 or 680–660cm−1) and CO (2200–2100cm−1). FTIR did not detect diatomic gases such as H2 and N2 due to the absence of dipole moment changes incurred by these gases [31].
The FTIR analysis of the evolved gas from TG measurements offered detailed information on the thermal behavior of sludge. However, the thermal degradation of sludge is a complex process that produces a variety of compounds. To better understand the evolution of main carbon and oxygen-containing chemical groups during sludge pyrolysis, the variation in the absorbance of OH, –C6H5, C–C, C=C, C–O, C=O, CO, CO2 with temperature was further characterized. The results are presented in Figure 5a–d.
From Figure 5a, it can be seen that -OH structure is mainly generated in 85–450 °C. In the second stage of pyrolysis, –OH is mainly derived from the release of crystal water in sludge. The absorbance intensity of –OH peaks at 288 °C was from the decomposition of oxygenates and formation of compounds containing hydroxyl functional groups [32]. –C6H5 structures are mostly present in benzene and its derivatives, and is generated at two temperature ranges: 67–500 °C and 762–850 °C. The highest spectral intensity of –C6H5 was achieved at 340 °C, mainly due to the volatilization of aromatic hydrocarbons in the feed and the cleaving of aromatic hydrocarbons with side chains.
During the third stage of pyrolysis (762–850 °C), the spectral intensity of –C6H5 increased with temperature. This is caused by the polycondensation of polycyclic aromatic hydrocarbons and hydrogenated aromatic hydrocarbons. In addition, organic macromolecules (cellulose, lignin, etc.) in sludge could undergo thermal cracking and form compounds containing –C6H5 structure.
It can be observed from Figure 5b that C–C was mainly produced in the second stage (195–336 °C) and the third stage (336–700 °C), with peaks occurring at around 304 °C and 570 °C, respectively. C=C structure mainly exist in the methyl(–CH3) and methylene(–CH2) groups of aliphatic and alkane bonds [33]. The unsaturated C=C structure was detected with the existence of two absorption peaks at 195–368 °C and 368–673 °C. It was noted that the spectral intensity of the C=C structure tend to slowly increase from 673 °C to 850 °C, which might be related to the dehydrocyclization of aliphatic hydrocarbon molecules and further aromatization reactions at high temperatures.
From Figure 5c, a single absorption peak was observed in 30–850 °C. It appeared to correspond with C–O and C=O groups which peaked at 310 °C and 295 °C, respectively. A previous study reported that C–O and C=O groups mainly derived from the pyrolysis of cellulose, hemicellulose, and lignin in sludge [23]. Above 310 °C, the absorbance of C–O and C=O groups decreased as temperature increased. This phenomena might be related to the reduction of carboxylic acids, esters and other compounds.
Figure 5d shows the spectral intensities of CO2 and CO in the evolved gas at different temperatures. It was reported that CO2 mostly originated from the degradation of oxygen-containing groups such as carboxyl, carbonyl and oxygen-containing heterocyclic [34]. CO2 was one of the key components in the gas-phase product at the early stage of sludge pyrolysis. It could be observed that CO2 peaked in the ranges 167–582 °C and 582–725 °C. The first peak occurred at 332 °C, primarily from to the decomposition of the carboxyl group with low thermal stability. The second peak appeared at 627 °C and was attributed to the decomposition of oxygen-containing heterocyclic ring and the carboxyl group with high thermal stability. In the 725–850 °C range, the spectral intensity of CO2 increased with the rise in temperature, possibly due to the increase of polycondensation reaction of macromolecular aromatic rings derived from sludge that produced more CO2.

3.3. Py-GC/MS Analysis

Based on the TG analysis in Section 3.2, the decomposition process was completed before the pyrolysis temperature reached 850 °C, which was taken as the analysis temperature range for Py-GC/MS tests. There are many kinds of organic components in the gas phase products from the 250 to 850 °C pyrolysis process. The typical ion chromatograms above 350 °C are more than 100 peaks, and the temperature is obviously affected. Over 90% of the volatile compounds was identified by the summation of the peak areas of individual compound. The identified compounds are those with the peak area matching degree larger than 70% and significant peak area larger than 0.1% when compared to compounds listed in the NIST library.
Table 2 showed that the composition and peak area of the identified organic compounds in the evolved gas at different temperature. The experiments were performed at least twice, and the results were repeatable. It can be seen that the organic compounds in evolved gas mainly include six groups: alkenes, aromatic hydrocarbons, alcohols, aldehydes, phenols, and carboxylic acids by their functional groups. Figure 6a–f further showed the classification and peak-area percentage of the different types of organic compounds. Due to the lack of standard mixture for the evolved gas, it was difficult to calibrate the MS detectors. This constraint limited the quantitative analysis of volatile product obtained. Therefore, an approach based on peak area value was adopted to represent the concentration of each compound identified and enable a direct comparison on the transformation of oxygen and carbon-containing compounds in this work [15].
At the low temperature pyrolysis (<350 °C), the volatile compounds containing O–C=O accounted for the highest proportion of the total detected substances, at about 53.27%. These compounds were mainly produced by the thermal degradation of cellulose and hemicellulose, to produce much high-grade mono-fatty acids including palmitic acid and palmitoleic acid. –OH was also generated into the evolved volatile product from the thermal release of a large number of alcohol hydroxyl groups containing R–OH; such as DL-2-aminopropanol, cholesterol-3-ol and cholesterol. In this stage, there were little trace of compounds containing –CHO, C=C and –C6H5 found.
In the middle temperature pyrolysis process (350–550 °C), production of compounds with O-C=O gradually decreased as temperature increased. This is caused by the carboxylic acid destruction and hydrogen bond breaking, which produce a large amount of carbon dioxide. The percentage of peak area belonging to compounds with R–OH and Ar–OH functional groups was found to increase. Over 350 °C, compounds with C=C and –C6H5 began to form from chain-breaking and dehydrogenation of long-chain aliphatic hydrocarbons or aromatic hydrocarbons with side-chain containing C–C and C–H. It was observed that a large number of compounds containing benzene ring (–C6H5) were formed by the decomposition of cellulose, hemicellulose, and lignin from the sludge. The compounds containing –CHO was found in less than 1% peak area at 550 °C.
Above 550 °C, carboxylic acid compounds containing O–C=O and compounds containing R–OH began to disappear due to the propagation of dehydration, decarboxylation, and decarbonylation reactions as temperature increased. No O–C=O and R–OH was detected above 750 °C and 650 °C, respectively. The peak area of compounds containing –CHO increased from 0.31% to 2.51% at 550–750 °C due to the production of large amounts of trimethyl butyraldehyde. Conversely, the peak area of olefin containing C=C rapidly decreased after 650 °C and disappeared entirely at 850 °C. In the low temperature pyrolysis process, Ar–OH was not easily cracked and substituted. Only above 550 °C did the peak area of compounds with Ar–OH show a trend of decreasing first, then rising and decreasing.
A previous study pointed out that phenolics have a high tendency of forming polycyclic aromatic hydrocarbons [35]. Therefore, as temperature increased, phenolic compounds might have dehydrated, condensated, and further aromatized to form macromolecular polycyclic aromatic hydrocarbons. In the 650–850 °C range, the peak area of compounds with –C6H5 increased significantly from 7.59% to 35.72%. At 850 °C, it could be seen that naphthalene (3.11%), acenaphthene (0.80%), fluorene (1.84%), phenanthrene (0.49%), anthracene (0.13%), fluoranthene (0.20%), and other macromolecular polycyclic aromatic hydrocarbons (PAHs) were detected in the evolved product. Compounds containing C=C, Ar–OH, and –C6H5 are more inclined to produce macromolecular PAHs at high temperature pyrolysis.

3.4. Pyrolysis Evolution Pathway of Organic Carbon and Oxygen-Containing Compounds

Active groups such as aromatic groups, phenolic hydroxyl groups, alcoholic hydroxyl groups, or carbon-based conjugated double bonds mainly exist in the form of organic molecular structures which are linked by C–C and C–O bonds. These structures can produce a large amount of carboxylic acid and its derivatives during pyrolysis at medium and low temperatures, and form macromolecular aromatic compounds at high temperatures, which lowers the quality of pyrolysis oil. Meanwhile, some small molecular gases such as CO, CO2, H2, and CH4 are produced. The results presented in Section 3.2 and Section 3.3 showed that the thermal decomposition of most organic components in sludge began above 200 °C. Small molecular carbohydrates mainly decomposed at 200–300 °C. Most cellulose and lignin are pyrolyzed in the temperature range of 300–350 °C. Protein and lipid are pyrolyzed in the wide temperature range of 200–600 °C. Because of the overlapping pyrolysis temperature range, cross-linking reactions between different compounds could occur, which makes the pyrolysis mechanism more complex.
On the basis of the aforementioned results and discussions and previous reports [36,37,38,39], this study proposed the transformation pathways of relevant reaction routes for carbon and oxygen-containing compounds in sludge pyrolysis process. These pathways are depicted in Figure 7. At the lower temperature pyrolysis stage (200–350 °C), macromolecule proteins break their peptide bonds to form small molecules containing amino chains, including aliphatic amines, cyclic amines and aromatic amines. The lignin and cellulose molecules form monomers mainly by the breaking of C–O–C and C–C bonds. Lignin mostly forms three kinds of alcohol monomers (p-coumaryl, coniferyl, and sinapyl alcohols) [39]. Lipid is mainly pyrolyzed to form hydroxy-containing glycerol, cholesterol, and alkanoic acids containing O–C=O. At higher temperatures (350–850 °C), acidic sites with small molecules and amino chains can promote the cleavage of streptamine to form olefins and NH3. Cyclic and aromatic amines are prone to dehydrate, decarboxylate, and deaminate to form aromatic compounds [40]. Cellulose monomers further break C–O to form short-chain molecules until they are converted into glucose. Lignin monomers deoxidize directly to form small hydrocarbons or aromatic compounds by condensation reaction. Moreover, carboxylic acids can be decarbonylated to alcohols, decarboxylated to long-chain alkanes, and dehydroxylated to aldehydes. Some aldehydes are decarbonylated to long-chain alkanes, while small amounts of alkanes can be cyclized and further aromatize to form polycyclic aromatic hydrocarbons.

4. Conclusions

This work has investigated the redistribution and transformation pathway of C- and O-containing organic compounds during sludge pyrolysis, providing an understanding of the pyrolysis mechanism. Sludge was found to decompose in a wide temperature range, starting at about 200 °C and peaking in the 200–550 °C range. Based on the types of carbon and oxygen-containing functional groups, the distribution of the evolved volatile compounds after sludge pyrolysis were mainly divided into six groups: alkenes, aromatic hydrocarbons, alcohols, aldehydes, phenols and carboxylic acids. Compounds containing –OH were generated in 85–450 °C. Benzene and its derivatives containing –C6H5, were mainly generated at the two temperature ranges: 67–500 °C and 762–850 °C. C=C structure mainly exist in the methyl (–CH3) and methylene (–CH2) groups of aliphatic and alkane bonds, which were produced in the 195–336 °C and 336–700 °C ranges. The C–O and C=O groups peaked at 310 °C and 295 °C.
CO2 was one of the main components in the gas-phase product at the early stage of sludge pyrolysis, which peaked in the 167–582 °C and 582–725 °C ranges. Temperature has an important role in the pyrolysis evolution of the functional groups. Over 550 °C, as the thermal chemical reaction of oxygen-containing groups enhanced, compounds containing O–C=O and –OH tended to disappear. From temperature of 550 °C and upwards, it was also observed that an increasing amount of macromolecular polycyclic aromatic hydrocarbon was formed through condensation and aromatization. The results obtained in the study will contribute to understanding of the pyrolysis mechanism of sludge and hence to the determination of the appropriate reaction conditions, improving the quality of bio-oil, and increasing the yield of the target products.

Author Contributions

Research approach and paper frame, Y.H.; Methodology and data curation, W.M. and Y.L.; Investigation, Y.L., L.W. and F.Y.; Writing-Original Draft Preparation, Y.L.; Data analysis, Z.H.; Writing-review and editing, H.W.

Funding

This research was funded by National Natural Science Foundation (Grant No. 51576178).

Acknowledgments

The authors want to appreciate the project of National Natural Science Foundation (Grant No. 51576178) providing financial supports of this work.

Conflicts of Interest

The authors declare no conflict of interest.

References

  1. Yang, G.; Zhang, G.; Wang, H. Current state of sludge production, management, treatment and disposal in China. Water Res. 2015, 78, 60–73. [Google Scholar] [CrossRef] [PubMed]
  2. Syed-Hassan, S.S.A.; Wang, Y.; Hu, S.; Song, S.; Sheng, S.; Xiang, J. Thermochemical processing of sewage sludge to energy and fuel: Fundamentals, challenges and considerations. Renew. Sustain. Energy Rev. 2017, 80, 888–913. [Google Scholar] [CrossRef]
  3. Folgueras, M.B.; Alonso, M.; Díaz, R.M. Influence of sewage sludge treatment on pyrolysis and combustion of dry sludge. Energy 2013, 55, 426–435. [Google Scholar] [CrossRef]
  4. Zhou, H.B.; Ma, C.; Gao, D.; Chen, T.B.; Zheng, G.D.; Chen, J.; Pan, T.H. Application of a recyclable plastic bulking agent for sewage sludge composting. Bioresour. Technol. 2014, 152, 329–336. [Google Scholar] [CrossRef] [PubMed]
  5. Wang, X.D.; Li, C.X.; Zhang, B.; Lin, J.J.; Chi, Q.Q.; Wang, Y. Migration and risk assessment of heavy metals in sewage sludge during hydrothermal treatment combined with pyrolysis. Bioresour. Technol. 2016, 221, 560–567. [Google Scholar] [CrossRef] [PubMed]
  6. Chan, W.P.; Wang, J.Y. Characterization of sludge for pyrolysis conversion process based on biomass composition analysis and simulation of pyrolytic properties. Waste Manag. 2018, 72, 274–286. [Google Scholar] [CrossRef]
  7. He, C.; Chen, C.L.; Giannis, A.; Yang, Y.H.; Wang, J.Y. Hydrothermal gasification of sewage sludge and model compounds for renewable hydrogen production: A review. Renew. Sustain. Energy Rev. 2014, 39, 1127–1142. [Google Scholar] [CrossRef]
  8. Piskorz, J.; Scott, D.S.; Westerberg, I.B. Flash pyrolysis of sewage sludge. Ind. Eng. Chem. Res. 1986, 25, 265–270. [Google Scholar] [CrossRef]
  9. Tsai, W.T.; Lee, M.K.; Chang, J.H.; Su, T.Y.; Chang, Y.M. Characterization of bio-oil from induction-heating pyrolysis of food-processing sewage sludges using chromatographic analysis. Bioresour. Technol. 2009, 100, 2650–2654. [Google Scholar] [CrossRef]
  10. Shen, L.; Zhang, D.K. An experimental study of oil recovery from sewage sludge by low-temperature pyrolysis in a fluidised-bed. Fuel 2003, 82, 465–472. [Google Scholar] [CrossRef]
  11. Font, R.; Fullana, A.; Conesa, J. Kinetic models for the pyrolysis and combustion of two types of sewage sludge. J. Anal. Appl. Pyrolysis 2005, 74, 429–438. [Google Scholar] [CrossRef]
  12. Urban, D.L.; Antal, M.J., Jr. Study of the kinetics of sewage sludge pyrolysis using DSC and TGA. Fuel 1982, 61, 799–806. [Google Scholar] [CrossRef]
  13. Piatkowski, N.; Steinfeld, A. Reaction kinetics of the combined pyrolysis and steamgasification of carbonaceous waste materials. Fuel 2010, 89, 1133–1140. [Google Scholar] [CrossRef]
  14. Thipkhunthod, P.; Meeyoo, V.; Rangsunvigit, P.; Rirksomboon, T. Describing sewage sludge pyrolysis kinetics by a combination of biomass fractions decomposition. J. Anal. Appl. Pyrolysis 2007, 79, 78–85. [Google Scholar] [CrossRef]
  15. Zhou, P.; Xiong, S.J.; Zhang, Y.X.; Jiang, H.; Chi, Y.C.; Lin, L. Study on the nitrogen transformation during the primary pyrolysis of sewage sludge by Py-GC/MS and Py-FTIR. Int. J. Hydrog. Energy 2017, 42, 18181–18188. [Google Scholar] [CrossRef]
  16. Tian, Y.; Zhang, J.; Zuo, W.; Chen, L.; Cui, Y.N.; Tan, T. Nitrogen conversion in relation to NH3 and HCN during microwave pyrolysis of sewage sludge. Environ. Sci. Technol. 2013, 47, 3498–3505. [Google Scholar] [CrossRef] [PubMed]
  17. Zhang, J.; Zuo, W.; Tian, Y.; Chen, L.; Yin, L.L.; Zhang, J. Sulfur transformation during microwave and conventional pyrolysis of sewage sludge. Environ. Sci. Technol. 2017, 51, 709–717. [Google Scholar] [CrossRef] [PubMed]
  18. ISO 11722. Solid Mineral Fuels. Hard Coal. Determination of Moisture in the General Analysis by Drying in Nitrogen; International Organization for Standardization: Geneva, Switzerland, 1999. [Google Scholar]
  19. ISO 625. Solid Mineral Fuels-Determination of Carbon and Hydrogen-Liebig Method, MOD; International Organization for Standardization: Geneva, Switzerland, 1996. [Google Scholar]
  20. ISO/TS 11725. Solid Mineral Fuels-Determination of Nitrogen-Semi-Micro Gasification, MOD; International Organization for Standardization: Geneva, Switzerland, 2004. [Google Scholar]
  21. ISO 351. Solid Mineral Fuels-Determination of Total Sulfur-High Temperature Combustion Method, NEQ; International Organization for Standardization: Geneva, Switzerland, 1996. [Google Scholar]
  22. ISO 1928. Solid Gross Calorific Value by Calculation of Mineral Fuels-Determination of the Bomb Calorimetric Method and Net Calorific Value, MOD; International Organization for Standardization: Geneva, Switzerland, 1995. [Google Scholar]
  23. Lin, Y.; Liao, Y.F.; Yu, Z.S.; Fang, S.W.; Ma, X.Q. A study on co-pyrolysis of bagasse and sewage sludge using TG-FTIR and Py-GC/MS. Energy Convers. Manag. 2017, 151, 190–198. [Google Scholar] [CrossRef]
  24. Jiang, W.K.; Chu, J.Y.; Wu, S.B.; Lucia, L.A. Modeling pyrolytic behavior of pre-oxidized lignin using four representative β-ether-type lignin-like model polymers. Fuel Proc. Technol. 2018, 176, 221–229. [Google Scholar] [CrossRef]
  25. Wei, Q.; Zhang, F.; Li, J.; Li, B.J.; Zhao, C.S. Oxidant-induced dopamine polymerization for multifunctional coatings. Polym. Chem. 2010, 1, 1430–1433. [Google Scholar] [CrossRef]
  26. Finsgar, M.; Fassbender, S.; Hirth, S.; Milosev, I. Electrochemical and XPS study of polyethyleneimines of different molecular sizes as corrosion inhibitors for AISI 430 stainless steel in near-neutral chloride media. Mater. Chem. Phys. 2009, 116, 198–206. [Google Scholar] [CrossRef]
  27. Yan, Z.L.; Yang, H.M.; Ouyang, J.; Tang, A.D. In situ loading of highly-dispersed CuO nanoparticles on hydroxyl-group-rich SiO2-AlOOH composite nanosheets for CO catalytic oxidation. Chem. Eng. J. 2017, 316, 1035–1046. [Google Scholar] [CrossRef]
  28. Gao, C.; Yu, X.Y.; Xu, R.X.; Liu, J.H.; Huang, X.J. AlOOH-Reduced graphene oxide nanocomposites: One-pot hydrothermal synthesis and their enhanced electrochemical activity for heavy metal ions. ACS Appl. Mater. Interfaces 2012, 4, 4672–4682. [Google Scholar] [CrossRef] [PubMed]
  29. Xu, L.; Jiang, Y.; Qiu, R. Parametric study and global sensitivity analysis for co-pyrolysis of rape straw and waste tire via variance-based decomposition. Bioresour. Technol. 2017, 247, 545–552. [Google Scholar] [CrossRef] [PubMed]
  30. Grube, M.; Lin, J.B.; Lee, P.H.; Kokorevicha, S. Evaluation of sewage sludge-based compost by FT-IR spectroscopy. Geoderma 2006, 130, 324–333. [Google Scholar] [CrossRef]
  31. Zhang, Z.; Wang, C.J.; Huang, G.; Liu, H.R.; Yang, S.L.; Zhang, A.F. Thermal degradation behaviors and reaction mechanism of carbon fibre-epoxy composite from hydrogen tank by TG-FTIR. J. Hazard. Mater. 2018, 357, 73–80. [Google Scholar] [CrossRef] [PubMed]
  32. Jong, W.D.; Nola, G.D.; Venneker, B.C.H.; Spliethoff, H.; Wojtowicz, M.A. TG-FTIR pyrolysis of coal and secondary biomass fuels: Determination of pyrolysis kinetic parameters for main species and NOx precursors. Fuel 2007, 86, 2367–2376. [Google Scholar] [CrossRef]
  33. Wang, S.R.; Wang, K.G.; Liu, Q.; Gu, Y.L.; Luo, Z.Y.; Cen, K.F.; Fransson, T. Comparison of the pyrolysis behavior of lignins from different tree species. Biotechnol. Adv. 2009, 27, 562–567. [Google Scholar] [CrossRef]
  34. Jia, Y.B.; Huang, J.J.; Wang, Y. 2004. Effects of calcium oxide on the cracking of coal tar in the freeboard of a fluidized bed. Energy Fuels 2004, 18, 1625–1632. [Google Scholar] [CrossRef]
  35. Gu, X.L.; Ma, X.; Li, L.X.; Liu, C.; Chen, K.H.; Li, Z.Z. Pyrolysis of poplar wood sawdust by TG-FTIR and Py-GC/MS. J. Anal. Appl. Pyrolysis 2013, 102, 16–23. [Google Scholar] [CrossRef]
  36. Debono, O.; Villot, A. Nitrogen products and reaction pathway of nitrogen compounds during the pyrolysis of various organic wastes. J. Anal. Appl. Pyrolysis 2015, 114, 222–234. [Google Scholar] [CrossRef]
  37. Wang, S.; Hu, Y.M.; Uzoejinwa, B.B.; Cao, B.; He, Z.X.; Wang, Q.; Xu, S.N. Pyrolysis mechanisms of typical seaweed polysaccharides. J. Anal. Appl. Pyrolysis 2016, 124, 373–383. [Google Scholar] [CrossRef]
  38. Kim, Y.M.; Han, T.U.; Lee, B.; Watanabe, A.; Teramae, N.; Kim, J.H.; Park, Y.K.; Park, H.; Kim, S. Analytical pyrolysis reaction characteristics of Porphyra tenera. Algal Res. 2018, 32, 60–69. [Google Scholar] [CrossRef]
  39. Gierer, J. Chemical aspects of kraft pulping. Wood Sci. Technol. 1980, 14, 241–266. [Google Scholar] [CrossRef]
  40. Wei, A.F.; Cao, J.P.; Zhao, X.Y.; Ren, J.; Gu, B.; Wei, X.Y. Formation of aromatics and removal of nitrogen in catalytic fast pyrolysis of sewage sludge: A study of sewage sludge and model amino acids. Fuel 2018, 218, 148–154. [Google Scholar] [CrossRef]
Figure 1. High-resolution XPS spectra of dry sewage sludge.
Energies 12 02258 g001
Figure 2. Fitting results of C1s and O1s XPS spectra of dry sewage sludge. (a) C1s; (b) O1s.
Energies 12 02258 g002
Figure 3. Thermogravimetric analysis of dry sewage sludge.
Energies 12 02258 g003
Figure 4. Evolution of the production of different products for pyrolysis of sewage sludge measured by Fourier transform infrared (FTIR) spectroscopy.
Energies 12 02258 g004
Figure 5. FTIR spectrum for pyrolysis products evolving from the sludge at different temperatures. (a) –OH, –C6H5; (b) C–C, C=C; (c) C–O, C=O; (d) CO, CO2.
Energies 12 02258 g005
Figure 6. Distribution of compounds with carbon and oxygen-containing functional groups at different temperatures. (a) C=C; (b) –C6H5; (c) O–C=O; (d) –CHO. (e) R–OH; (f) Ar–OH.
Energies 12 02258 g006
Figure 7. Possible carbon and oxygen-containing functional groups transformation pathways of sludge during pyrolysis.
Energies 12 02258 g007
Table 1. Proximate and ultimate analyses of the sewage sludge.
Proximate Analysis (wt.%)Mad (%)Aad (%)Vad (%)FCad (%)H (MJ·kg−1)
2.1041.0754.692.1413.5
Ultimate analysis (wt.%)CHOSN
35.75.3412.811.753.44
Table 2. Detailed analysis of Total Ions Chromatograph (TIC) chromatogram of the evolved gas at different temperatures.
No.Retention Time(R.T)/(min)CompoundsFormulaPeak Area/%
250 °C350 °C450 °C550 °C650 °C750 °C850 °C
11.595butanal, 3-methyl-C5H10O----2.51--
21.634benzeneC6H6-----4.486.48
31.6441-propanol,2-amino-, (.+/-.)-C3H9NO3.28------
42.047tolueneC7H8---1.32.464.335.9
52.1031-octeneC8H16----1.17--
62.4492-furanmethanolC5H6O2--0.70.99---
72.586ethylbenzeneC8H10----1.271.621.46
82.7471-noneneC9H18---0.250.620.47-
92.791styreneC8H8--0.481.362.162.193.26
102.8641,3,5,7-cyclooctatetraeneC8H8--0.87----
113.5471-deceneC10H20----1.53--
123.908benzene, 1-propenyl-C9H10----0.411.020.75
133.942d-limoneneC10H16---0.66 --
144.108indeneC9H8------1.69
154.181phenol, 2-methyl-C7H8O-----0.760.54
164.43p-cresolC7H8O--2.242.41.993.382.36
174.9962-methylindeneC10H10-----1.070.88
185.051h-indene, 1-methyl-C10H10-----1.2-
195.2261-dodeceneC12H24-----0.61-
205.309naphthaleneC10H8-----1.753.11
215.9921-methylnaphthaleneC11H10------2.29
225.9961-trideceneC13H26---0.370.73--
236.289naphthalene,2-methyl-C11H10-----1.07-
246.5621,4-benzenediol, 2-methyl-C7H8O2---0.65---
256.7091-tetradeceneC14H28---0.51.250.57-
266.758biphenylC12H10-----0.580.66
277.1921-undecene,5-methyl-C12H24---0.52---
287.2653-allyl-6-methoxyphenolC10H12O2-0.451.040.77---
297.363acenaphthyleneC12H8------0.8
307.489chloroethyl esterC15H30---0.50.690.51-
318.163dodecanoic acidC12H24O1.532.43.551.781.2--
328.622fluoreneC13H10------1.84
338.81213-tetradecenalC14H26O---0.31---
3410.685tetradecanoic acidC14H28O22.151.91.451.960.54--
3511.315phenanthreneC14H10-----0.280.49
3611.486anthraceneC14H10------0.13
3711.778pentadecanoic acidC15H30O23.572.181.381.530.58--
3814.482palmitoleic acidC16H30O29.273.040.132.260.86--
3914.852n-hexadecanoic acidC16H32O225.024.784.243.031.860.47-
4017.282fluorantheneC16H10------0.2
4119.542oleic acidC18H34O27.452.1-1.720.61--
4219.9716-octadecenoic acid, (z)-C18H34O2--2.130.34---
4320.22octadecanoic acidC18H36O23.570.850.840.60.51--
4424.482-octylcyclopropaneoctanalC19H36O-0.130.11----
4538.181.gamma.-tocopherolC28H48O2-0.15-0.11---
4638.458cholestan-3-olC27H48O4.28------
4738.488cholestanolC27H48O-0.660.290.350.21--
4839.537cholesterolC27H46O1.79-0.20.23---
4943.109stigmastanolC29H52O-0.240.10.18---
“-”: Below the detection limit.

