Volumetric Measurements of Methane-Coal Adsorption and Desorption Isotherms—Effects of Equations of State and Implication for Initial Gas Reserves


Discipline of Petroleum Engineering, Western Australian School of Mines: Minerals, Energy and Chemical Engineering, Curtin University, 26 Dick Perry Avenue, Kensington, WA 6151, Australia
*
Author to whom correspondence should be addressed.
Energies 2019, 12(10), 2022; https://doi.org/10.3390/en12102022
Submission received: 10 May 2019
/
Revised: 22 May 2019
/
Accepted: 23 May 2019
/
Published: 27 May 2019
(This article belongs to the Special Issue Development of Unconventional Reservoirs)
Abstract
:This study presents the effects of equations of state (EOSs) on methane adsorption capacity, sorption hysteresis and initial gas reserves of a medium volatile bituminous coal. The sorption experiments were performed, at temperatures of 25 °C and 40 °C and up to 7MPa pressure, using a high-pressure volumetric analyzer (HPVA-II). The measured isotherms were parameterized with the modified (three-parameter) Langmuir model. Gas compressibility factors were calculated using six popular equations of state and the results were compared with those obtained using gas compressibility factors from NIST-Refprop® (which implies McCarty and Arp’s EOS for Z-factor of helium and Setzmann and Wagner’s EOS for that of methane). Significant variations were observed in the resulting isotherms and associated model parameters with EOS. Negligible hysteresis was observed with NIST-refprop at both experimental temperatures, with the desorption isotherm being slightly lower than the adsorption isotherm at 25 °C. Compared to NIST-refprop, it was observed that equations of state that gave lower values of Z-factor for methane resulted in “positive hysteresis”, (one in which the desorption isotherm is above the corresponding adsorption curve) and the more negatively deviated the Z-factors are, the bigger the observed hysteresis loop. Conversely, equations of state that gave positively deviated Z-factors of methane relatively produced “negative hysteresis” loops where the desorption isotherms are lower than the corresponding adsorption isotherms. Adsorbed gas accounted for over 90% of the calculated original gas in place (OGIP) and the larger the Langmuir volume, the larger the proportion of OGIP that was adsorbed.
1. Introduction
Coal-seams are typically characterized by large proportions of the gas (mostly methane [1,2,3], with traces of impurities such as CO2 and N2) existing predominantly as adsorbed phase in the internal surface areas of the rock matrix while the natural cleats’ macropores may contain some water and free gas [1]. The primary storage mechanism in coal-seams is thus gas adsorption in the internal surface areas of the coal matrix [4]. The amounts of gas adsorbed by a coal depend on different factors such as pressure, temperature and moisture contents [5]. The relation of amount of adsorbed gas to pressure at a constant temperature is referred to as adsorption isotherm and has been the primary means of assessing the gas adsorption capacity of coals [2]. Adsorption isotherms are mostly measured experimentally using different techniques such as volumetric, manometric, gravimetric, and some combinations thereof [6] most of which rely on some equation of state to obtain gas compressibility factors for data interpretation [7].
The dependencies of adsorption capacity and gas reserves estimates on gas compressibility factors have been illustrated by different researchers [7,8,9,10,11]. Despite this knowledge, indiscriminate uses of EOSs for Z-factors needed for generating sorption isotherms is very common [10,12,13,14]. Redlich-Kwong EOS [12], 32-parameter modified Benedict-Webb-Rubin (MBWR) EOS [13] and a combination of McCarty and Arp and Setzmann and Wagner EOSs [12] are some examples found in the literature.
To further demonstrate the influence of equations of state on high-pressure sorption data, we extend our investigation to methane-coal sorption hysteresis and gas in-place volumes. Hysteresis in high-pressure sorption isotherms of supercritical methane on coal has become a common observation and yet, it remains difficult to explain. Some researchers believe it is caused primarily by measurement uncertainties [5,15,16] while others have argued that it could be too significant to be attributed to measurement errors alone [5]. Parameters such as equilibrium time [6,17], (residual) moisture contents of coal [8,17], coal ranks [8,18], particle sizes of coal [19,20], irreversible structural changes to coal due to gas adsorption [21,22], irreversible absorption associated with gas adsorption [16,23], coal’s surface heterogeneity [24], gas trapping [8], irreversible chemical bonding of gas molecules with molecules of coal [16,17,21] and selectiveness of adsorption sites during desorption [21] have been offered as explanations for observed high-pressure sorption hysteresis of CO2-coal and/or CH4-coal systems.
It is generally believed that, where hysteresis exists, desorption isotherms should lie above their adsorption counterparts. This type of hysteresis is referred to as “positive hysteresis” [25] and was the case with all the examples cited above. Less commonly, cases of “negative hysteresis” and cross-overs (desorption isotherm intercepting adsorption isotherm) have also be reported [6,25,26,27]. However, it was hitherto believed that such observations could only be caused by pressure non-equilibration, desorption of pre-adsorbed gas in the adsorbent [6] or irreversible structural changes to the solid as a result of gas adsorption [25,26].
From the above discussion, it is obvious that there is no single universal explanation for CO2-coal and CH4-coal sorption hysteresis at high-pressure. A similar conclusion was reached by Wang et al. [28] in their review paper on sorption hysteresis of CO2 and CH4 on coals. It is noteworthy however, that majority of the articles reviewed were based on volumetric/manometric method. This invariably means that the authors used some equations of state to obtain the fluid data required for experimental data analysis. Interestingly, none of the authors considered that the choice of EOSs (and hence, calculated Z-factors) could be the cause of the observed hysteresis. The primary aim of this paper is therefore to establish that the choice of EOS has a significant effect on high-pressure adsorption and desorption isotherms of methane on coal, associated model parameters, degree and type of sorption hysteresis as well calculated gas reserves from coalbed seams.
2. Materials and Methods
2.1. Sample
The coal sample used in this study is ranked medium volatile bituminous with a mean vitrinite reflectance of 1.43%. The results of the sample’s petrographic and proximate analyses are summarized in Table 1. The sample was pulverized and sieved to particle sizes 45–75 μm (325–200 mesh) and then subjected to low-pressure nitrogen adsorption to determine its pore-size distributions (PSDs).
2.2. Sample Characterization Using Low-Pressure Nitrogen Adsorption
Pore size distribution was achieved using low-pressure nitrogen ad/desorption tests at a temperature of 77.3 K (≈ −196 °C) and equilibrium relative pressure (P/Po, where the saturation pressure, Po = 0.1 MPa and P = equilibrium pressure) range of about 0.01 to 1 using a Micromeritics® Tristar II 3020 instrument. The sample was degassed at a temperature of 110 °C for a minimum of 8 h prior to the measurements. The experimental isotherms were parameterized using Brunauer-Emmett-Teller (BET) model [29] and coupled with the non-local density-functional theory (NLDFT) to compute the PSDs.
2.3. Measurement of Methane Sorption Isotherms
Methane adsorption and desorption isotherms were measured for the sample using Particulate System’s HPVA-II® 200 unit described in [10,13,30,31]. This equipment uses volumetric technique for gas adsorption and desorption measurements. The volume of free-space was measured using helium expansion method [10,13,30,31]. In addition to the isotherms computed by the equipment (reference data), six other isotherms were calculated, at each temperature, from the raw experimental data, using Z-factors obtained from the EOSs discussed in Ekundayo and Rezaee [10]. The total amount adsorbed at any pressure step r is given by the following equation [10]:
where , and are the standard molar volume of gas, the universal gas constant () and the weight of the adsorbent respectively; are the pressure, temperature and the corresponding methane Z-factor condition of the manifold (of volume, ) before dosing gas into the sample cell, are the manifold’s final condition after dosing. represent the equilibrium condition of the sample cell (volume ), are the temperature and Z-factor in the upper stem (volume, ) of the sample holder while are the corresponding values in the lower stem (volume ). The parameters , & , are related to the volume free space at ambient condition () and can be calculated as discussed in Ekundayo and Rezaee [10]. A plot of against gives an adsorption isotherm.
If the amounts adsorbed at any two consecutive adsorption steps and are and respectively, then the differential amount adsorbed at step can be obtained as:
Thus, the target amount during the desorption from step to is . In practice, however, desorption step terminates at a new pressure point (typically, ) desorbing an amount . Therefore, the amount adsorbed at the pressure point is given as:
A plot of against on the same axes as the adsorption isotherm gives the desorption isotherm. In a rare case where , . For this ideal case, the isotherms do not only overlay, they are also equal. In reality, and may be less or greater than resulting in one of three scenarios:
- (1)
- Negligible (or Zero) Hysteresis in which the isotherms overlay even though
- (2)
- Positive Hysteresis in which and as such, desorption isotherm lies above the adsorption curve
- (3)
- Negative Hysteresis in which and as such, desorption isotherm lies below the adsorption curve
2.4. Theory
2.4.1. Isotherm Modeling
The measured excess adsorbed amounts are usually converted to absolute amounts, which are needed for practical applications [32]. In this work, the measured isotherms were parameterized using the 3-parameter Langmuir model [7,13,21,32] which includes a factor to convert the excess amount adsorbed to absolute amount. If the excess amount at any equilibrium pressure, P is , then the model is given as:
where VL, PL = Langmuir volume and pressure (respectively); = Adsorbed gas phase density
M = Molecular weight of methane.
The model parameters were determined by non-linear curve fitting with each parameter bounded to . The adsorbed gas phase density was assumed to be pressure-independent.
2.4.2. Gas in-Place Calculation
The total volume of gas originally in-place, in a coal-seam, is the sum of the free gas and adsorbed gas and can be calculated using Equation (6) [33]:
In this equation, A (acre) is the area of the coal seam, h (ft) is the thickness, represent the respective initial porosity and water saturation in the cleat system, (g/cc) is the density of the coal seam, (MPa) is initial reservoir pressure, (rcf/scf) represents the initial gas formation volume factor (FVF) calculated from Equation (7), (scf/ton) is the Langmuir volume for the adsorption isotherm at reservoir temperature, (°C) and (MPa) is the corresponding Langmuir pressure. Table 2 shows the parameters used in calculating the OGIP for each EOS.
in Equation (7) is the Z-factor of methane at initial coal seam pressure and temperature.
It is obvious from Equation (7) that the gas FVF is directly related to Z- factor and as such is also EOS-dependent. To isolate the effect of the gas FVF on the calculated volume of gas in-place, two different cases were investigated as follows:
- Case 1:
- Gas FVF equals the value calculated for each EOS.
- Case 2:
- Gas FVF equals constant for all EOS. The constant value was set as the value obtained for the reference EOS.
3. Results and Discussion
3.1. Low-Pressure Nitrogen Sorption Isotherms and Pore-Size Distribution
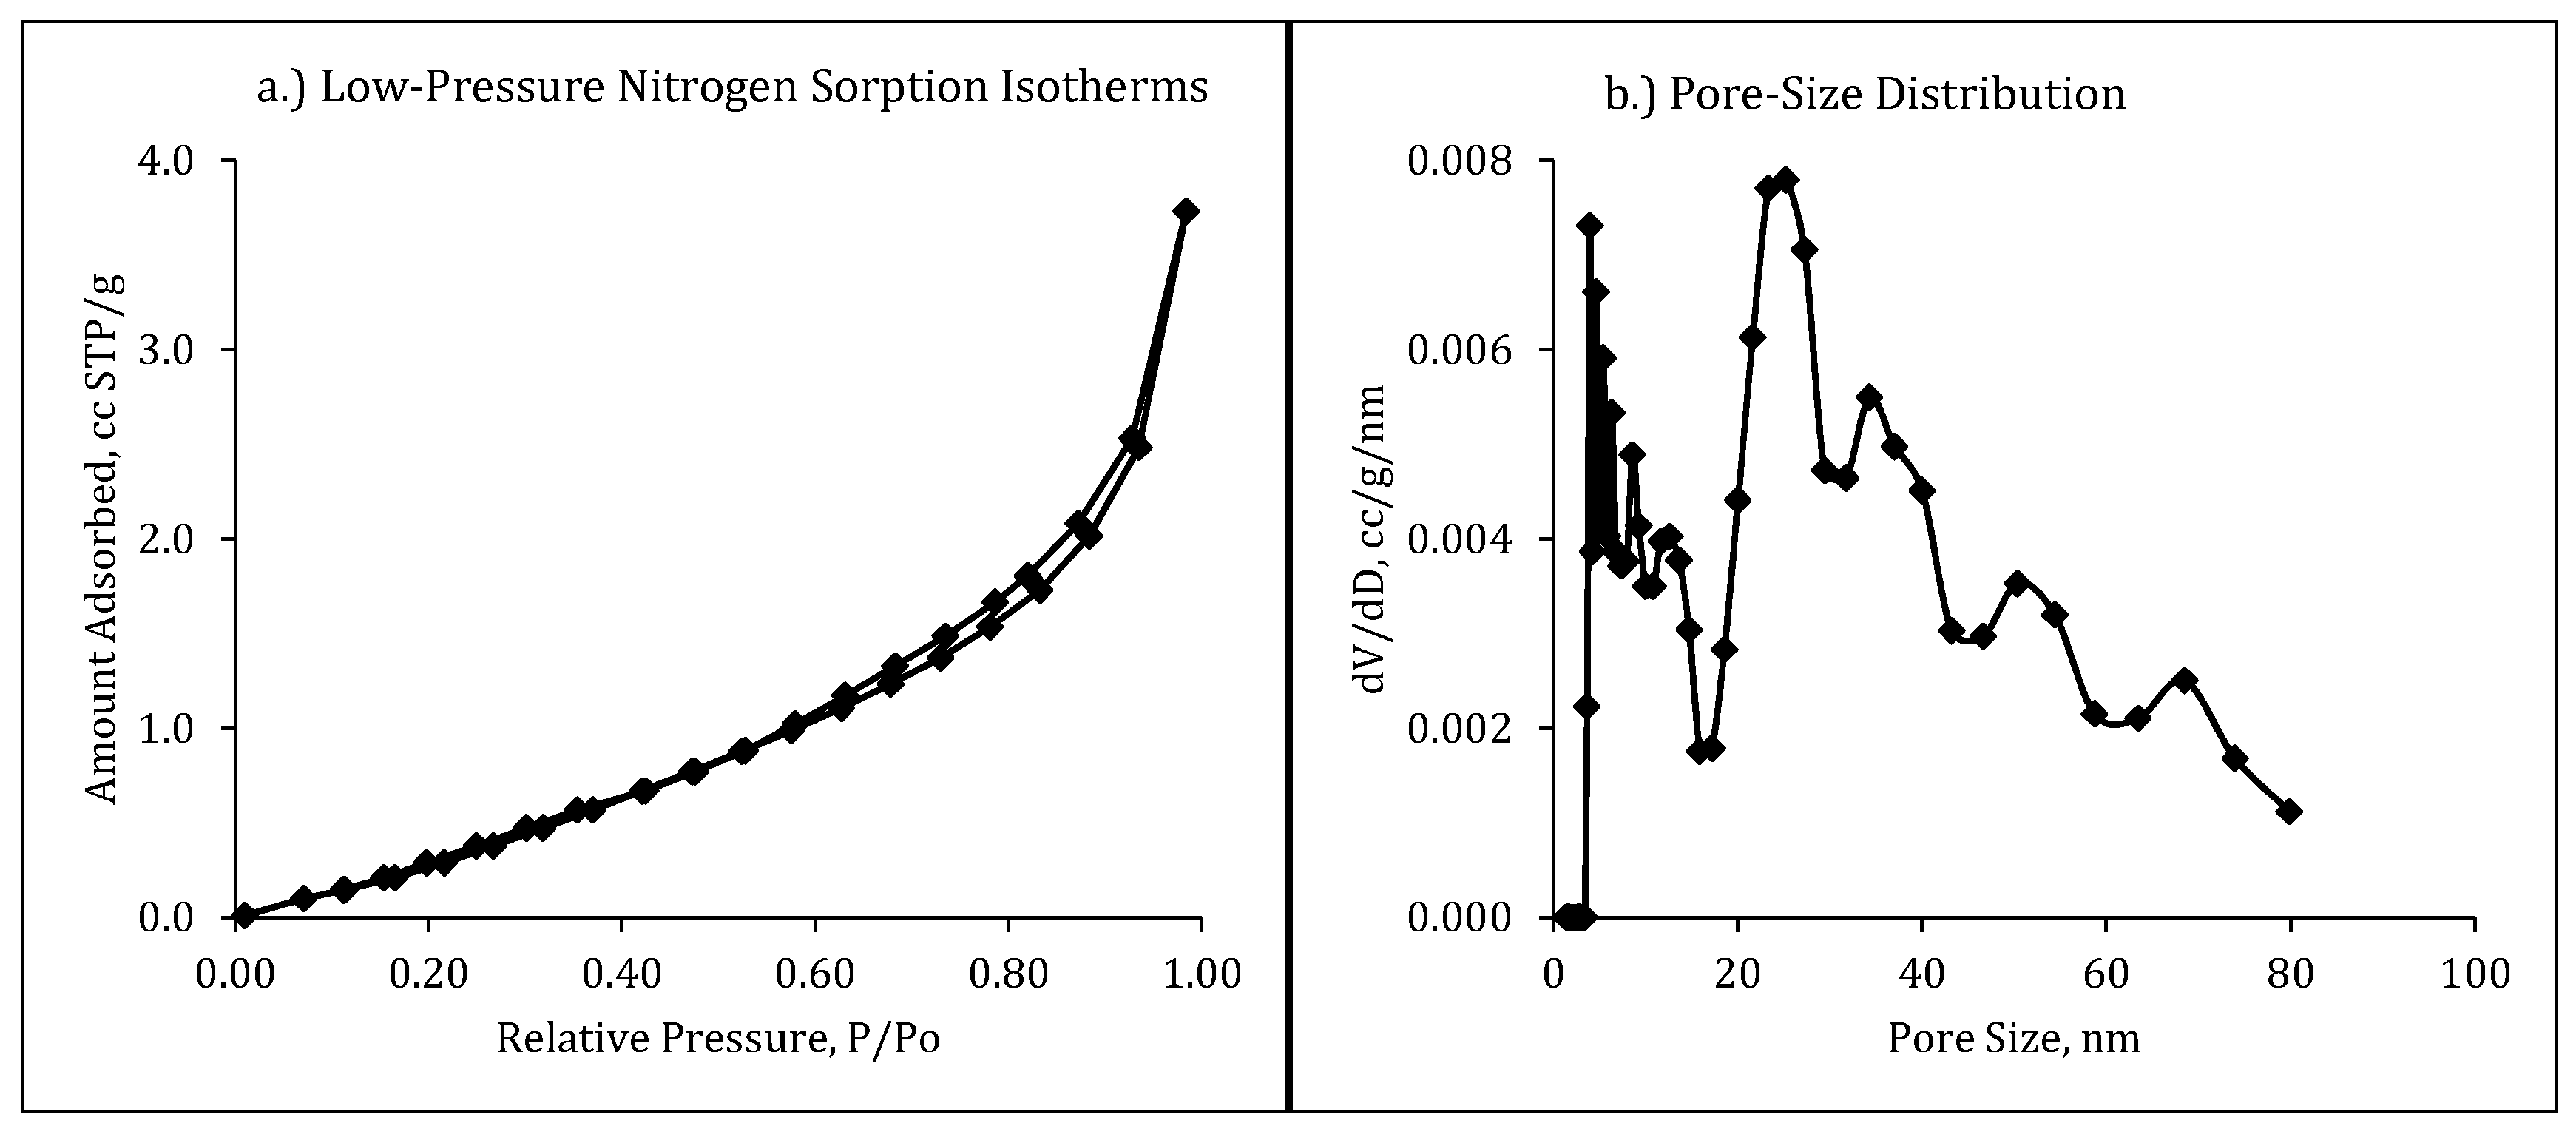
Figure 1 shows the low-pressure nitrogen sorption isotherms (Figure 1a) and the corresponding pore-size distribution, PSD (Figure 1b) for the coal sample used in the study. The nitrogen adsorption isotherm shows no monolayer coverage but exhibits a significant multilayer coverage [34], up to a relative pressure of about 0.8, followed by a sharp increase in the amount adsorbed (an indication of capillary condensation [35]) thereafter. Negligible hysteresis of type H3 (IUPAC classification, [34]) characterized by a type II adsorption isotherm and a lower closure of the hysteresis loop indicate that the sample is composed of non-rigid aggregates of slit-like particles and possible presence of a network of macropores [34]. The PSD shows that the sample is composed of approximately bi-modal distributed pores with mesopores accounting for more than 90% of the distribution and dominant pores sizes of approximately 4 nm and 25 nm. The PSD also shows negligible micropores thereby confirming the absence of monolayer coverage observed in the nitrogen adsorption isotherm.
3.2. Methane-Coal Adsorption Isotherms
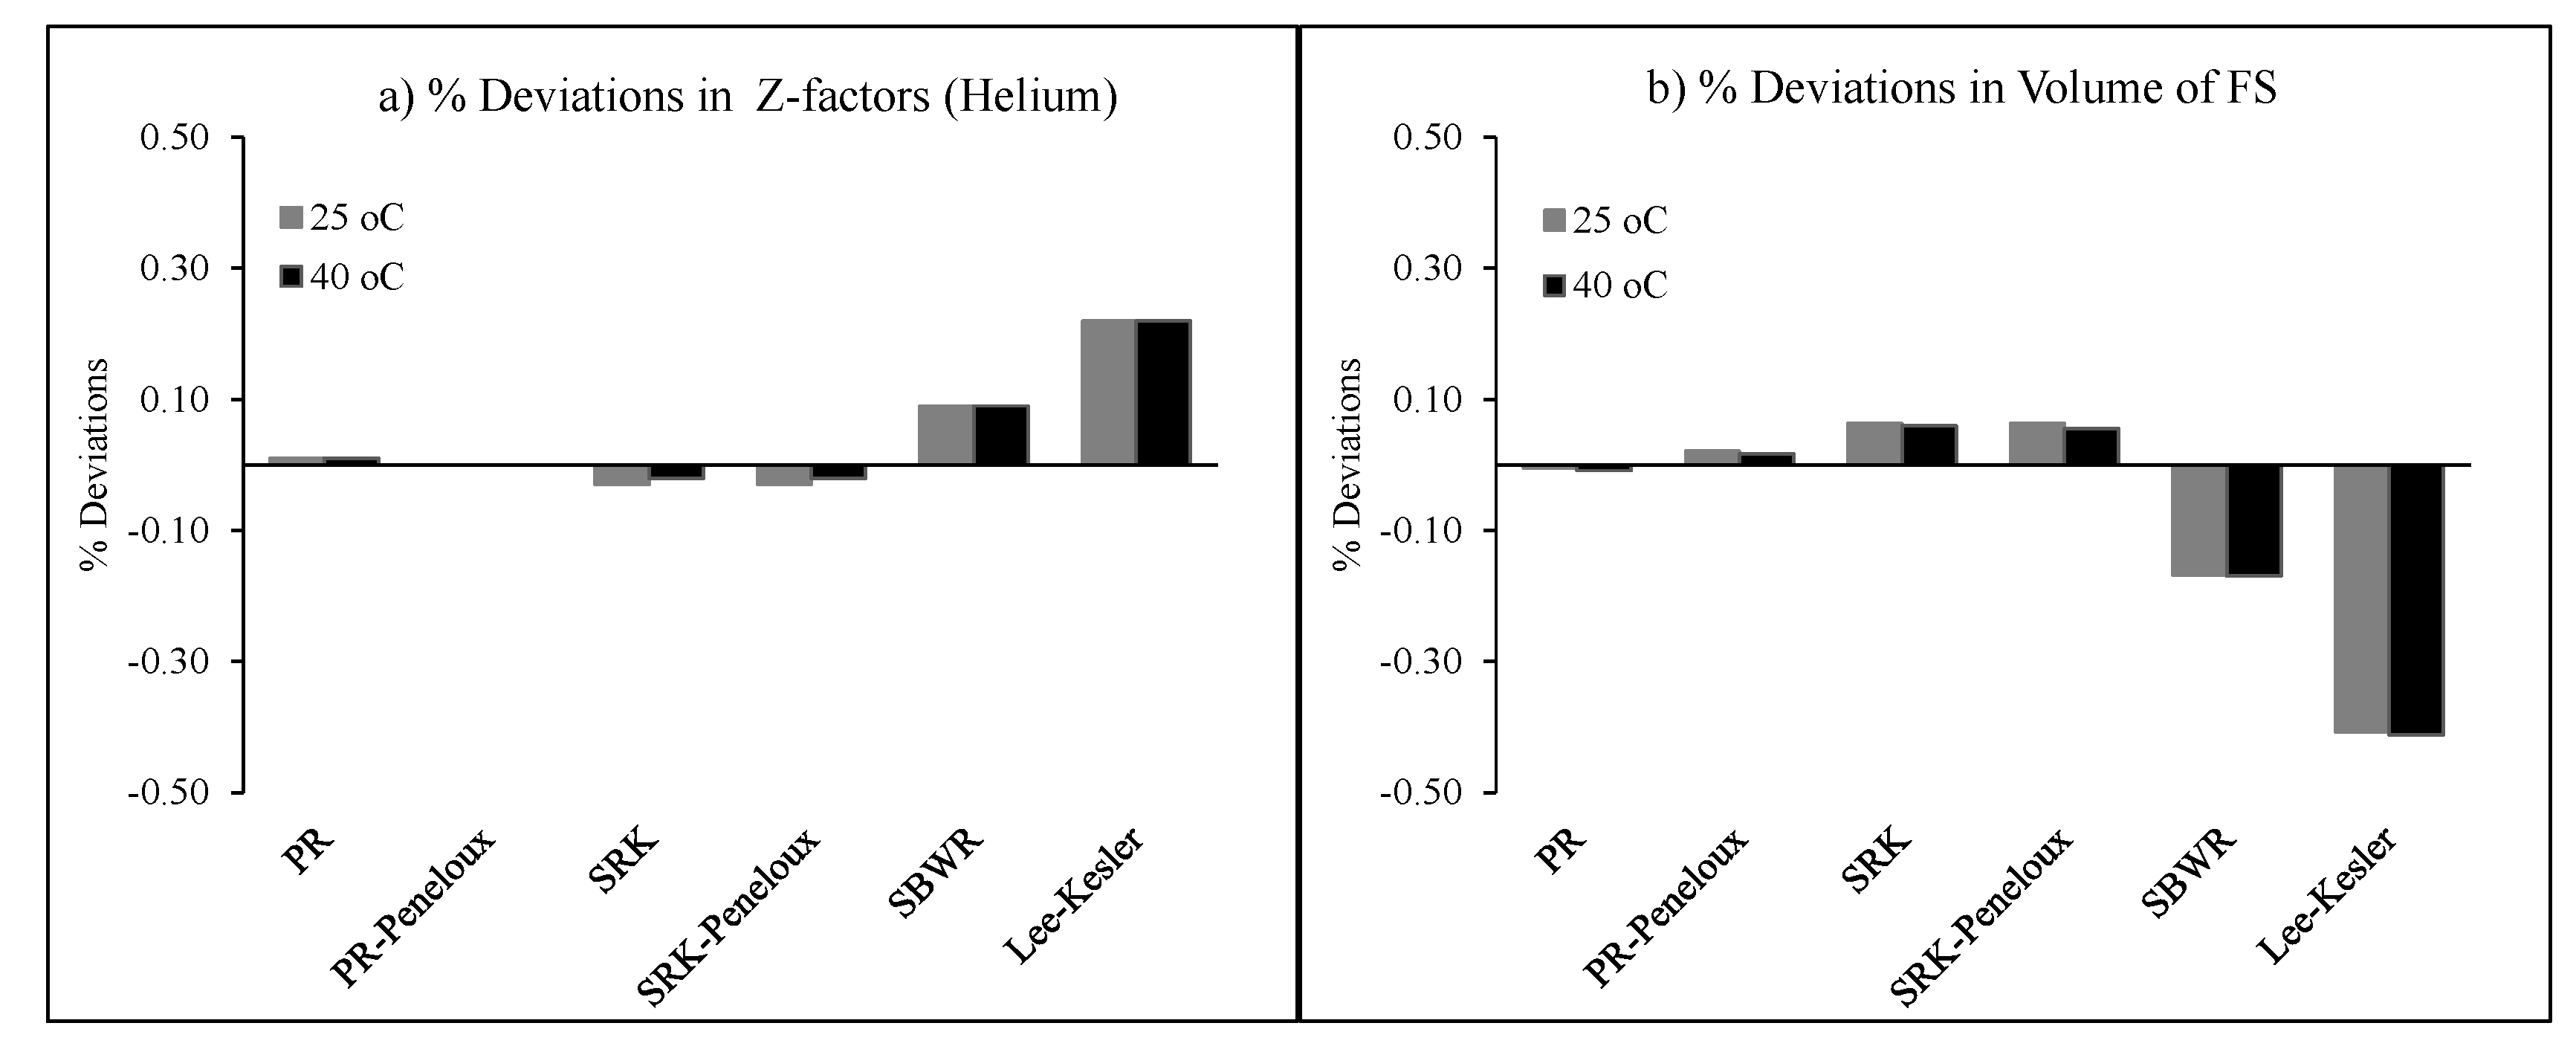
Figure 2 shows the variations in the calculated Z-factors of helium (Figure 2a), relative to those obtained from McCarty and Arp’s EOS [36], at the test temperatures and the corresponding variations in the resulting ambient volumes of free space (Figure 2b). The deviations are minimal for helium Z-factor (within ±0.25%) for all the EOS. Although the corresponding deviations of free space volume are also small (within±0.5%), they can have significant effects on the amounts adsorbed, especially at high pressure [10,37,38].
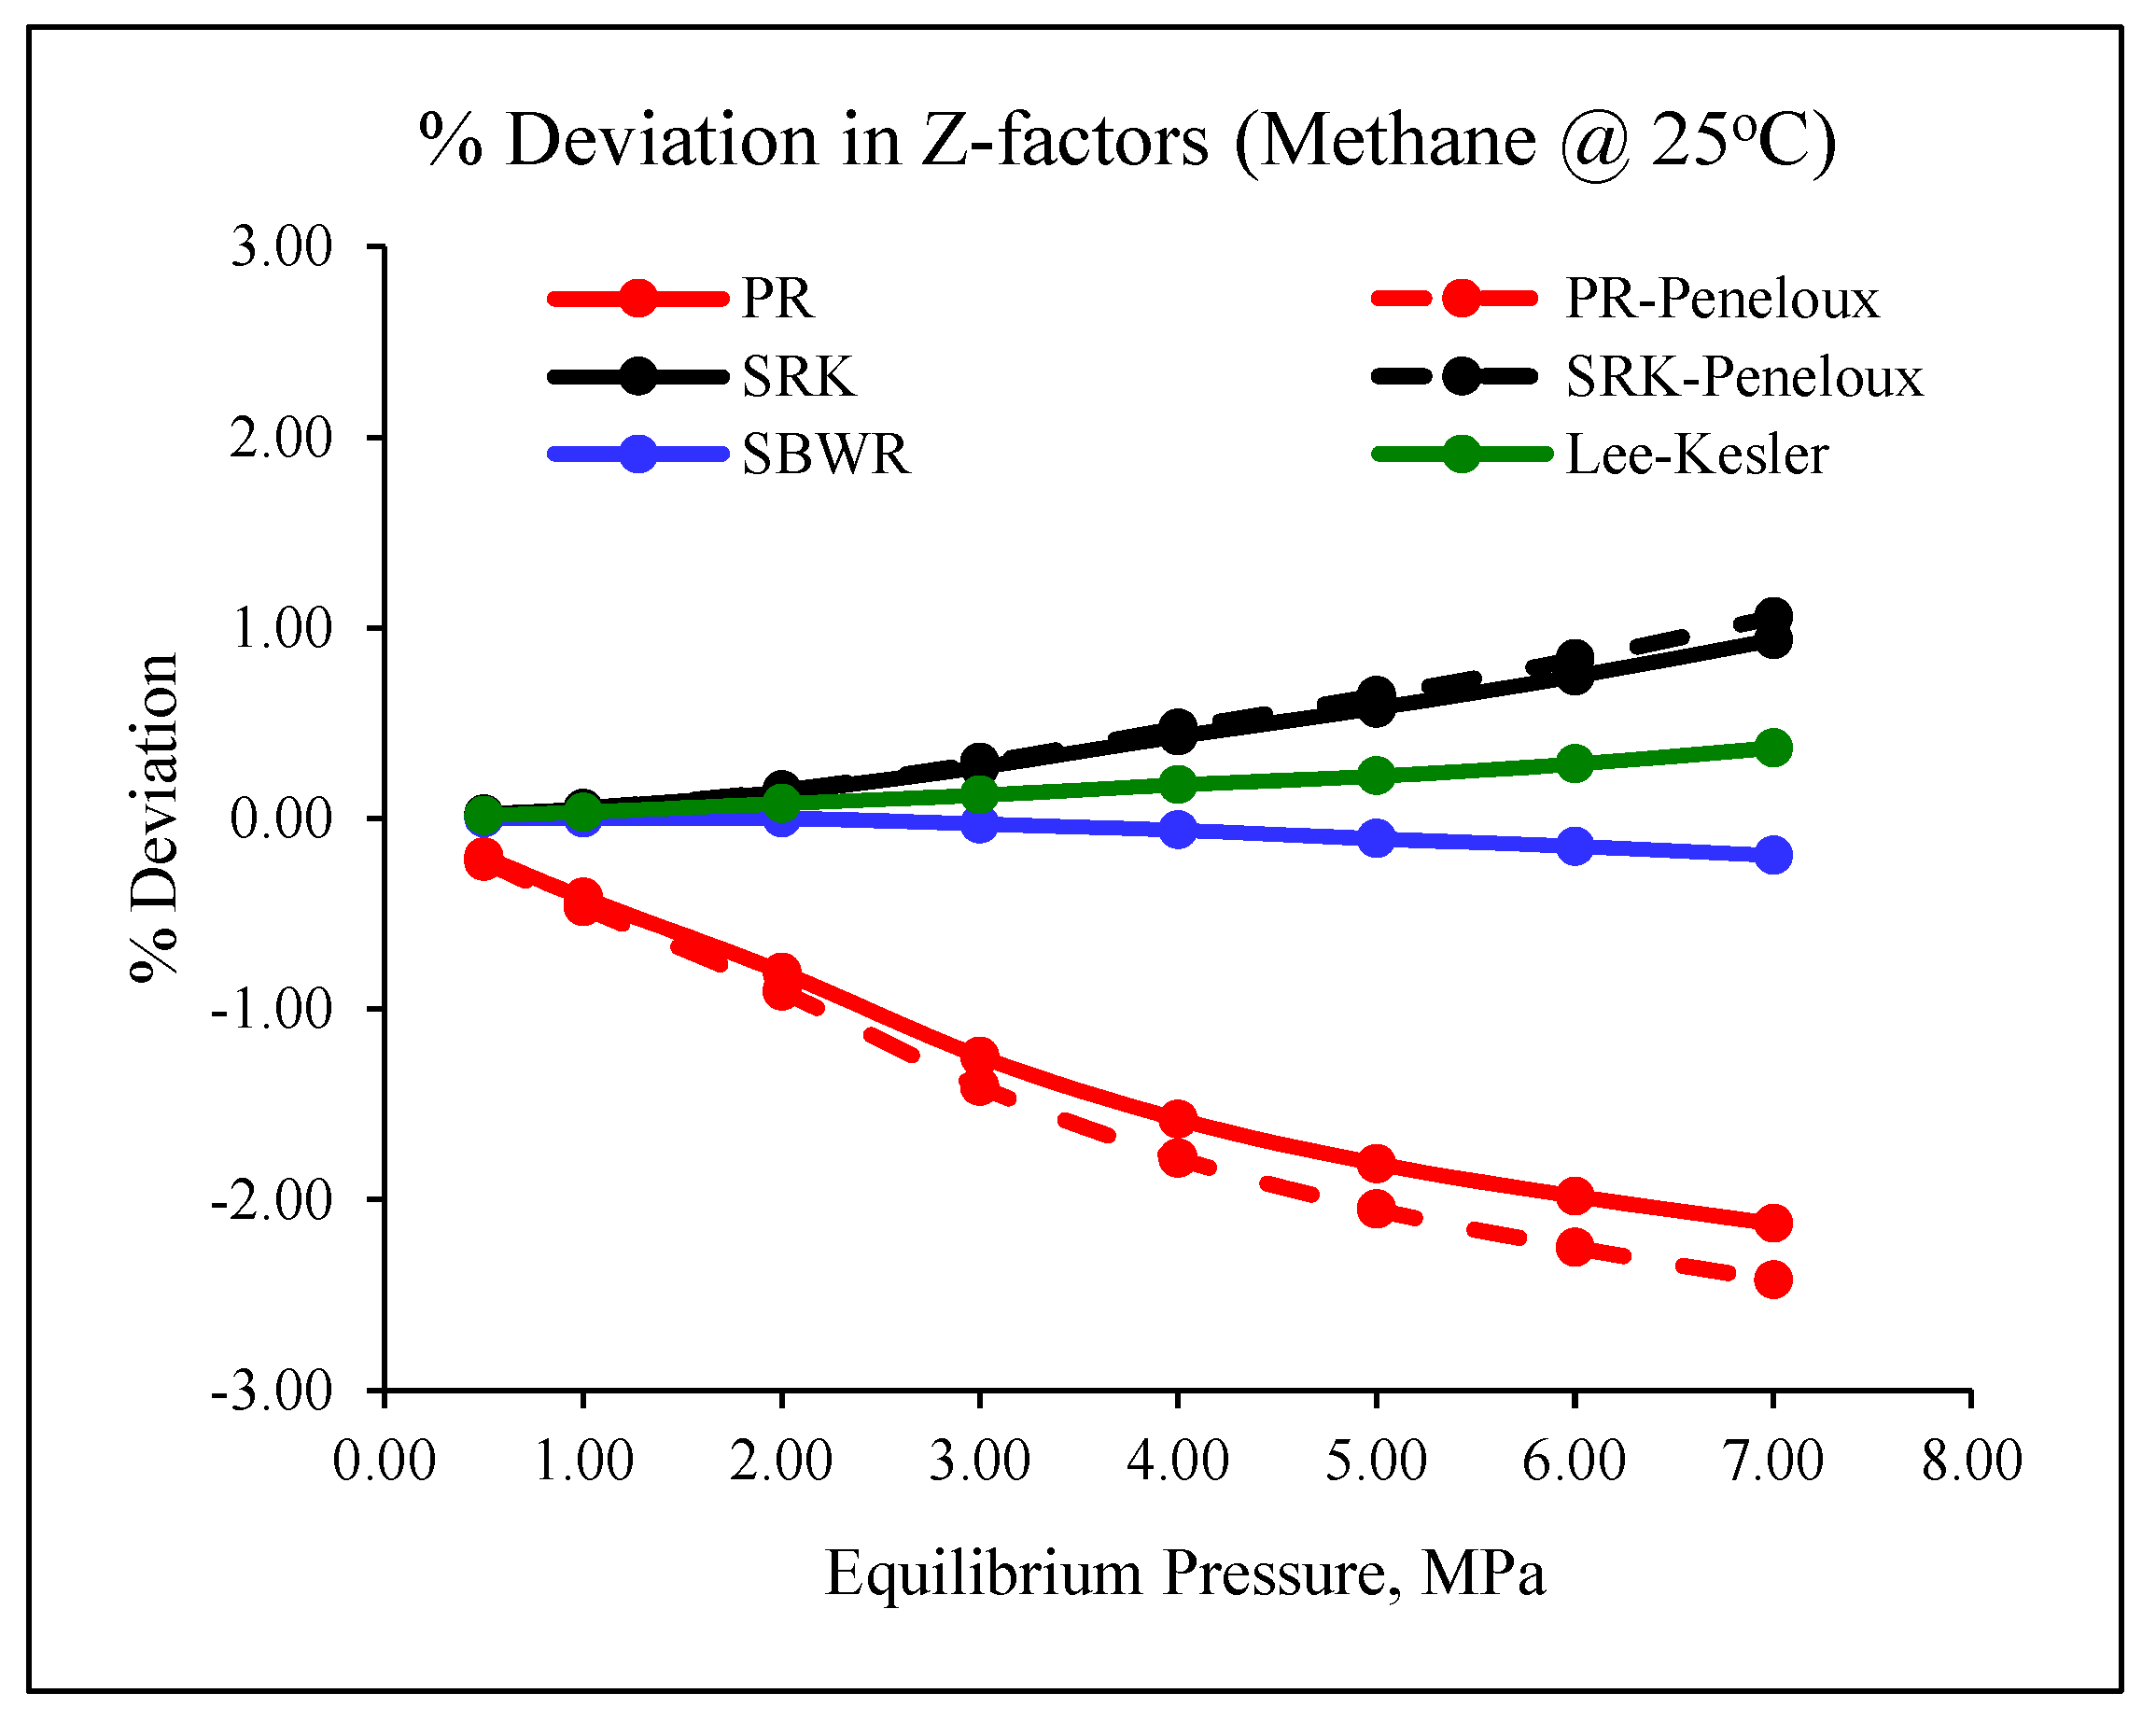
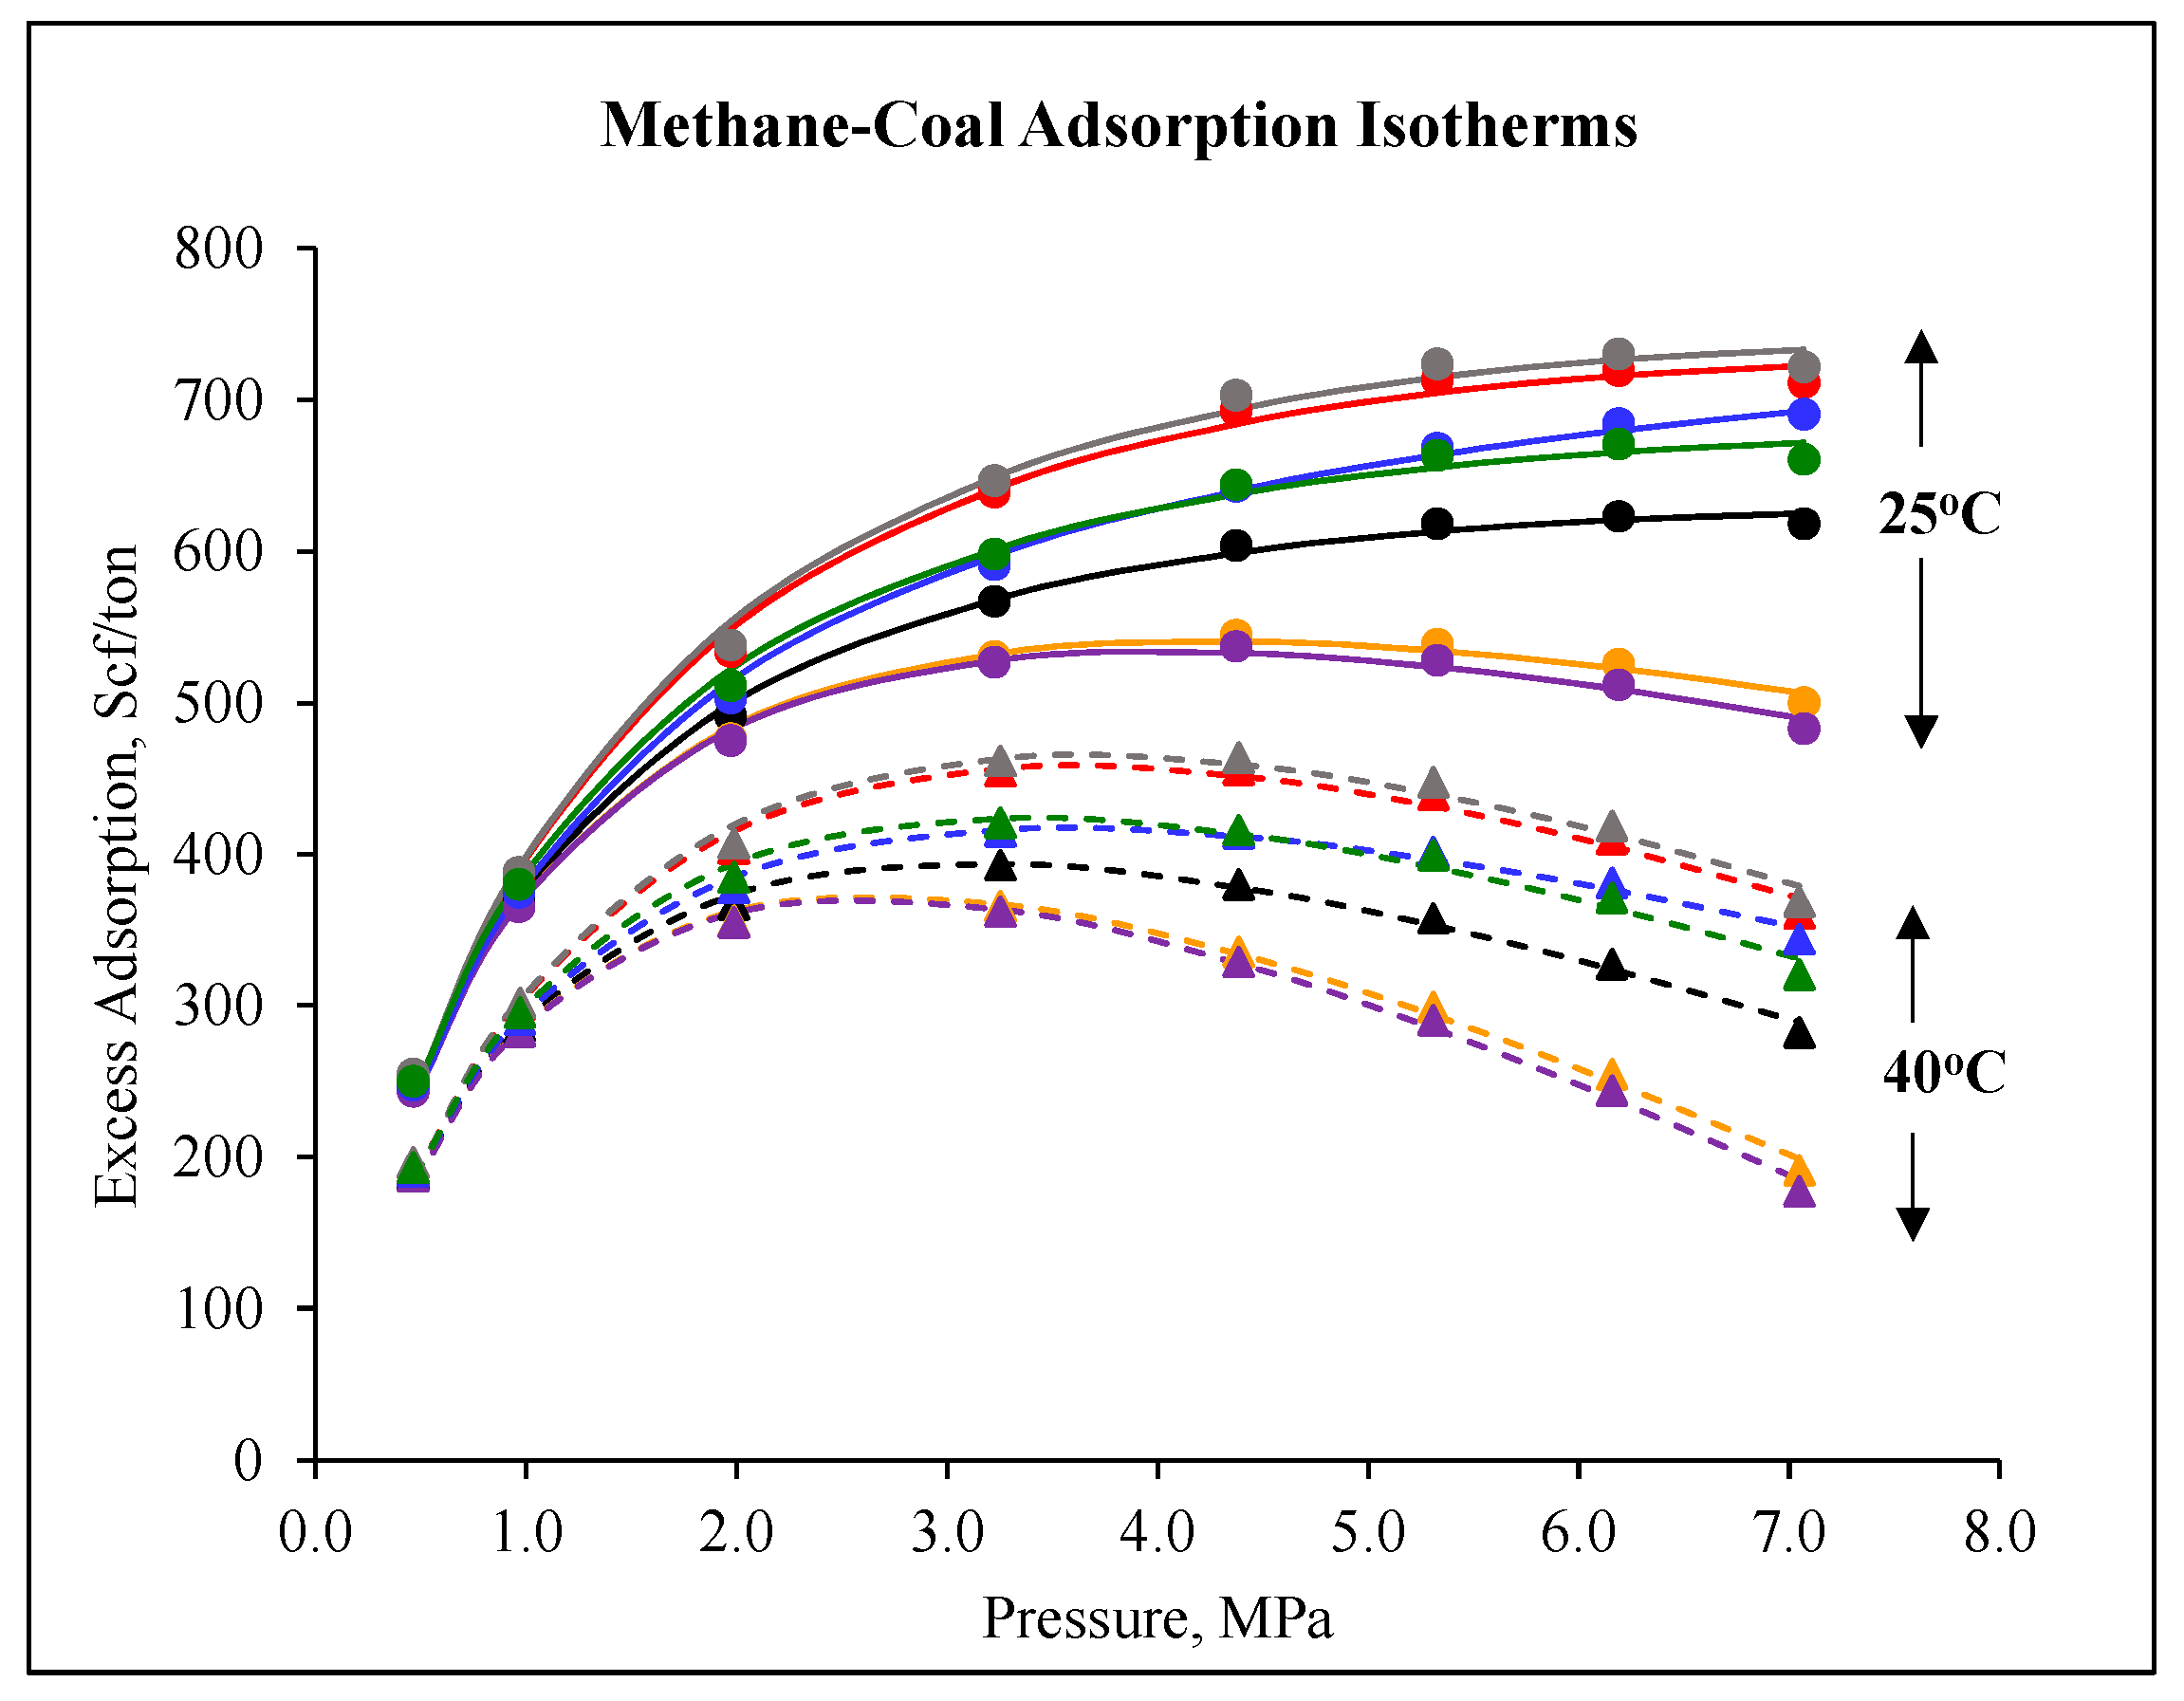
Figure 3 shows an example of the deviations in Z-factors of methane at 25 °C as a function of pressure for each EOS. For each sample, the deviations increase with pressure with PR-Peneloux showing the largest negative deviation while SBWR-EOS gave the closest Z-factor of methane relative to Setzmann and Wagner’s EOS. As shown in Figure 4, significant variations were also seen in the resulting adsorption isotherms for all EOSs. As expected, EOSs that gave negative deviations for Z-factor of methane resulted in adsorption isotherms higher than NIST-refprop’s. The size of the resultant isotherms, relative to that of the reference EOS, is determined by the combined effects of volume of free-space and Z-factor of methane. For example, PR-EOS and PR-Peneloux EOS gave nearly the same free space volume as the reference EOS but gave significant larger isotherms due to their lower Z-factors of methane while SBWR-EOS and Lee-Kesler, despite their higher Z-factors of methane, gave higher isotherms than the reference isotherm due their lower free space volumes. It is not surprising that the SRK-EOS and its volume-shifted version gave significantly lower isotherms relative to the reference given that the volumes of free-space and Z-factors of methane are higher for both compared to the reference EOS.
3.3. Methane-Coal Desorption Isotherms & Sorption Hysteresis
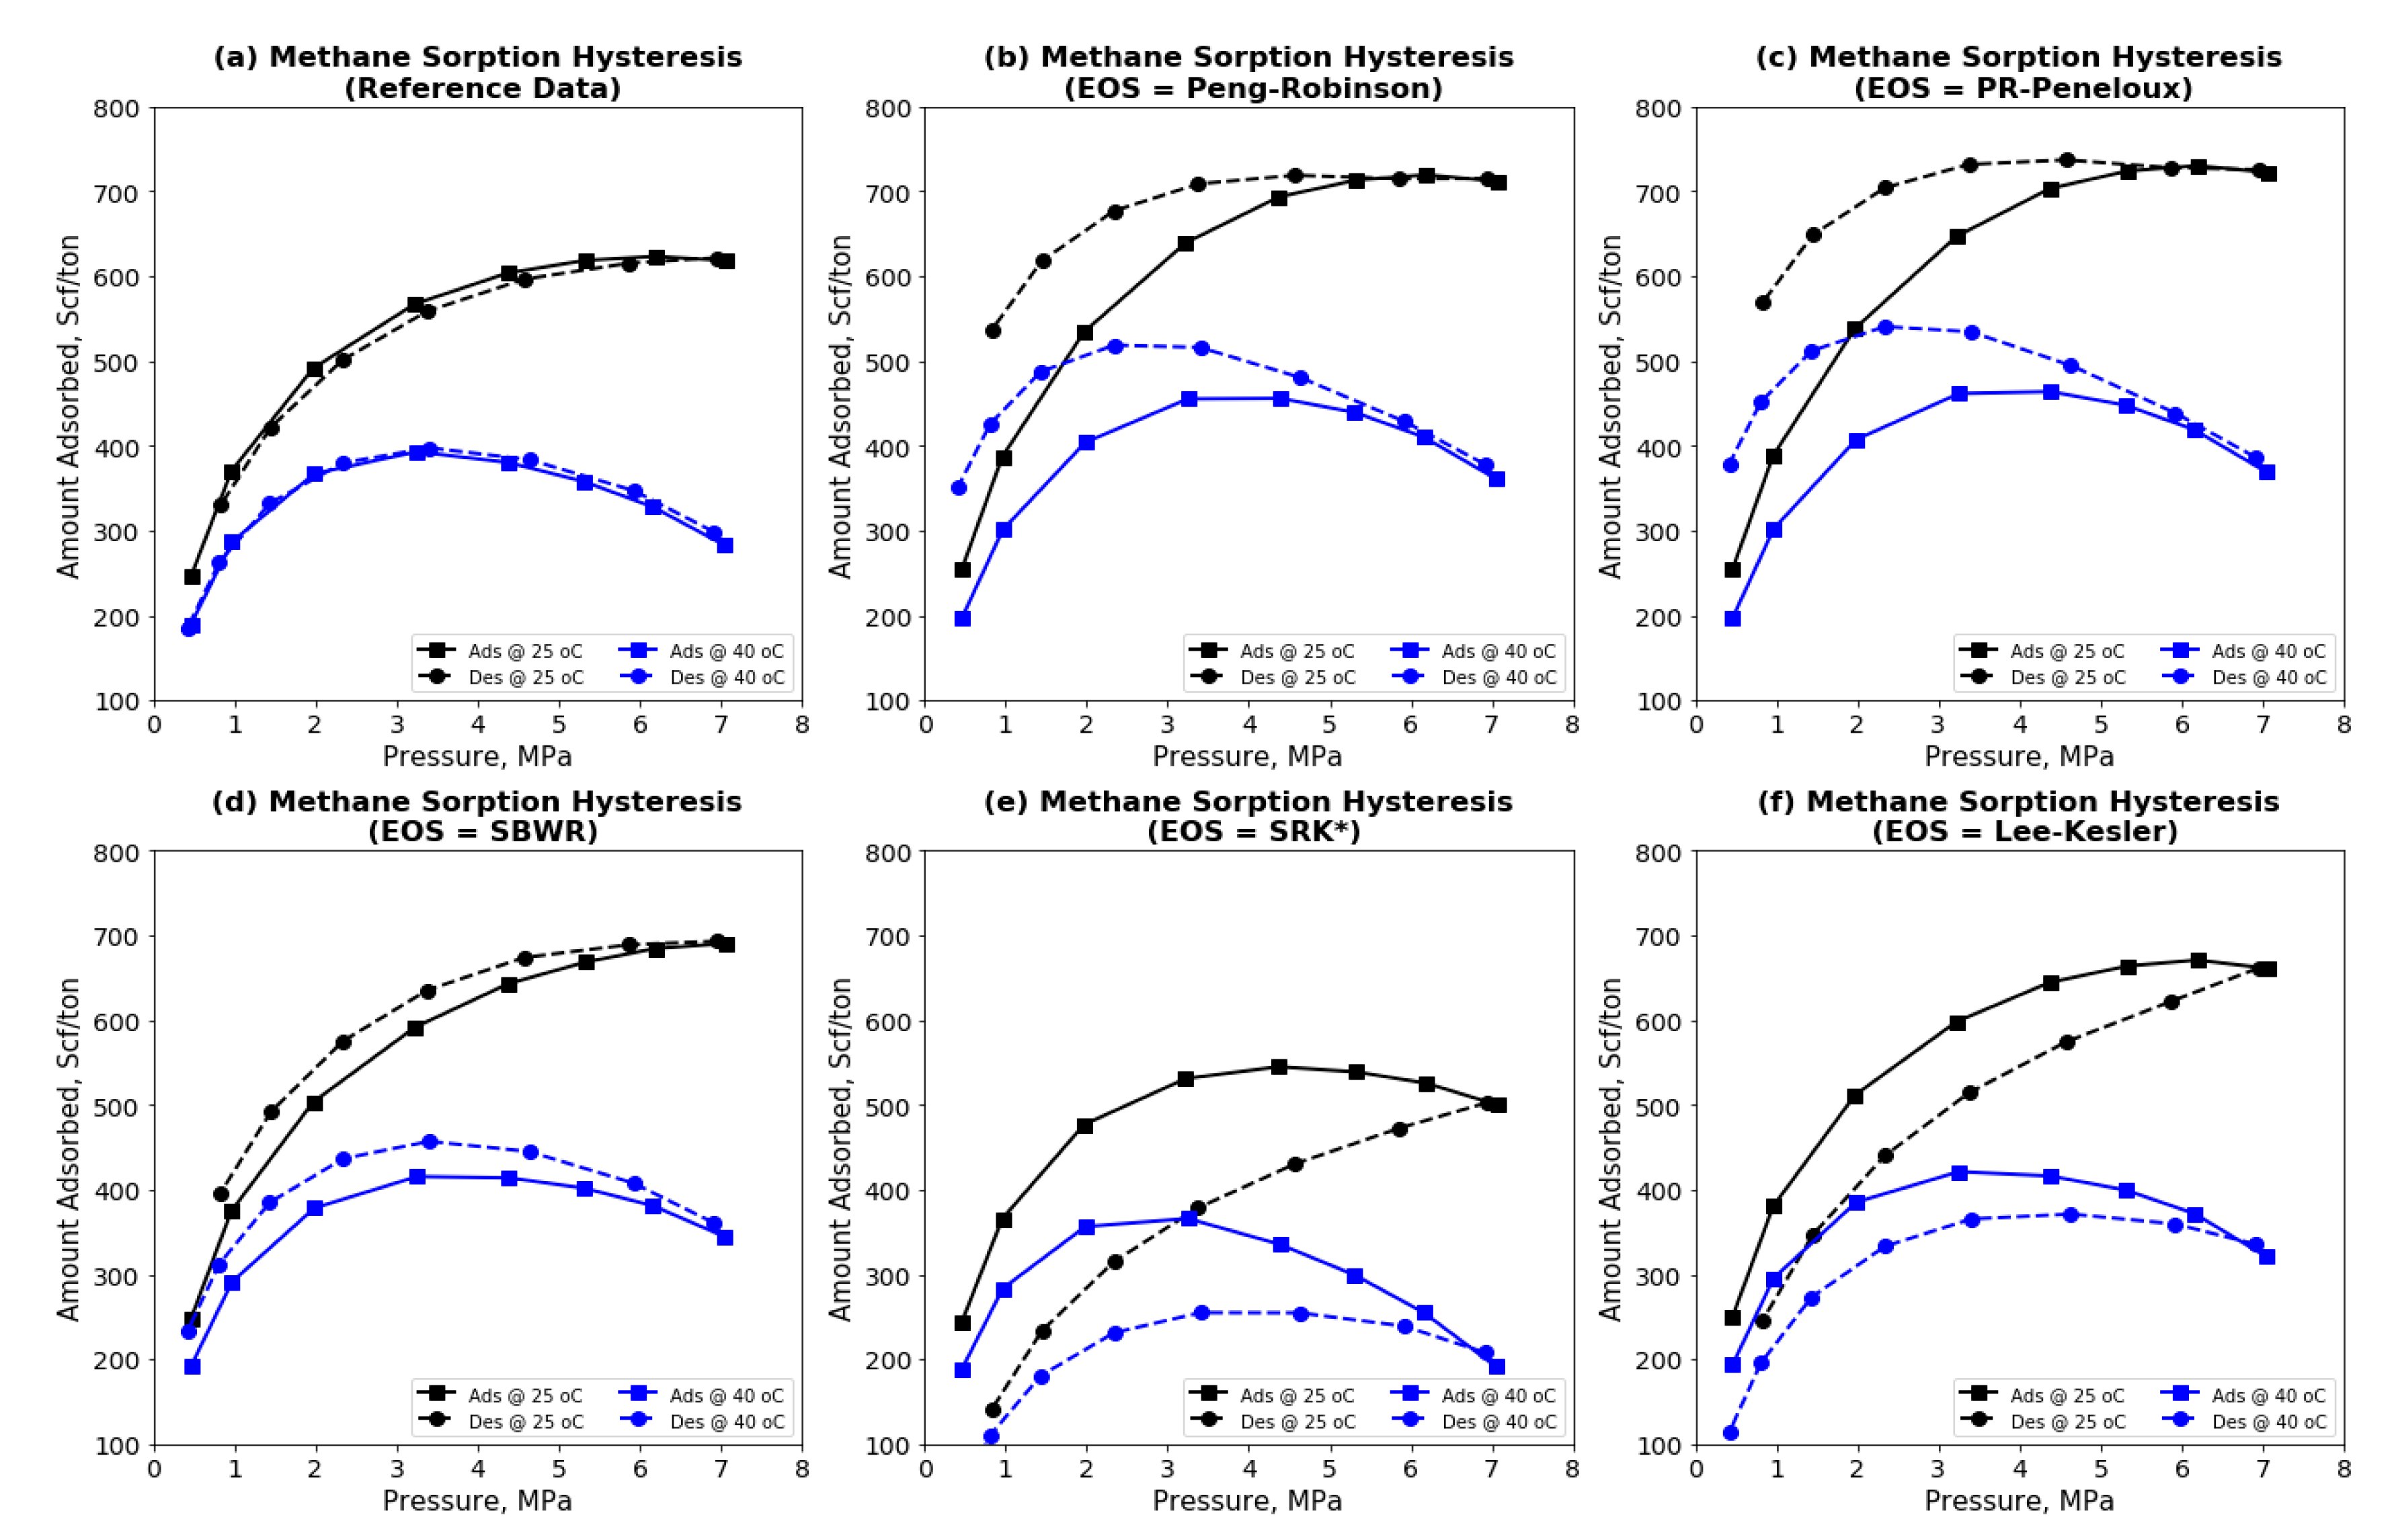
It is clear from Section 3.2 that adsorption isotherms from the same experimental data vary significantly for different EOSs. Similar observations are made with desorption isotherms and hysteresis between the adsorption and desorption isotherms. Figure 5 shows the adsorption and desorption isotherms for different EOSs.
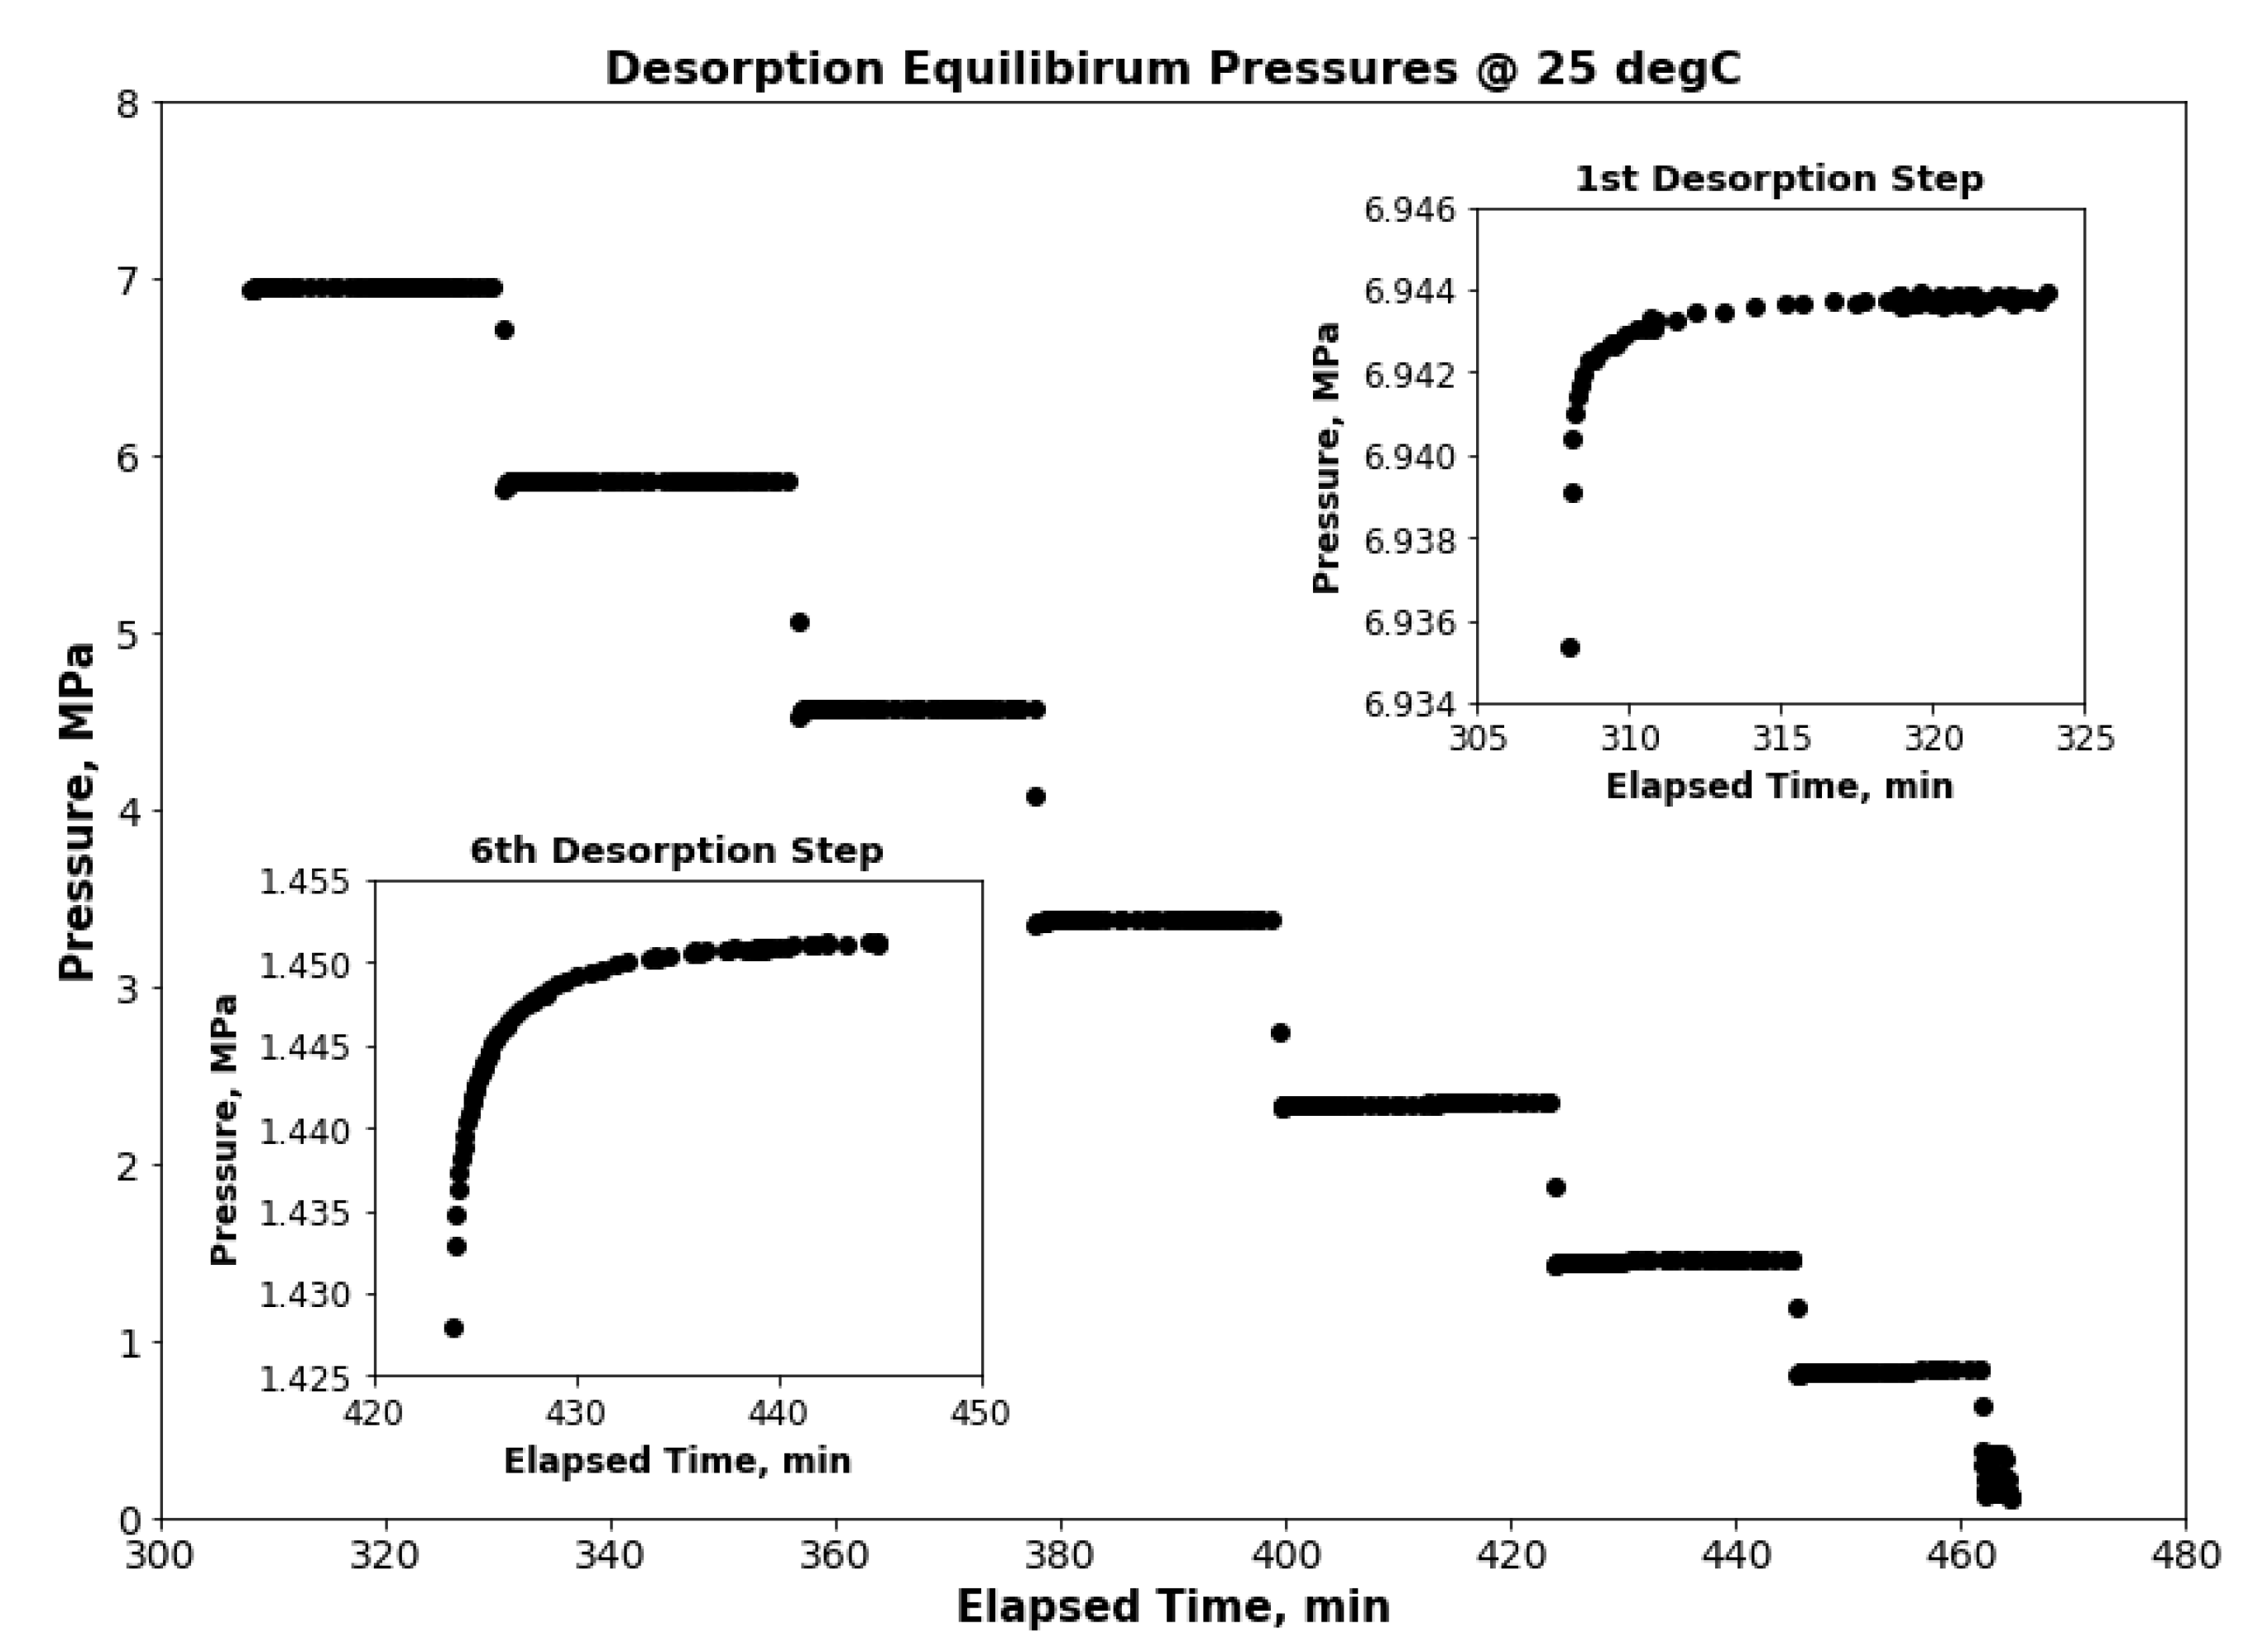
Negligible hysteresis can be seen between the adsorption and desorption isotherms for NIST-refprop® at both temperatures. For the measurements at 25 °C, the desorption isotherm is slightly lower than the adsorption isotherm for most test pressures (Figure 5a). Although the reason for this behavior is not clear, it is unlikely due to any significant irreversible structural changes to the coal sample, as postulated by He et al. [26], given the near negligible difference between the isotherms. Also, pressure equilibrium was achieved (as shown in Figure 6) for each desorption step, therefore, pressure non-equilibration was also ruled out as a reason for this anomaly. Thus, it is assumed that this observation may be related to measurement uncertainties especially fluctuations in experimental temperature.
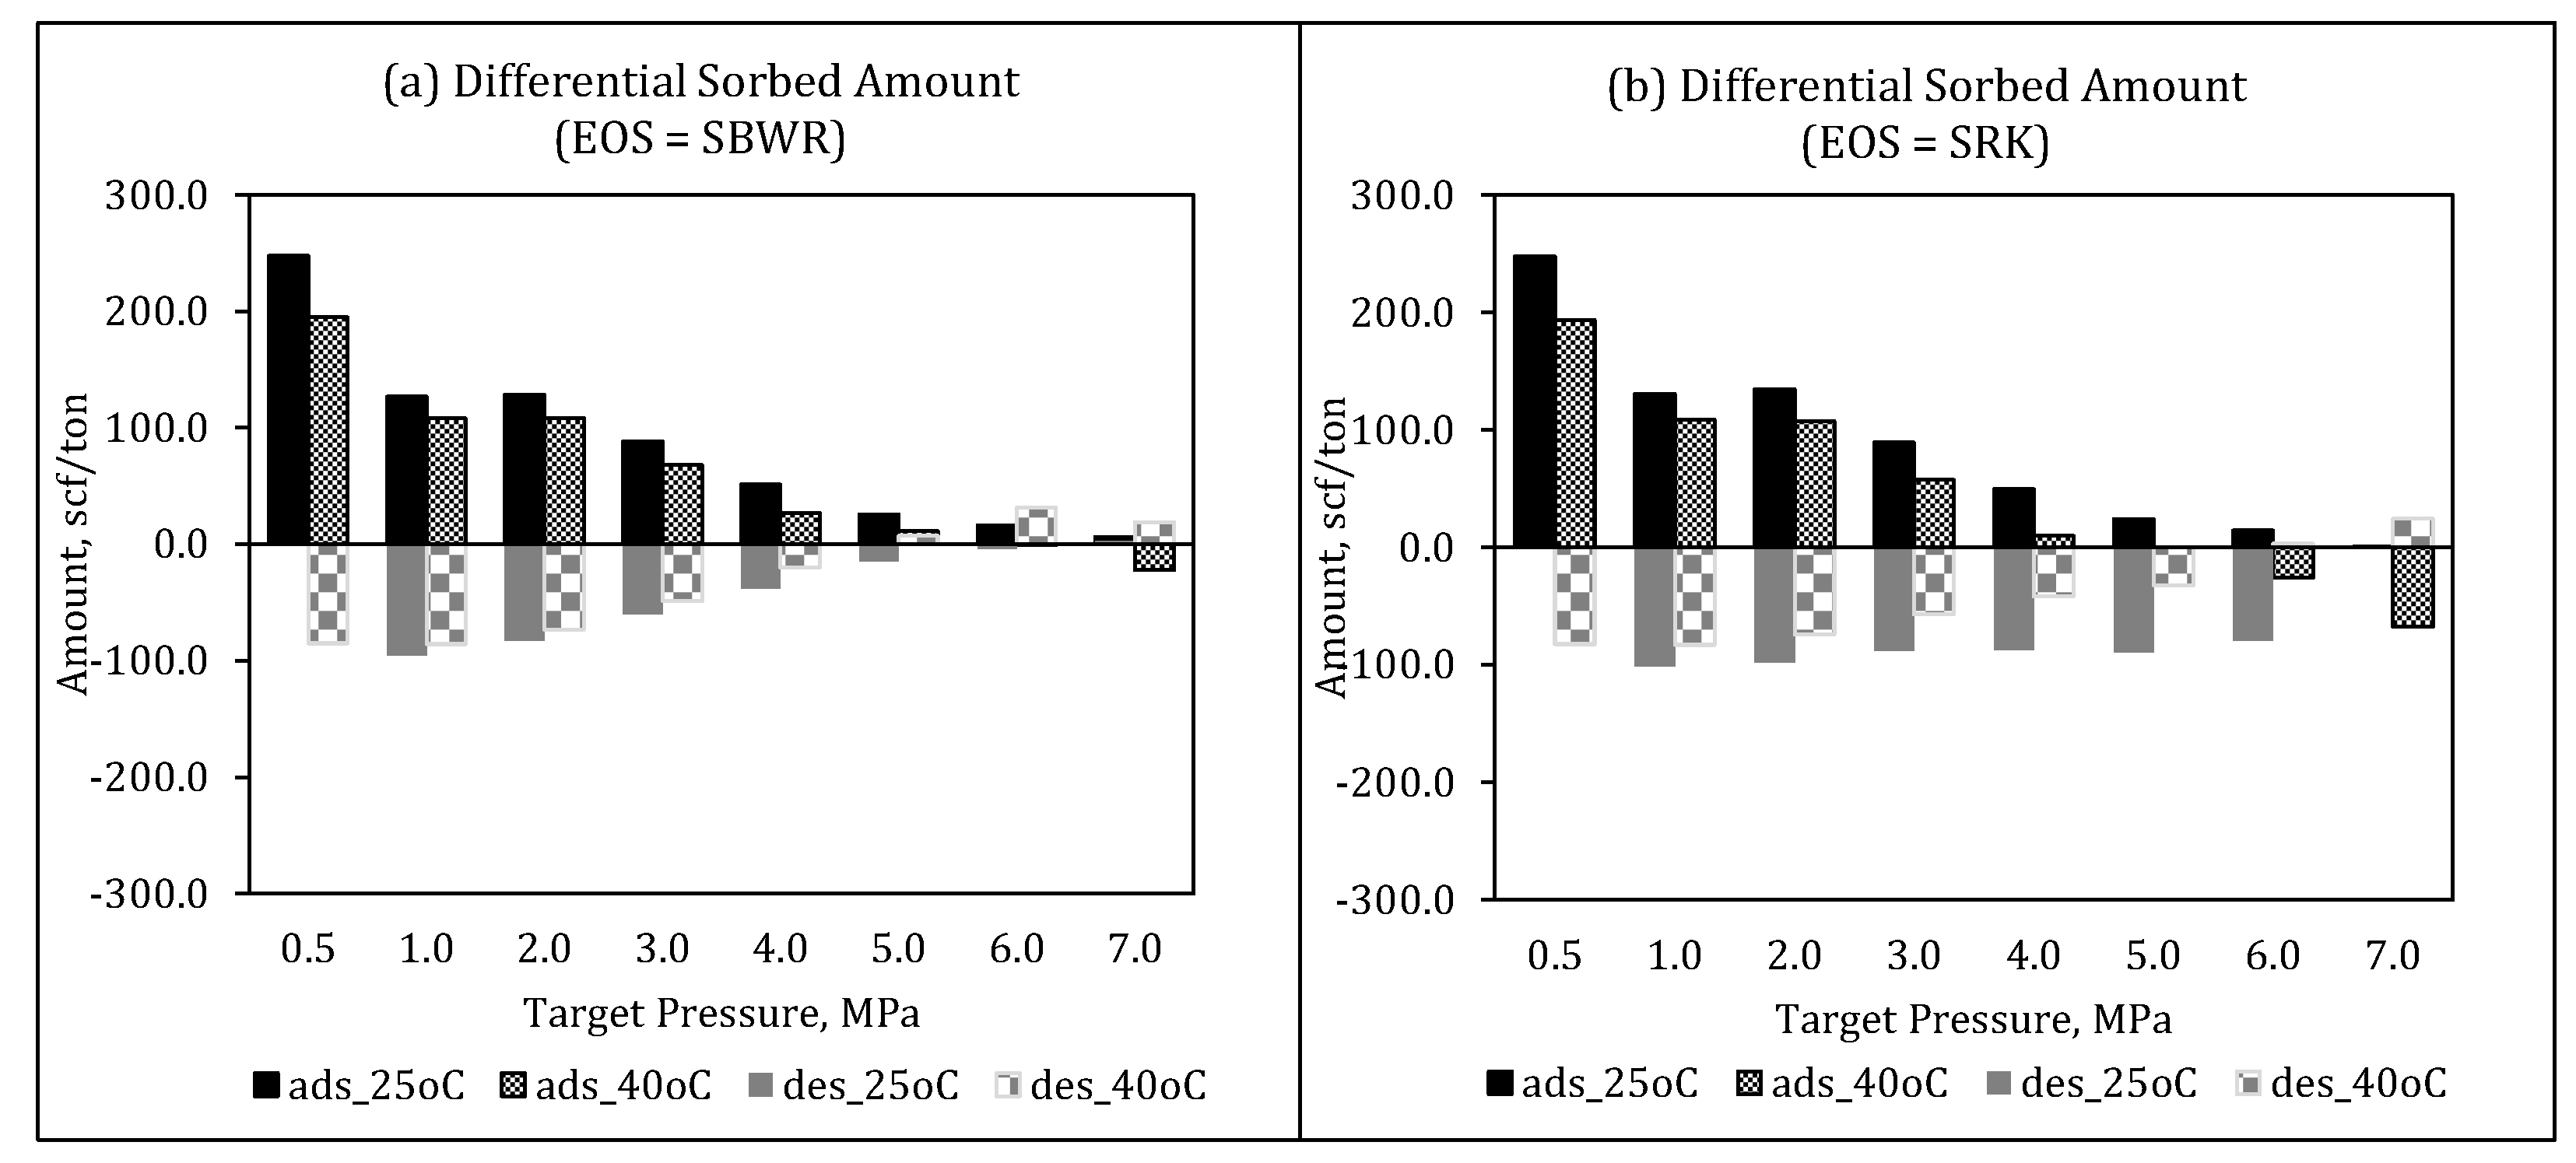
Compared to refprop, each of the comparison EOS gave significant differences between the adsorption and desorption isotherms (Figure 5b–f) leading to two types of observed sorption hysteresis. On one hand, EOSs (that is PR-Peneloux, PR-EOS and SBWR-EOS) that gave lower values of Z-factor for methane resulted in positive hysteresis and the more negatively deviated the Z-factors are, the bigger the observed hysteresis loop. As shown in the example plot in Figure 7a, these EOSs gave lower differential amounts of desorbed gas than the corresponding differential amounts adsorbed. Conversely, EOSs (that is SRK-Peneloux, SRK-EOS and LK-EOS) that gave positive relative deviations for Z-factors of methane [10] produced negative hysteresis loops and the more positively deviated the Z-factors are, the larger the loop. As shown in the example plot in Figure 7b, each of these EOSs gave differential amounts of gas desorbed greater, for most of the pressure steps, than the corresponding differential amounts adsorbed.
3.4. Langmuir Parameters
Table 3 shows the model parameters obtained by fitting the 3-parameter Langmuir model to each of the adsorption isotherms. The results showed that model achieved over 99% match with each of the isotherms as indicated by the R2 values. For each EOS, it was also observed that Langmuir volume and adsorbed phase density are lower, while Langmuir pressure is higher, at 40 °C than the corresponding values at 25 °C due to the reducing effect of temperature on gas adsorption [12,13,14,31,32]. The lower adsorbed phase density at 40 °C is an indication of the temperature-dependent nature of this parameter which is often assumed to be constant [13,21,32,39]. SBWR-EOS gave the closest values of Langmuir volume and pressure compared to NIST-refprop at both temperatures. Conversely, PR-EOS and PR-Peneloux gave the largest deviations for these parameters relative to the reference values. These observations agree with the deviations of Z-factors of methane obtained from these EOSs. Lastly, the adsorbed phase density obtained from SBWR-EOS at 25 °C is large and as such, the ratio of the bulk gas density at each pressure to adsorbed phase density is negligibly small so that excess adsorption approximates absolute adsorption for this EOS at this temperature.
3.5. Original Gas in-Place
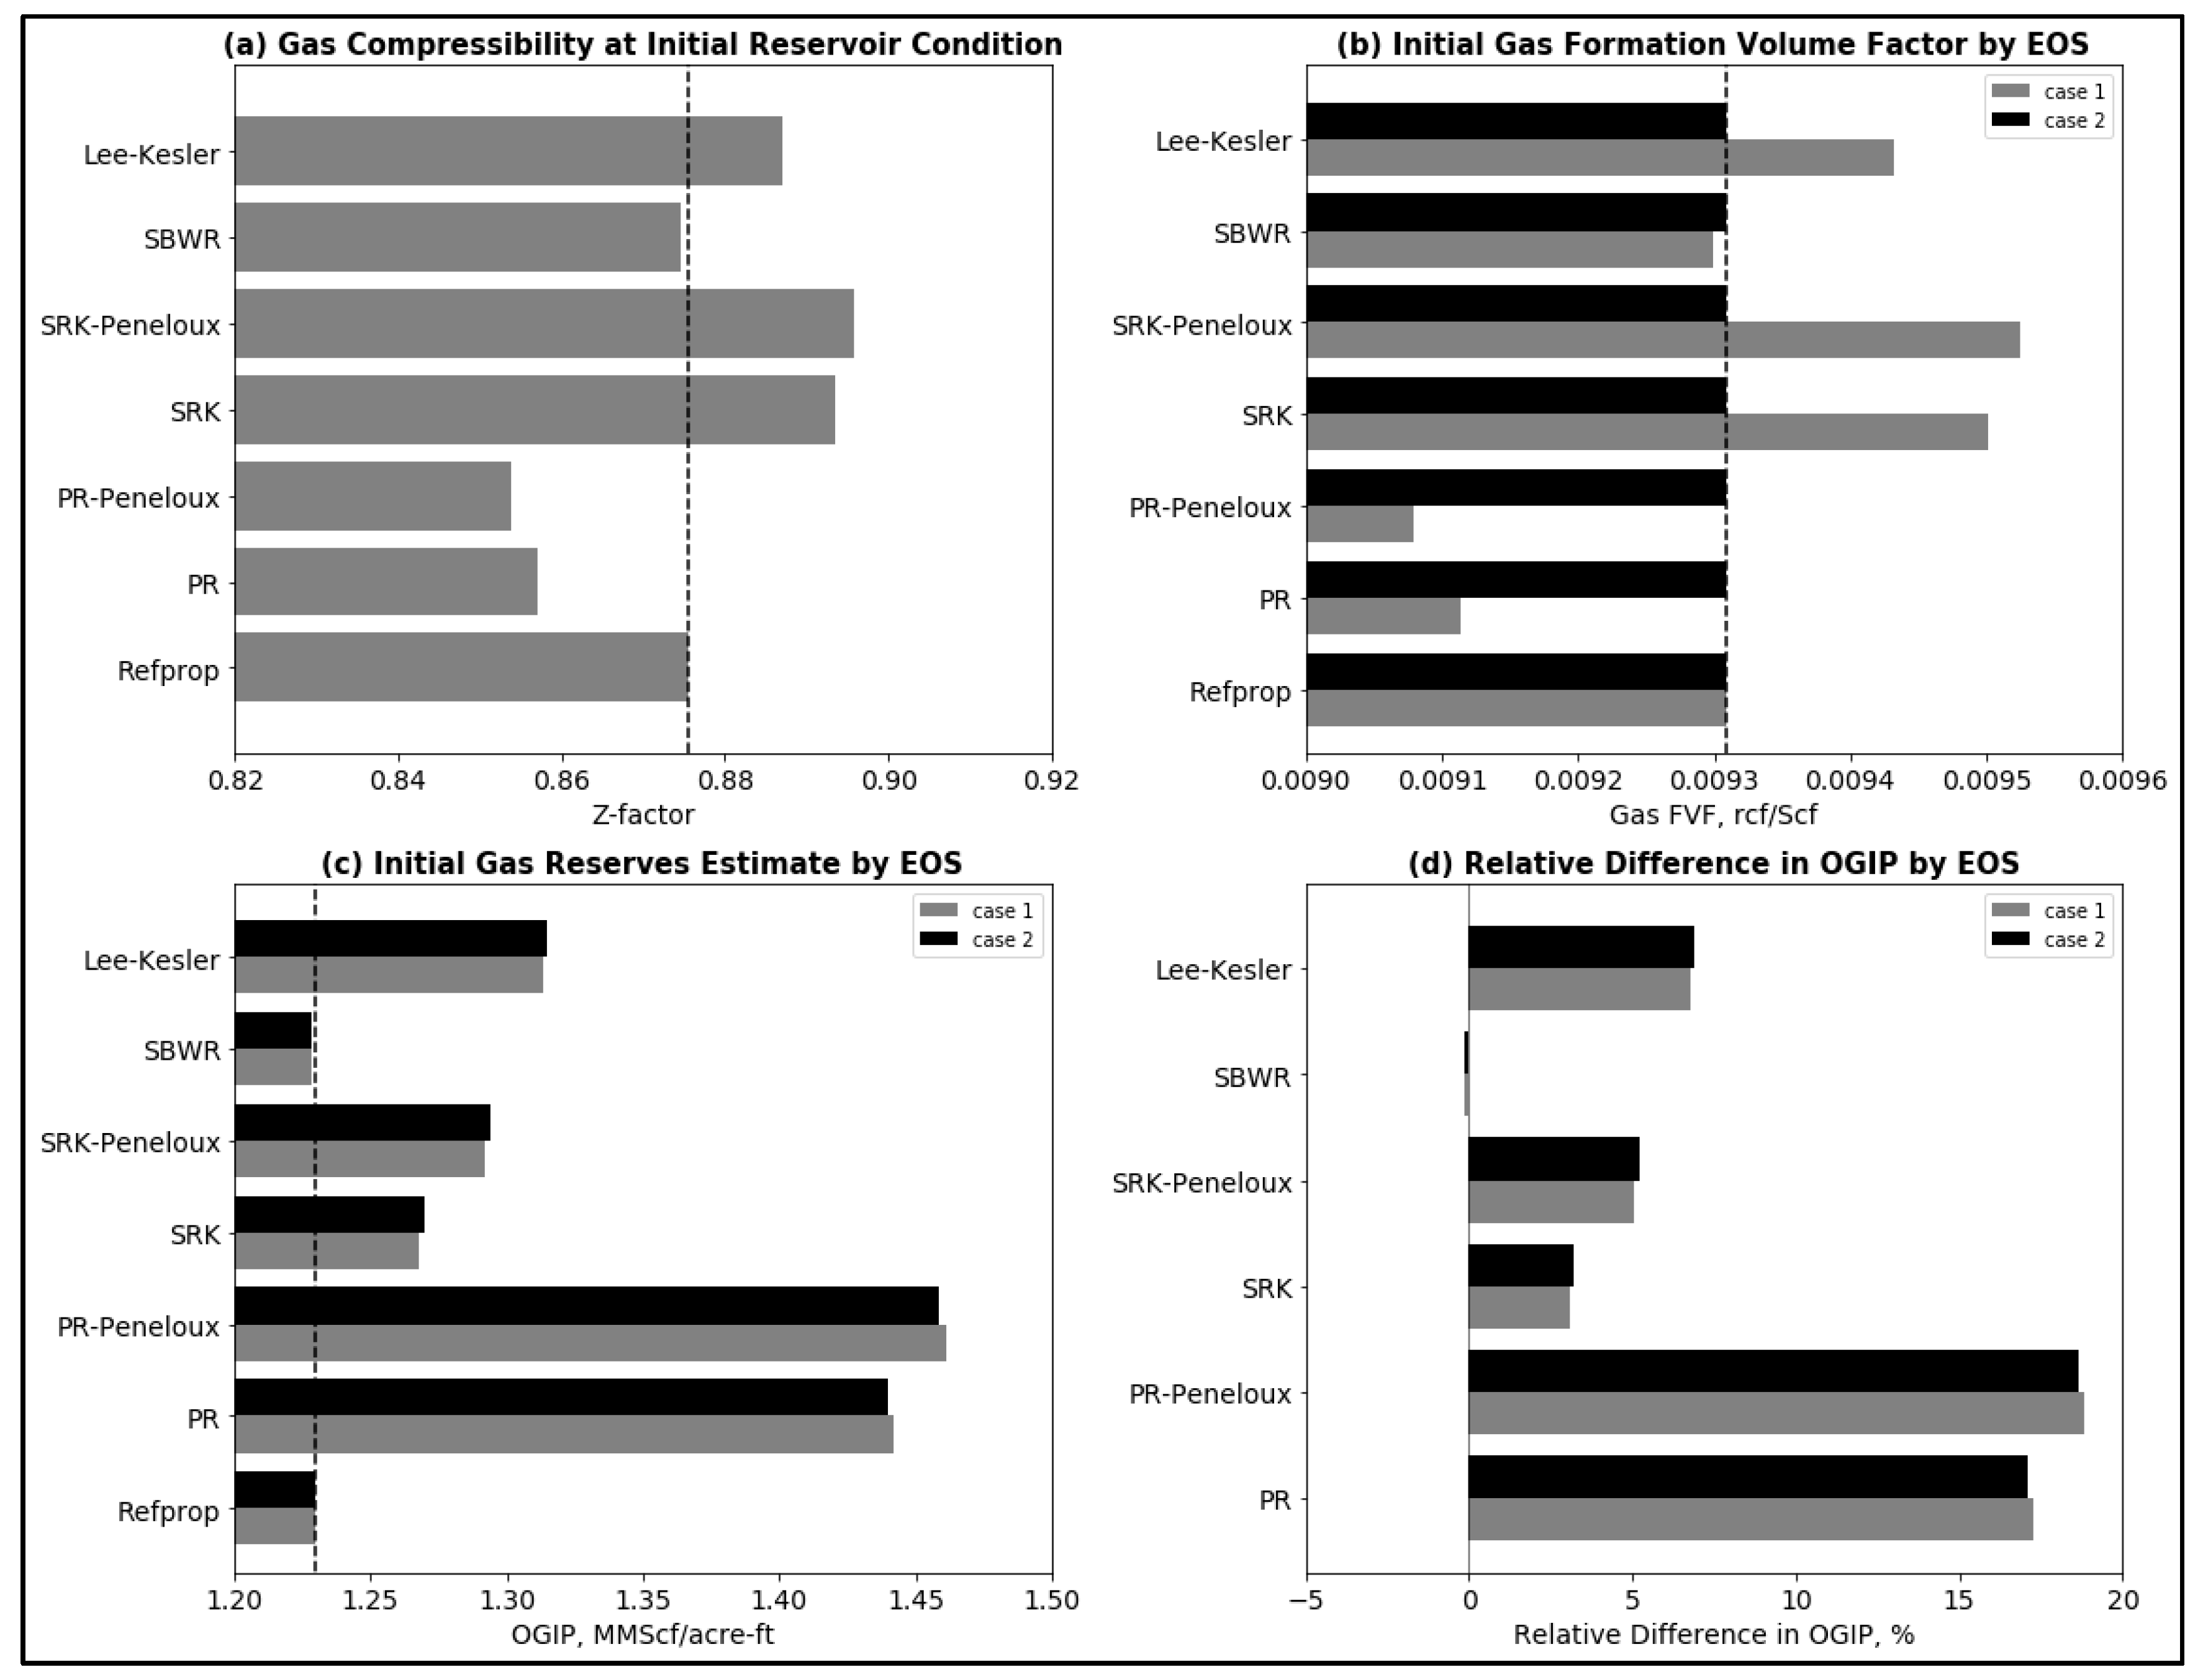
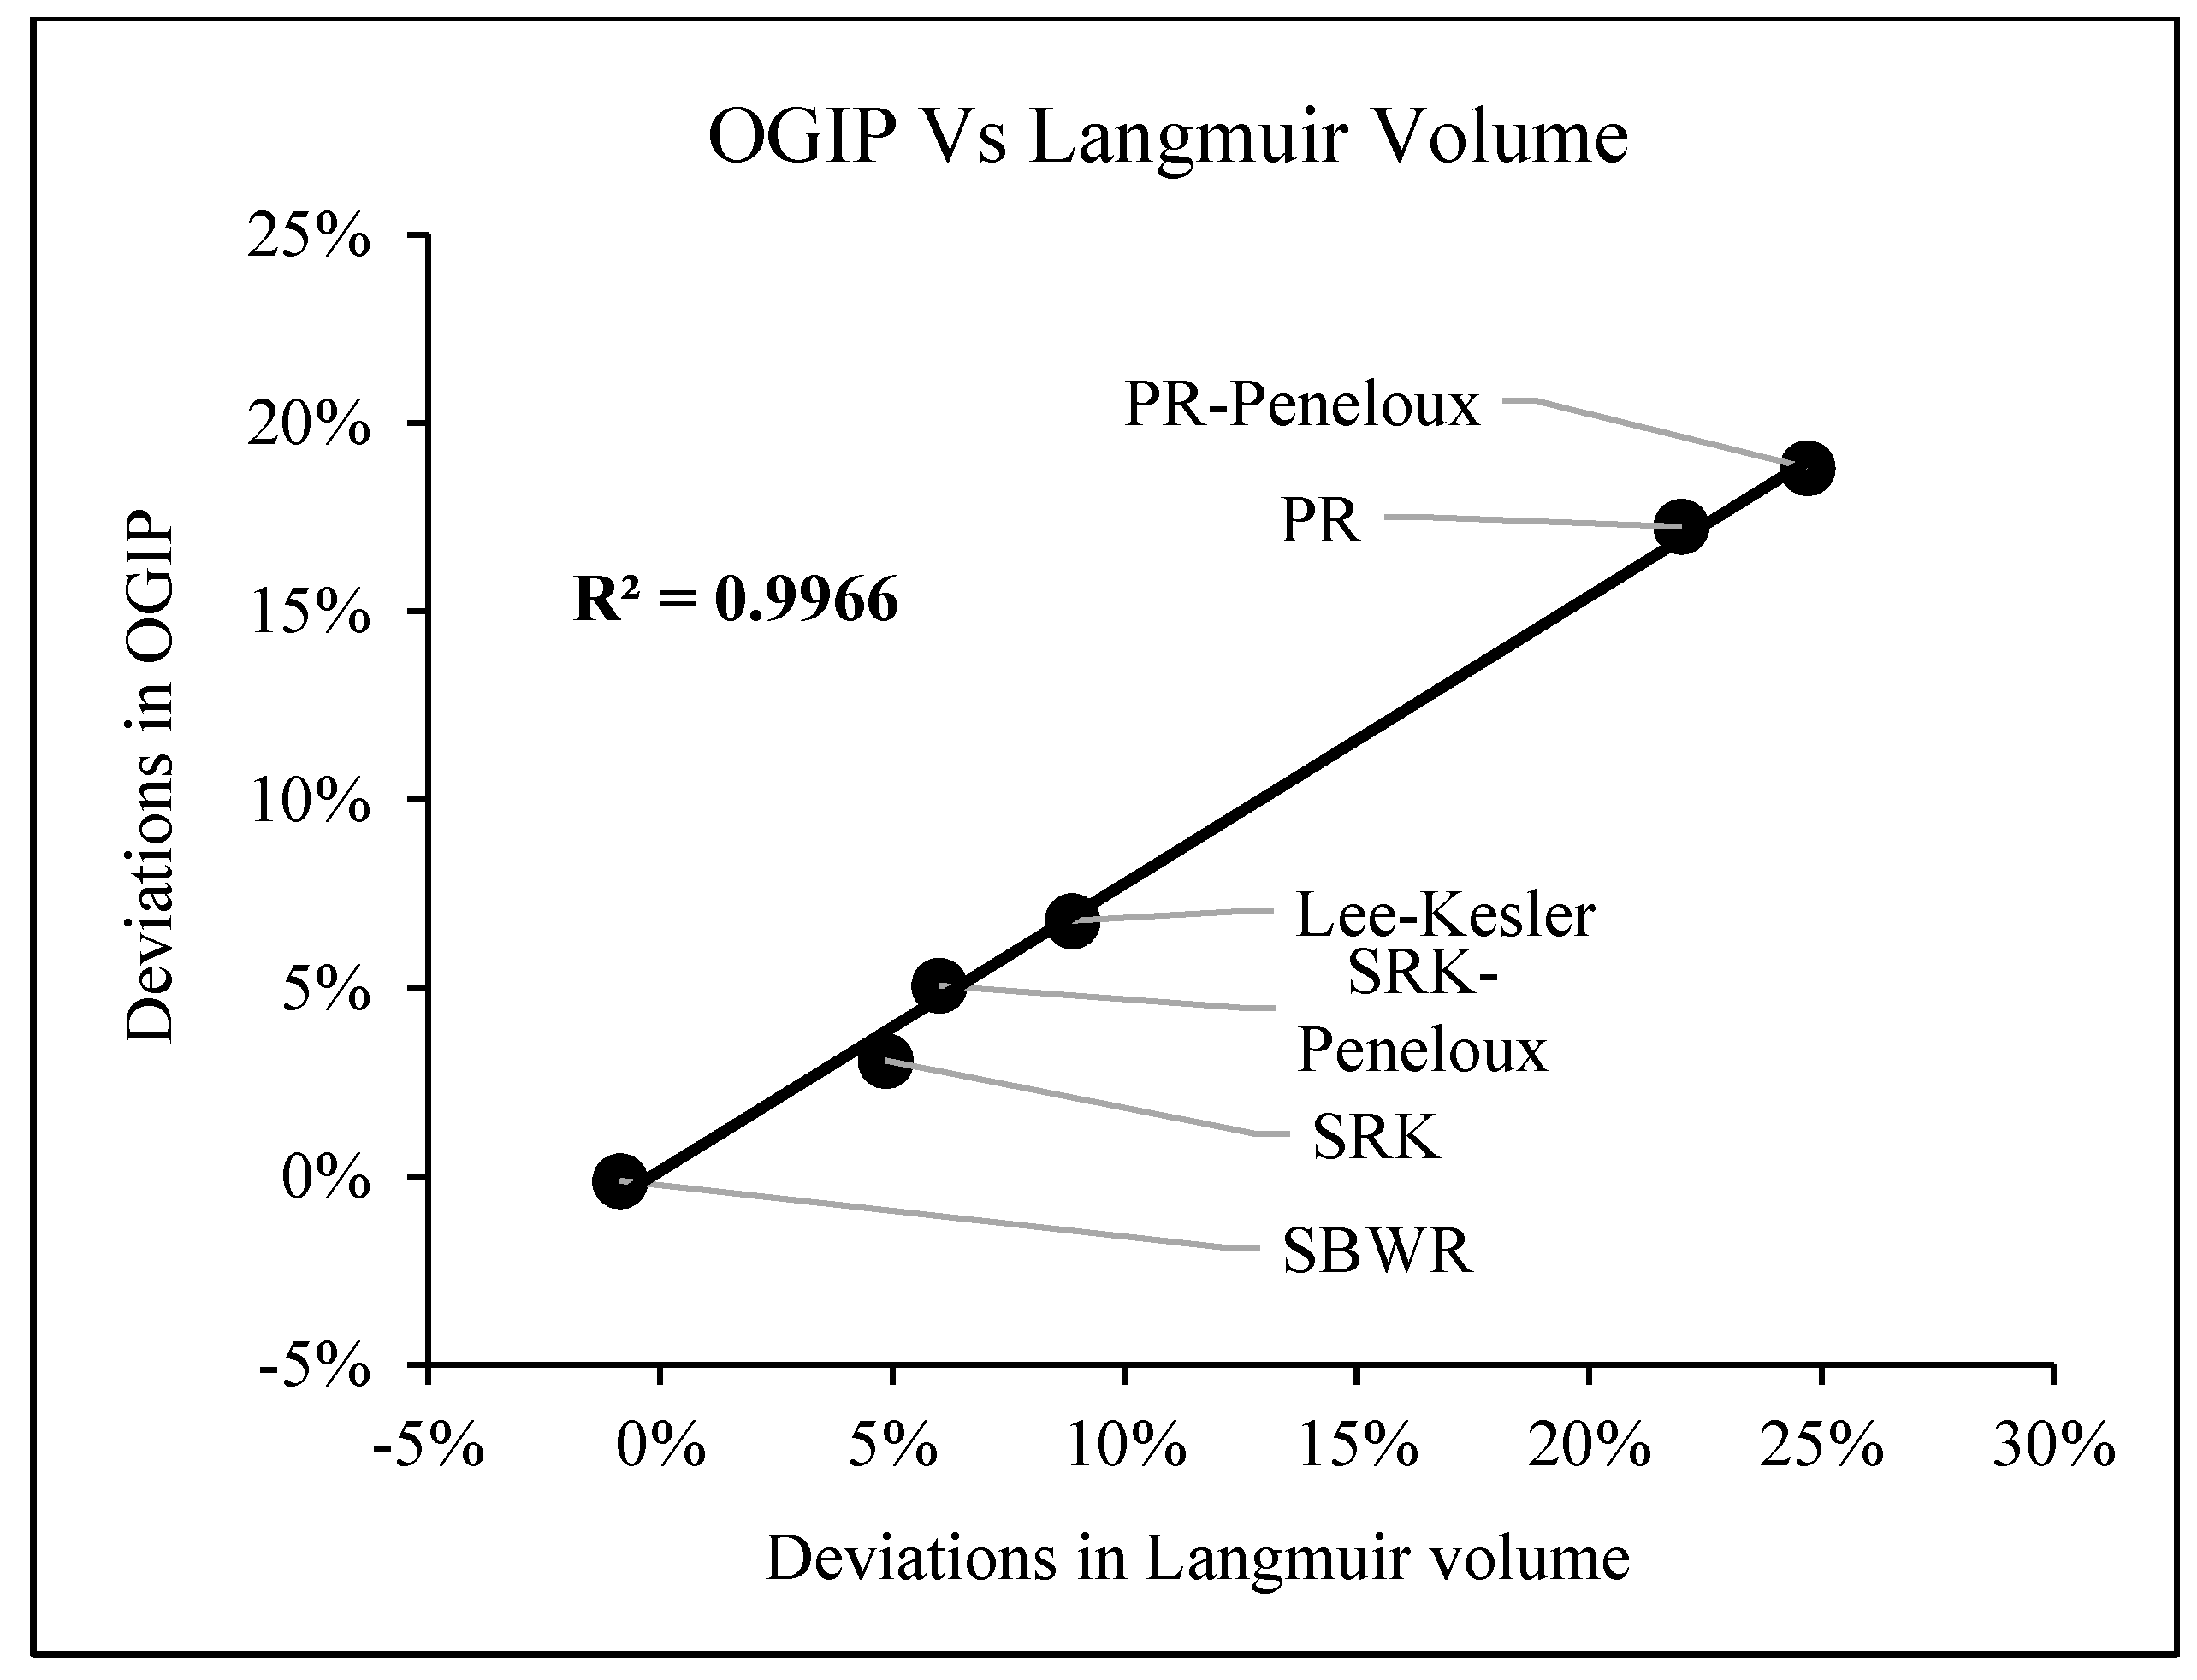
Figure 8 shows the calculated initial Z-factor, initial gas FVF, OGIP and relative differences in the calculated OGIP for each EOS. Similar to previous observations on variations in z-factors of methane, PR-Peneloux, PR and SBWR EOSs gave lower values of Z-factor of methane compared to the Setzmann & Wagner’s (shown as refprop in Figure 8) while SRK-Peneloux, SRK and Lee-Kesler EOSs gave higher values. The corresponding values of initial gas FVF are shown in Figure 8b (grey bars). Given the direct relationship between Z-factor and gas FVF (as shown in Equation (7)), the calculated initial gas FVF followed the same trend as the Z-factors. The black bars in Figure 8b represent the constant value of gas FVF for case 2. This constant value is the reference gas FVF obtained from Setzmann and Wagner’s EOS. As shown in Figure 8c, the calculated OGIPs for cases 1 and 2 show minimal differences. This implies that gas FVF (by implication z-factor) has negligible effect on OGIP for this coal. Therefore, it can be concluded that the observed variation in calculated OGIPs is primarily caused by the variation in Langmuir parameters obtained with the different EOSs. As shown in Figure 8d, SBWR-EOS gave the lowest deviation in OGIP relative to refprop while PR-Peneloux EOS gave the largest deviation. As shown in Figure 9, these deviations correlate directly with deviations of Langmuir volume (or pressure) relative to the refprop.
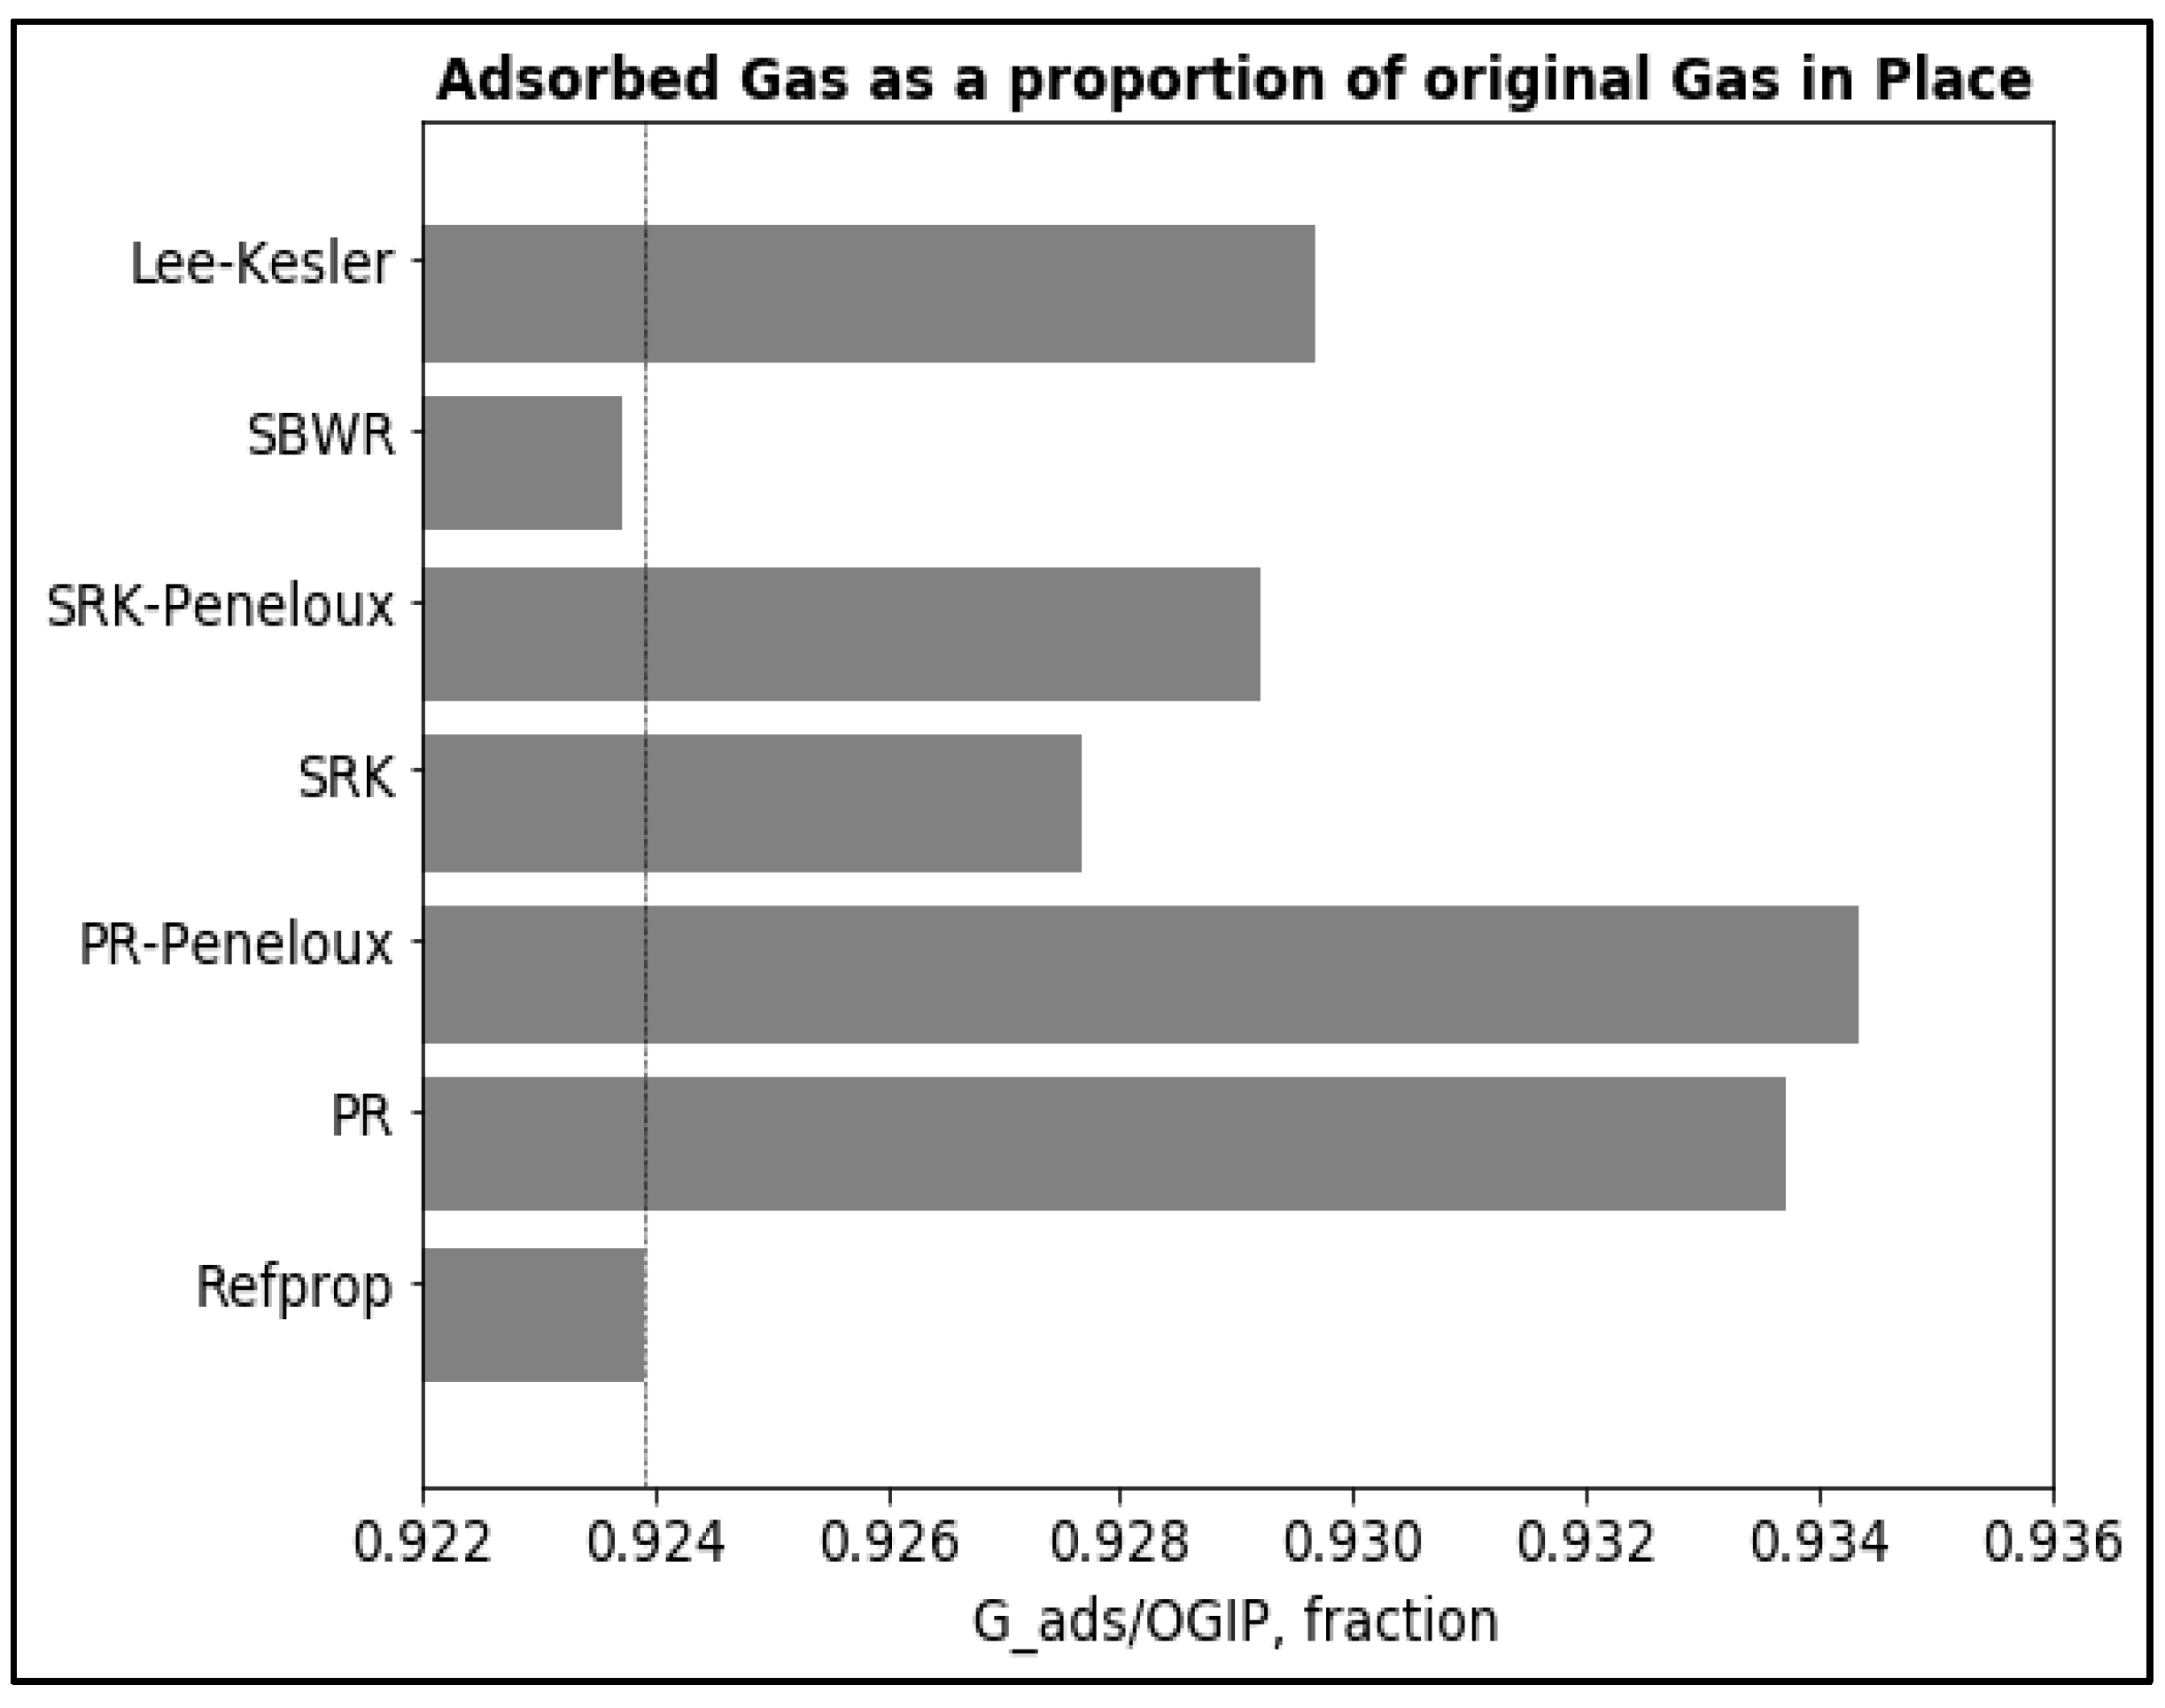
The proportion of OGIP that is adsorbed is shown in Figure 10. It is not unsurprising that the adsorbed gas accounted for over 90% of gas in-place (for each EOS) given the initial porosity and initial water saturation in the cleats (see Table 2). This is also supported by the sample’s pore-size distribution which contains less than 10% of macropores.
4. Conclusions
This paper presents the effects of equations of state on the results of high-pressure volumetric measurements of methane adsorption and desorption isotherms on a coal sample. The results showed that all the equations of state tested gave varied deviations in the measured isotherms, calculated Langmuir parameters, observed type and degree of sorption hysteresis and original gas in-place because of the variations in the calculated Z-factors of both helium and methane relative to NIST-refprop. It can be concluded that:
- (1)
- Gas compressibility factors have significant effects on high-pressure adsorption and desorption isotherms of methane on coal.
- (2)
- Langmuir parameters also varied significantly with the choice of EOS with the SBWR-EOS having the closest values of Langmuir volumes and pressures to NIST-refprop at both test temperatures.
- (3)
- For each EOS, Langmuir volume and adsorbed phase density are lower at 40 °C than the corresponding values at 25 °C because of the negative effect of temperature on adsorption.
- (4)
- High-pressure methane-coal adsorption-desorption hysteresis is not a unique phenomenon; its existence, degree and type depend on the applied EOS.
- (5)
- For both test temperatures, negligible hysteresis was observed for the reference EOS while a relationship was observed between the deviations of methane Z-factor for each EOS (relative to Setzmann and Wagner’s) and the type of sorption hysteresis observed. Negatively deviating EOSs produced positive sorption hysteresis while positively deviating ones gave negative sorption hysteresis for the same dataset.
- (6)
- Calculated OGIP is predominantly in adsorbed phase and as such, varies with Langmuir volume.
In summary, it has been demonstrated that, significant uncertainties may be incurred in estimated gas contents and gas reserves of unconventional gas reservoirs due to the choice of EOS for computing the gas compressibility factors needed for experimental data analysis.
Author Contributions
Conceptualization, J.M.E.; Data curation, J.M.E.; Formal analysis, J.M.E.; Investigation, J.M.E.; Methodology, J.M.E.; Resources, R.R.; Supervision, R.R.; Writing–original draft, J.M.E.; Writing–review & editing, R.R.
Funding
This research received no external funding.
Acknowledgments
The authors would like to acknowledge the contributions of Australian Government Research Training Program and Curtin Research Scholarships and the Unconventional Gas Research group at the discipline of Petroleum Engineering, Western Australian School of Mines: Minerals, Energy and Chemical Engineering in supporting this research.
Conflicts of Interest
The authors declare no conflict of interest.
References
- Rachmat, S.; Pramana, A.A.; Febriana, L. Indonesia’s Unconventional Resources, Modified Resource Triangle, and a Typical Example of Stimulation of Coalbed Methane Reservoir. Mod. Appl. Sci. 2012, 6, 99–111. [Google Scholar] [CrossRef]
- Seidle, J. Sorption of Gas on Coals. In Fundamentals of Coalbed Methane Reservoir Engineering; PennWell: Tulsa, OK, USA, 2011; pp. 125–153. [Google Scholar]
- Penuela, G.; Ordonez, A.; Bejarano, A. A Generalized Material Balance Equation for Coal Seam Gas Reservoirs. In Proceedings of the SPE Annual Technical Conference and Exhibition, New Orleans, LA, USA, 27–30 September 1998. [Google Scholar]
- King, G.R. Material-Balance Techniques for Coal-Seam and Devonian Shale Gas Reservoirs With Limited Water Influx. SPE Reserv. Eng. 1993, 8, 67–72. [Google Scholar] [CrossRef]
- Bell, G.J.; Rakop, K.C. Hysteresis of Methane/Coal Sorption Isotherms. In Proceedings of the 61st SPE-ATCE, New Orleans, LA, USA, 5–8 October 1986. [Google Scholar]
- Keller, J.U.; Staudt, R. Gas Adsorption Equilibria: Experimental Methods and Adsorptive Isotherms; Springer: Berlin, Germany, 2005. [Google Scholar]
- Gasparik, M.; Rexer, T.F.T.; Aplin, A.C.; Billemont, P.; Weireld, G.D.; Gensterblum, Y.; Henry, M.; Krooss, B.M.; Liu, S.; Ma, X.; et al. First international inter-laboratory comparison of high-pressure CH4, CO2 and C2H6 sorption isotherms on carbonaceous shales. Int. J. Coal Geol. 2014, 132, 131–146. [Google Scholar] [CrossRef]
- Goodman, A.L.; Busch, A.; Duffy, G.J.; Fitzgerald, J.E.; Gasem, K.A.M.; Gensterblum, Y.; Krooss, B.M.; Levy, J.; Ozdemir, E.; Pan, Z.; et al. An Inter-laboratory Comparison of CO2 Isotherms Measured on Argonne Premium Coal Samples. Energy Fuels 2004, 18, 1175–1182. [Google Scholar] [CrossRef]
- Lutynski, M.A.; Battistutta, E.; Bruining, H.; Wolf, K.H.A. Discrepancies inthe assessment of CO2 storage capacity and methane recovery from coal with selected equation of states Part I. Experimental isotherm calculation. Physicochem. Probl. Miner. Process. 2011, 47, 159–168. [Google Scholar]
- Ekundayo, J.; Rezaee, R. Effect of Equation of States on High Pressure Volumetric Measurements of Methane-Coal Sorption Isotherms—Part 1: Volumes of Free Space and Methane Adsorption Isotherms. Energy Fuels 2019, 33, 1029–1036. [Google Scholar] [CrossRef]
- Al-Fatlawi, O.; Hossain, M.M.; Osborne, J. Determination of best possible correlation for gas compressibility factor to accurately predict the initial gas reserves ingas-hydrocarbon reservoirs. Int. J. Hydrogen Energy 2017, 42, 25492–25508. [Google Scholar] [CrossRef]
- Tang, X.; Wang, Z.; Ripepi, N.; Kang, B.; Yue, G. Adsorption Affinity of Different Types of Coal: Mean Isosteric Heat of Adsorption. Energy Fuels 2015, 29, 3609–3615. [Google Scholar] [CrossRef]
- Zhang, Y.; Xing, W.; Liu, S.; Liu, Y.; Yang, M.; Zhao, J.; Song, Y. Pure methane, carbon dioxide, and nitrogen adsorption on anthracite from China over a wide range of pressures and temperatures: Experiments and modeling. RSC Adv. 2015, 5, 52612–52623. [Google Scholar] [CrossRef]
- Yang, F.; Hu, B.; Xu, S.; Meng, Q.; Krooss, B.M. Thermodynamic Characteristic of Methane Sorption on Shales from Oil, Gas, and Condensate Windows. Energy Fuels 2018, 32, 10443–10456. [Google Scholar] [CrossRef]
- Ozdemir, E. Dynamic nature of supercritical CO2 adsorption on coals. Adsorption 2017, 23, 25–36. [Google Scholar] [CrossRef]
- Dutta, P.; Bhowmik, S.; Das, S. Methane and carbon dioxide sorption on a set of coals from India. Int. J. Coal Geol. 2011, 85, 289–299. [Google Scholar] [CrossRef]
- Battistutta, E.; van Hemert, P.; Lutynski, M.; Bruining, H.; Wolf, K.H. Swelling and sorption experiments on methane, nitrogen and carbon dioxide on dry Selar Cornish coal. Int. J. Coal Geol. 2010, 84, 39–48. [Google Scholar] [CrossRef]
- Busch, A.; Gensterblum, Y.; Krooss, B.M. Methane and CO2 sorption and desorption measurements on dry Argonne premium coals: Pure components and mixtures. Int. J. Coal Geol. 2003, 55, 205–224. [Google Scholar] [CrossRef]
- Feng, Y.Y.; Yang, W.; Chu, W. Coalbed methane adsorption and desorption characteristics related to coal particle size. Chin. Phys. B 2016, 25, 068102. [Google Scholar] [CrossRef]
- Zhang, L.; Aziz, N.; Ren, T.; Nemcik, J.; Tu, S. Influence of coal particle size on coal adsorption and desorption characteristics. Arch. Min. Sci. 2014, 59, 807–820. [Google Scholar] [CrossRef]
- Zhang, R.; Liu, S. Experimental and theoretical characterization of methane and CO2 sorption hysteresis in coals based on Langmiur desorption. Int. J. Coal Geol. 2016, 171, 49–60. [Google Scholar] [CrossRef]
- Liu, Z.; Zhang, Z.; Lu, Y.; Choi, S.K.; Liu, X. Sorption Hysteresis Characterization of CH4 and CO2 on Anthracite, Bituminous Coal, and Lignite at Low Pressure. J. Energy Resour. Technol. 2017, 140, 012203. [Google Scholar] [CrossRef]
- Weishauptová, Z.; Přibyl, O.; Sýkorová, I.; Machovič, V. Effect of bituminous coal properties on carbon dioxide and methane high pressure sorption. Fuel 2015, 139, 115–124. [Google Scholar] [CrossRef]
- Jessen, K.; Tang, G.Q.; Kovscek, A.R. Laboratory and Simulation Investigation of Enhanced Coalbed Methane Recovery by Gas Injection. Transp. Porous Media 2008, 73, 141–159. [Google Scholar] [CrossRef]
- Kim, H.J.; Shi, Y.; He, J.; Lee, H.H.; Lee, C.H. Adsorption characteristics of CO2 and CH4 on dry and wet coal from subcritical to supercritical conditions. Chem. Eng. J. 2011, 171, 45–53. [Google Scholar] [CrossRef]
- He, J.; Shi, Y.; Ahn, S.; Kang, J.W.; Lee, C.H. Adsorption and Desorption of CO2 on Korean Coal under Subcritical to Supercritical Conditions. J. Phys. Chem. B 2010, 114, 4854–4861. [Google Scholar] [CrossRef]
- Rodrigues, C.F.A.; da Silva, J.M.M.; Dinis, M.A.P.; de Sousa, M.J.L. Effect of gas compressibility factor estimation in coal sorption isotherms accuracy. Int. J. Oil Gas Coal Technol. 2018, 19, 230–247. [Google Scholar] [CrossRef]
- Wang, K.; Wang, G.; Ren, T.; Cheng, Y. Methane and CO2 sorption hysteresis on coal: A critical review. Int. J. Coal Geol. 2014, 132, 60–80. [Google Scholar] [CrossRef]
- Brunauer, S.; Emmett, P.H.; Teller, E. Adsorption of Gases in Multimolecular Layers. J. Am. Chem. Soc. 1938, 60, 309–319. [Google Scholar] [CrossRef]
- Zou, J.; Rezaee, R. Effect of particle size on high-pressure methane adsorption of coal. Pet. Res. 2016, 1, 53–58. [Google Scholar] [CrossRef]
- Zou, J.; Rezaee, R.; Liu, K. Effect of Temperature on Methane Adsorption in Shale Gas Reservoirs. Energy Fuels 2017, 31, 12081–12092. [Google Scholar] [CrossRef]
- Gasparik, M.; Ghanizadeh, A.; Bertier, P.; Gensterblum, Y.; Bouw, S.; Krooss, B.M. High-Pressure Methane Sorption Isotherms of Black Shales from the Netherlands. Energy Fuels 2012, 26, 4995–5004. [Google Scholar] [CrossRef]
- Seidle, J. Gas and Water Mass Balances in Coals. In Fundamentals of Coalbed Methane Reservoir Engineering; PennWell: Tulsa, OK, USA, 2011; pp. 217–246. [Google Scholar]
- Thommes, M.; Kanero, K.; Neimark, A.V.; Olivier, J.P.; Rodriguez-Reinoso, F.; Rouquerol, J.; Sing, K.S.W. Physisorption of gases, with special reference to the evaluation of surface area and pore size distribution (IUPAC technical Report). Pure Appl. Chem. 2015, 87, 1051–1069. [Google Scholar] [CrossRef]
- Jun-yi, L.; Zheng-song, Q.; Wei-an, H.; Yang, L.; Ding-ding, S. Nano-pore structure characterization of shales using gas adsorption and mercury intrusion techniques. J. Chem. Pharm. Res. 2014, 6, 850–857. [Google Scholar]
- McCarty, R.D.; Arp, V.D. New wide range equation of state for helium. Adv. Cryog. Eng. 1990, 35, 1465–1475. [Google Scholar]
- Rouquerol, J.; Rouquerol, F.; Llewellyn, P.; Denoyel, R. Surface excess amounts in high-pressure gas adsorption: Issues and benefits. Colloids Surf. A Physicochem. Eng. Asp. 2016, 496, 3–12. [Google Scholar] [CrossRef]
- Do, D.D.; Do, H.D. Appropriate volumes for adsorption isotherm studies: The absolute void volume, accessible pore volume and enclosing particle volume. J. Colloid Interface Sci. 2007, 316, 317–330. [Google Scholar] [CrossRef]
- Harpalani, S.; Prusty, B.K.; Dutta, P. Methane/CO2 Sorption Modeling for Coalbed Methane Production and CO2 Sequestration. Energy Fuels 2006, 20, 1591–1599. [Google Scholar] [CrossRef]
Figure 1.
Pore-Size Distribution from Low-Pressure Nitrogen Adsorption Data.

Figure 2.
Effect of Equation of State on Free-Space (a) Variation in Z-factor of helium gas by EOS (b) Corresponding variation in volume of free space.
Figure 2.
Effect of Equation of State on Free-Space (a) Variation in Z-factor of helium gas by EOS (b) Corresponding variation in volume of free space.

Figure 3.
Example of variations in gas compressibility factor of methane at 25 °C.

Figure 4.
Methane-coal adsorption isotherms by equation of state (legends: markers = Excess adsorbed amount, lines = Langmuir fit; black = NIST-refprop, red = PR-EOS, brown = PR-Peneloux, orange = SRK-EOS, purple = SRK-Peneloux, blue = SBRW-EOS and green = Lee-Kesler).
Figure 4.
Methane-coal adsorption isotherms by equation of state (legends: markers = Excess adsorbed amount, lines = Langmuir fit; black = NIST-refprop, red = PR-EOS, brown = PR-Peneloux, orange = SRK-EOS, purple = SRK-Peneloux, blue = SBRW-EOS and green = Lee-Kesler).

Figure 5.
Methane-coal sorption hysteresis by equation of state (* SRK-Peneloux is similar).

Figure 6.
Equilibrium pressures for all desorption steps at 25 °C.

Figure 7.
Comparing differential ad/desorbed amounts vs. EOS.

Figure 8.
Effects of equation of state on OGIP (a) EOS Vs Z-factor at initial reservoir conditions (b) EOS Vs Initial FVF (c) EOS Vs OGIP (d) Relative difference in calculated OGIPs.
Figure 8.
Effects of equation of state on OGIP (a) EOS Vs Z-factor at initial reservoir conditions (b) EOS Vs Initial FVF (c) EOS Vs OGIP (d) Relative difference in calculated OGIPs.

Figure 9.
Relationship between calculated gas reserves and Langmuir volume.

Figure 10.
Adsorbed gas as a ratio of the original gas in-place.


Table 1.
Properties of the coal sample.
| Components | Composition (%) |
|---|---|
| A. Petrographic Analysis | |
| Vitrinite | 75.0 |
| Fusinite | 3.3 |
| Semi-fusinite | 13.0 |
| Macrinite | 0.3 |
| Inertodetrinite | 4.0 |
| Mineral matter | 4.5 |
| Mean maximum reflectance | 1.43 |
| B. Proximate Analysis | |
| Ash content | 9.6 |
| Moisture content | 1.2 |
| Volatile matter | 21.2 |
| Fixed carbon | 68.0 |
Table 2.
Parameters used for initial gas reserves estimates.
| Parameters | |
|---|---|
| Reservoir Temperature, °C | 40 |
| Initial Res. Pressure, MPa | 10.34 |
| Rock density, g/cc | 1.34 * |
| Initial porosity, fraction | 0.1 * |
| Initial water saturation, fraction | 0.8 * |
* data from [27].
Table 3.
Langmuir parameters for different equations of state (adsorption isotherms only).
| EOS | ||||||||
|---|---|---|---|---|---|---|---|---|
| Temp. | Parameters | Refprop | PR | PR-Pen. | SRK | SRK-Pen. | SBWR | Lee-Kesler |
| 25 °C | VL, Scf/ton | 772.9 | 943.3 | 964.6 | 806.6 | 815 | 800 | 836.8 |
| PL, MPa | 1.02 | 1.34 | 1.38 | 1.08 | 1.1 | 1.09 | 1.13 | |
| ρads, Kg/m3 | 689.9 | 590.9 | 578.8 | 183.8 | 165.4 | 1.30E+09 | 742.9 | |
| R2 | 0.9985 | 0.9969 | 0.9966 | 0.9978 | 0.9977 | 0.9983 | 0.9973 | |
| 40 °C | VL, Scf/ton | 705.8 | 860.9 | 880.1 | 740 | 748.2 | 699.7 | 768.4 |
| PL, MPa | 1.26 | 1.63 | 1.68 | 1.34 | 1.35 | 1.23 | 1.39 | |
| ρads, Kg/m3 | 92.1 | 103.7 | 104.6 | 69.4 | 66.9 | 116.6 | 98.2 | |
| R2 | 0.9953 | 0.9918 | 0.9915 | 0.9946 | 0.9947 | 0.9957 | 0.9911 | |
© 2019 by the authors. Licensee MDPI, Basel, Switzerland. This article is an open access article distributed under the terms and conditions of the Creative Commons Attribution (CC BY) license (http://creativecommons.org/licenses/by/4.0/).
Share and Cite
MDPI and ACS Style
Ekundayo, J.M.; Rezaee, R. Volumetric Measurements of Methane-Coal Adsorption and Desorption Isotherms—Effects of Equations of State and Implication for Initial Gas Reserves. Energies 2019, 12, 2022. https://doi.org/10.3390/en12102022
AMA Style
Ekundayo JM, Rezaee R. Volumetric Measurements of Methane-Coal Adsorption and Desorption Isotherms—Effects of Equations of State and Implication for Initial Gas Reserves. Energies. 2019; 12(10):2022. https://doi.org/10.3390/en12102022
Chicago/Turabian StyleEkundayo, Jamiu M., and Reza Rezaee. 2019. "Volumetric Measurements of Methane-Coal Adsorption and Desorption Isotherms—Effects of Equations of State and Implication for Initial Gas Reserves" Energies 12, no. 10: 2022. https://doi.org/10.3390/en12102022
Note that from the first issue of 2016, this journal uses article numbers instead of page numbers. See further details here.