Integration of Electric Vehicles into the Electric Power System Based on Results of Road Traffic Census

1
Energy System Integration Social Cooperation Program, Institute of Industrial Science, University of Tokyo, Komaba 4-6-1, Meguro-ku, Tokyo 153-8505, Japan
2
JPBS Business Service, Fukagawa 2-2-18, Koto-ku, Tokyo 135-8451, Japan
*
Author to whom correspondence should be addressed.
Energies 2019, 12(10), 1849; https://doi.org/10.3390/en12101849
Submission received: 2 April 2019
/
Revised: 6 May 2019
/
Accepted: 10 May 2019
/
Published: 15 May 2019
Abstract
:We propose a model for the integration of electric vehicles (EVs) into the grid power system in Japan. The potential of the switchover from conventional vehicles to EVs and the incurred charging loads for the EV fleet were evaluated based on the results of a Japanese road traffic census. Furthermore, an EV battery operation model was incorporated into the production cost analysis model, which is capable of determining the optimal electricity supply and demand, considering the existing interconnector power flows. The potential economic and environmental contributions of EV charge and discharge controls, with the ultimate goal of realizing the introduction of a massive renewable energy source in the future, were also evaluated. We found that EVs can greatly contribute to expanding the use of renewable energy and reducing system cost by charging and discharging not only at the owner’s home but also at his/her workplace.
1. Introduction
Although there are several alternative fuel-conversion mechanisms that could be used to phase out fossil fuels, electricity is a particularly promising means of reducing CO2 emissions, particularly in the transport sector. In 2018, both the French and British governments announced their intention to ban the manufacture of new petrol and diesel automobiles to accelerate the deployment of electric vehicles (EVs) by 2040. Other countries are expected to follow their lead.
In 2017, Japanese CO2 emissions in the transport sector totaled 213 million tons, making up 17.9% of the total emissions for that year. Emissions from road vehicles accounted for 86.3% of the total for the transport sector (15.4% of the overall total), with 49.8% being emitted by passenger cars (8.9% of the total) and 36.5% by trucks (6.5% of the total) [1]. One way the Japanese government is pursuing countermeasures to reduce CO2 emissions by vehicles by 2030 is through the introduction of next-generation vehicles, including hybrid vehicles (HEVs), EVs, plug-in hybrid vehicles (PHEVs), fuel cell vehicles, and clean diesel vehicles (CDVs). Other countermeasures include the promotion of traffic flow measures, modal shifts, autonomous cars, and fuel economy improvements for individual vehicles. The addition of EVs and PHEVs, in particular, is expected to not only lead to energy conservation but also ensure that the flexibility of the required power system is in accordance with the renewable energy expansion that contributes to drastic reductions in CO2 emissions. As of 2017, HEVs were well established in the Japanese market, with approximately six million on the road, whereas the number of EV vehicles was only 75,000 [2]. There are some obstacles to EV popularization, such as their high price, limited cruising distance, and the insufficient EV charging infrastructure numbers. At the same time, there is also concern about the impact on the electricity supply with the ongoing electrification of vehicles.
To promote the growth, usability, and applicability of EVs, it will be is necessary to grasp the potential of EV conversion, determine the available charging and discharging characteristics, and assess the value of EV integration into the electric power supply and the effects of demand on the network.
In this study, the potential of conventional vehicles switching to EVs by estimating the necessary charge amounts of EV fleet is evaluated. Here, an EV battery operation model was integrated into a production cost simulation model to evaluate the impacts of EV batteries on power systems in Japan, such as economic value, CO2 reduction effects, and the evading curtailment of over-generated renewable electricity.
2. Literature Review
To correctly evaluate the impacts of EV integration into future power systems, including large amounts of renewable energy resources, a realistic EV driving pattern model and EV production cost model for the power system (including EVs with appropriately consolidated resolution) are required. Each index is quantified in terms of economic efficiency, CO2 reduction, energy efficiency, and power system reliability. There is much to research in the field of EVs, and several papers have reviewed the ongoing research since 2010. For example, References [3,4] reviewed the modeling and evaluation of studies of EV integration into the power grids. Reference [5] classified the methods for smart charging and introduced control strategies and their commonly used algorithms. Furthermore, a systematic review of the approaches adapted to model electric vehicle use and changing patterns across a variety was described in [6]. Below, we focus on a review of the evaluation of the impact of EVs on the balancing of power systems, as it relates to our study.
There have been several studies related to the impacts of EV and PEV integration into power systems and their ability to overcome the problem of intermittent renewable energy generation. References [7,8,9,10,11] focus either on nationwide or utility-wide power system simulations (including EVs or PHEVs), whereas References [12] and [13] center on smaller microgrid systems. The latter studies generally simulated detailed operations, including the unit commitment of power generators.
Lyon et al. evaluated the impacts of moving the PEV charge times for the regional transmission organization PJM (Pennsylvania New Jersey Maryland) interconnection and midcontinent independent system operator markets in the United States (US) [7]. The PEV fleet model was based on a US national household travel survey and they considered three types of charging patterns, implying that the charge times and amounts were not the control variables in the model. The researchers used the simple marginal cost curve calculated using plant capacity factors and forecast fuel prices to generate a cost model. They confirmed that the total monetary savings from demand-shifting would be quite small as a percentage of total electricity costs, with the value of smart charging policies varying significantly across the chosen electricity grids.
Camus et al. targeted the 2020 Portuguese power system with several EV penetration and hydro production scenarios [8]. In their study, an electricity market simulator was used, and the marginal cost curve was based on supply costs for different kinds of energy generators. The EV driving pattern was not considered. However, three types of charging patterns were prepared, in the same way as in Reference [7]. The impact of EVs on a reliability scenario was estimated to be minimal in terms of the load profiles and electricity prices.
In a Spanish case study, a detailed analysis of the impacts of EVs on the Spanish power system was investigated in Reference [9]. Here, the mid-term operation model computed generation dispatch, simulated hourly power system operations, as well as five types of EV driving patterns that were defined for the model where charging and discharging were optimized together as a whole. Different scenarios involving generation by variable renewable energy sources (VRE) and EV penetrations were studied, and they confirmed that high levels of VRE generation combined with high EV penetration brought considerable operational cost benefits to power systems.
Wang et al. proposed a new unit commitment model that could simulate the interactions between PHEVs, wind power, and demand response (DR) using four PHEV charging scenarios that were simulated for the power system of Illinois, USA [10]. The PHEV fleet model was type-clustered, with the last-trip end time being based on the results of a national household travel survey. Here, three types of charging patterns were considered, with a smart charging operation determined by a unit commitment model (i.e., off-peak hours) to fill in the valley of the load profile.
Dallinger et al. investigated the way in which grid-connected EVs could contribute to the integration of renewable generation sources under fluctuating conditions for a 2030 scenario in California and Germany [11]. The study used an agent-based simulation model including real-time prices as control signals to simulate driving behavior. However, only residual load duration curves were discussed and not the system’s dynamic characteristics.
A recent analysis by the California Public Utilities Commission revealed the PEV infrastructure needs in California from 2017 to 2025, using an EV infrastructure projection tool which incorporates representative statewide travel data from the 2010–2012 California Household Travel Survey. Based on spatial EV existence, they estimated sum-charging profiles (noted as a “dragon curve”). However, the impacts of smart charging were not studied [14].
Many researchers have evaluated investigations addressing the impacts of introducing EVs into the Japanese market. Zhang et al. examined the impact of integrating photovoltaic (PV) power into future Japanese electricity systems, in particular in the Kansai area, with EVs and heat pump water heaters under smart control strategies [15]. The study was based on a scenario analysis using the developed input–output approach. All the EV batteries were regarded as being one large battery, with charge and discharge operational controls based on planned strategies. Yabe et al. studied the effects of EV optimization on the operational planning of integrated power systems in Japan [16]. While the study was based on the results of a road traffic census, the production cost models for the generators based on marginal fuel cost curves were simplified.
The electric power supply systems in Japan are divided into ten areas that are connected through grid interconnector lines in the longitudinal direction. This is due to geographical issues, such that the system is classified as being a “longitudinal transmission system.” Although the use of interconnector lines was not common in the past, this is expected to change due to the indirect auction mechanism for power trading that is due to start in 2020. It is likely that the number of trades over interconnection lines will increase with an increase in the amount of renewable energy being produced. It is also necessary to consider the desired electricity supply and demand in 2030, including the use of grid interconnections (which trade power and stability) as well as the energy flexibility function, such as DR and the control of the renewable output.
In view of the above, the present study set out to conduct electricity supply and demand simulations using a production cost model that includes grid interconnector lines to evaluate the impacts of EVs in Japan. The potential economic and environmental contributions of EV charge and discharge controls on the future mass renewable energy infrastructure were also evaluated. The novelty of this research is the high reliability of the evaluation, which uses a credible driving model by vehicle type (based on actual driving data) as well as an electricity supply and demand simulation allowing the consideration of interconnector power flows in Japan. While the conventional power operation model at the country-level generally regards the use of EVs exogenously and adds it to the demand, our model can optimize the operations of both generators and EV storage batteries endogenously within the power system. We could determine the potential of EV flexibility, taking into account regional demand, resources, such as renewable energy, and EV use characteristics.
The structure of this paper is as follows. Section 3 describes the modeling method applied to an EV fleet with an estimation of the electric power demand in Japan. A production cost model that considers interconnection power grid flows and an added EV battery model is addressed in Section 4. Section 5 describes the simulation conditions and predicted results for 2030, followed by the conclusions presented in Section 6.
3. Estimation of EV Switching Potential in Japan
3.1. Road Traffic Census Vehicle Origin and Destination Survey
The "Road Traffic Census Vehicle Origin and Destination Survey” (OD survey) is part of a nationwide survey of road traffic in Japan, carried out regularly by the Ministry of Land, Infrastructure, and Transport [17]. The survey, carried out every five years, is based on a questionnaire that gathers data on the purpose of use, origin, destination, mileage, etc. for each trip of each automobile. Specifically, day trips taken on weekdays and holidays from mid-September to mid-November are targeted. Although the survey results for 2005 and 2010 were available for our analysis, there was no noticeable difference in the outcomes for both years. Therefore, this paper is based on the results for 2010.
The results of the OD survey are listed in Table 1. Private cars were clustered based on the mileage data given in Section 3.3. The total travel distance was estimated from an individual’s vehicle mileage multiplied by the expansion coefficient that was added to each vehicle and then aggregated by the ten utility areas. The number of vehicles used was based on the actual value calculated for FY 2017 while the operational rate (i.e., the ratio of vehicles driven on a particular day as per the OD survey) was used for the estimation.
Only the mileage of those vehicles returning to the point of the first departure within 24 hours was covered. The following vehicles were excluded:
- Vehicle trip data that comprised of missing or mismatched departure/arrival times and trip mileage;
- Vehicles that drove over 150 km/h.
The final effective data number was found to be 145,582 during weekdays and 73,242 during holiday outings.
Taxi fleets were also excluded from this study because only customer trips were captured by the OD survey. For reference, taxis accounted for approximately 0.4% of the total number of cars evaluated, which is approximately 0.01% in terms of the total distance traveled in Japan. In addition, fixed-route bus fleets were also excluded because their arrival and departure times were not part of the OD survey.
We set the upper mileage criteria of the EV switching potential to 150 km/day for private and small freight vehicles, and 300 km/day for buses, full-size freight vehicles, and other special-purpose vehicles.
Figure 1 shows the ratio of EV switching potential to EVs in terms of travel distance and number. Here, the definition of “commuter vehicle” is based on the destination including workplaces and an absence from the home of at least six hours. Private/personal commuter vehicles are a good match for the EV market because the EV switching potential was almost 100% in terms of number and more than 95% in terms of mileage. The annual mileage total was found to be 583 billion km, while the EV potential mileage (which was below the criteria) was 448 billion. This corresponds to 77% of the total mileage, with more than 90% of vehicles being candidates for switching to EVs, except for buses.
3.2. EV Travel Patterns and Electricity Consumption
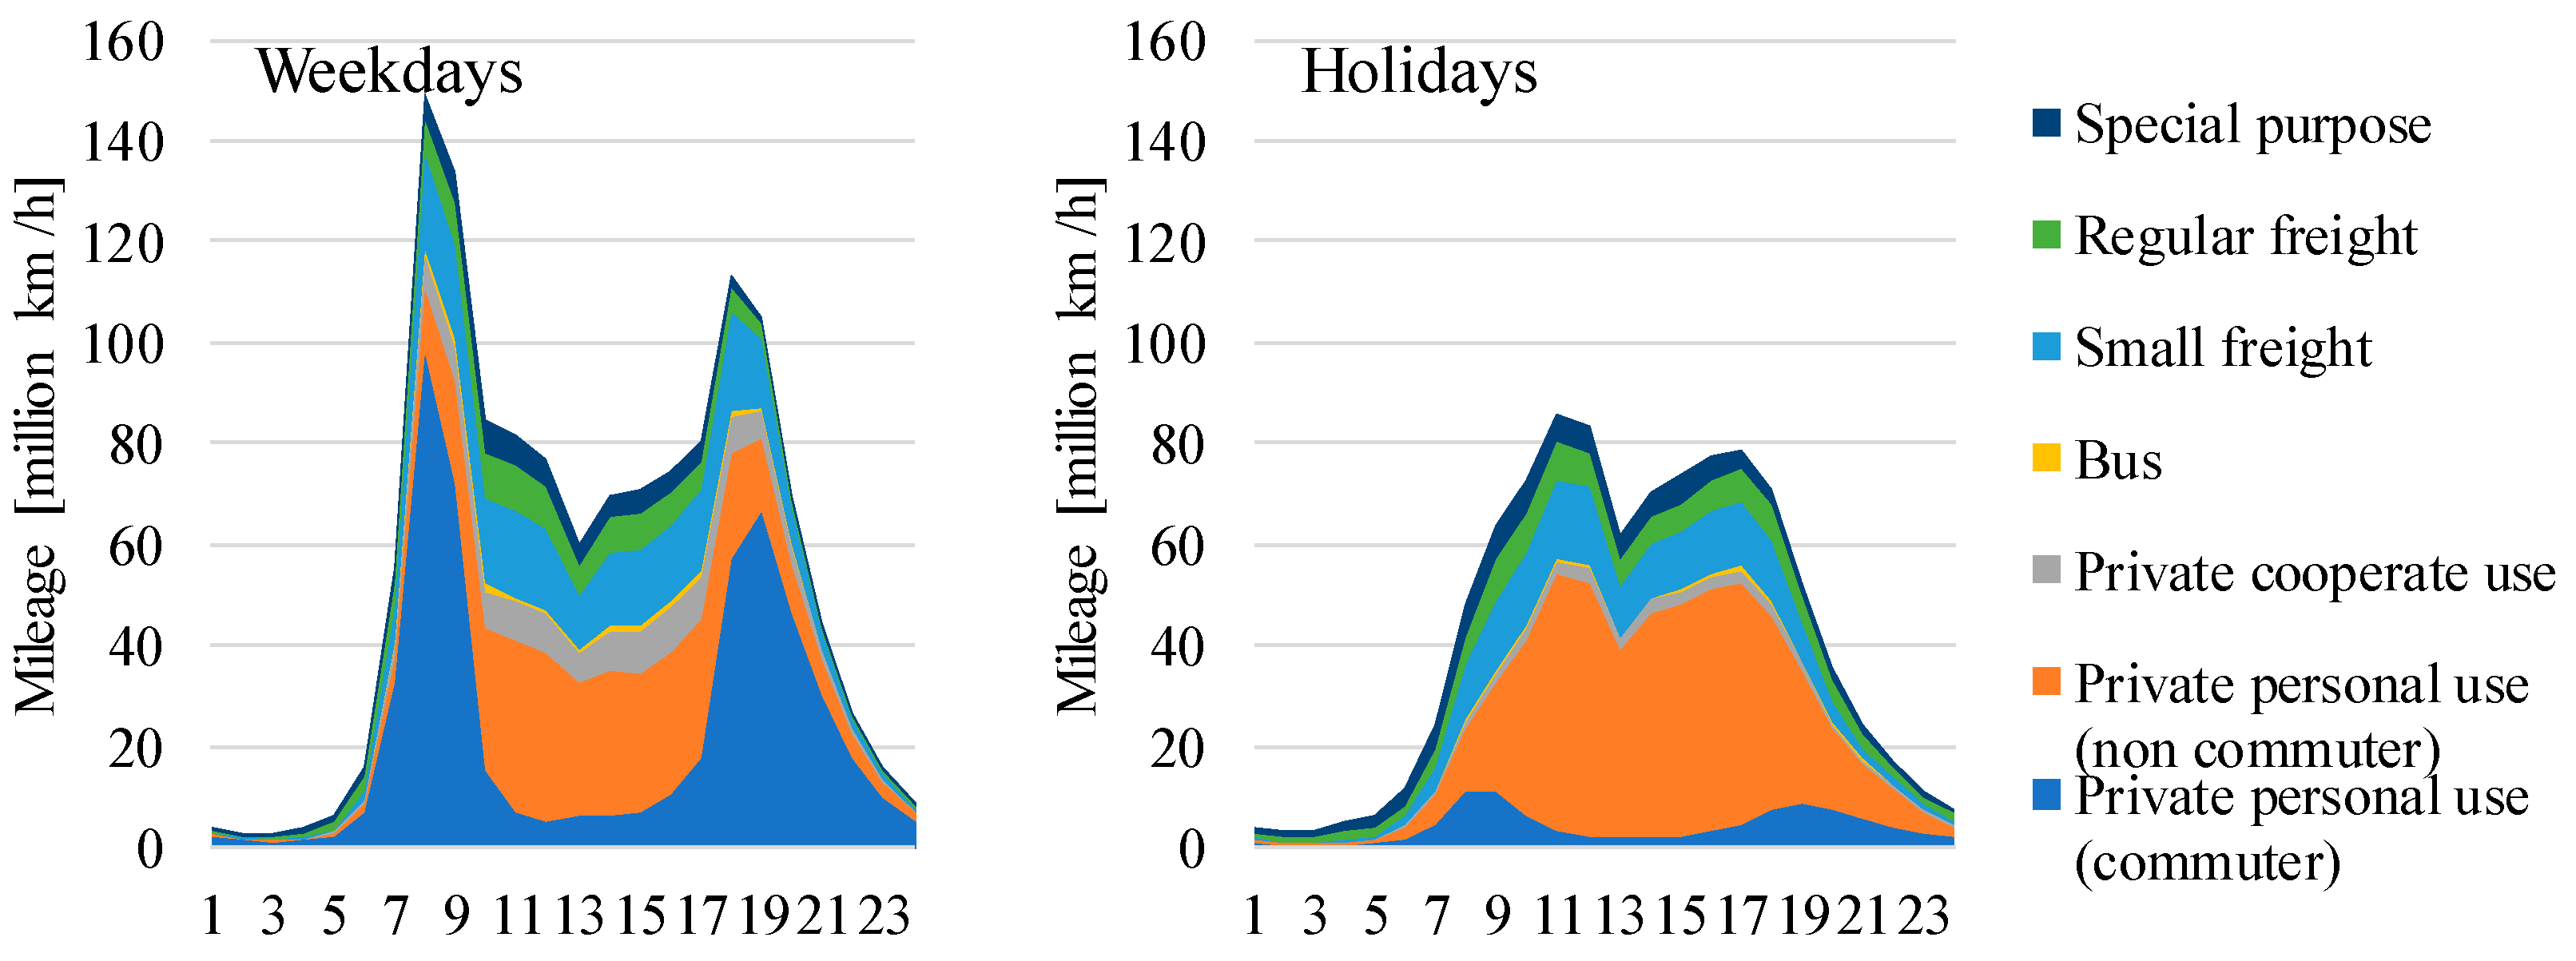
Figure 2 shows the results of hourly mileage accumulation for the EV switching potential by vehicle type. Here, the mileage covered by private/personal-use vehicles was found to dominate. The commuter vehicle morning and evening peaks were more prevalent on weekdays, while the proportion of non-commuting vehicles was particularly large on holidays.
If we assume the EV efficiency to be 7 km/kWh for private and small freight vehicles, and 2.3 km/kWh for all other types of vehicles (calculated from the fuel consumption ratio of a conventional car), then the annual overall electricity consumption for a complete switch to EVs was estimated to be 79 TWh. In FY 2016, the total electric power demand in Japan was 890 TWh, so the potential increase in demand as a result of a complete switch to EVs was 9%. The EV switching potential in private vehicles was approximately 60 million units, which brought 2.4 TWh/day of electricity demand and 180 GW of adjusted capacity if we assume that the battery specification was 40 kWh/3 kW per unit. The latter was larger than that the peak Japanese electricity demand, of 180 GW, which occurred in 2016. When other types of EV cars are incorporated into the switching potential, and assuming the battery specifications for long-distance vehicles to be 100 kWh/10 kW, then the values become 3.9 TWh/day of electricity demand and 334 GW of adjusted capacity.
Figure 3 shows the potential capacity of an EV battery and the ratio of the total capacity to the area peak demand, as calculated from the EV switching potential by area, arranged in order from north to south. In this case, the proportion of freight vehicles in northernmost Hokkaido was large, while in other areas, private cars accounted for about 70% of the total. The percentage of commuter vehicles was low in the Tokyo and Kansai areas (due to the public transport infrastructure being well developed). The EV potential capacity in Hokkaido, Tohoku, Kyushu, and Okinawa exhibited by far the largest proportion of peak demand, while the smallest was the Kansai region. Figure 4 shows the potential EV electricity demand share and the ratio of total demand to total area. About 60% of the total fleet was private car use in certain areas. Hokkaido, Tohoku, Kyushu, and Okinawa accounted for the largest proportion of the total demand (more than 11%). The smallest proportion (6.6%) was attributed to the Kansai region.
3.3. EV Clustering
Basically, EV charging and discharging would need to be completed for an individual vehicle. However, we had to treat the EV batteries as one large battery in order to model the charge and discharge control functions for EVs in the system-wide demand and supply simulation model.
Japanese vehicles are virtually all used for short journeys, and only a fraction of their battery capacity will be used for driving when daily charging is assumed. This means that if all cars are treated as one large battery, the degree of freedom of charge and discharge would be too high. To prevent this problem, we attempted to cluster the EVs for each travel pattern, with charge and discharge operations completed within each cluster. Based on the mileage covered, the vehicle types that are more likely to be switched to an EV are private cars, and so we classified them into five different clusters based on 24-hour travel data obtained from the OD survey.
The k-means ++ approach, which is a non-hierarchical clustering method for improving the selection method of the initial value of the conventional k-means method, was used to cluster the travel patterns of the vehicle and day types [18].
We used 24-hour travel distances as cluster keys and, after trying several cluster numbers, we chose five clusters that were easy to interpret visually.
Figure 5, Figure 6 and Figure 7 show the clustering results for private/personal use vehicles. Figure 5 shows the average mileage (nationwide) for each cluster, arranged in ascending order by mileage type. Figure 6 shows the home and workplace existence ratio which corresponds to the availability of charging and discharging for each cluster. Figure 7 shows the corresponding ratio of each cluster by area, which includes non-operated vehicles. For weekdays, vehicles were classified into five types, namely, CL1 which includes about half of the commuting cars and half of the non-commuting vehicles and for which the mileage is smaller, CL2 which mainly includes commuting vehicles which leave early and return dispersively, CL3 which mainly includes commuting vehicles which leave early and return early, CL4 which mainly includes vehicles which leave early and return late, and CL5 which mainly includes non-commuting vehicles for which the mileage is greater. On weekends, vehicles were classified into five types, namely, CL1 for which the mileage is smaller, CL2 which mainly includes commuting vehicles, CL3 which leaves in the morning, CL4 which leaves around noon, and CL5 which leaves in the afternoon.
The average mileage of private personal-use vehicles was approximately 24.8 km per day on weekdays and 27.6 km per day on holidays. Here, 60–70% of the vehicles were classed as “CL1,” given that the average mileage was below 15 km per day. The total existence ratio of the operated vehicles at home was 39% on weekdays and 37% on holidays. At the workplace, the values were 14% on weekdays and 3% on holidays. The ratio of non-operated vehicles was higher, with the values being 37% on weekdays and 49% on holidays. The smaller mileage for operated cars and a higher ratio of non-operated cars indicates that, in Japan, vehicles are parked for most of the time.
4. Production Cost Model Including EV Operation
In the present study, we used an electric production cost model called ESPRIT-multi-regulation (MR) analysis [19] to conduct power supply and demand simulations to evaluate the impacts of EVs in Japan. The ESPRIT-MR is a tool that can perform power supply and demand analysis that takes into consideration factors that are applicable only in Japan, such as interconnector line flows and renewable energy supplies. The ESPRIT-MR model was developed to analyze a years’ worth of operational interconnections with a heavy penetration of VRE sources, such as PV and wind. It minimized the power generation costs in Japan, with power unit outputs, pumped storage operation, and interconnecting line flows, as well as supply and demand adjustment flexibility, as variables. The Gurobi Optimizer [20] was used as the solver for this model.
In this paper, an EV model was added to the conventional ESPRIT-MR model where the optimal charge and discharge operations were implemented to minimize the total cost. This model also considers the “charging control only” and “charge and discharge control” methods of EV battery operation. It was assumed that operating EVs were subject to charge control only while all EVs, including non-operating vehicles, were subject to charge and discharge control.
When only charging control is applied, the EV model was subject to constraints including the upper and lower limits for the charge amount, sufficient state of charge (SOC) to ensure the required fleet loads, and the termination conditions of SOC. The hourly charging conditions were also optimized to minimize the total operational cost. For the charging and discharging control method, constraints on the upper and lower limits of the discharge amount were added, with either the charge amount or discharge amount per hour being optimized. Here, the chargeable/dischargeable amount was determined based on the battery capacity per unit, while the existence ratio at the home or workplace was estimated from the previous section.
This formula is shown below, based on an objective function defined by the minimization of total annual operational costs for the Japanese power grid system:
Constraints:
- (1)
- Supply and demand balance:
- (2)
- Upper and lower limits on generator output:
- (3)
- Restriction on VRE upper and lower limits:
- (4)
- Interconnected power flow limits:
- (5)
- Capacity constraints on pumped storage reservoir:
- (6)
- Pumping input/output upper and lower limit constraints:
- (7)
- LFC capability restrictions:
- (8)
- Simultaneous constraints on pumping and power generation in pumped storage:
- (9)
- Pumped storage balance constraints:
- (10)
- LFC adjustment power supply upper/lower limits:
- (11)
- Upper and lower limits and balance constraints on LFC adjustment power:
- (12)
- Must-run unit constraints:
- (13)
- Maintenance constraints:
- (14)
- EV battery balance:
- (15)
- EV charging and discharging control constraints:
- Charging upper limits for charging control only (only operated EV batteries are used):
- Charging upper limits for charging and discharging control (all EV batteries are used):
- Discharging upper limits in charging and discharging control (all EV batteries are used):
- (16)
- EV SOC constraints:
- Required SOC at time t (this is the SOC that exceeds the fleet demand and charge/discharge amount after time t − 1):
- conditions for SOC:
- EV SOC upper and lower limits:
5. Simulation
5.1. Simulation Conditions
In the present study, a potential future power system for Japan was modeled based on the scenarios presented in a 2015 Japanese government report on the “Long-term energy outlook in 2030” [21]. The simulation conditions are described in the following sections.
5.1.1. Available Generators and Electricity Demand
The available generators for 10 areas in Japan were chosen based on both the 2015 Japanese government report (mentioned in the previous section) and the future plans for each major utility [21]. Although the nuclear power plants in Fukushima were shut down as a result of the 2011 earthquake, these were also considered in the simulation. With regards to the VRE, we assumed the total capacity of the PV to be 103.4 TWh (86.7 GW, facility utilization rate 13.6%), wind power generation to be 75.2 TWh (32.2 GW, facility utilization rate 26.7%), geothermal power generation to be 10 TWh, and biomass power generation to be 39 TWh. The inhomogeneous distribution of VRE between areas was set based on the resource potential, scale of each area, actual introduction to date, and the outlook of industry groups. Note that the introduction of PV and wind power has exceeded the projections of the long-term energy outlook report as a result of reflecting actual deployment trends [21]. We also assumed the capacity and operation of combined heat and power (CHP) in Japan for 2030 [21]. The generation of CHP is 119 TWh (16.9 GW), with 70 TWh (12.5 GW) of traditional use, 3 TWh (0.7 GW) of CHP for area-wide use and commercial fuel cell use, 16 TWh (3.7 GW) of residential fuel-cell use, and 30 TWh of CHP that can be exported to external markets. We assumed the share of several CHP types according to the current deployment data.
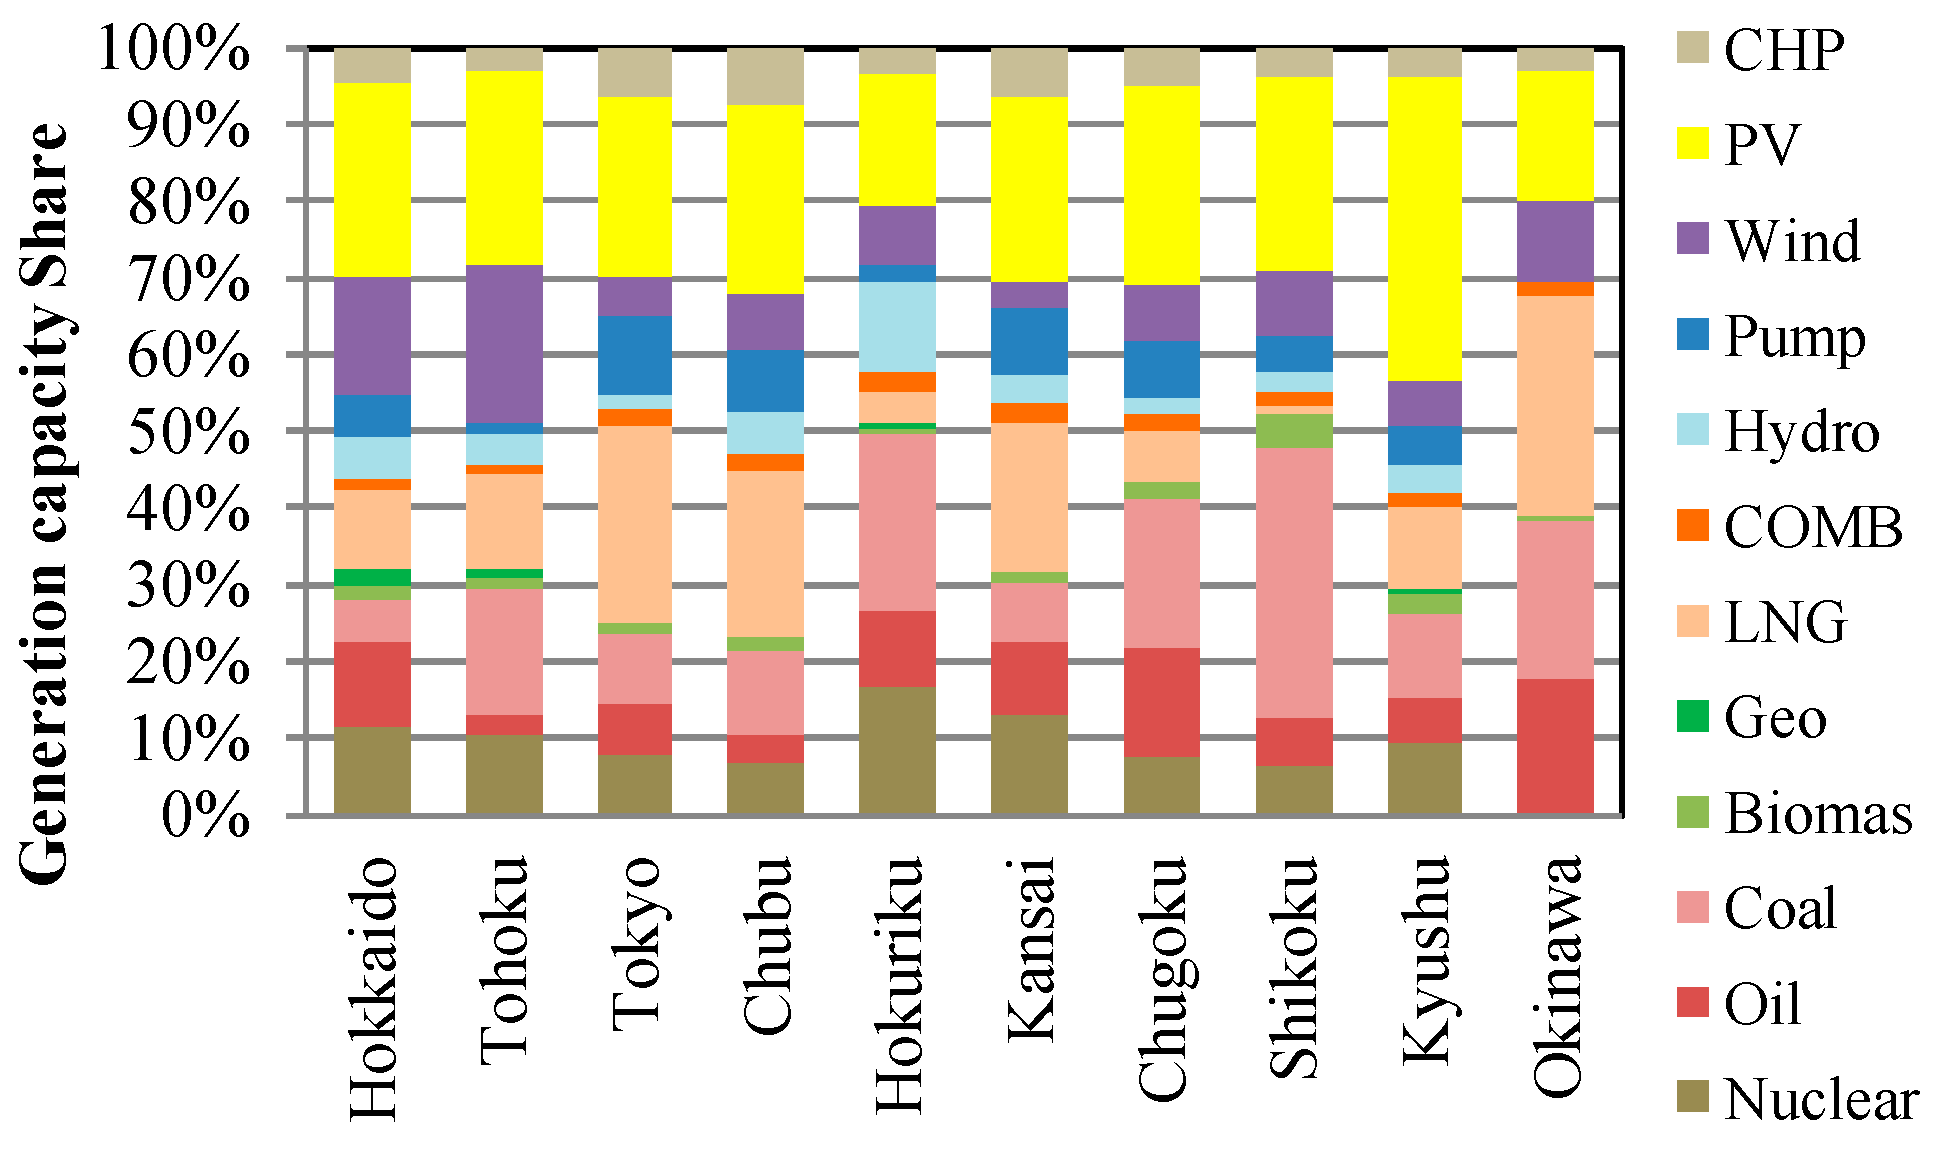
Figure 8 and Figure 9 show the amount and share of the generation capacity per given area. We found the share of PV and wind power generation to be high in Hokkaido, Tohoku, Chugoku, Shikoku, and Kyushu, but low in Tokyo, Chubu, Kansai, and Hokuriku. As it is difficult to balance supply and demand in Hokkaido, Tohoku, and Kyushu due to non-flexible generators, such as VRE and nuclear power, the curtailment of PV and wind power generation was inevitable in these areas.
The rated capacity, minimum output, station service power ratio, thermal efficiency including partial load characteristics and required periodic repair days, were set for each unit for both thermal power and nuclear power generation. The average generated power and available output by month were also set for hydroelectric power generation. For pumped hydro generators with constant speed generation or variable speed generation, the rated capacity, minimum output, and efficiency were each set by unit.
5.1.2. Hourly Profile of Electricity Demand and VRE Generation
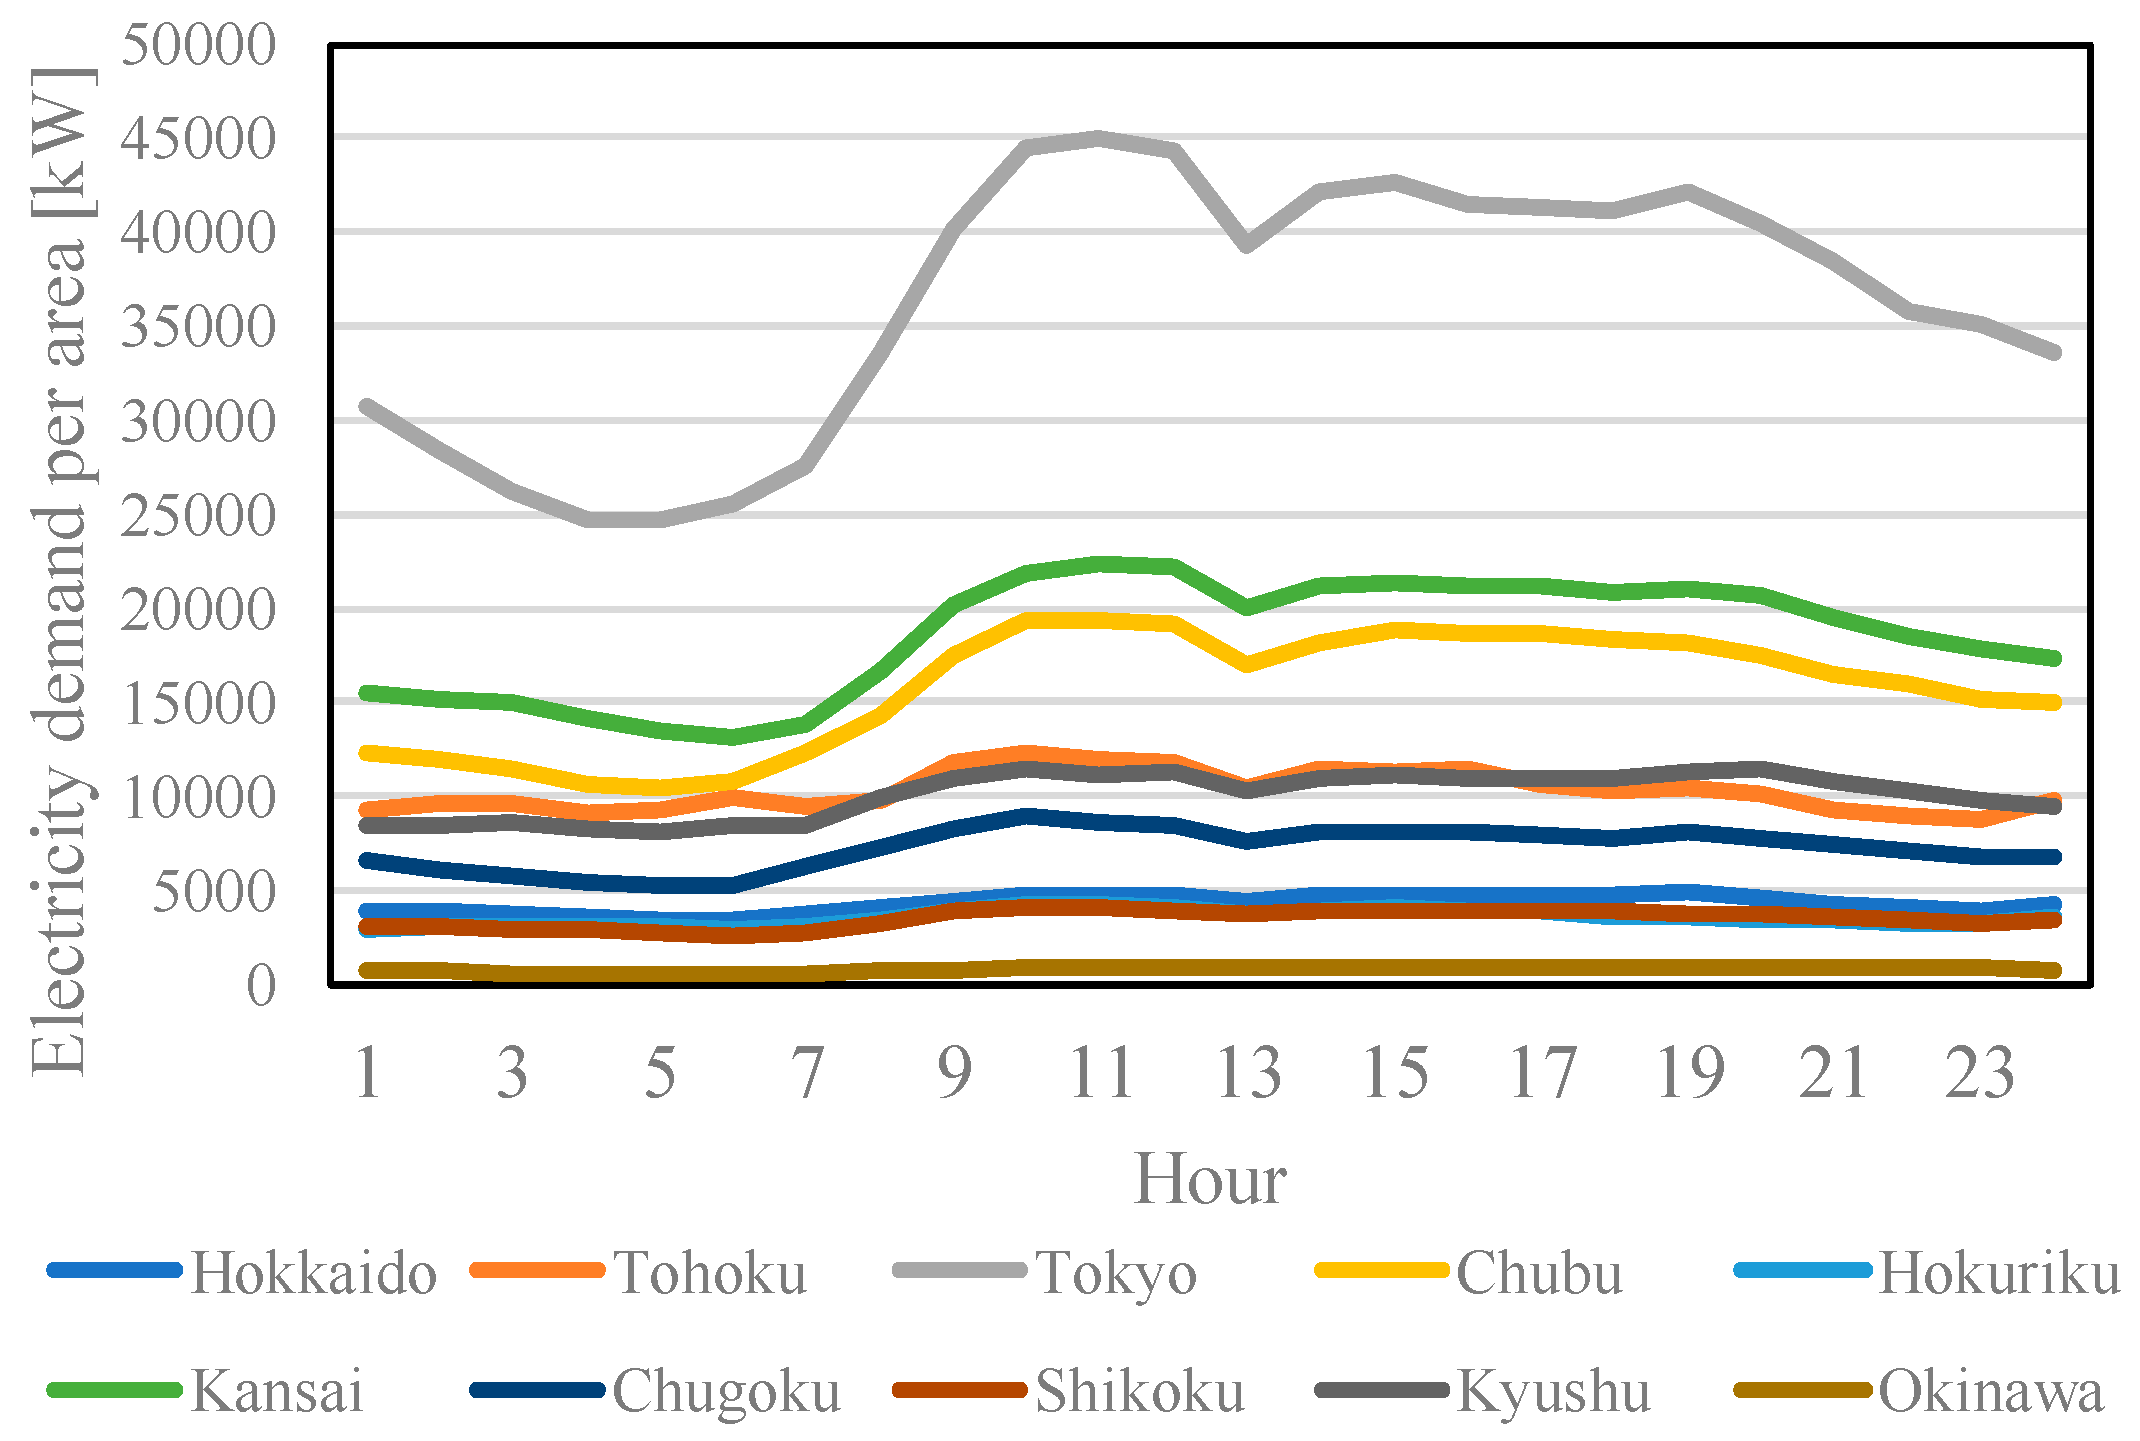
The hourly electricity demand profile for each of the ten areas (grids) in Japan for 2030 was estimated based on fiscal 2013 (April 2013 to March 2014), and the total demand was assumed based on the energy conservation case in the 2015 Japanese government report as shown in Figure 10. The hourly PV power generation output was estimated based on solar radiation, temperature, and wind speed data for 2013 for each region. The hourly wind power generation was based on actual wind farm data for 2013.
5.1.3. Available LFC Supply Capacity, Required LFC Capacity for VRE, and Demand Fluctuation
The available LFC capacity of the generators was set to ±5% of the rated capacity for thermal power, ±20% for hydropower, ±20% for pumped storage stations in generating mode, and ±20% for variable speed pumping in both generating and pumping modes.
Fluctuations in both demand and power generation for PV/wind power output in the LFC field were dependent on the demand characteristics and power generation characteristics, which contained the smoothing effects of PV/wind power generation based on the location within each area. In the present study, the required LFC capacity was set to ±2% of the hourly demand fluctuation, ±10% of the PV output, and ±5% of the wind power output. In this analysis, an EV battery was not used for LFC regulation.
5.1.4. Interconnection
Table 2 lists the interconnection capacities for the electricity and adjustment exchange between the ten areas addressed in this study. The bidirectional operational capacity of each line was found to differ depending on the constraint factors selected for the grid, such as heat capacity, synchronous stability, voltage stability, and frequency retention. We assumed that the LFC adjustment output fluctuation for renewable energy was performed using the interconnected line margin, with the available capacity set to 10% of the interconnected line capacity.
5.1.5. EVs
For an at-home or workplace EV, we assume that charge and discharge devices are available, to which the EV is constantly connected while parked. As described in Section 3.1, the target for EV switching was private-use vehicles, with the distance traveled and charge/discharge availability patterns estimated in five clusters for each area. A charge and discharge cycle was completed for each cluster, with two types of controls considered, these being the “charge control only” and “charge and discharge control” modes. Regarding the EV specifications, 40 kWh was used for the storage battery capacity and 3 kW as the charge and discharge capacity (assuming that the charge/discharge efficiency was 90%). The EV fleet efficiency was set to 7 km/kWh, with the initial and last state of charge for the EV battery on any particular day set to 50%. Since there were only two driving patterns for a vehicle (weekdays or holidays), the same driving patterns were used for holidays and weekdays throughout the year.
In 2030, the number of EVs in use was predicted to be 8.96 million, which is approximately 16% of the total number of private passenger vehicles (56.01 million) in 2016 [21]. In our study, we also considered that the ratio of non-operating vehicles was half of that estimated based on the OD statistics shown in Figure 7. This prediction was based on the premise that EVs would be purchased at a higher price than conventional vehicles and used relatively frequently. As a result, the EV mileage in 2030 was assumed to be 7,468 km/year for each vehicle, which is 1.3 times greater than the personal passenger vehicle average based on OD statistics. The distance is less than the actual yearly mileage of 100 EVs (approximately 17,781 km/year) in the US [22]. The electric power demand per unit was 1,067 kWh/year, while the actual EV average power demand in the US was 3,269 kWh/year [22].
5.2. Simulation Cases
The scenario-based simulations were set as follows, considering the control methods (with charge control only or with charge and discharge control and the availability of workplace control):
- Case 0.
- No EV cases
- Case 1.
- At-home dumb-charging case
- Case 2.
- Charging control at home only
- Case 3.
- Charging control at home and at the workplace
- Case 4.
- Charging and discharging control at home only
- Case 5.
- Charging and discharging control at home and at the workplace
In the dumb-charging scheme, an EV was charged immediately after a return day trip at a charging capacity of 3 kW.
5.3. Simulation Results
5.3.1. Electricity Generation
Figure 11 shows the nationwide annual electricity generation amount for each power generation type, while Figure 12 shows the changes to the generated power, with reference to the case lacking any EV (Case 0). An EV shift to dumb-charging led to an increase in the total generated electrical energy of 7.5 TWh (0.7%), from 1,108 TWh to 1,116 TWh. In this case, coal, LNG, and pumped generation also increased.
Compared to the dumb-charging scenario, the charge and discharge controls made LNG and pumped generation decrease, while coal generation (with lower fuel costs) increased. In Case 5, the curtailment of the charge and discharge controls, both at home and at the workplace, decreased as a result of the curtailment in the VRE generation but increased for PV and wind-power output.
There remains a need to discuss these results and determine how they can be interpreted in light of the results of previous studies and the working hypotheses. The findings and their implications should be discussed in the broadest context possible. Future research directions may also be highlighted.
5.3.2. Operational Costs
Table 3 summarizes the simulation results for each case. Operational costs include the start-up costs and the fuel costs for nationwide power generation. The VRE curtailment ratio is calculated as the curtailed power divided by the generated power from PV and wind generation. The CO2 emissions originate from thermal power plants. In the following, the knowledge obtained from the difference between the values for the respective cases in Table 3 will be described.
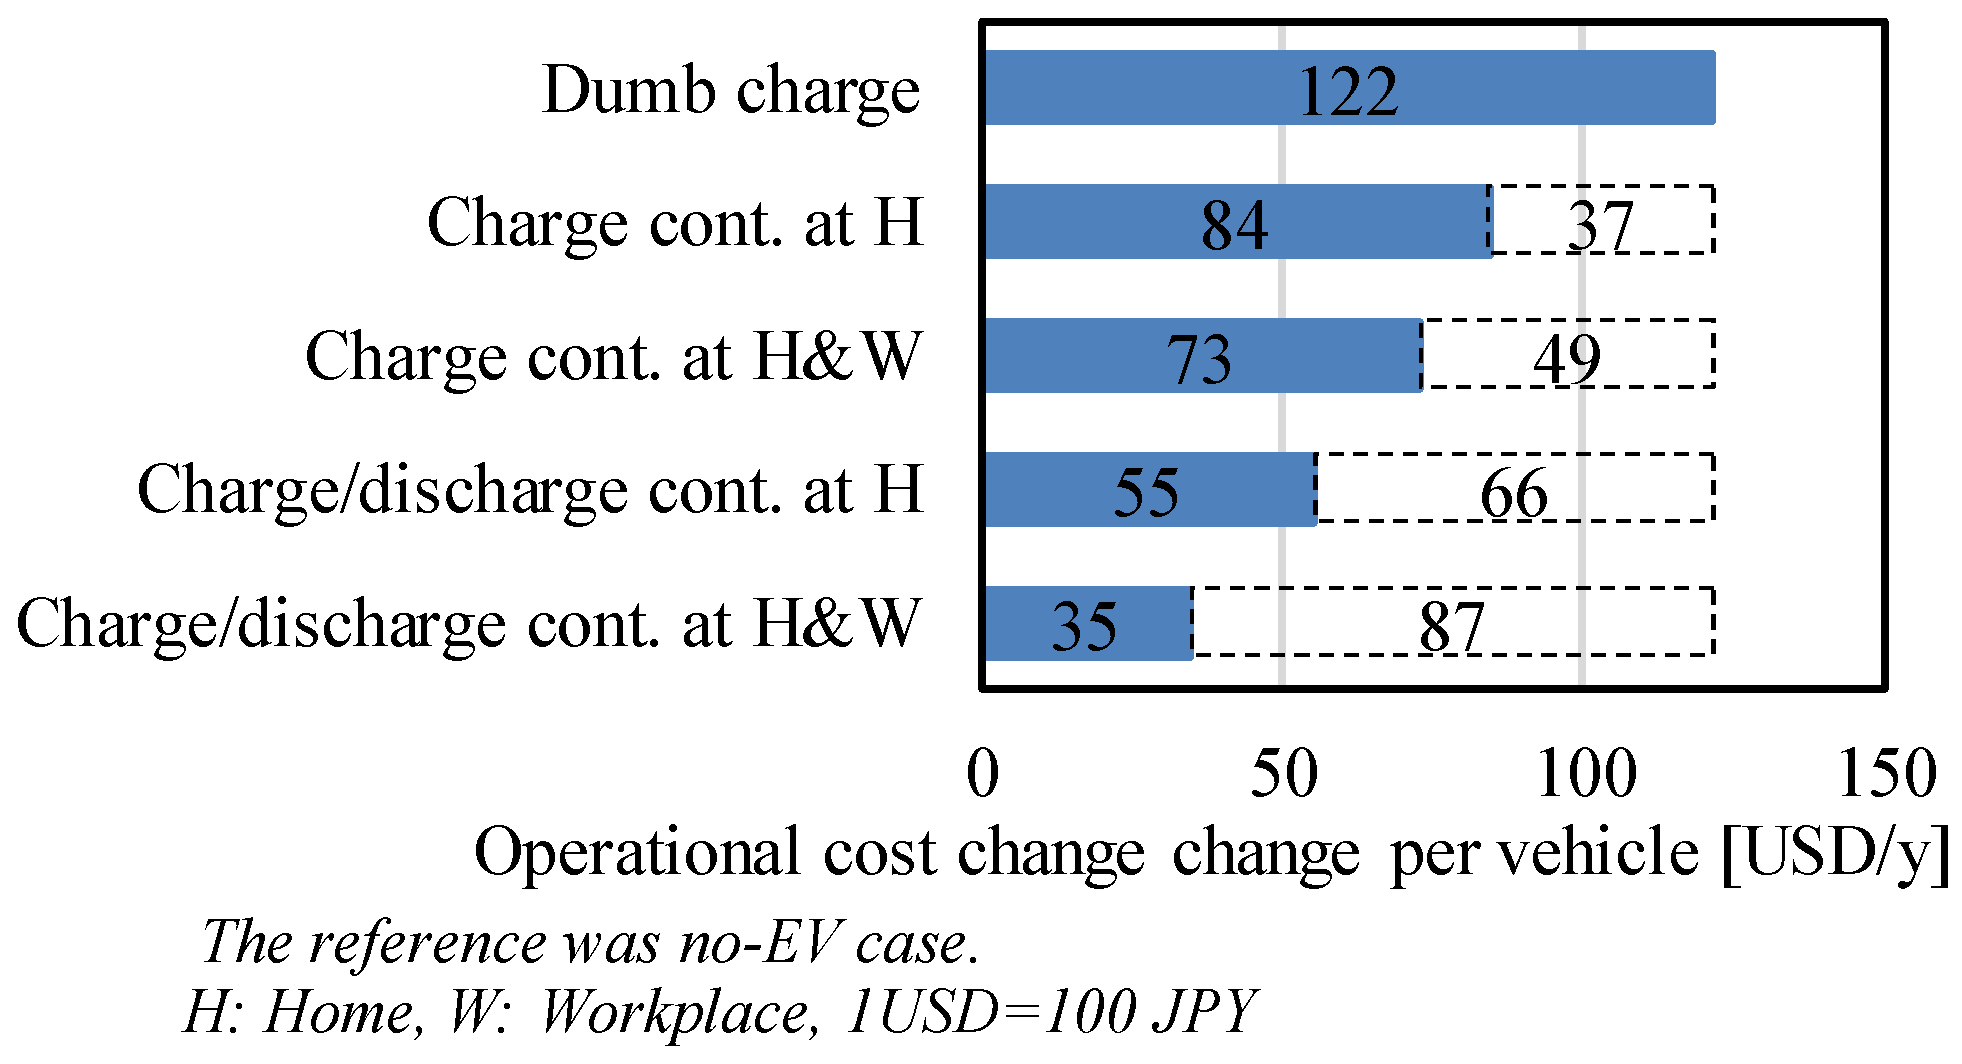
Figure 13 shows the difference in operational costs of power generation in Japan, including the start-up costs and fuel costs. The cost is seen to increase with a shift towards EVs with dumb charging (Case 1), relative to the scenario with no EVs (Case 0). This increase was approximately $1,090 million per year. The effects of reducing the operational costs by controlling the EV charging and discharging regime increased from $334 million per year in Case 2 to $778 million per year in Case 5. These figures correspond to a cost reduction of 31%–71% compared to the incremental cost by dumb charging. Changes in the operational cost per vehicle are shown in Figure 14. Here, the cost of an EV shift in the dumb charging scenario (Case 1) compared to the scenario with no EVs (Case 0) increased by $122s per year. The effects of these operational cost reductions resulting from the application of EV charging and discharging controls increased from $37 per year in Case 2 to $87 per year in Case 5. Meanwhile, the cost merit per vehicle for the workplace charging control method, determined by the difference between Case 2 and Case 3, was $12 per year. The cost merit per vehicle of the workplace charging/discharging control, as determined by the difference between Case 4 and Case 5, was almost double that of the workplace charging control method, at $21 per year.
5.3.3. Reduction in VRE Curtailment
A curtailment in the VRE generation indicates the electric power suppression needed to minimize the total system costs with respect to the amount of electric power that should have been generated, based on the solar radiation and wind conditions. As shown in Figure 8, the generation capacity led to a 33.9-TWh annual curtailment in VRE in Case 0, which corresponds to 16.5% for PV and 18.2% for wind power generation. In contrast, Figure 15 shows the effects of reducing the VRE curtailment through the introduction of EVs and control. Here, the EV shift in the dumb-charge scenario had the potential to reduce the curtailment by approximately 0.7%, as the electricity demand increased with respect to the no-EV case. This remarkable improvement was higher when workplace controls were available because they can greatly contribute to the mitigation of PV output curtailment during the day.
5.3.4. CO2 Emissions
Changes in the CO2 emissions are shown in Figure 16. We found that the electricity demand increased due to an increase in the EV shift at 2.9 Mt per year in the dumb-charging scenario. On the other hand, assuming that all conventional vehicles were fueled by gasoline, the CO2 emissions of the overall transportation sector decreased by approximately 13.4 Mt per year due to the electrification of vehicles. Here, the fuel efficiency of such vehicles was 11.9 km/l, based on Reference [23]. The CO2 emission intensity of gasoline was 2.38 kg CO2 /l CO2, where emissions increased through EV battery control (i.e., Cases 2 to 4) compared to the dumb-charging scheme (Case 1). The latter was due to the objective function of the model being cost minimization, which did not impose CO2 emissions penalties. The charge/discharge controls for the EVs contributed to the load leveling that enabled an increase in the generation of cheaper coal-fired power, which resulted in an increase in CO2 emissions. However, these were only small increases that had the potential to be offset against gasoline consumption.
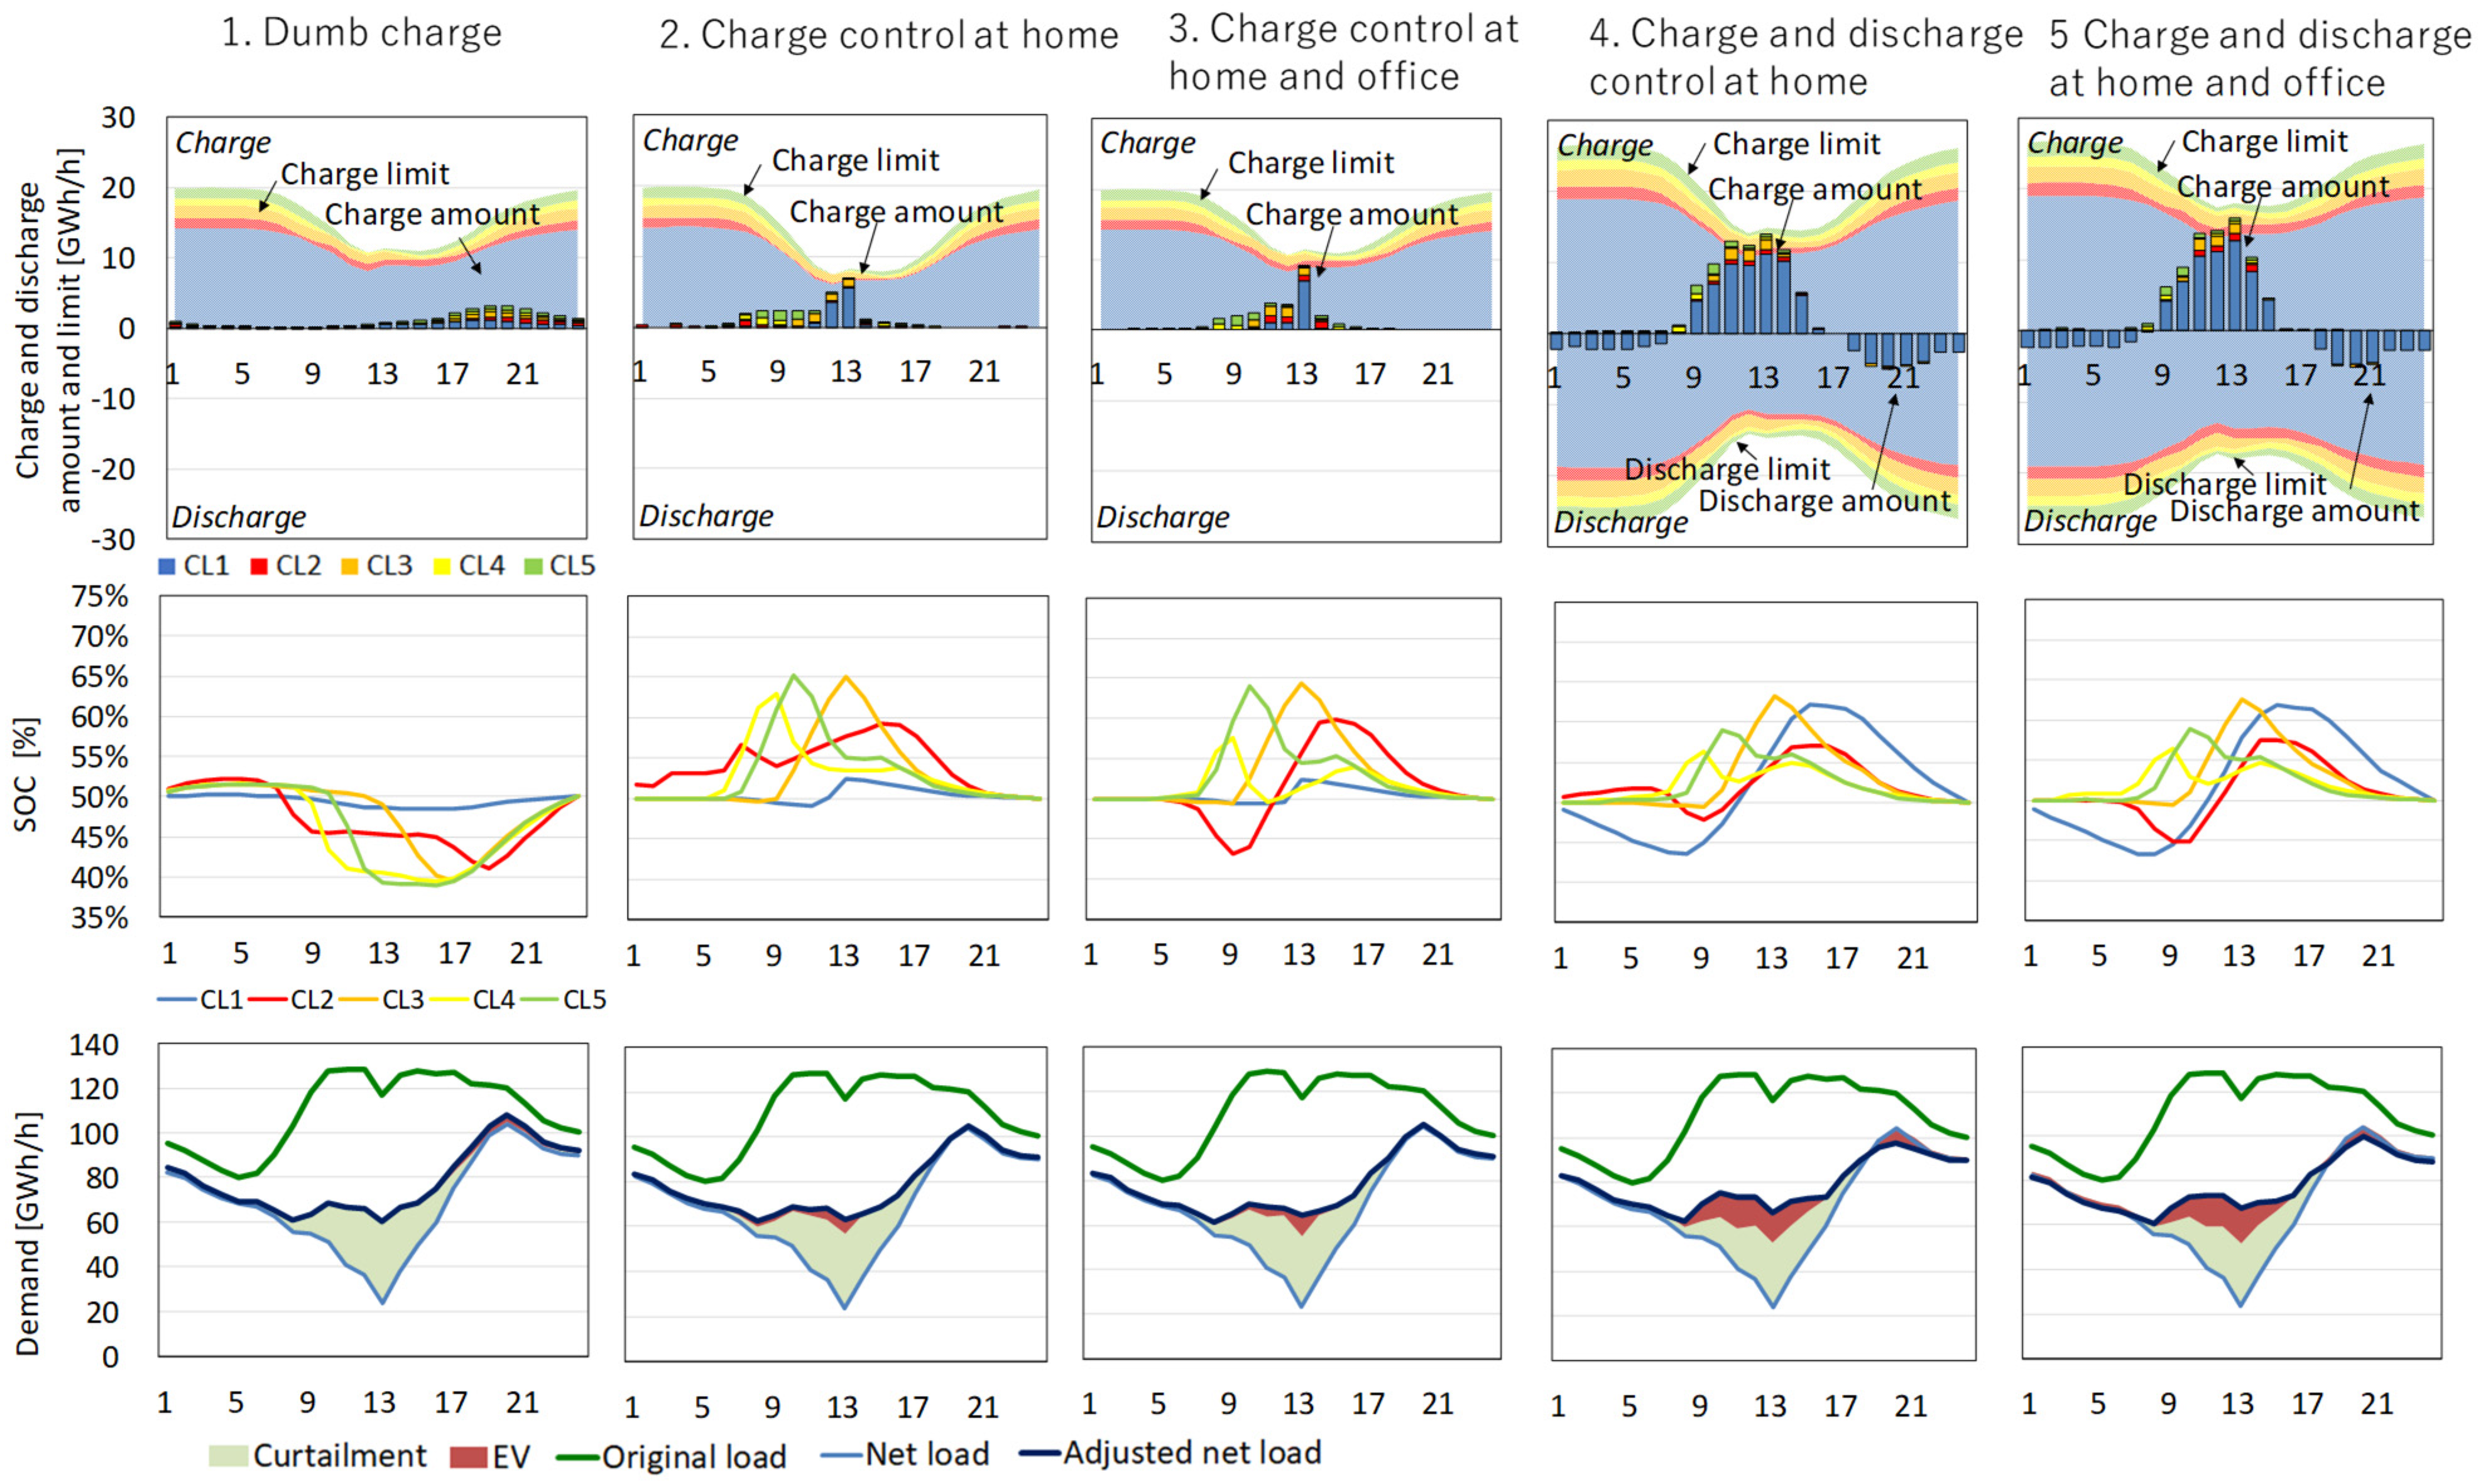
5.3.5. Daily Operations
Figure 17 shows the nationwide charging and discharging patterns, SOC by cluster, and change in net demand for each case on 1 April.
The upper graphs in Figure 17 show the potential and optimized controlled values for EVs, while the middle graphs show the total SOC for EVs in each cluster. The net load in the lower graphs indicates the demand curve, subtracting PV, wind power generation, co-generation, and interchange power from the original demand. The adjusted net load indicates a demand curve by reflecting the curtailment for VRE output, as well as the optimal EV charging and discharging. Here, the amount of discharge on the upper graphs does not include the discharge for the EV fleet.
While the charging demands occur in the evening for the dumb charging scheme, the degree of freedom of battery utilization on EVs increased for Case 2 to Case 5.
In the case when only charge control is applied, the controlled amount was limited because the fleet charging load was the only parameter that could be controlled. The charging and discharging controls made it possible to discharge power in the evenings, which flattens the residual load curve. Since the non-operating vehicles were also controlled, the discharging control potential increased.
In addition, the availability of workplace controls shifted the charge from early in the morning to midday. This contributed to mitigating the PV output curtailment.
The upper graphs in Figure 17 show that the controlled EV amounts almost reached the available charge, while the middle graphs show that the SOC varied between 40 and 70%. This indicates that the controlled variable for the EV was limited not by the kWh capacity (40 kWh/unit), but by the kW capacity (3 kW/unit). Therefore, it is expected that the controlled amount will further expand through the use of inverters with a larger capacity for charge and discharge. This, however, may lead to risks related to the restrictions on the distribution network, such that the tradeoff should be considered carefully.
6. Conclusions
We have proposed a model for integrating and assimilating electric vehicles (EVs) into the power grid system in Japan. An EV driving model was constructed based on the results of a Japanese road traffic census and a production cost model for the entire power system. The contribution of EVs as a flexible resource was evaluated by considering the availability of EVs both at home and at the workplace.
We simulated the supply and demand forecasts for 2030, assuming a 16% introduction of EVs to the private vehicle sector, and determined the following:
- -
- Japanese vehicles travel shorter distances, with nearly half of all vehicles being unused on a daily basis, based on a 2010 OD survey. As a future scenario, assuming that the ratio of non-operating vehicles is half that found in 2010, the travel mileage per vehicle equaled 7,468 km per year, which was less than half of that found for EVs in the US. Therefore, the charge control method could not be used to make EV batteries contribute to the grid. Both charging and discharging control did allow the batteries of non-operating vehicles to be utilized, which led to an increase in the control potential.
- -
- The introducing of EVs to a point where they constituted 16% of all private cars in 2030 increased the nationwide electric power system demand by 0.7%. As the control amount for EVs increased, the curtailment of VRE was reduced, the overall power generation of pumped storage and natural gas decreased, while the use of inexpensive coal increased. The introduction of EVs increased the generation costs in a dumb-charging scenario, however, in that the application of charge to an EV battery could reduce the incremental cost by 31%–40%, while the charge/discharge control could reduce it by 54%–71%.
- -
- A 17% curtailment in VRE occurred without the introduction of EVs. Here, the curtailment was reduced by 0.7% in the dumb-charging case, by 4.6–7.7% for the charge control only case, and by 13.9–18.1 % in the case when both charge and discharge controls are applied.
- -
- Since CO2 emissions were not restricted in this simulation, the CO2 release increased slightly through the application of charge and discharge controls when operational costs were minimized. However, due to the effect of fossil fuel substitution with the adoption of EVs, the CO2 emissions were reduced by 10–11 Mt per year.
- -
- The control effects of EVs were restricted by the kW capacity (3 kW). It was, therefore, suggested that greater control effects could be attained by increasing the inverter capacity for the charge and discharge scenarios. An increase in the kWh capacity (40 kWh) did not lead to an increase in the effect under this assumption.
Given the results produced by our analysis, it was found that EVs can greatly contribute to expanding the use of renewable energy and reducing system costs by charging and discharging not only at home but also at the workplace. Thus, the installation of charging facilities at places of work is a worthwhile venture that should be supported politically.
Our future work will include the analysis of various scenarios to determine the effect of integrating EVs. In-depth parameter analysis should be promoted for the number of EVs, the battery kW and kWh capacity, the SOC initial level, and different cluster methods. We will also develop an evaluation model for multiple DR resources other than EVs.
Author Contributions
Y.I. conceived and built up the research methodology, analyzed and wrote this paper. H.A. conducted the system simulations. K.O. supervised the research and made suggestions regarding this research.
Funding
This research received no external funding.
Acknowledgments
This work was supported by JST CREST Grant Number JPMJCR15K4, Japan and the New Energy and Industrial Technology Development Organization (NEDO).
Conflicts of Interest
The authors declare no conflict of interest.
Nomenclature
| Index | |
| t | Time slot |
| i | Generator unit |
| ig | Grid |
| m | Interconnection line |
| c | Electric vehicle (EV) cluster |
| imustrun | Index of must-run generator units |
| imuststop | Index of must-stop generator units |
| imainte | Index of generator units under maintenance |
| Parameters | |
| bi, ci | Coefficients |
| NT | Number of time slots |
| Ngrid | Number of grids |
| NGig, idxig | Total number and initial index of generator units in grid ig |
| NPGig, idpig | Total number and initial index of pumped storage units in grid ig |
| NTGig, idtig | Total number and initial index of thermal and nuclear generator units in grid ig |
| NHGig, idhig | Total number and initial index of hydro, geothermal and biomass generator units in grid ig |
| Ntgig | Set of thermal generators and nuclear generator units in grid ig |
| Nhgig | Set of hydro, geothermal and biomass generator units in grid ig |
| LOADigt | System load at time t in grid ig |
| PLi, PUi, adjpui | Lower and upper output and adjustment ratio of generator unit i |
| PsLi, PsUi | Lower and upper water storage capacity of pumped storage unit i |
| PgLi, PgUi, adjpgi | Lower and upper output and adjustment ratio of pumped storage unit i |
| PpLi, PpUi, adjppi | Lower and upper input and adjustment ratio of pumped storage unit i |
| ηi | Pumping efficiency of pumped water generator unit i |
| Npf | Number of interconnection lines |
| Npfig, from, Npfig, to | Set of grids that are from side and to side connected with grid ig via interconnection lines |
| PfGUig, PfGLig | Upper and lower limit flow via interconnection lines connected to grid ig |
| PfUm, PfLm | Upper and lower limit flow in interconnection line m |
| mrgm | Marginal capacity in interconnection line m |
| lossm | Transmission loss in interconnection line m |
| BTig, adjbtig | Battery capacity and adjustment ratio in grid ig |
| orloadig, orpvig, orwdig | Required adjustment ratio for system load, photovoltaic (PV) generation and wind power generation in grid ig |
| NEVig | Number of EV cluster of grid ig |
| EVhomeig,ct | EV chargeable capacity at time t in cluster c of grid ig |
| EVhome2ig,ct | EV chargeable and dischargeable capacity at time t in cluster c of grid ig |
| EVloadig,ct | EV fleet load at time t in cluster c of grid ig |
| ηCh | EV battery efficiency |
| BTcapmaxig,c | Maximum EV battery capacity in cluster c of grid ig |
| BTcapminig,c | Minimum EV battery capacity in cluster c of grid ig |
| Variables | |
| Pit | Outputs of generator i at time t |
| Uit | Unit commitment states of generator unit i at time t (0stop, 1start) |
| Ugi,ig, Upi,ig | Unit commitment states of pumped storage unit i in grid ig (0stop, 1start) |
| Upit | Unit commitment states for pumping of pumped storage unit i at time t in generator i (0stop, 1start) |
| Ugit | Unit commitment states for generating of pumped storage unit i at time t in generator i (0stop, 1start) |
| Psi t | Water storage amount of pumped storage unit i at time t |
| Ppit, Pgit | Pumping input and output amount of pumped storage unit i at time t |
| Phit, adjhi | Output and adjustment ratio of hydropower unit i at time t |
| Pcgigt, adjcgig | Output and adjustment ratio of co-generation system at time t in grid ig |
| Ppvigt,Pwdigt | Output of PV and wind power systems at time t in grid ig |
| SVpvigt, SVwdigt | Curtailment of PV and wind power systems at time t in grid ig |
| Pfmt | Power flow on interconnection line m |
| LFCsendigt | LFC (load frequency control) power from grid ig to other grids |
| LFCreceiveigt | LFC power from other grids to grid ig |
| LFCupit | LFC reserve capacity to raise at time t in generator unit i |
| LFCdownit | LFC reserve capacity to lower at time t in generator unit i |
| EVchig,ct | EV charging amount for EV fleet at time t in cluster c of grid ig |
| EVochig,ct | EV charging amount for other than EV fleet at time t in cluster c of grid ig |
| Dischig,ct | EV discharging amount at time t in cluster c of grid ig |
| EVsocig,ct | EV state of charge (SOC) at time t in cluster c of grid ig |
References
- The Ministry of the Environment Japan’s National Greenhouse Gas Emissions in Fiscal Year 2017. Available online: https://www.env.go.jp/press/files/en/784.pdf (accessed on 14 May 2019).
- Automobile Inspection & Registration Information Association Vehicle Ownership Trend in Japan. Available online: https://www.airia.or.jp/publish/statistics/trend.html (accessed on 14 May 2019). (In Japanese).
- Richardson, D.B. Electric vehicles and the electric grid: A review of modeling approaches, impacts, and renewable energy integration. Renew. Sustain. Energy Rev. 2013, 19, 247–254. [Google Scholar] [CrossRef]
- Liu, L.; Kong, F.; Liu, X.; Peng, Y.; Wang, Q. A review on electric vehicles interacting with renewable energy in smart grid. Renew. Sustain. Energy Rev. 2015, 51, 648–661. [Google Scholar] [CrossRef]
- Hu, J.; Morais, H.; Sousa, T.; Lind, M. Electric vehicle fleet management in smart grids: A review of services, optimization and control aspects. Renew. Sustain. Energy Rev. 2016, 56, 1207–1226. [Google Scholar] [CrossRef] [Green Version]
- Daina, N.; Sivakumar, A.; Polak, J.W. Modelling electric vehicles use: a survey on the methods. Renew. Sustain. Energy Rev. 2017, 68, 447–460. [Google Scholar] [CrossRef] [Green Version]
- Lyon, T.P.; Michelin, M.; Jongejan, A.; Leahy, T. Is “smart charging” policy for electric vehicles worthwhile? Energy Policy 2012, 41, 259–268. [Google Scholar] [CrossRef]
- Camus, C.; Farias, T.; Esteves, J. Potential impacts assessment of plug-in electric vehicles on the Portuguese energy market. Energy Policy 2011, 39, 5883–5897. [Google Scholar] [CrossRef]
- Fernandes, C.; Frías, P.; Latorre, J.M. Impact of vehicle-to-grid on power system operation costs: The Spanish case study. Appl. Energy 2012, 96, 194–202. [Google Scholar] [CrossRef]
- Wang, J.; Liu, C.; Ton, D.; Zhou, Y.; Kim, J.; Vyas, A. Impact of plug-in hybrid electric vehicles on power systems with demand response and wind power. Energy Policy 2011, 39, 4016–4021. [Google Scholar] [CrossRef]
- Dallinger, D.; Gerda, S.; Wietschel, M. Integration of intermittent renewable power supply using grid-connected vehicles—A 2030 case study for California and Germany. Appl. Energy 2013, 104, 666–682. [Google Scholar] [CrossRef]
- Tan, Z.; Yang, P.; Nehorai, A. An Optimal and Distributed Demand Response Strategy with Electric Vehicles in the Smart Grid. IEEE Trans. Smart Grid 2014, 5, 861–869. [Google Scholar] [CrossRef]
- Saber, A.; Venayagamoorthy, G. Resource cheduling under uncertainty in a smart grid with renewables and plug-in vehicles. IEEE Syst. J. 2012, 6, 103–109. [Google Scholar] [CrossRef]
- California Energy Commission. California Plug-in Electric Vehicle Infrastructure Projections 2017–2025; California Energy Commission: Sacramento, CA, USA, 2018.
- Zhang, Q.; Tezuka, T.; Ishihara, K.N.; Mclellan, B.C. Integration of PV power into future low-carbon smart electricity systems with EV and HP in Kansai Area, Japan. Renew. Energy 2012, 44, 99–108. [Google Scholar] [CrossRef]
- Yabe, K.; Shinoda, Y.; Seki, T.; Tanaka, H.; Akisawa, A. Market penetration speed and effects on CO2 reduction of electric vehicles and plug-in hybrid electric vehicles in Japan. Energy Policy 2012, 45, 529–540. [Google Scholar] [CrossRef]
- The Ministry of Land, Infrastructure and Transport Road Traffic Census Vehicle Origin and Destination Survey. Available online: http://www.mlit.go.jp/road/h27road-od/od1.html (accessed on 14 May 2019). (In Japanese).
- Arthur, D.; Vassilvitskii, S. k-means++: the advantages of careful seeding. In Proceedings of the Eighteenth Annual ACM-SIAM Symposium on Discrete Algorithms; Society for Industrial and Applied Mathematics Philadelphia: Philadelphia, PA, USA, 2007; pp. 1027–1035. [Google Scholar]
- Azuma, H.; Ogimoto, K.; Fukutome, S.; Minotsu, S. Impacts of asset investment of renewable energy on market design and operation. In Proceedings of the CIGRE 2016, Paris, France, 21–26 August 2016. [Google Scholar]
- Gurobi Gurobi Optimizer 8.1. Available online: http://www.gurobi.com/ (accessed on 14 May 2019).
- Ministry of Economy, Trade and Industry Long-Term Energy Supply and Demand Outlook 2015. Available online: https://www.meti.go.jp/english/press/2015/pdf/0716_01a.pdf (accessed on 14 May 2019).
- Electric Power Research Institute Electric Vehicle Driving, Charging, and Load Shape Analysis a Deep Dive into Where, When, and How Much Salt River Project (SRP) Electric Vehicle Customers Charge. Available online: http://mydocs.epri.com/docs/PublicMeetingMaterials/ee/000000003002013754.pdf (accessed on 14 May 2019).
- Ministry of Land, Infrastructure and Transport Automobile Fuel Consumption Survey. Available online: http://www.mlit.go.jp/k-toukei/nenryousyouhiryou.html (accessed on 14 May 2019).
Figure 1.
Travel distance and ratio of electric vehicle (EV) switching potential by vehicle type.
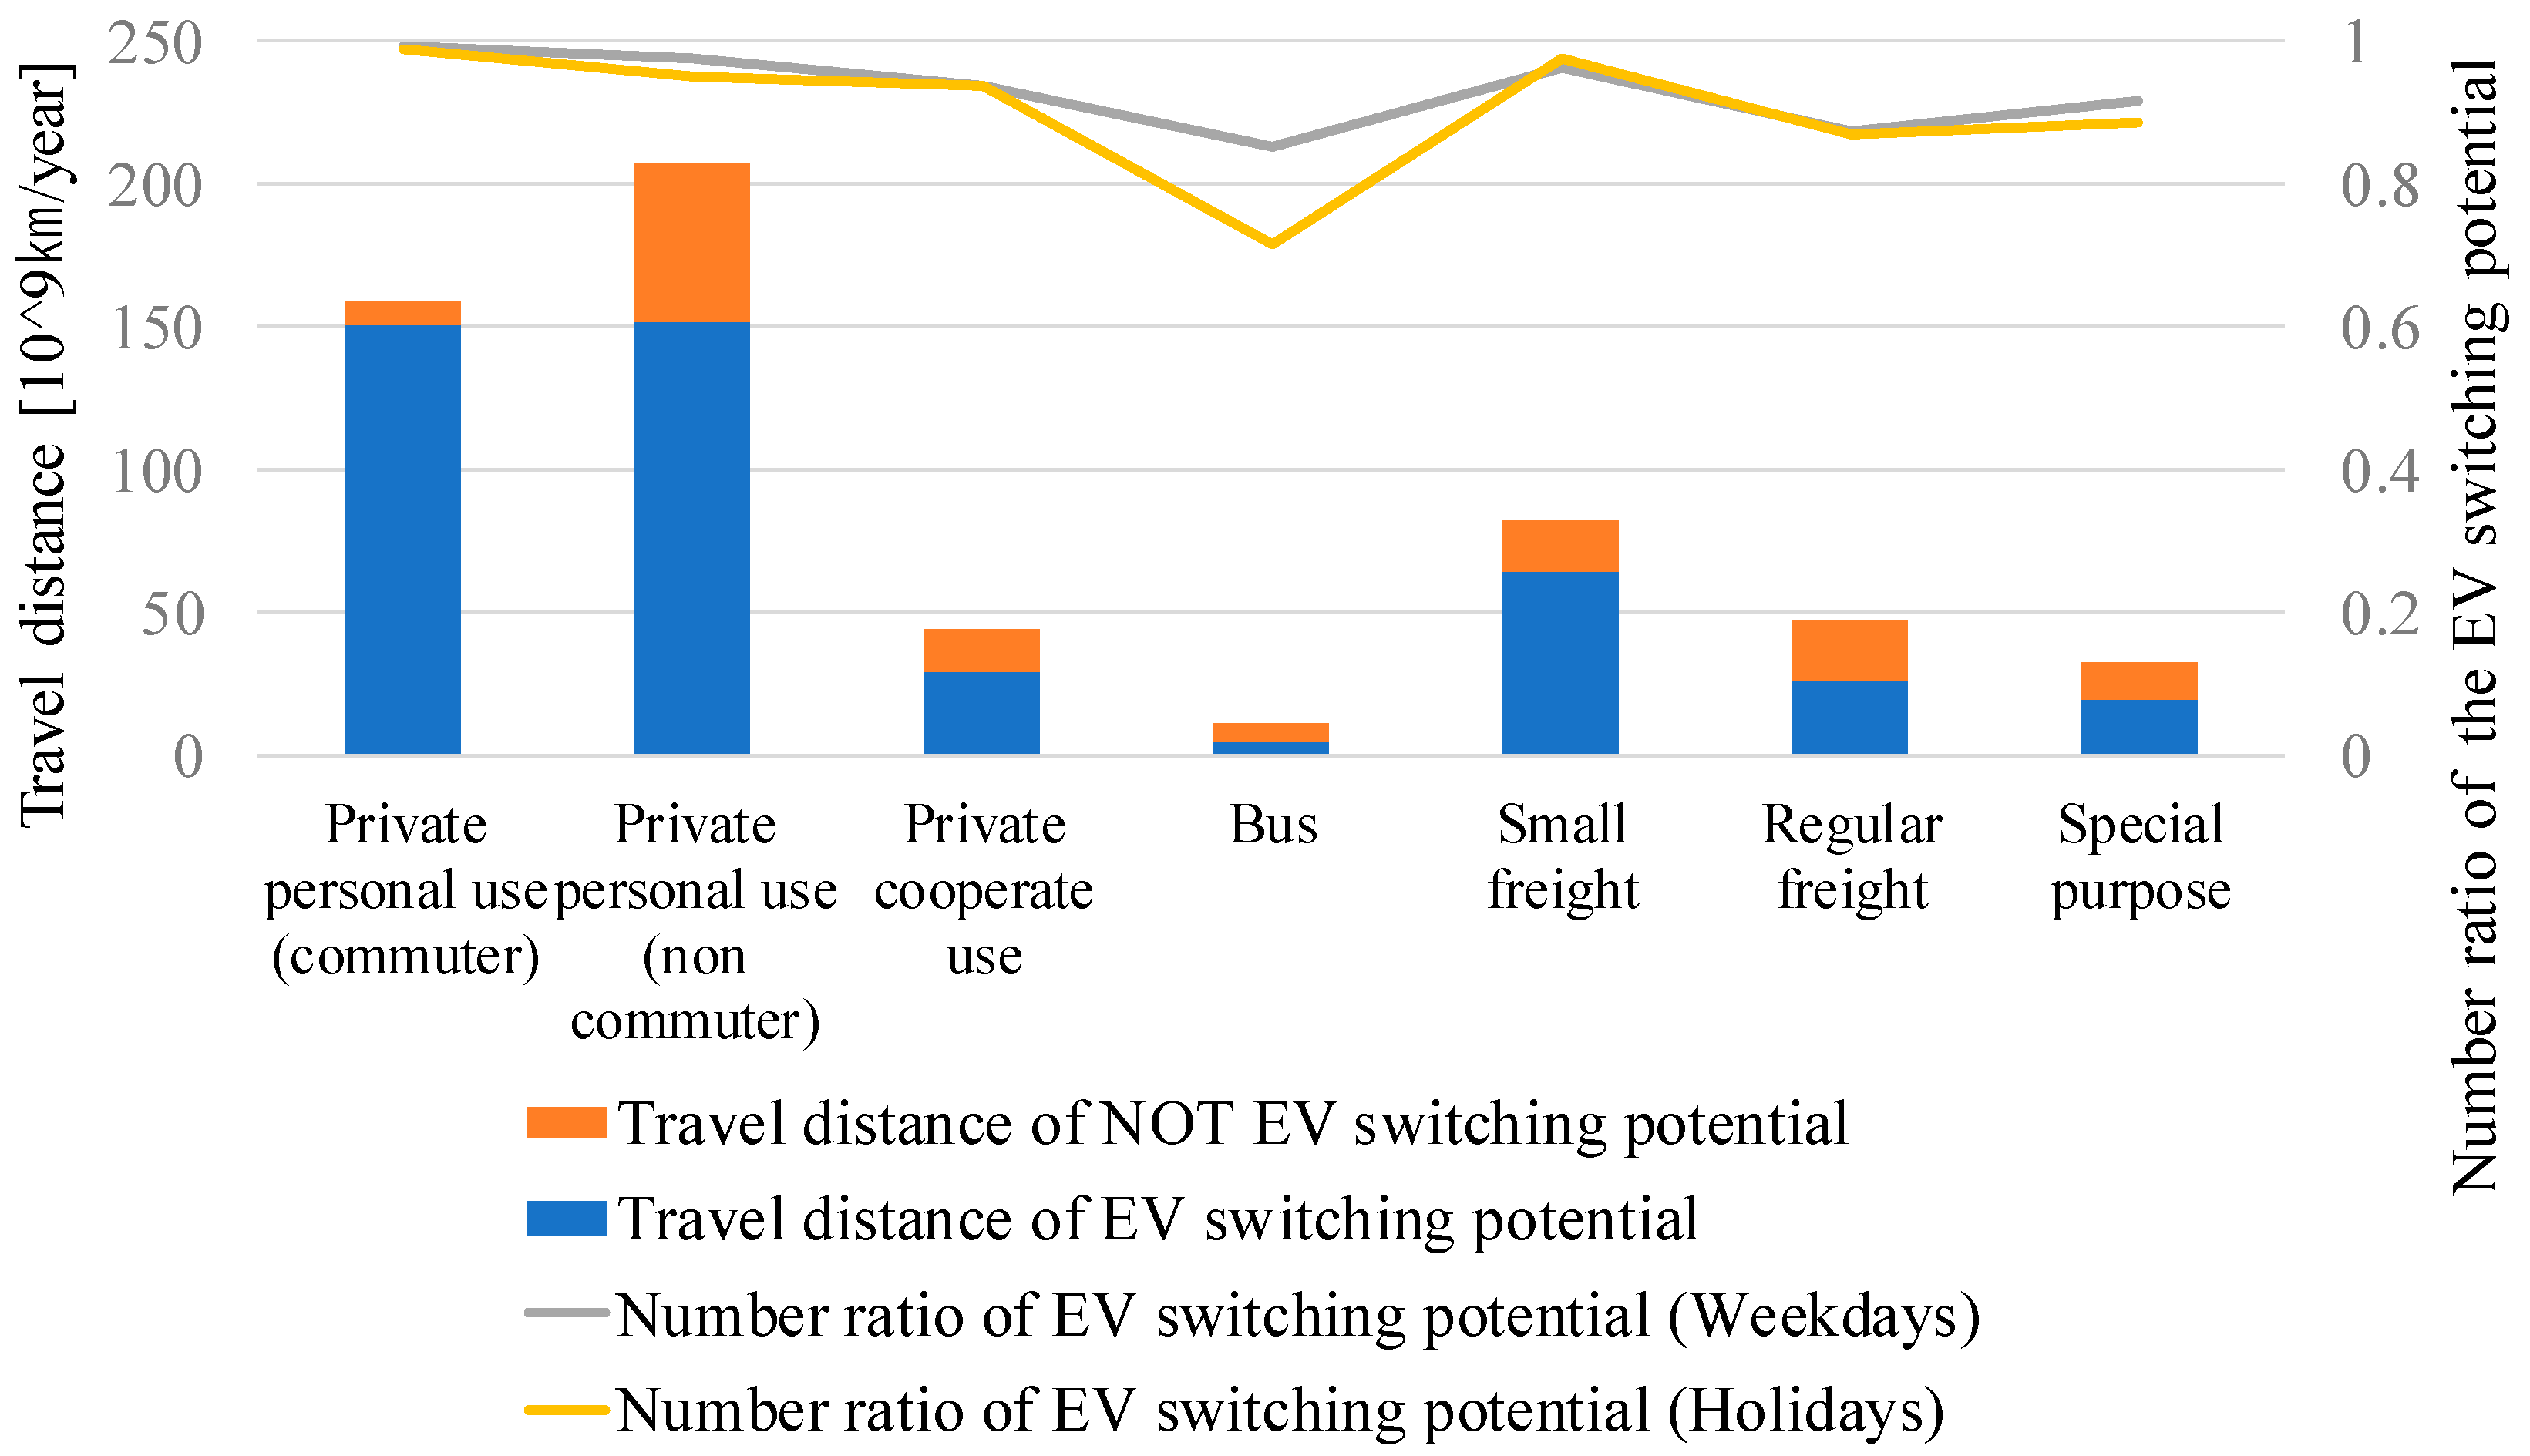
Figure 2.
Hourly mileage of the EV switching potential by vehicle type.

Figure 3.
Potential share of EV battery capacity and ratio of total capacity to area peak demand by area.
Figure 3.
Potential share of EV battery capacity and ratio of total capacity to area peak demand by area.
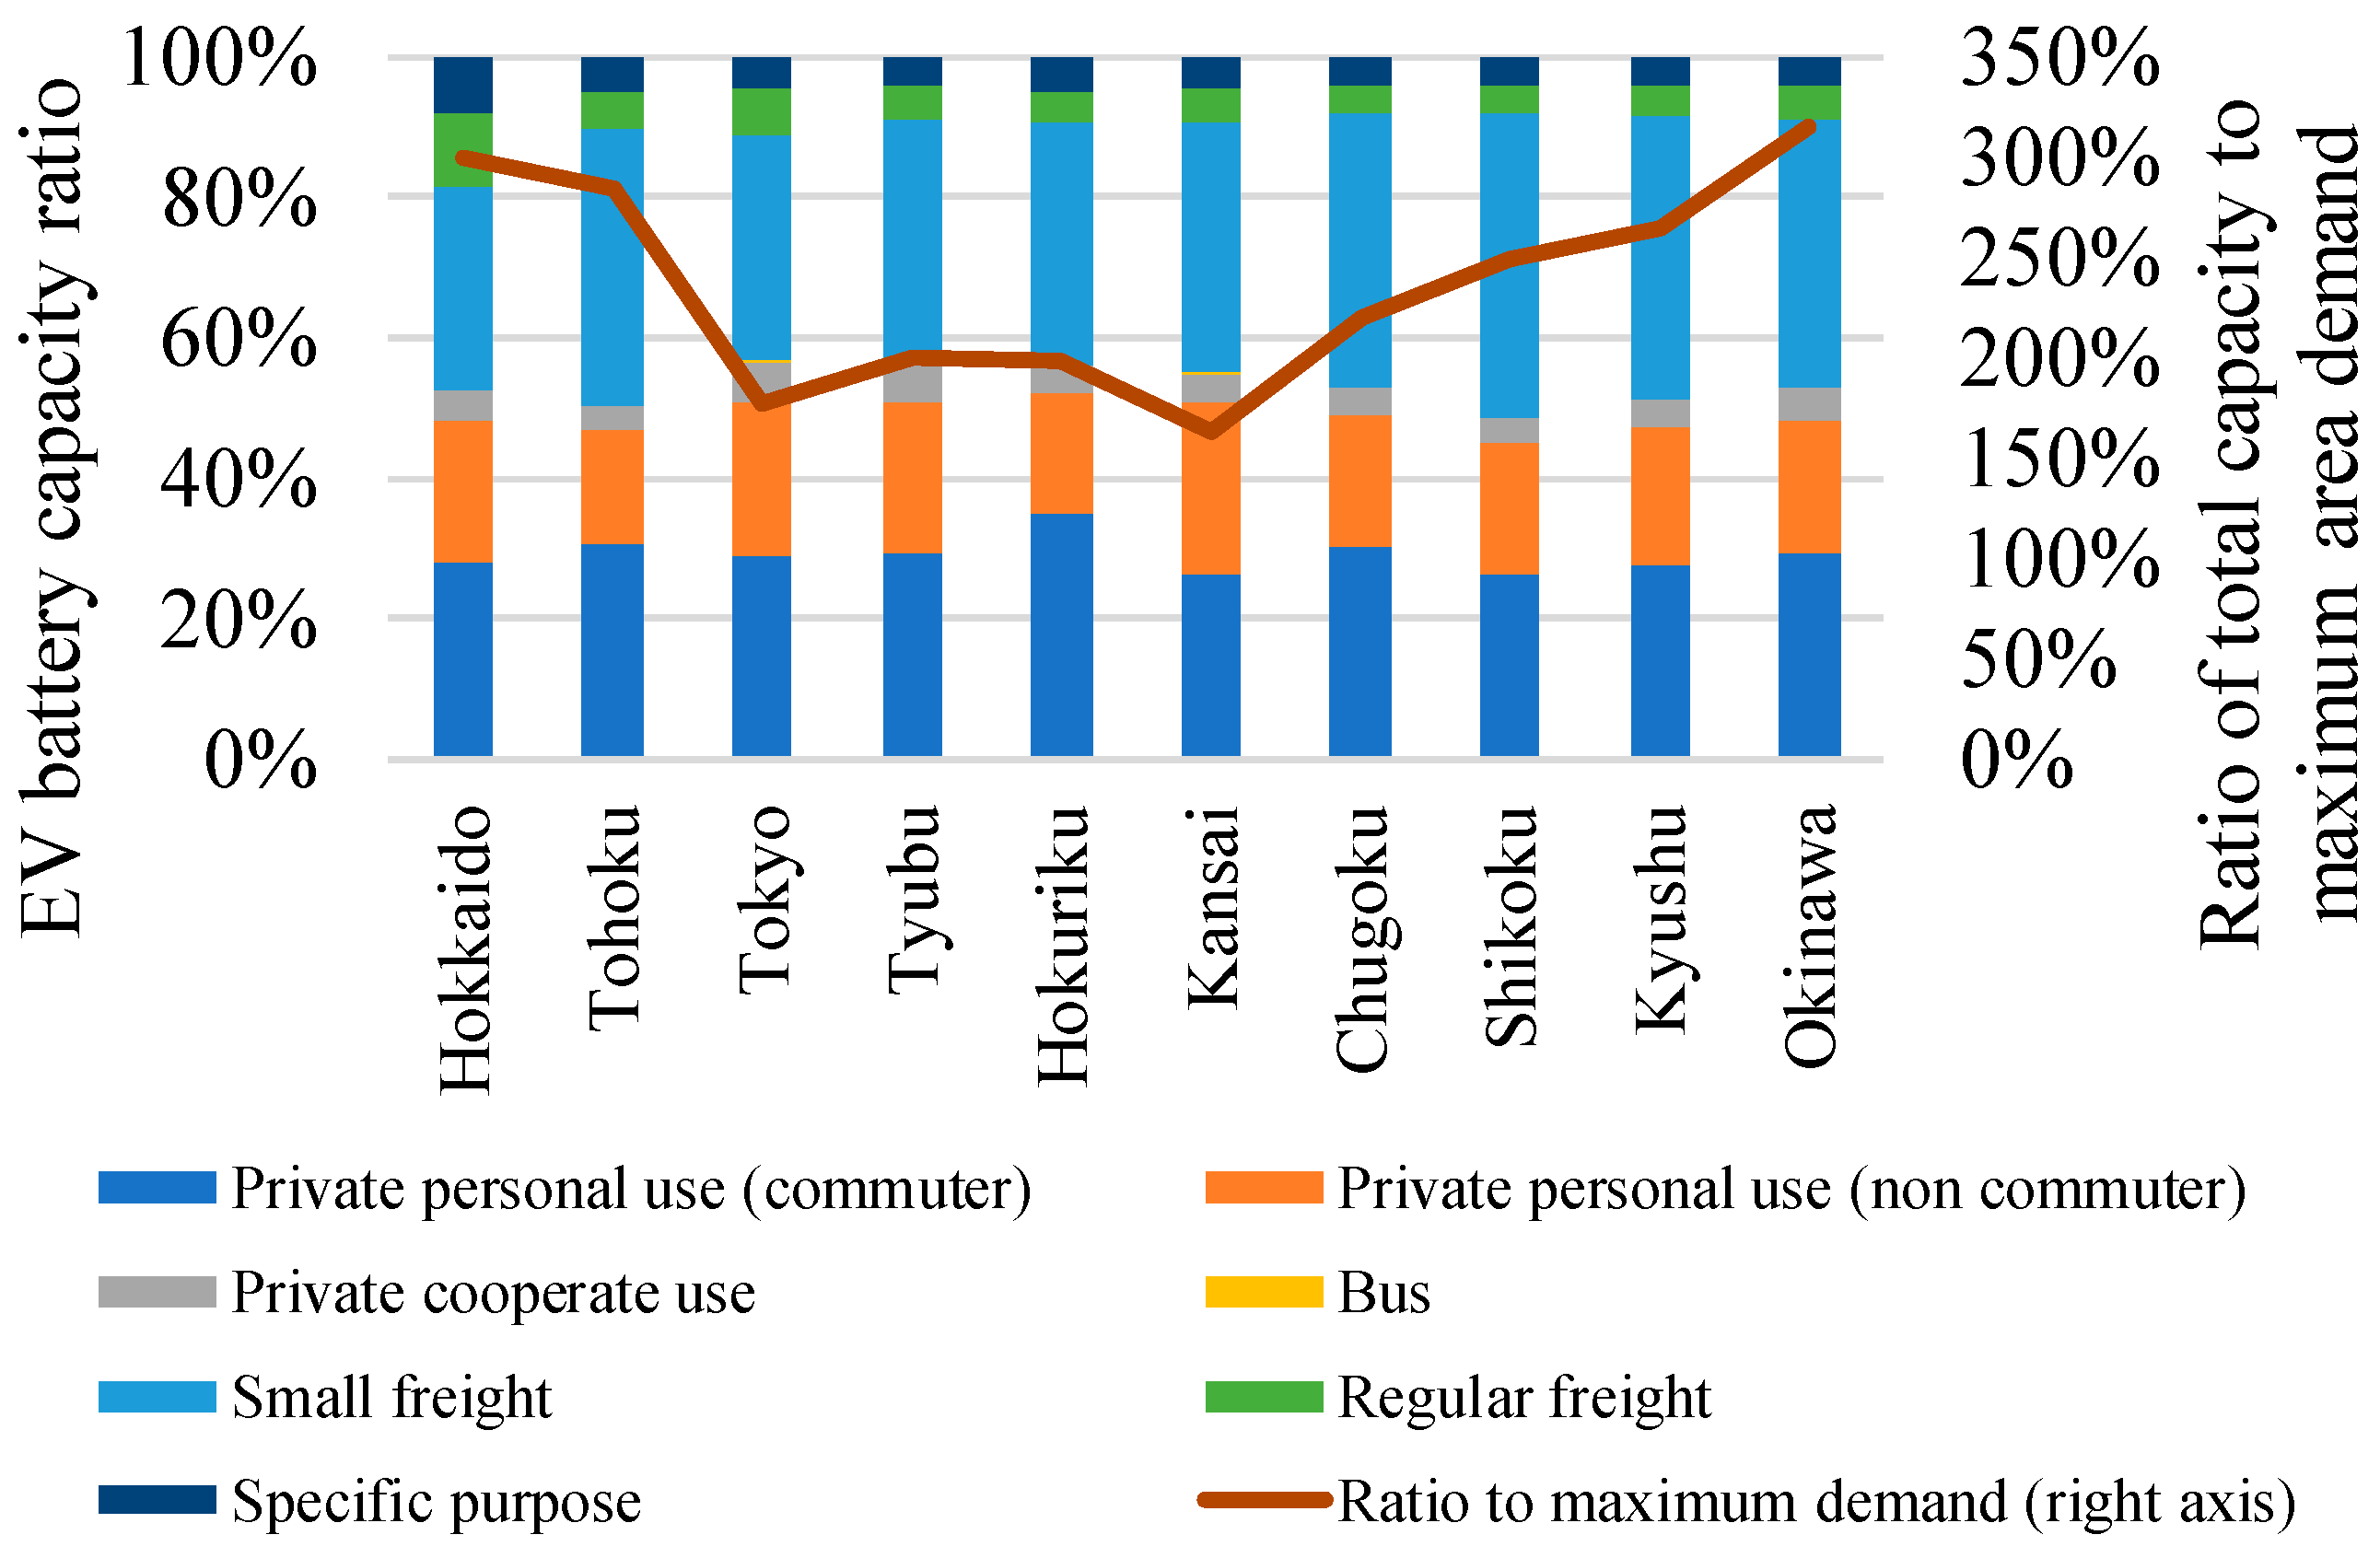
Figure 4.
Potential share of EV electricity demand and ratio of total demand to total area demand by area.
Figure 4.
Potential share of EV electricity demand and ratio of total demand to total area demand by area.

Figure 5.
Mileage patterns (by cluster) of private, personal-use vehicles.

Figure 6.
Home and workplace existence ratio (by cluster) of private, personal-use vehicles.

Figure 7.
Vehicle share (by cluster and area) of private, personal-use vehicles.
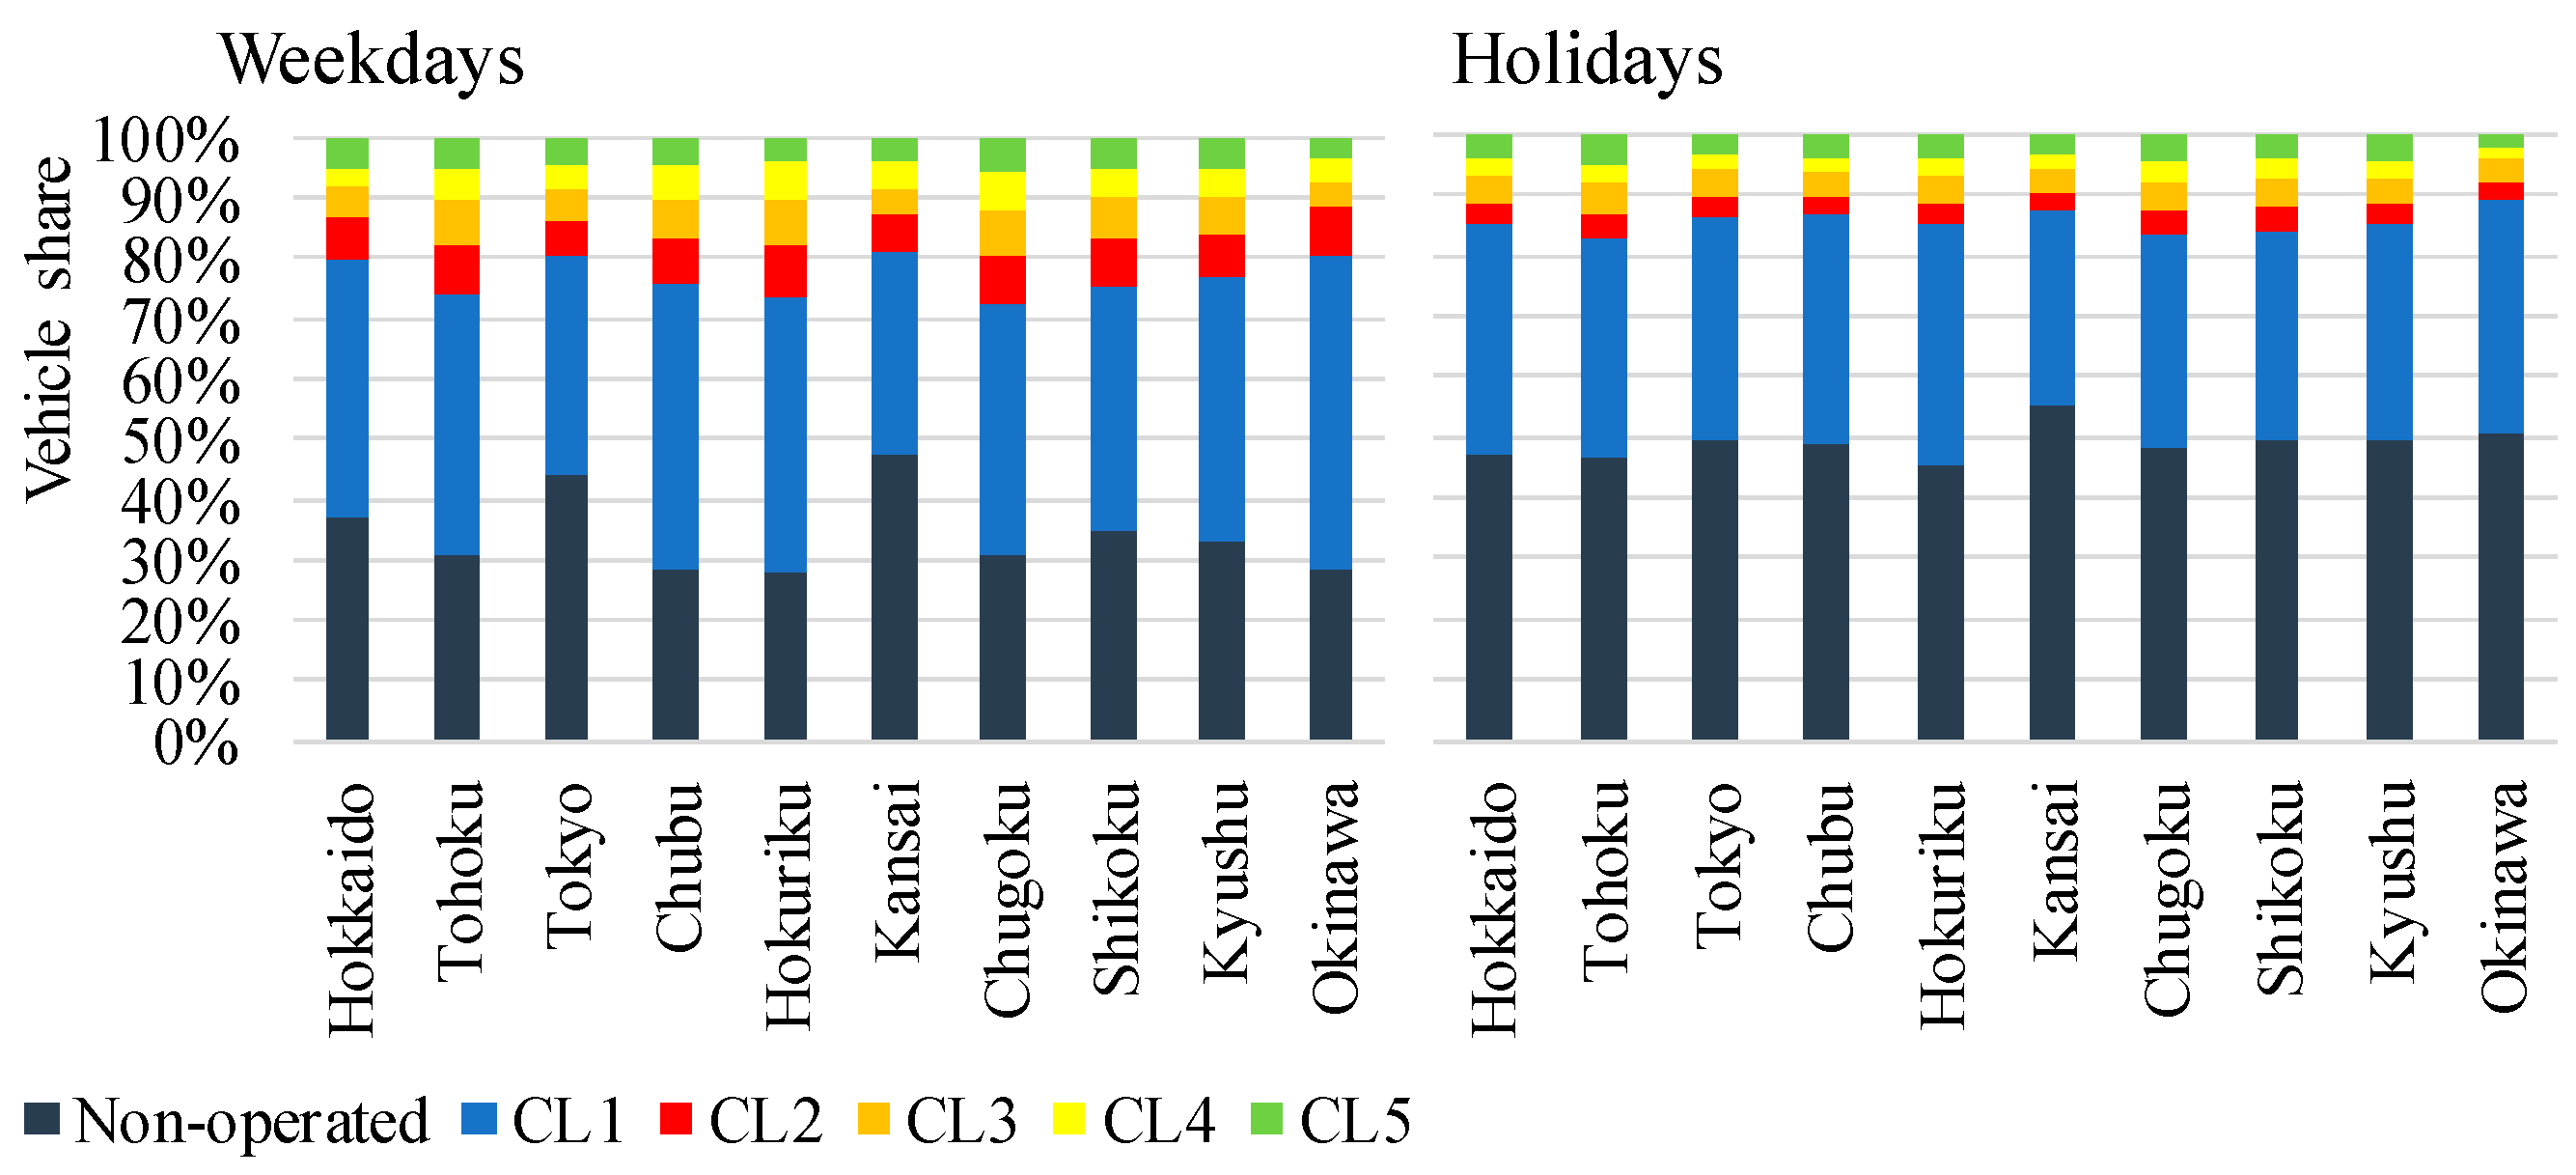
Figure 8.
Generation capacity per given area.
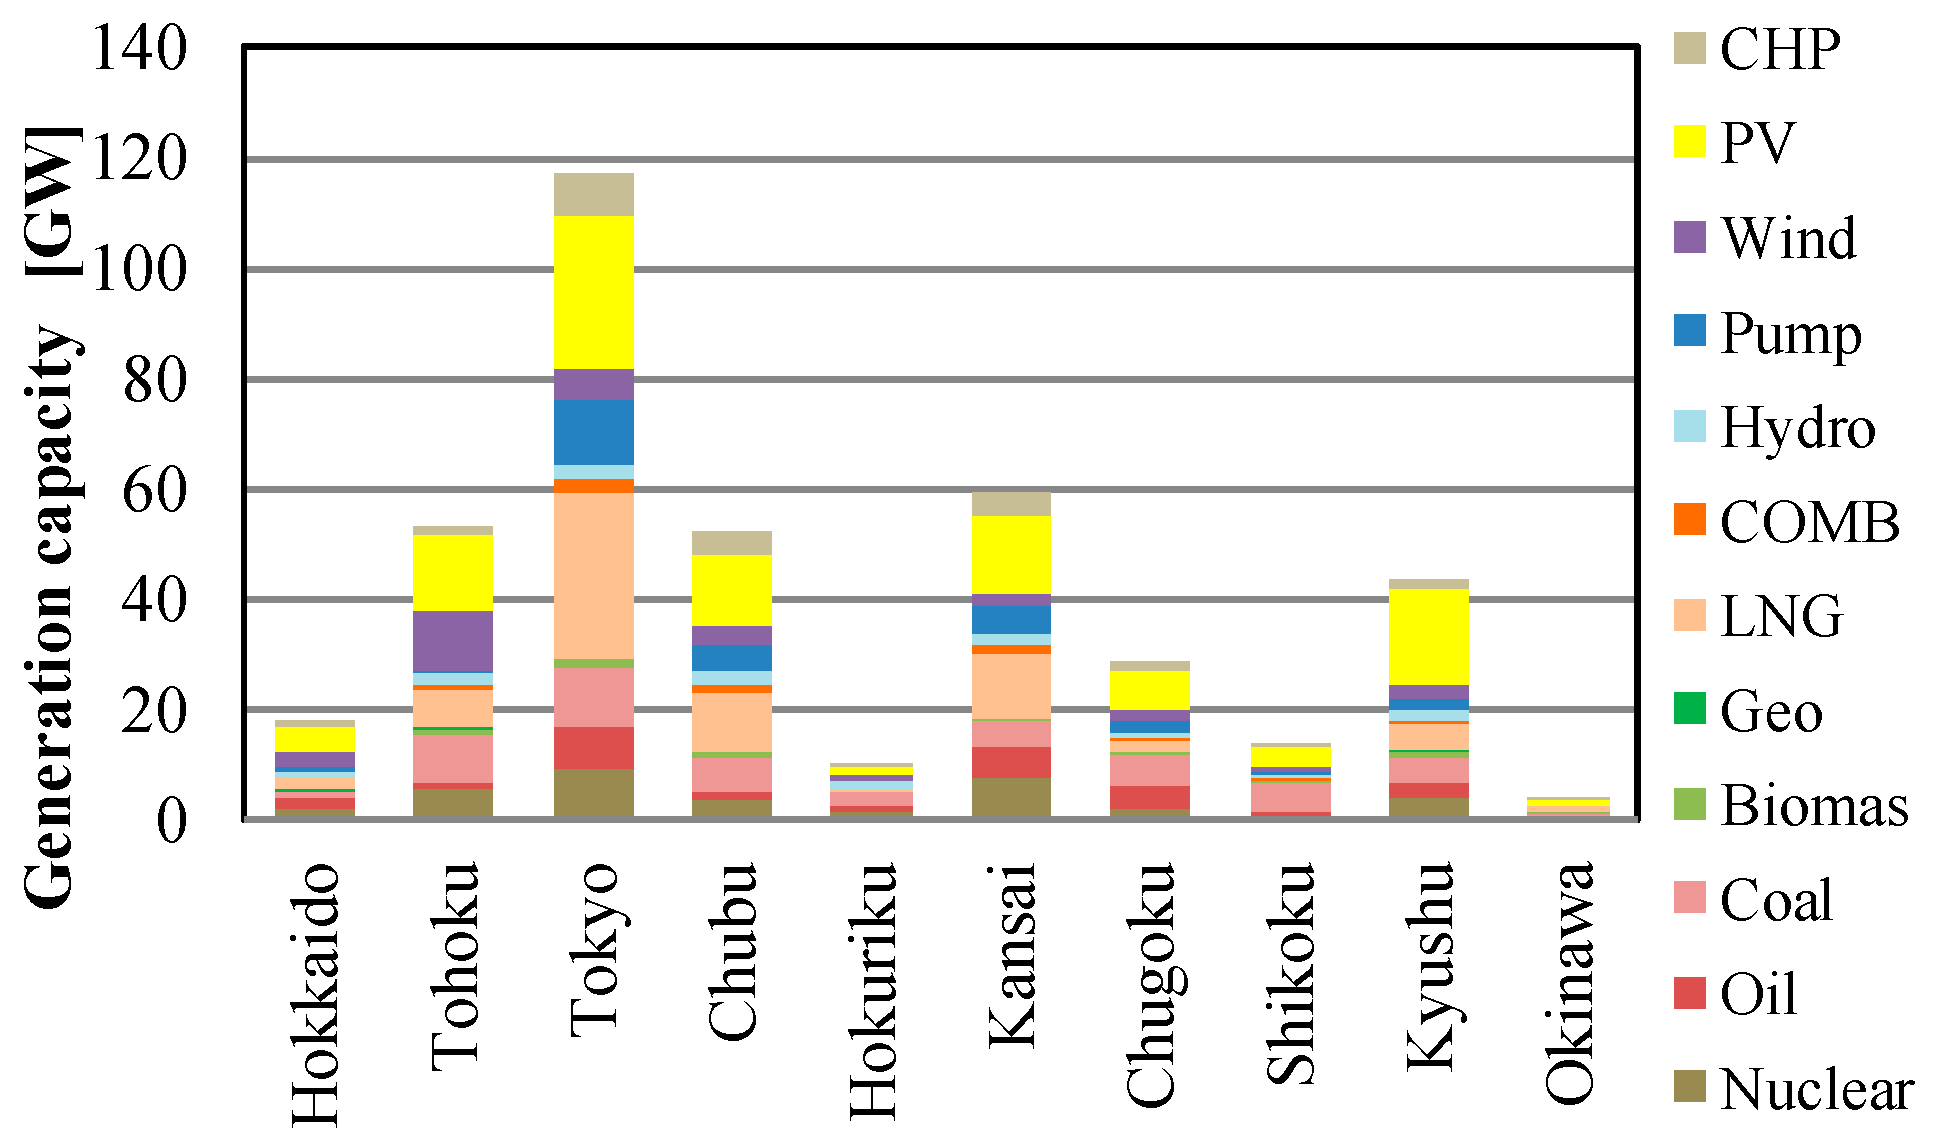
Figure 9.
Share of the generation capacity per given area.

Figure 10.
Hourly profile of electricity demand per given area on 1 April.

Figure 11.
Nationwide annual electricity generation amount (by generation type) for each simulation.
Figure 11.
Nationwide annual electricity generation amount (by generation type) for each simulation.
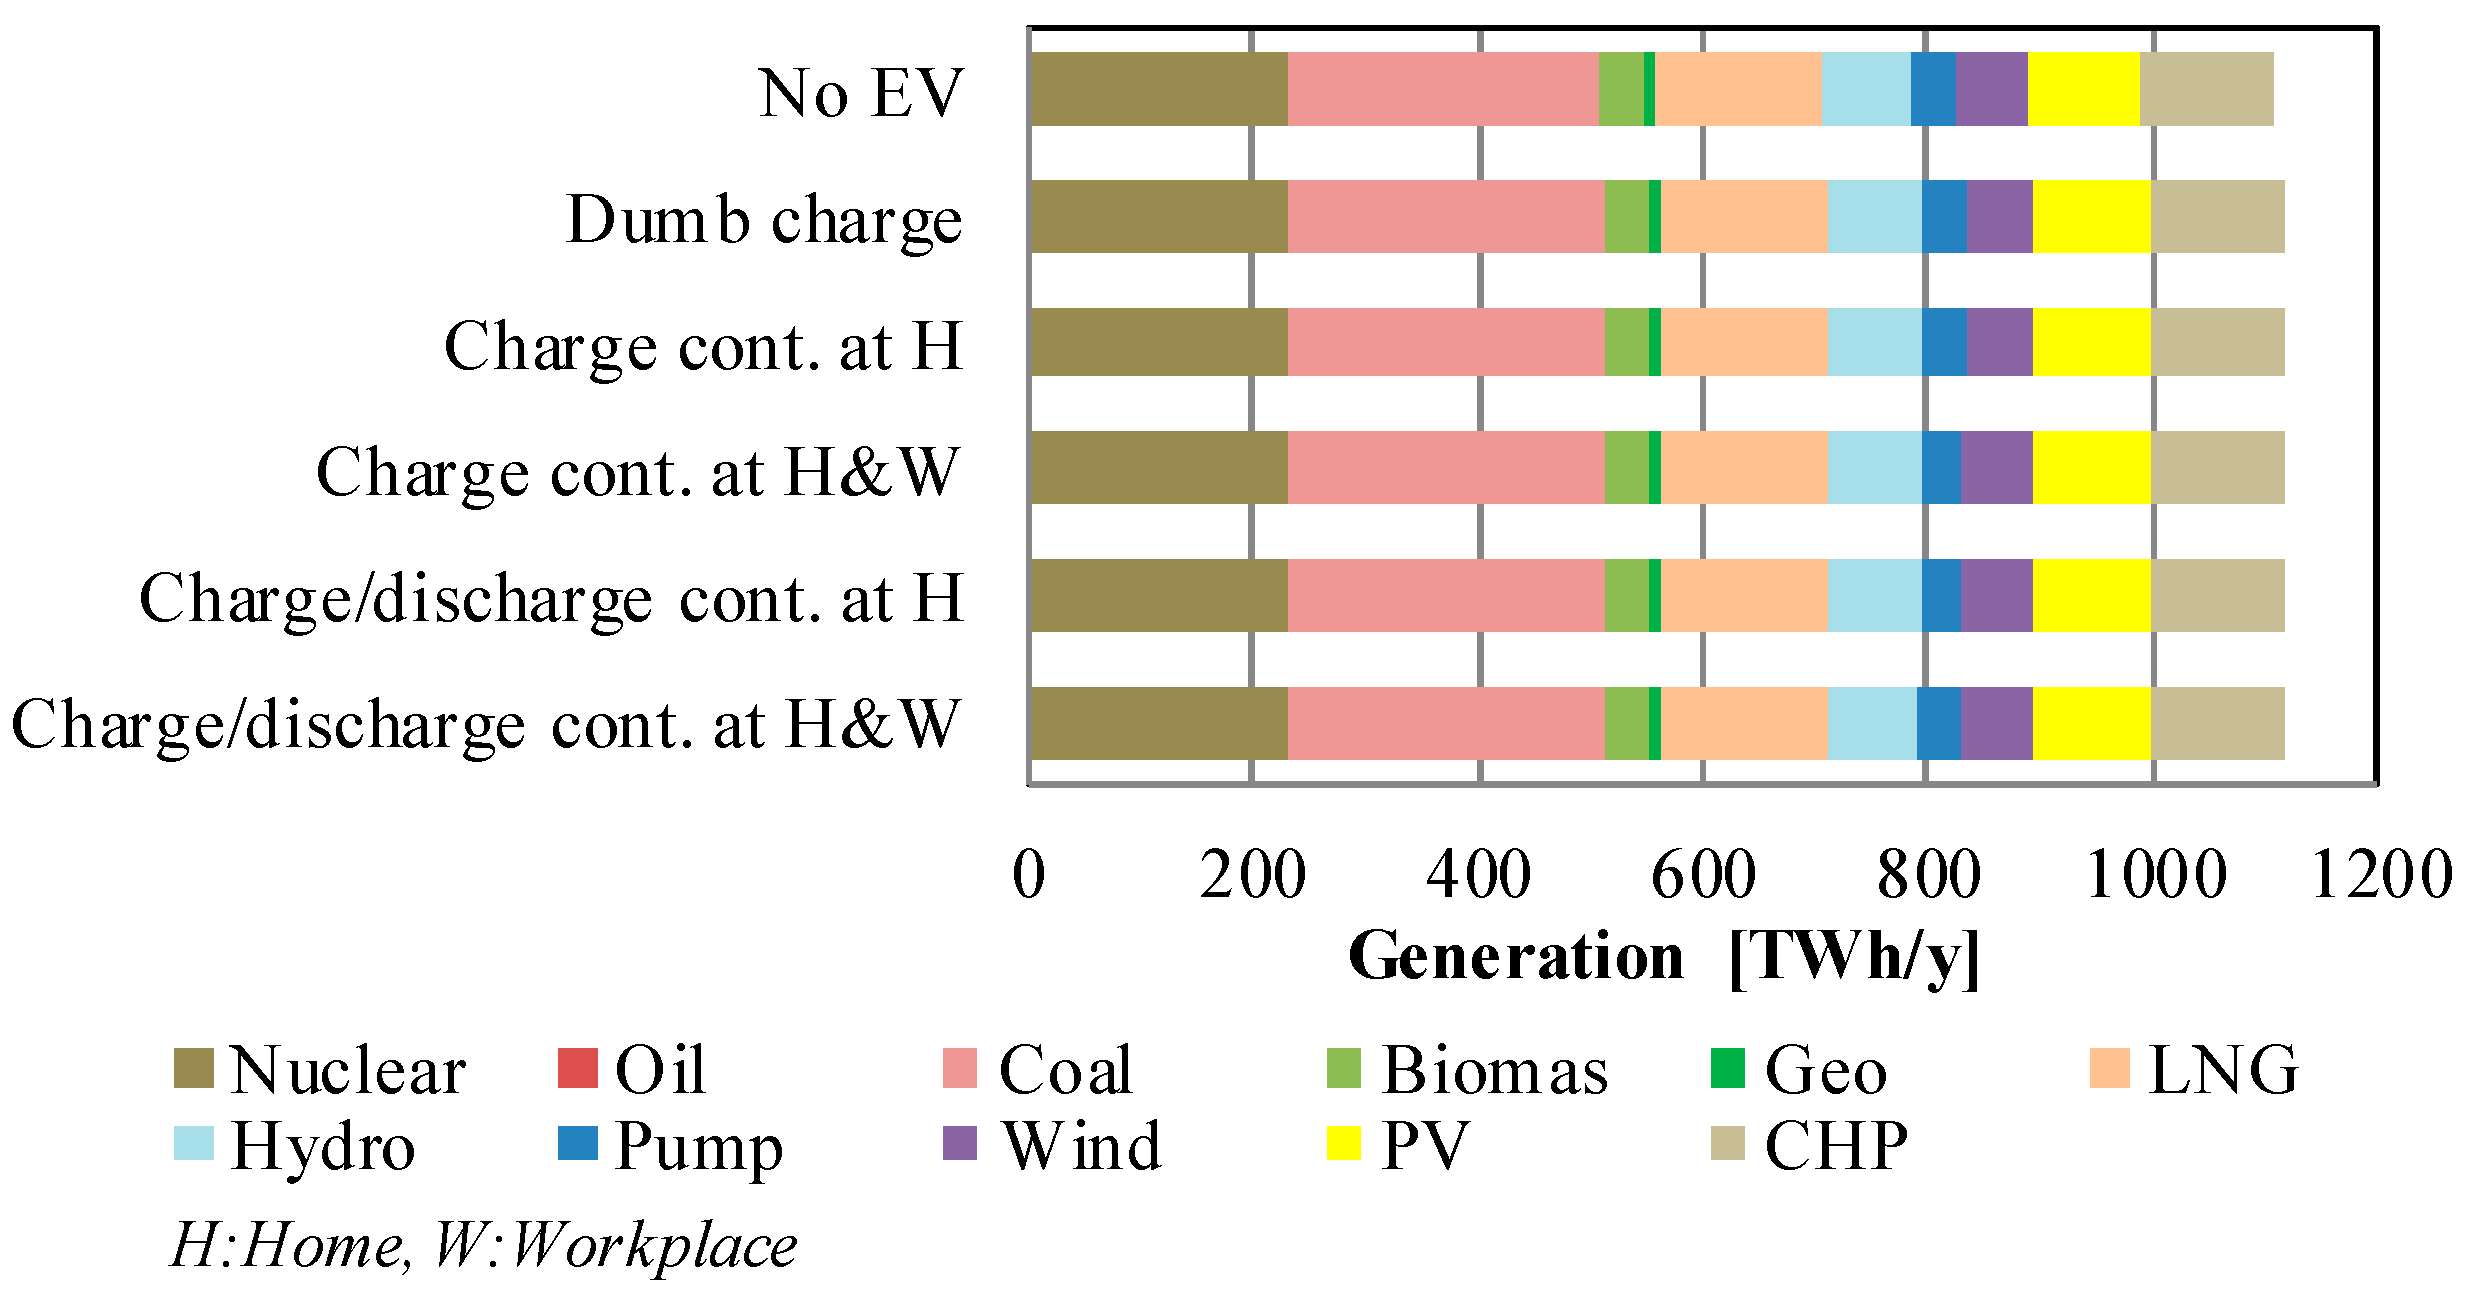
Figure 12.
Change in generated power with reference to Case 0.

Figure 13.
Nationwide operational costs for power generation changes compared to no-EV case.

Figure 14.
Nationwide operational costs for power generation changes per vehicle compared to no-EV case.
Figure 14.
Nationwide operational costs for power generation changes per vehicle compared to no-EV case.

Figure 15.
Nationwide reduction in VRE curtailment.
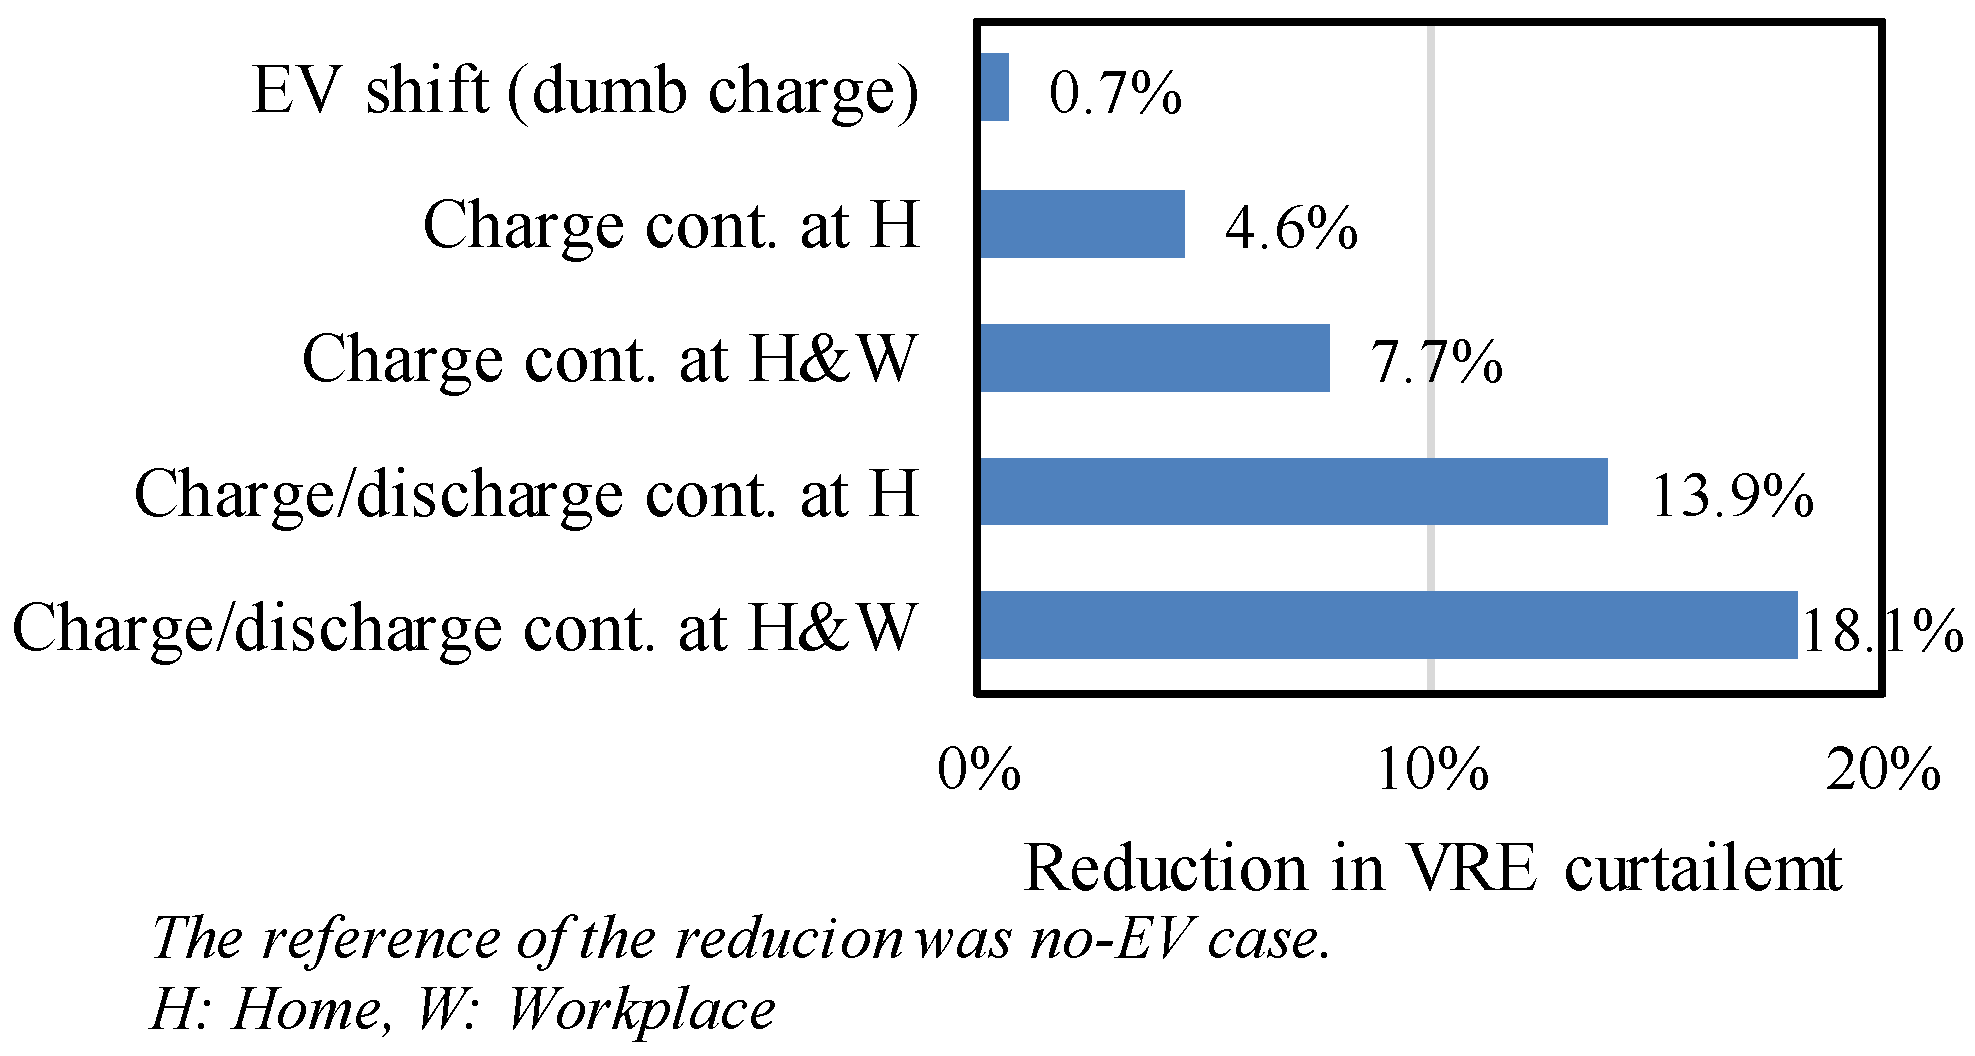
Figure 16.
Nationwide CO2 emission change compared to no-EV case.
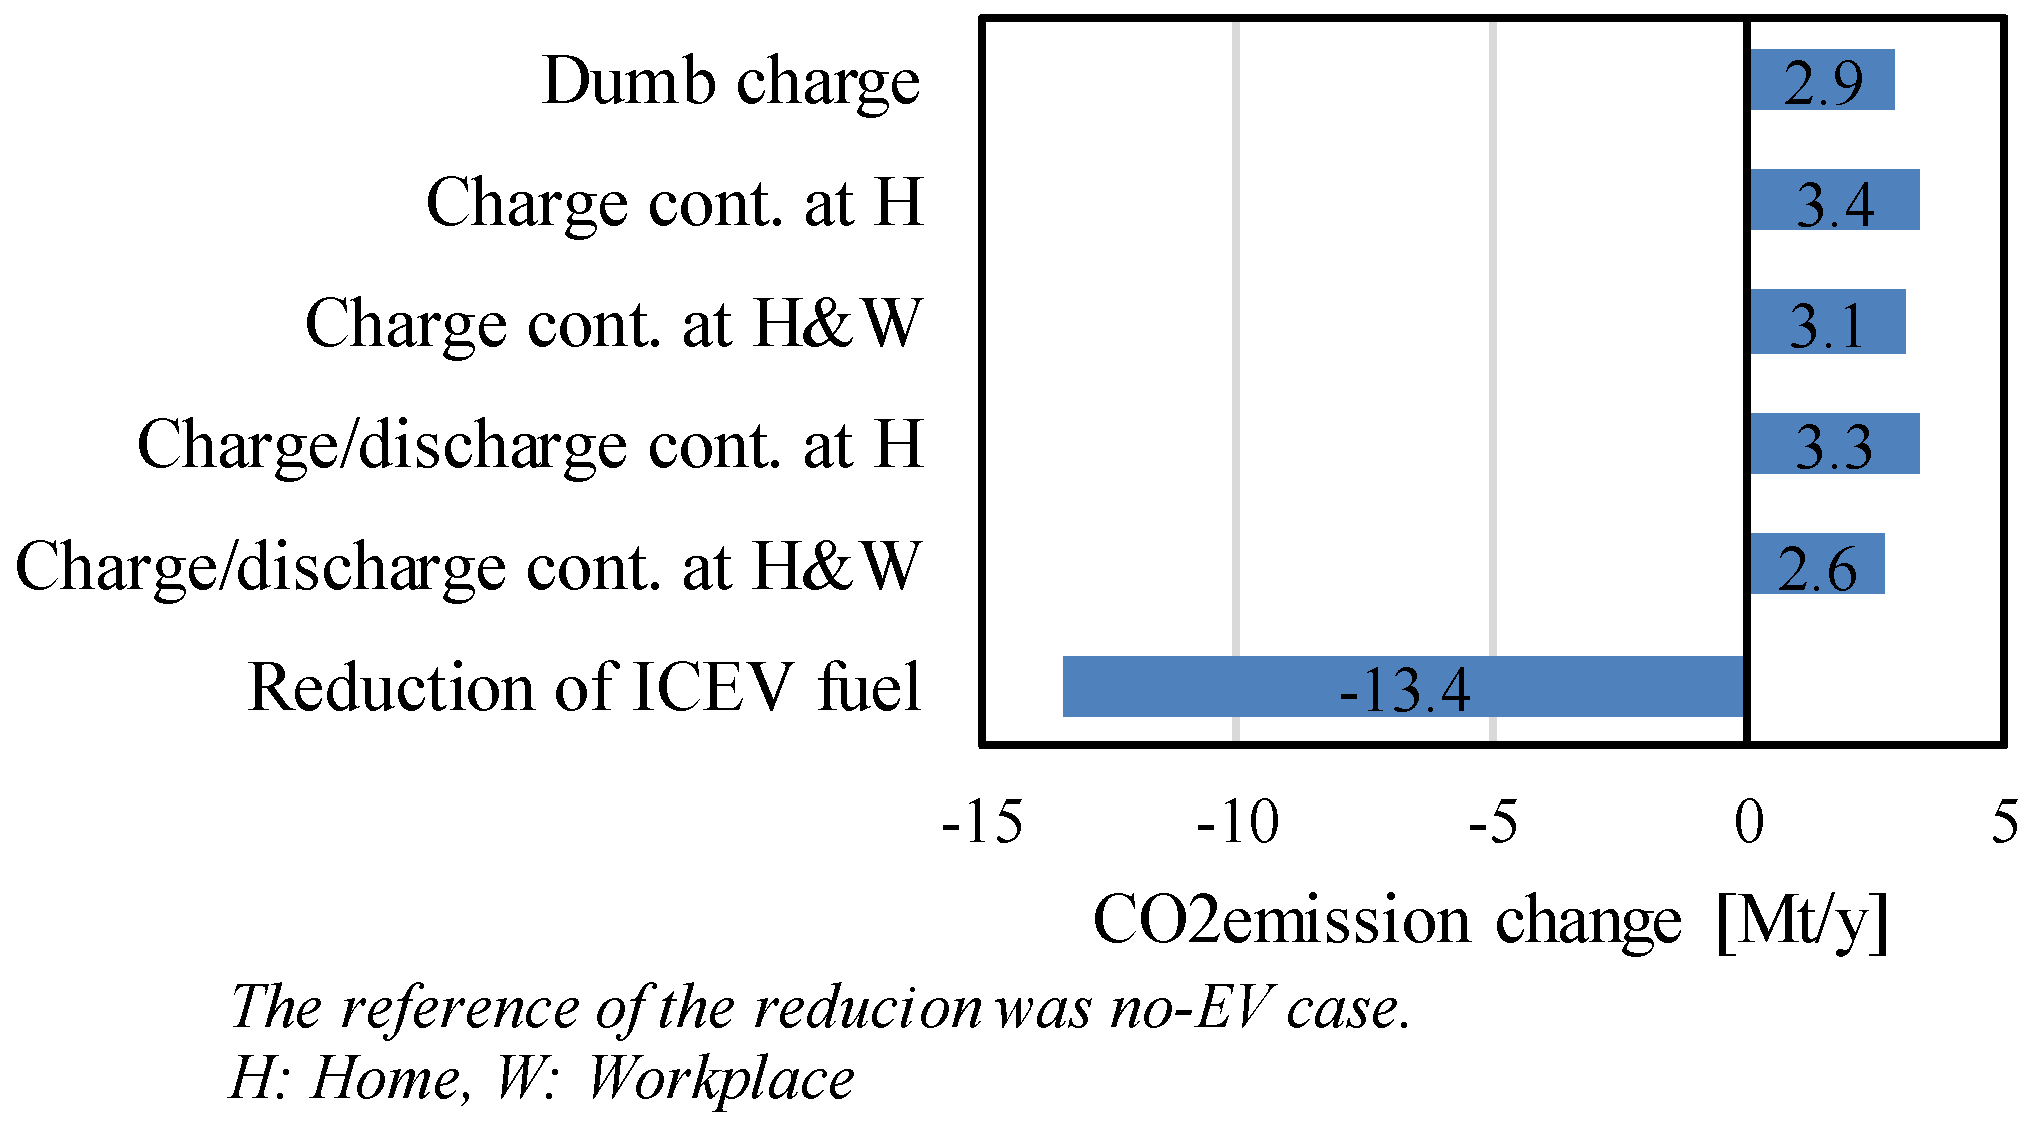
Figure 17.
Daily operational results on a case by case basis (Nationwide, 1 April, 2030).

Table 1.
Definitions of vehicle types.
| Vehicle Types in the OD Survey | Vehicle Types in this Paper |
|---|---|
| Private light passenger vehicle | Private personal use vehicle (commuting, non-commuting) Private and corporate use vehicles |
| Private passenger vehicle | |
| Bus | Bus |
| Light truck | Small freight vehicle |
| Small freight vehicle | |
| Regular freight vehicle | Regular freight vehicle |
| Special purpose vehicle | Special purpose vehicle |
Table 2.
Capacity of interconnected lines (MW).
| From | To | Energy Exchange Capacity | |
|---|---|---|---|
| Send | Receive | ||
| Hokkaido | Tohoku | 810 | 810 |
| Tohoku | Tokyo | 4455 | 585 |
| Tokyo | Chubu | 1890 | 1890 |
| Chubu | Hokuriku | 270 | 270 |
| Chubu | Kansai | 1656 | 2250 |
| Hokuriku | Kansai | 1440 | 1170 |
| Kansai | Chugoku | 2430 | 3600 |
| Kansai | Shikoku | 1260 | 1260 |
| Chugoku | Shikoku | 1080 | 1080 |
| Chugoku | Kyushu | 495 | 2331 |
Table 3.
Nationwide simulation results in each case.
| Item | Case 0 | Case 1 | Case 2 | Case 3 | Case 4 | Case 5 |
|---|---|---|---|---|---|---|
| Operational costs (US$ billion/y) | 46,439 | 47,529 | 47,195 | 47,094 | 46,936 | 46,751 |
| VRE curtailment ratio (%) | 17.2 | 17.1 | 16.4 | 15.8 | 14.8 | 14.1 |
| CO2 emissions (Mt/year) | 309.2 | 312.0 | 312.5 | 312.2 | 312.5 | 311.8 |
© 2019 by the authors. Licensee MDPI, Basel, Switzerland. This article is an open access article distributed under the terms and conditions of the Creative Commons Attribution (CC BY) license (http://creativecommons.org/licenses/by/4.0/).
Share and Cite
MDPI and ACS Style
Iwafune, Y.; Ogimoto, K.; Azuma, H. Integration of Electric Vehicles into the Electric Power System Based on Results of Road Traffic Census. Energies 2019, 12, 1849. https://doi.org/10.3390/en12101849
AMA Style
Iwafune Y, Ogimoto K, Azuma H. Integration of Electric Vehicles into the Electric Power System Based on Results of Road Traffic Census. Energies. 2019; 12(10):1849. https://doi.org/10.3390/en12101849
Chicago/Turabian StyleIwafune, Yumiko, Kazuhiko Ogimoto, and Hitoshi Azuma. 2019. "Integration of Electric Vehicles into the Electric Power System Based on Results of Road Traffic Census" Energies 12, no. 10: 1849. https://doi.org/10.3390/en12101849
Note that from the first issue of 2016, this journal uses article numbers instead of page numbers. See further details here.