Performance Prediction Based on Effects of Wrapping Angle of a Side Channel Pump
by
 , , ,
, , ,
Ji Pei
1 ,
,
Fan Zhang
1,2,*,
Desmond Appiah
1,
Bo Hu
3,*,
Shouqi Yuan
1,
Ke Chen
1 and
Stephen Ntiri Asomani
1 1
National Research Center of Pumps, Jiangsu University, Zhenjiang 212013, China
2
Faculty of Mechanical Engineering and Automation, Zhejiang Sci-Tech University, Hangzhou 310018, China
3
Department of Energy and Power Engineering, Tsinghua University, Beijing 100084, China
*
Authors to whom correspondence should be addressed.
Energies 2019, 12(1), 139; https://doi.org/10.3390/en12010139
Submission received: 5 November 2018
/
Revised: 26 December 2018
/
Accepted: 27 December 2018
/
Published: 1 January 2019
(This article belongs to the Section I: Energy Fundamentals and Conversion)
Abstract
:This paper seeks to predict the performance of the side channel pump by considering the influences of different wrapping angles. Firstly, three pump cases 1, 2 and 3 are modeled with wrapping angles 15°, 30° and 45°, respectively. Secondly, different physical parameters comprising exchanged mass flow, pressure and velocity distributions are plotted at the best efficiency point (QBEP) to analyze the internal flow characteristics. Since the flow exchange times depend on the size of the wrapping angle, the size of the wrapping angle has significant effects on the pump head performance. Case 1 with the smallest wrapping angle recorded the largest head improvement at all operating conditions compared to case 2 and case 3. Case 1 at QBEP attained a head coefficient increase of about 9.8% and 38.6% compared to that of case 2 and case 3, respectively. However, the size of the wrapping angle had a slight effect on the pump efficiency; thus, case 1 still predicted a marginal increase in efficiency compared to case 2 and case 3 at all operating conditions. Lastly, the numerical simulations were validated with experimental data after manufacturing pump case 2.
1. Introduction
The side channel pump is a kind of energy conversion regenerative machine which has the capability to develop high pressure heads at comparatively low specific speeds in industrial processes. The total efficiency of the side channel pump is relatively lower than that of other vaned pumps, and has a very complex flow pattern. The fluid enters at the inner radius of the blade from the side channel in a parallel direction to the shaft axis and gains angular momentum from the moving blades. Finally, the fluid exits through the outer radius in the radial direction into the side channel by the shear force produced by the rotating impeller. This exchange of energy occurs repeatedly from the inflow to outflow regions, leading to the helical flow pattern of the fluid. The high head developed by the fluid results from the exchange of momentum between the impeller and the side channel. [1]. Although a clearer understanding of the underlying theory regarding the operation of this pump has not been fully achieved, it has been employed widely in many fields of pumping fluids over the past century.
Siemen and Hinsch [2] primarily designed the side channel pump to deliver community water in the early years of the 20th century. However, with the modification of the geometrical parameters, the side channel pump can transport both viscous liquids and gases. This pump can handle volatile fluids without being vapor-locked; hence, it records excellent self-priming abilities. The turbulence mixing and circulation momentum exchange are the main theories used to describe the flow mechanism in the side channel pump. The turbulence mixing theoretical model which was considered by Senoo [3] and Iverson [4] takes into account the turbulent shear stress assumed between the impeller, fluid and side channel. Engels [5], Wilson et al. [6] and Grabow [7] used the circulation momentum model, which suggested that the momentum gained by the fluid in the impeller acts on the low-speed fluid in the side channel by circulation. Although this theoretical model does not take into consideration the influences of the shear stress, it has proven to be potent for illustrating the internal flow characteristics of the side channel pump till date. Song et al. [8] presented a modified theory of the work of Wilson et al. [6], which considered the circulatory velocity changes along the side channel. Meanwhile, Quail et al. [9] proposed a one-dimensional numerical model for the momentum exchange in regenerative pumps. Yoo et al. [10] offered mathematical models to estimate the circulatory flow behavior and slip factor of regenerative pumps. Over the years, many researchers have conducted several studies to improve the hydraulic performance by modifying different geometrical parameters of the pump. Shimosaka and Yamazaki [11] conducted experimental research on the influences of the blade number, gaps and the area of the channel. Non-radial blades and different channel areas were used by Yamazaki and Tomita [12] to study the performance of regenerative pumps. The influences of the gaps and blade number of the regenerative pump were carried out by Badami [13]. Surek [14] evaluated the effects of blade geometry on the performance of a side channel pump. Choi et al. [15] performed extensive experimental research mainly focusing on the limitations of Grabow [7], Yoo et al. [10], Shimosaka and Yamazaki [11]. The influences of straight inclined and chevron blades on the hydraulic performance of regenerative pumps were evaluated. Recently, computational fluid dynamics (CFD) tools have been used to study the inner flow behavior of turbomachines. Meakhail et al. [16] used CFX commercial software to study the effects of radial blades on recirculation flows in regenerative machines. Meakhail and Park [17] enhanced the hydraulic performance of a regenerative pump by considering two exit angles for the impeller blades. Shirinov and Oberbeck [18] investigated the influences of different blade profiles on the performance of regenerative pumps. The chevron blades used allowed the best momentum transfer between the impeller and side channel at very high pressures. Bӧhle and Müller [19] used analytical and CFD approaches to study the flow patterns inside a side channel pump. Moreover, Quail et al. [20] used CFD codes to calculate the inner flow characteristics inside the regenerative pump. The numerical solution was verified with experimental test data. Fleder et al. [21,22] developed theoretical models to predict the internal flow and performance characteristics of a side channel pump. Fleder and Bӧhle [23] presented a systematic and detailed examination on the effect of blade and side channel geometries on the hydraulic performance of a side channel pump. Recently, Zhang et al. [24,25] revealed the effects of the blade suction angle on the head performance of the side channel pump. The main principle of operation of a side channel pump has been an intriguing phenomenon for many scholars over the years, with particular attention paid to the impeller. Meanwhile, the structure of the side channel also has significant influences on the hydraulic performance of the pump. In the side channel, the fluid power is used to overcome the friction and unsteady behavior generated as a result of its structure and cross-sectional area. Senoo [26] analyzed the geometric condition of the inlet region of the side channel. Sixsmith and Altmann [27] and Sixsmith [28] showed that circular structure of the side channel reduces the turbulence in the circulatory flow, and the velocity of the circulatory flow reduces with a wider flow passage area of the side channel. This in turn lowers the kinetic energy of the flow. For some other types of low-specific-speed radial impeller pumps, Gao [29,30] investigated the effect of volute cross-section area profile, outlet blade angle and blade loading on the hydraulic performance.
In between the inflow and outflow of the side channel is the interrupter, and the angle between them is referred to as the wrapping angle. The interrupter separates the high pressurized flow at the outflow from the low pressurized flow at the inflow and also causes the fluid to leave through the outlet. Apparently, some portions of the flow do not exit through the outlet but instead move into the interrupter region which is transported from the pressure side of the blade to the suction side [25]. It is worth noting that the length of the side channel mainly aids in the number of times the flow is exchanged. Since the total performance of the pump can be affected by the size of the wrapping angle, it is of interest to investigate the influences of wrapping angle on the side channel pump performance. This paper seeks to predict the performance and internal flow characteristics of a side channel pump by varying different wrapping angle from φ = 15° to 45°. Thereafter, the static pressure, velocity and exchanged mass flow components are analyzed in all three pump cases. Overall, an experimental test was conducted to validate the solution from the numerical calculations.
2. Pump Model
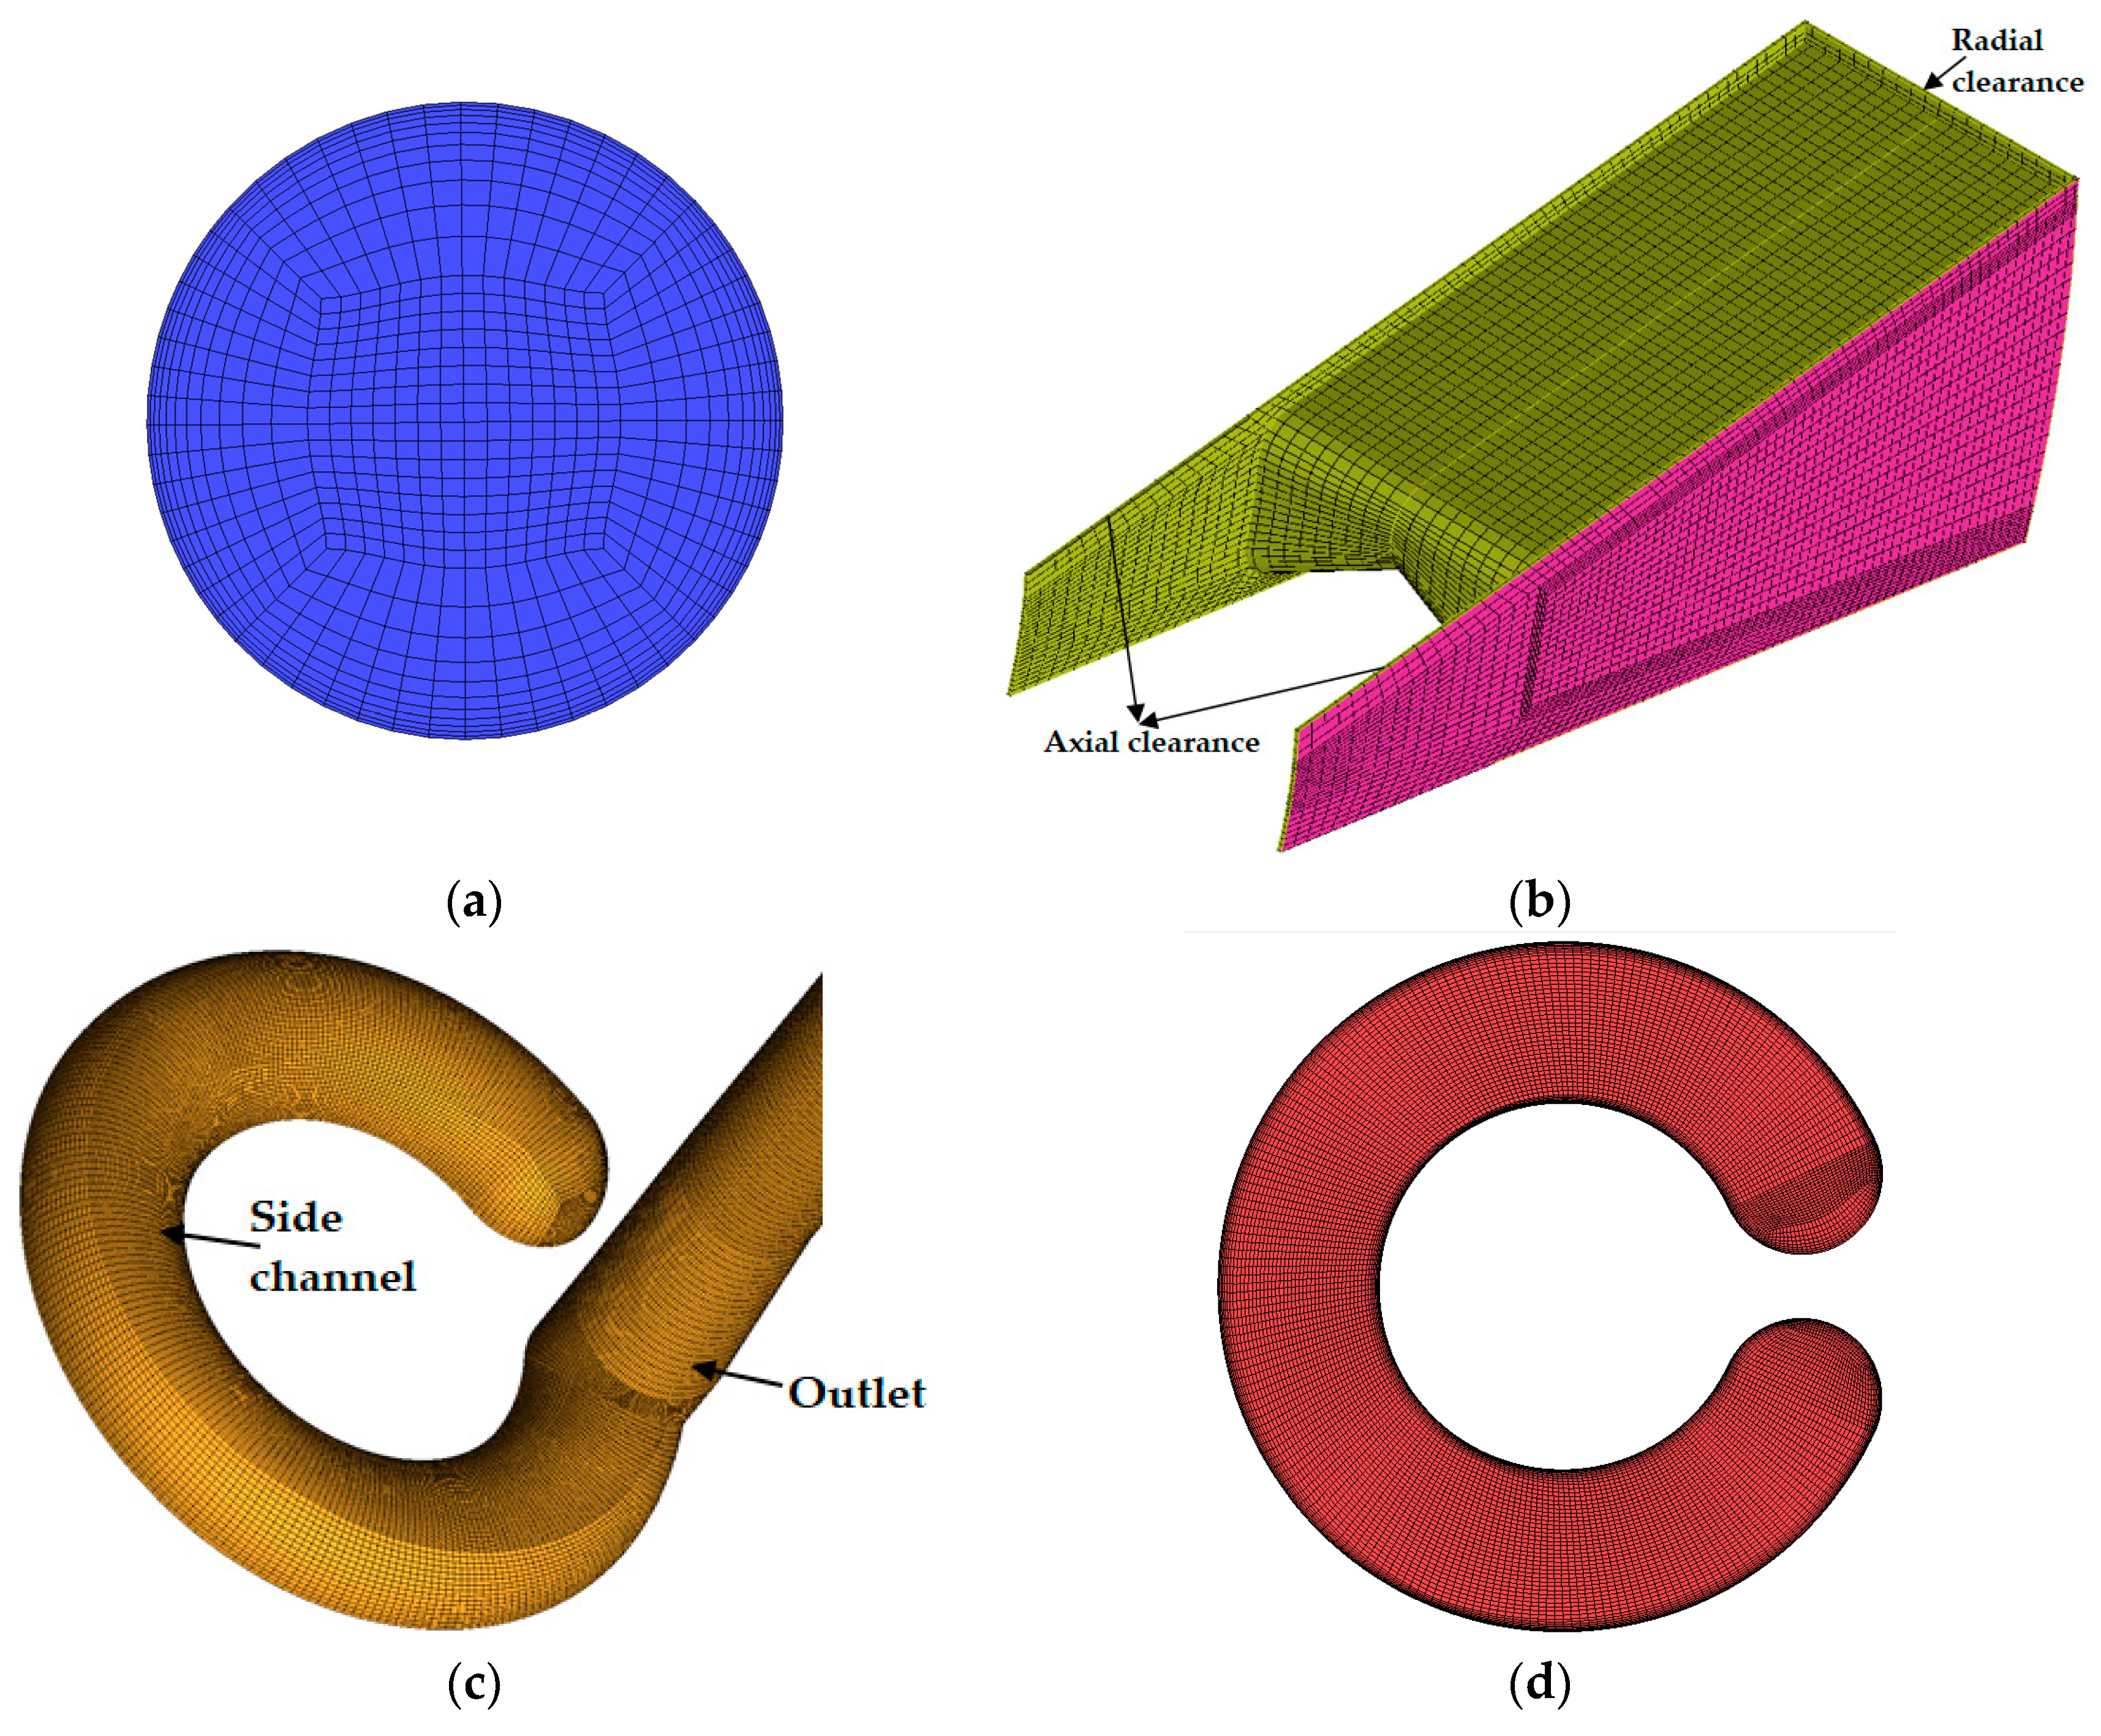
Figure 1 shows the structure of a single stage side channel pump model. The three-dimensional (3D) models of the pump are created using NX 11. The pump is mainly made up of the inlet pipe, radial impeller blades, circular side channel and outlet pipe. The suction side of the impeller is profiled in an isosceles-triangular form with the suction angle of 30° [24,25]. The inlet pipe is separated by the interrupter from outlet pipe to prevent reverse flow. Three different wrapping angles with φ = 15°, 30° and 45° used for this investigations are referred to as case 1, case 2 and case 3 respectively as indicated in Figure 1c. The specific speed of the pump model studied is very low with a magnitude of 8.6 (). Integers of 15° are selected for the wrapping angle because it corresponds to the blade pitch angle. The axial and radial clearances are set to 0.2 mm to minimize the flow leakage. The pump model is made to operate at a rotational speed of 1500 rpm at all operating conditions for all three cases. The main geometrical parameters of the pump model are illustrated in Table 1.
3. Numerical Simulations
3.1. Governing Equations
The fluid moving through the pump is assumed to be incompressible, unsteady and exhibits 3D turbulent flows. To predict the side channel pump performance based on different wrapping angles, the unsteady Reynolds-averaged Navier-Stokes (URANS) equations for the conservation of mass and momentum are given as:
Here, is the Reynolds stress tensor which is given as:
is the Kronecker delta, i, j = 1, 2, 3.
3.2. Turbulence Model
The shear stress transport (SST) turbulence model was applied to solve the flow equations in this study. Fleder [23] concluded that SST k-ω has the capability to predict the flow within a side channel pump after evaluating the effects of different turbulence models. In detail, Menter [31,32] and Wilcox [33,34] demonstrated that the SST model is an improved k-ω turbulence model. Menter [31,32] developed a blending function for the Wilcox model [33,34] because of its high sensitivity to free-stream flows. It is a combination of the transformed k-ω and k-ε equations which switches automatically between inner wall layers and free-stream flows. Menter [31,32] multiplied k-ω equation by a blending function F1 and the transformed k-ε equation by a (1 − F1).
k-ω equations:
Modified k-ε model
The blending functions F1 and F2 are:
The turbulent viscosity, is calculated using:
The k-ω equation for the inner boundary layer prediction is applied using the following coefficients: , , , , .
Meanwhile, the k-ε equation for the free-stream flows is solved using the following coefficients: , , , .
3.3. Grid Generation
The ICEM CFD 14.5 is used to generate hexahedral structured grids for all pump cases. A single blade channel of the impeller is meshed and periodically arrayed in 24-blades as the rotating domain. The radial and axial clearances are meshed together with the impeller as one domain. The side channel and outlet are also meshed together as a single domain. Figure 2 shows the computational flow grids generated. The inlet and outlet pipes were extended to satisfactory lengths in order to acquire a fairly stable flow. The boundary layer between the impeller and the side channel are refined with high grid numbers because that is the main location for the flow exchange. Table 2 shows three different grid numbers used to conduct the grid independence and convergence index analyses for pump case 2 at flow rate, Q = 10 m3·h−1. Establishing grid convergence is a necessity in any numerical study, thus following the works of Fleder et al. [21], Fleder and Bӧhle [22,23] and Zhang et al. [24,25] on a similar side channel pump model, three grids (coarse, medium, fine) are created. Based on Celik et al. [35] procedures for estimating and reporting of discretization error in CFD applications, Grid C (fine grid) is selected for the entire numerical study. The grid number, quality criterion and average y+ of each domain of Grid C is presented in Table 3. Pump cases 1 and 3 are meshed using the same blocking method with approximated grid sizes. The pump head is defined as the pressure difference between the outlet and inlet. The pump head at each operating condition is calculated by averaging all the head values at each time step for the last two impeller revolutions of the unsteady numerical simulations.
3.4. Steady and Unsteady Simulations Step-Up
The 3D (URANS) governing equations within the side channel pump are solved using the CFX commercial software. With the steady simulation, water at room temperature is selected as the fluid material. The interface between the impeller and the side channel is set to frozen-rotor. The boundary condition at the inlet is set to a constant total pressure of 1000 Pa. The flow is normally directed to the boundary condition with a medium turbulence intensity of 5%. The outlet boundary condition is set to opening with cylindrical velocity components at different flows to achieve consistent results with the experimental test data. The SST k-ω turbulence model is selected. The steady simulation was calculated for 1000 iterations with convergence criteria of 1.0 × 10⁻⁵. The results from the steady calculations could not predict the flow within the pump, and were thus used to initiate the unsteady simulations to achieve a fairly periodic numerical calculations. In the case of the unsteady simulations, the interface between the impeller and side channel is set to transient rotor-stator. This is done because at each time step the relative position between the impeller and the side channel changes with this kind of interface. The second-order backward Euler transient scheme is selected for the time discretization. The impeller is set for six complete revolutions with a total time of 0.24 s. The time step is defined as 1.111 × 10⁻⁴ s representing 1° of impeller rotation. Within every time step, ten maximum coefficient loops of convergence control are chosen. A standard no-slip wall condition is employed for the near wall function because the Reynolds number, () of the flow is about 1.13 × 10⁵ [36].
4. Numerical Results
4.1. Head Fluctuation Curves
Figure 3 shows the head fluctuation curves at the QBEP of all three cases for the last 45 time steps of the last impeller revolution. This is plotted at an angular position, ϕ1 (285° to 330°) close to the outflow region as indicated in Figure 4. From the curves, it was observed that the static pressure head fluctuates after every 15° which corresponds to the blade pitch angle. The minimum and maximum values are highlighted in all cases for the head curves. Case 1 marked the highest fluctuating values amongst the three while case 3 marked the lowest fluctuating values. Case 2 recorded moderate head value at the maximum points. Furthermore, case 1 exhibited two major peaks compared with case 2 and case 3. This is likely to be attributed to the size of the wrapping angle since case 1 exchanged flow many times closer to the outlet section.
Figure 4 shows the pressure distribution in the impeller under the maximum and minimum values for case 2 at the QBEP value. The pressure distribution is generated using dataset recorded at the maximum and minimum head. It was observed that the pressure values at the maximum point was higher compared to the minimum. Hence, the internal flow analyses are carried out at the maximum point for all three cases at their respective QBEP values.
4.2. Exchanged Mass Flow
Figure 5 shows an overview of the mass flow exchanged between the impeller and the side channel. The red color is used to represent the mass flow out into the side channel while the green color represents the mass flow into the impeller blades. The exchanged mass flow plot revealed the energy conversion inside the side channel pump, confirming that the fluid enters the impeller at the inner radius and after accelerating it leaves the impeller to the side channel at the outer radius of the impeller. It is observable for all three cases that the inflow and outflow regions are characterized with an irregular exchange of mass flow. The irregular flow patterns around the inflow regions is highlighted in blue for all three cases. At an angular position, (150° to 240°), the flow is assumed to develop its full flow characteristics after travelling through about 8 to 10 blades. At this angular position, the flow begins to turn in the circular channel. Fleder et al. [23] showed that the turning effect of the flow caused by the geometry shape reveals irregular flow characteristics, creating vortices at the inner radius of the blade of all three cases. This is highlighted in black for all cases. Case 2 demonstrated a better mass flow exchange at this angular position, compared with cases 1 and 3.
From Table 4, case 1 performed best flow exchange within the whole flow passage among the three cases while case 3 recorded the worst. This suggests that increasing the wrapping angle lowers the flow exchange between the impeller and side channel.
4.3. Pressure Distribution Analysis
To analyze the pressure distribution in the impeller clearly, three planes in the XY direction were created and set to different positions in the z direction. Plane 1, 2 and 3 corresponds to z1 = 0, z2 = 0.0075 m and z3 = 0.015 m, respectively. Figure 6 shows the axial planes indicated at the different positions.
Figure 7 shows the static pressure distribution contour in the impeller at plane 1, 2 and 3 for all cases. The static pressure gradually increased in magnitude from the inflow region to the outflow region for all three cases on all the planes. The impeller blades impart centrifugal effect on the flow in the radial direction from the inflow to the outflow. This action produces circulation between the impeller and side channel. However, it is observed that the pressure magnitudes increases marginally from plane 3 to 1. The inflow regions show a reasonably uniform pressure distribution in plane 3 compared to that on plane 1 and 2. This can be attributed to the pressure growth in the tangential direction. Plane 1 is set close to the impeller side channel interface where the flow is about exiting into the side channel. It can be observed that the outflow regions for cases 1 and 2 registered similar patterns and higher values of pressure compared to that of case 3. This is because case 3 has the shortest length of the side channel and the pressure magnitude is dependent on the exchanged flow times between the impeller and side channel. The inflow region of cases 1 and 3, shows irregular pressure distributions on plane 1 between angular position of 45°–60°. On all the planes, it is realized that the interrupter region recorded minimal pressure magnitudes just after the outflow region. This shows that the pressure that was lost in the interrupter was not converted into head because there is no side channel for energy exchange [22]. Hence, the size of the wrapping angle significantly affects the total hydraulic performance of the side channel pump.
Figure 8 shows the pressure distribution in the side channel and the side channel wall. Generally, similar pressure patterns are exhibited within and around the walls of the side channel. Moreover, the pressure increased steadily in the tangential direction from inflow to the outflow. In comparison, the pressure tends to become stronger in a tangential direction in cases 1 and 2 than in case 3. This can also be attributed to the exchange flow between the impeller and the side channel. The inflow regions in cases 1 and 3 also experienced irregular pressure distribution compared to case 2. It can be seen that the pressure attained by the flow exiting the impeller was almost the same as the pressure which entered the impeller. This indicates that the side channel hardly adds pressure energy but is responsible for the transportation of the fluid. Generally speaking, with a decrease in the size of the wrapping angle, the static pressure becomes much stronger inside and around the walls of the side channel, and the similar pressure characteristic occurred on all the impeller planes. Thus, the decrease of the wrapping angle improves the head performance and likewise the total hydraulic performance of the side channel pump.
In order to quantify the pressure distribution in the pump cases, the static pressure is plotted against the impeller rotation which corresponds to 1°. Two monitoring points are set in both the impeller and side channel flow passages respectively to measure the pressure data for all pump cases. Both monitoring points are set at the same angular position, 180° but different heights, z = 0.0015 m and −0.007 m for the impeller and side channel flow passages respectively. Figure 9 shows the pressure distribution in the impeller flow passage. All pump cases exhibited 24 peaks and valleys in both impeller and side channel flow passages. As discussed earlier, the pressure increases gradually from inflow (peak 1) to outflow (peak 21 for case 1) but decreases abruptly at the interrupter. Pump case 1 recorded the highest number of flow exchange times of 21. For example, in between peaks 21 and 1 is the interrupter region which shows irregular pressure distributions. At this point, two blades are located each at the inlet and outlet pipes respectively in addition to the blade(s) in the interrupter. Thus, the size of the wrapping angle affects the irregularities of the pressure distributions which subsequently affects the performance of the pump. The pressure distribution in the side channel flow passage for all cases is lower compared to the impeller passage as indicated in Figure 10.
4.4. Velocity Distribution Analysis
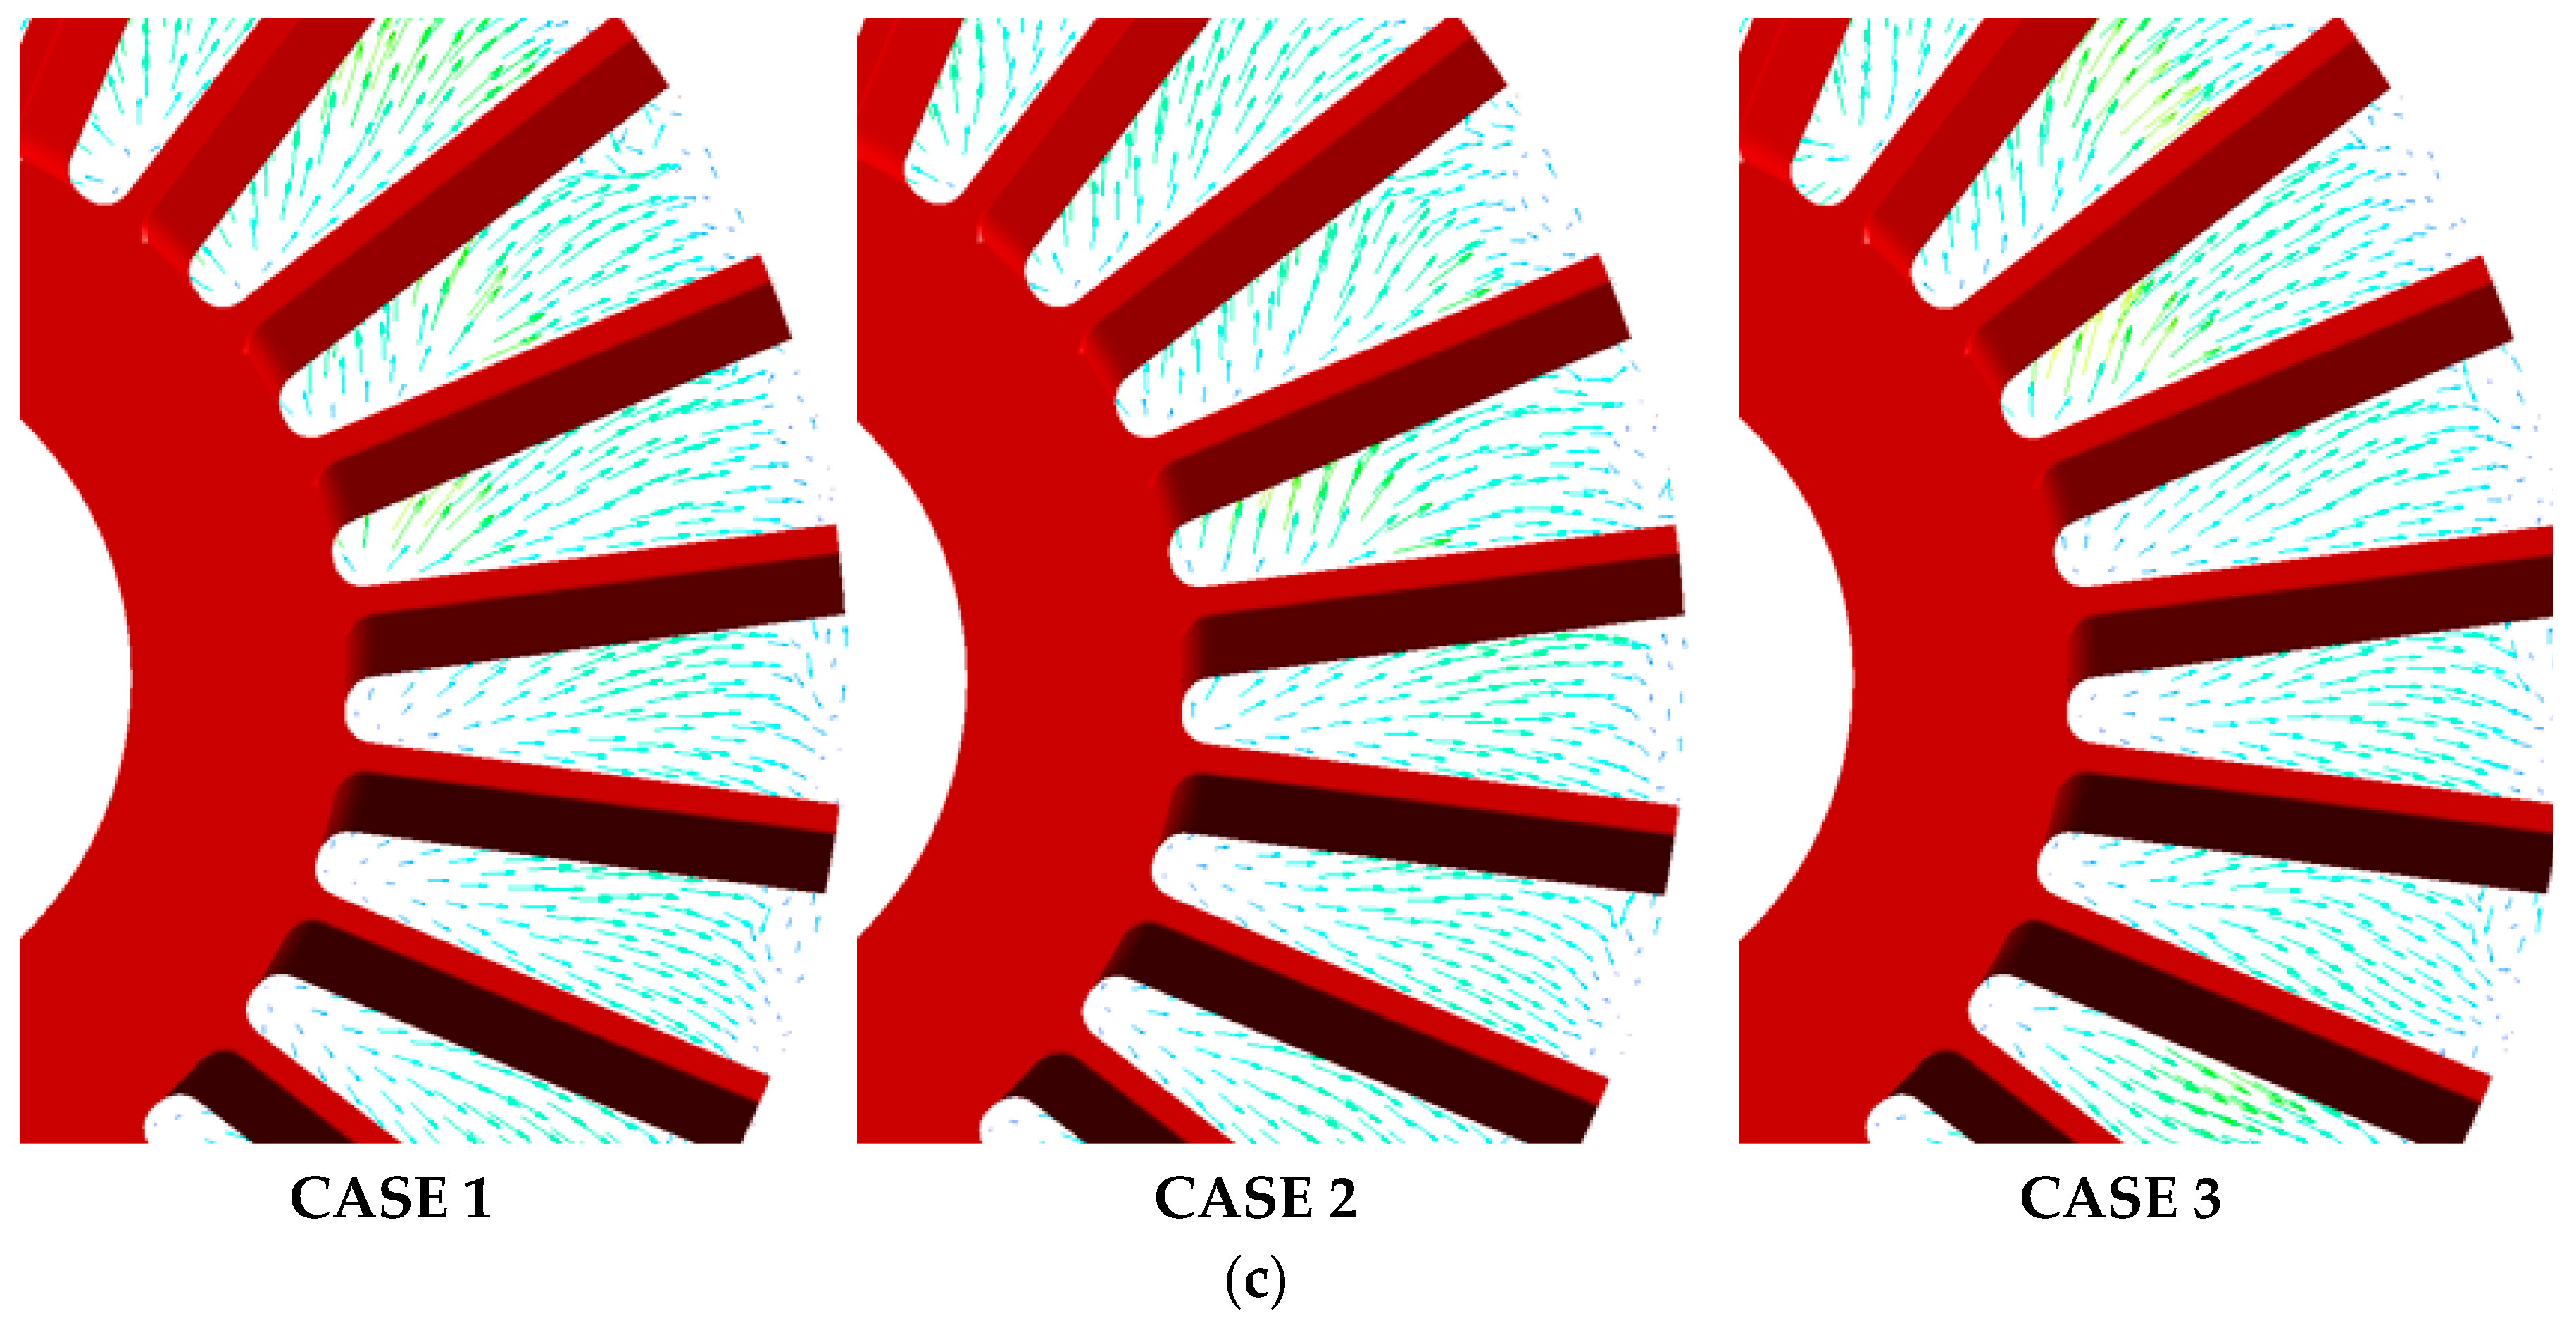
Figure 11c shows the velocity vector on plane 3. On this plane, the flow in the blades starts to accelerate towards the impeller and side channel interface. The velocity gradient was comparatively higher at the inner radius than outer radius. Moreover, similar radial vortex flows are experienced at the outer radius for all three cases. As the flow moves towards plane 2 in Figure 11b, the radial vortices at the outer radius of the impeller are still observable for all three cases. The central radius of the impeller experiences small magnitude of vortex flow on this plane. Figure 11a shows the velocity vector on plane 1 which is close to the side channel interface. The flow entry at the inner radius of the blade registered a high tangential velocity magnitude due to the centrifugal effect on the flow in the axial clearance. The radial vortex flow highlighted in black, red, purple and green colors at the outer radius increases in magnitude in all cases. Partly, this can be attributed to the collision of the flow between the flow exiting and the flow already moving in the side channel. This collision tends to reduce the tangential velocity. This subsequently results in unwanted fluid power loss to overcome the resistance caused by fluid friction and turbulence. Furthermore, the vortex at the outer radius of the blade can partly be associated to the circulation loss experienced by the fluid moving from the impeller passage to the side channel due to the sudden differences in flow passage fields. All three pump cases show similar radial vortex patterns, making it an interesting field for future research.
Figure 12 shows the velocity vector distribution in the ZX plane at z = 0. On this plane, the velocity gradient in both impeller and side channel are revealed. Moreover, a complete flow pattern is also shown, whereby the flow enters at the inner radius and leaves at the outer radius of the blade. This accounts for the axial vortex which allows the energy conversion process between the impeller and side channel. All three pump cases revealed the flow exits into the side channel at higher velocity and decreases gradually before it re-enters at a lower velocity. It is quite obvious that some reverse flows are present at the blade inner radius for all three cases. Generally the impeller passage exhibits low velocity components compared to the side channel. However, cases 2 and 3 show higher velocities at the inner radius than case 1. Furthermore, very low velocity magnitudes are observed at the center of the impeller.
5. Experimental Apparatus and Validation
5.1. Experimental Apparatus
Pump case 2 is selected for experimental validation of the numerical results. Experimental measurements are carried out using a closed loop water circuit configuration built for the side channel pump model as indicated in Figure 13. Its components includes a water supply unit, a pump unit, and a delivery unit. The impeller used is made of aluminum, while the side channel and the pump casing used in the process are made of plexiglass in other to provide a clear visualization of the inner flow pattern. The shaft of the pump model is operated by a variable speed electric AC motor (7AA112M04) manufactured by ELEKTRA company and regulated by a frequency converter of range 0 Hz to 50 Hz. Pressure sensors with uncertainty of 0.15% and a range of 0 to 10 bar are installed at the inlet and outlet pipes to record the pressure data. An electromagnetic flow meter from Endress+Hauser company measuring in the range of 0.9–30 m3·h−1 and maximum measuring error of ±0.5% is also installed to measure the volumetric flow. A pneumatic valve from Samson company is used to control the flow. The software LabVIEW 8.5 is used to record 20 sample data for each opening of the valve for further data processing. The data is collected twice at each operating condition for reliability. Moreover, random uncertainty of the experimental measurements is carried out with a confidence probability level of 95%. A part-load flow condition (4 m3 h−1) is selected for the error analysis. The random uncertainty of flow rate, head, rotation speed and torque is ±0.08%, ±0.24%, ±0.01%, ±0.17% respectively. The random uncertainty of the pump efficiency is ±0.31%.
5.2. Comparison of CFD and Experimental Performances
As discussed earlier in Section 3.3, in order to predict the head and efficiency at each operating condition, these variables are evaluated by averaging all values at each time step for the last two impeller revolutions of the unsteady numerical simulations. The efficiency at each time step is evaluated using:
The head coefficient is subsequently evaluated using:
Figure 14 shows CFD and experimental measurements as a function of flow rate ratio of pump case 2. The efficiency curves of both CFD and experiments increased gradually until the maximum peak, QBEP value and thereafter decreased sharply. The best efficiency point, QBEP value occurred at Q/QBEP = 1.0 for both CFD and experimental test results. The CFD data registered a 5.99% and 5.06% efficiency increase relative to the experimental data at 0.8 Q/QBEP and Q, respectively. The CFD results recorded higher efficiencies at all operating conditions compared to the experimental data. This is as a result of the mechanical losses ignored during the numerical calculations. Moreover, the flow within the pump was very turbulent. With increasing volumetric flow, the head coefficients for both CFD and experimental test decrease. This effect can be attributed to the rotational losses incurred by the fluid moving through the pump [25]. Eventually, the head coefficients decrease gradually to zero at the maximum flow rate ratio because at this rotational speed, the pump cannot discharge flow beyond the maximum point. Meanwhile, at lower volumetric flows, the average circulatory velocity increases because the circulations through the blade increase; thus, producing high heads. It is observed that the experimental results revealed higher head coefficients compared to the CFD results at all operating conditions. The head deviation at QBEP is 5.27%. The numerical results illustrated slight deviations between the experimental results, thus a good agreement exists between the numerical and experimental results.
5.3. Hydraulic Performance under CFD Data
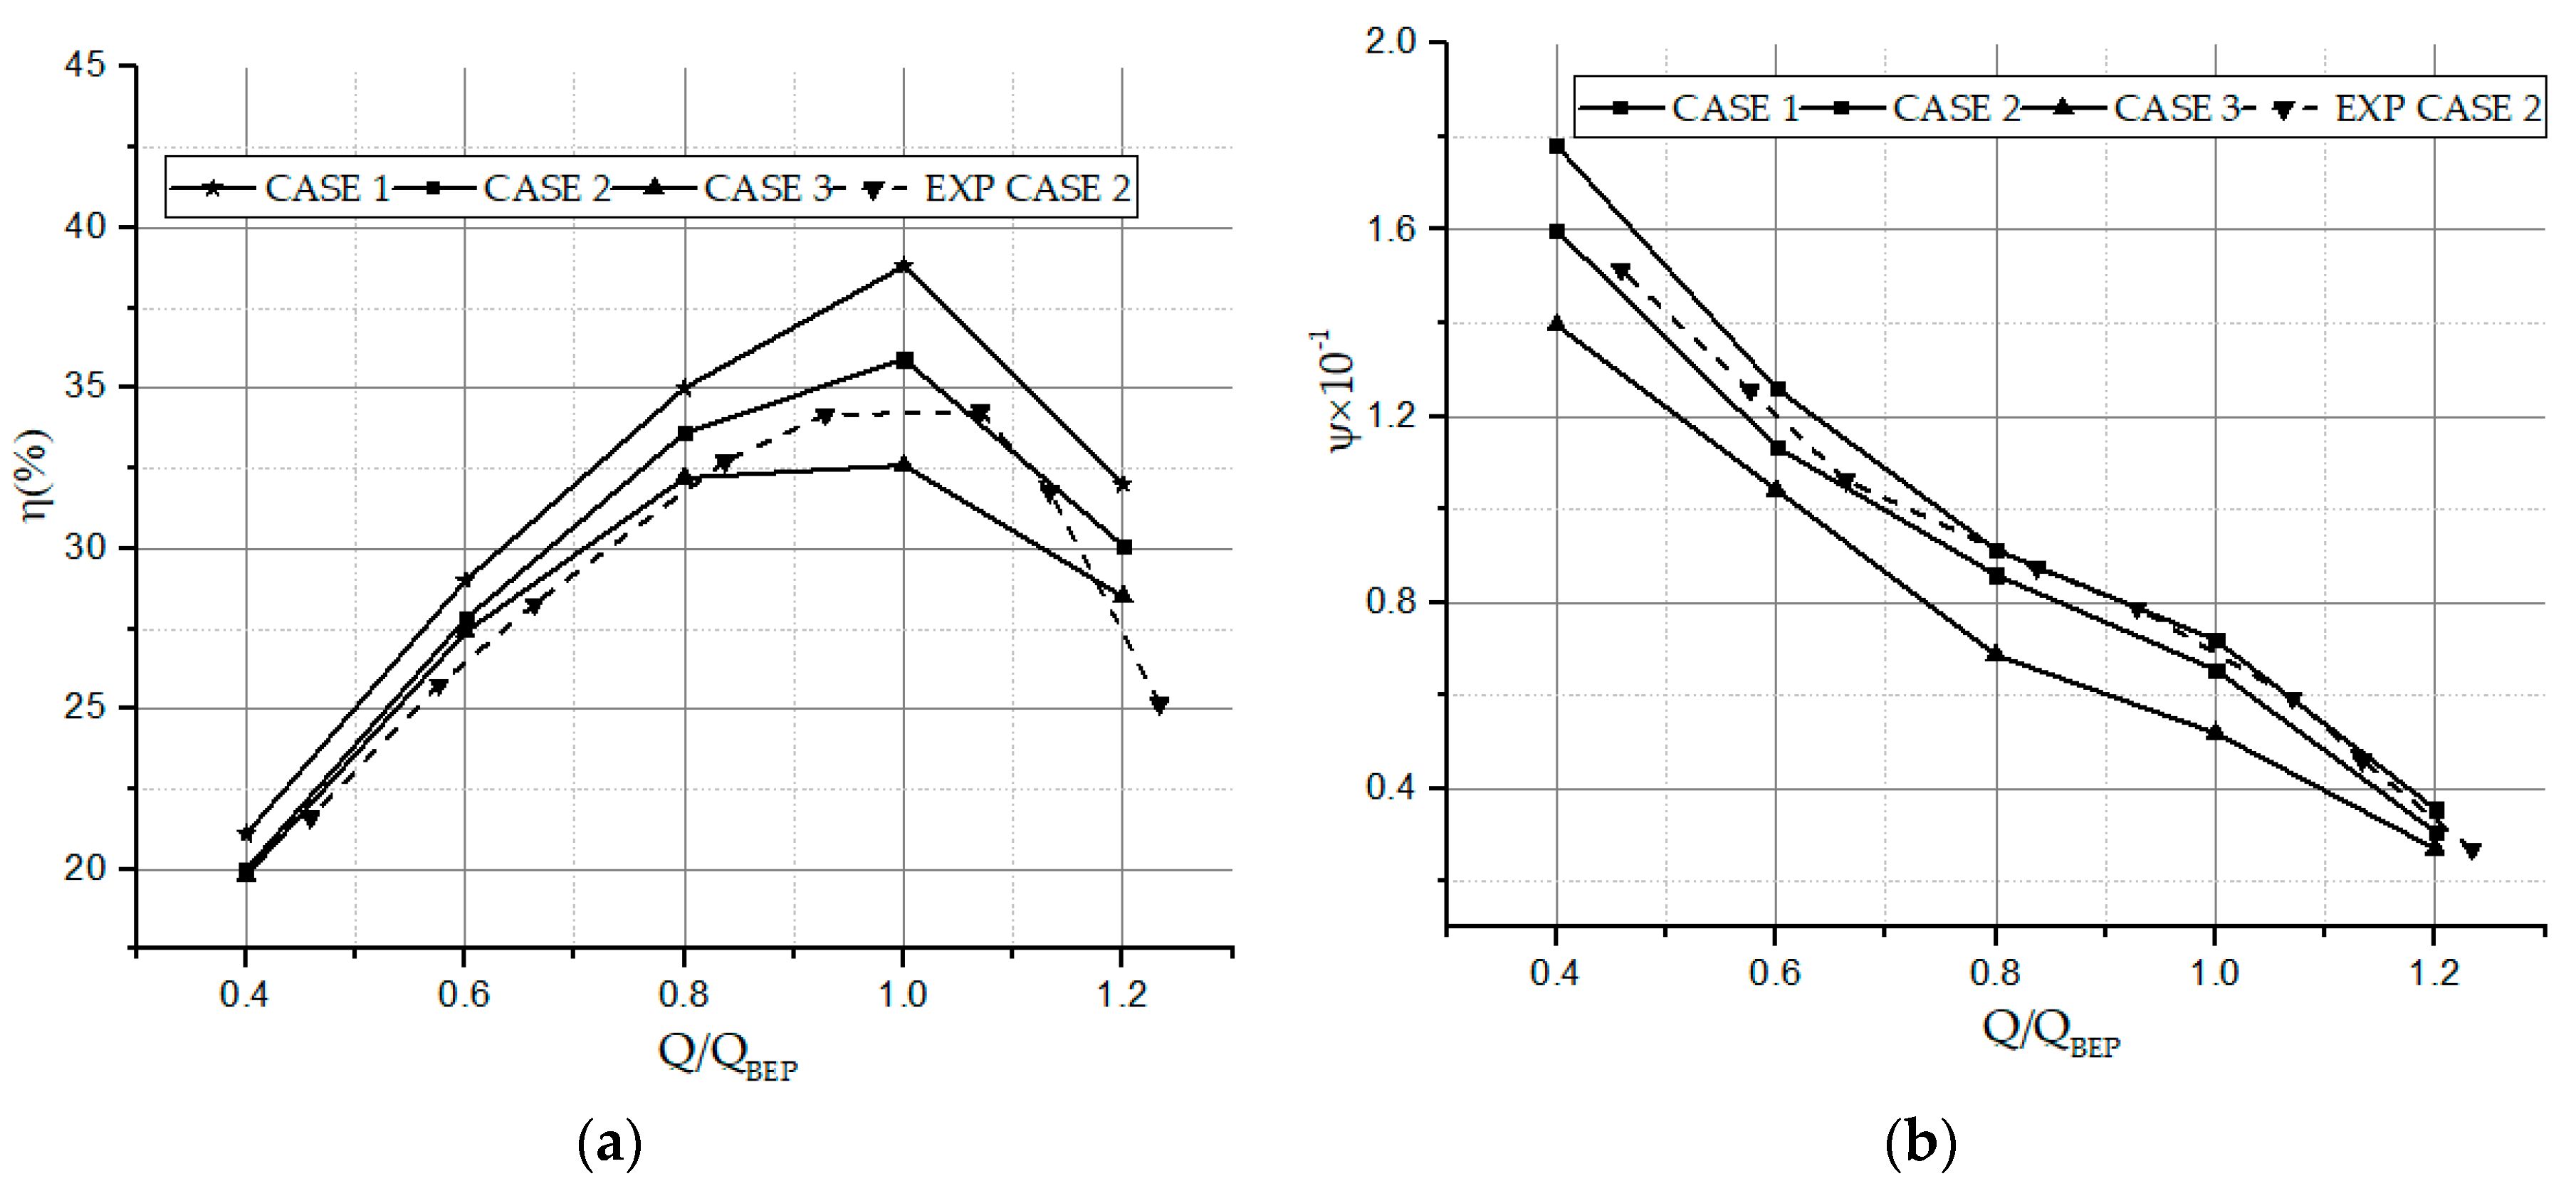
Figure 15a compares the CFD efficiency curves for all three pump cases. It was observed that the QBEP for all the cases occurred at Q/QBEP = 1.0. The curves of all three pump cases increased gradually until the QBEP and suddenly decreased. All three cases recorded nearly the same efficiencies from 0.4 Q/QBEP to 0.8 Q/QBEP. At 0.8 Q/QBEP the efficiency of case 1 is 4.2% and 8.7% more than case 2 and case 3, respectively. Case 1 recorded the highest efficiency of 38.8% while case 3 recorded the lowest at QBEP. The efficiency of case 1 at QBEP improved by 8.1% and 19.0% compared to case 2 and case 3, respectively.
Figure 15b compares the hydraulic head coefficient curves for the three pump cases. When the valve is gradually opened, the head coefficient decreases as the flow rate increases. The high head coefficients at part load condition can be attributed to the high circulation velocity. Fleder et al. [23] and Zhang et al. [25] indicated that as the flow ratio increases, the flow enters the impeller blades with less circulation velocity lowering the level of regeneration between the impeller and side channel thus lowering the static pressure of the flow discharged. The head coefficient deviation at 0.6 Q/QBEP of case 1 improved by 11.0% and 21.0% compared to cases 2 and 3, respectively. At 0.8 Q/QBEP small differences in the head coefficients are recorded between case 1 and case 2. At this operating condition, the head coefficient of case 1 was about 6.2% and 32.8% higher than that of case 2 and case 3, respectively.
Importantly, case 1 recorded the highest head coefficient while case 3 recorded the lowest at all operating conditions. Case 1 marked a head coefficient increase of 9.8% and 38.6% compared to case 2 and case 3, respectively at QBEP. Overall, the CFD hydraulic performance curves indicated that decreasing the wrapping angle caused an increase in the head and efficiency of the side channel pump, which is also consistent with the analyses of the internal flow patterns. Furthermore, marginal difference in the efficiency and head of case 1 and case 2 is revealed; thus, for a clear separation between the outflow and inflow regions, case 2 seems to portray optimal hydraulic performance. The poor performance of case 3 can partly be attributed to unsteady flow fields developed in the pump as a result of its wrapping angle size. The fluid power rated in case 3 was used to overcome the unsteady fields and some portions of it was used to develop the head rise, thereby producing lower head and efficiency compared to case 1 and 2 at all operating conditions.
6. Conclusions
To investigate the effects of wrapping angle on the performance of the side channel pump, 3D URANS equations were solved using the SST k-ω turbulence model. Three side channel pump cases were studied numerically to predict the performance with different wrapping angles. For this purpose, pump case 2 was built for experimental validation to show the accuracy of the numerical simulations. Analyses of the internal flow dynamics revealed a better understanding of the effects of the size of the wrapping angle. Below are some conclusions that were drawn out from the above investigations.
- (1)
- The size of wrapping angle has a significant effect on the head performance with a slight increase in the efficiency of the side channel pump. In industrial situations where high heads are required, the size of the wrapping angle can be reduced. Pump case 1 with the smallest wrapping angle records head improvement at all operating conditions compared to case 2 and case 3. Although the size of the wrapping angle slightly affected the efficiency of the side channel pump, case 1 still predicted a marginal increase compared to the other two pump cases at all operating conditions.
- (2)
- The pressure growth in the tangential direction from inflow to the outflow mainly depends on flow exchange times between the impeller and side channel. A small wrapping angle produces stronger static pressure in both the impeller and side channel flow passage than a larger wrapping angle.
- (3)
- The radial vortex flow at the outer radius has negative effects on the pump performance and increases as the size of the wrapping angle increases. Pump case 3 experienced the strongest vortices at the outer radius. Furthermore, the mass flow exchange view shows the energy conversion and zones of irregular flow patterns within the side channel pump. Pump cases 1 and 2 perform better energy conversion whereas pump case 3 has many irregular flow characteristics along the flow passage; thus, the size of the wrapping angle affects the energy conversion in side channel pumps.
Author Contributions
Conceptualization, F.Z. and D.A.; Methodology, J.P.; Formal Analysis, B.H.; Resources, S.Y.; Writing—Original Draft Preparation, D.A.; Writing—Review and Editing, K.C. and S.N.A.; Supervision, J.P.
Funding
This research was funded by National Natural Science Foundation of China: 51809121 and 51879121, Natural Science Foundation of Jiangsu Province: BK20170548, Senior Talent Research Start-up Foundation of Jiangsu University: 17JDG040, Open Foundation of Zhejiang Provincial Top Key Academic Discipline of Mechanical Engineering: ZSTUME02A02.
Acknowledgments
The authors express their sincere gratitude to Martin Bӧhle of the SAM in Technical University of Kaiserslautern, Germany for his great support with the experimental test in this study.
Conflicts of Interest
The authors declare no conflicts of interest.
Nomenclature
| d | diameter of impeller, mm |
| H | head, m |
| P | pressure, Pa |
| Q | flow rate, m3/h |
| ω | angular speed, rad/s |
| n | rotational speed, r/min |
| η | efficiency |
| φ | wrapping angle, deg |
| ρ | density, kg/m3 |
| θ | blade suction angle, deg |
| h | height of the side height, mm |
| b | blade thickness, mm |
| s | axial clearance, mm |
| σ | radial clearance, mm |
| y+ | non-dimensional wall distance |
| t | time, s |
| M | torque, Nm |
| z | height of axial plane in z-direction, m |
| ϕ | angular position, deg |
| g | acceleration due to gravity, m/s2 |
| ψ | head coefficient |
| y+ | non-dimensional wall distance |
| M | torque, Nm |
| k | kinetic energy of turbulence, m2/s2 |
| ϵ | dissipation of kinetic energy of turbulence, m2/s3 |
| ω | specific dissipation of turbulence kinetic energy, s−1 |
| Reynolds-stress tensor | |
| β’ | turbulence-model coefficients |
| μ | dynamic viscosity, Pa.s |
| μt | turbulent viscosity, m2/s |
| σk | turbulence-model coefficients |
| σω | turbulence-model coefficients |
| F1, F2 | blending or auxiliary functions in turbulence model |
| Kronecker delta | |
| auxiliary variable in turbulence model | |
| S | scalar measure of the vorticity tensor |
| Subscript | |
| xi | cartesian coordinates: x, y, z |
| i, j | components in different directions |
| Abbreviations | |
| CFD | computational fluid dynamics |
| SST | shear stress transport |
| URANS | unsteady Reynolds-averaged Navier-Stokes equations |
| BEP | best efficiency point |
References
- Appiah, D.; Zhang, F.; Yuan, S.; Osman, M.K. Effects of the Geometrical Conditions on the Performance of a Side Channel Pump: A review. Int. J. Energy Res. 2018, 42, 416–428. [Google Scholar] [CrossRef]
- Siemen, O.; Hinsch, J. A Circulation Pump Which Acts Partially with Sealing Circling Auxiliary Liquid. Germany Patent 413435, 3 March 1920. [Google Scholar]
- Senoo, Y. Researches on Peripheral Pumps. Rep. Res. Inst. Appl. Mech. 1954, 3, 53–113. [Google Scholar]
- Iverson, H.W. Performance of the Periphery Pump. J. Fluids Eng. Trans. ASME 1955, 77, 19–28. [Google Scholar]
- Engels, H. Investigations of Ring Pumps; Tech Hoch Hannover: Hannover, Germany, 1940. [Google Scholar]
- Wilson, W.A.; Santalo, M.A.; Oelrich, J.A. A Theory of the Fluid Dynamic Mechanism of Regenerative Pumps. J. Fluids Eng. Trans. ASME 1955, 77, 1303–1316. [Google Scholar]
- Grabow, G. Influence of the Number of Vanes and Vane Angle on the Suction Behaviour of Regenerative Pumps. In Proceedings of the 5th Conference on Fluid Machinery, Budapest, Hungary, 15–20 September 1975; Volume 1, pp. 351–364. [Google Scholar]
- Song, J.W.; Engeda, A.; Chung, M.K. A Modified Theory for the Flow Mechanism in a Regenerative Flow Pump. Proc. Inst. Mech. Eng. Part A J. Power Energy 2003, 217, 311–322. [Google Scholar] [CrossRef]
- Quail, F.A. One Dimensional Numerical Model for the Momentum Exchange in Regenerative Pumps. J. Eng. Gas Turbines Power 2011, 133, 093001. [Google Scholar] [CrossRef]
- Yoo, I.; Park, M.; Chung, M. Improved Momentum Exchange Theory for Incompressible Regenerative Turbomachines. Proc. Inst. Mech. Part A J. Power Energy 2005, 219, 567–581. [Google Scholar] [CrossRef]
- Shimosaka, M.; Yamazaki, S. Research on the Characteristics of Regenerative Pump. 1st Report, Influences of Flow Channel and Impeller. Bull. JSME 1960, 3, 185–190. [Google Scholar] [CrossRef]
- Yamazaki, S.; Tomita, Y.; Sasahara, T. Research on the Performance of the Regenerative Pump with Non-Radial Vanes. Bull. JSME 1972, 15, 337–343. [Google Scholar] [CrossRef]
- Badami, M. Theoretical and Experimental Analysis of Traditional and New Periphery Pumps. SAE Tech. Pap. Ser. 1997, 971074. [Google Scholar] [CrossRef]
- Surek, D. Influence of the Blade Geometry on the Characteristic Curve Gradient of Side Channel Machines. Res. Eng. 1998, 64, 173–182. [Google Scholar]
- Choi, W.C.; Yoo, I.S.; Park, M.R.; Chung, M.K. Experimental Study on the Effect of Blade Angle on Regenerative Pump Performance. Proc. Inst. Mech. Eng. Part A J. Power Energy 2013, 227, 585–592. [Google Scholar] [CrossRef]
- Meakhail, T.; Seung, O.P.; Lee, D.A.; Meakhail, S. A study of circulating flow in regenerative pump. In Proceedings of the KSAS 1st International Session, Gyeongju, Korea, 14–15 November 2003; pp. 19–26. [Google Scholar]
- Meakhail, T.; Park, S. An Improved Theory for Regenerative Pump Performance. Proc. Inst. Mech. Part A J. Power Energy 2005, 219, 213–222. [Google Scholar] [CrossRef]
- Shirinov, A.; Oberbeck, S. Optimisation of the High Vacuum Side Channel Pump. In Proceedings of the 7th International Conference on Compressors and their Systems, London, UK, 5–6 September 2011; pp. 5–6. [Google Scholar]
- Bӧhle, M.; Muller, T. Evaluation of the Flow Inside a Side Channel Pump by the Application of an Analytical Model and CFD. In Proceedings of the ASME 2009 Fluids Engineering Division Summer Meeting, Vail, CO, USA, 2–6 August 2009. Paper No. FEDSM2009-78023. [Google Scholar]
- Quail, F.; Scanlon, T.; Stickland, M. Design Optimisation of a Regenerative Pump using Numerical and Experimental Techniques. Int. J. Numer. Methods Heat Fluid Flow 2011, 21, 95–111. [Google Scholar] [CrossRef]
- Fleder, A.; Muller, T.; Bӧhle, M. A Theoretical Method to Improve the Side Channel Pump Efficiency. In Proceedings of the 9th European Conference on Turbomachinery, Istanbul, Turkey, 21–25 March 2011; Volume 1, pp. 711–720. [Google Scholar]
- Fleder, A.; Bӧhle, M. A Study of the Internal Flow Structure in a Side Channel Pump. In Proceedings of the ISROMAC-14, Honolulu, HI, USA, 27 February–2 March 2012. Paper ID 1133. [Google Scholar]
- Fleder, A.; Bӧhle, M. A Systematical Study of the Influence of Blade Length, Blade Width and Side Channel Height on the Performance of a Side Channel Pump. ASME J. Fluid Eng. 2015, 137, 121102. [Google Scholar] [CrossRef]
- Zhang, F.; Fleder, A.; Bӧhle, M.; Yuan, S. Effect of Suction Side Blade Profile on the Performance of a Side Channel Pump. Proc. Inst. Mech. Part A J. Power Energy 2016, 230, 586–597. [Google Scholar] [CrossRef]
- Zhang, F.; Appiah, D.; Yuan, S.; Osman, M.K.; Ke, C. Transient Flow Characterization in Energy Conversion of a Side Channel Pump under Different Blade Suction Angles. Energy 2018, 161, 635–648. [Google Scholar] [CrossRef]
- Senoo, Y. Influences of the Suction Nozzle on the Characteristic of a Peripheral Pump and an Effective Method of their Removal. In Reports of Research Institute for Applied Mechanic; Kyusku University: Fukuoka, Japan, 1954; Volume 3, pp. 129–142. [Google Scholar]
- Sixsmith, H.; Altmann, H. A Regenerative Compressor. Trans. ASME 1977, 99, 637–647. [Google Scholar] [CrossRef]
- Sixsmith, H. The Theory and Design of a Regenerative Compressor. In Vacuum and Ultravacuum: Physics and Technology; CRC Press: Boca Raton, FL, USA, 2017. [Google Scholar]
- Gao, B.; Du, W.; Yang, L. Influences of volute cross-section area profile on performance of low-specific-speed centrifugal pump. J. Drain Irrigat. Mach. Eng. 2017, 35, 749–754. [Google Scholar]
- Cao, W.; Zhang, Y.; Yao, L. Influence of outlet blade angle on performance of centrifugal pump and correction of slip factor. J. Drain Irrigat. Mach. Eng. 2017, 35, 755–760. [Google Scholar]
- Menter, F.R. Two-Equation Eddy Viscosity Models for Engineering Applications. AIAA J. 1994, 32, 1598–1605. [Google Scholar] [CrossRef]
- Menter, F. Zonal Two Equation Turbulence Models for Aerodynamic Flows. In Proceedings of the 24th Fluid Dynamics Conference, Orlando, FL, USA, 6–9 July 1993; AIAA Paper. pp. 93–2906. [Google Scholar]
- Wilcox, D. Turbulence Modeling for CFD; DCW Industries Inc.: La Canada, CA, USA, 1993; p. 4. [Google Scholar]
- Wilcox, D. Reassessment of the Scale-Determining Equation for Advanced Turbulence Models. AIAA J. 1988, 26, 1299. [Google Scholar] [CrossRef]
- Celik, I.B.; Ghia, U.; Roache, P.J.; Freitas, C.J.; Coleman, H.; Raad, P.E. Procedure for Estimation and Reporting of Uncertainty due to Discretization in CFD applications. J. Fluids Eng. 2008, 130, 078001. [Google Scholar]
- Gülich, J.F. Centrifugal Pumps; Springer: Berlin/Heidelberg, Germany; New York, NY, USA, 2008. [Google Scholar]
Figure 1.
Structure of a single stage model of a side channel pump. (a) 3D pump model; (b) typical assembly of side channel with radial impeller; (c) side channel with different wrapping angles.
Figure 1.
Structure of a single stage model of a side channel pump. (a) 3D pump model; (b) typical assembly of side channel with radial impeller; (c) side channel with different wrapping angles.

Figure 2.
Computational grid domains. (a) inlet; (b) side channel and outlet; (c) impeller; (d) side channel interface.
Figure 2.
Computational grid domains. (a) inlet; (b) side channel and outlet; (c) impeller; (d) side channel interface.
Figure 3.
Head fluctuation curve.
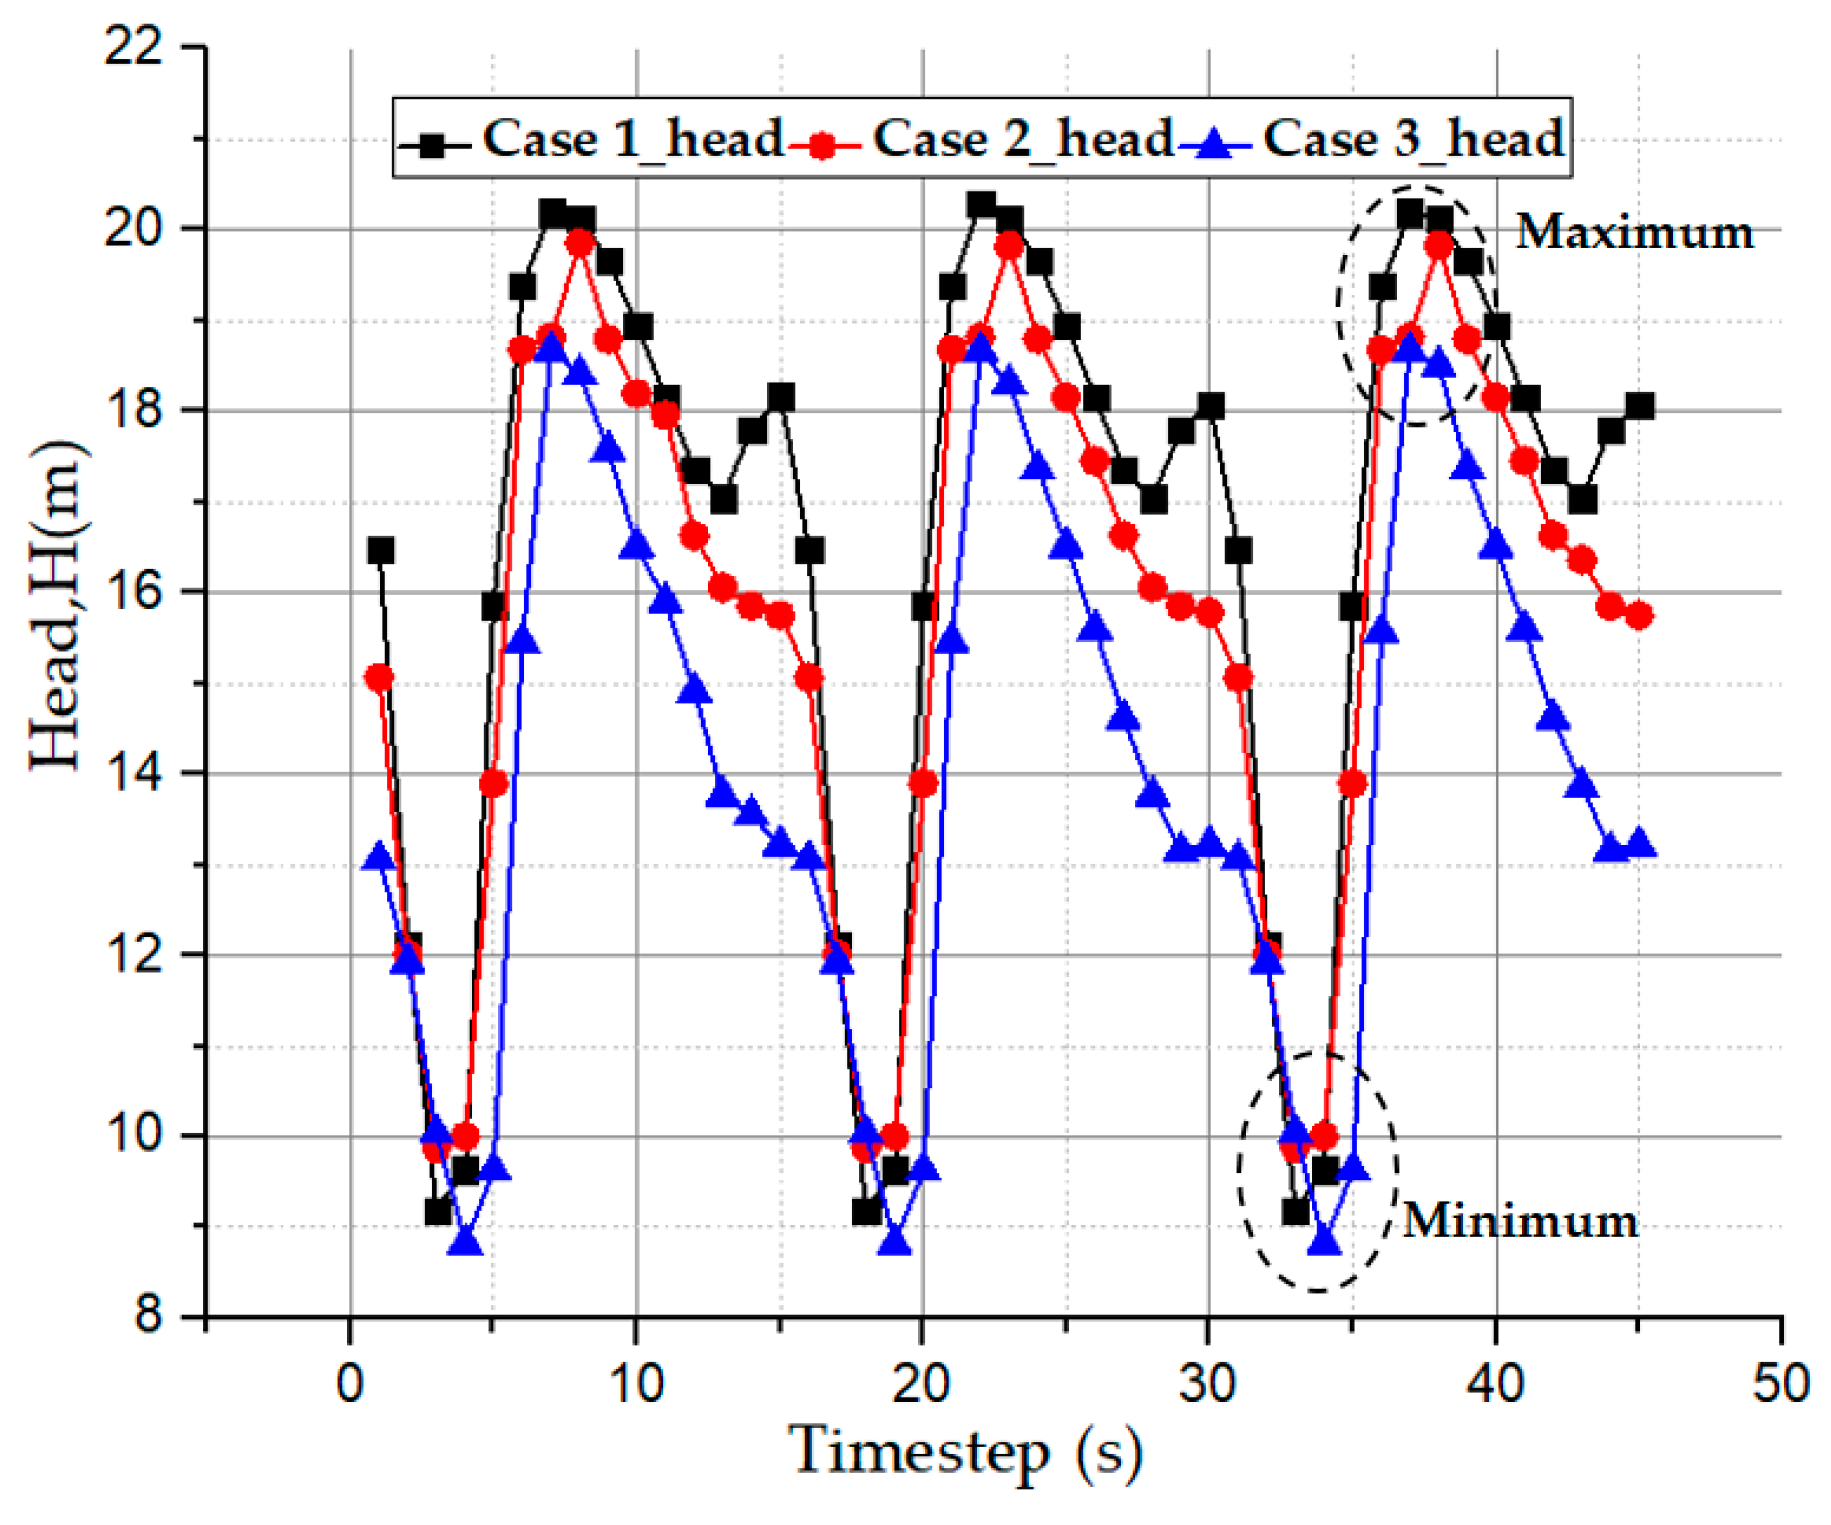
Figure 4.
Pressure distribution in the impeller. (a) Minimum head; (b) Maximum head.
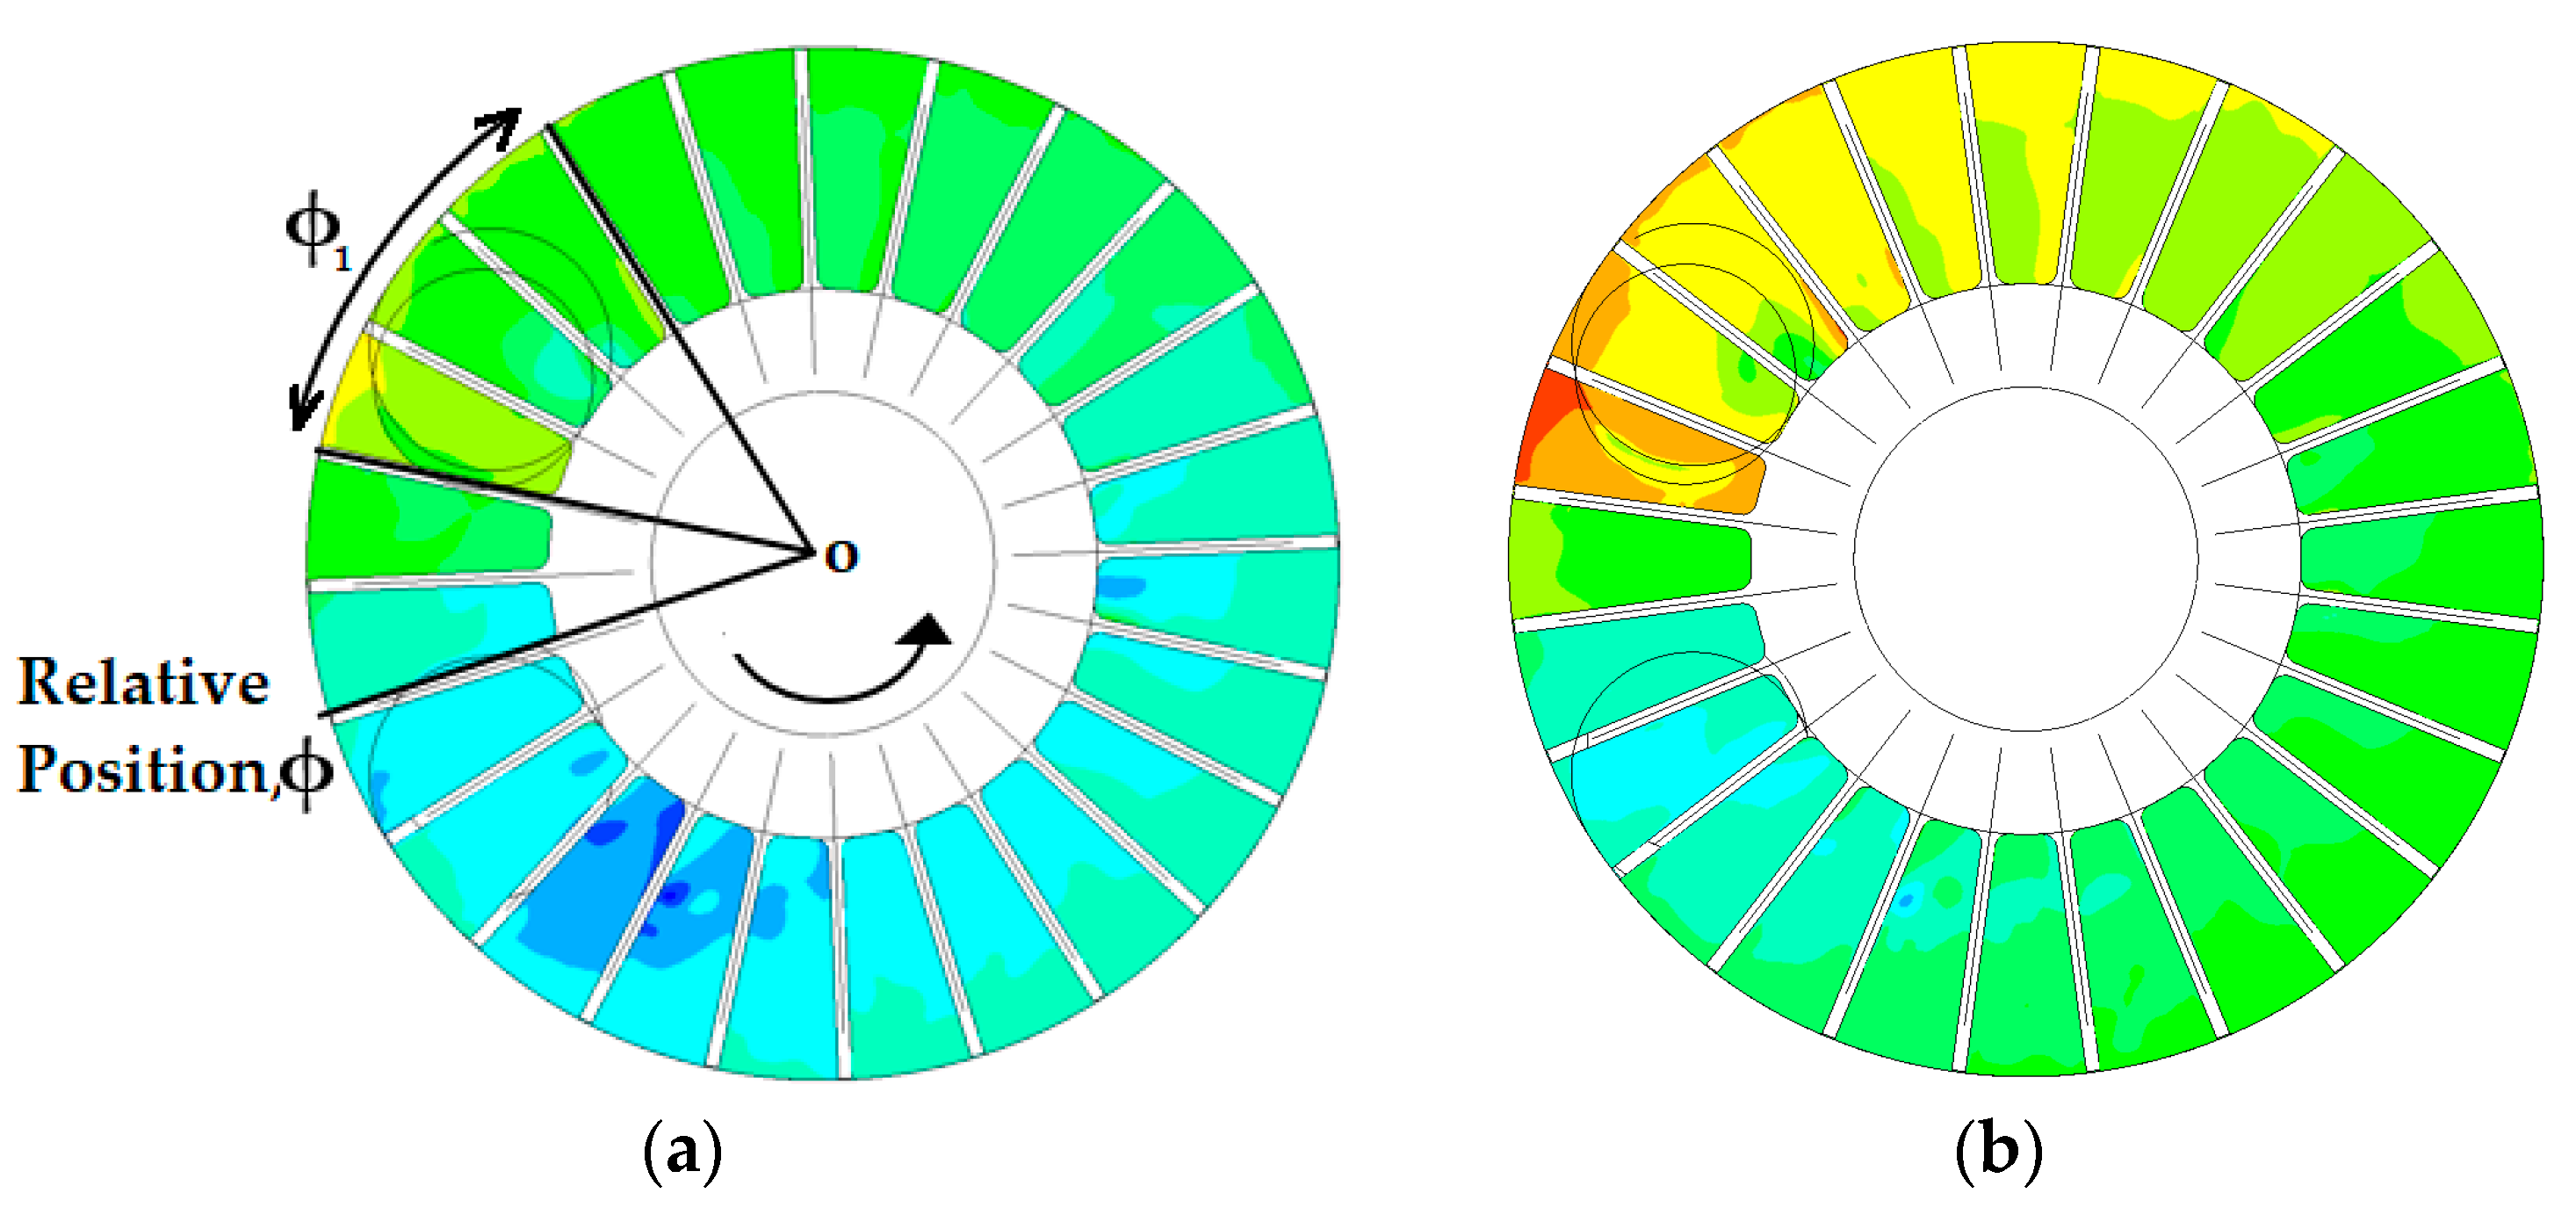
Figure 5.
Exchanged mass flow plot between the impeller and side channel of three cases.
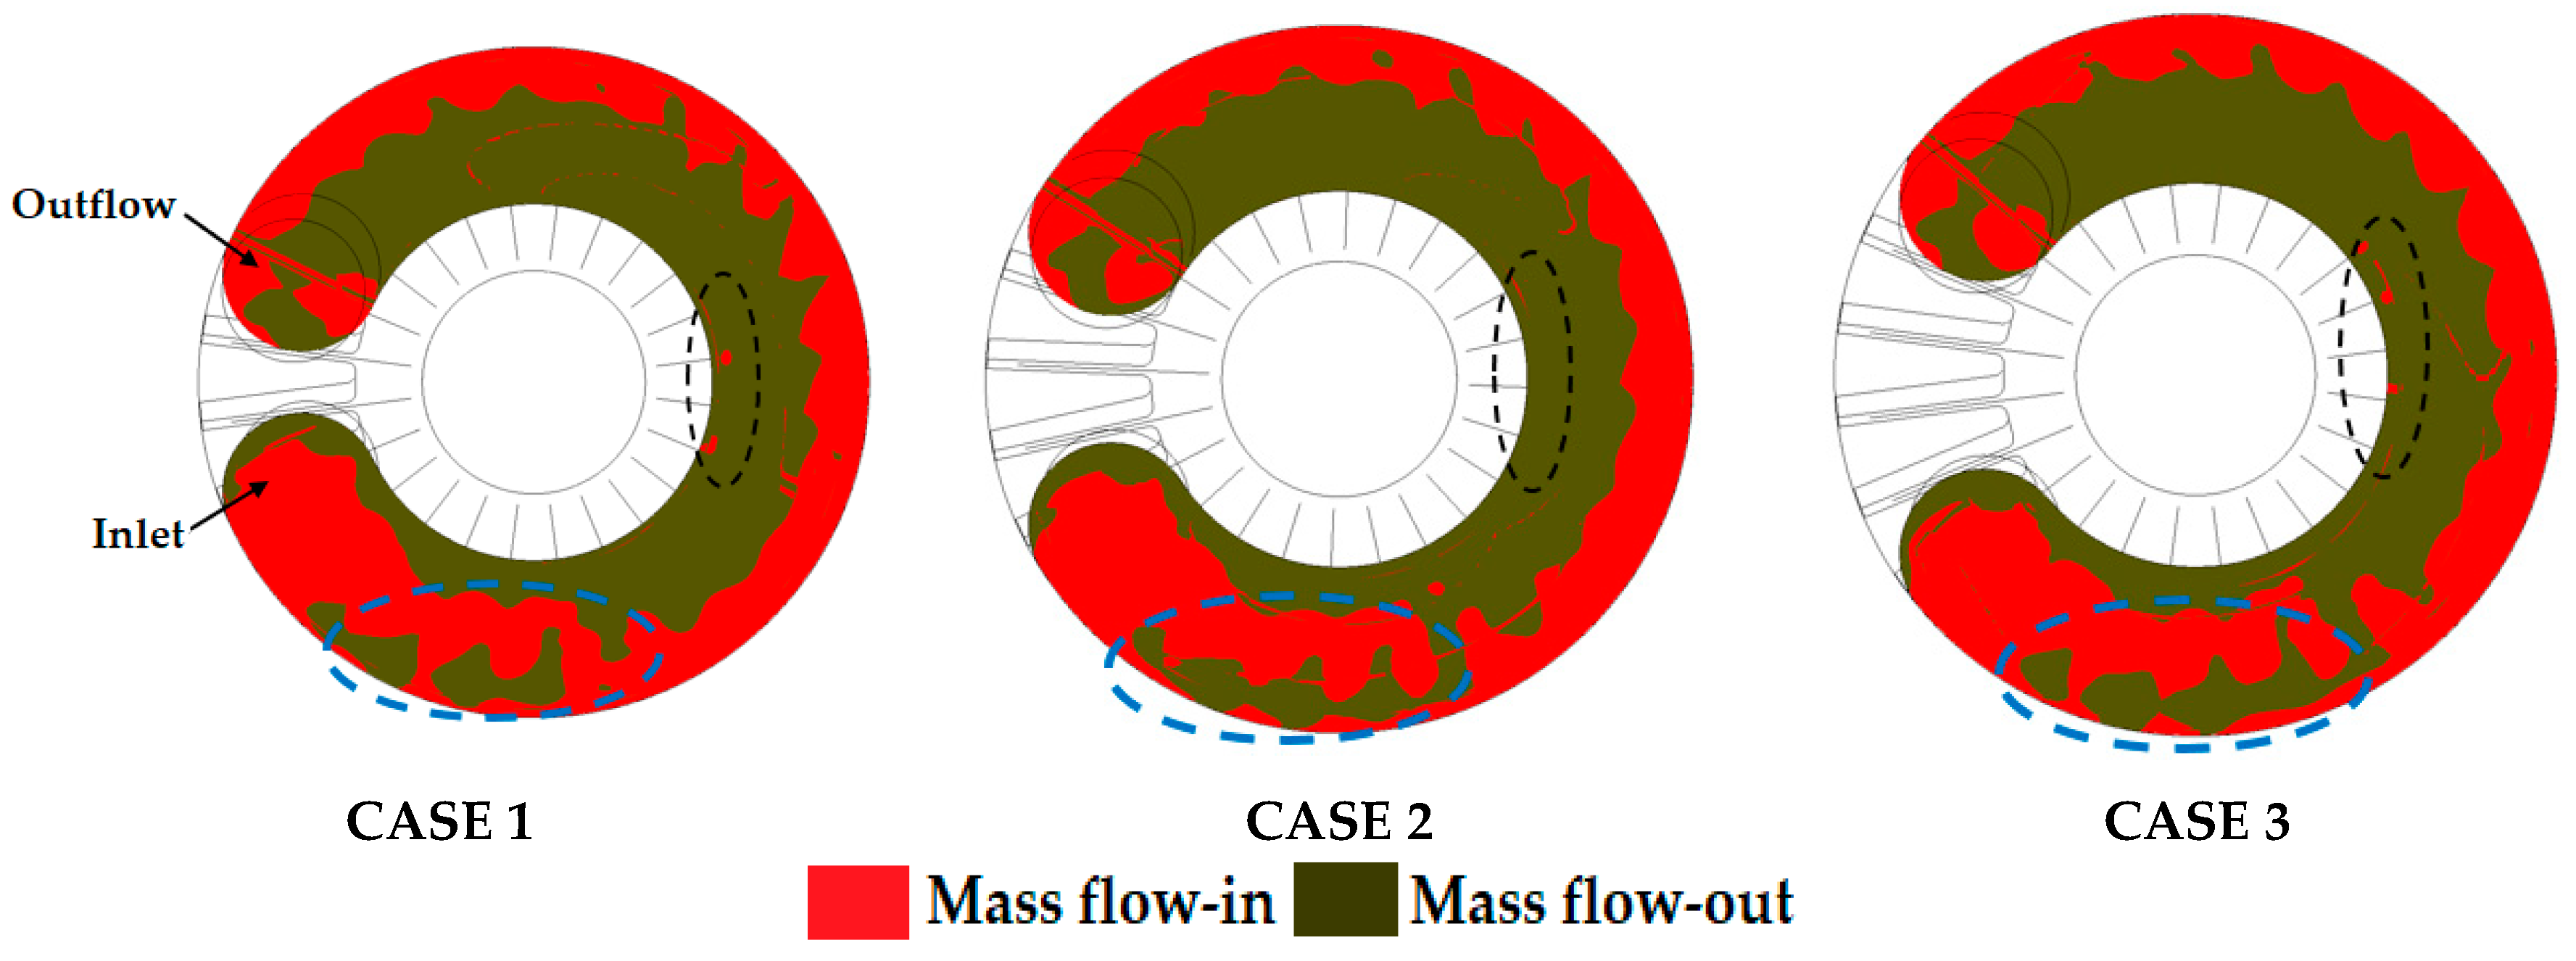
Figure 6.
Three axial planes on the impeller flow passage.

Figure 7.
Static pressure distribution in the impeller. (a) plane 1; (b) plane 2; and (c) plane 3.
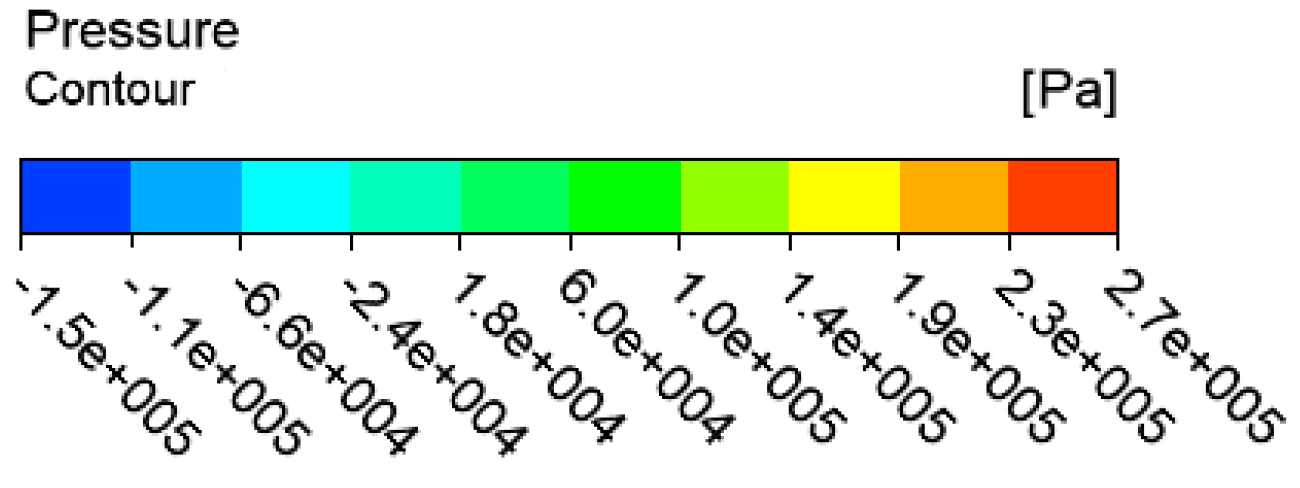
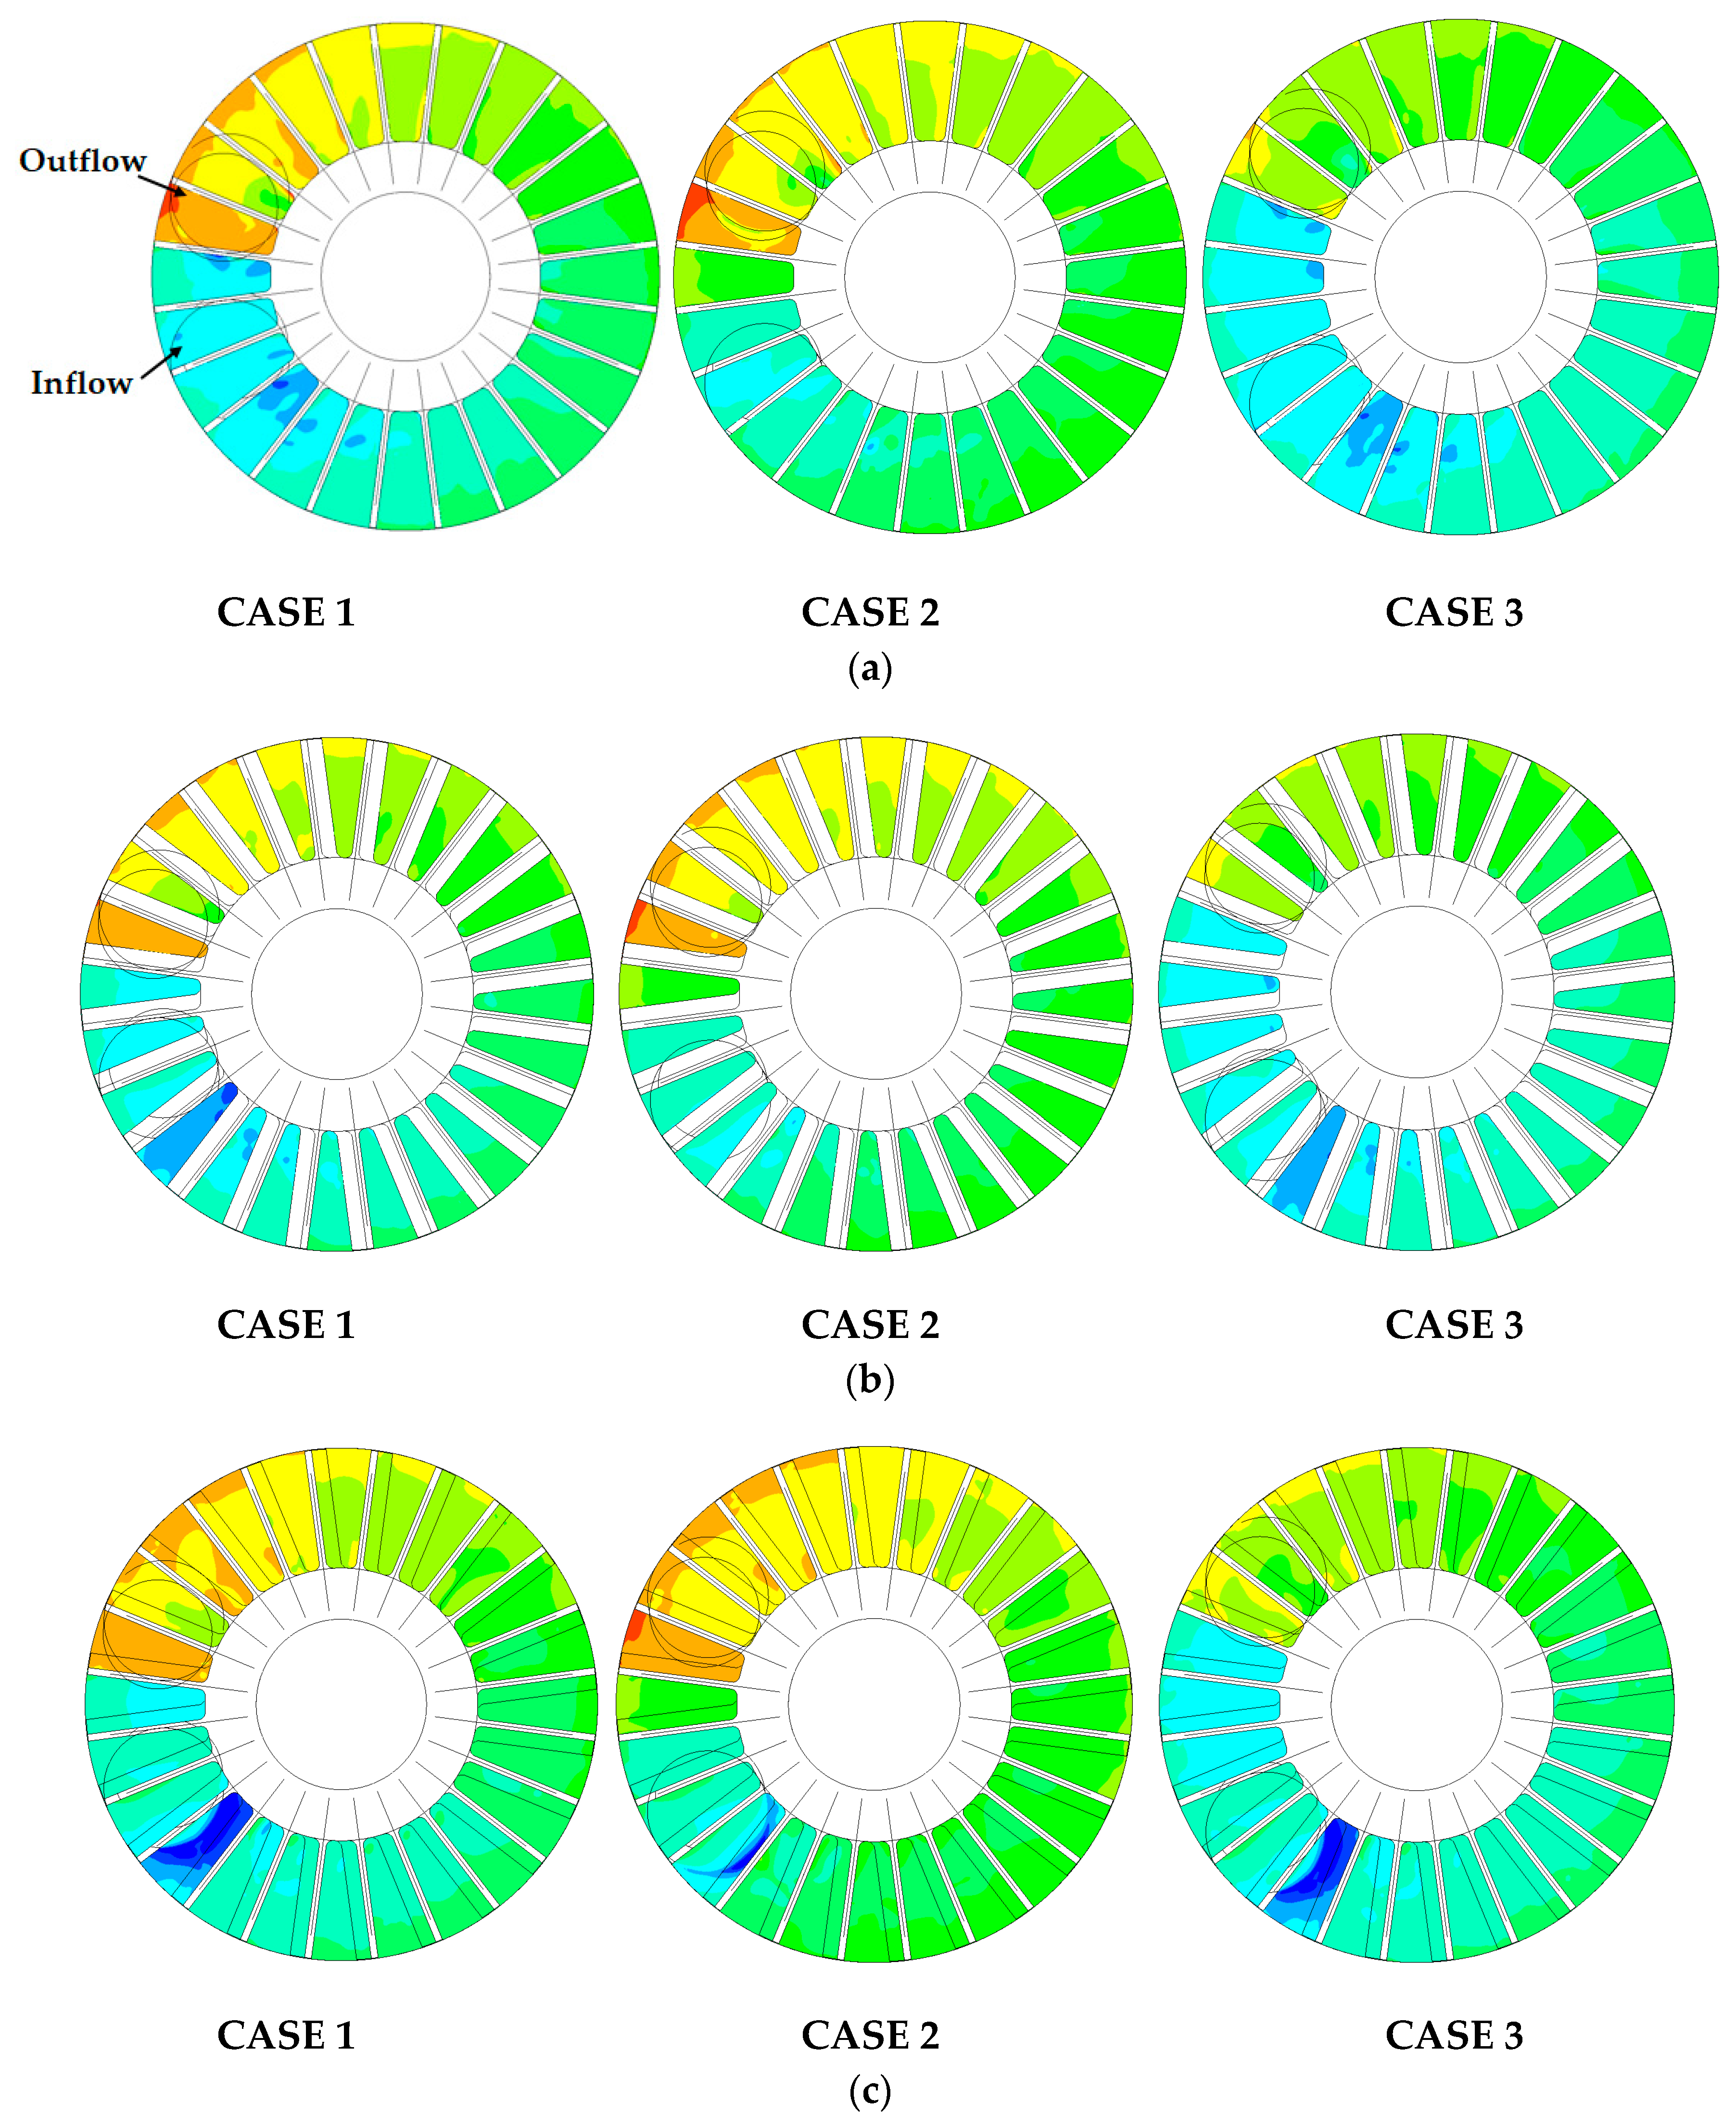
Figure 8.
Static pressure distribution in the side channel. (a) Inside; (b) Wall.
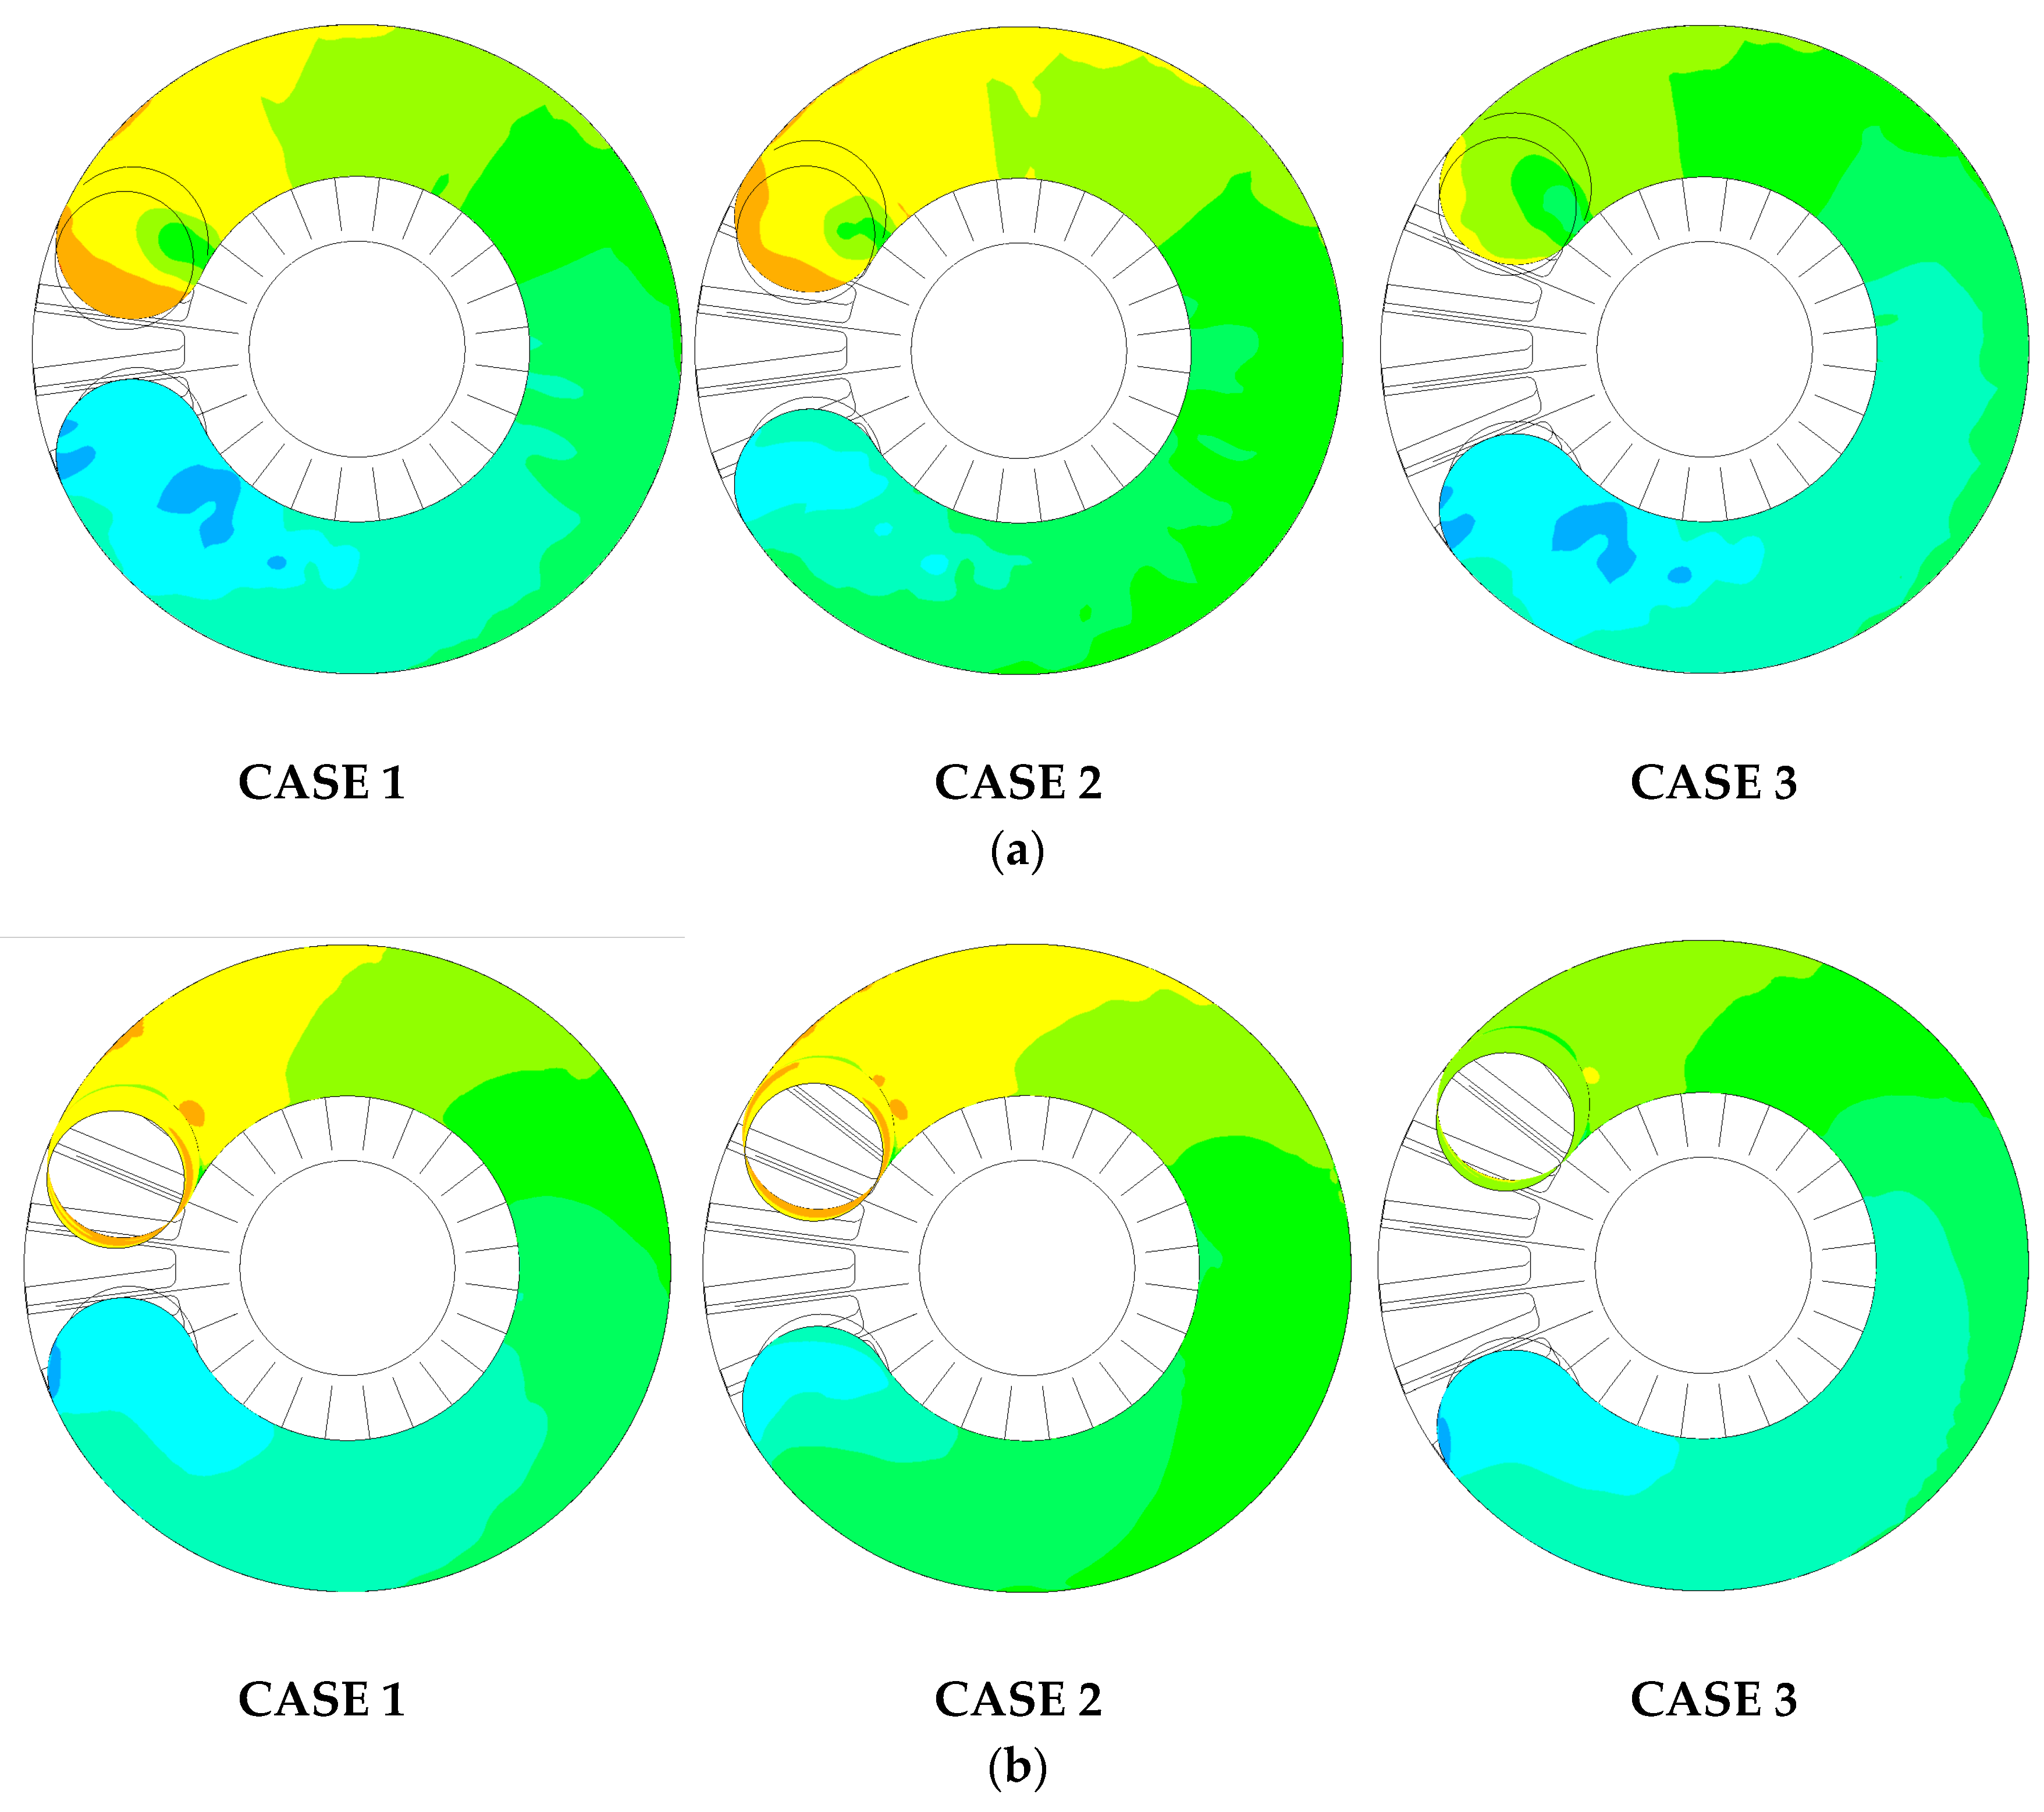
Figure 9.
Static pressure distribution in the impeller. (a) Case 1; (b) Case 2; and (c) Case 3.
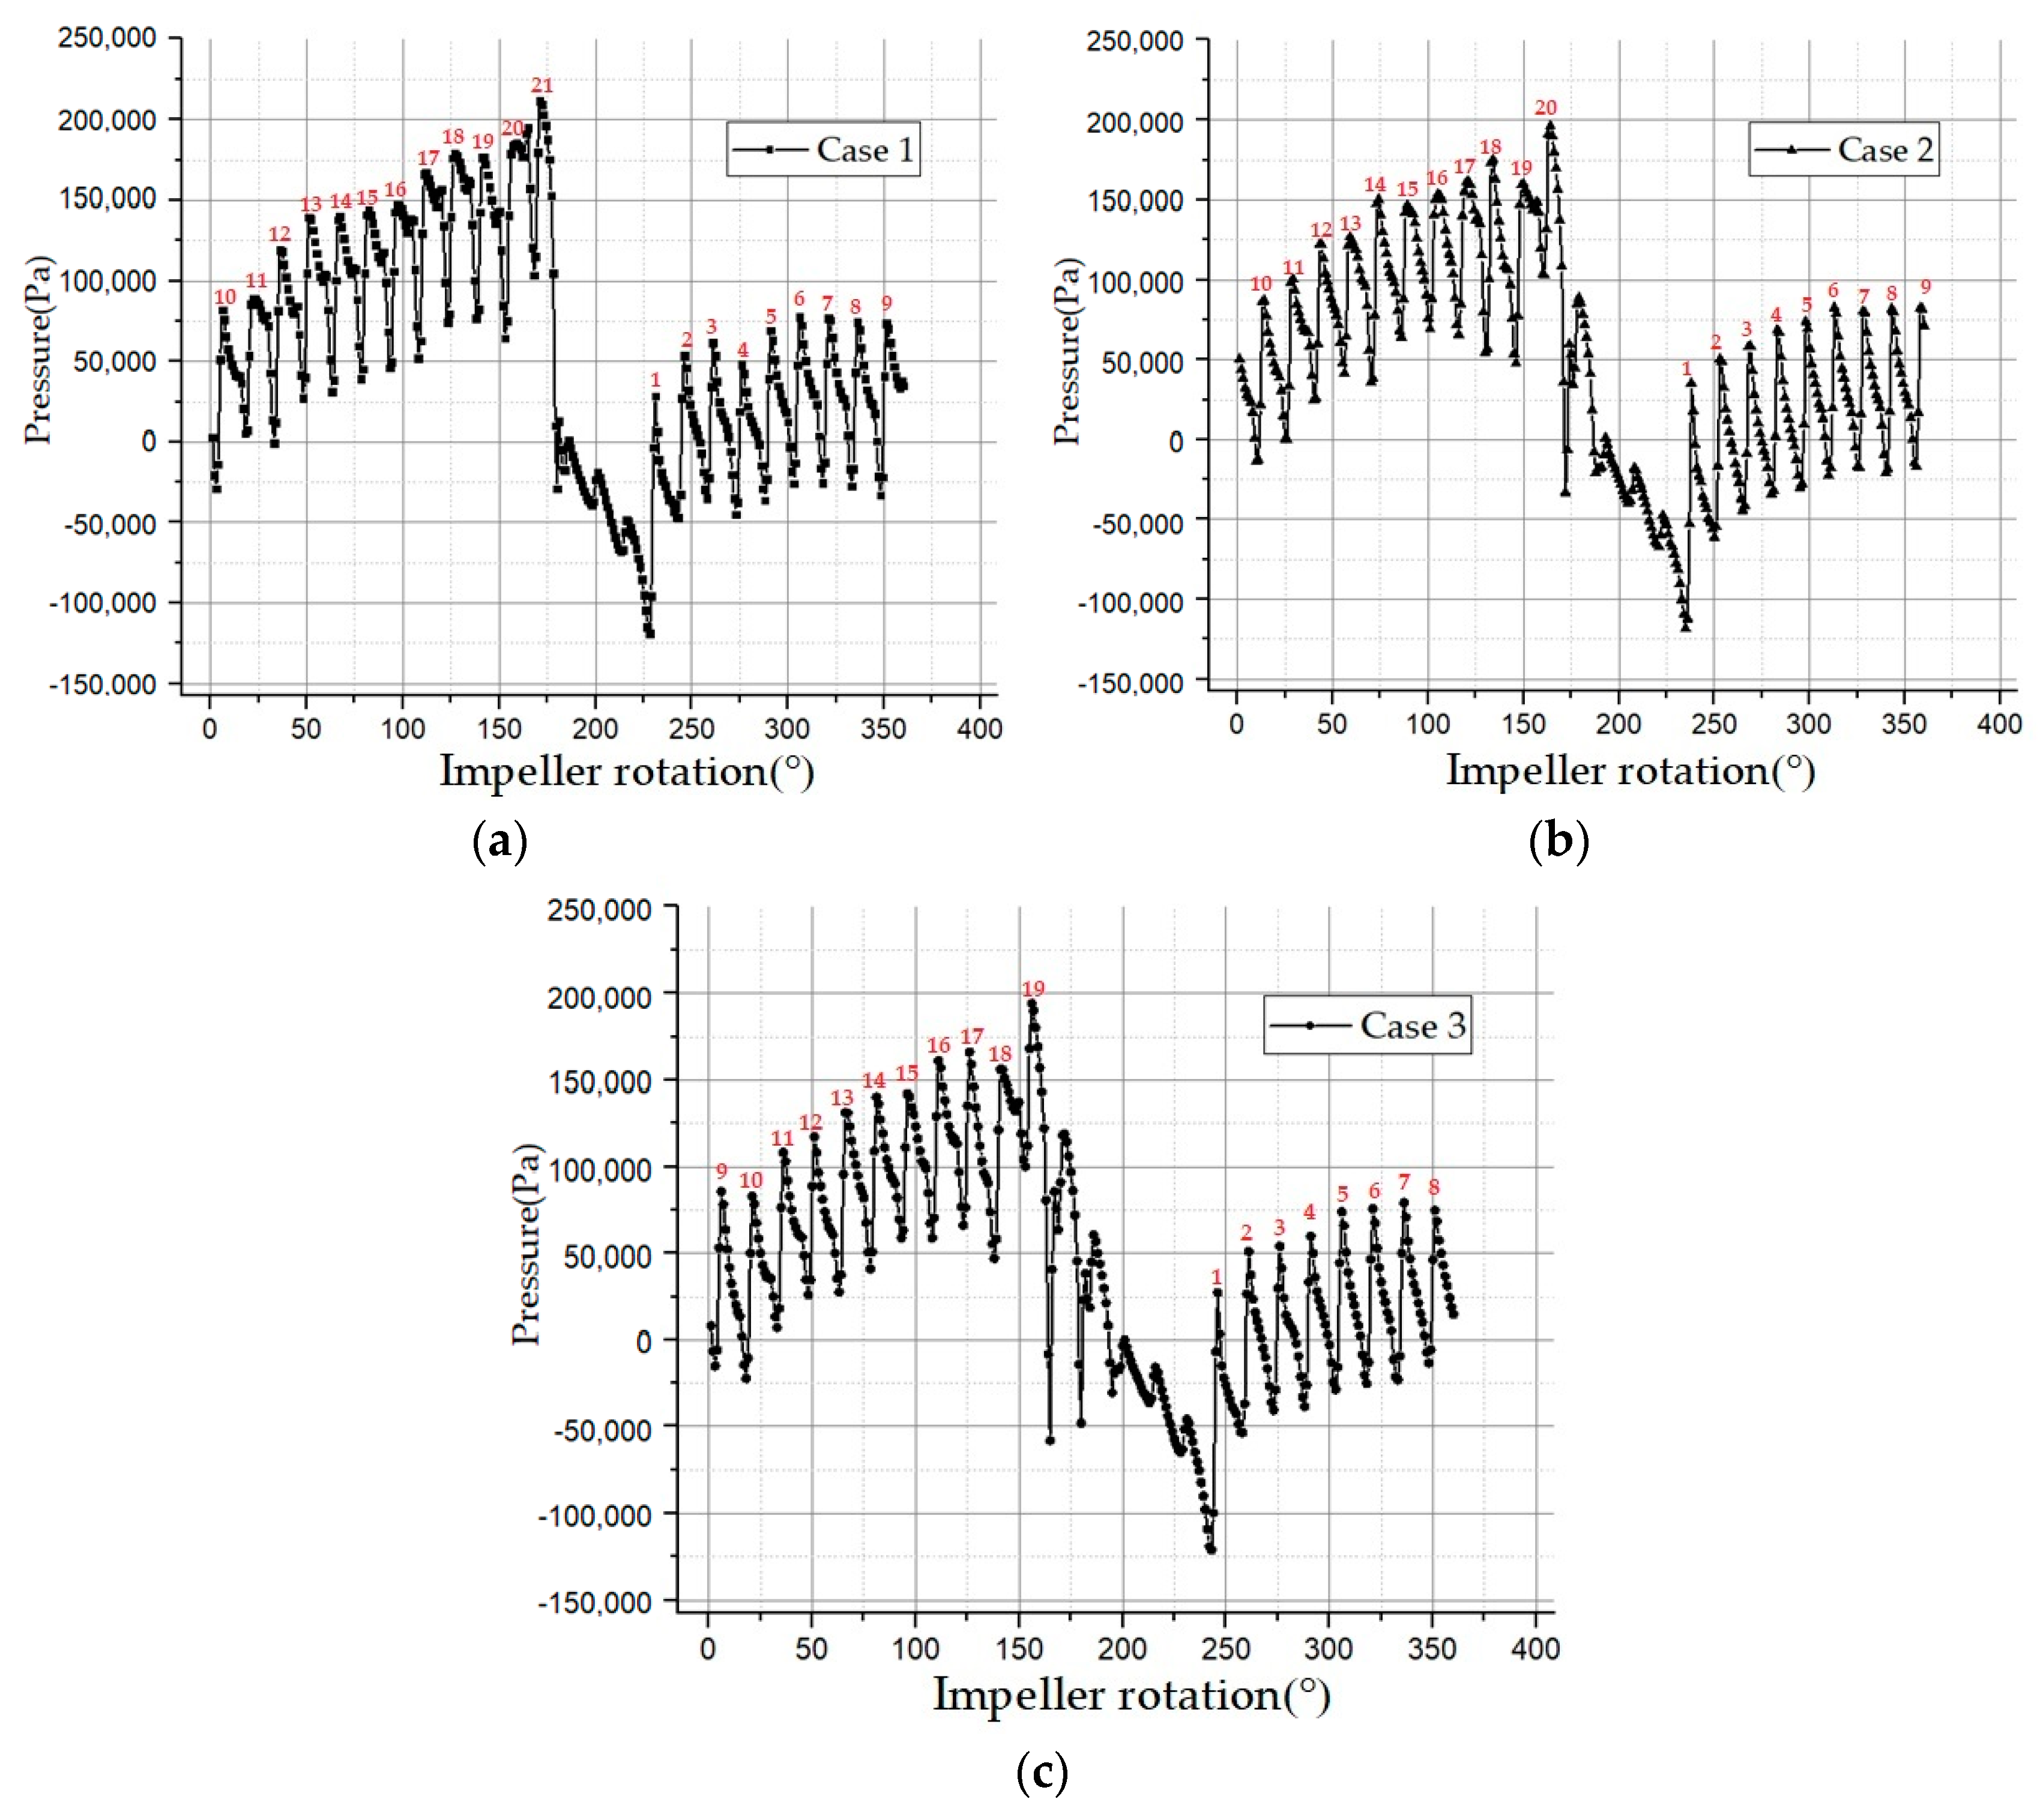
Figure 10.
Static pressure distribution in the side channel.
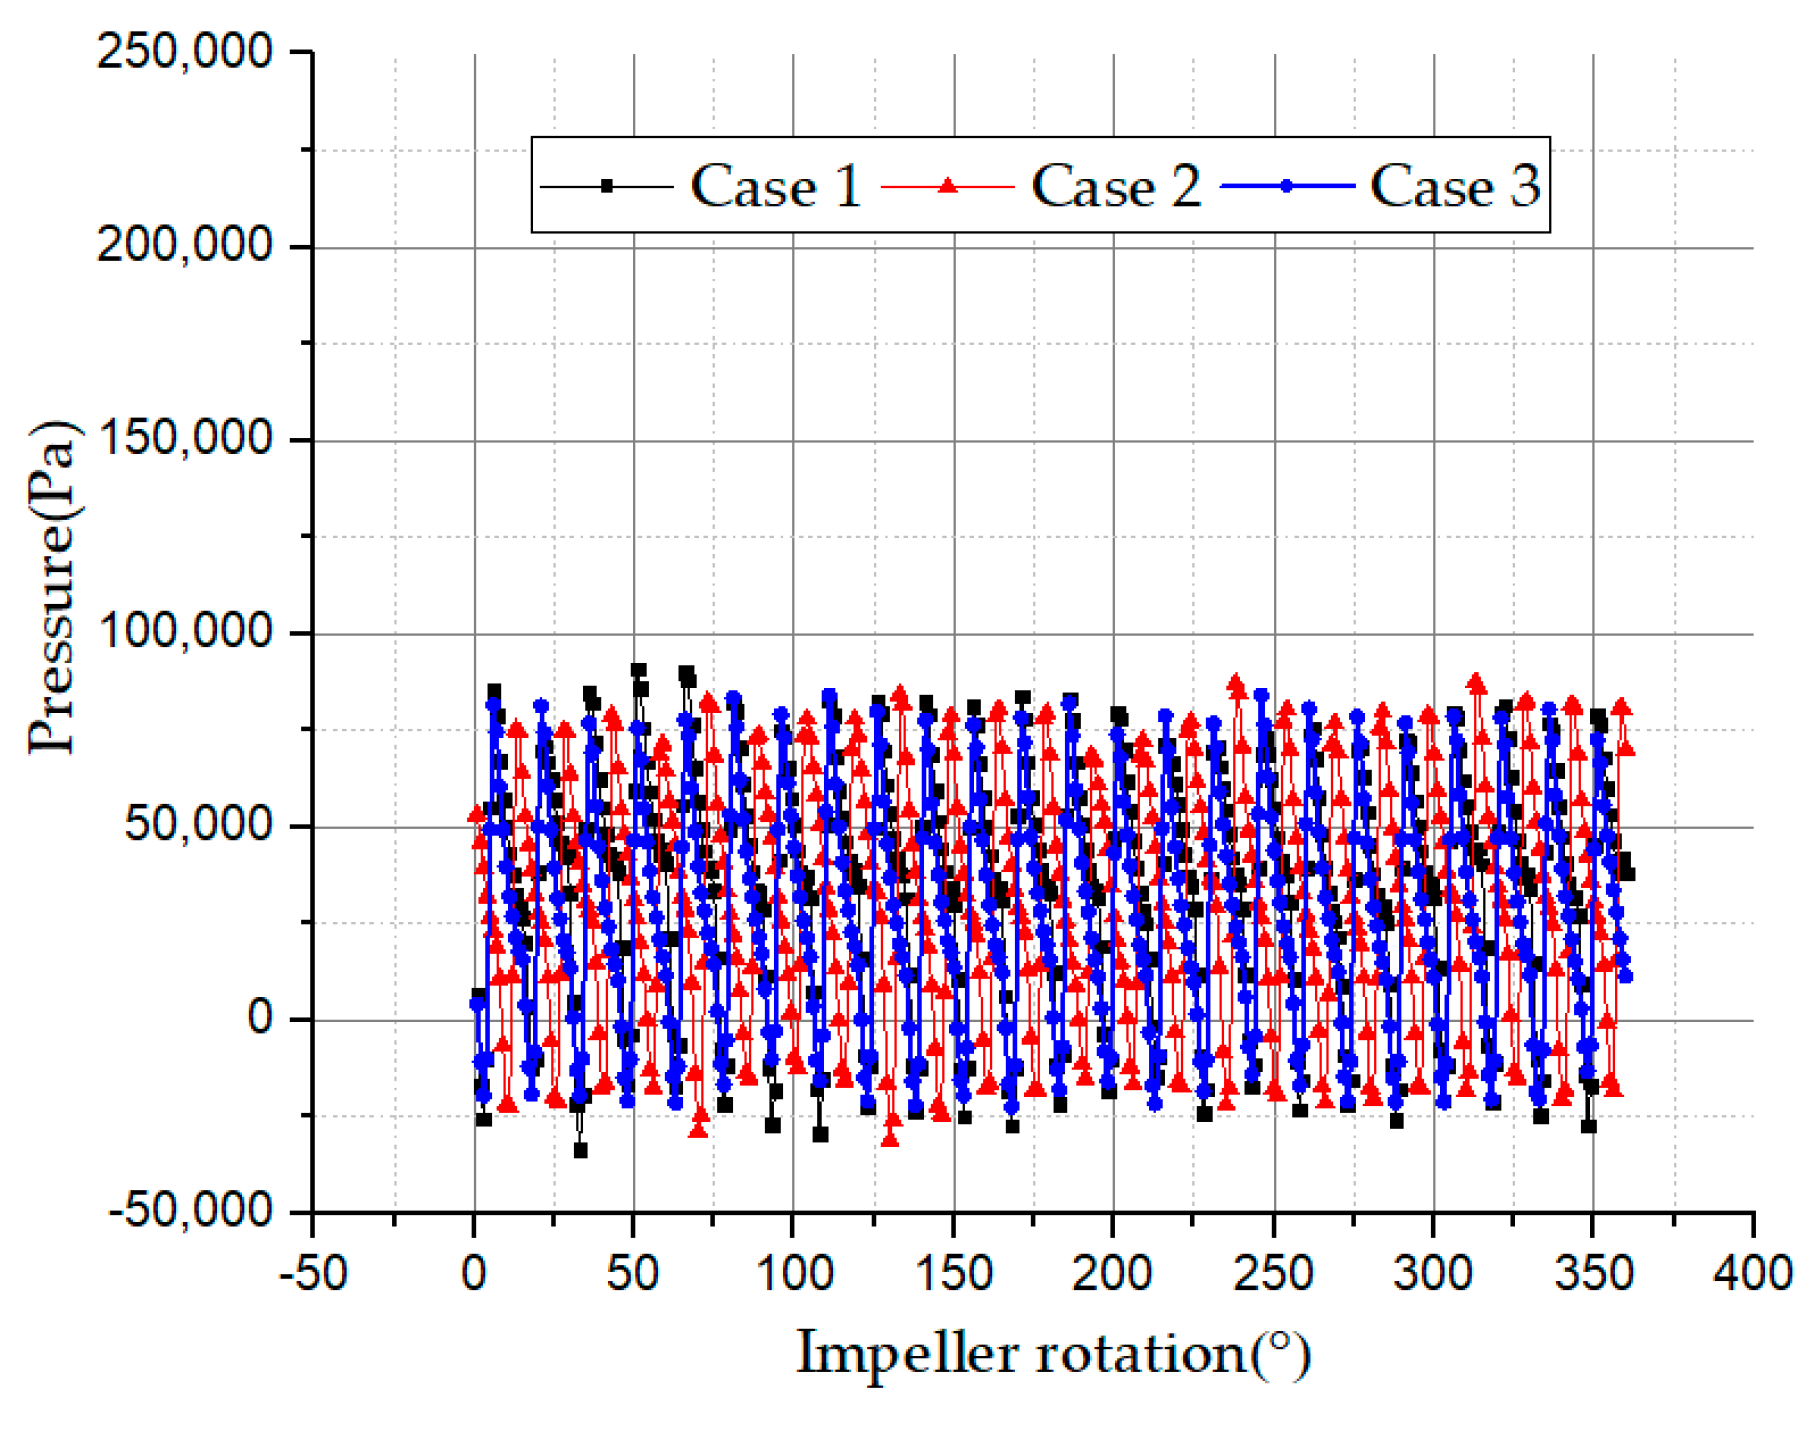
Figure 11.
Velocity vector distribution in the impeller. (a) Plane 1; (b) Plane 2; and (c) Plane 3.
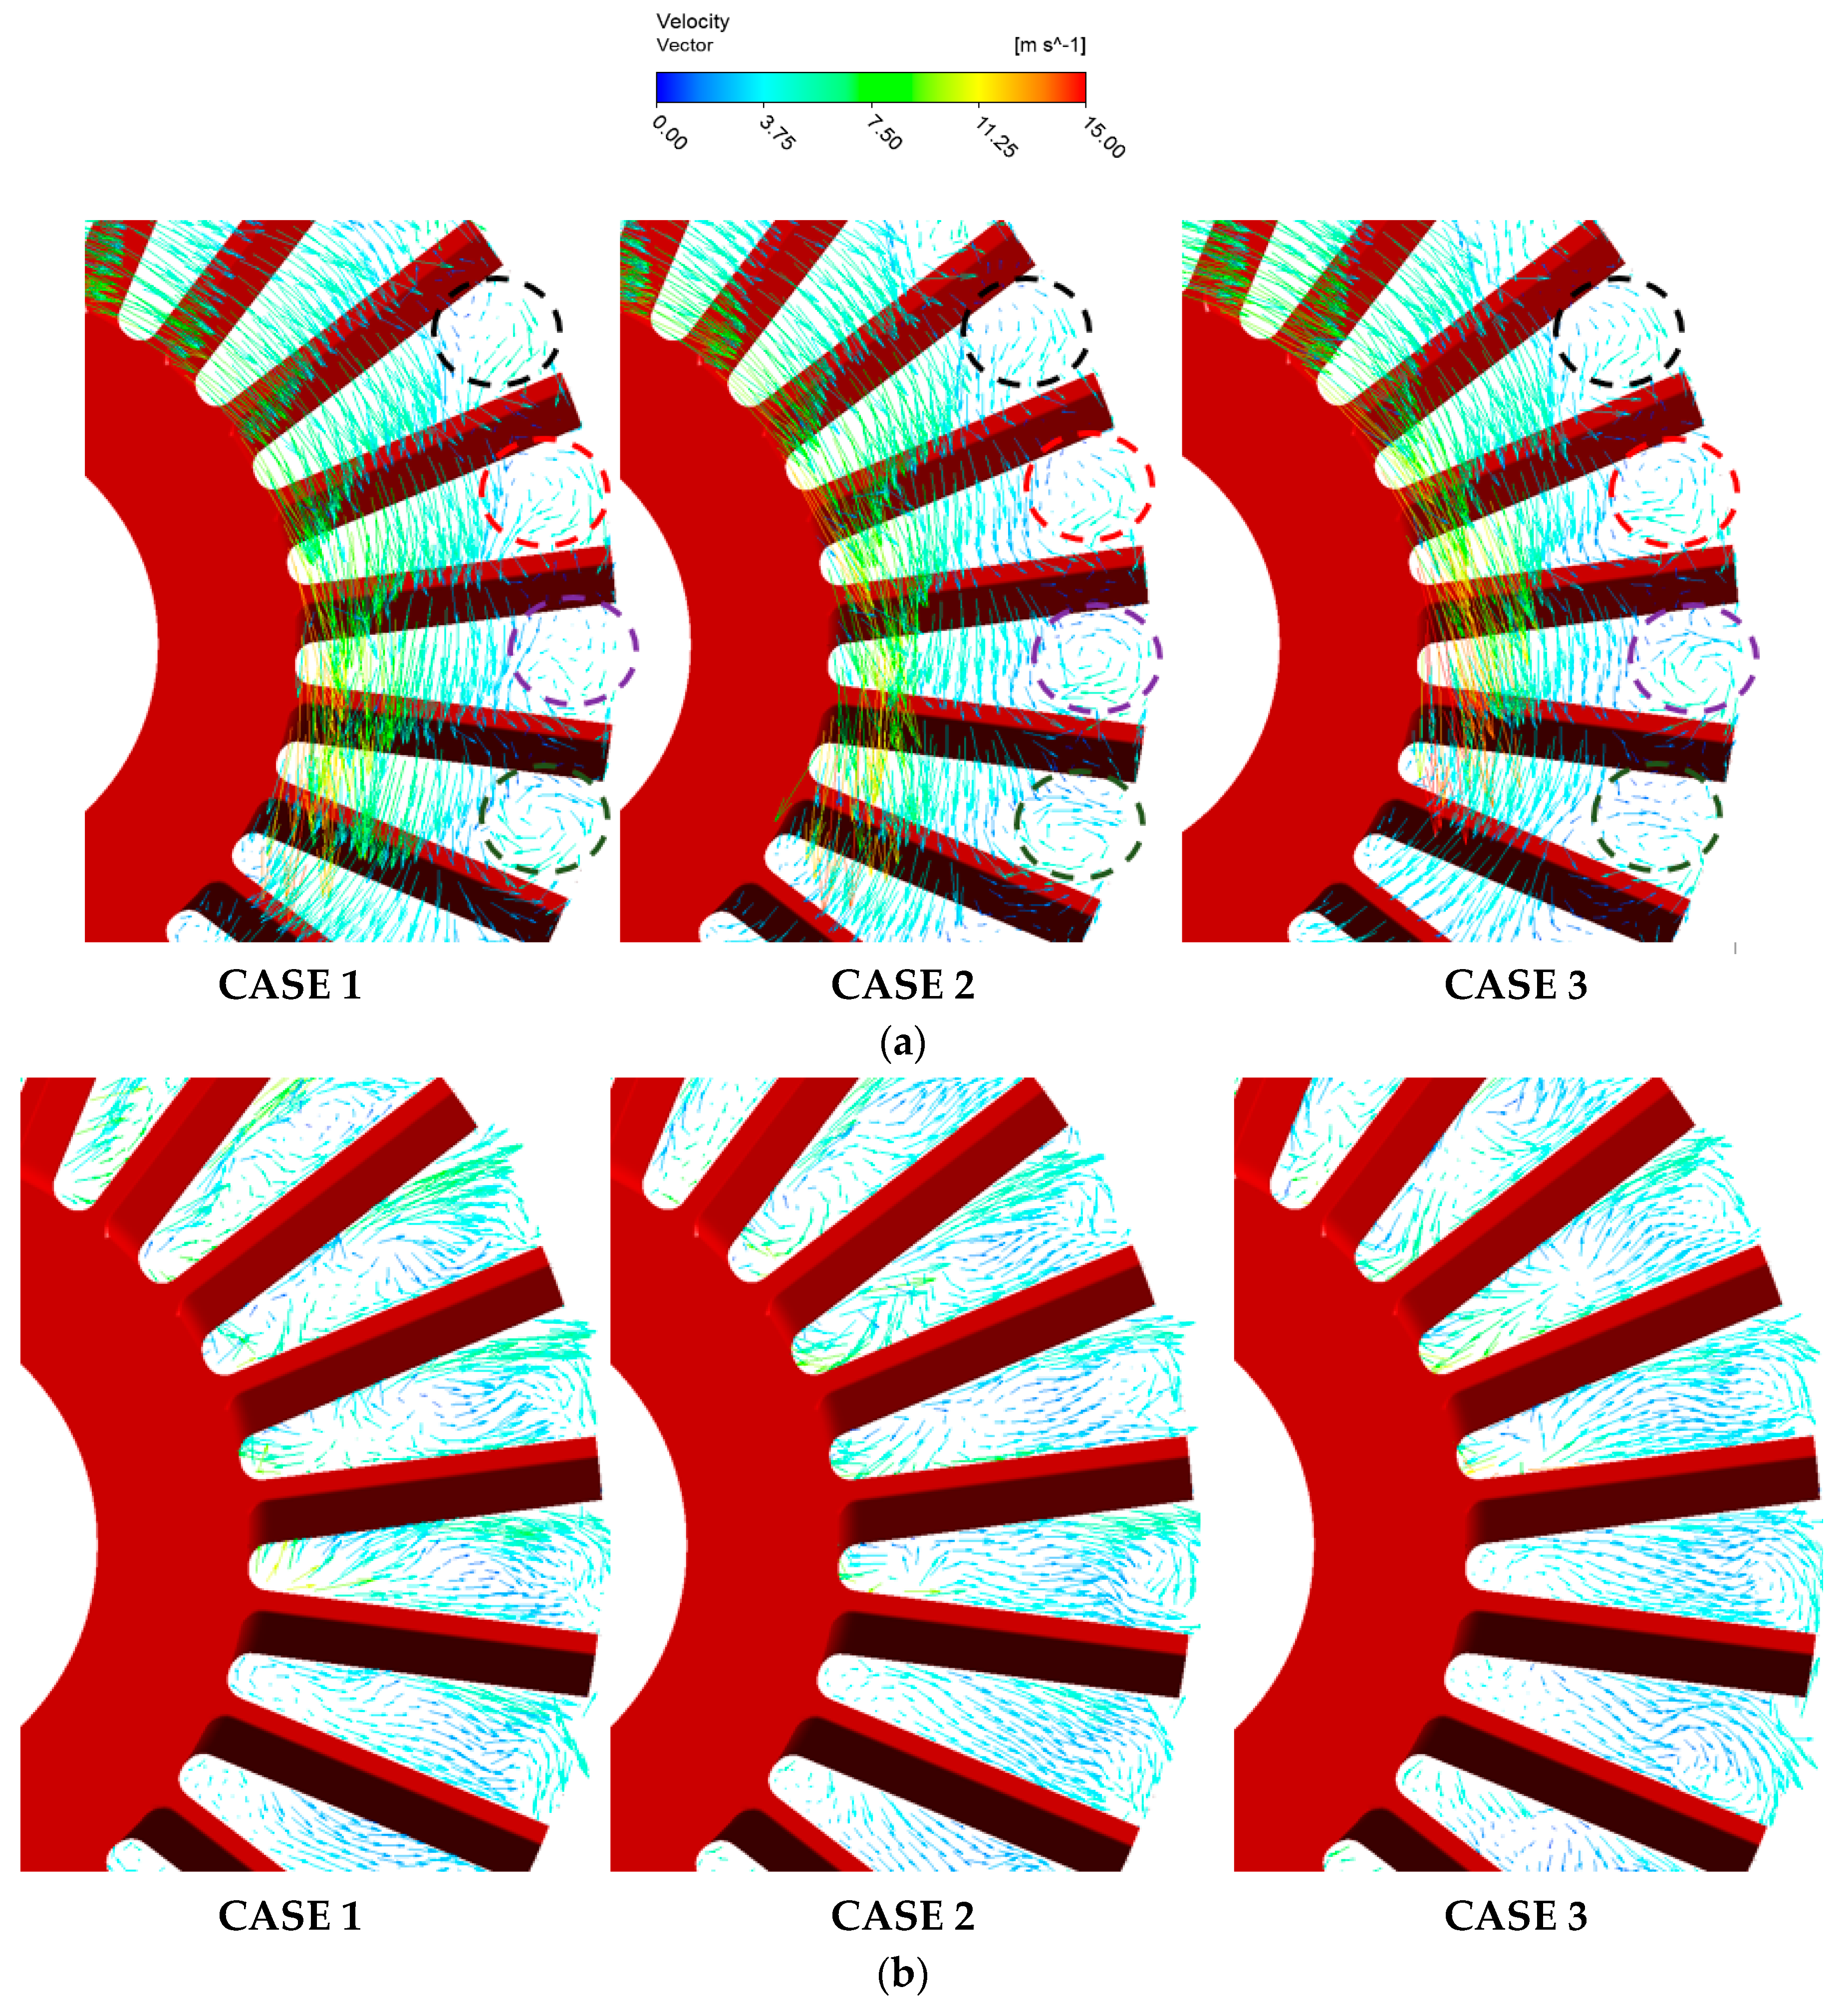

Figure 12.
Velocity vector distribution in impeller and side channel.
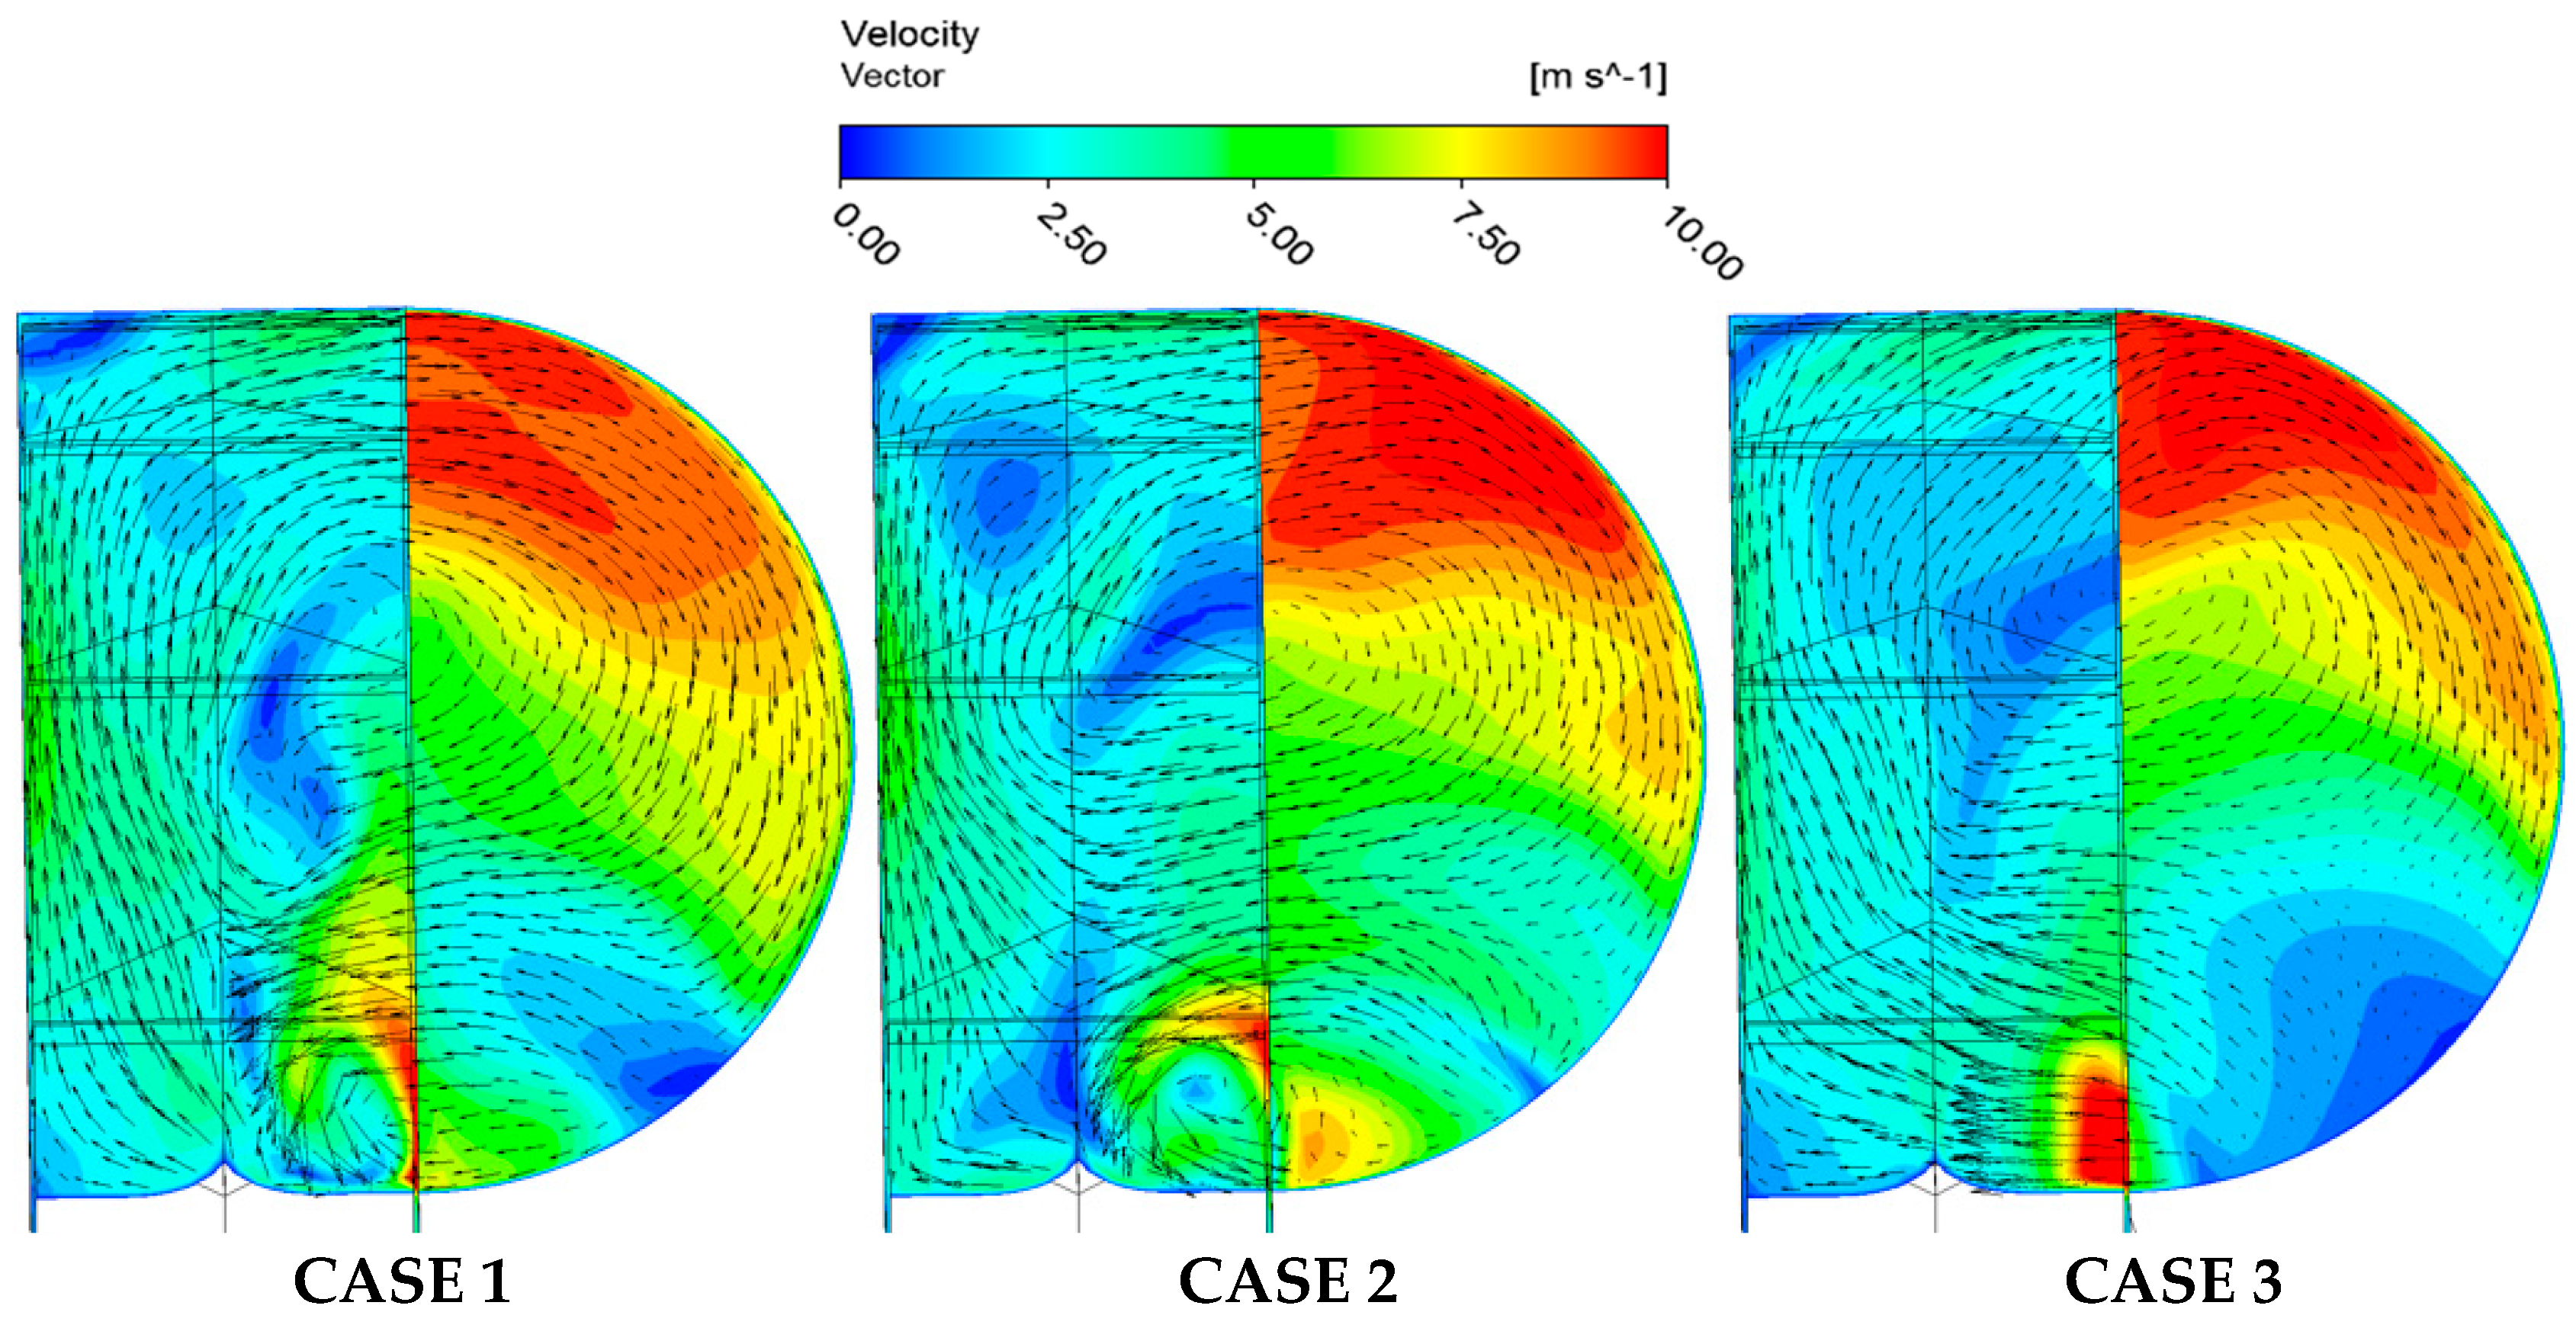
Figure 13.
Experimental setup.
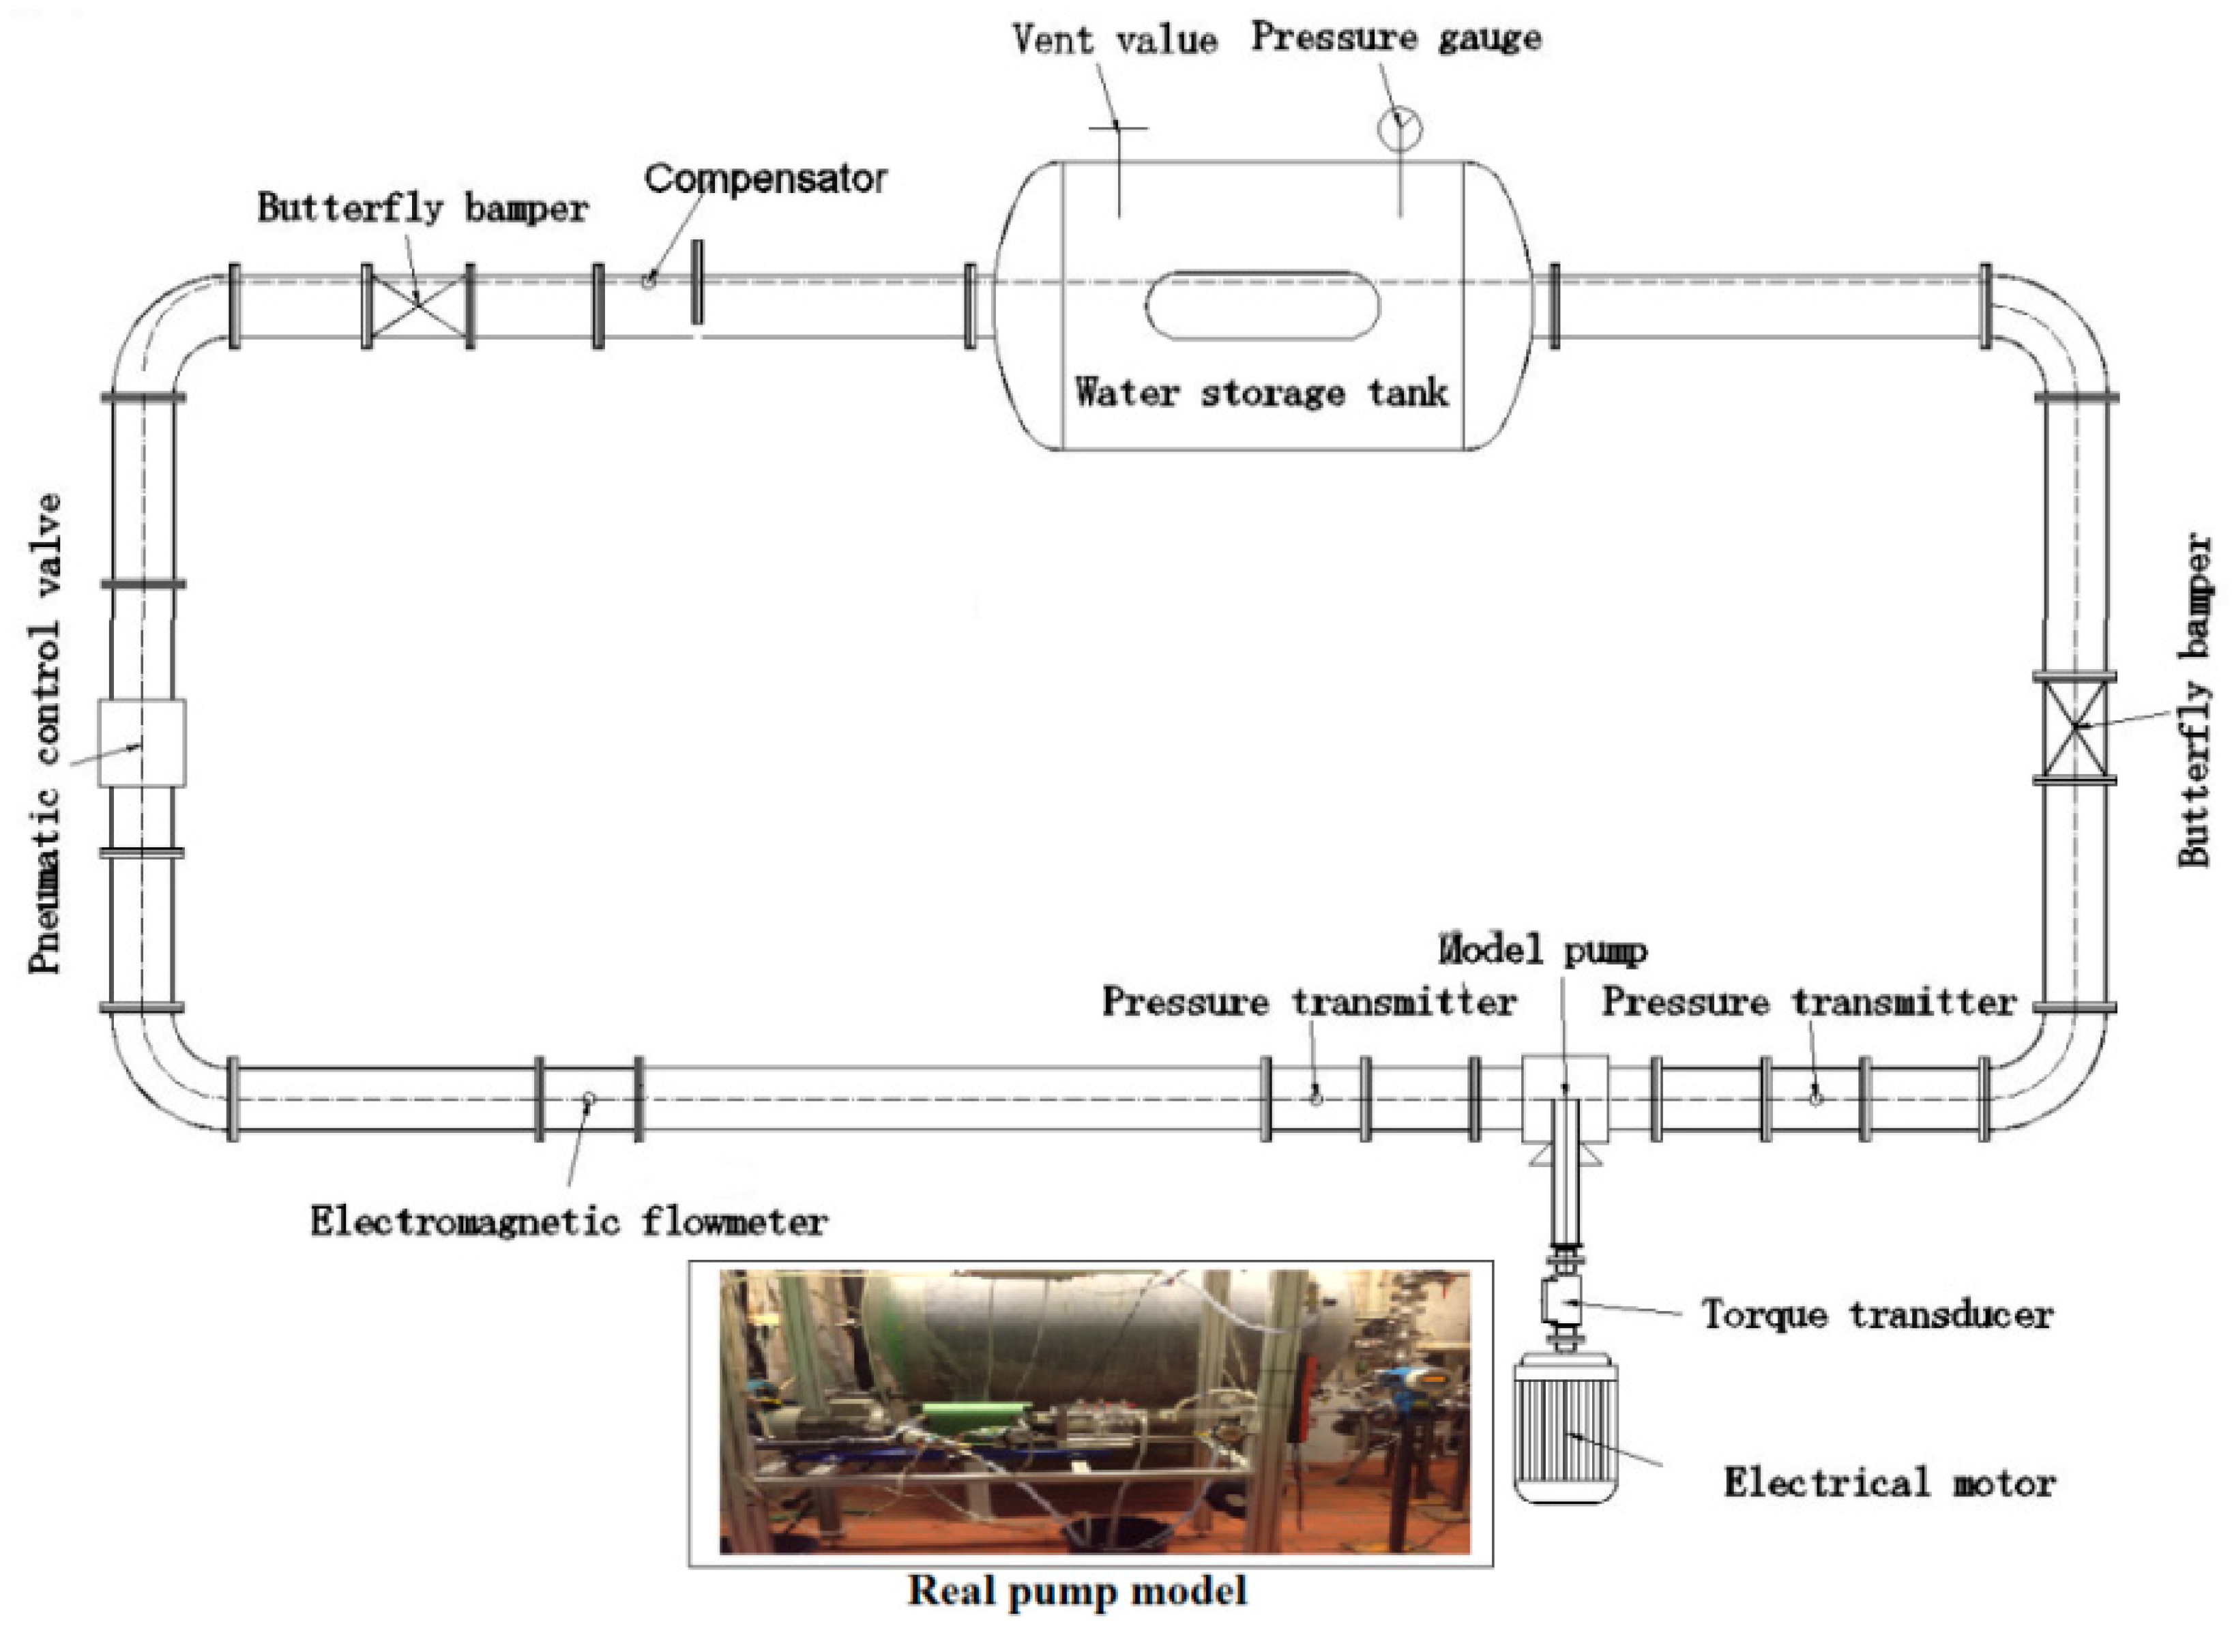
Figure 14.
Hydraulic performance comparison between the experimental data and CFD under pump case 2. (a) efficiency; (b) head coefficient.
Figure 14.
Hydraulic performance comparison between the experimental data and CFD under pump case 2. (a) efficiency; (b) head coefficient.

Figure 15.
Hydraulic performance curves comparison with CFD data. (a) efficiency; (b) head coefficient.
Figure 15.
Hydraulic performance curves comparison with CFD data. (a) efficiency; (b) head coefficient.


Table 1.
Main parameters of pump model.
| Parameter | Value |
|---|---|
| Impeller outer diameter, d2 (mm) | 150 |
| Impeller inner diameter, d1 (mm) | 80 |
| Blade width, w (mm) | 15 |
| Blade thickness, b (mm) | 2 |
| Blade suction angle (°) | 30 |
| Rotational speed, n (r/min) | 1500 |
| Blade number | 24 |
| Radial clearance, σ (mm) | 0.2 |
| Axial clearance, s (mm) | 0.2 |
| Side channel radius, r (mm) | 17.6 |
| Wrapping angle, φ (°) | 15, 30, 45 |
Table 2.
Three different grid numbers for Grid convergence index (GCI).
| Grid | Grid Number (×106) | Head (m) | Grid Convergence Index (GCI) (%) |
|---|---|---|---|
| A | 3.7 | 17.0 | 9.8431 |
| B | 4.0 | 17.9 | 8.3531 |
| C | 4.5 | 18.3 | 1.7957 |
Table 3.
Structured grid data for Grid C.
| Domain | Grid Number (×106) | Grid Quality Criterion | Ave. y+ | ||
|---|---|---|---|---|---|
| Determinant 3 × 3 × 3 | Angle | Aspect Ratio | |||
| Inlet | 0.1 | 0.60–1 | 46.89–89.64 | 1.27–40.1 | 18.54 |
| Impeller | 3.4 | 0.62–1 | 20.62–87.91 | 1.10–23.0 | 34.28 |
| Side channel | 1.0 | 0.57–1 | 37.78–89.90 | 1.28–42.4 | 43.94 |
Table 4.
Exchanged mass flow.
| Pump | Mass Flow-In (kg·s−1) | Mass Flow-In (kg·s−1) |
|---|---|---|
| Case 1 | 13.8438 | −11.0998 |
| Case 2 | 13.1637 | −10.3925 |
| Case 3 | 12.4384 | −9.6593 |
© 2019 by the authors. Licensee MDPI, Basel, Switzerland. This article is an open access article distributed under the terms and conditions of the Creative Commons Attribution (CC BY) license (http://creativecommons.org/licenses/by/4.0/).
Share and Cite
MDPI and ACS Style
Pei, J.; Zhang, F.; Appiah, D.; Hu, B.; Yuan, S.; Chen, K.; Asomani, S.N. Performance Prediction Based on Effects of Wrapping Angle of a Side Channel Pump. Energies 2019, 12, 139. https://doi.org/10.3390/en12010139
AMA Style
Pei J, Zhang F, Appiah D, Hu B, Yuan S, Chen K, Asomani SN. Performance Prediction Based on Effects of Wrapping Angle of a Side Channel Pump. Energies. 2019; 12(1):139. https://doi.org/10.3390/en12010139
Chicago/Turabian StylePei, Ji, Fan Zhang, Desmond Appiah, Bo Hu, Shouqi Yuan, Ke Chen, and Stephen Ntiri Asomani. 2019. "Performance Prediction Based on Effects of Wrapping Angle of a Side Channel Pump" Energies 12, no. 1: 139. https://doi.org/10.3390/en12010139
Note that from the first issue of 2016, this journal uses article numbers instead of page numbers. See further details here.