Research on Key Parameters Operation Range of Central Air Conditioning Based on Binary K-Means and Apriori Algorithm

School of Mechatronic Engineering and Automation, Shanghai University, Shanghai 200072, China
*
Author to whom correspondence should be addressed.
Energies 2019, 12(1), 102; https://doi.org/10.3390/en12010102
Submission received: 26 November 2018
/
Revised: 24 December 2018
/
Accepted: 26 December 2018
/
Published: 29 December 2018
Abstract
:As the energy-saving control of central air conditioning has been widely applied in modern architecture, research of real-time optimal control based on historical data and identification of its optimal control strategies are of great importance for reducing energy wasting of buildings. However, due to the property of easily falling into local optimum, conventional k-means approach cannot achieve the goal of real-time optimal control, we therefore propose an innovative binary k-means clustering algorithm which is used to adjust the target value of temperature difference (TD) in the control system of chilled water and cooling water of central air conditioning system (CACS). Thanks to the clustering control, among the 304 test data, the coefficient of performance (COP) of 211 sets of data, which accounted for 69.41%, are higher than those of the traditional control method. In the simulation system, the COP of 191 sets of data, which accounted for 62.83%, are higher than those of traditional control methods, achieving better energy efficiency. To achieve the goal of identify potential energy-saving control strategies, the Apriori algorithm is proposed to correlate the key parameters and energy consumption efficiency of the CACS. The results show when the chilled water temperature difference (CWTD) > 2.0 °C and the cooling water temperature difference (COWTD) > 2.4 °C, some rules are discovered as follows: 1. The probability of a larger system COP will increase if the CWTD is set lower than the third quartile value or the COWTD is set lower than the first quartile value. 2. The probability of a larger system COP will also increase if the CTWD is set lower than the first quartile and the COWTD is set between the first and the third quartile. These underlying regularity is useful for technicians to adjust the control parameters of the equipment, to improve energy efficiency and to reduce energy consumption.
1. Introduction
In recent years, with the popularization of central air conditioning in modern buildings, energy-saving control of central air conditioning has been the focus of research. Studies have pointed out that using advanced control technology can save more than 20% of energy output [1]. During the exploration process, a large amount of central air conditioning data has been stored in the CACS. The large amount of data stored in the CACS cannot be utilized with traditional data analysis methods because of the variety of data structures in their subsystems [2]. However, DM is believed to be a powerful tool to learn the underlying regularity in large dataset [3]. Energy-saving methods can be found [4] through the advanced DM methods on the operational data of the CACS [5]. The major DM practices in energy-saving are as follows: finding patterns, associations or relationships [6], building prediction models [7], diagnostics and tuning controllers. Studies of DM has been applied on energy-saving optimization of CACS. Yu found the energy wasting and equipment failures in CACS by the relevance and rules summarized from comparing the data obtained in two years [8]. Hou proposed the application of DM combined with rough set methods and artificial neural network methods on the fault detection and diagnosis of Heating, Ventilating and Air Conditioning (HVAC) sensors [9]. Z Zhao proposed a data processing algorithm combining Kalman filtering with particle swarm optimization, which can compensate for uncertain factors and disturbances of data collected, establish the nonlinear variation trend database and achieve the purpose of energy-saving control of air-conditioning systems [10]. Z Wang proposed a neural network model on air handling unit (AHU) through data preprocessing and correlation analysis, and made it as a method to identify the relationship between air temperature (AT) and other variables of the CACS [11]. Chen proposed a solution to achieve the goal of intelligentization of air-conditioning products, digitization of enterprise operations and extreme user experience. This method mainly uses supervised learning algorithms such as decision trees and support vector machines, and unsupervised learning algorithms such as cluster analysis and association rule analysis [12]. J Wang proposed a method to achieve better building energy efficiency. It is a method that can be used to reveal hidden knowledge of event-driven optimization mass datasets in CACS [13]. E Malyavina proposed a method that aimed at determining thermal, electric power and water consumption during a year. The method takes the operation of CACS in different hours of the day into account and optimizes the inflow air treatment pattern on the basis of power input minimization [14].
The research on air-conditioning energy-saving control mainly focus on two directions: data optimization for the control process of traditional control methods and discovery of potential control strategies. Applying data mining method to parameter control of central air conditioning directly is rarely explored in current research. Research of this paper makes it possible to apply data mining methods to the control link in energy-saving control, which is innovative compared to others.
This paper is to apply in-depth data mining (DM) in the data obtained in the operation of CACS in order to achieve the key operating control parameters of the CACS and discover energy-saving rules hidden in CACS. The structure of the paper is organized as follows. Section 2 introduces the central air conditioning system as well as the data source and data mining process in this paper. Section 3 describes the data mining methods and experimental scenarios. Section 4 shows the results of the data mining and Section 5 analyzes the data mining results obtained in this paper. In the last section, this article is summarized.
2. CACS
2.1. Architecture of CACS
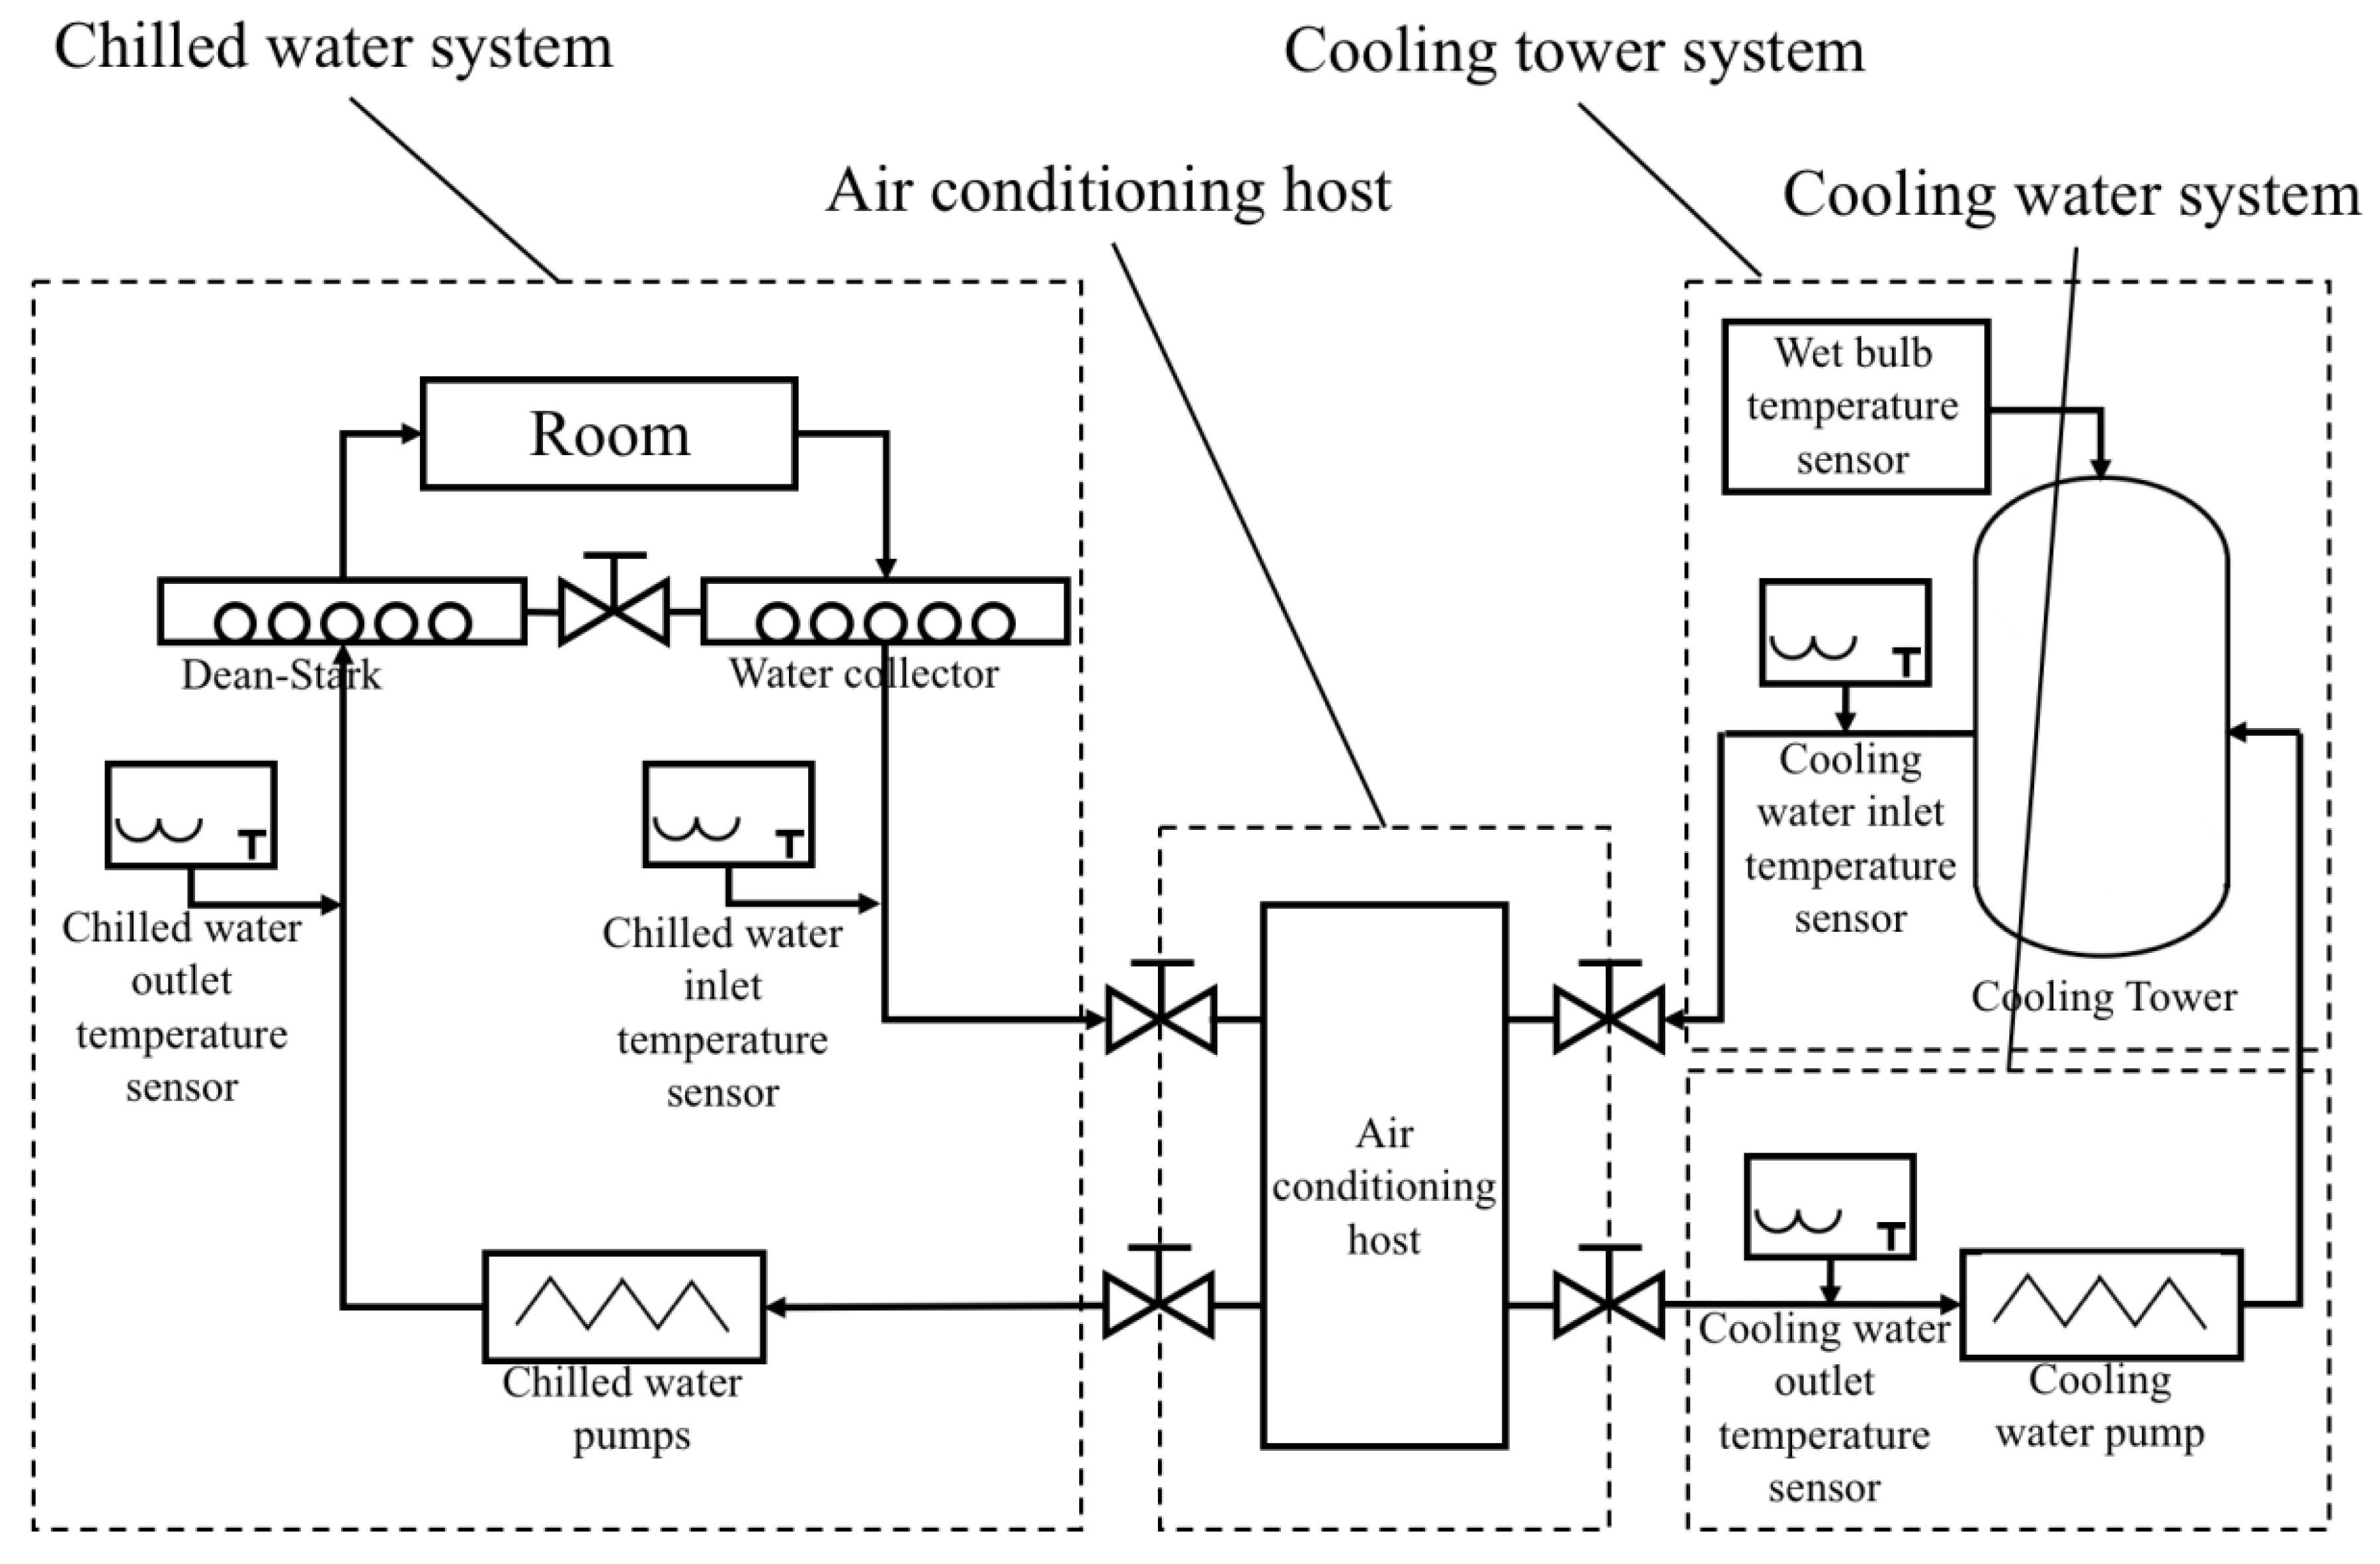
The data are collected from the CACS. Figure 1 shows the structure of the CACS, which consists of four parts: air-conditioning host module, chilled water module, cooling water module, and cooling tower module. The chiller unit uses the PLC to collect signals, control the chilling operation and monitor the chilling operation. Industrial computer is used as the core processor of the entire acquisition control system and touch screen is used as the control devices for terminal parameter acquisition. RS485 converters and Ethernet protocols are used for data transmission. Various types of sensors are used to measure the operating parameters of the chiller in the system, which including chiller current, electric power, electricity consumption, chilled water supply and return water temperature, cooling inlet and outlet water temperature, operating frequency, and wet bulb temperature transmitter.
The screw refrigeration unit (WCFX77NN, DUNHAM-BUSH Ltd., Hartford, CT, USA), chilled water pump (YE3-280S-2-75kW, Shanghai Donghai Electrical and Mechanical Technology Co., Ltd., Shanghai, China) and cooling water pump (YE3-280S-2-75kW, Shanghai Donghai Electrical and Mechanical Technology Co., Ltd., Shanghai, China) are used in the system. The model of the electric energy meter is ACR330ELH (ACR330ELH, Acrel Electric Co., Ltd. Jiangyin, China). Data measurement sensors include (1) CNIK300 multifunction energy meter (CNIK300, YIKO Instrument Co., Ltd. Wenzhou, China) with energy pulse output and RS485 communication. (2) Temperature transmitters (SBW, Shanghai Miaodi Instrument Co., Ltd. Shanghai, China) are used to measure water temperature of chilled water supply, return water temperature, cooling water return, and outlet water temperature. (3) Wet bulb temperature transmitter (EPOW004001, ECOA Technologies Ltd. Chinese Taipei) with function of modbus communication. Data measured by each sensor is stored in the MySQL (Community Edition 5.7) by the data collection module of the central air conditioning backstage.
2.2. Operation Data
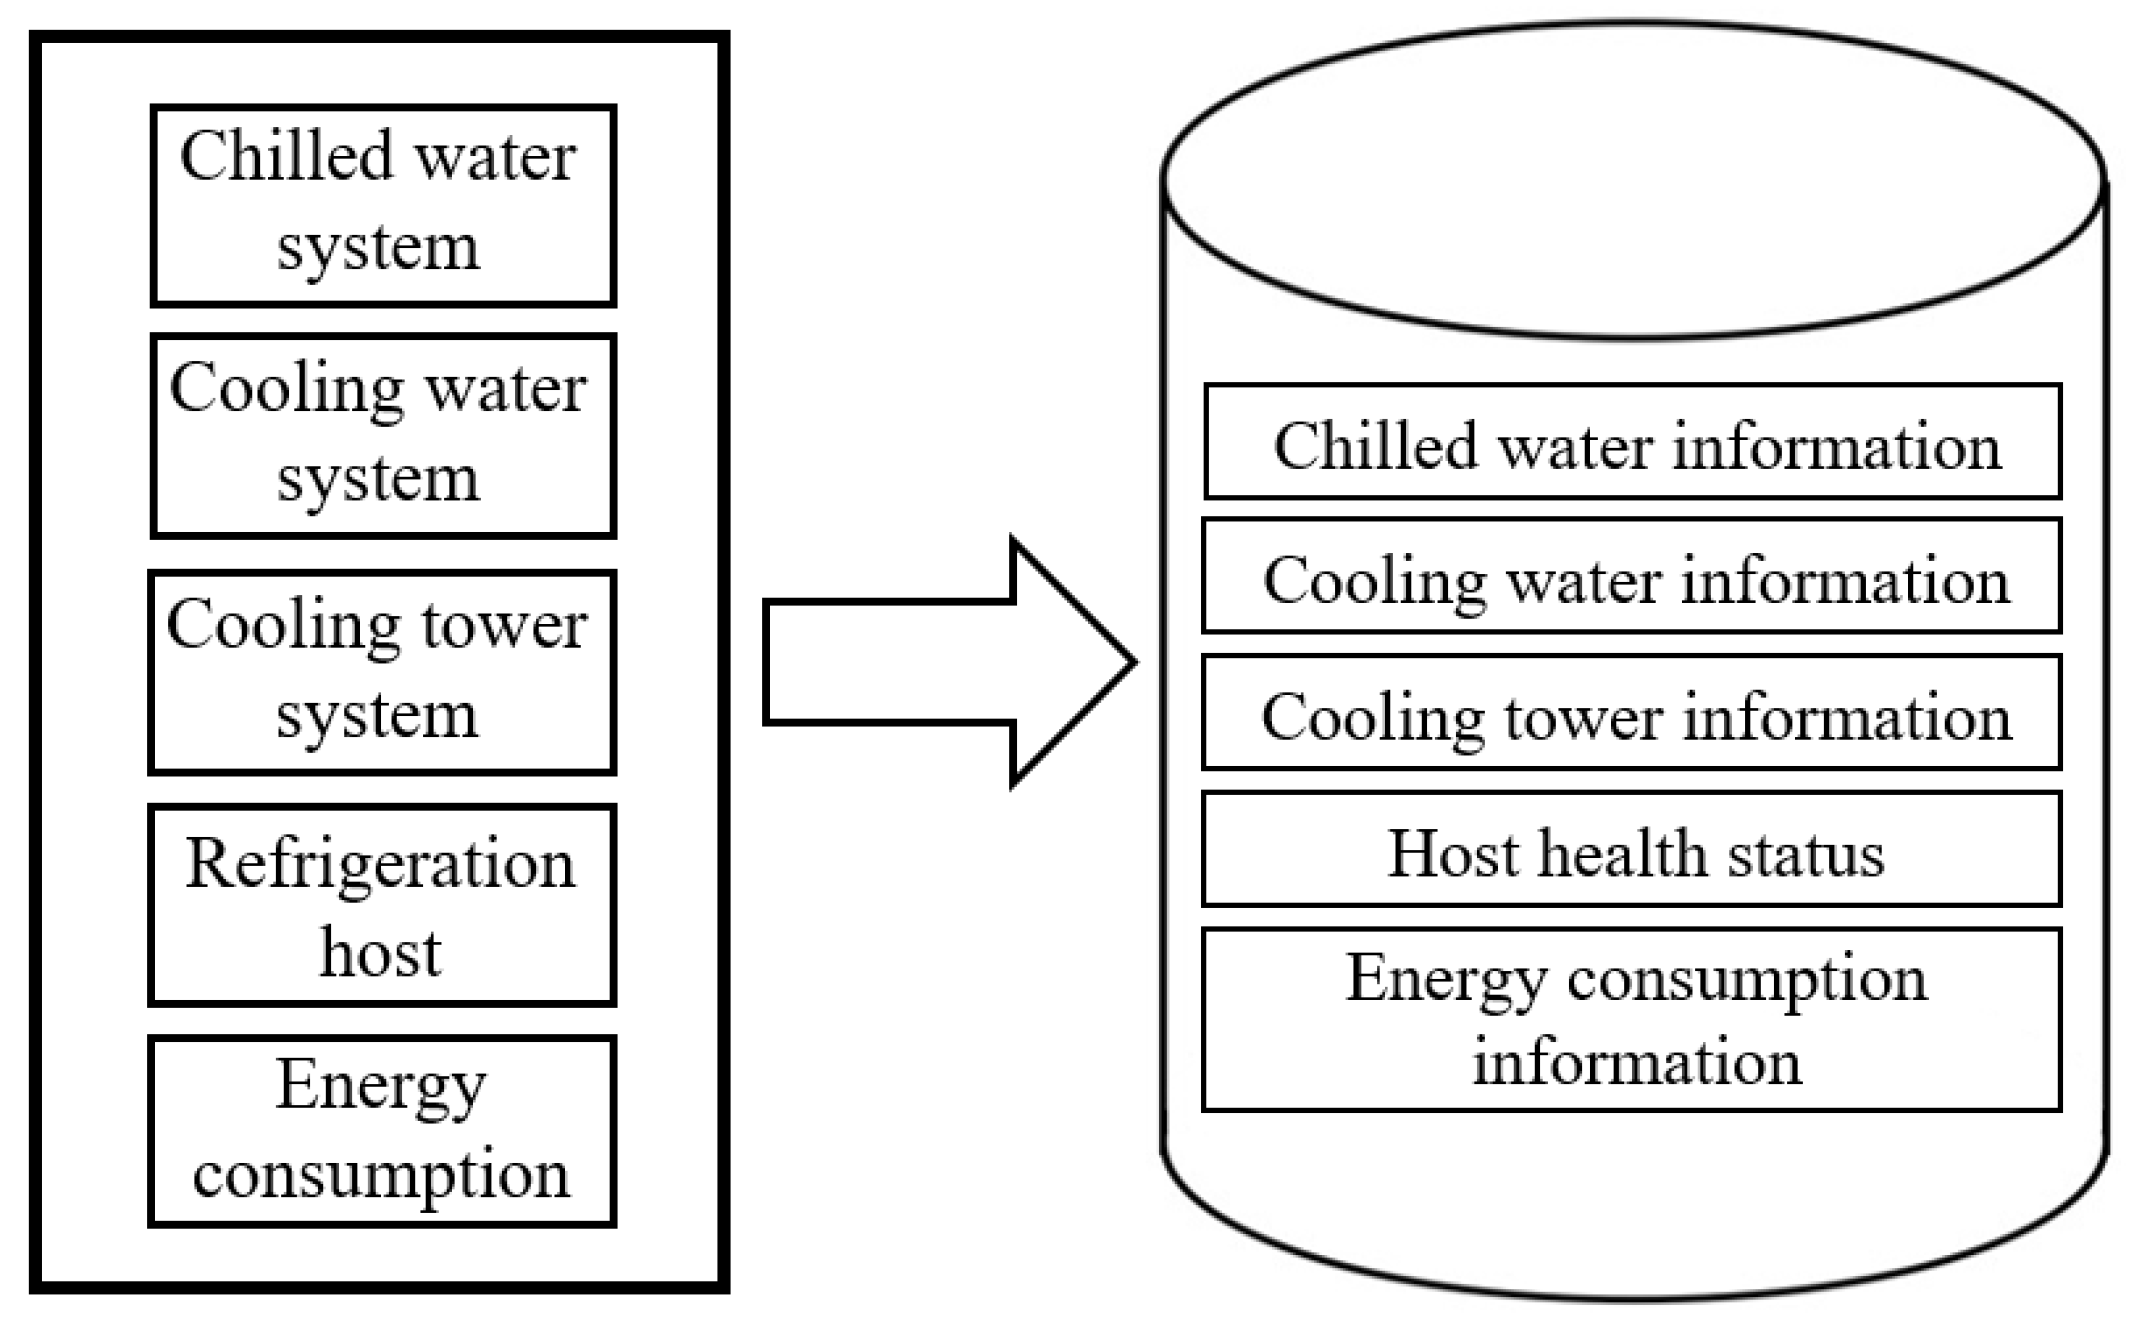
Large amount of central air conditioning data are stored in the CACS. As demonstrated in Figure 2, the CACS operating data are usually generated by chilled water system, cooling water system, cooling tower system, refrigeration host and energy consumption.
- (1)
- Chilled water system: The data include parameters of chilled inlet water temperature, chilled outlet water temperature, chilled water pump frequency, chilled water pump flux, chilled water pump power and cooling capacity.
- (2)
- Cooling water system: The data include parameters of cooling inlet water temperature, outlet water temperature, cooling water pump frequency, cooling water pump flow and cooling water pump power.
- (3)
- Cooling tower system: The data include parameters of inverter frequency, cooling tower outlet water temperature, cooling tower inlet water temperature, outdoor wet bulb temperature, outdoor AT, outdoor relative humidity and cooling tower power.
- (4)
- Refrigeration host system: The data include parameters of host operating conditions, fault alarm conditions, power, the given capacity of compressor and the current capacity of compressor.
- (5)
- Energy consumption: The data include parameters of host energy consumption, energy consumption of chilled water pump, energy consumption of cooling water pump, energy consumption of cooling tower, total energy consumption of the system, and system COP value.
2.3. Data Analysis Process
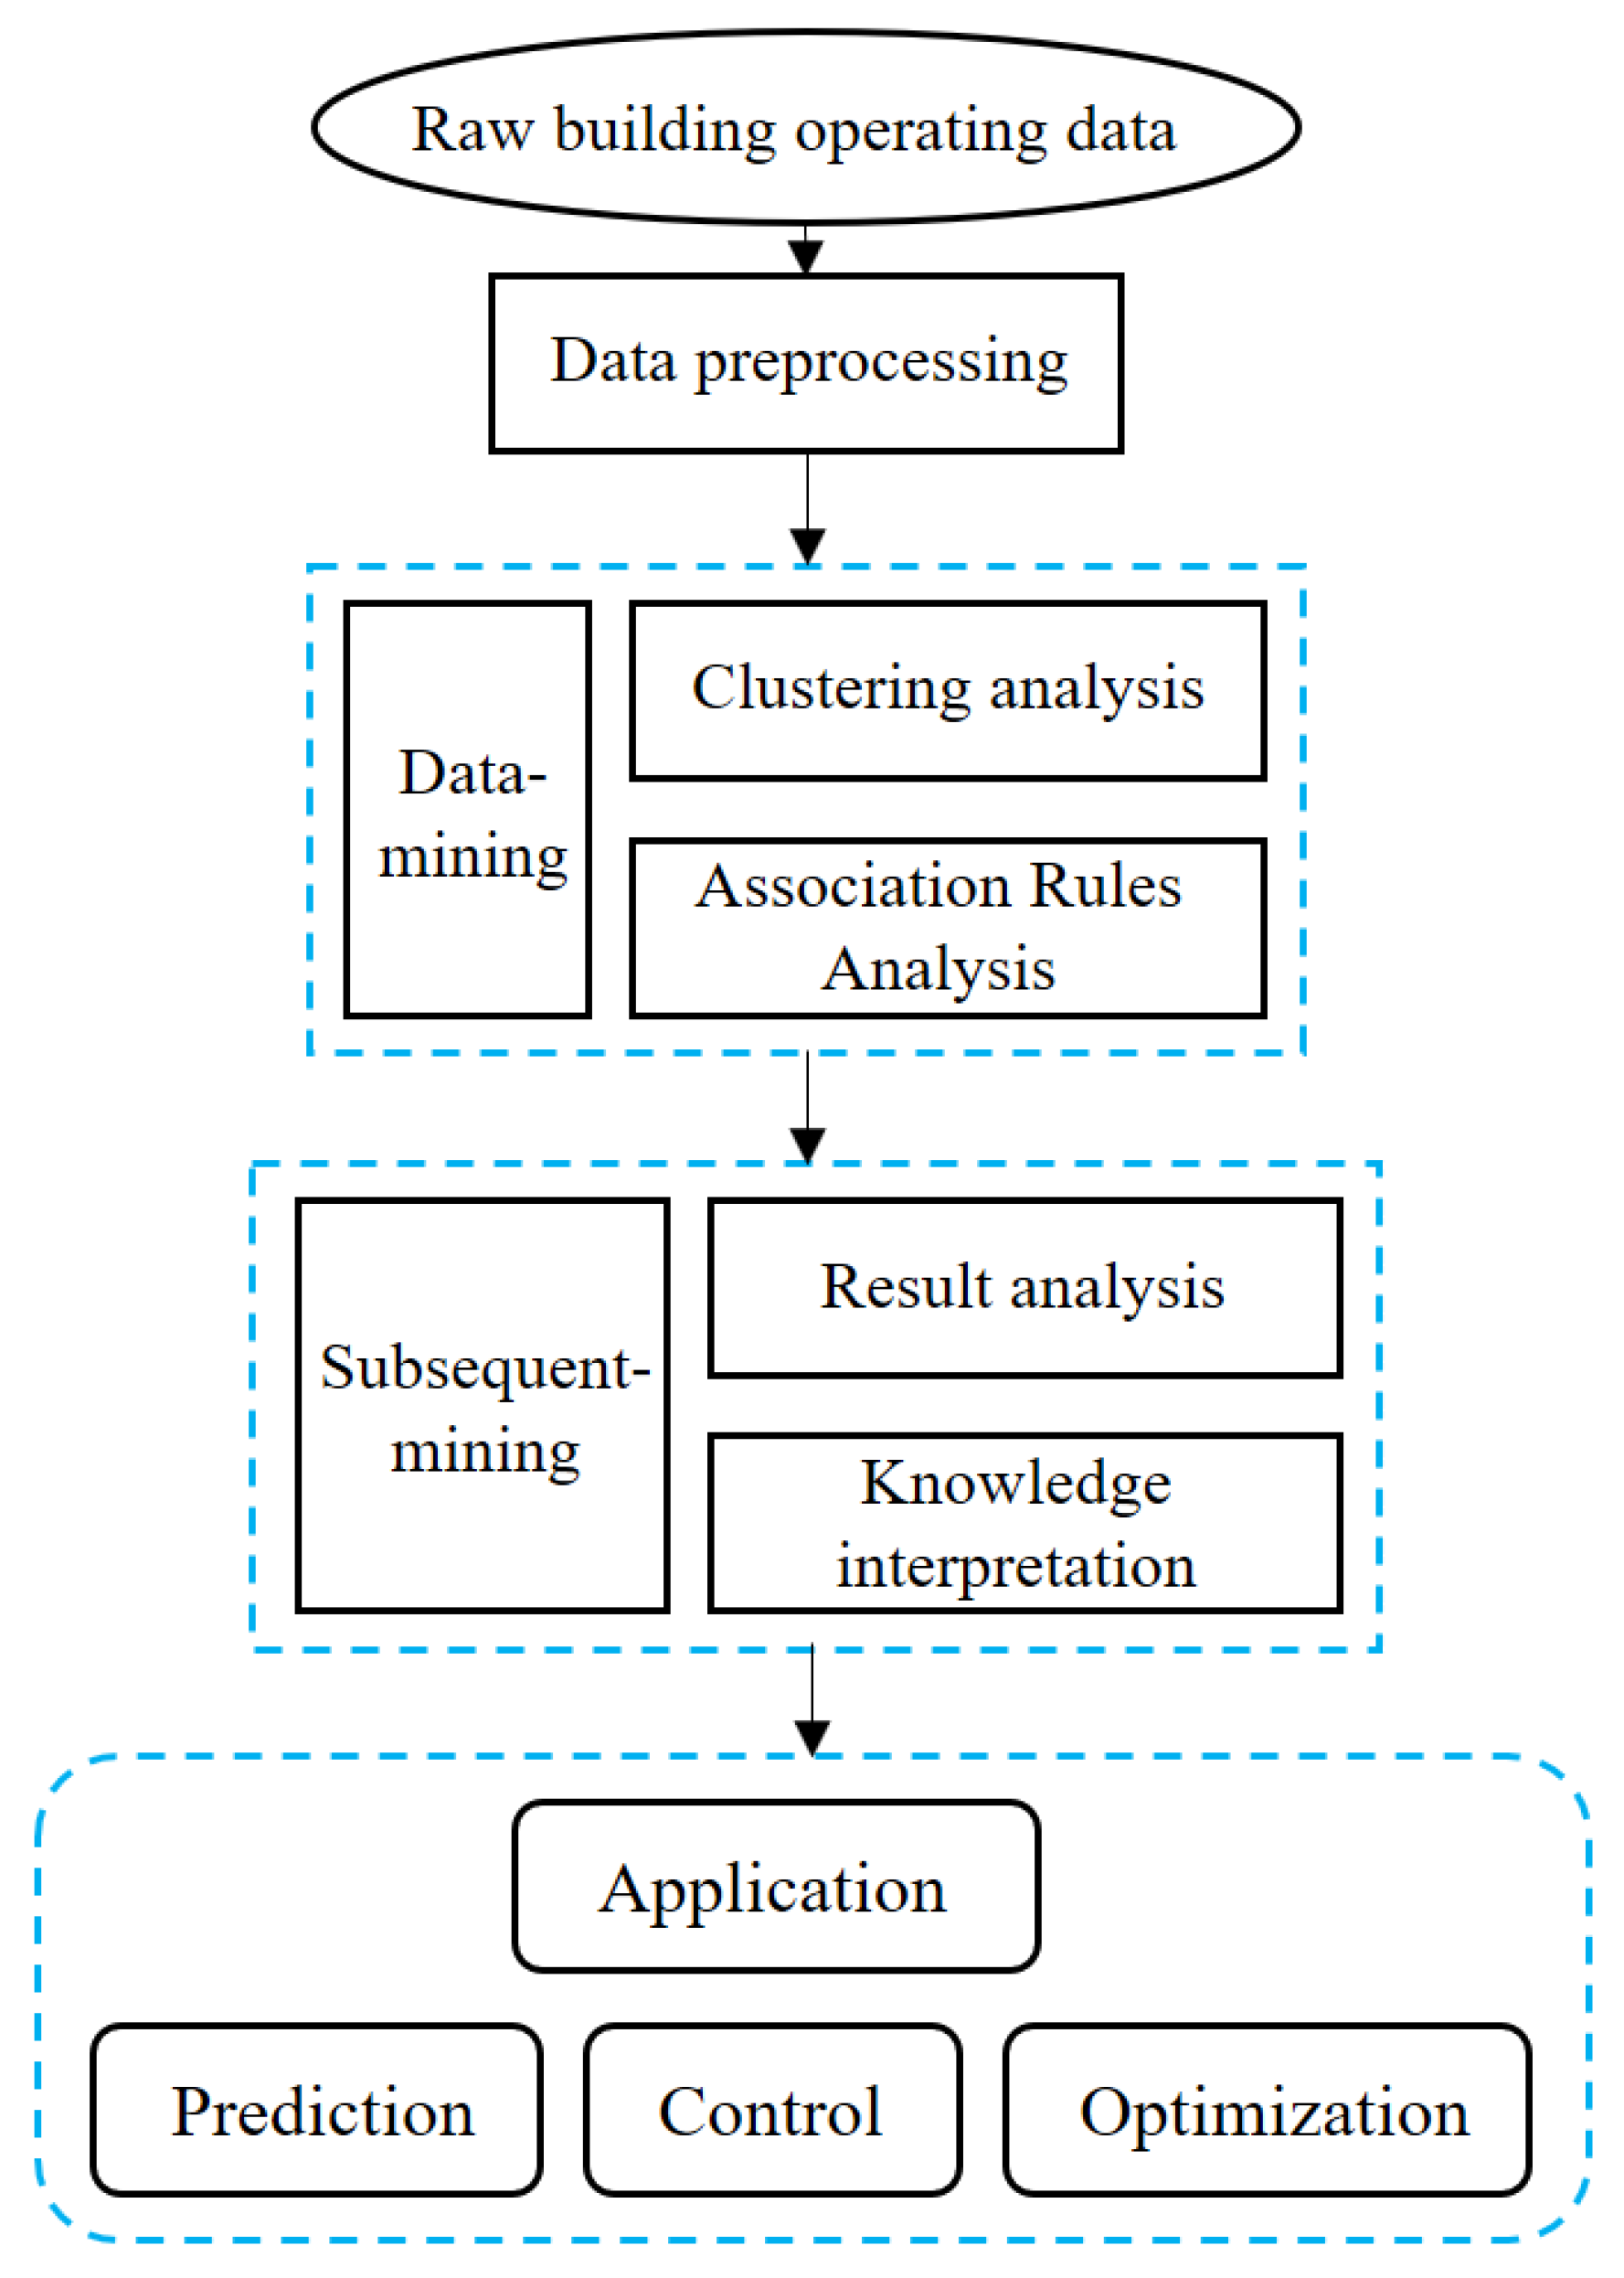
Figure 3 shows the data analysis process of CACS. The process consists of data preprocessing, DM and subsequent processing. Data need to be preprocessed before DM because some original data might be missing, inconsistent and erroneous. Each step in the preprocessing section can be accomplished by conventional methods, including format conversion, cleaning and screening of the raw data. As shown in Table 1. The preprocessing consists of data cleaning, data standardization, and data conversion. Data cleansing is the process of removing outliers, inconsistent values, and incorrect values from the original data. Methods for handling data loss include moving averages, discarding processing and interpolation. Data outlier detection includes graphic-displayed method, model-based method or a combination of both. Data standardization is the normalization of data collected by different standards in different statistical periods [15]. The normalization methods mainly include Max-min normalization, Z-score normalization and decimal scaling normalization. Data collected by different standards in different statistical periods can be integrated and processed after data normalization. Removing objects that are noisy is an important goal of data cleaning as noise hinders most types of data analysis. Noise removal and format conversion are also important in enhancing data analysis. Preprocessing methods include but not limited to the methods mentioned above, suitable method can be selected accordingly to specific preprocessing purpose.
In this paper, the data is first taken out of the database and format the data, numeric classes are converted to float type and time classes are converted to string type. Second, populate single missing value with interpolation and neglect processing of consecutive missing values to ensure data integrity and accuracy. Last, clean out the out-of-range outliers (e.g., abnormal COP values) and save the data to the list. Data preprocessing of the association takes one more step. The data needs to be classified according to the quartiles after the data is cleaned. And then save the data categories in new list.
A subsequent processing method that can illustrate the underlying regularity of the DM results is proposed in this paper. Although useful information can be obtained from massive data by algorithms, it cannot be used in practical application. The amount of information obtained by DM is massive but it does not have any practical value before being summarized and combined with a specific research field by professional researchers.
3. Methods
3.1. Binary K-Means Clustering Algorithm
The k-means algorithm is a hard clustering algorithm and is a typical representative of a prototype-based objective function clustering. It is an objective function that takes the distance between data points and the prototype as optimization [16]. The adjustment rules of the iterative operation are obtained through finding the extremum of the function. The k-means algorithm uses Euclidean distance as a measure of similarity. It minimizes the evaluation index J by finding the optimal classification of an initial cluster center vector V [17]. The algorithm adopts the sum of squared errors criterion function as clustering criterion. In the k-means algorithm, an initial partition is determined first based on the initial cluster center, and then the initial partition is optimized [18]. The clustering algorithm aims to maximize the similarity of samples in the same group and minimize the similarities between groups. K-means clustering is a simple and effective algorithm in various clustering methods. It can divide n observations into k clusters measured by Euclidean distances.
For a given sample and Equation (1) is the Minkowski distance. When p = 2, it is the Euclidean distance. K-means clustering considers the Euclidean distance data. The objective function of clustering is the sum of squared errors (SSE), as shown in Equation (2).
where . is the number of cluster centers, is the center , and is the Euclidean distance. Solve the centroid and find the minimum value of Equation (2). Let = 0, can be solved by Equation (3). The result is shown in Equation (4). The best center of mass for SSE to reach the minimum value is the average of the midpoints of the cluster.
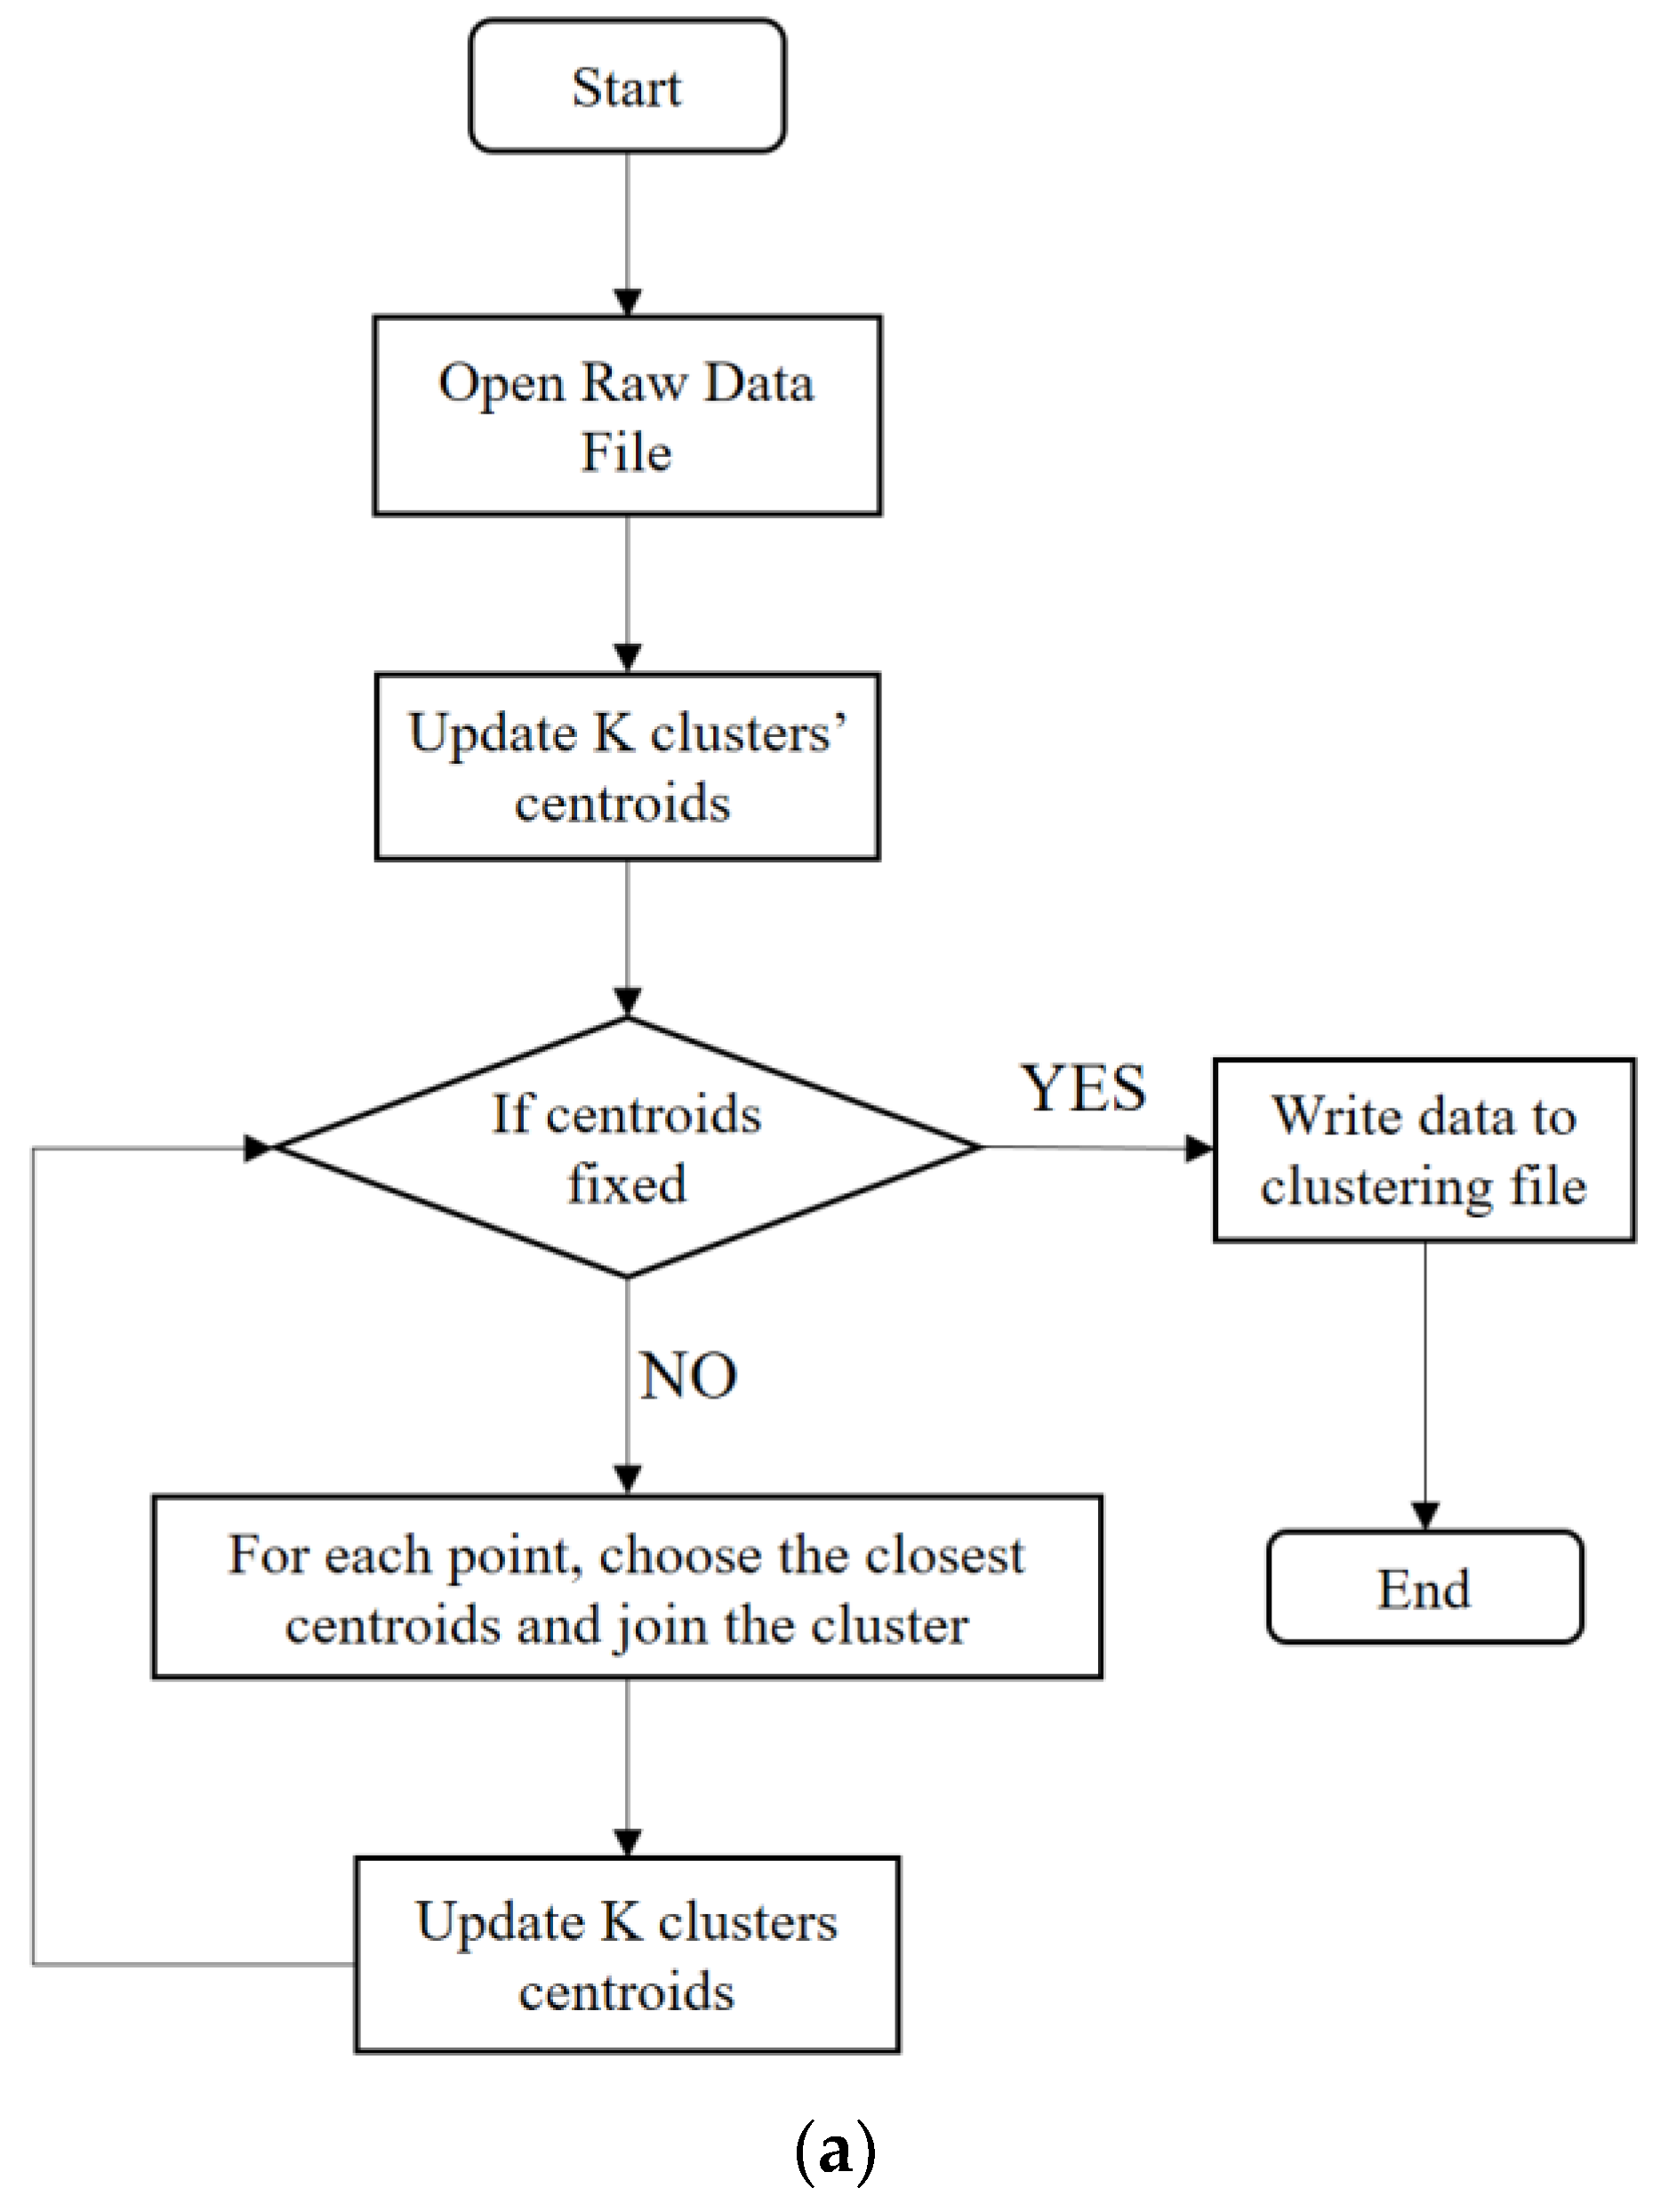
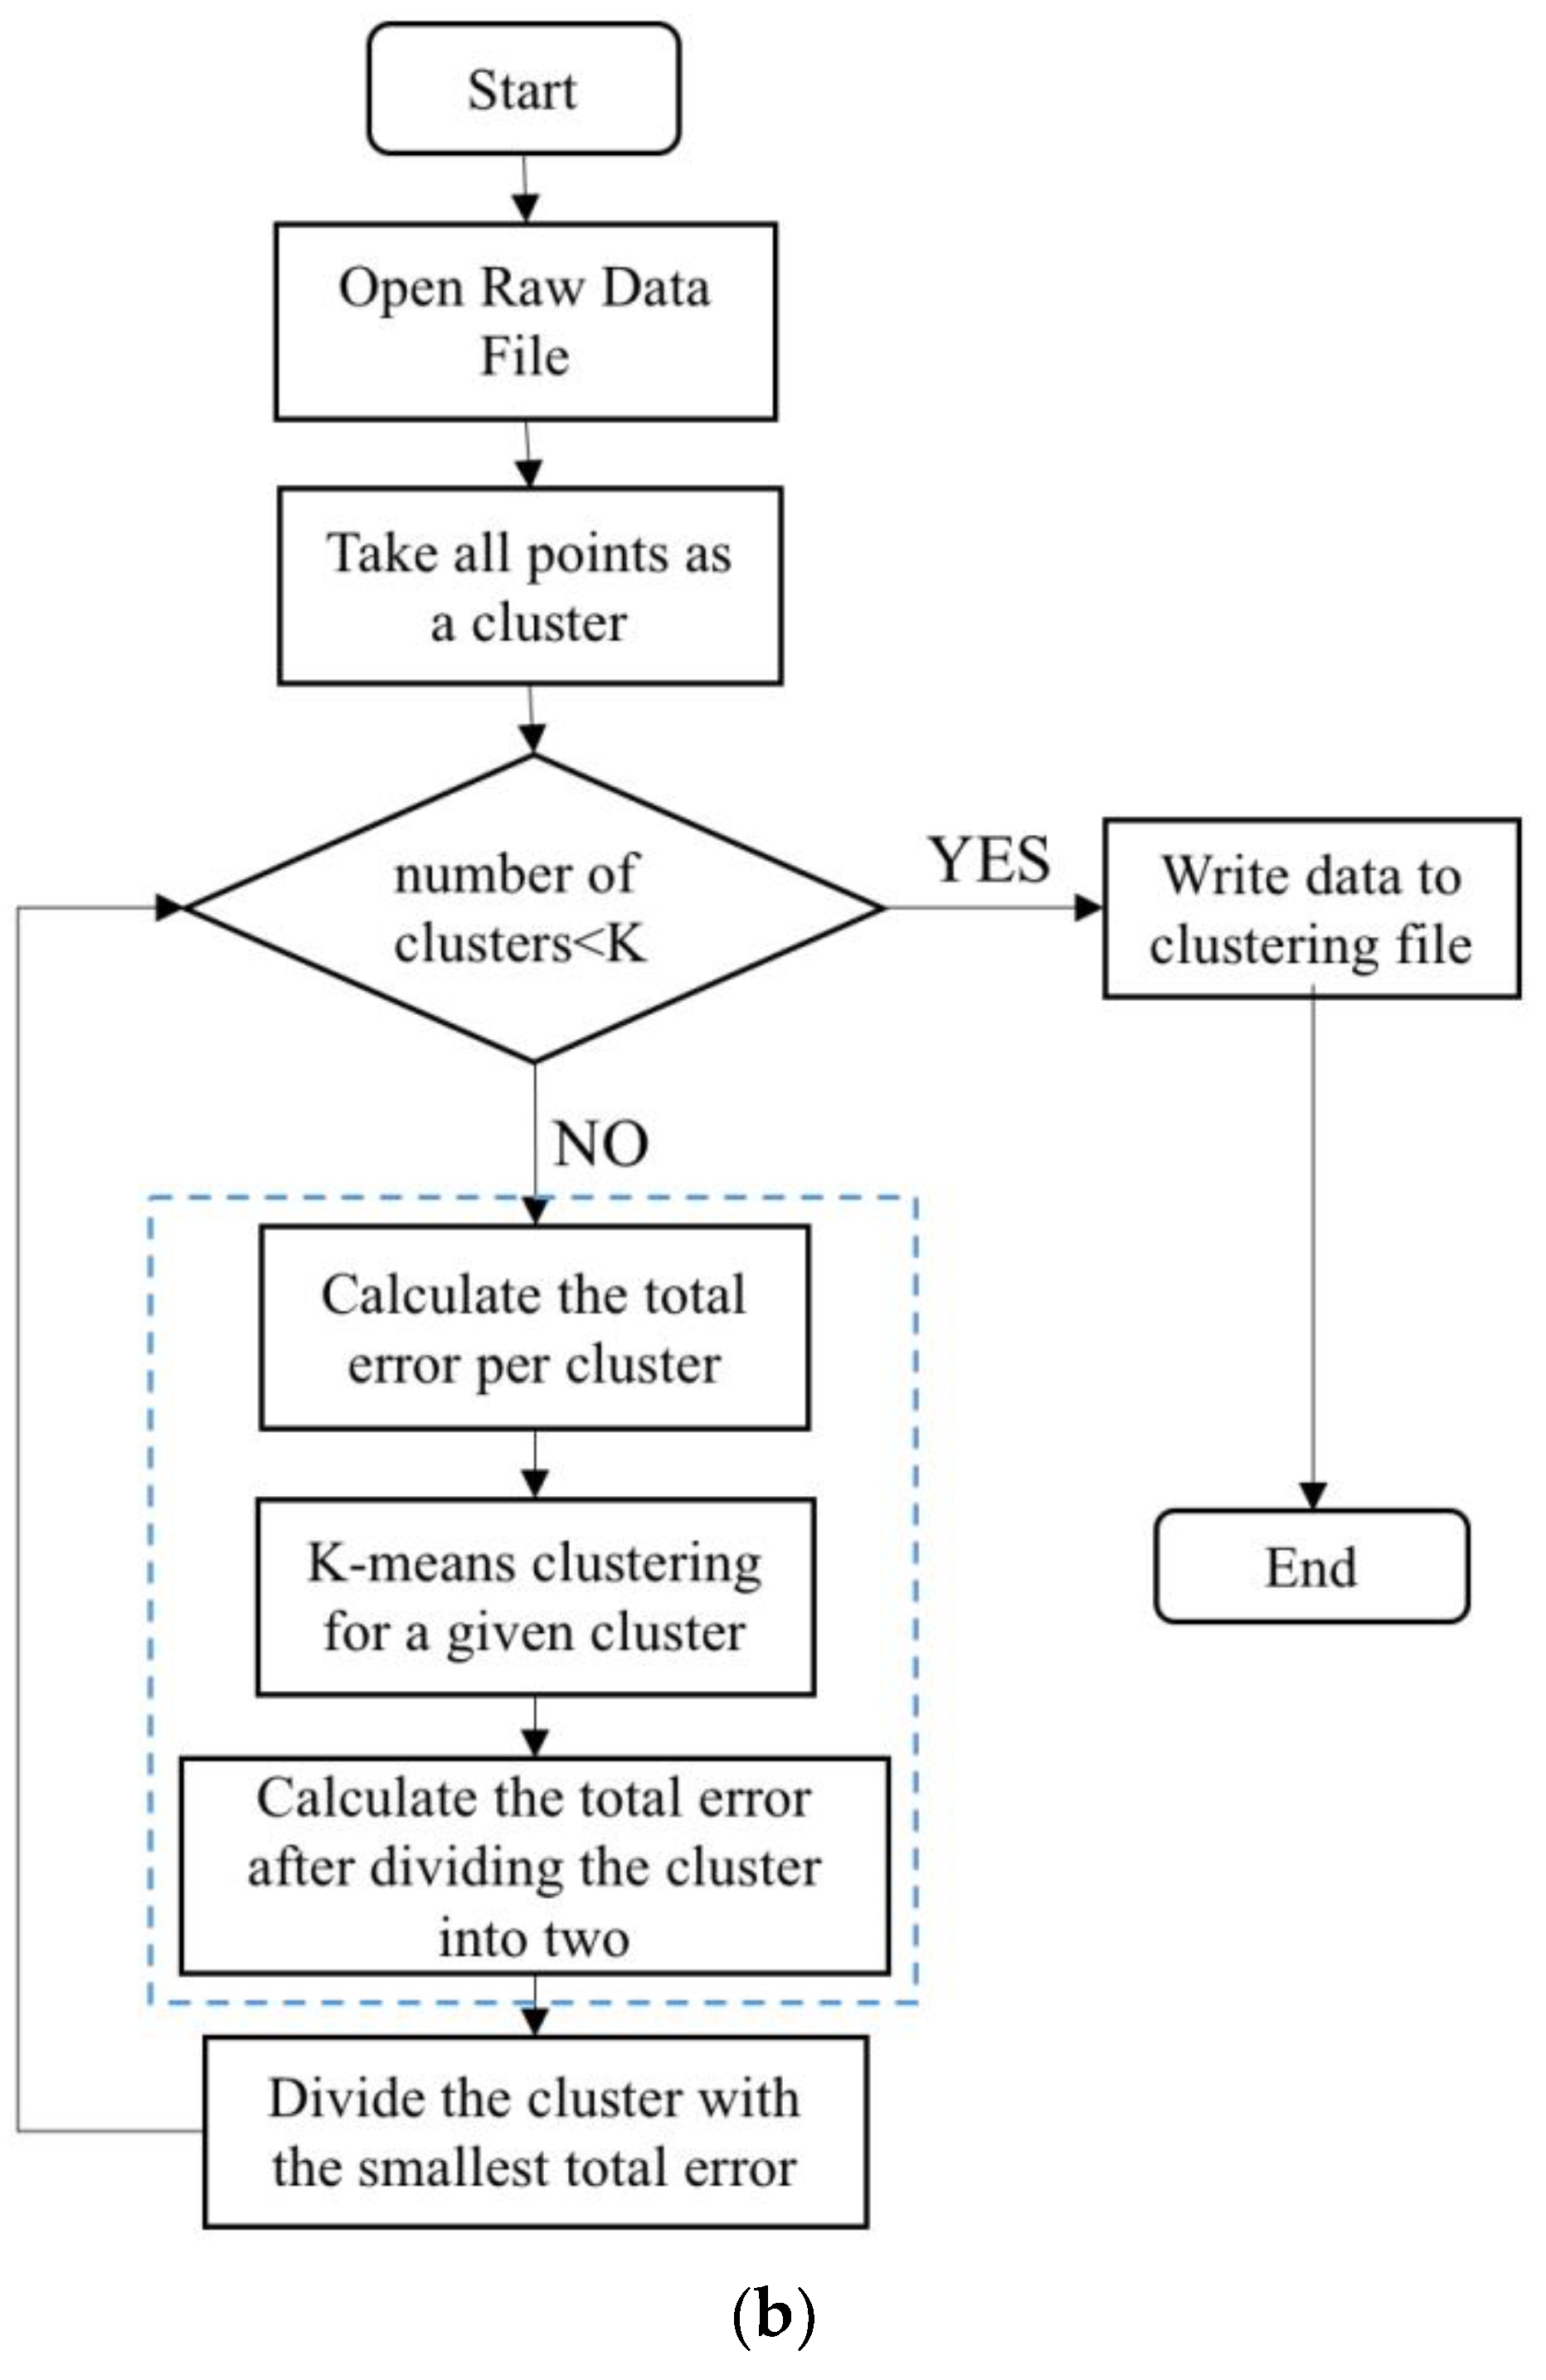
The choice of the initial cluster center has a great impact on the clustering results in k-means clustering. Effective clustering results may be difficult to obtain if the initial value selection is unreasonable. Thus, in order to avoid the algorithm falling into a local optimum during the analysis of the case, this paper uses an improved algorithm called binary k-means clustering. In the binary k-means clustering, the SSE value is judged first, and then the samples are clustered until the k clusters are achieved. Figure 4a,b illustrates the algorithm flow diagrams of the k-means and the binary k-means clustering algorithm. The binary k-means algorithm takes all points as one cluster first, then divides this cluster into two and selects one of the clusters to continue the division process. The cluster that would be selected depends on whether the partitioning of this cluster can minimize the value of the SSE. The whole process is repeated till the number of clusters specified by the user is obtained.
3.2. Apriori Association Algorithm
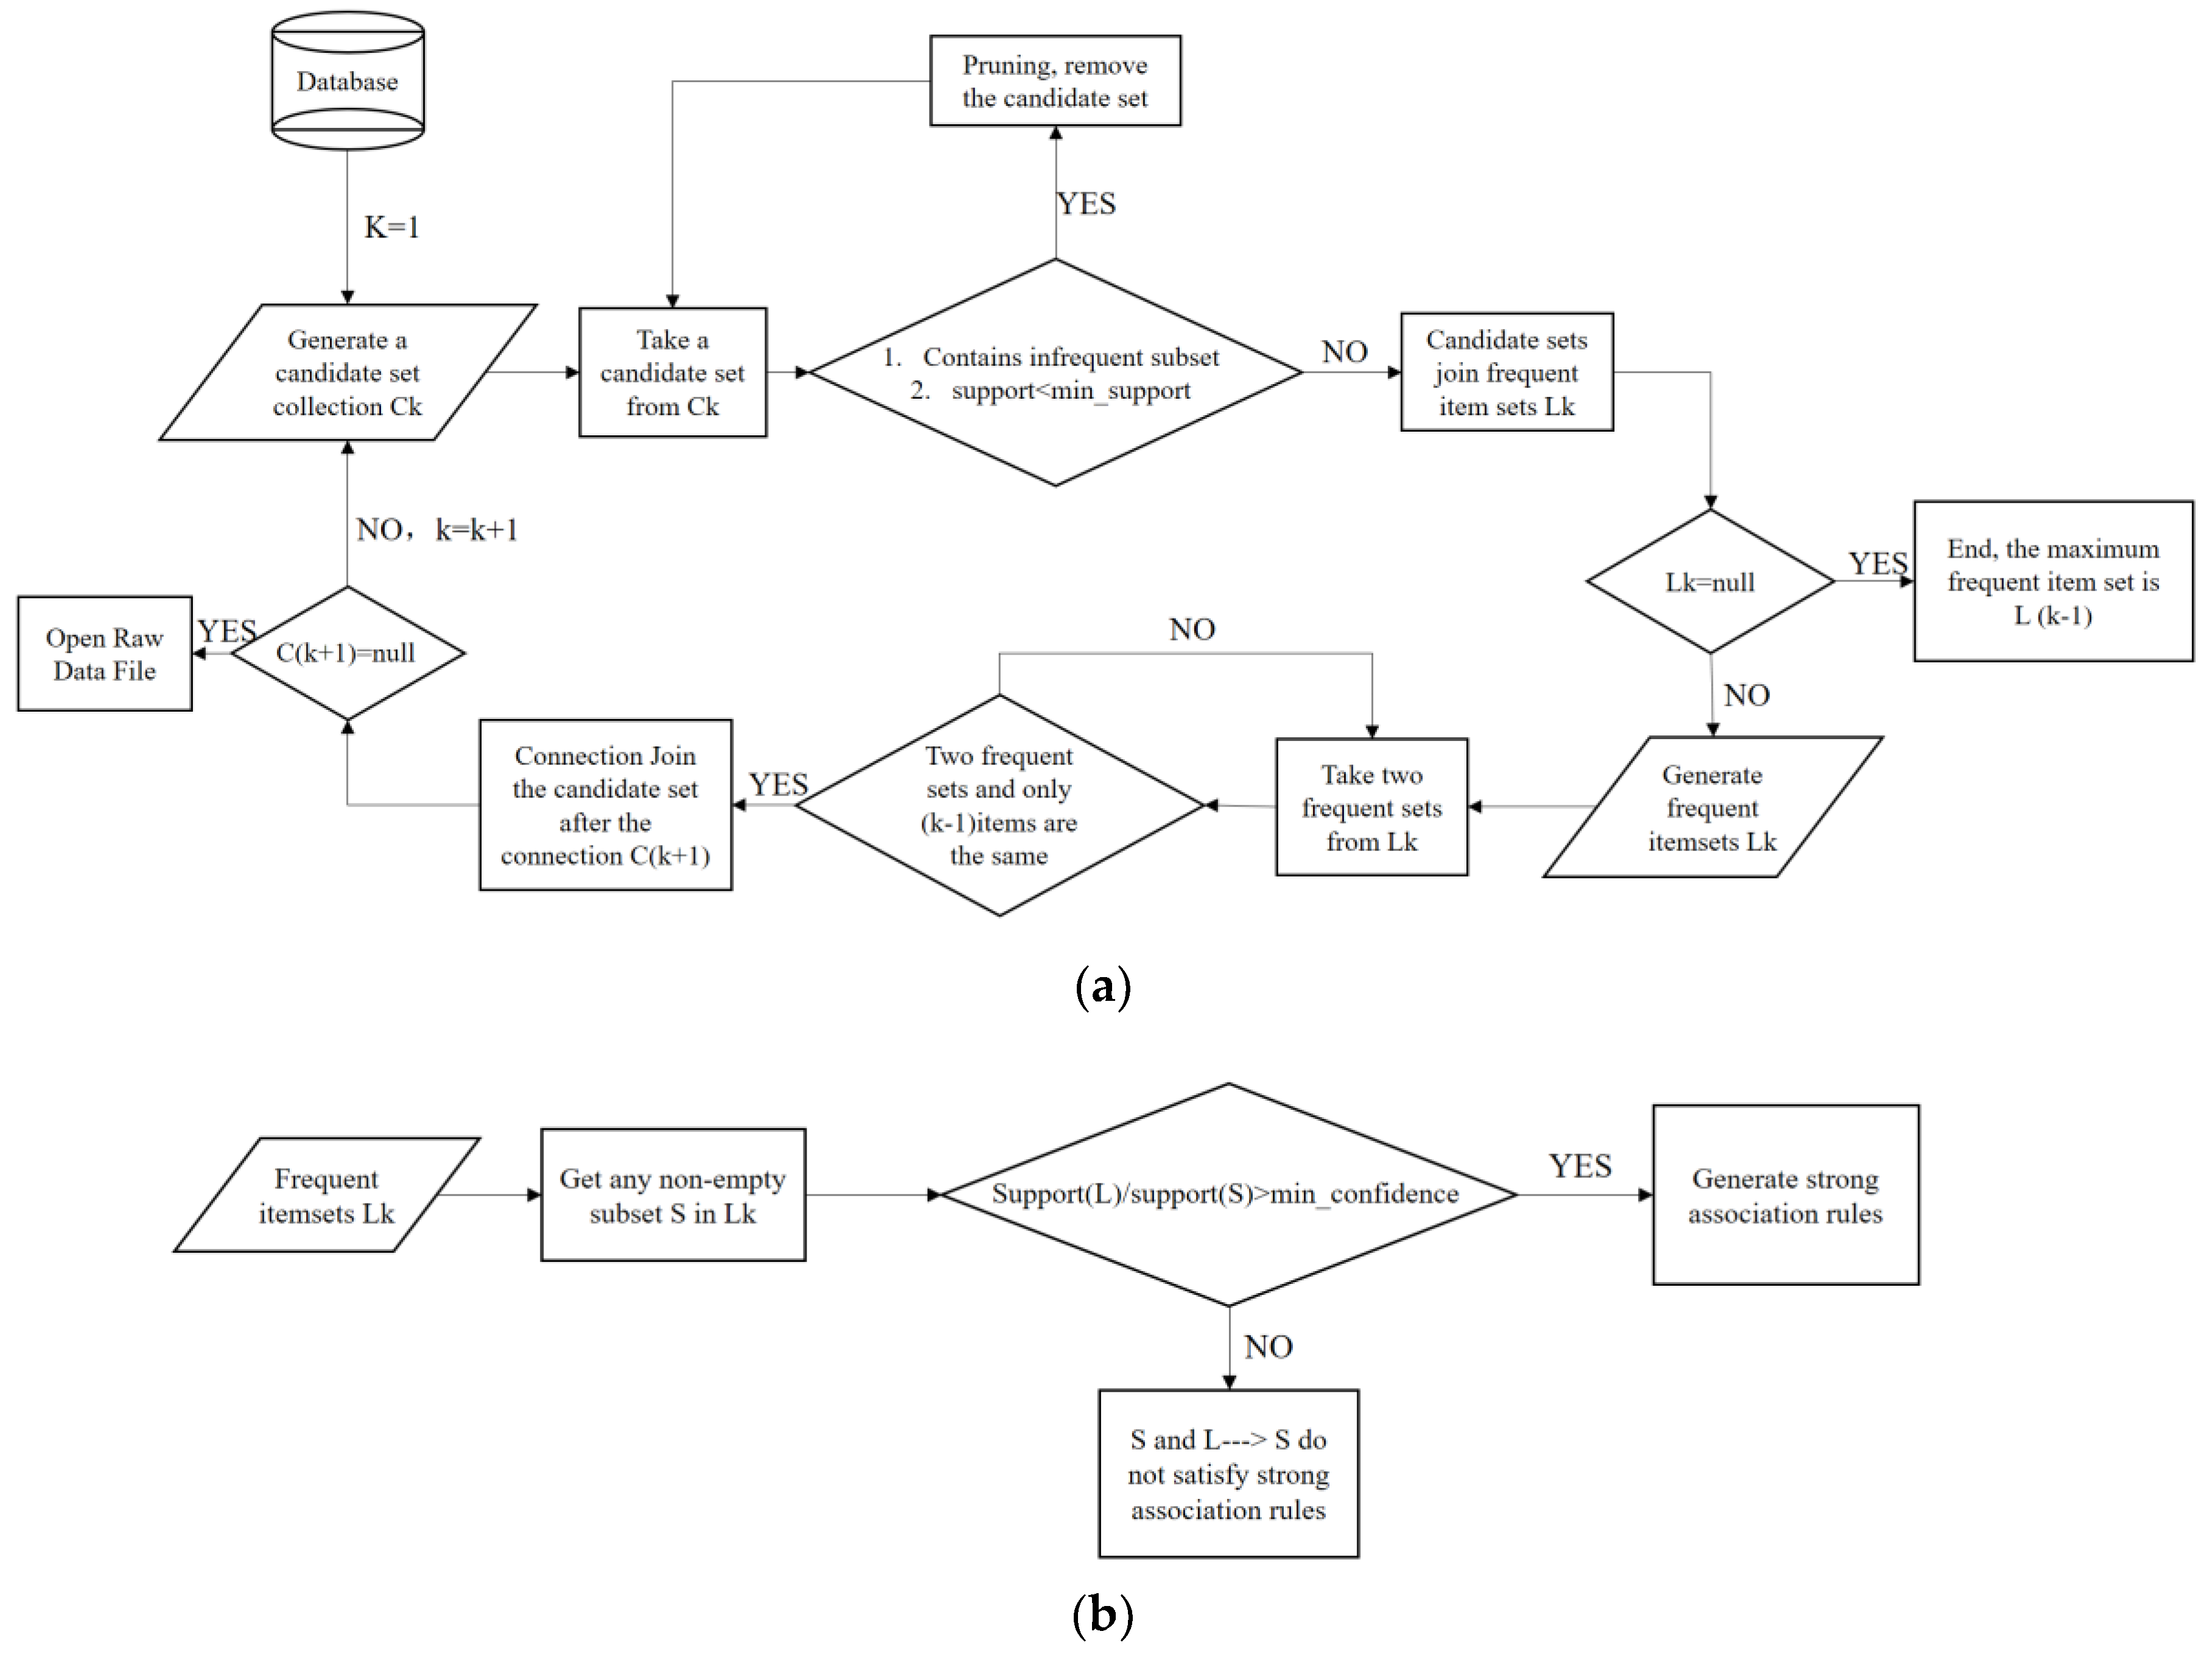
Apriori is one of the classic algorithms in the association algorithm. It identifies the frequent individual items in the database and extends them to larger and larger item sets as long as those item sets appear sufficiently often in the database [19]. The purpose of using association rules for DM is to discover underlying association rules in mass data through various measurement methods [20]. Thus, this paper introduces the Apriori algorithm to correlate and analyze variables in the operation of CACS. The flow of Apriori is shown in Figure 5a,b. Apriori algorithm cycles statistics and compares individual entry data, then extends the data rules to the entire dataset. Underlying regularities will be discovered by counting and analyzing frequently occurring associations and datasets. The association rules are formulas like X → Y. X is called the antecedent or left-hand-side of association rules and Y is called the consequent (or right-hand-side) of association rules. There are three important parameters in association rules: support (Equation (5)), confidence (Equation (6)), and lift (Equation (7)):
The support indicates the probability that X and Y appear at the same time, which represents the frequency of an association rule. Confidence is the probability that Y occurs when X occurs. Confidence is a measure for the accuracy of an association rule, which indicates the strength of an association rule. Lift is the ratio of confidence to the probability of Y, which represents the influence of the occurrence of X to Y.
The Apriori algorithm can only assort categorical data into high, medium, and low. However almost all data in CACS are digital, thus it is difficult to determine the interval of categories in practical applications. So the first quartile (Q1) and third quartile (Q3) of the variable are used to specify the interval. The data are divided into three categories: high, medium, and low. The digital data are converted into the classification data by equal frequency grouping method. Take the COP value as an example. The first quartile (Q1 = 3.71) and the third quartile (Q3 = 4.43) should be found first, and then numerical data are divided into three categories: COP < 3.71, COP = [3.71, 4.43] and COP > 4.43.
3.3. Protocol
The experimental data was collected from CACS in a five-star hotel in Jiangyin, Jiangsu Province, China. The data was recorded once a minute, including equipment operating parameters and environmental parameters. Table 2 shows the scope of data in the CACS.
The operating data in 180 days between April 2016 and October 2016 were selected. The original data had about 260,000 items and 242,000 effective data were left after missing data was discarded. The processed data was used for control strategy research and energy conservation monitoring. Data preprocessing and subsequent processing are based on Microsoft Excel (Office 2016, Microsoft Corporation, Redmond, WA, USA). Some processing are done by VBA programming. The DM algorithm is programmed in python language in PyCharm software (Community Edition, JetBrains s.r.o., Prague, Czech Republic).
In this research, constant temperature difference control strategy was used in CACS. The TD between the chilled inlet water and chilled outlet water was used as a feedback signal for control. Therefore the chilled water temperature difference (CWTD), chilled water pump frequency, cooling water temperature difference (COWTD), cooling water pump frequency, outdoor wet-bulb temperature, frequency of cooling tower, system COP value, air temperature and relative humidity were chosen as eigen values to perform cluster analysis. The CWTD, COWTD, relative humidity and AT were selected as item sets for correlation analysis and mining.
Data preprocessing methods were selected based on the characteristics of the original data and the DM method used. Firstly, the data to be used was selected from the data record, which contains equipment operating parameters, environmental parameters, energy consumption and efficiency. In order to ensure the authenticity of the data, the missing data and inconsistent data was cleaned up, the outliers were detected and the preprocessed data was found to be within the normal range. Finally, about 87.9% of the data was still available for DM. After preprocessing, (1) the centroid was reached by clustering the data with the binary k-means algorithm. The test data of CWTD, COWTD and the system COP value were removed. The Euclidean distance between the test data and the centroids of the clusters were calculated. The data into clusters with small distances were classified. The control parameters are set, according to the the CWTD and COWTD of the centroid. The results were compared with that from the simulation, with the results obtained from traditional method for verification. (2) Frequent item sets and association rules were obtained through the Apriori algorithm. A simple and effective method as an interpretation rule for mining results is presented. The data are divided into high, medium and low categories according to the COP value. High COPs represent high energy efficiency. Low COPs and low energy efficiency require optimization. The records with medium COPs can be used for subsequent analysis.
4. Results
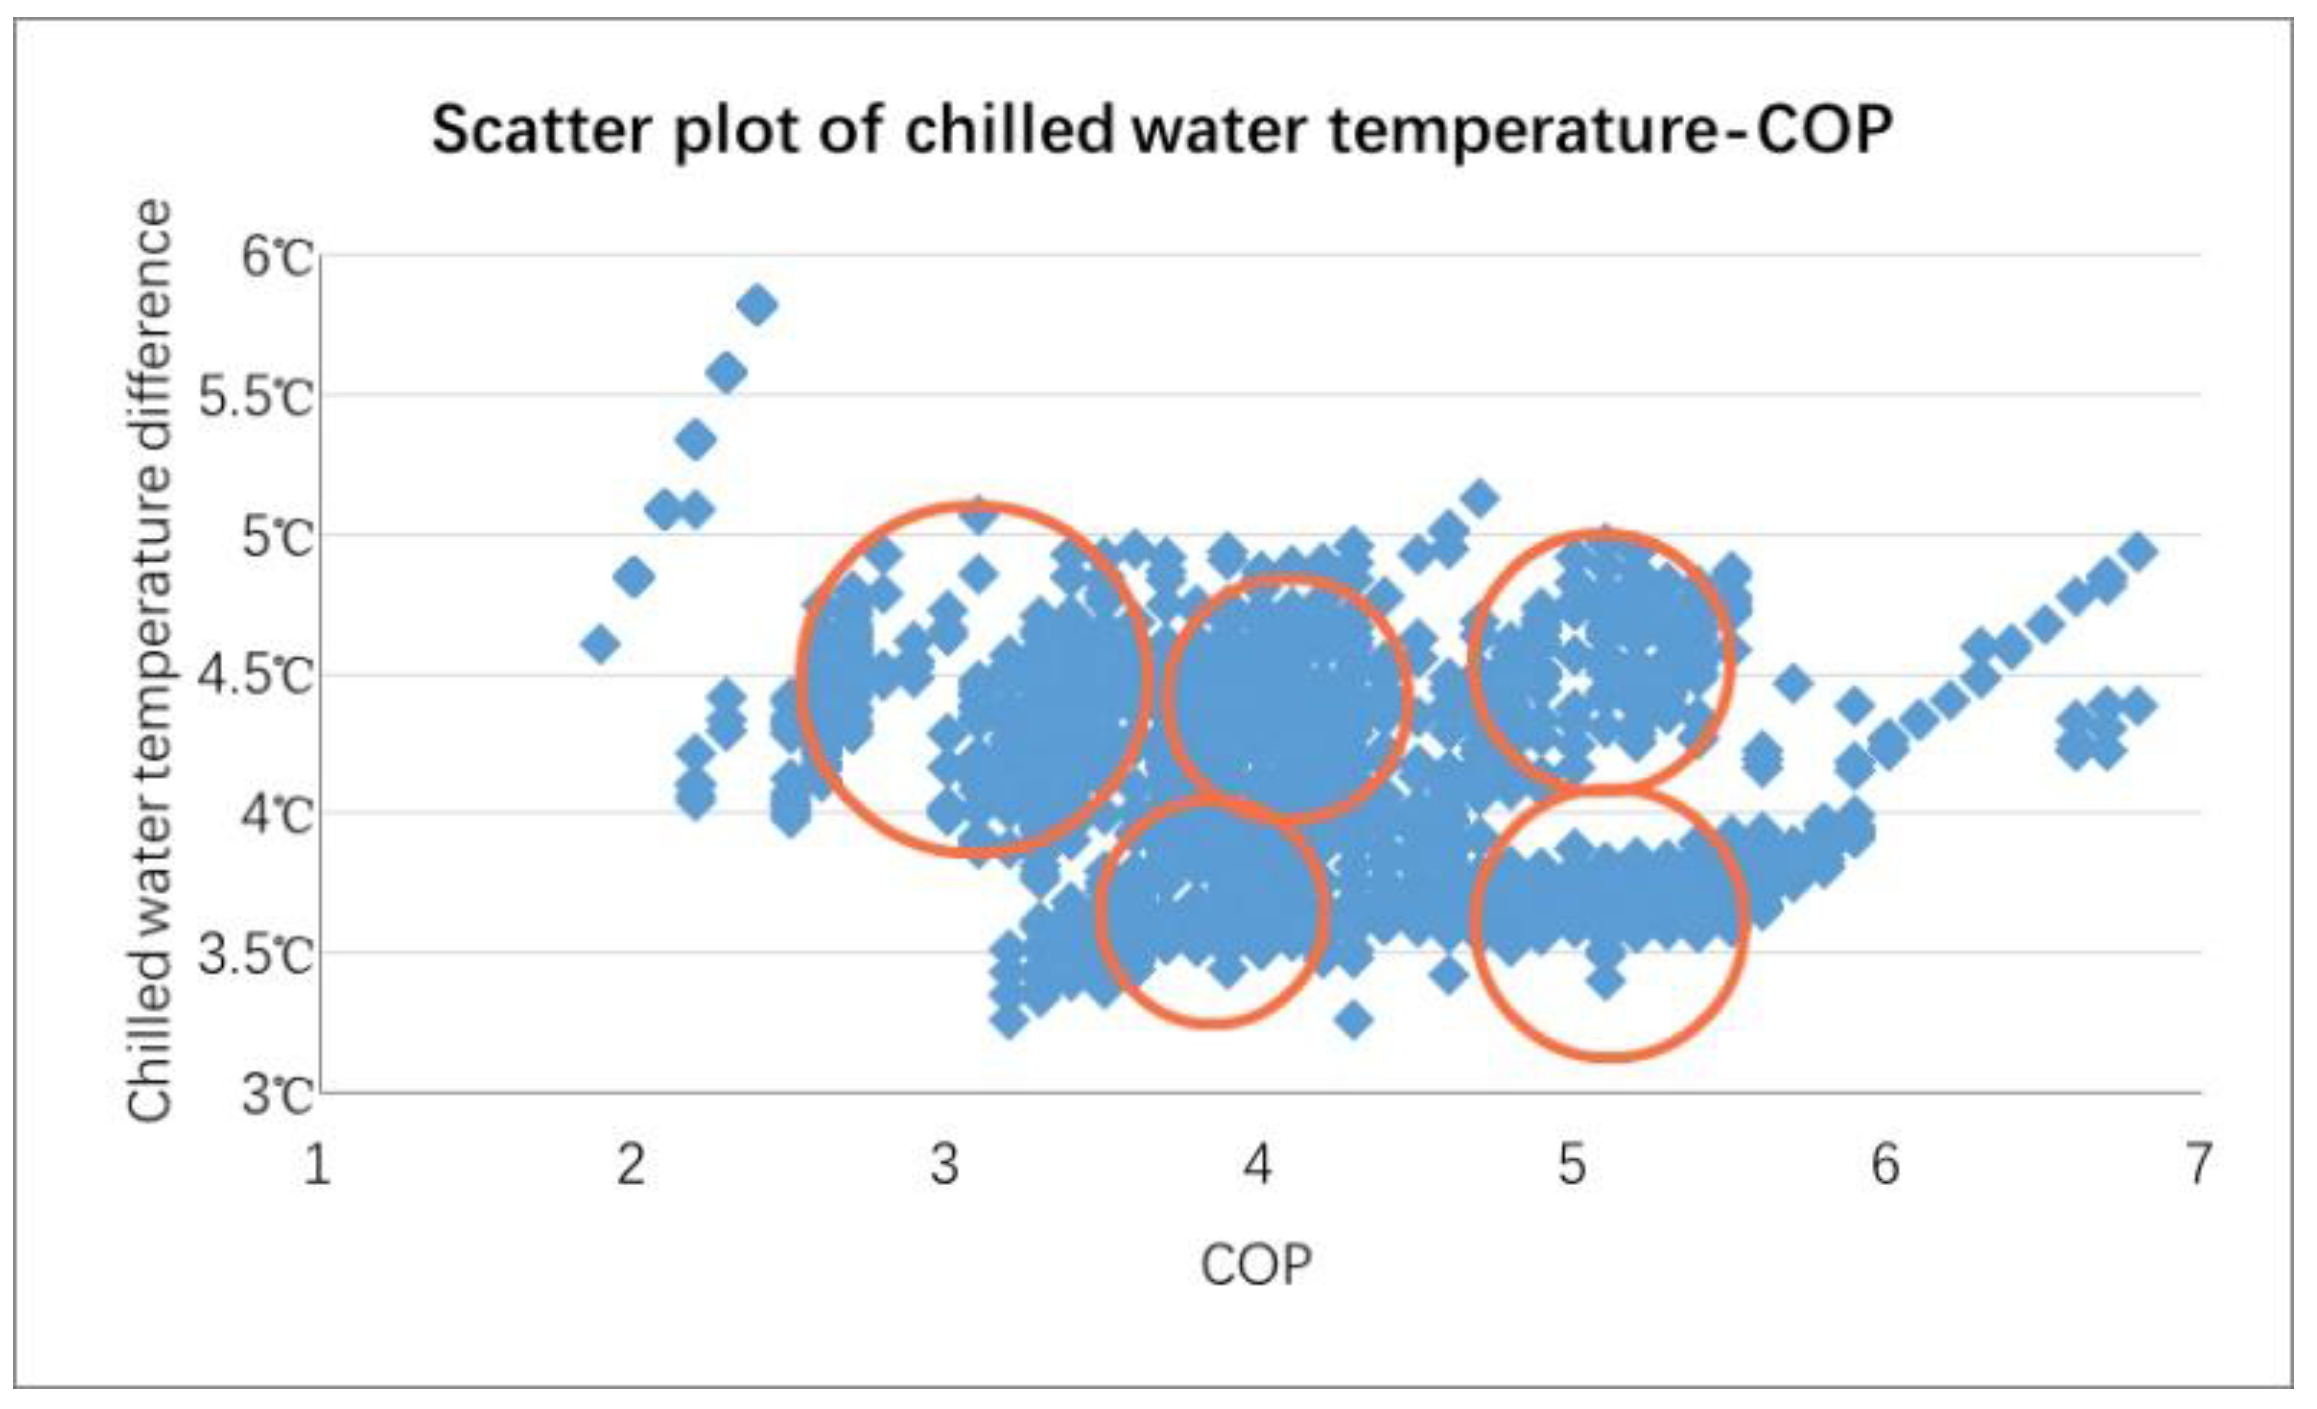
Scatter plots of CWTDs and COPs, scatter plots of COWTDs and COPs were performed. Analysis of experimental data and results are shown in Figure 6 and Figure 7. Data are clustered according to the red circle.
Binary k-means clustering was performed on preprocessed and format-converted data. As shown in Figure 8, SSE with k near 5 is calculated and the result was analyzed. Change rate of SSE became stable after k = 6.
After clustering by the binary k-means algorithm, the parameters recorded in the CACS were divided into 6 clusters. As shown in Table 3, the centroid of each cluster is recorded.
Apriori algorithms were used to correlate the data. The results obtained are shown in Table 4 and Table 5 after the data of CACS is classified and processed. The left-hand-side is the antecedent of the association rule, and the right-hand-side is the consequent of the association rule.
- Type 1:
- Expected Rules.
- Type 2:
- Unexpected Rules.
5. Discussion
5.1. Discussion of Dichotomous K-Means Clustering
The temperature difference (TD) of the chilled water and the TD of the cooling water were the control parameter that needed to be obtained through cluster analysis, thus they were considered as target indicators and illustrated in Figure 6 and Figure 7. From the scatter plot of the CWTD and COP, the value of k was determined to be around 5. From the scatter plot of the COWTD and COP, the value of k can be determined in the vicinity of 4–5. Thus, it was reasonable to take 5 as the initial value of the k for verification. The error sum of each data and centroid were calculated after each clustering as a standard for verification. The smaller the error, the smaller the error between centroid point and the point in the cluster and the more reasonable the initial value of K. As shown in Figure 8, the change rate of SSE reduced significantly when k is in the range of 5–7 in the process. Therefore, it was reasonable to set the initial k as 6.
Table 3 shows the centroids obtained from clustering. A cluster analysis was performed on 304 test data. Clusters of historical data are used to generate data clusters and new control parameters are obtained. Among the 304 test data, the COP of 211 sets of data, which account for 69.41%, are higher than those of the traditional control method, achieving better energy efficiency compared with the traditional control methods. In addition, the average COP from clustering is also 14.73% higher than the COP of traditional algorithms. The COP was obtained again through inputting the control parameters (CWTD, COWTD) in the simulation system. The COP of 191 sets of data, which account for 62.83%, were higher than those of traditional control methods. The average COP from clustering was also 9.22% higher than the COP of traditional algorithms. Therefore, cluster analysis can be a new way of energy-saving control in CACS, which will improve the control efficiency of CACS and reduce energy consumption.
5.2. Discussion of Apriori Association Analysis Results
The processed data was analyzed by Apriori rules, and two types of rules were obtained: expected rules and unexpected rules.
Table 4 shows the expected rules. The first rule, “CWTD < 3.6 °C, COP > 4.42”, is an expected rule with high confidence coefficient. When the CWTD is set lower than the first quartile, the frequency of higher COP is higher. The first rule can be verified by the second and third rules. In the operation of the CACS, the chilled water exchanges heat directly with room air. When the TD of the control chilled water is not too high, the COP can be increased and the energy efficiency can be improved. The third rule “COWTD < 3.1 °C, COP > 4.42” is also an expected rule. From rules 3 to 6, it can be found that when the COWTD setting was gradually increased, the COP will decrease. The reason is that when the cooling water exchanges heat with the chilled water, the TD of the cooling water is set too large and exceed the heat transfer rate of the two. Cooling capacity contained in the COWTD cannot be fully used during the heat exchange, which results in energy loss and the reduction of energy efficiency and COP.
Table 5 shows the unexpected rules. The first and second rules “29 °C < AT < 34.9 °C, COP < 3.72”, and “AT > 34.9 °C, COP < 3.72” are unexpected rules in correlation analysis. It is found that when the AT is high, the COP will be low. When the AT rises, the system administrator increased the air conditioner operating power for the comfort in the hotel, which resulted in a decrease of energy efficiency and COP. The third and fourth rules “AT < 29 °C, relative humidity > 80.7% → COP > 4.42” and “AT > 34.9 °C, relative humidity < 54% → COP > 4.42” showed that in a low-AT and high-humidity environment or a high-AT and low-humidity environment, the COP is also relatively high. Rule 3 is due to the fact that when the AT is low, high humidity increases the air heat exchange efficiency and COP. Thus, it can be found that on the basis of this rule, the increase in humidity leads to higher air heat transfer efficiency and a higher probability of a higher COP. The finding on the influence of humidity on the energy-saving effect in CACS is valuable, and it is of great significance to future research on the influence of relative humidity on the energy-saving effect in CACS.
6. Conclusions
Data mining research on data of CACS is demonstrated by clustering and association in this paper. The achievements of the case study in a hotel mainly include: (1) A method to determine the control parameters of CACS by clustering mining is proposed and energy-saving effect is achieved. (2) The energy consumption rule in CACS is found by Apriori association, the results of data analysis show that the operation data of the equipment can be analyzed by DM and cluster analysis to optimize the control effect of CACS. Expected and unexpected rules of the CACS energy consumption discovered by association rule mining can serve as guides to help technicians adjust equipment parameters timely, improve energy efficiency and reduce the energy consumption of the building. More importantly, this research makes it possible to apply data mining methods to the control link in an energy-saving control, not limited to identification of potential rules. Based on the historical data, the binary k-means clustering algorithm can be used to the process of control operation, which is innovative. Nevertheless, when applying cluster analysis to optimize the operation of CACS, there are challenges such as the combination of algorithms and control systems, algorithms’ requirement on the computing power of the system and indicators that are difficult to quantify (e.g., comfort, etc.). We are also researching how to put the algorithm on a cloud platform, leveraging the resources of cloud computing to achieve effective goals of the calculation. We will attempt to address these challenges in upcoming studies.
Author Contributions
Conceptualization, L.Y. and F.Q.; methodology, F.Q.; software, F.Q.; validation, L.Y., F.Q. and W.L.; formal analysis, F.Q.; investigation, F.Q.; resources, L.Y.; data curation, F.Q.; writing—original draft preparation, F.Q.; writing—review and editing, L.Y.; visualization, F.Q. and W.L.; supervision, L.Y.; project administration, L.Y.
Funding
This research received no external funding.
Conflicts of Interest
The authors declare no conflict of interest.
References
- Kontogiorgos, P.; Chrysanthopoulos, N.; Papavassilopoulos, G. A Mixed-Integer Programming Model for Assessing Energy-Saving Investments in Domestic Buildings under Uncertainty. Energies 2018, 11, 989. [Google Scholar] [CrossRef]
- Fu, X.; Cheng, F. Data mining in building automation system for improving building operational performance. Energy Build. 2014, 75, 109–118. [Google Scholar]
- Wu, X.; Zhu, X.; Wu, G.Q.; Ding, W. Data mining with big data. IEEE Trans. Knowl. Data Eng. 2013, 26, 97–107. [Google Scholar]
- Fan, C.; Xiao, F.; Wang, S. Development of prediction models for next-day building energy consumption and peak power demand using data mining techniques. Appl. Energy 2014, 127, 1–10. [Google Scholar] [CrossRef]
- Wei, X.; Kusiak, A.; Li, M.; Tang, F.; Zeng, Y. Multi-objective optimization of the HVAC (heating, ventilation, and air conditioning) system performance. Energy 2015, 83, 294–306. [Google Scholar] [CrossRef]
- Fan, C.; Xiao, F.; Yan, C. A framework for knowledge discovery in massive building automation data and its application in building diagnostics. Autom. Constr. 2015, 50, 81–90. [Google Scholar] [CrossRef]
- Zhao, H.X.; Magoulès, F. A review on the prediction of building energy consumption. Renew. Sustain. Energy Rev. 2012, 16, 3586–3592. [Google Scholar] [CrossRef]
- Yu, Z.; Haghighat, F.; Fung, B.C.M.; Zhou, L. A novel methodology for knowledge discovery through mining associations between building operational data. Energy Build. 2012, 47, 430–440. [Google Scholar] [CrossRef]
- Hou, Z.; Lian, Z.; Ye, Y.; Yuan, X. Data mining based sensor fault diagnosis and validation for building air conditioning system. Energy Convers. Manag. 2006, 47, 2479–2490. [Google Scholar] [CrossRef]
- Zhao, Z.; Yu, N.; Yu, T.; Zhang, H. Data Analysis and Modeling of Chilled Water Loops in Air Conditioning Systems. Math. Probl. Eng. 2017, 2017, 1–16. [Google Scholar] [CrossRef]
- Wang, Z.; Han, N.; Wang, Y. Studies on Neural Network Modeling for Air Conditioning System by Using Data Mining with Association Analysis. In Proceedings of the International Conference on Internet Computing and Information Services, Hong Kong, China, 17–18 September 2011; pp. 423–427. [Google Scholar]
- Chen, H.; Sun, S.; Liu, J.; Li, G. Application of data mining technology to refrigeration and air conditioning industry. Heat. Vent. Air Cond. 2016, 46, 20–26. [Google Scholar]
- Wang, J.; Zhou, P.; Huang, G.; Wang, W. A Data Mining Approach to Discover Critical Events for Event-Driven Optimization in Building Air Conditioning Systems. Energy Procedia 2017, 143, 251–257. [Google Scholar] [CrossRef]
- Malyavina, E.; Kryuchkova, O. Analysis of annual power consumption by central air conditioning systems using the climatic data stochastic statistics model. In Proceedings of the Environmental Engineering. Proceedings of the International Conference on Environmental Engineering, Vilnius, Lithuania, 19–20 May 2011; p. 776. [Google Scholar]
- Tang, W.J.; Yang, H.T. Data Mining and Neural Networks Based Self-Adaptive Protection Strategies for Distribution Systems with DGs and FCLs. Energies 2018, 11, 426. [Google Scholar] [CrossRef]
- Li, X.; Song, K.; Wei, G.; Lu, R.; Zhu, C. A Novel Grouping Method for Lithium Iron Phosphate Batteries Based on a Fractional Joint Kalman Filter and a New Modified K-Means Clustering Algorithm. Energies 2015, 2015, 7703–7728. [Google Scholar] [CrossRef]
- Huang, Z. Extensions to the k-Means Algorithm for Clustering Large Data Sets with Categorical Values. Data Min. Knowl. Discov. 1998, 2, 283–304. [Google Scholar] [CrossRef]
- Celebi, M.E.; Kingravi, H.A.; Vela, P.A. A Comparative Study of Efficient Initialization Methods for the K-Means Clustering Algorithm. Expert Syst. Appl. 2012, 40, 200–210. [Google Scholar] [CrossRef]
- Kavšek, B.; Lavrač, N.; Jovanoski, V. APRIORI-SD: Adapting Association Rule Learning to Subgroup Discovery. Appl. Artif. Intell. 2006, 20, 543–583. [Google Scholar] [CrossRef]
- Minaeibidgoli, B.; Barmaki, R.; Nasiri, M. Mining numerical association rules via multi-objective genetic algorithms. Inf. Sci. 2013, 233, 15–24. [Google Scholar] [CrossRef]
Figure 1.
Central air conditioning system.
Figure 2.
Building information and data source.

Figure 3.
The flow chart of data analytics in building.

Figure 4.
(a) The flow chart of k-means clustering analysis. (b) The flow chart of binary k-means clustering analysis.
Figure 4.
(a) The flow chart of k-means clustering analysis. (b) The flow chart of binary k-means clustering analysis.


Figure 5.
(a) Apriori Algorithm Step 1: Generate Frequent Item set . (b) Apriori Algorithm Step 2: Find Strong Association Rules.
Figure 5.
(a) Apriori Algorithm Step 1: Generate Frequent Item set . (b) Apriori Algorithm Step 2: Find Strong Association Rules.

Figure 6.
Scatter plot of CWTD-COP.

Figure 7.
Scatter plot of COWTD-COP.

Figure 8.
Equipment of data source.


Table 1.
The problems and solutions for data preprocessing.
| Data Preprocessing | Problems | Solutions |
|---|---|---|
| Data cleaning | Data quality problem, e.g., data missing, inconsistent values, outliers | Missing value: moving average, imputation, and inference-based Outlier: graphical, model-based, hybrid methods |
| Data normalization | Different data scale, Units and difference Data sources | Data value scaling: Max-min, Z-score, and decimal scaling normalization Data sampling scaling |
| Data transform | Different data type | Equal-frequency binning, equal-interval binning, and entropy-based discretization |
Table 2.
Data description and scope.
| Data Source | Data Type | Data Amount |
|---|---|---|
| A five-star hotel at Jiangyin, Jiangsu Province | HVAC equipment operating parameters, environmental parameters and energy consumption records | 1.2 G/0.5 year |
Table 3.
Centroid of cluster analysis.
| Cluster | Chilled Water Temp Difference (°C) | Chilled Water Pump Frequency (Hz) | Cooling Water Temp Difference (°C) | Cooling Pump Frequency (Hz) | Wet Bulb Temp (°C) | Cooling Tower Frequency (Hz) | COP | Temp (°C) | Relative Humidity (%) |
|---|---|---|---|---|---|---|---|---|---|
| 1 | 4.5630 | 41.4704 | 3.3000 | 41.9926 | 26.3796 | 12.0607 | 4.3656 | 35.2333 | 49.9852 |
| 2 | 3.2200 | 40.6697 | 3.2981 | 30.2116 | 24.5077 | 17.2828 | 4.5782 | 26.8329 | 83.8129 |
| 3 | 4.2466 | 43.4582 | 3.5555 | 45.0129 | 26.4996 | 44.3682 | 3.9104 | 30.1626 | 75.6207 |
| 4 | 3.1248 | 39.9822 | 3.3039 | 30.3435 | 24.3119 | 49.3978 | 4.5326 | 26.4971 | 84.1991 |
| 5 | 4.8915 | 46.0203 | 4.3944 | 46.1344 | 27.2867 | 40.0540 | 3.7865 | 33.6890 | 61.1712 |
| 6 | 5.2388 | 44.1753 | 4.3262 | 45.5552 | 27.3579 | 41.7690 | 4.0713 | 37.5562 | 45.0564 |
Table 4.
Expected rules.
| Left-Hand-Side | Right-Hand-Side | Support | Confidence | Lift |
|---|---|---|---|---|
| CWTD = [−, 3.6 °C] | COP > 4.42 | 0.1089 | 0.6399 | 2.5596 |
| CWTD = [3.6 °C, 5.3 °C] | COP > 4.42 | 0.1029 | 0.3018 | 0.6036 |
| CWTD = [, 3.6 °C], COWTD = [3.1 °C, 4.8 °C] | COP > 4.42 | 0.0582 | 0.3404 | 1.3616 |
| COWTD = [−, 3.6 °C] | COP > 4.42 | 0.0571 | 0.6353 | 2.5412 |
| COWTD = [3.1 °C, 4.8 °C] | COP < 3.72 | 0.18 | 0.3493 | 0.6986 |
| COWTD = [4.8 °C, + ] | COP < 3.72 | 0.0643 | 0.2659 | 1.0636 |
Table 5.
Unexpected rules.
| Left-Hand-Side | Right-Hand-Side | Support | Confidence | Lift |
|---|---|---|---|---|
| AT = [29, 34.9 °C] | COP < 3.72 | 0.18 | 0.3644 | 0.7288 |
| AT = [34.9 °C, +] | COP < 3.72 | 0.0632 | 0.5493 | 2.1972 |
| AT = [−, 29 °C], Relative humidity = [80.7%, +] | COP > 4.42 | 0.0985 | 0.5526 | 2.2104 |
| CWTD = [−, 3.6 °C], Relative humidity = [80.7%, +] | COP > 4.42 | 0.0839 | 0.5841 | 2.3364 |
© 2018 by the authors. Licensee MDPI, Basel, Switzerland. This article is an open access article distributed under the terms and conditions of the Creative Commons Attribution (CC BY) license (http://creativecommons.org/licenses/by/4.0/).
Share and Cite
MDPI and ACS Style
Yan, L.; Qian, F.; Li, W. Research on Key Parameters Operation Range of Central Air Conditioning Based on Binary K-Means and Apriori Algorithm. Energies 2019, 12, 102. https://doi.org/10.3390/en12010102
AMA Style
Yan L, Qian F, Li W. Research on Key Parameters Operation Range of Central Air Conditioning Based on Binary K-Means and Apriori Algorithm. Energies. 2019; 12(1):102. https://doi.org/10.3390/en12010102
Chicago/Turabian StyleYan, Liangwen, Fengfeng Qian, and Wei Li. 2019. "Research on Key Parameters Operation Range of Central Air Conditioning Based on Binary K-Means and Apriori Algorithm" Energies 12, no. 1: 102. https://doi.org/10.3390/en12010102
Note that from the first issue of 2016, this journal uses article numbers instead of page numbers. See further details here.