Evaluation of Some State-Of-The-Art Wind Technologies in the Nearshore of the Black Sea


Abstract
:1. Introduction
2. Materials and Methods
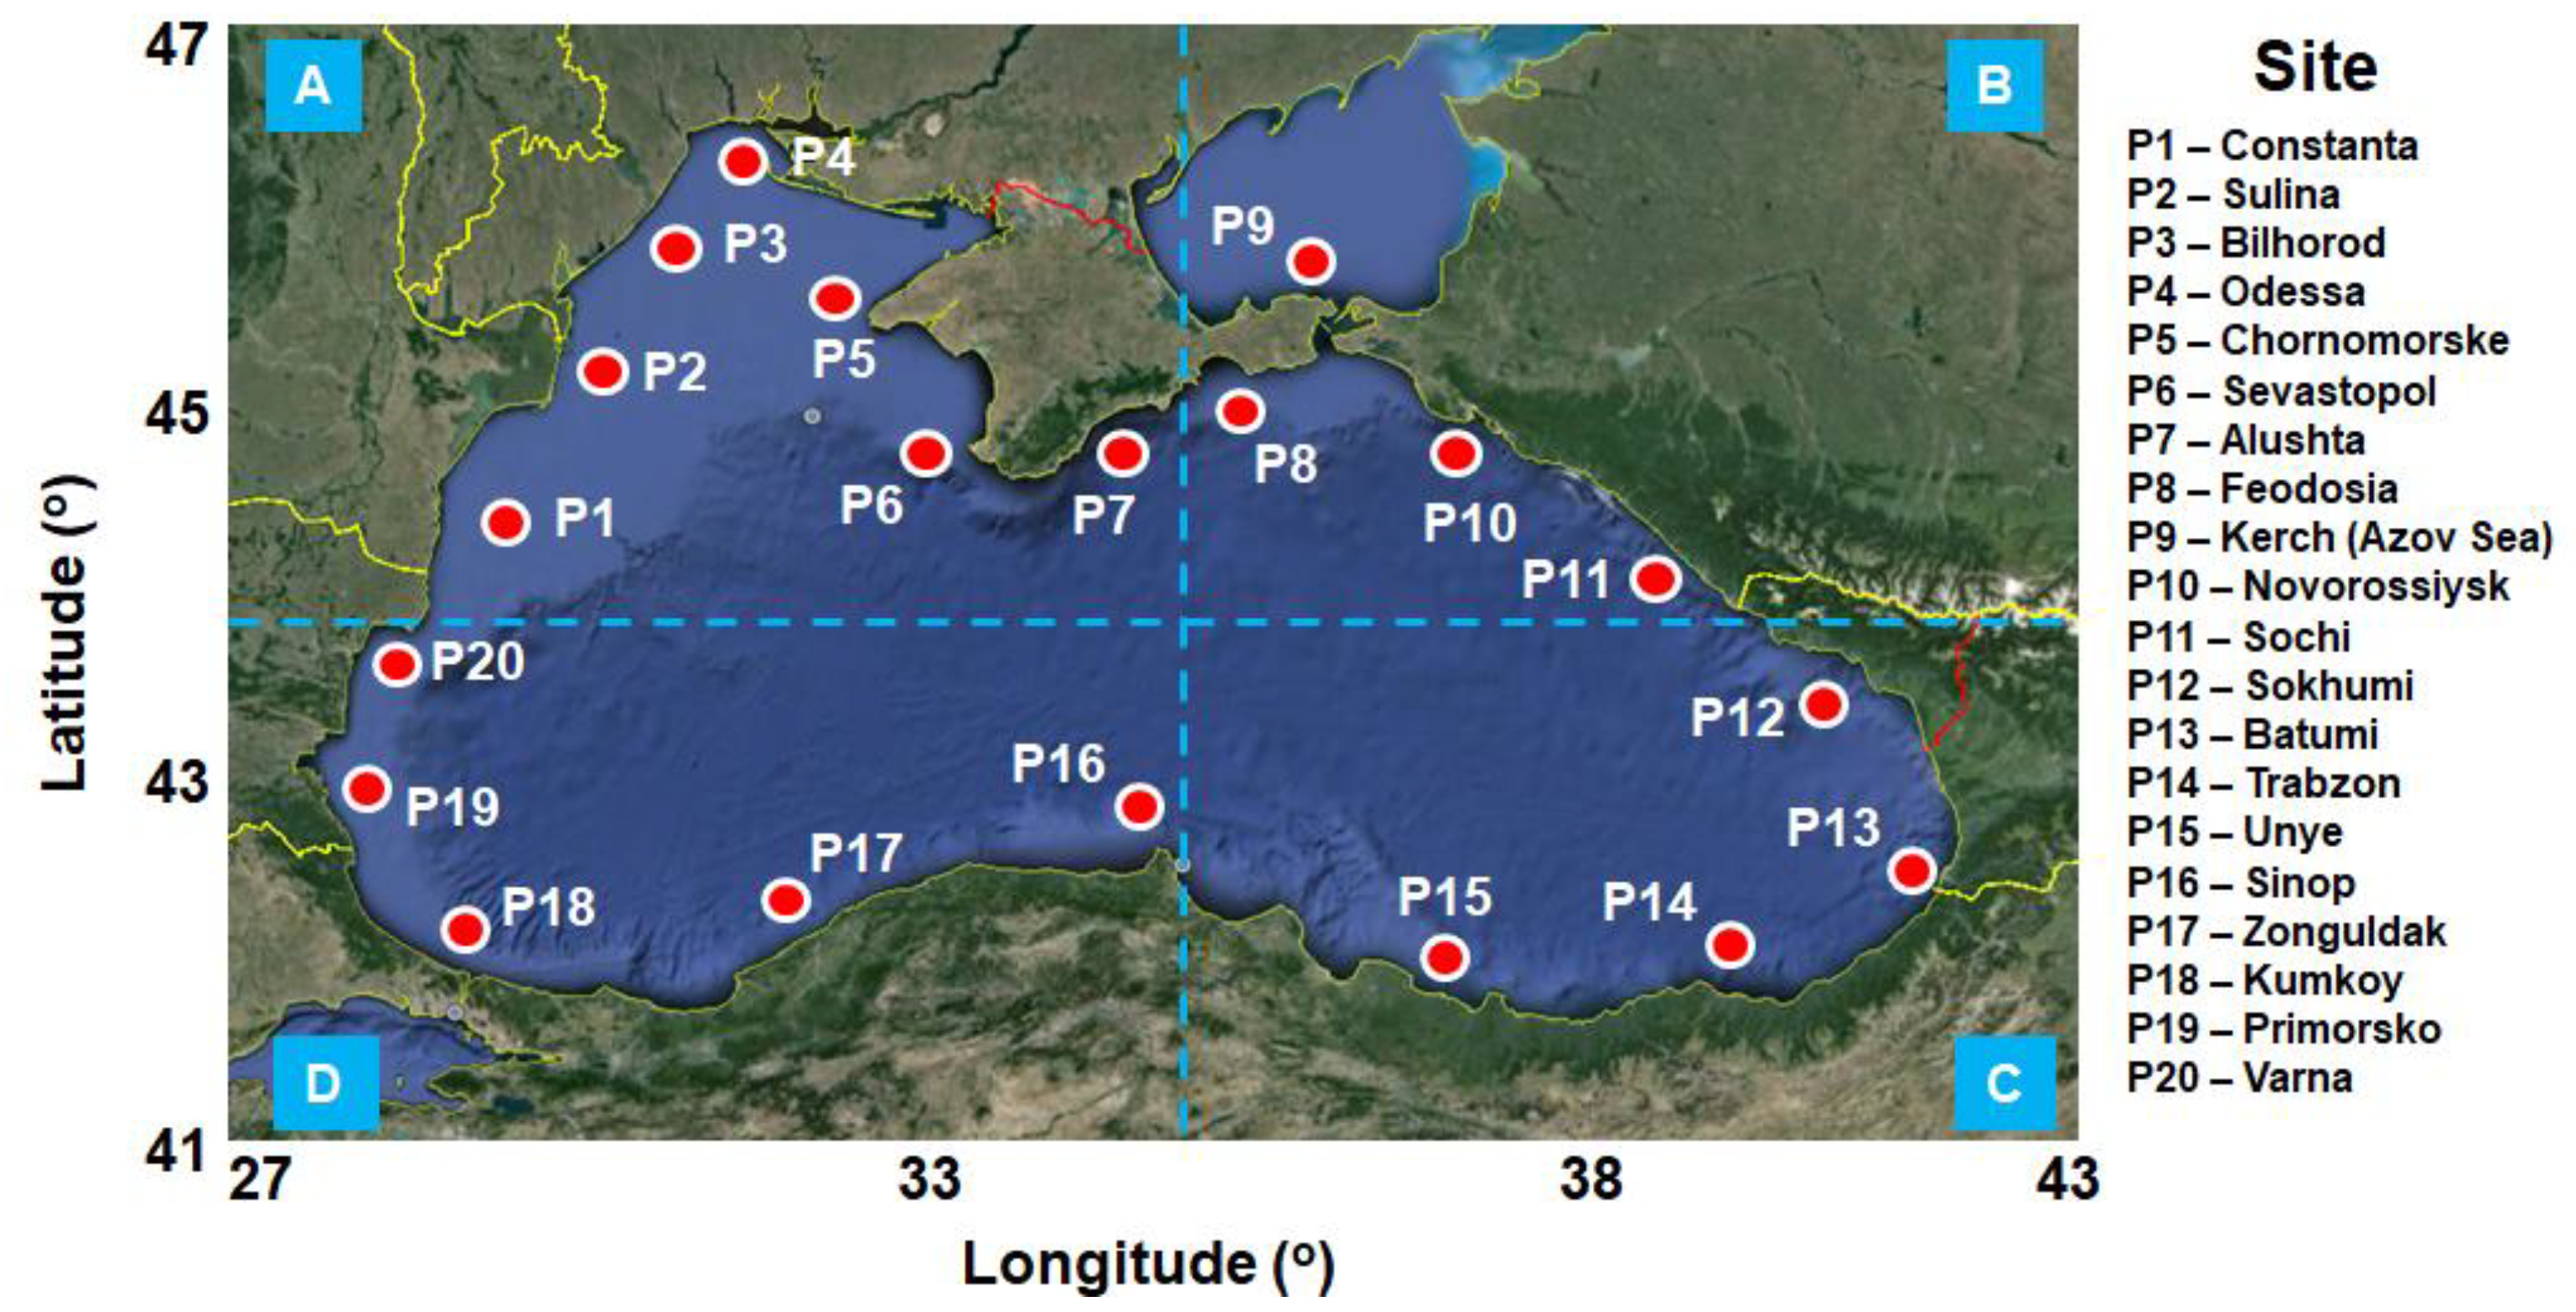
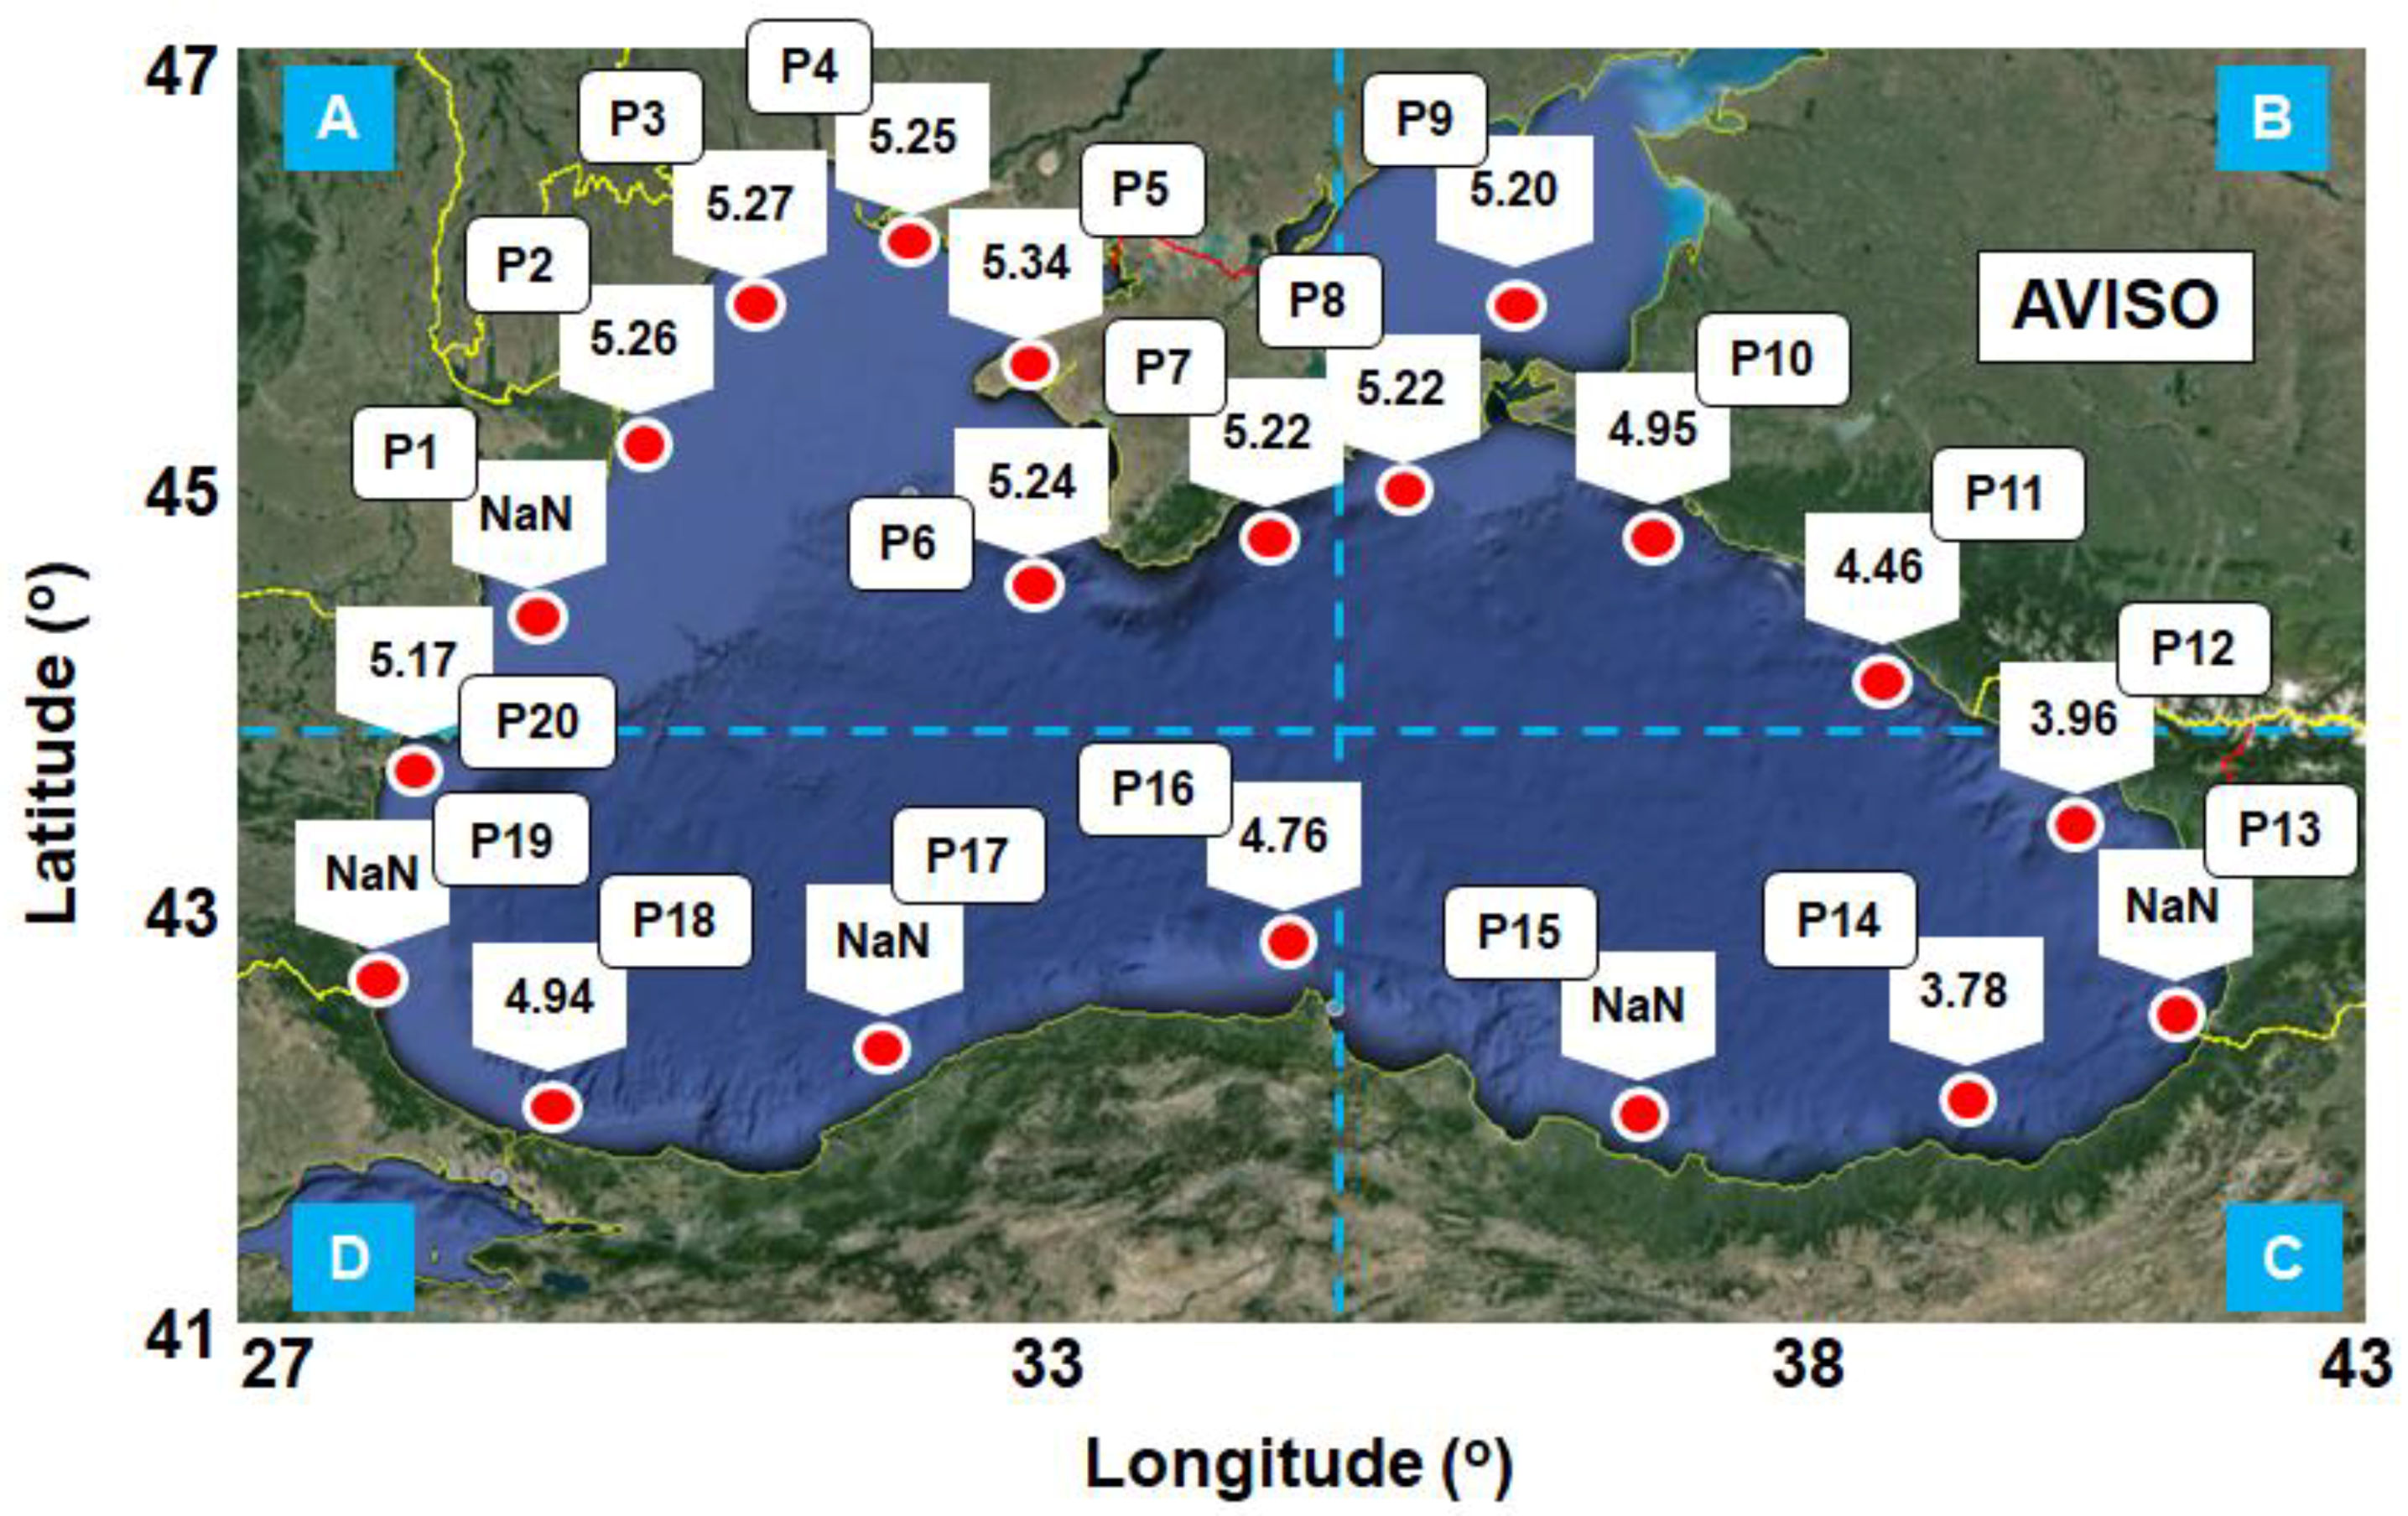
2.1. The Target Area
2.2. Dataset
2.3. Wind Turbines
3. Results
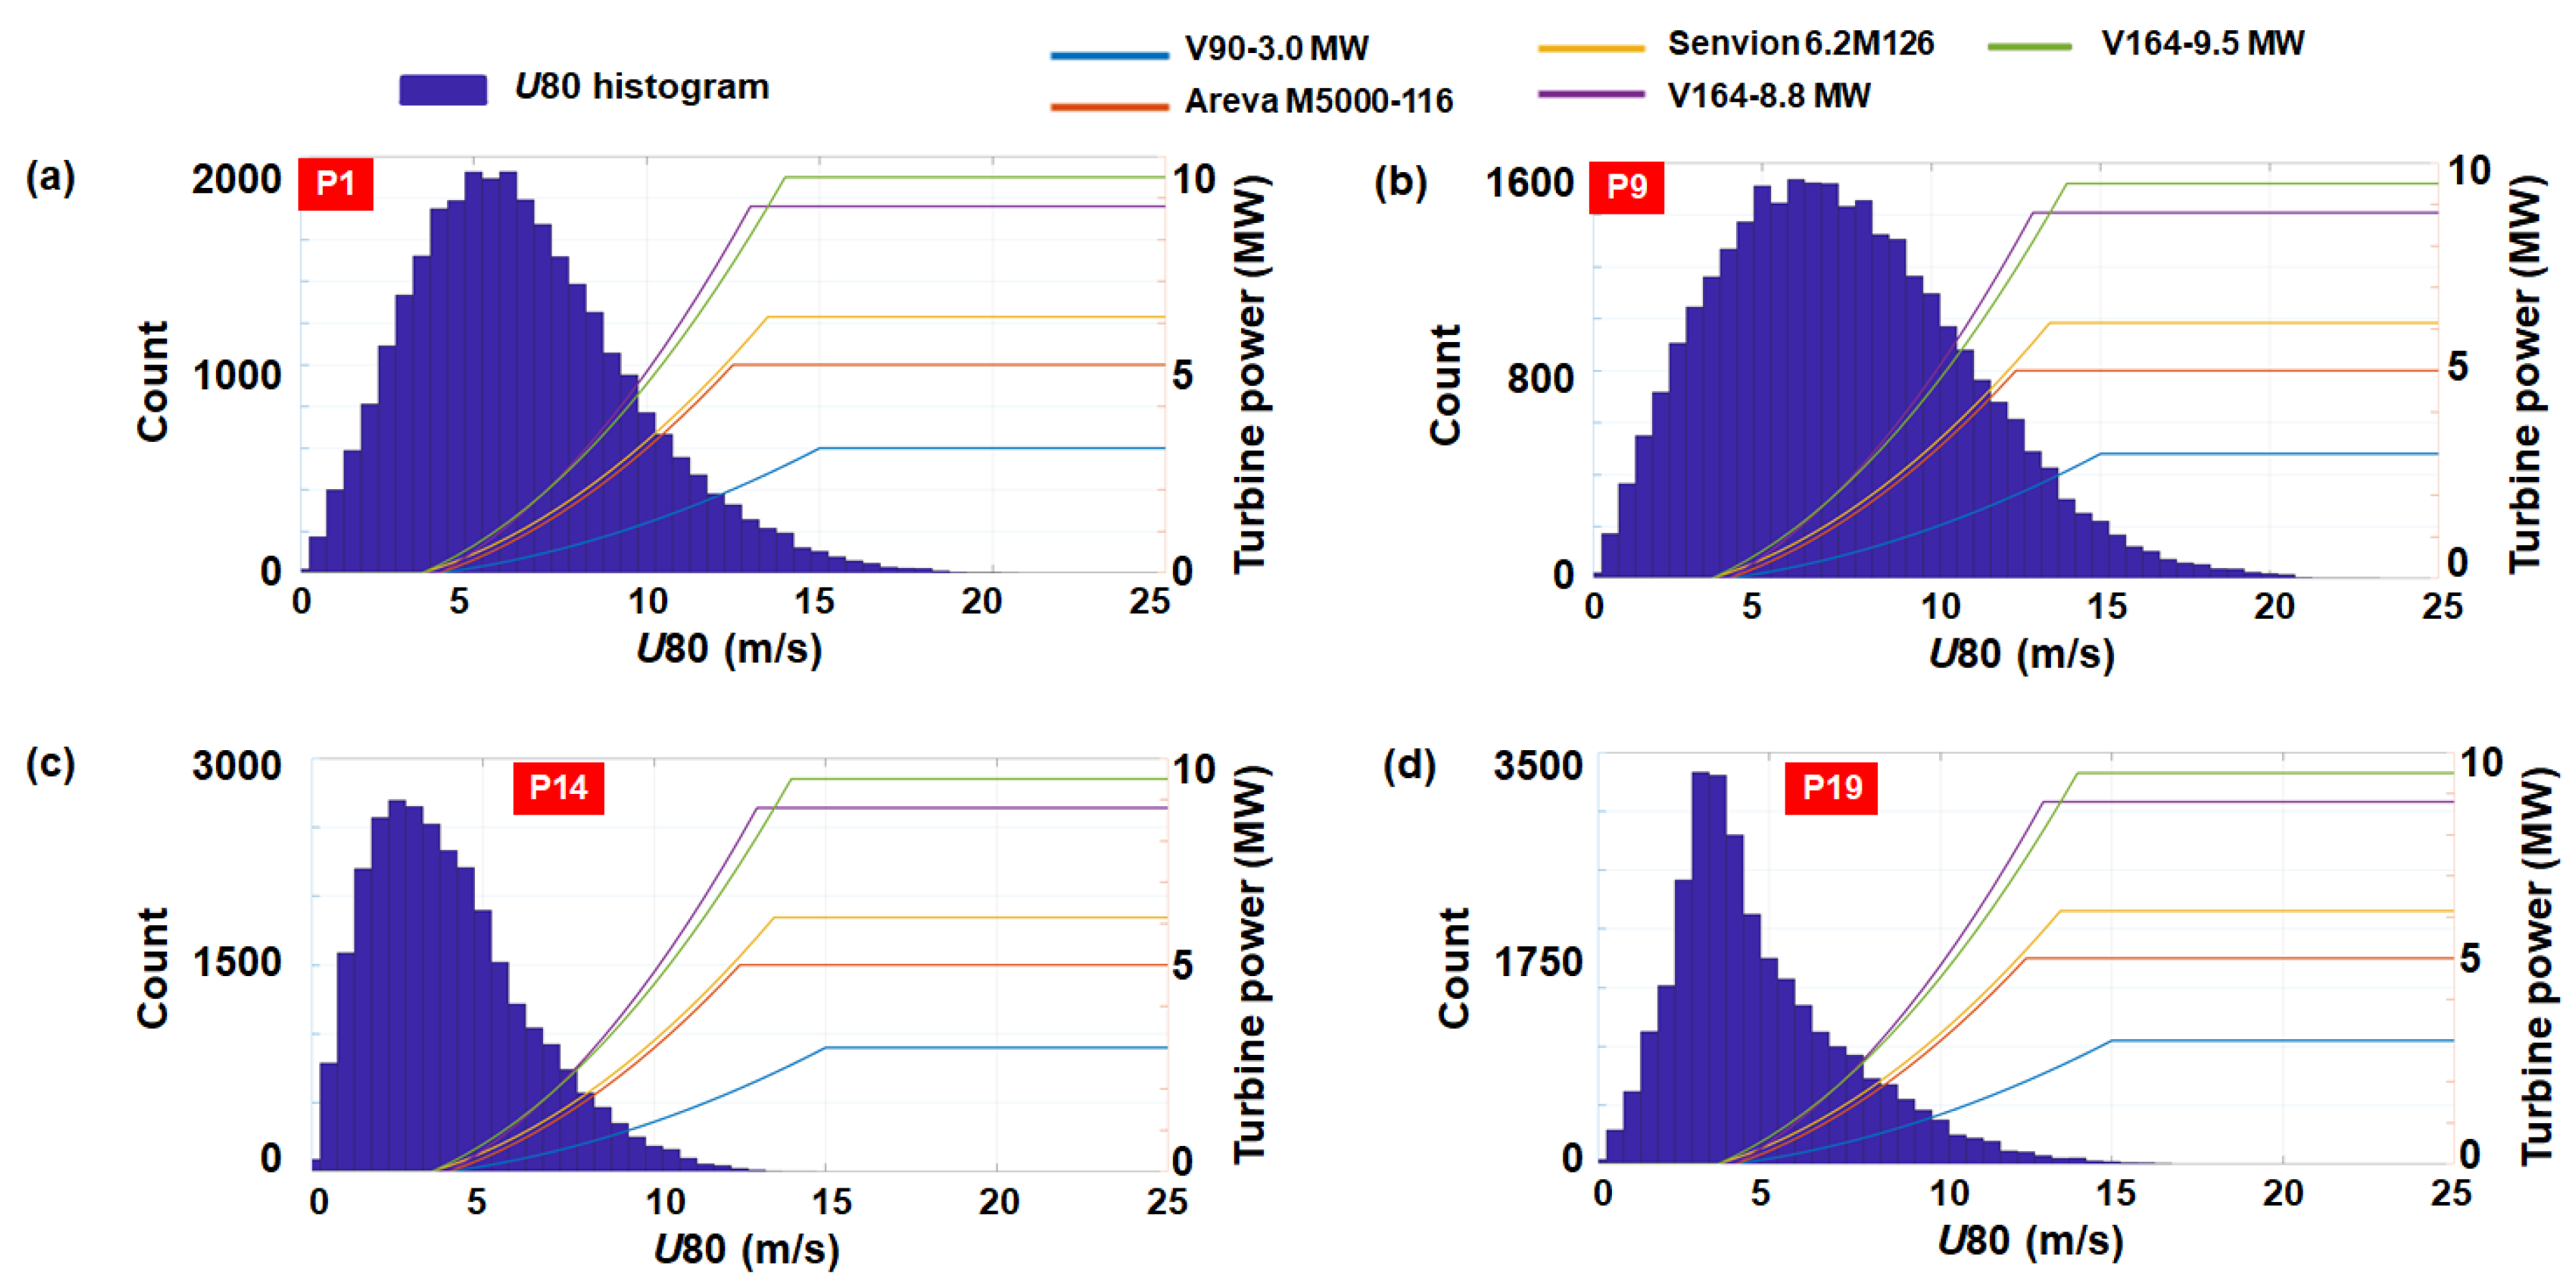
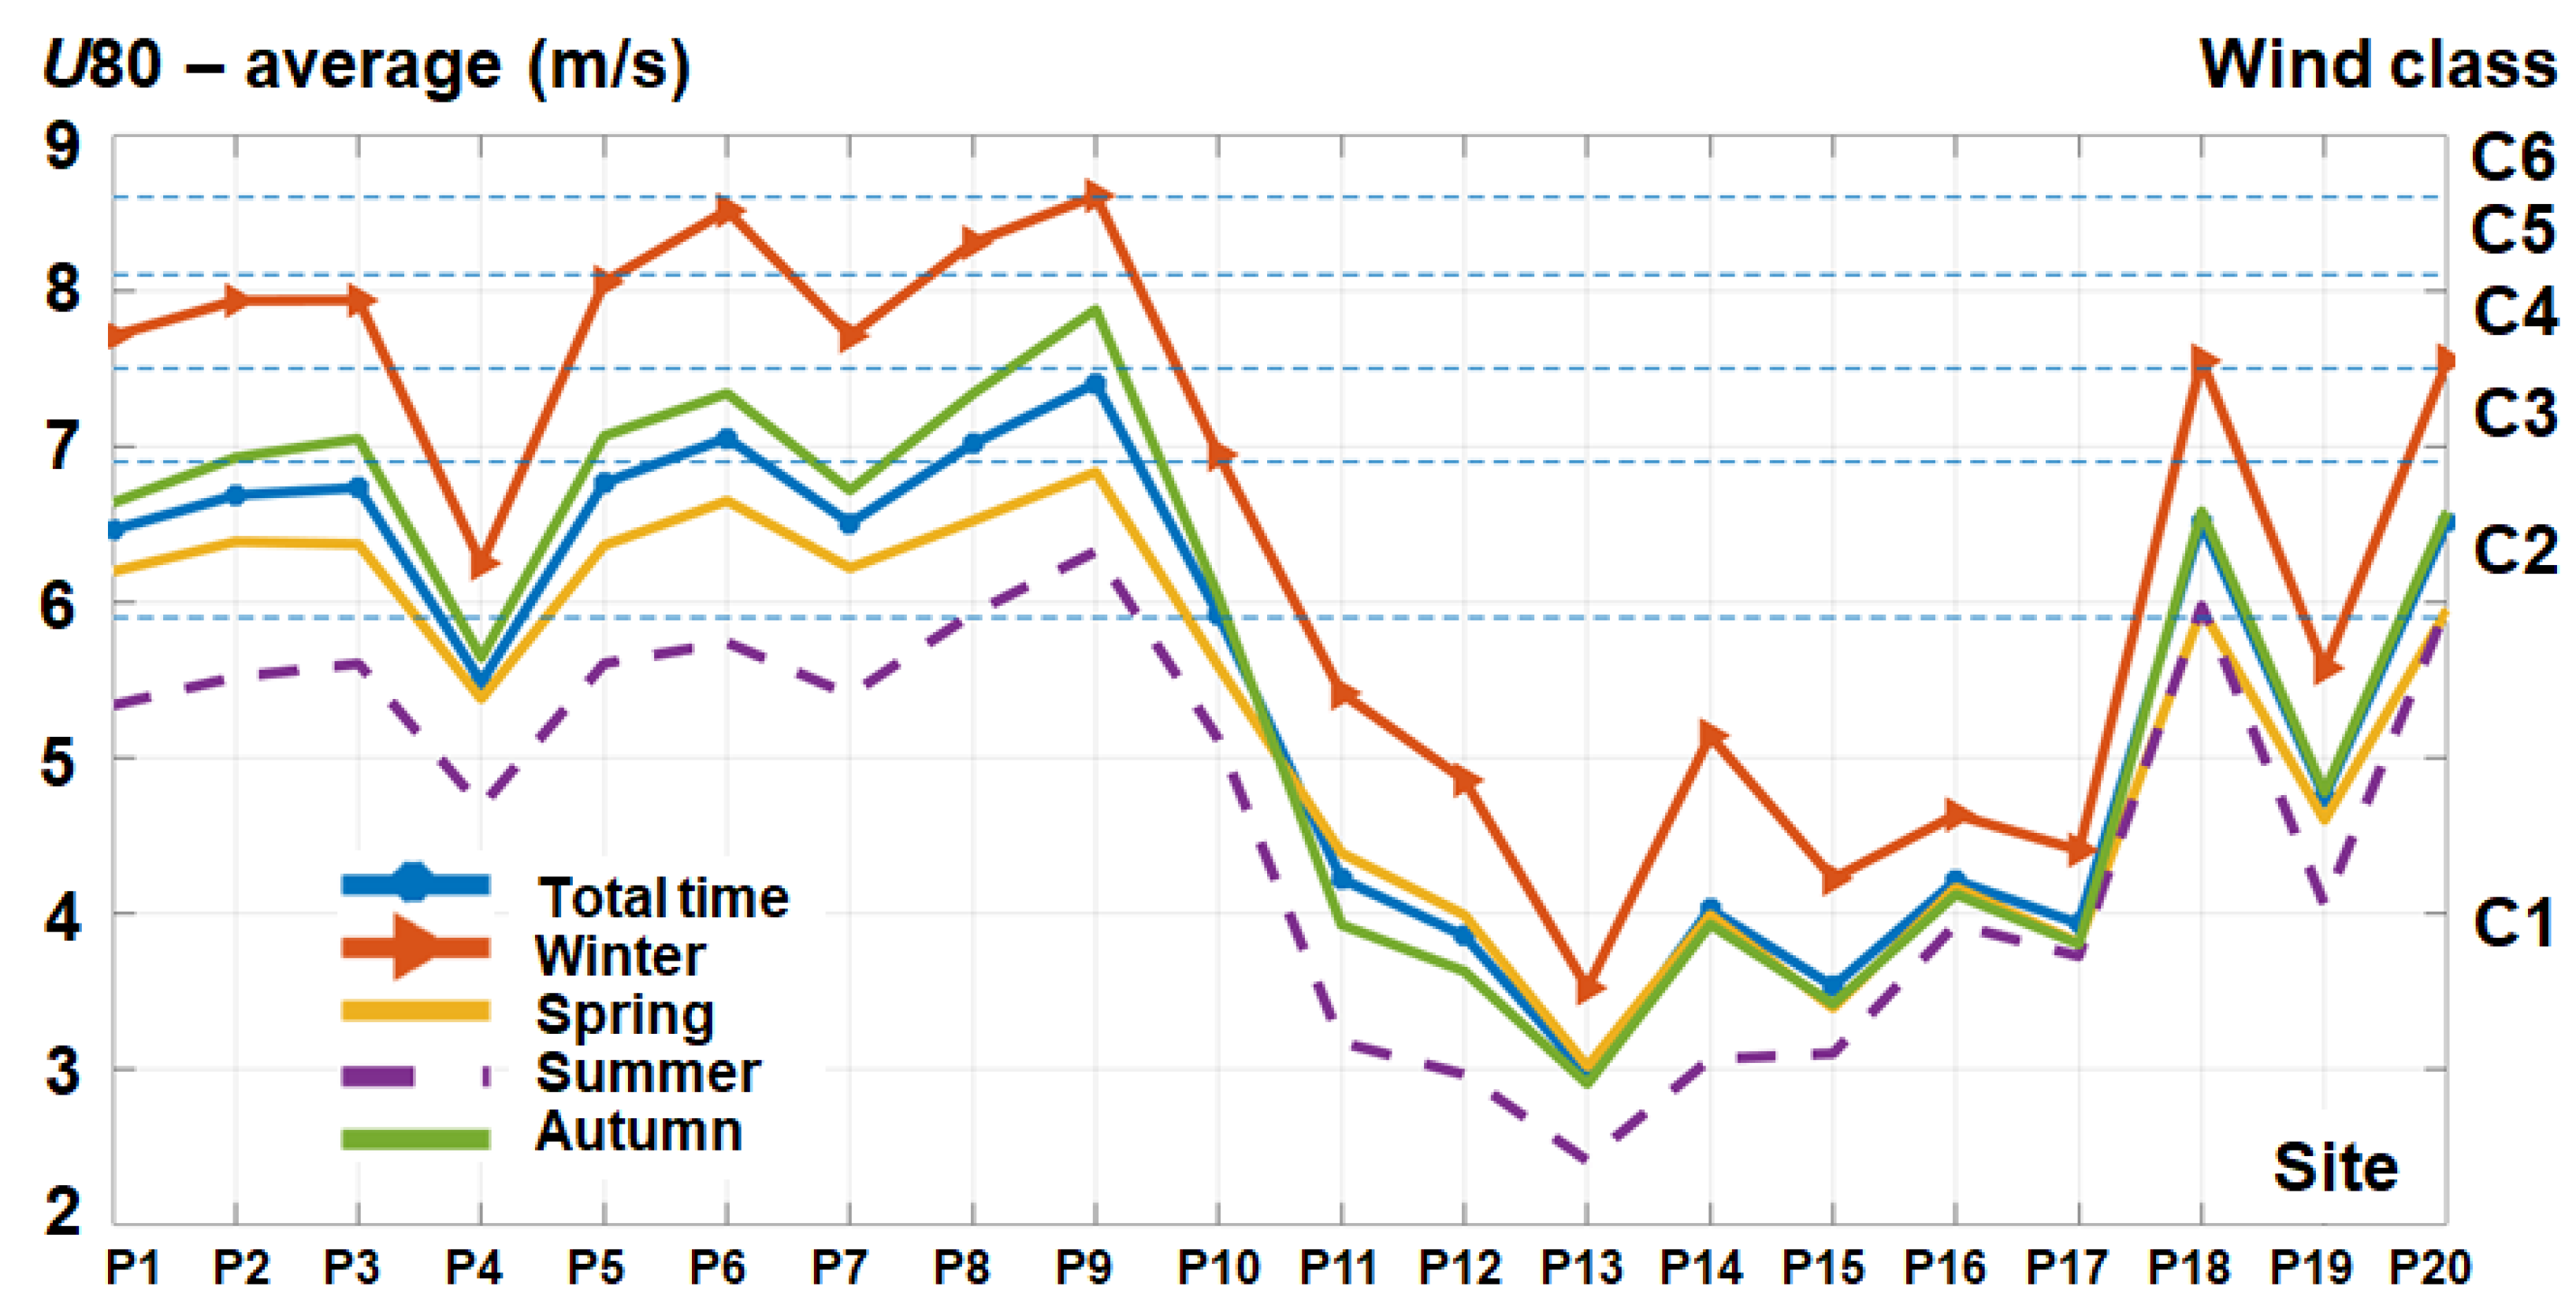
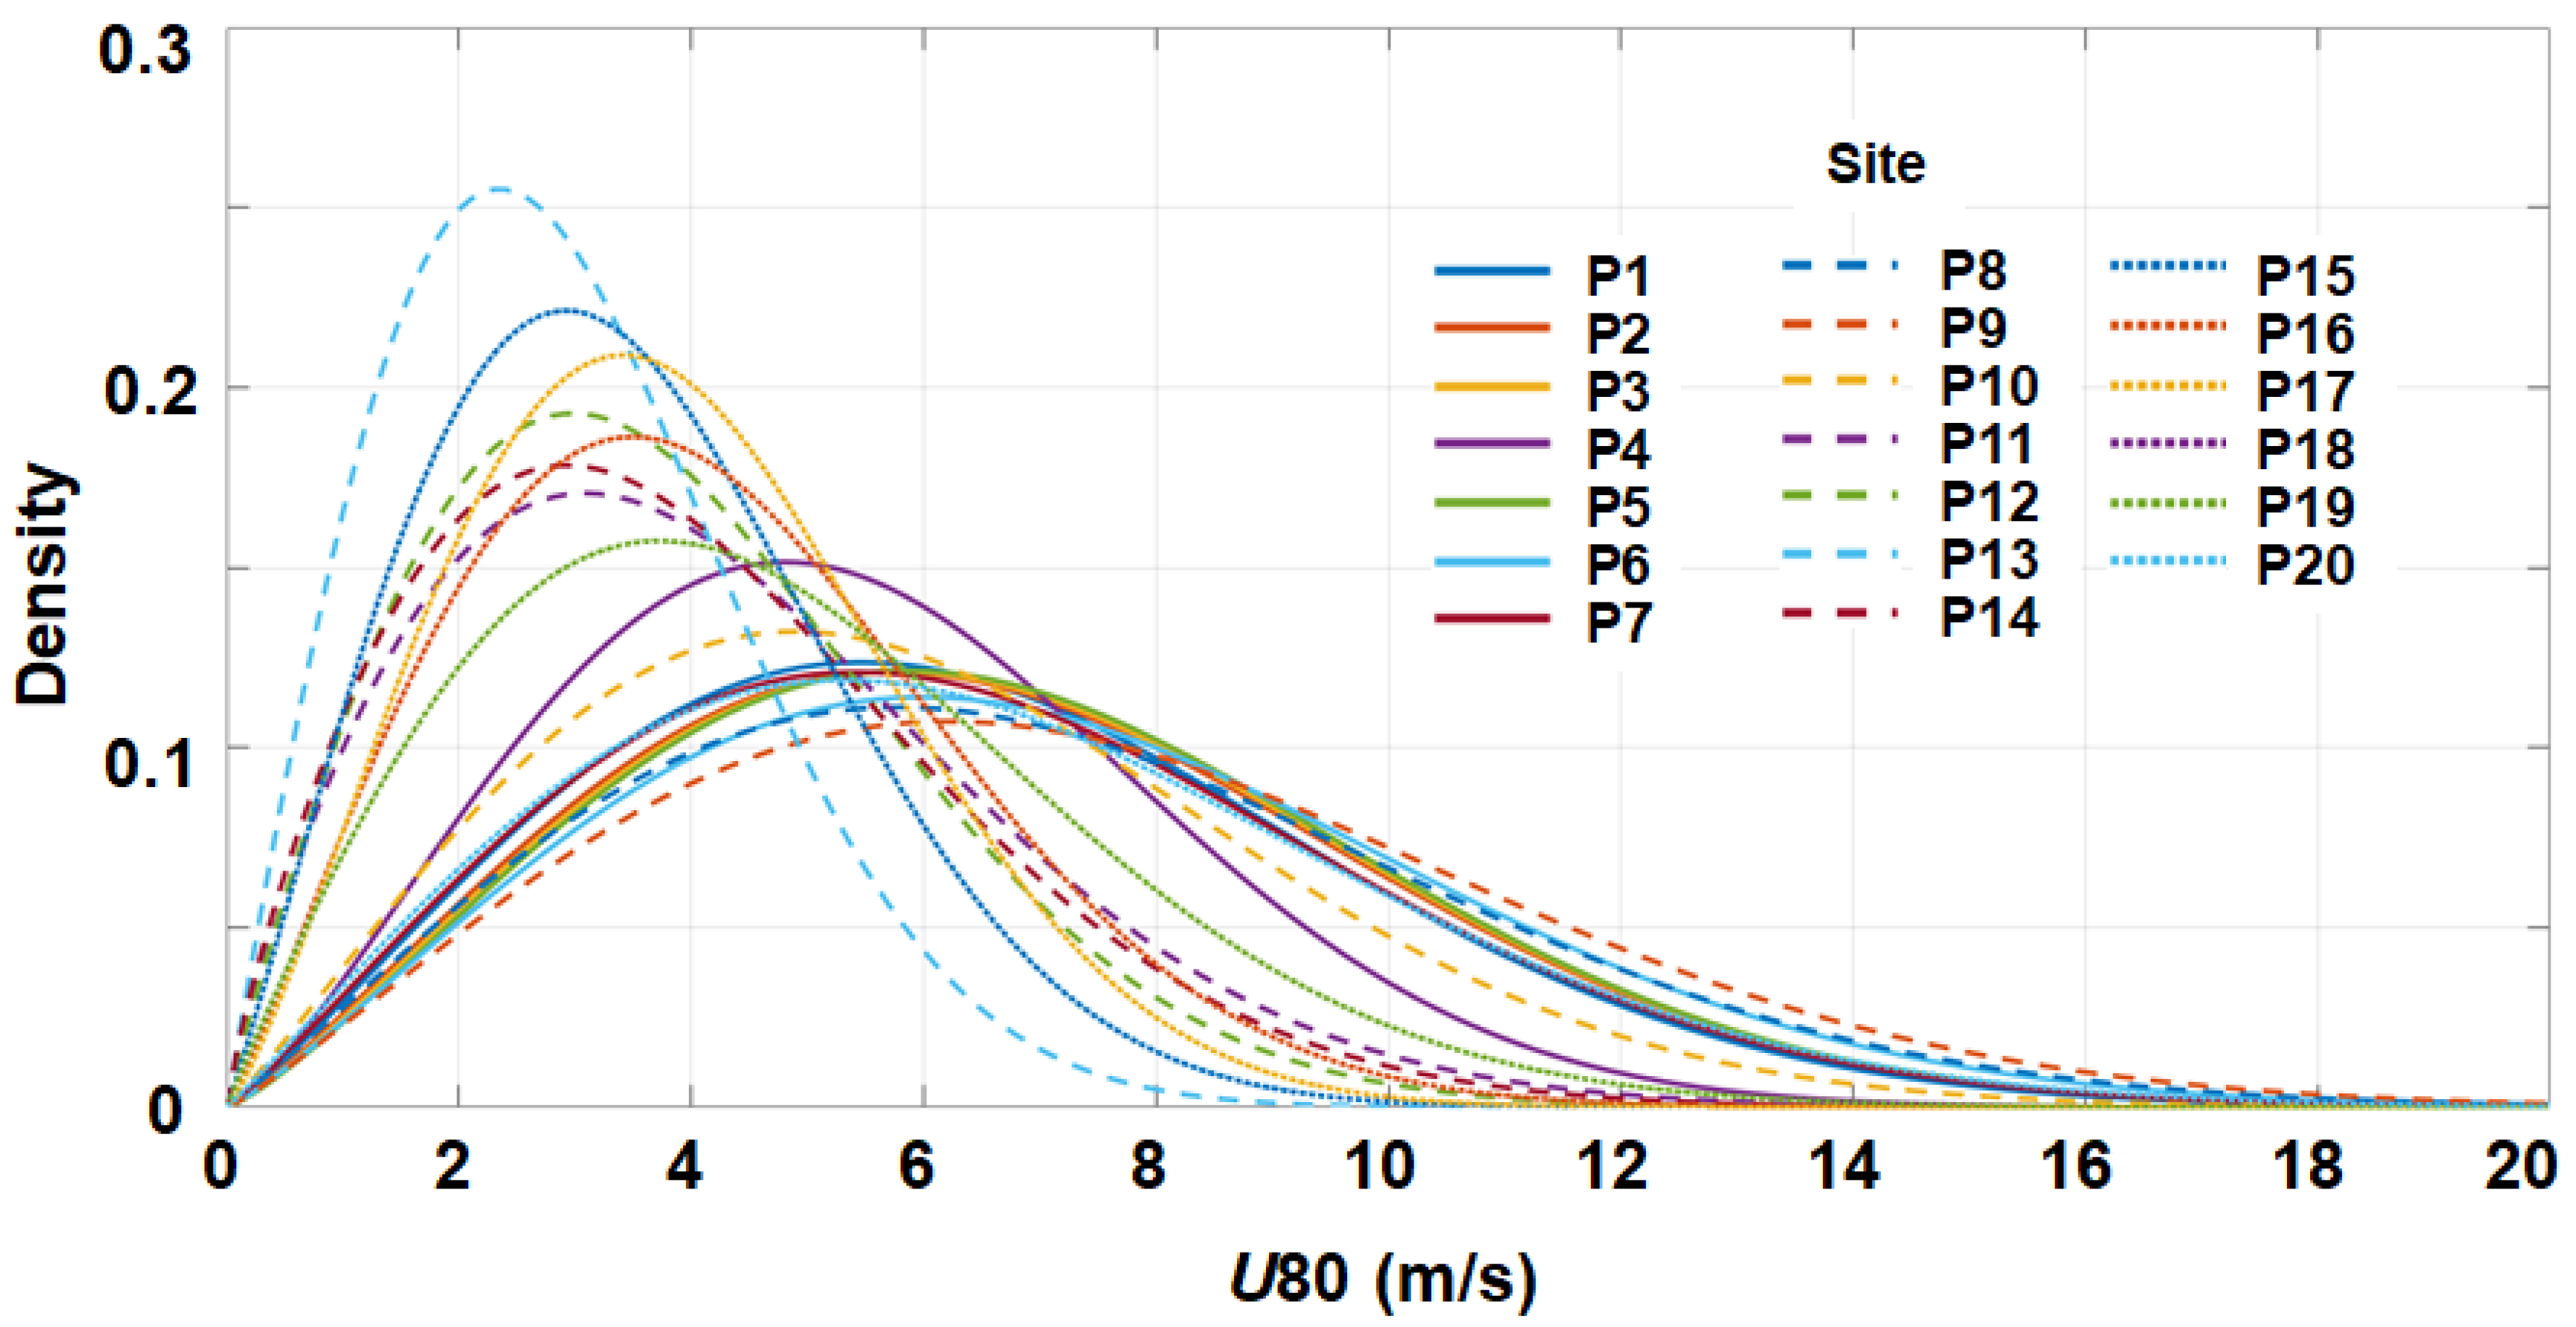
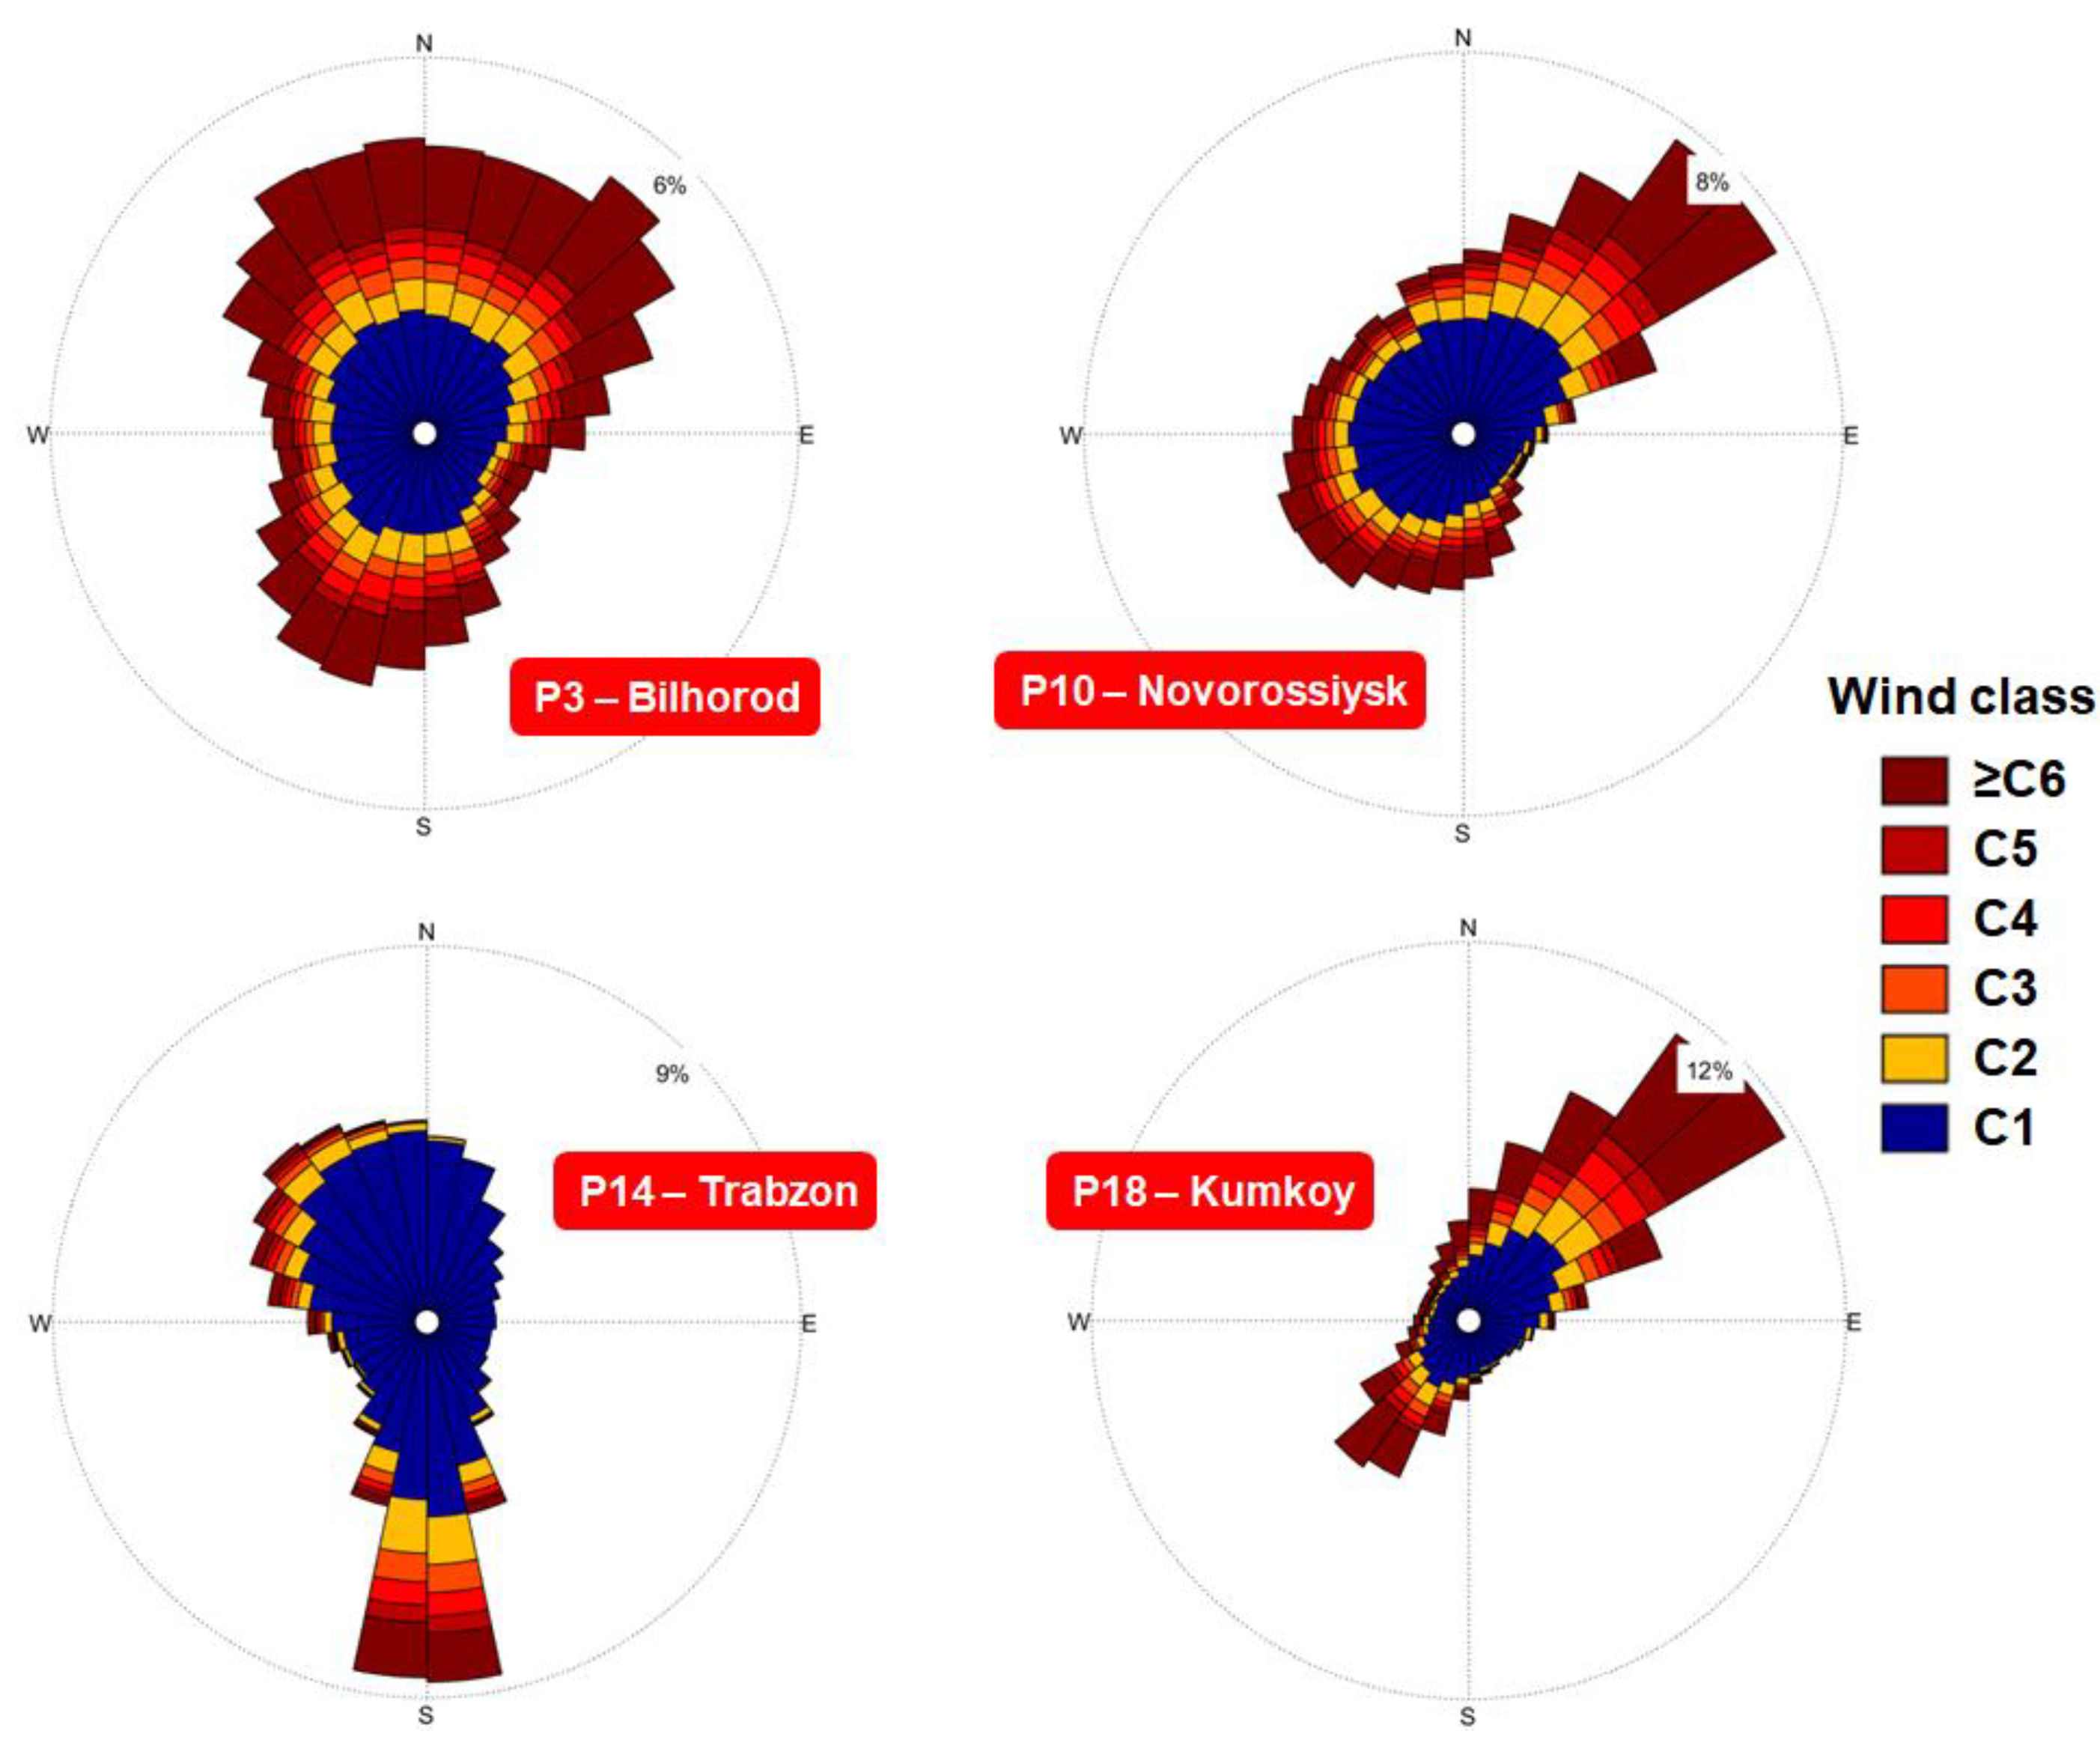
3.1. Analysis of the Wind Data
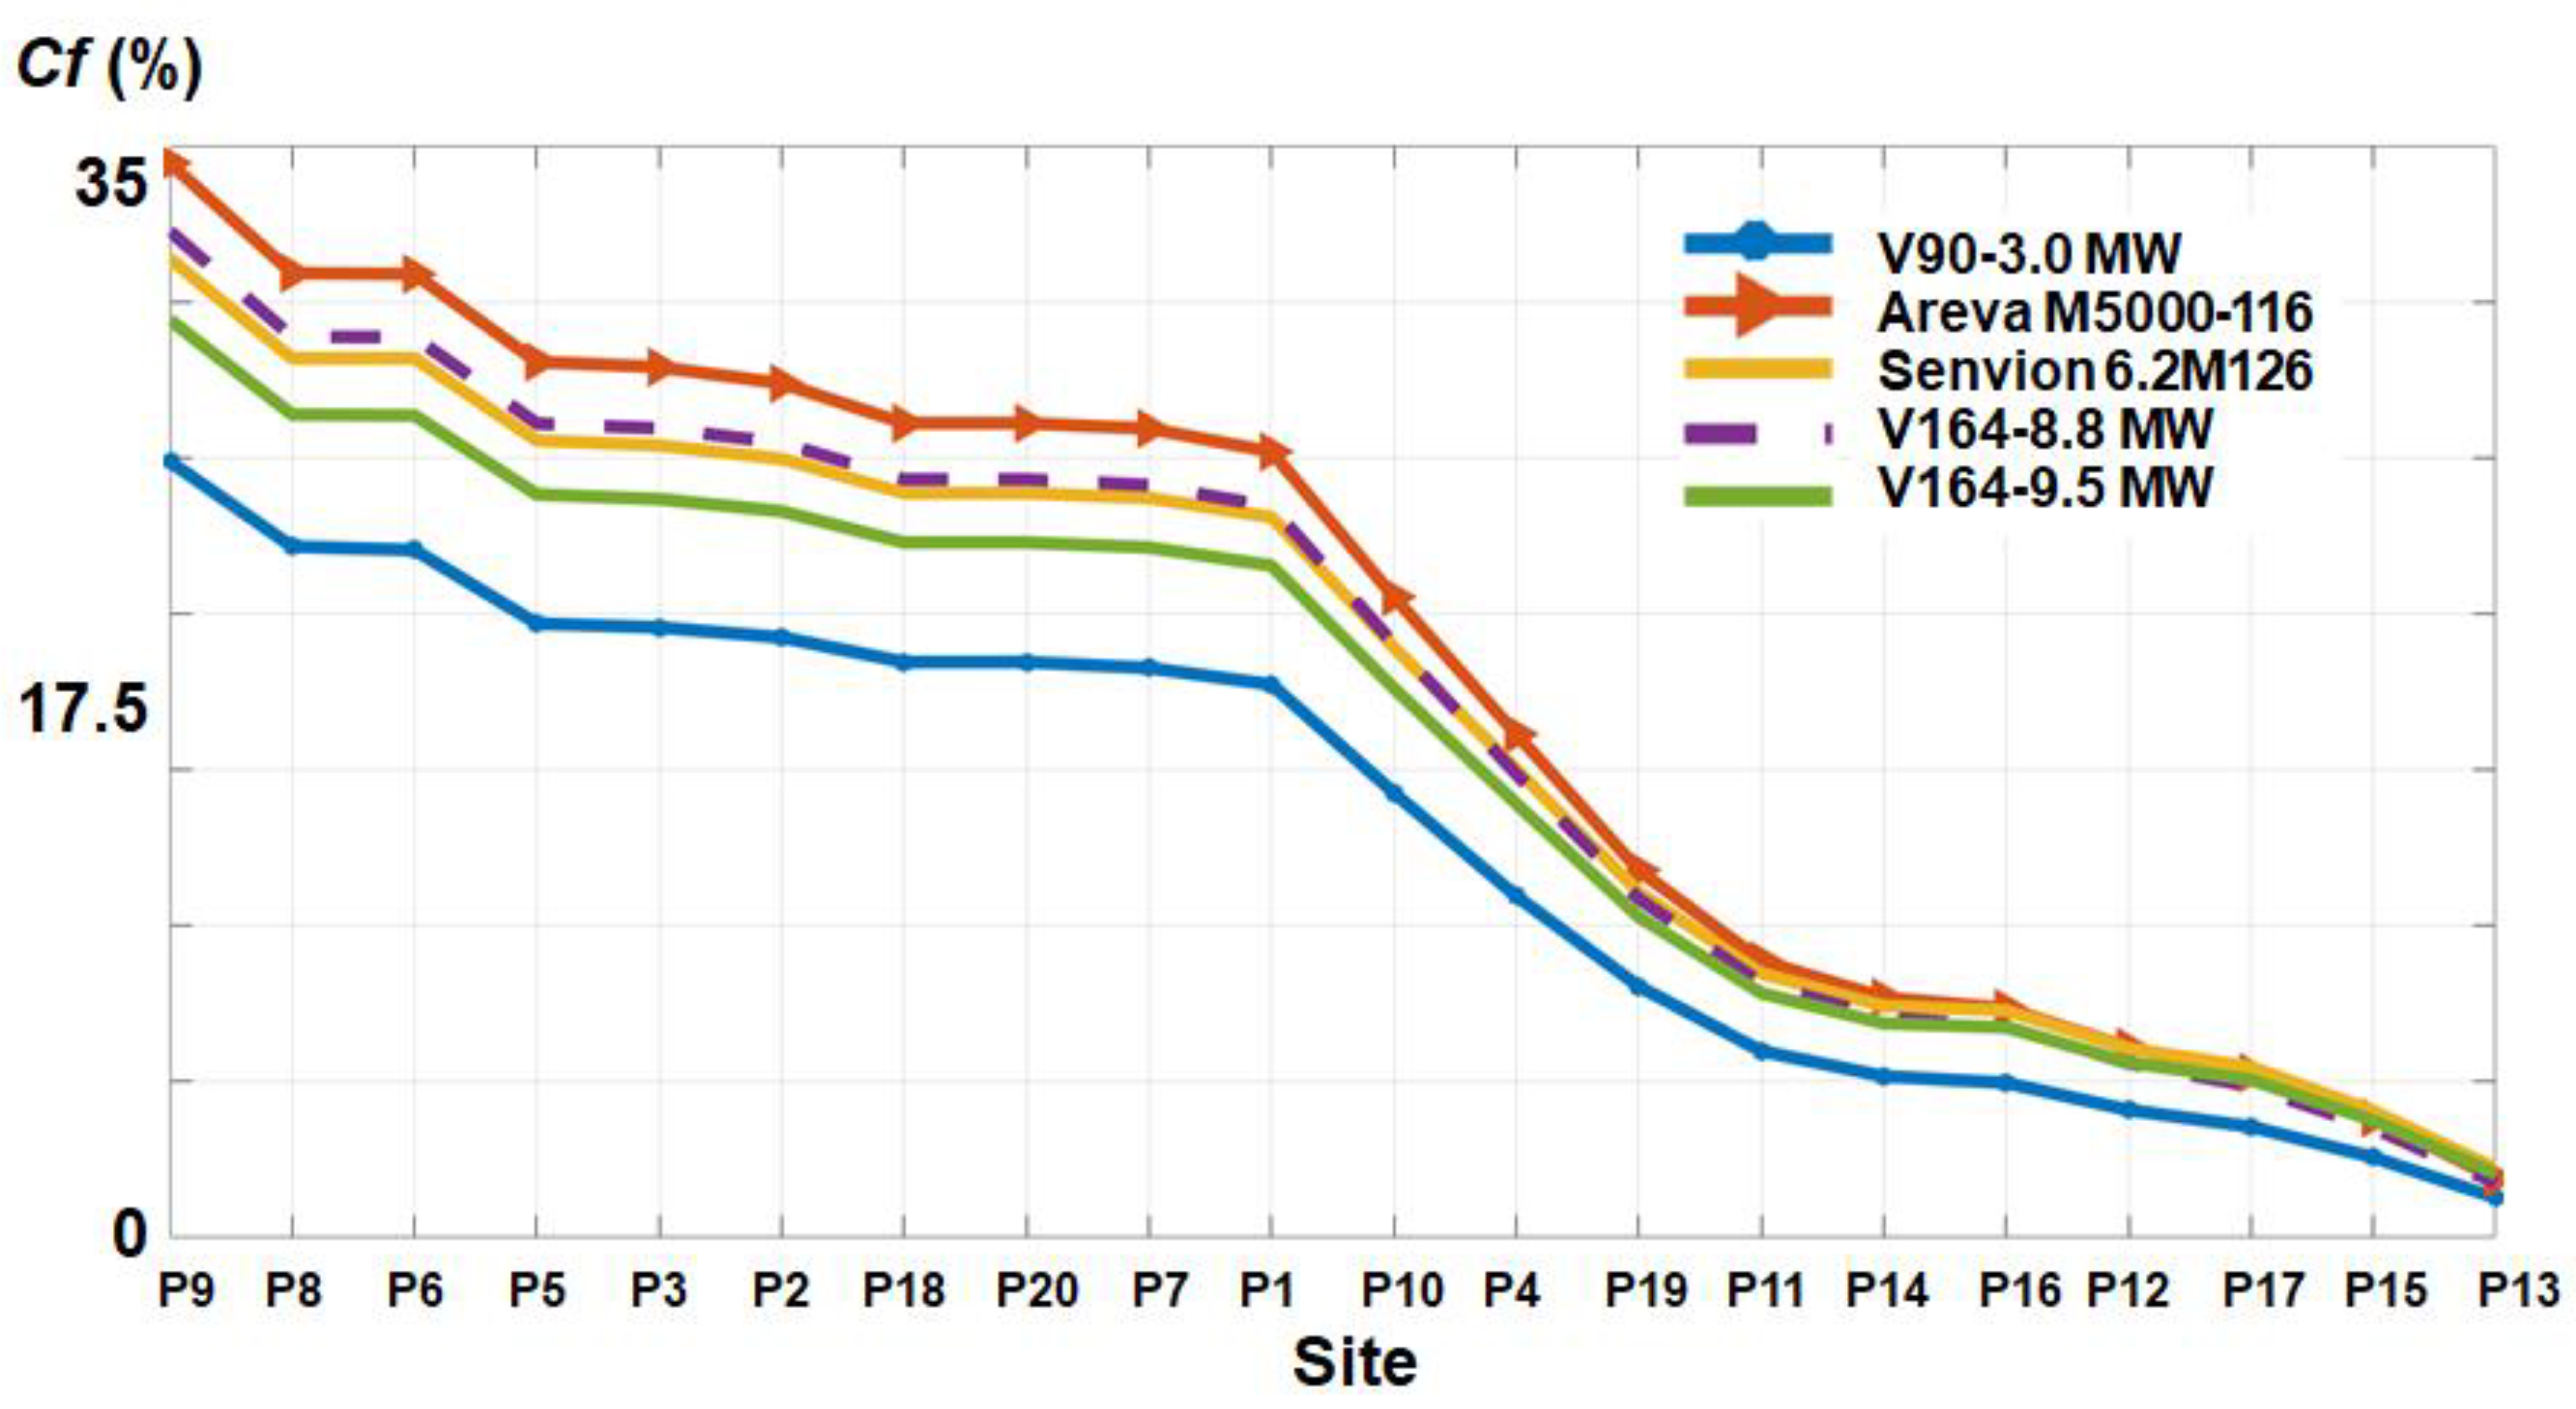
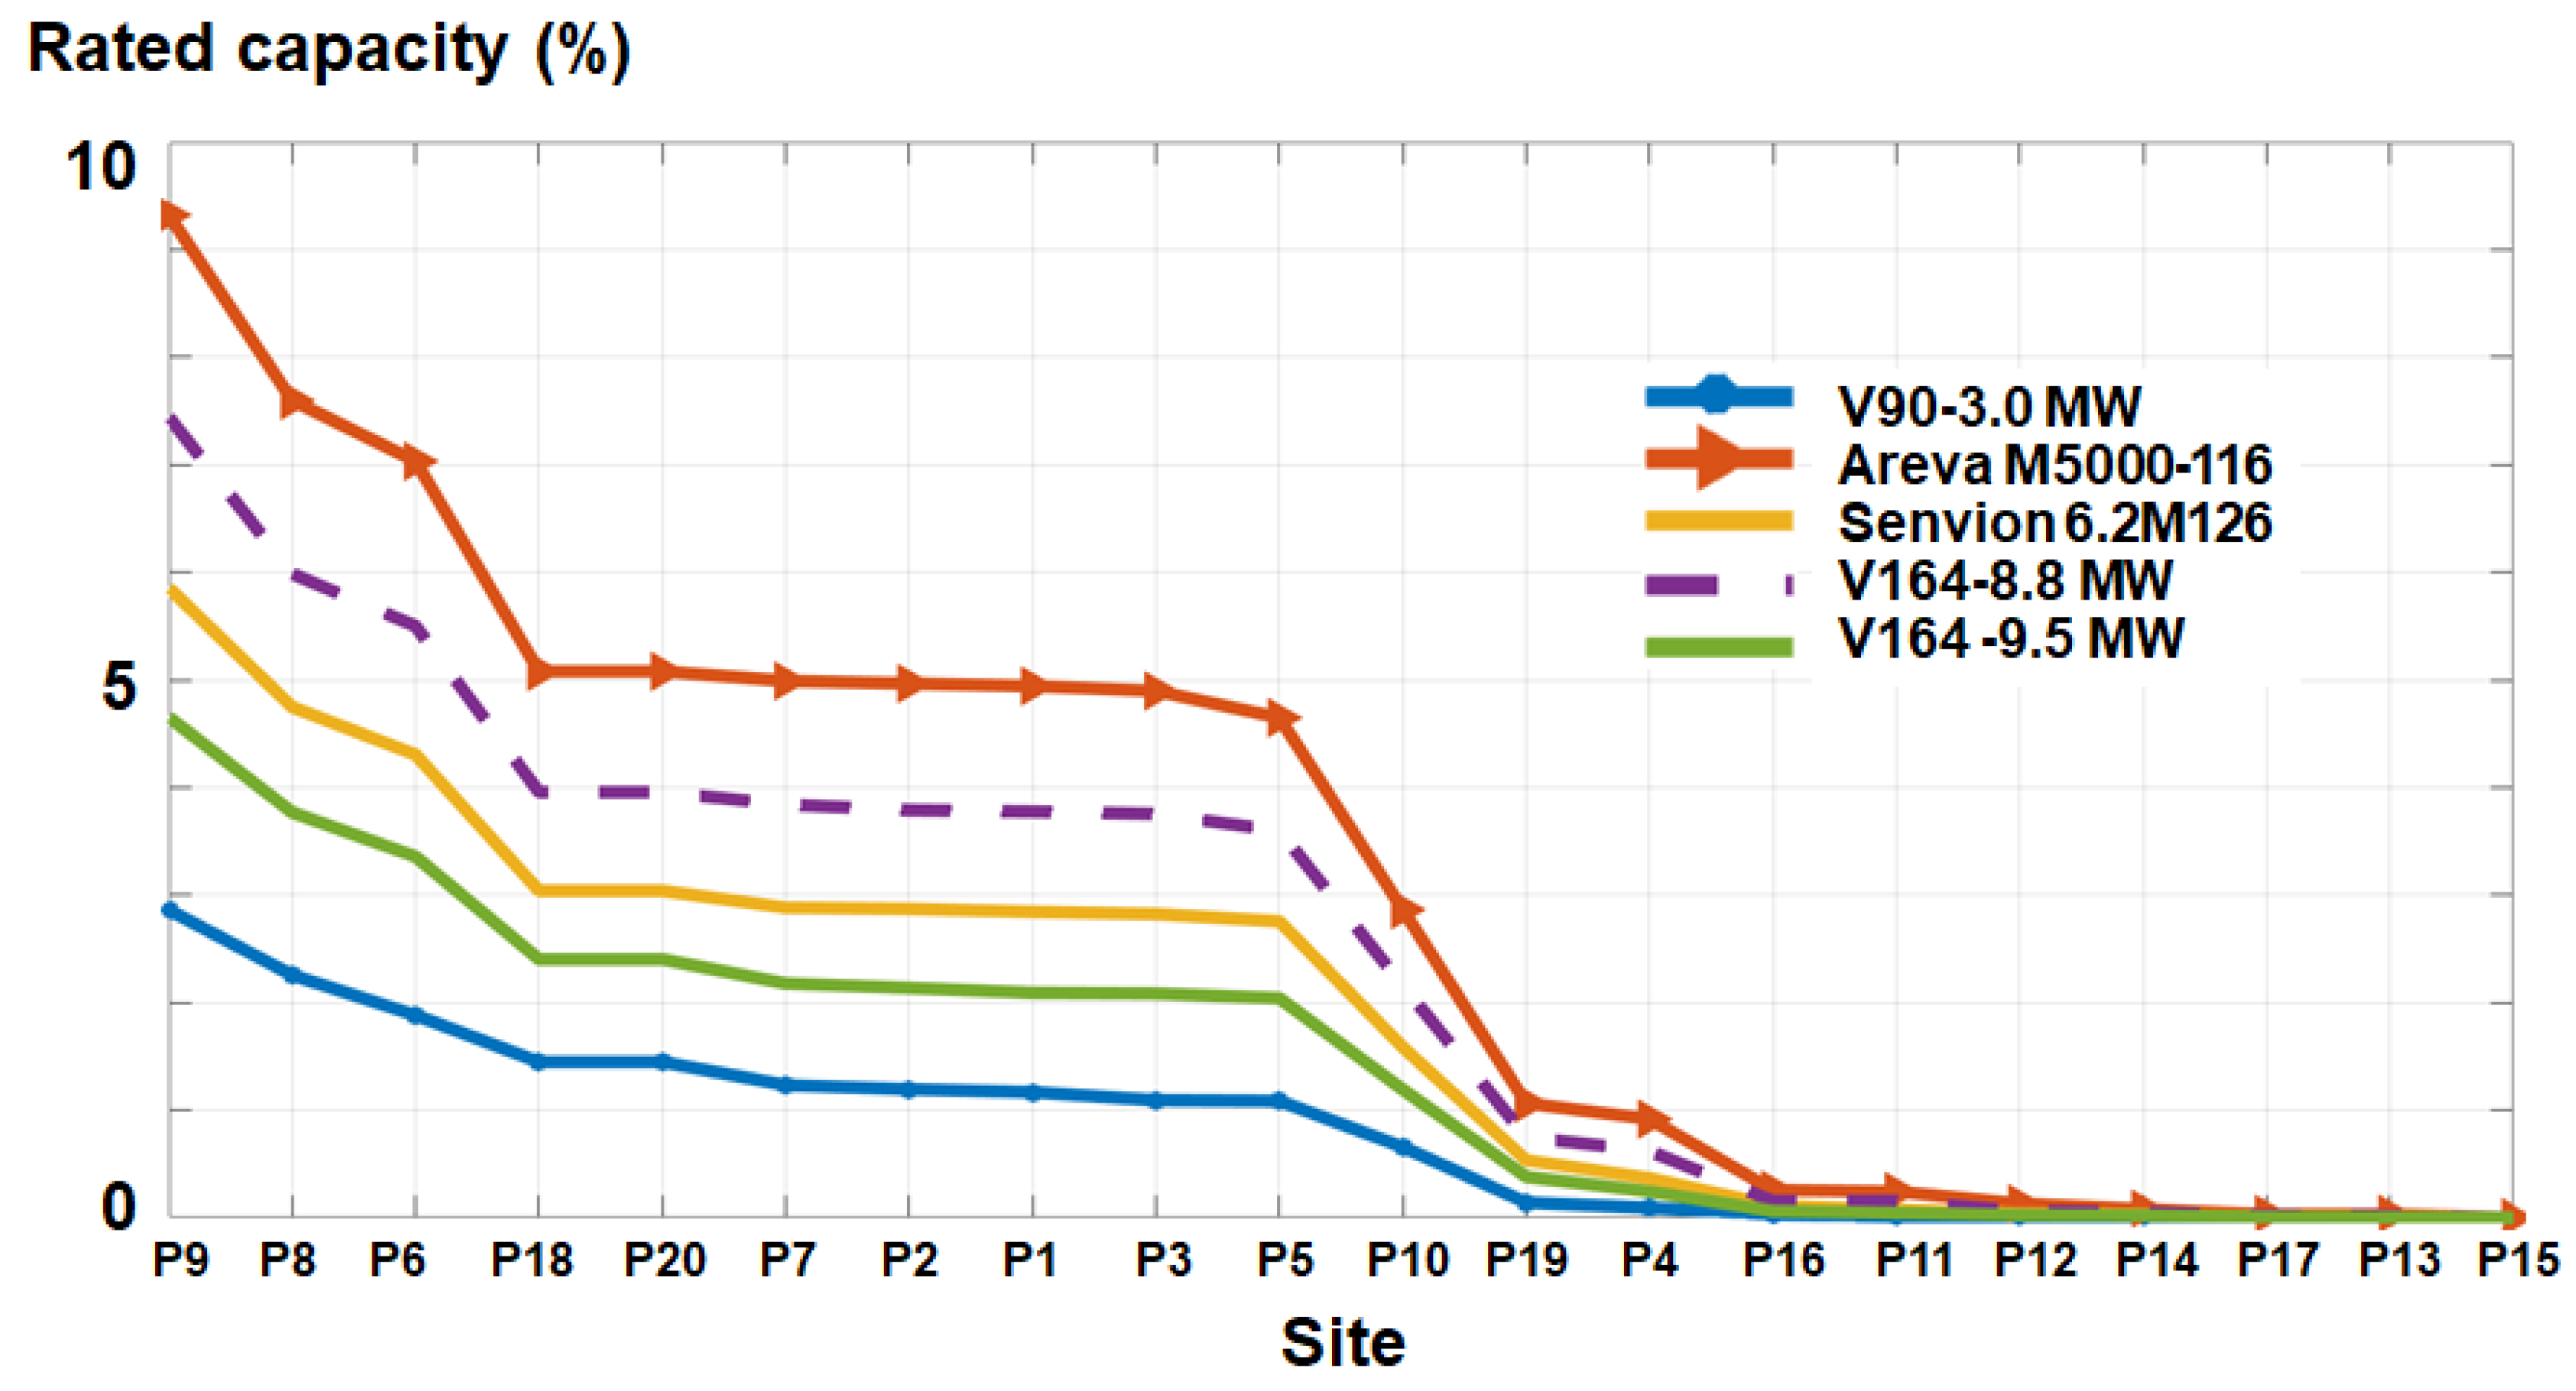
3.2. Evaluation of the Wind Turbine Performance
4. Discussion
5. Conclusions
- From the literature review, it was highlighted the fact that wind resources in the Black Sea are not very often evaluated from the point of view of a renewable energy project, most of the research being focused on climatological studies or calibrations of the numerical models.
- The Crimea Peninsula seems to present the most attractive wind resources, but considering the current geopolitical situation, the likelihood of a wind project in the near future in those coastal waters is not high.
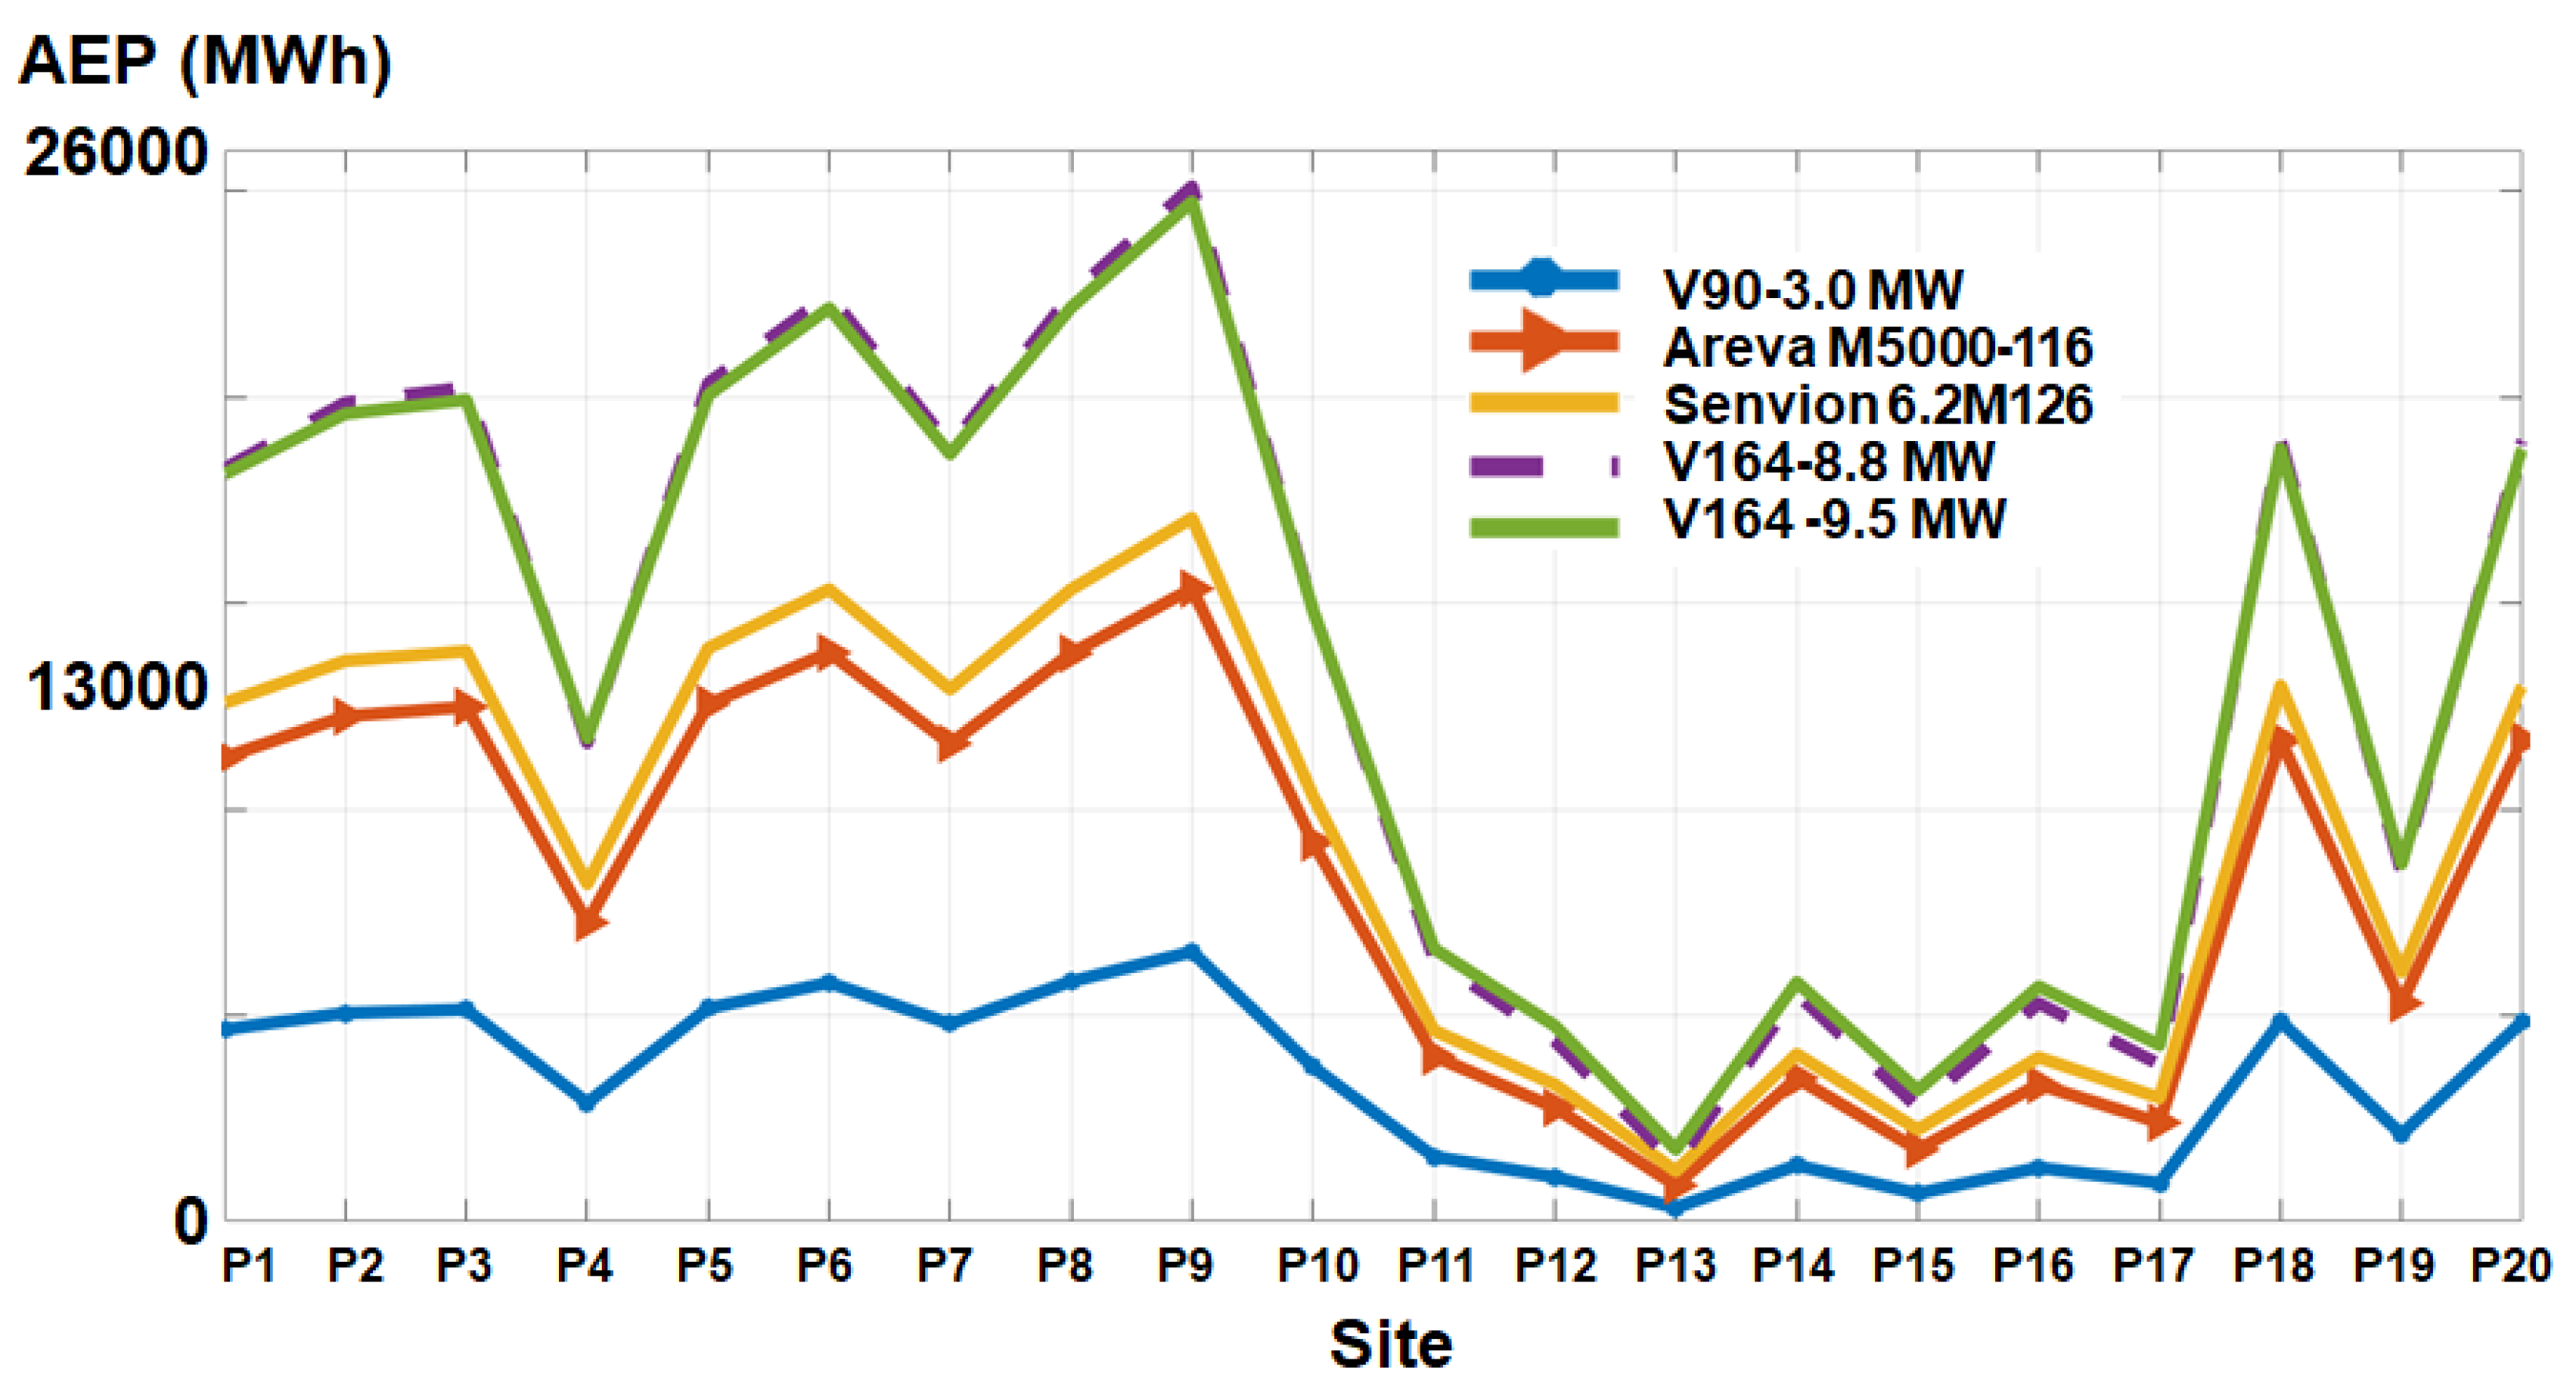
- Considering the expected performances of the V90-3.0 MW, we can say that this is not a viable candidate for the Black Sea area. A lower rated wind speed system, such as Areva M5000-116, seems to be more efficient for this coastal environment.
- A wind project, including high capacity turbines, seems to be more productive in the western and northern parts of the Black Sea (Sectors A and B). There is a significant difference between the results reported by Senvion 6.2M126 and V164-8.8 MW or V164-9.5 MW, while for latter two turbines the results are almost identical in the case of the AEP index. For most sites, better results are reported by the system rated at 8.8 MW.
- Based on the electricity production statistics and the computed AEP values, it was possible to estimate the required number of turbines to reach at least 1% of the national share. The results indicate that, for the western part of the Black Sea, this target can be easily achieved throughout one or two wind farms projects.
Author Contributions
Funding
Acknowledgments
Conflicts of Interest
Nomenclature
| ACCWA | Assessment of the Climate Change effects on the WAve conditions in the Black Sea |
| AEP | Annual Electricity Production |
| AVISO | Archiving, Validation and Interpretation of Satellite Oceanographic Data |
| DAMWAVE | Data Assimilation Methods for improving the WAVE predictions in the Romanian nearshore of the Black Sea |
| ECMWF | European Centre for Medium-Range Weather Forecasts |
| NaN | Not A Number |
| Cf | capacity factor |
| T | average hours per year (8760 h/year) |
| U10 | wind speed reported at 10 m above sea level |
| U80 | wind speed reported at 80 m above sea level |
| roughness of the sea surface (0.01 m) | |
| P(u) | power curve of a turbine |
| f(u) | Weibull probability density function |
| ; | reference heights |
References
- Ji, Q.; Zhang, D.; Geng, J. Information linkage, dynamic spillovers in prices and volatility between the carbon and energy markets. J. Clean. Prod. 2018, 198, 972–978. [Google Scholar] [CrossRef]
- Wang, Y.; Guo, Z. The dynamic spillover between carbon and energy markets: New evidence. Energy 2018, 149, 24–33. [Google Scholar] [CrossRef]
- Child, M.; Koskinen, O.; Linnanen, L.; Breyer, C. Sustainability guardrails for energy scenarios of the global energy transition. Renew. Sustain. Energy Rev. 2018, 91, 321–334. [Google Scholar] [CrossRef]
- Armeanu, D.Ş.; Vintilă, G.; Gherghina, Ş.C. Does Renewable Energy Drive Sustainable Economic Growth? Multivariate Panel Data Evidence for EU-28 Countries. Energies 2017, 10, 381. [Google Scholar] [CrossRef]
- Karakosta, C. A holistic approach for addressing the issue of effective technology transfer in the frame of climate change. Energies 2016, 9, 503. [Google Scholar] [CrossRef]
- Castro-Santos, L.; Martins, E.; Guedes Soares, C. Methodology to calculate the costs of a floating offshore renewable energy farm. Energies 2016, 9, 324. [Google Scholar] [CrossRef]
- Willis, D.J.; Niezrecki, C.; Kuchma, D.; Hines, E.; Arwade, S.R.; Barthelmie, R.J.; DiPaola, M.; Drane, P.J.; Hansen, C.J.; Inalpolat, M. Wind energy research: State-of-the-art and future research directions. Renew. Energy 2018, 125, 133–154. [Google Scholar] [CrossRef]
- Poulsen, T.; Hasager, C.B. The Revolution of China: Offshore Wind Diffusion. Energies 2017, 10, 2153. [Google Scholar] [CrossRef]
- Lapworth, A. The diurnal variation of the marine surface wind in an offshore flow. Q. J. R. Meteorol. Soc. 2005, 131, 2367–2387. [Google Scholar] [CrossRef] [Green Version]
- Global Statistics. Available online: http://gwec.net/global-figures/graphs/ (accessed on 15 August 2018).
- The European Offshore Wind Industry–Key Trends and Statistics 2017. Available online: https://windeurope.org/about-wind/statistics/offshore/european-offshore-wind-industry-key-trends-statistics-2017/ (accessed on 15 August 2018).
- Rusu, E.; Onea, F. Joint Evaluation of the Wave and Offshore Wind Energy Resources in the Developing Countries. Energies 2017, 10, 1866. [Google Scholar] [CrossRef]
- Rusu, L.; Onea, F. The performance of some state-of-the-art wave energy converters in locations with the worldwide highest wave power. Renew. Sustain Energy Rev. 2017, 75, 1348–1362. [Google Scholar] [CrossRef]
- Rusu, L.; Bernardino, M.; Guedes Soares, C. Wind and wave modelling in the Black Sea. J. Oper. Oceanogr. 2014, 7, 5–20. [Google Scholar] [CrossRef] [Green Version]
- Rusu, L.; Ganea, D.; Mereuta, E. A joint evaluation of wave and wind energy resources in the Black Sea based on 20-year hindcast information. Energy Explor. Exploit. 2018, 36, 335–351. [Google Scholar] [CrossRef]
- Valchev, N.N.; Trifonova, E.V.; Andreeva, N.K. Past and recent trends in the western black sea storminess. Nat. Hazards Earth Syst. Sci. 2012, 12, 961–977. [Google Scholar] [CrossRef]
- Onea, F.; Rusu, E. Wind energy assessments along the Black Sea basin. Meteorol. Appl. 2014, 21, 316–329. [Google Scholar] [CrossRef]
- Akpinar, A.; Ponce de León, S. An assessment of the wind re-analyses in the modelling of an extreme sea state in the black sea. Dyn. Atmos. Ocean. 2016, 73, 61–75. [Google Scholar] [CrossRef]
- Koletsis, I.; Kotroni, V.; Lagouvardos, K.; Soukissian, T. Assessment of offshore wind speed and power potential over the mediterranean and the black seas under future climate changes. Renew. Sustain. Energy Rev. 2016, 60, 234–245. [Google Scholar] [CrossRef]
- Damwave. Available online: http://www.im.ugal.ro/DAMWAVE/index_engleza.htm (accessed on 25 March 2018).
- ACCWA. Available online: http://193.231.148.42/accwa/index_en.php# (accessed on 25 March 2018).
- Davy, R.; Gnatiuk, N.; Pettersson, L.; Bobylev, L. Climate change impacts on wind energy potential in the European domain with a focus on the Black Sea. Renew. Sustain. Energy Rev. 2018, 81, 1652–1659. [Google Scholar] [CrossRef] [Green Version]
- Onea, F.; Rusu, E. An Evaluation of the Wind Energy in the North-West of the Black Sea. Int. J. Green Energy 2014, 11, 465–487. [Google Scholar] [CrossRef]
- Ilkiliç, C.; Aydin, H. Wind power potential and usage in the coastal regions of turkey. Renew. Sustain. Energy Rev. 2015, 44, 78–86. [Google Scholar] [CrossRef]
- Onea, F.; Rusu, E. Efficiency assessments for some state of the art wind turbines in the coastal environments of the black and the caspian seas. Energy Explor. Exploit. 2016, 34, 217–234. [Google Scholar] [CrossRef]
- Argın, M.; Yerci, V. The assessment of offshore wind power potential of Turkey. In Proceedings of the 2015 9th International Conference on Electrical and Electronics Engineering (ELECO), Bursa, Turkey, 26–28 November 2015; pp. 966–970. [Google Scholar]
- Raileanu, A.B.; Onea, F.; Rusu, E. Evaluation of the Offshore Wind Resources in the European Seas Based on Satellite Measurements. In Proceedings of the Conference: International Multidisciplinary Scientific GeoConferences SGEM, Albena, Bulgaria, 16–25 June 2015; pp. 227–234. [Google Scholar]
- Arkhipkin, V.S.; Gippius, F.N.; Koltermann, K.P.; Surkova, G.V. Wind waves in the Black Sea: Results of a hindcast study. Nat. Hazards Earth Syst. Sci. 2014, 14, 2883–2897. [Google Scholar] [CrossRef]
- Kosarev, A.N. The Black Sea Environment; Springer-Verlag: Berlin, Germany, 2008; pp. 11–30. ISBN 978-3-540-74291-3. [Google Scholar]
- ERA-Interim. Available online: https://www.ecmwf.int/en/forecasts/datasets/archive-datasets/reanalysis-datasets/era-interim (accessed on 18 August 2018).
- Dee, D.P.; Uppala, S.M.; Simmons, A.J.; Berrisford, P.; Poli, P.; Kobayashi, S.; Andrae, U.; Balmaseda, M.A.; Balsamo, G.; Bauer, P. The ERA-Interim reanalysis: Configuration and performance of the data assimilation system. Q. J. R. Meteorol. Soc. 2011, 137, 553–597. [Google Scholar] [CrossRef]
- Zheng, C.; Xiao, Z.; Peng, Y.; Li, C.; Du, Z. Rezoning global offshore wind energy resources. Renew. Energy 2018, 129, 1–11. [Google Scholar] [CrossRef]
- Dupont, E.; Koppelaar, R.; Jeanmart, H. Global available wind energy with physical and energy return on investment constraints. Appl. Energy 2018, 209, 322–338. [Google Scholar] [CrossRef]
- Onea, F.; Rusu, E. Sustainability of the Reanalysis Databases in Predicting the Wind and Wave Power along the European Coasts. Sustainability 2018, 10, 193. [Google Scholar] [CrossRef]
- Carvalho, D.; Rocha, A.; Gómez-Gesteira, M.; Silva Santos, C. Offshore wind energy resource simulation forced by different reanalyses: Comparison with observed data in the iberian peninsula. Appl. Energy 2014, 134, 57–64. [Google Scholar] [CrossRef]
- Gallagher, S.; Tiron, R.; Whelan, E.; Gleeson, E.; Dias, F.; McGrath, R. The nearshore wind and wave energy potential of Ireland: A high resolution assessment of availability and accessibility. Renew. Energy 2016, 88, 494–516. [Google Scholar] [CrossRef]
- Wan, Y.; Fan, C.; Dai, Y.; Li, L.; Sun, W.; Zhou, P.; Qu, X. Assessment of the Joint Development Potential of Wave and Wind Energy in the South China Sea. Energies 2018, 11, 398. [Google Scholar] [CrossRef]
- Kim, H.-G.; Kim, J.-Y.; Kang, Y.-H. Comparative Evaluation of the Third-Generation Reanalysis Data for Wind Resource Assessment of the Southwestern Offshore in South Korea. Atmosphere 2018, 9, 73. [Google Scholar] [CrossRef]
- Mattar, C.; Borvarán, D. Offshore wind power simulation by using WRF in the central coast of Chile. Renew. Energy 2016, 94, 22–31. [Google Scholar] [CrossRef]
- MSWH/MWind: Aviso+. Available online: https://www.aviso.altimetry.fr/en/data/products/windwave-products/mswhmwind.html (accessed on 18 August 2018).
- Pujol, M.-I.; Faugère, Y.; Taburet, G.; Dupuy, S.; Pelloquin, C.; Ablain, M.; Picot, N. DUACS DT2014: The new multi-mission altimeter data set reprocessed over. Ocean Sci. 2016, 12, 1067–1090. [Google Scholar] [CrossRef]
- Global Offshore Wind Farms Database–4C Offshore. Available online: https://www.4coffshore.com/windfarms/ (accessed on 19 May 2018).
- Vestas V90-3.0-300 MW-Wind Turbine. Available online: https://en.wind-turbine-models.com/turbines/603-vestas-v90-3.0 (accessed on 29 July 2018).
- AREVA M5000-116-500 MW-Wind Turbine. Available online: https://en.wind-turbine-models.com/turbines/23-areva-m5000-116 (accessed on 29 July 2018).
- 6.2M126-Wind Turbine 6.2 MW. Available online: https://www.senvion.com/global/en/products-services/wind-turbines/6xm/62m126/ (accessed on 19 August 2018).
- MHI Vestas Offshore V164-8.8 MW-880 MW-Wind Turbine. Available online: https://en.wind-turbine-models.com/turbines/1819-mhi-vestas-offshore-v164-8.8-mw (accessed on 19 August 2018).
- MHI Vestas Offshore V164/9500–Manufacturers and turbines–Online Access–The Wind Power. Available online: https://www.thewindpower.net/turbine_en_1476_mhi-vestas-offshore_v164-9500.php (accessed on 19 August 2018).
- Onea, F.; Deleanu, L.; Rusu, L.; Georgescu, C. Evaluation of the wind energy potential along the Mediterranean Sea coasts. Energy Explor. Exploit. 2016, 34, 766–792. [Google Scholar] [CrossRef] [Green Version]
- Manwell, J.F.; McGowan, J.G.; Rogers, A.L. Wind Energy Explained: Theory, design and application. Wind Eng. 2006, 30, 169–170. [Google Scholar] [CrossRef]
- Carballo, R.; Iglesias, G. A methodology to determine the power performance of wave energy converters at a particular coastal location. Energy Convers. Manag. 2012, 61, 8–18. [Google Scholar] [CrossRef]
- Salvacao, N.; Guedes Soares, C. Wind resource assessment offshore the Atlantic Iberian coast with the WRF model. Energy 2018, 145, 276–287. [Google Scholar] [CrossRef]
- Dong, Y.; Peng, C.-Y.J. Principled missing data methods for researchers. SpringerPlus 2013, 2, 222. [Google Scholar] [CrossRef] [PubMed]
- Archer, C.L.; Jacobson, M.Z. Spatial and temporal distributions of US winds and wind power at 80 m derived from measurements. J. Geophys. Res. 2003, 108, 4289. [Google Scholar] [CrossRef]
- The World Factbook. Available online: https://www.cia.gov/library/publications/the-world-factbook/ (accessed on 15 Jun 2018).
- Onea, F.; Rusu, E. The expected efficiency and coastal impact of a hybrid energy farm operating in the Portuguese nearshore. Energy 2016, 97, 411–423. [Google Scholar] [CrossRef]


| No. | Site | Country | Sector | Long (o) | Lat (o) | Water Depth (m) | Distance from Coastline (km) |
|---|---|---|---|---|---|---|---|
| P1 | Constanta | Romania | A | 28.77 | 44.15 | 31 | 9.32 |
| P2 | Sulina | A | 29.90 | 45.09 | 28 | 7.17 | |
| P3 | Bilhorod-Dnistrovskyi | Ukraine | A | 30.82 | 45.78 | 26 | 42.37 |
| P4 | Odessa | A | 31.18 | 46.45 | 14 | 32 | |
| P5 | Chornomorske | Russia | A | 32.66 | 45.57 | 28 | 6.93 |
| P6 | Sevastopol | A | 33.36 | 44.58 | 32 | 1.46 | |
| P7 | Alushta | A | 34.45 | 44.66 | 30 | 3.16 | |
| P8 | Feodosia | B | 35.52 | 44.95 | 30 | 9.66 | |
| P9 | Kerch (*Azov Sea) | B | 36.48 | 45.61 | 11 | 18.11 | |
| P10 | Novorossiysk | B | 37.77 | 44.62 | 31 | 3.23 | |
| P11 | Sochi | B | 39.68 | 43.57 | 30 | 1.95 | |
| P12 | Sokhumi | C | 41.02 | 42.97 | 29 | 3.19 | |
| P13 | Batumi | Georgia | C | 41.56 | 41.64 | 31 | 3.59 |
| P14 | Trabzon | Turkey | C | 39.71 | 41.02 | 32 | 1.4 |
| P15 | Unye | C | 37.31 | 41.15 | 33 | 3.44 | |
| P16 | Sinop | D | 35.14 | 42.04 | 30 | 2.09 | |
| P17 | Zonguldak | D | 31.76 | 41.47 | 31 | 2.54 | |
| P18 | Kumkoy | D | 29.04 | 41.27 | 28 | 2.14 | |
| P19 | Primorsko | Bulgaria | D | 27.77 | 42.26 | 30 | 0.87 |
| P20 | Varna | D | 28.21 | 43.13 | 30 | 22.34 |
| Turbine | Rated Power (MW) | Cut-in Speed (m/s) | Rated Speed (m/s) | Cut-out Speed (m/s) | Hub Height (m) | Reference |
|---|---|---|---|---|---|---|
| V90-3.0 MW | 3 | 4 | 15 | 25 | 80–105 | [43] |
| Areva M5000-116 | 5 | 4 | 12.5 | 25 | 90 | [44] |
| Senvion 6.2M126 | 6.15 | 3.5 | 13.5 | 30 | 85–95 | [45] |
| V164-8.8 MW | 8.8 | 4 | 13 | 25 | 105–140 | [46] |
| V164-9.5 MW | 9.5 | 3.5 | 14 | 25 | 105–140 | [47] |
| Winter | Spring | ||||||
|---|---|---|---|---|---|---|---|
| U80 (m/s) | Dir (°) | C3–C6 (%) | U80 (m/s) | Dir (°) | C3–C6 (%) | ||
| P2 | 7.93 | 189.02 | 52.64 | P2 | 6.37 | 172.74 | 33.99 |
| P9 | 8.61 | 169.65 | 59.00 | P9 | 6.83 | 168.56 | 39.55 |
| P13 | 3.52 | 183.43 | 0.88 | P13 | 3.02 | 206.74 | 0.42 |
| P18 | 7.55 | 160.41 | 46.99 | P18 | 5.95 | 143.63 | 27.39 |
| Summer | Autumn | ||||||
| P2 | 5.52 | 167.66 | 21.52 | P2 | 6.93 | 165.84 | 39.88 |
| P9 | 6.32 | 156.63 | 34.26 | P9 | 7.88 | 154.94 | 50.86 |
| P13 | 2.41 | 239.98 | 0.04 | P13 | 2.91 | 195.09 | 0.78 |
| P18 | 5.98 | 97.85 | 29.47 | P18 | 6.58 | 130.94 | 36.78 |
| Winter | Spring | ||||||||||
|---|---|---|---|---|---|---|---|---|---|---|---|
| Turbine | T1 | T2 | T3 | T4 | T5 | T1 | T2 | T3 | T4 | T5 | |
| P2 | 7325 | 17,303 | 19,155 | 29,187 | 28,654 | P2 | 4458 | 11,016 | 12,188 | 18,497 | 18,219 |
| P9 | 8748 | 20,042 | 22,320 | 33,925 | 33,431 | P9 | 5561 | 13,207 | 14,699 | 22,274 | 21,989 |
| P13 | 593 | 1537 | 2053 | 2622 | 3129 | P13 | 338 | 880 | 1236 | 1510 | 1893 |
| P18 | 6827 | 15,806 | 17,637 | 26,750 | 26,457 | P18 | 3870 | 9468 | 10,608 | 15,934 | 15,856 |
| Summer | Autumn | ||||||||||
| P2 | 3033 | 7575 | 8544 | 12,721 | 12,785 | P2 | 5453 | 13,229 | 14,623 | 22,254 | 21,866 |
| P9 | 4468 | 11,038 | 12,210 | 18,507 | 18,217 | P9 | 7428 | 17,225 | 19,180 | 29,165 | 28,716 |
| P13 | 94 | 254 | 458 | 451 | 726 | P13 | 320 | 836 | 1153 | 1423 | 1760 |
| P18 | 3704 | 9381 | 10,369 | 15,672 | 15457 | P18 | 5025 | 12,121 | 13,472 | 20,414 | 20,145 |
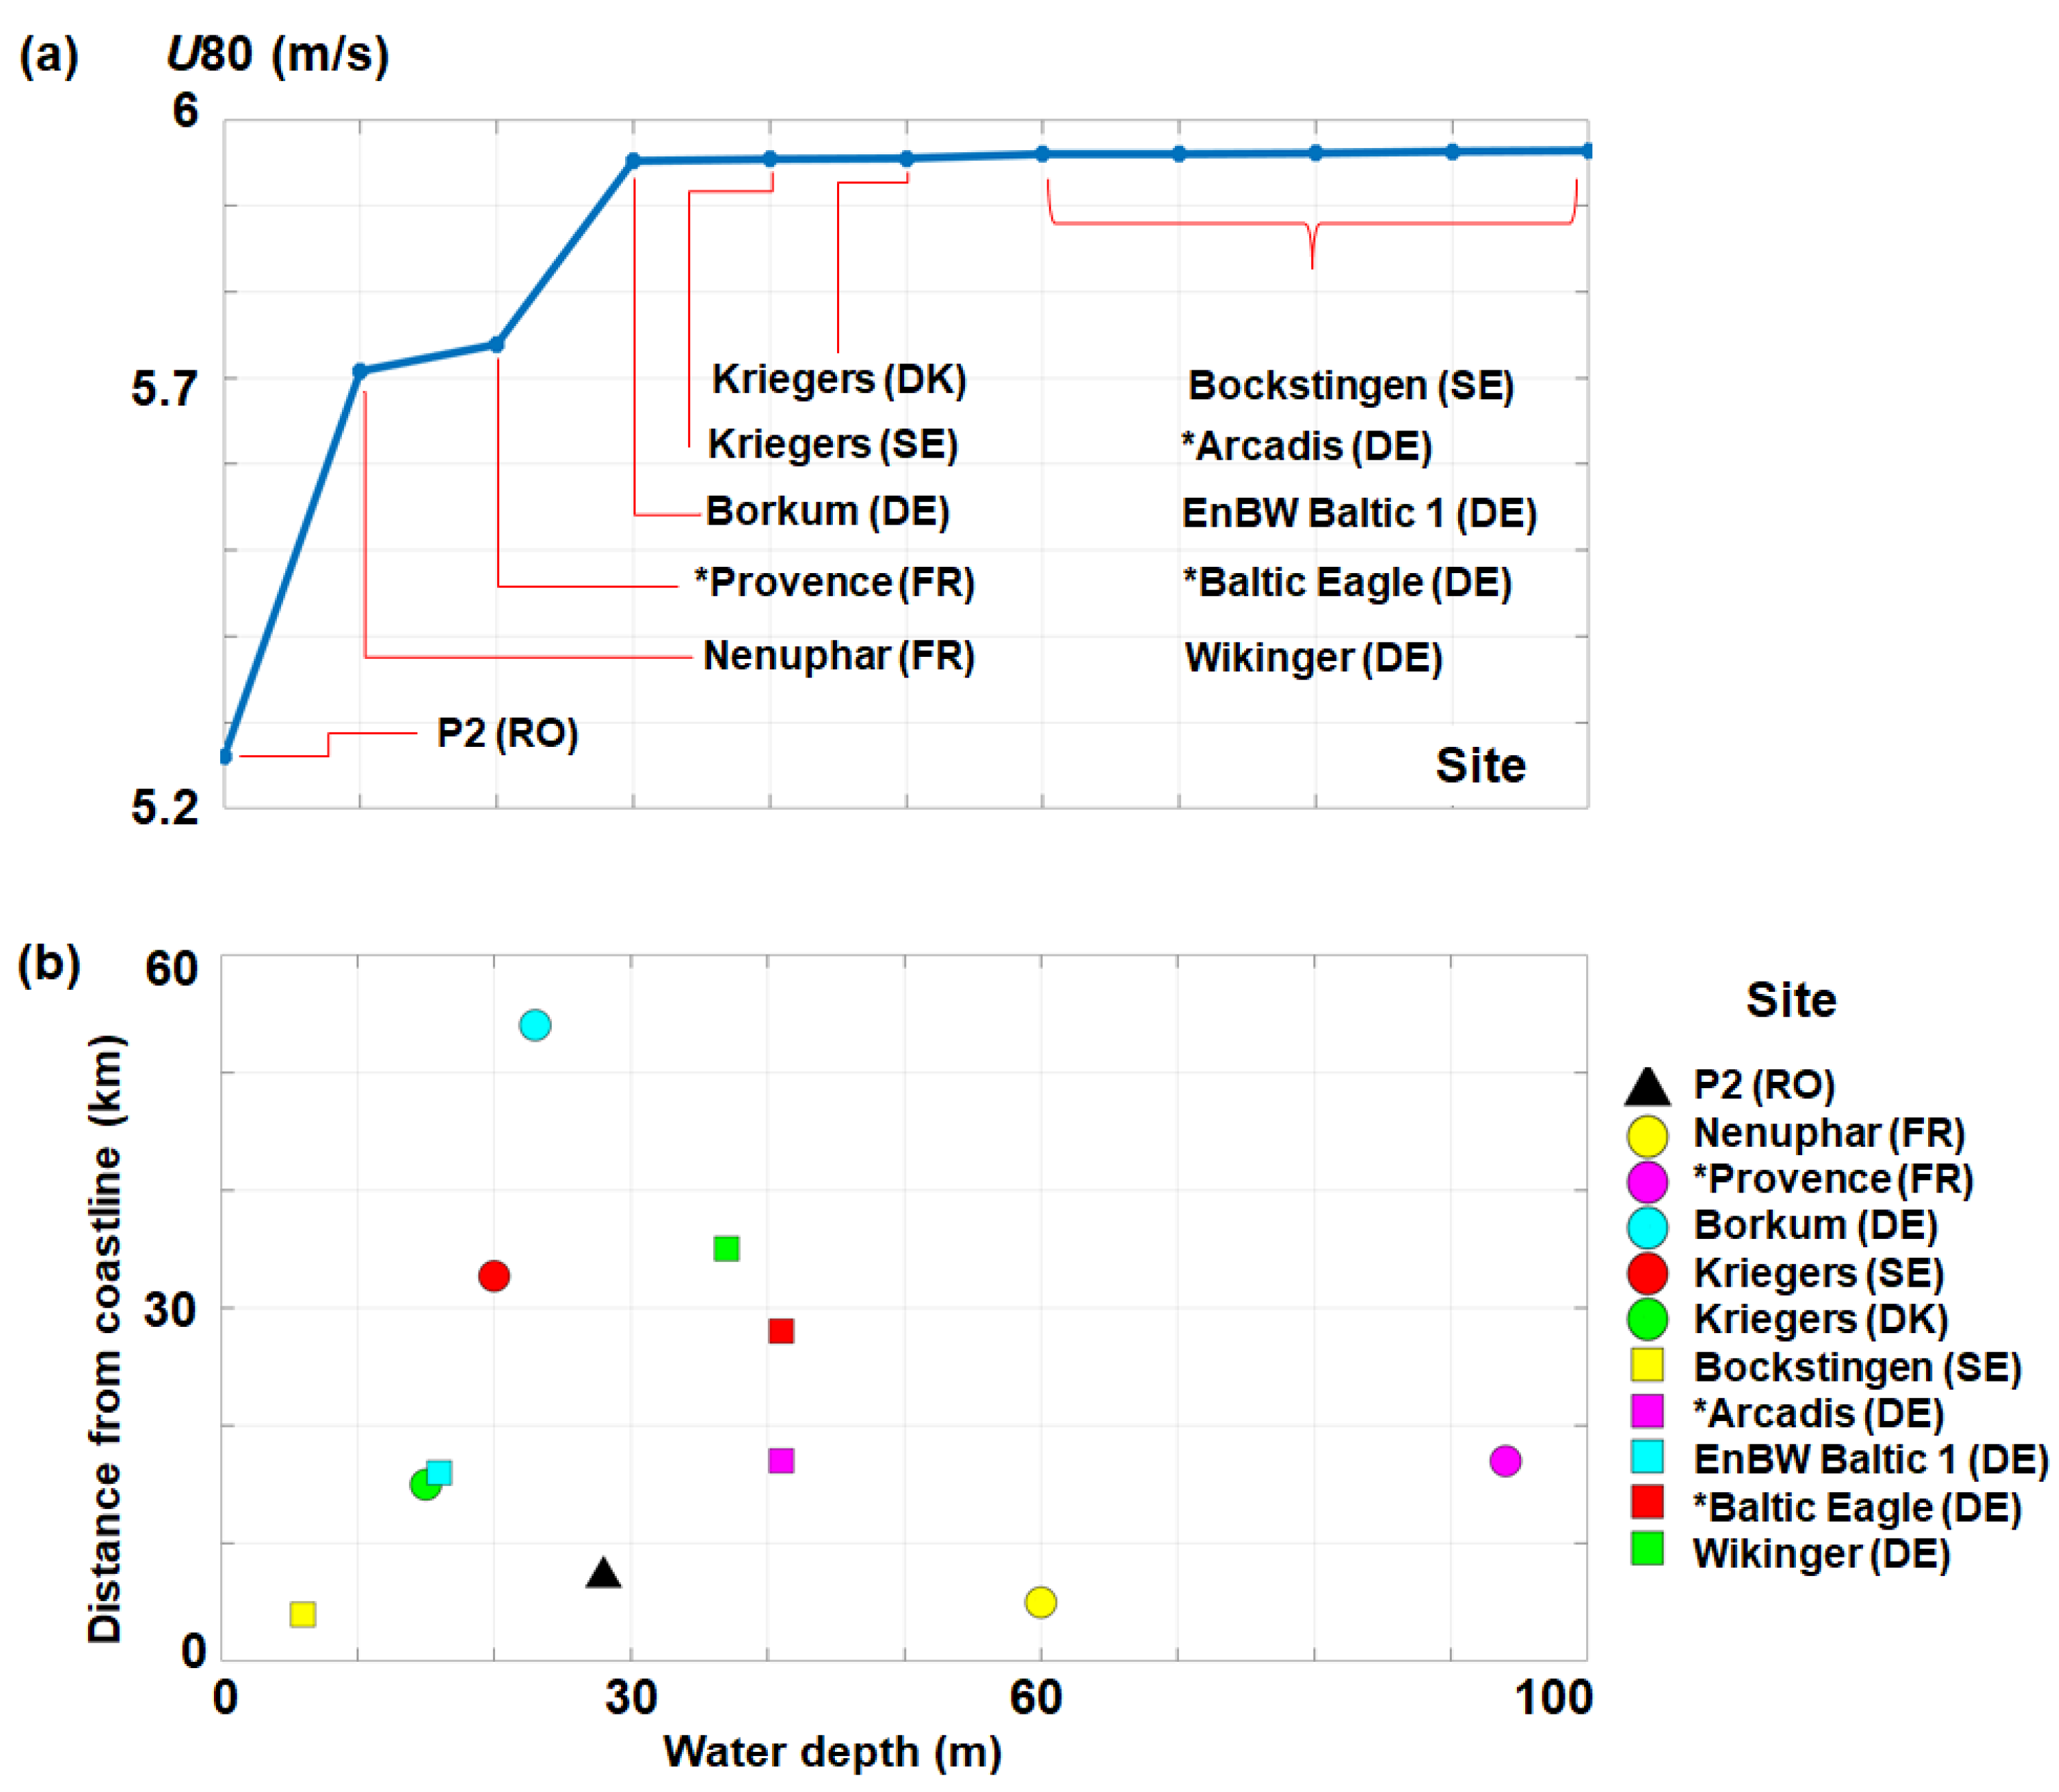
| No. | Project | Country | Status | Project Capacity (MW) | Turbine Model | Water Depth (m) | Distance from Coastline (km) |
|---|---|---|---|---|---|---|---|
| 1 | Nénuphar (test site) | France | Consent authorized | 10 | Not decided | 60–70 | 5 |
| 2 | Provence (floating) | France | Early planning | 24 | SWT-8.0-154 | 94–104 | 17 |
| 3 | Borkum Riffgrund 1 | Germany | Operational | 582 | SWT-6.0-154 | 28–34 | 45 |
| 4 | Kriegers Flak II | Sweden | Consent authorized | 640 | Not decided | 20–40 | 32.7 |
| 5 | Kriegers Flak | Denmark | Pre-construction | 590 | SG 8.0-167 DD | 15–30 | 15 |
| 6 | Bockstingen | Sweden | Operational | 2.75 | Wind World 550 kW | 6 | 4 |
| 7 | Arcadis Ost 1 | Germany | Consent authorized | 247 | Haliade 150-6 MW | 41–46 | 17 |
| 8 | EnBW Baltic 1 | Germany | Operational | 48.3 | SWT-2.3-93 | 16–19 | 16 |
| 9 | Baltic Eagle | Germany | Consent authorized | 476 | Not decided | 41–44 | 28 |
| 10 | Wikinger | Germany | Operational | 350 | AD 5-135 | 37–43 | 35 |
© 2018 by the authors. Licensee MDPI, Basel, Switzerland. This article is an open access article distributed under the terms and conditions of the Creative Commons Attribution (CC BY) license (http://creativecommons.org/licenses/by/4.0/).
Share and Cite
Onea, F.; Rusu, L. Evaluation of Some State-Of-The-Art Wind Technologies in the Nearshore of the Black Sea. Energies 2018, 11, 2452. https://doi.org/10.3390/en11092452
Onea F, Rusu L. Evaluation of Some State-Of-The-Art Wind Technologies in the Nearshore of the Black Sea. Energies. 2018; 11(9):2452. https://doi.org/10.3390/en11092452
Chicago/Turabian StyleOnea, Florin, and Liliana Rusu. 2018. "Evaluation of Some State-Of-The-Art Wind Technologies in the Nearshore of the Black Sea" Energies 11, no. 9: 2452. https://doi.org/10.3390/en11092452