Electrical Treeing in Cable Insulation under Different HVDC Operational Conditions


Abstract
:1. Introduction
2. Sample Preparation
3. Experiment Setup and Test Procedure
4. Experimental Results
4.1. Electrical Treeing under Pure HVDC
4.2. Electrical Treeing under Polarity Reversing HVDC
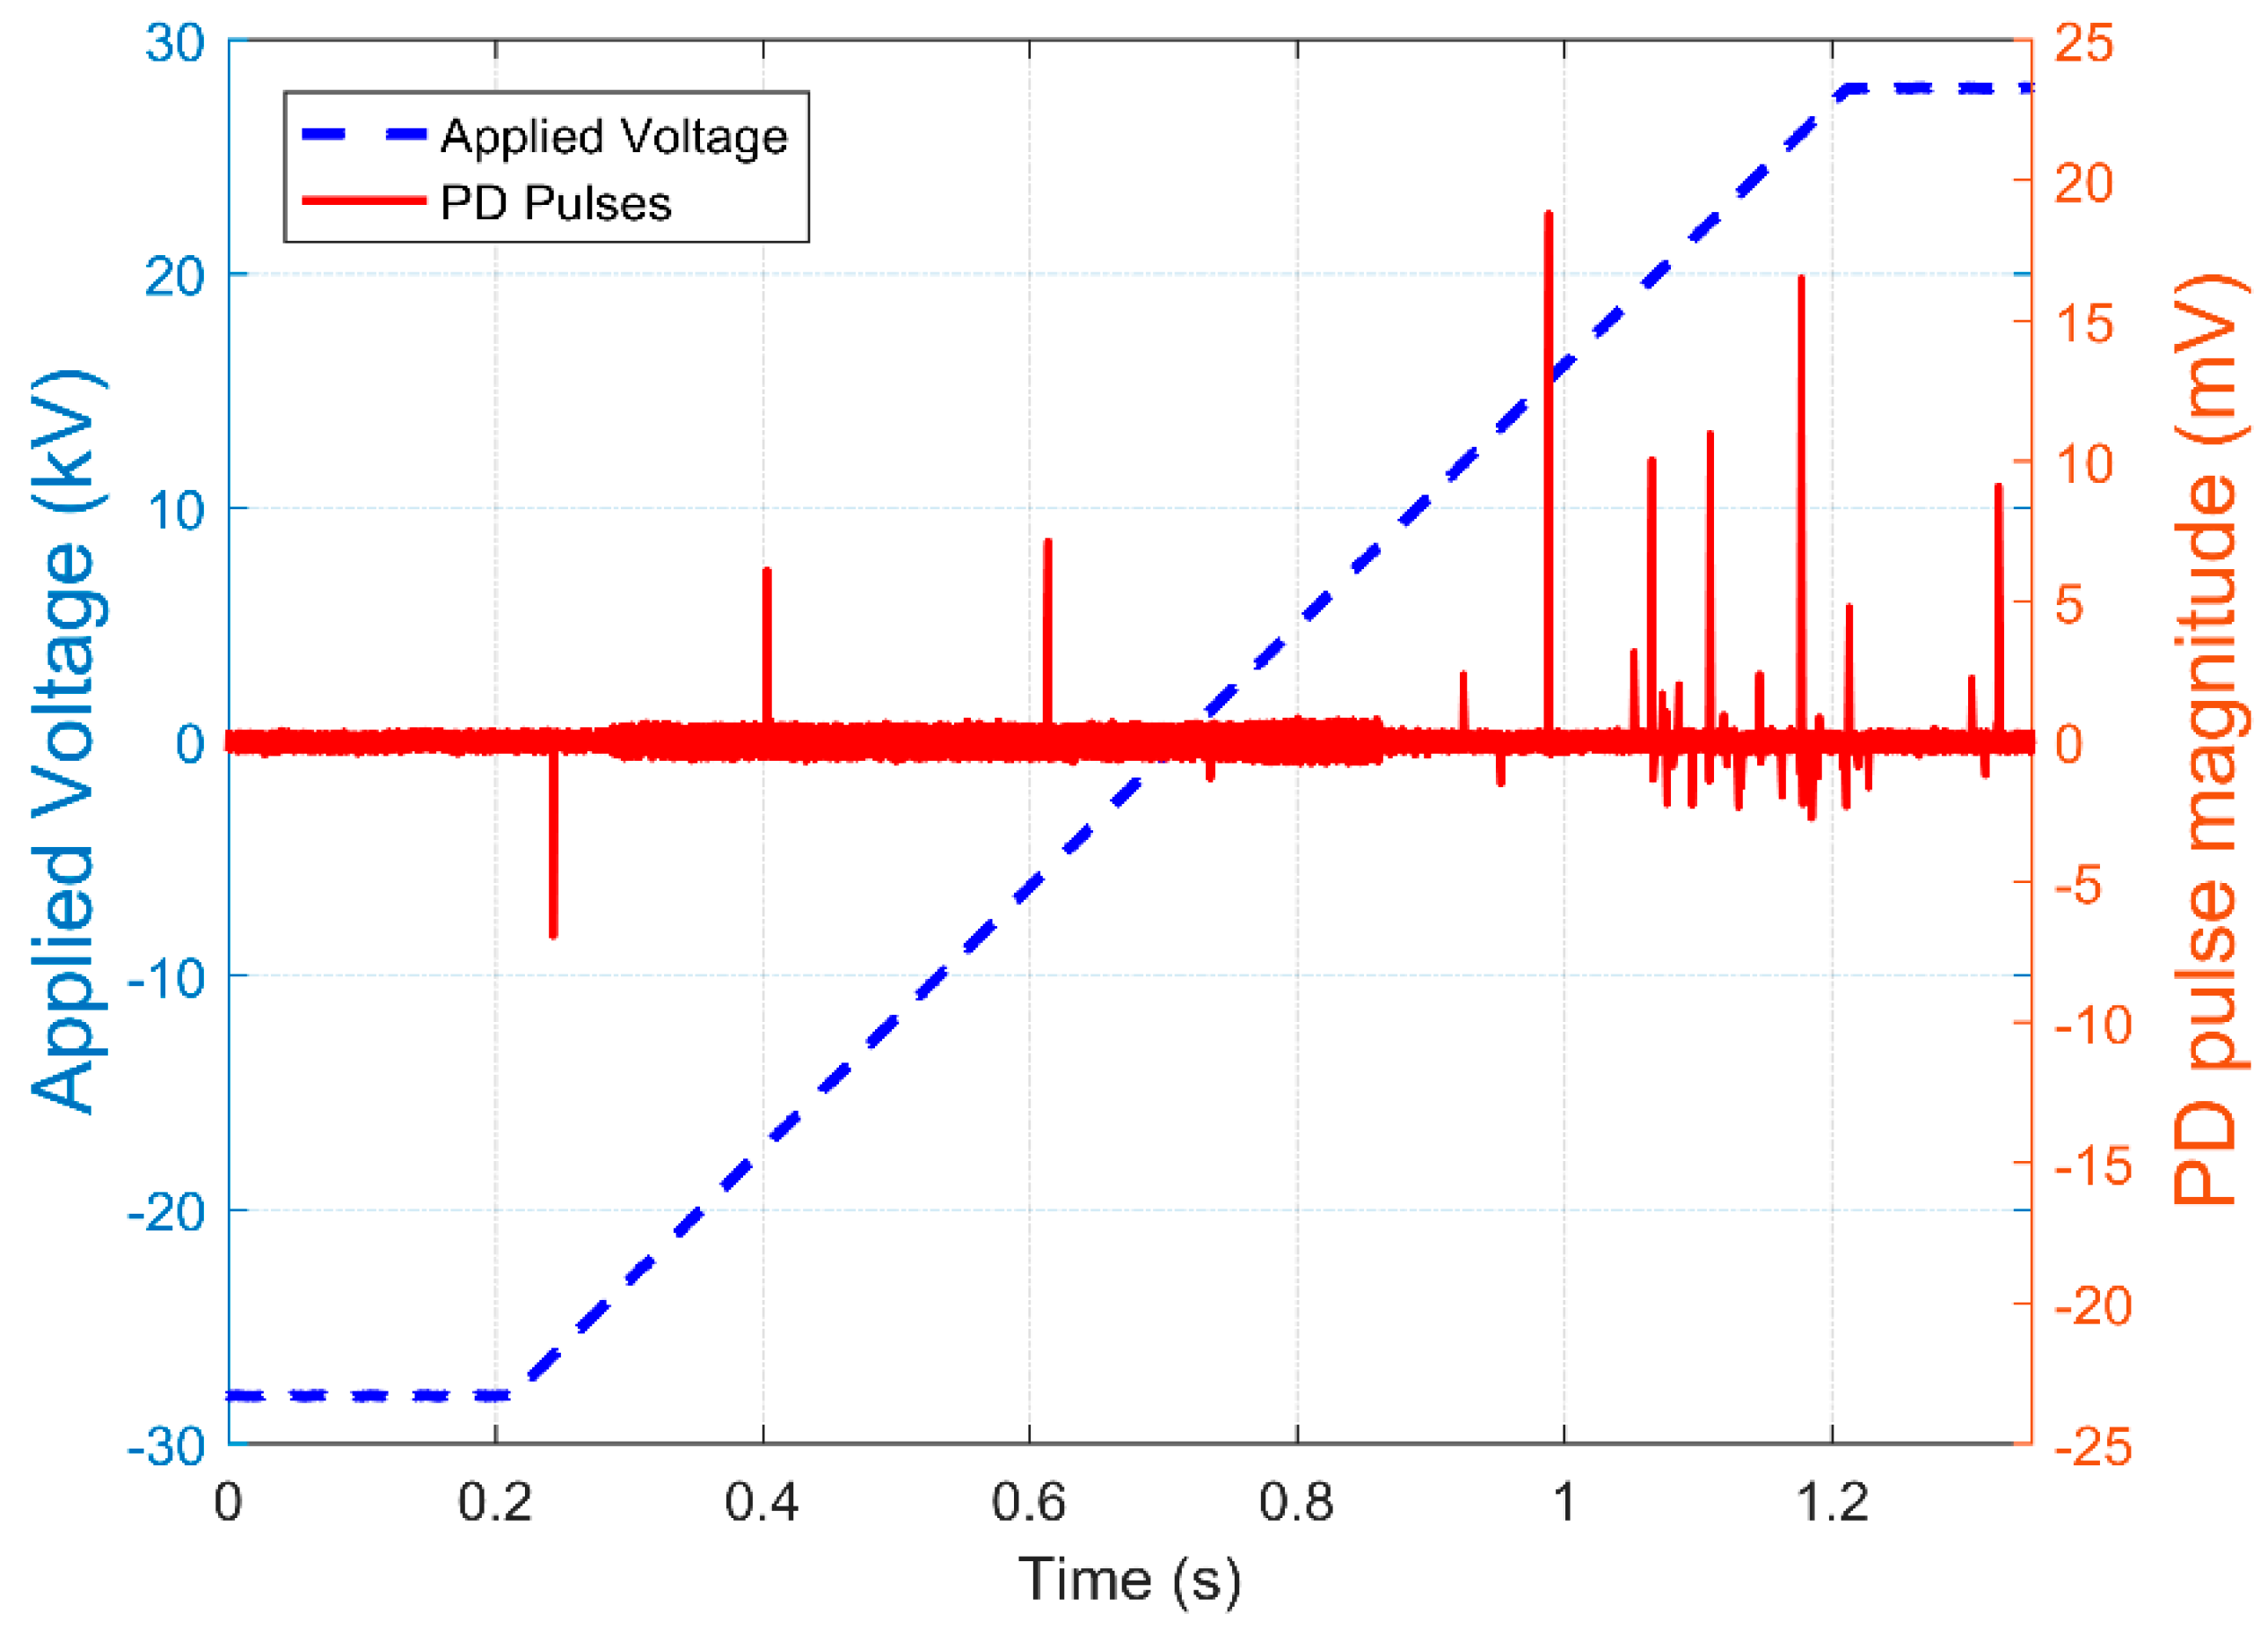
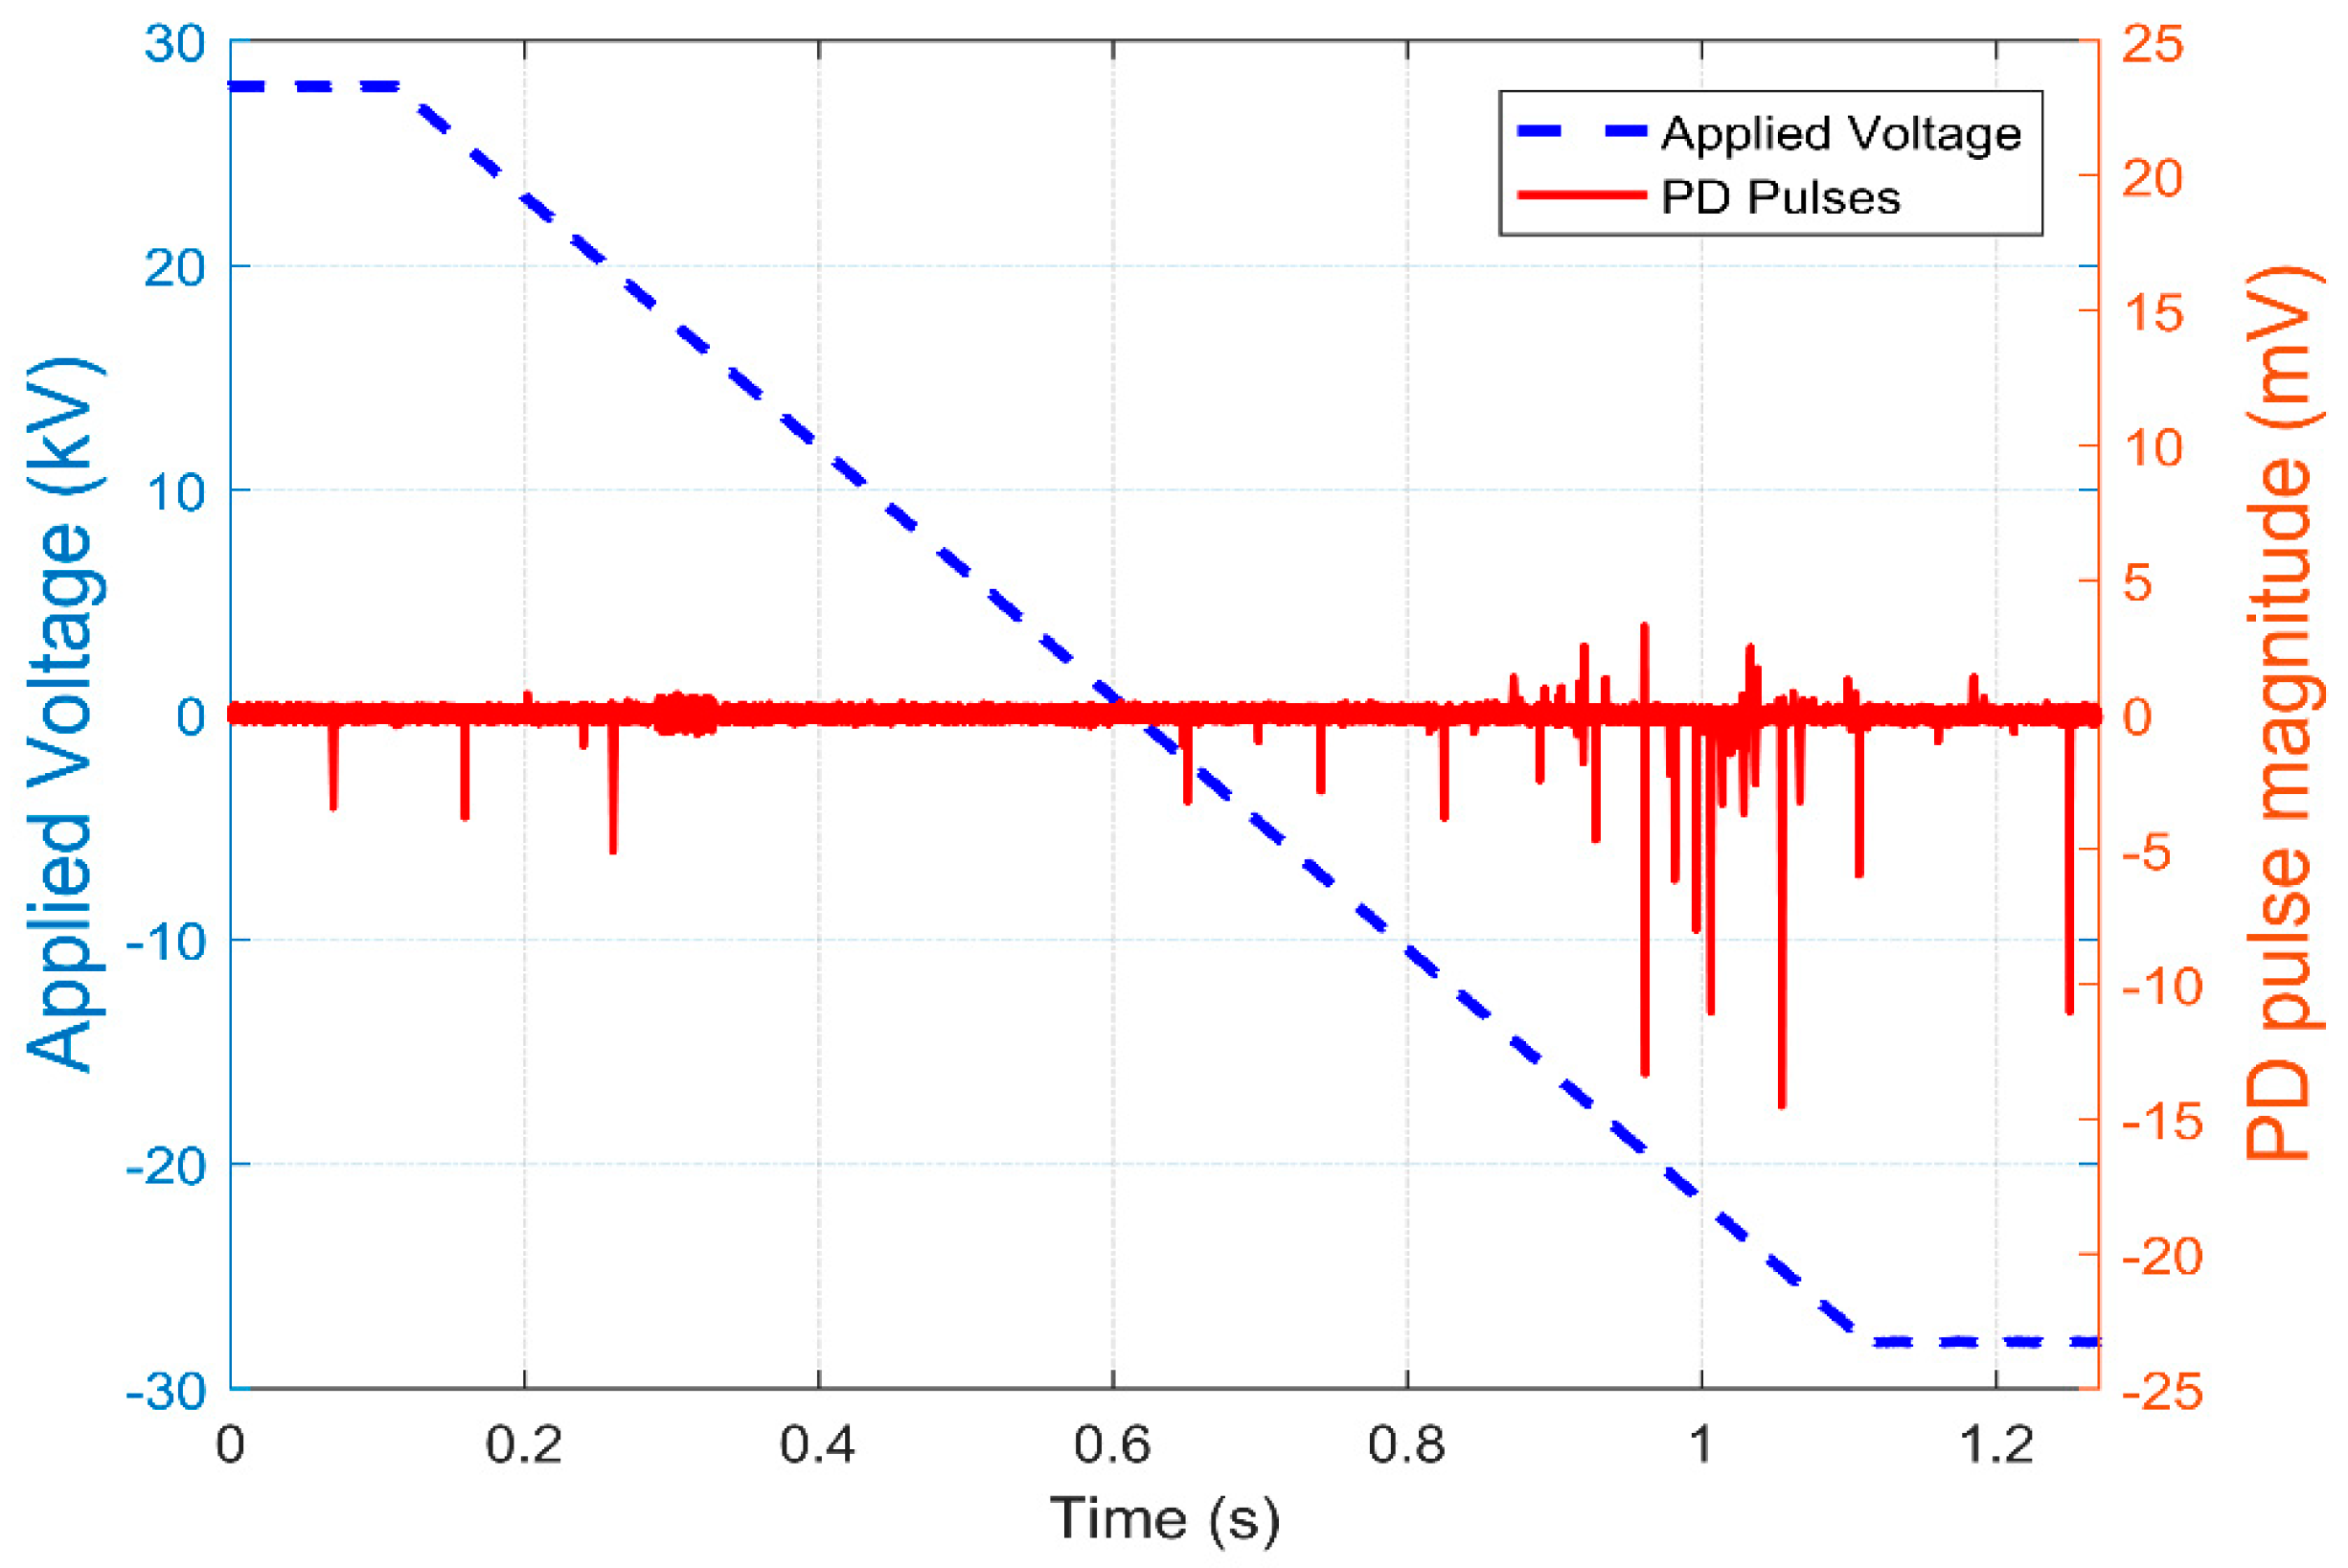
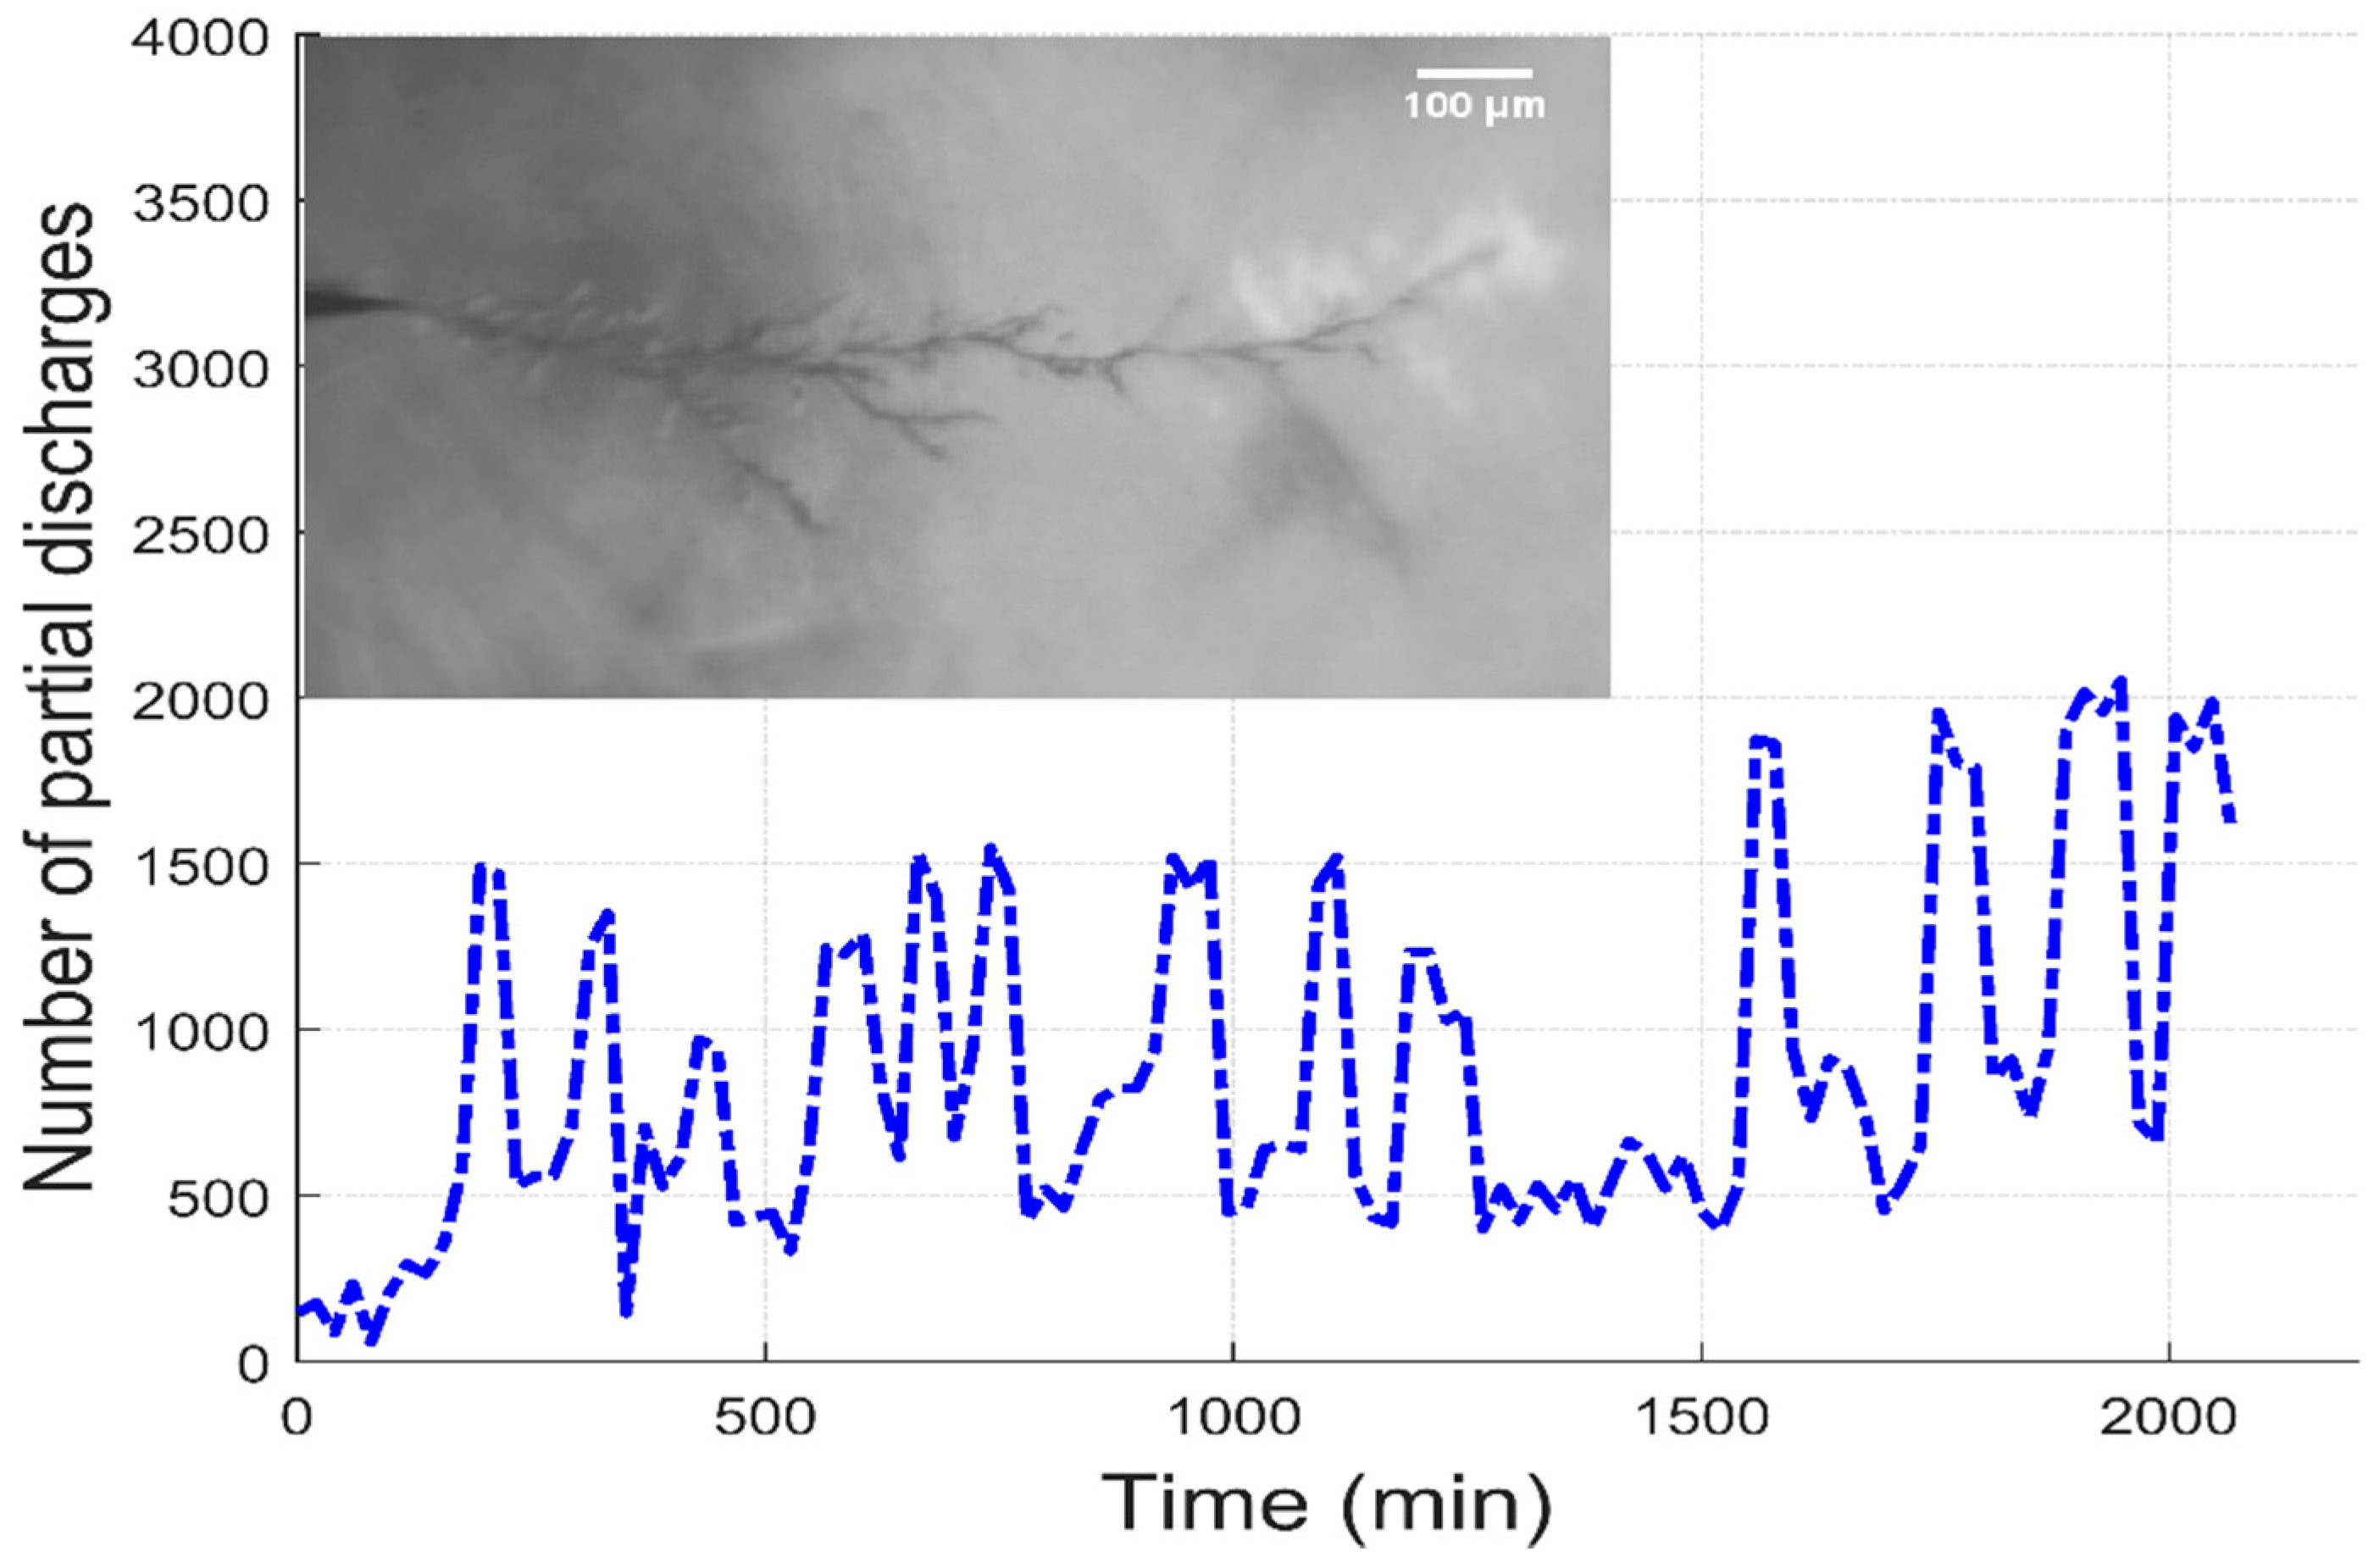
4.3. PD Behavior at Different Stages of ET Growth
5. Discussion
6. Conclusions
Author Contributions
Funding
Conflicts of Interest
References
- Special Report: 60 Years of HVDC. Available online: https://new.abb.com/motors-generators/about-us/document-library (accessed on 20 December 2014).
- Arrillaga, J. High Voltage Direct Current Transmission, 1st ed.; Institute of Electrical Engineering: London, UK, 1998; ISBN 13: 9780852969410. [Google Scholar]
- Murata, Y.; Sakamaki, M.; Abe, K.; Inoue, Y.; Mashio, S.; Kashiyama, S.; Matsunaga, O.; Igi, T.; Watanabe, M.; Asai, S.; et al. Development of high voltage dc-Xlpe cable system. SEI Tech. Rev. 2013, 101, 55–62. [Google Scholar]
- Morshuis, P.; Cavallini, A.; Fabiani, D.; Montanari, G.C.; Azcarraga, C. Stress conditions in HVDC equipment and routes to in service failure. IEEE Trans. Dielectr. Electr. Insul. 2015, 22, 81–91. [Google Scholar] [CrossRef]
- Azizian Fard, M.; Reid, A.J.; Hepburn, D.M.; Farrag, M.E. Partial discharge behavior under HVDC superimposed with transients. In Proceedings of the 51st International Universities Power Engineering Conference (UPEC), Coimbra, Portugal, 6–9 September 2016; pp. 1–5. [Google Scholar]
- Marzzanti, G.; Marzinotto, M. Extruded Cables for High Voltage Direct Current Transmission: Advance in Research and Development; Wiley-IEEE Press: Hoboken, NJ, USA, 2013; ISBN 978-1-118-09666-6. [Google Scholar]
- Montanari, G.C.; Dissado, L.A.; Serra, S. The hidden threat to HVDC polymeric insulation at design field: Solitonic conduction. IEEE Electr. Insul. Mag. 2014, 30, 39–50. [Google Scholar] [CrossRef]
- Dissado, L.A.; Fothergill, J.C. Electrical Degradation and Breakdown in Polymers, 1st ed.; Peter Peregrinus Ltd.: London, UK, 1992; ISBN (0863411967). [Google Scholar]
- Schurch, R.; Rowland, S.M.; Bradley, R.S.; Withers, P.J. Imaging and analysis techniques for electrical trees using X-ray computed tomography. IEEE Trans. Dielectr. Electr. Insul. 2014, 21, 53–63. [Google Scholar] [CrossRef]
- Dissado, L.A. Understanding electrical trees in solids: from experiment to theory. IEEE Trans. Dielectr. Electr. Insul. 2002, 9, 483–497. [Google Scholar] [CrossRef]
- Jarvid, E.M.; Johansson, A.B.; Blennow, J.H.M.; Andersson, M.R.; Gubanski, S.M. Evaluation of the performance of several object types for electrical treeing experiments. IEEE Trans. Dielectr. Electr. Insul. 2013, 20, 1712–1719. [Google Scholar] [CrossRef]
- Iddrissu, I.; Zheng, H.; Rowland, S.M. Electrical tree growth in epoxy resin under DC voltages. In Proceedings of the IEEE International Conference on Dielectrics (ICD), Montpellier, France, 3–7 July 2016; pp. 820–823. [Google Scholar]
- Du, B.X.; Su, J.G.; Han, T. Electrical tree characteristics of XLPE under repetitive pulse voltage in low temperature. IEEE Trans. Dielectr. Electr. Insul. 2015, 22, 1801–1808. [Google Scholar] [CrossRef]
- Du, B.X.; Zhu, L.W. Effects of magnetic field on electrical tree growth in silicone rubber under repetitive pulse voltage. IEEE Trans. Dielectr. Electr. Insul. 2015, 22, 1785–1792. [Google Scholar] [CrossRef]
- ASTM International. Standard Test Method for Evaluation of Resistance to Electrical Breakdown by Treeing in Solid Dielectric Materials Using Diverging Fields; ASTM D3756-97; ASTM International: West Conshohocken, PA, USA, 2010. [Google Scholar]
- Qi, X.; Boggs, S. Thermal and mechanical properties of EPR and XLPE cable compounds. IEEE Electr. Insul. Mag. 2006, 22, 19–24. [Google Scholar] [CrossRef]
- Abramowitz, M.; Davidson, M.W. Microscope Objectives: Immersion Media. Olympus Microscopy Resource Center. Available online: http://www.olympusmicro.com/primer/anatomy/immersion.html (accessed on 10 January 2017).
- Babadi, S.; Ramirez-Iniguez, R.; Boutaleb, T.; Mallick, T. Performance comparison of a freeform lens and a CDTIRO when combined with an LED. IEEE Photonics J. 2017, 9, 1–8. [Google Scholar] [CrossRef]
- Liu, Y.; Cao, X. Electrical tree initiation in XLPE cable insulation by application of DC and impulse voltage. IEEE Trans. Dielectr. Electr. Insul. 2013, 20, 1691–1698. [Google Scholar] [CrossRef]
- Griac, J.; Adamec, V.; Calderwood, J.H. On the comparability of single and double needle tests for treeing resistance. IEEE Trans. Electr. Insul. 1982, 17, 356–358. [Google Scholar] [CrossRef]
- McMahon, E.J. A tutorial on treeing. IEEE Trans. Electr. Insul. 1978, 13, 277–288. [Google Scholar] [CrossRef]
- Wang, Y.; Li, G.; Wu, J.; Yin, Y. Effect of temperature on space charge detrapping and periodic grounded DC tree in cross-linked polyethylene. IEEE Trans. Dielectr. Electr. Insul. 2016, 23, 3704–3711. [Google Scholar] [CrossRef]
- Li, Z.; Liu, R.; Wang, H.; Liu, W. Space charges and initiation of electrical trees. IEEE Trans. Electr. Insul. 1989, 24, 83–89. [Google Scholar] [CrossRef]
- Mammeri, M.; Laurent, C.; Nedjar, M. Dynamics of voltage polarity reversal as the controlling factor in space-charge induced breakdown of insulating polymers. IEEE Trans. Dielectr. Electr. Insul. 1997, 4, 44–51. [Google Scholar] [CrossRef]
- Champion, J.V.; Dodd, S.J.; Zhao, Y.; Vaughan, A.S.; Brown, M.; Davies, A.E.; Sutton, S.J.; Swingler, S.G. Morphology and the growth of electrical trees in a propylene/ethylene copolymer. IEEE Trans. Dielectr. Electr. Insul. 2001, 8, 284–292. [Google Scholar] [CrossRef]
- Kudo, K. Fractal analysis of electrical trees. IEEE Trans. Dielectr. Electr. Insul. 1998, 5, 713–727. [Google Scholar] [CrossRef]
- Chen, X.; Xu, Y.; Cao, X.; Dodd, S.J.; Dissado, L.A. Effect of tree channel conductivity on electrical tree shape and breakdown in XLPE cable insulation samples. IEEE Trans. Dielectr. Electr. Insul. 2011, 18, 847–860. [Google Scholar] [CrossRef]
- Ren, M.; Zhou, J.; Song, B.; Zhang, C.; Dong, M.; Albarracín, R. Towards optical partial discharge detection with micro silicon photomultipliers. Sensors 2017, 17, 2595. [Google Scholar] [CrossRef] [PubMed]


| Voltage Level (kV) | Positive DC | Negative DC |
|---|---|---|
| Percentage of Samples in Which ET’s Initiated (%) | Percentage of Samples in Which ET’s Initiated (%) | |
| 22.0 | 0 | 0 |
| 25.0 | 20 | 0 |
| 28.0 | 20 | 0 |
| Voltage Level (kV) | Positive DC | Negative DC |
|---|---|---|
| Percentage of Samples in Which ET’s Initiated (%) | Percentage of Samples in Which ET’s Initiated (%) | |
| 22.0 | 0 | 0 |
| 25.0 | 20 | 20 |
| 28.0 | 50 | 60 |
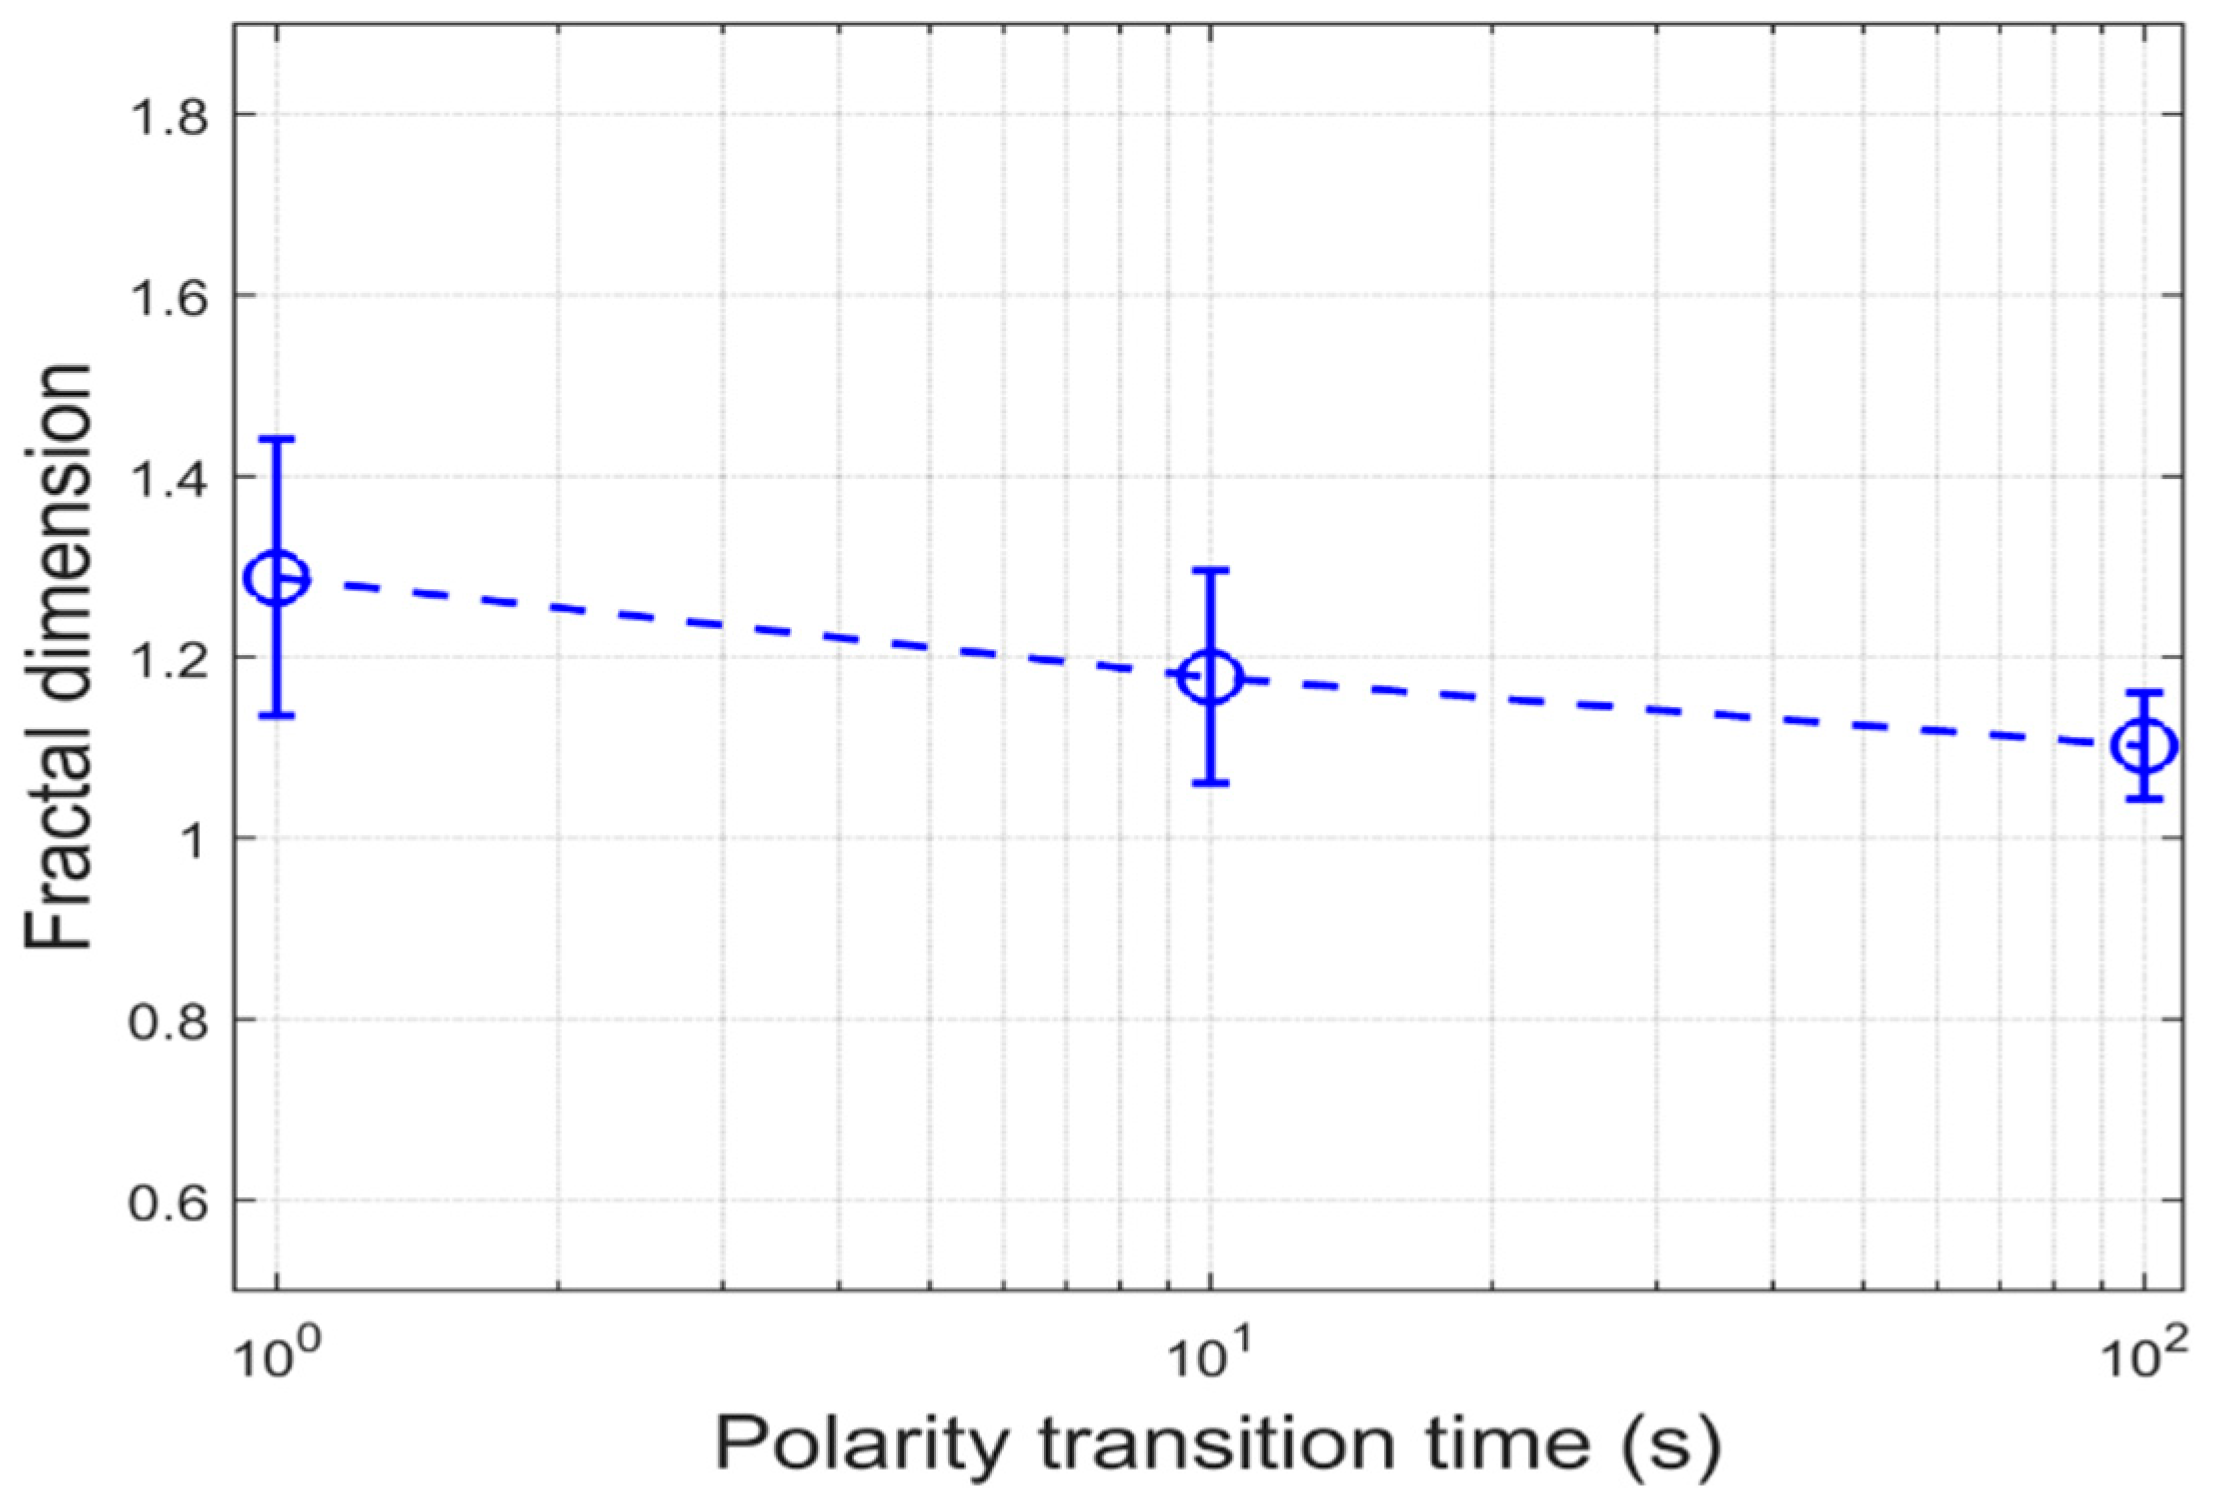
| Voltage Level (kV) | Polarity Transition Time (s) | ||
|---|---|---|---|
| 1 | 10 | 100 | |
| Percentage of Samples in Which ET’s Initiated (%) | |||
| 22.0 | 40 | 10 | 10 |
| 25.0 | 70 | 60 | 30 |
| 28.0 | 90 | 70 | 80 |
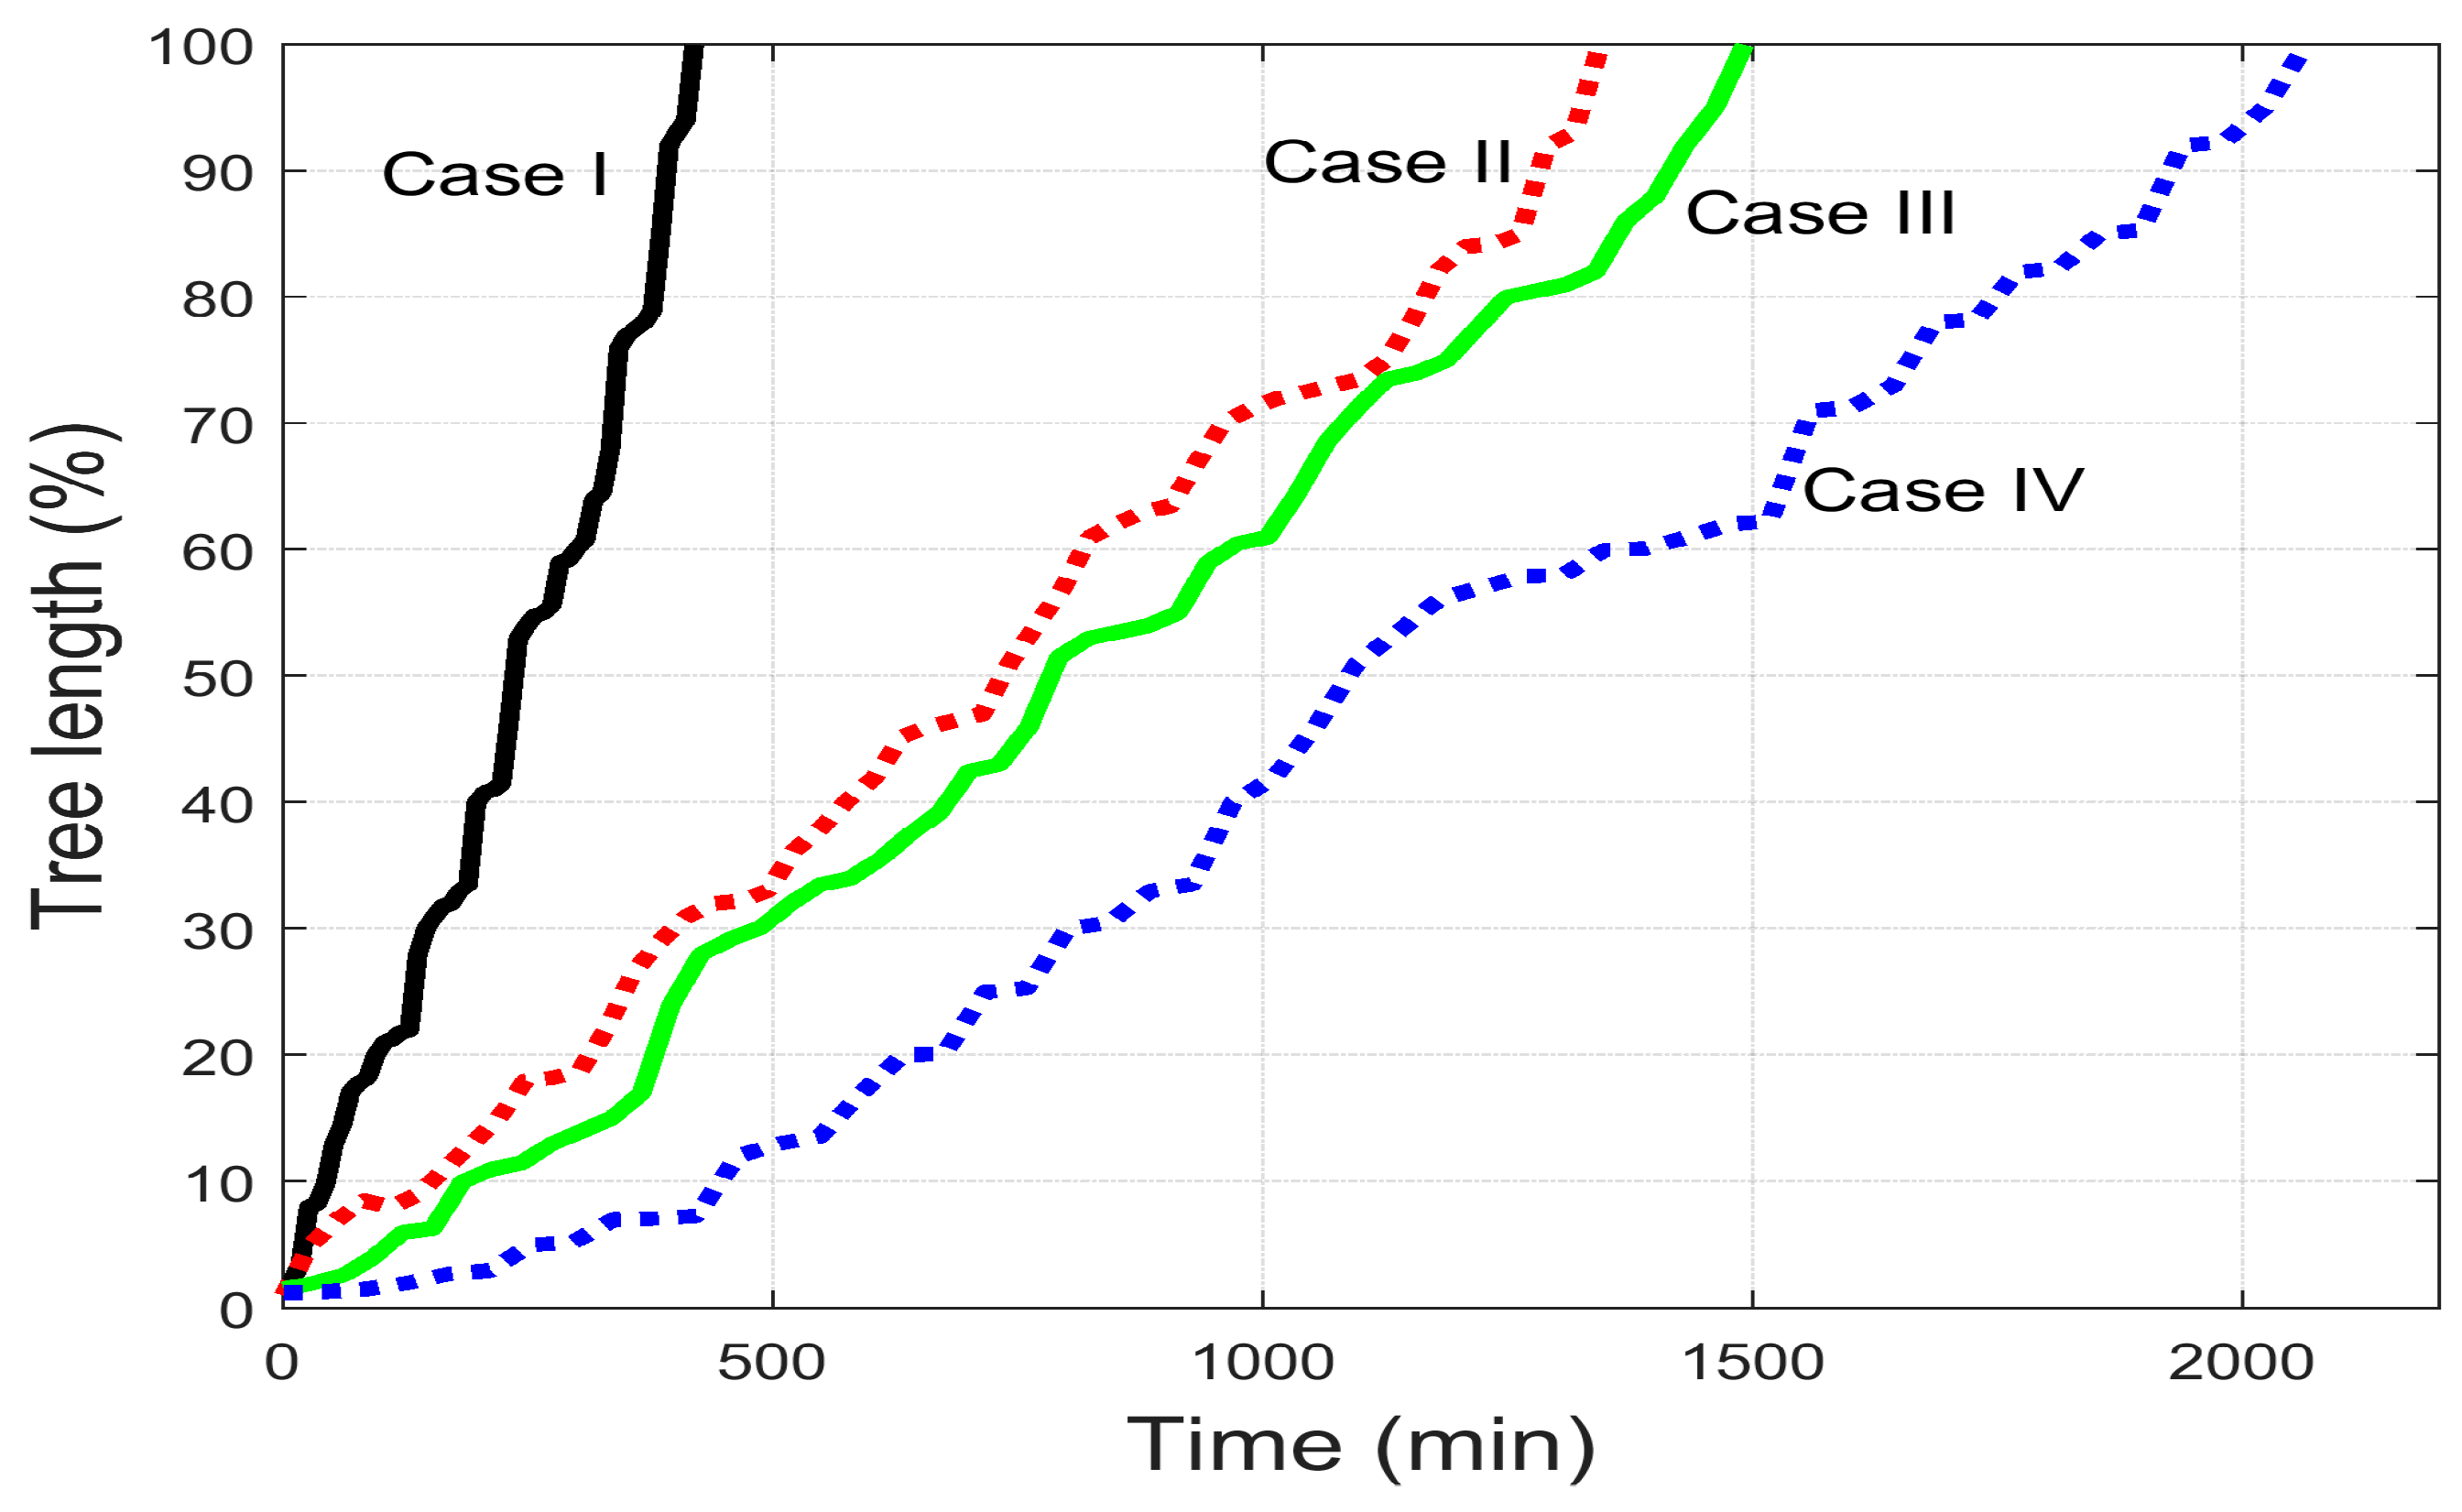
| Case | SST (min) | PTT (s) |
|---|---|---|
| I | 1 | 1 |
| II | 5 | 1 |
| III | 5 | 10 |
| IV | 5 | 100 |
© 2018 by the authors. Licensee MDPI, Basel, Switzerland. This article is an open access article distributed under the terms and conditions of the Creative Commons Attribution (CC BY) license (http://creativecommons.org/licenses/by/4.0/).
Share and Cite
Fard, M.A.; Farrag, M.E.; McMeekin, S.; Reid, A. Electrical Treeing in Cable Insulation under Different HVDC Operational Conditions. Energies 2018, 11, 2406. https://doi.org/10.3390/en11092406
Fard MA, Farrag ME, McMeekin S, Reid A. Electrical Treeing in Cable Insulation under Different HVDC Operational Conditions. Energies. 2018; 11(9):2406. https://doi.org/10.3390/en11092406
Chicago/Turabian StyleFard, Mehrtash Azizian, Mohamed Emad Farrag, Scott McMeekin, and Alistair Reid. 2018. "Electrical Treeing in Cable Insulation under Different HVDC Operational Conditions" Energies 11, no. 9: 2406. https://doi.org/10.3390/en11092406