Analysis of Winding Vibration Characteristics of Power Transformers Based on the Finite-Element Method


1
School of Electrical Engineering, Shandong University, Jinan 250061, China
2
State Grid, Jining Power Supply Company, Jining 272000, China
*
Author to whom correspondence should be addressed.
Energies 2018, 11(9), 2404; https://doi.org/10.3390/en11092404
Submission received: 25 August 2018
/
Revised: 6 September 2018
/
Accepted: 7 September 2018
/
Published: 11 September 2018
(This article belongs to the Special Issue Intelligent Control in Energy Systems)
Abstract
:The winding is the core component of a transformer, and the technology used to diagnose its current state directly affects the operation and maintenance of the transformer. The mechanical vibration characteristics of a dry-type transformer winding are studied in this paper. A short-circuit test was performed on an SCB10-1000/10 dry-type transformer, and the vibration signal at the surface was measured. Based on actual experimental conditions, a vibration-simulation model of the transformer was established using COMSOL Multiphysics software. A multiphysics coupling simulation of the circuit, magnetic field, and solid mechanics of the transformer was performed on this model. The simulation results were compared with measured data to verify the validity of the simulation model. The simulation model for a transformer operating under normal conditions was then used to develop simulation models of transformer-winding looseness, winding deformation, and winding-insulation failure, and the winding fault vibration characteristics were analyzed. The results provide a basis for detecting and analyzing the mechanical state of transformer windings.
1. Introduction
The safety and reliability of power transformers, which are the core pieces of equipment in a power grid, are important for the reliable operation of the entire power grid [1]. Foreign statistics show that approximately 2% of transformers that run continuously for more than four years will experience accidents of varying degrees [2]. The high failure rate of transformers has always affected the safe and stable operation of the power grid [3], and it is not difficult to find that mechanical faults in transformer are often due to latent issues upon reviewing historical cases of transformer accidents [4]. Transformer faults generally involve the failure of main components and accessories, with the primary source of these faults being due to windings and core failures. In China, faults have occurred in 18 transformers in and above the 110 kV class [5]. Of these faults, 10 (55.6%) were caused by winding issues. From 2006 to 2010, the State Grid Corporation of China (SGCC) compiled statistics on the causes of faults in 46 transformers, of which 26 (56.5%) were caused by winding deformation [6]. In 2013, there were five accidents in transformers of the 110 kV class and above belonging to the Guangxi Power Supply Company of the Southern China Power Grid [7]. Of these, four cases (80%) were caused by winding deformation.
The study of electromagnetic vibration in transformers began in the 1920s, mainly by large power-transformer manufacturers and related research institutions. However, that work was limited by the technology available at that time, when winding fault simulations were not ideal [8]. Fahnoe H. studied the forced vibration of a transformer’s vibrating iron core under magnetostriction and resonance at the harmonic frequency [9]. A substantial amount of simulation of the transformer was carried out. The modal-resonance frequency of the transformer was analyzed such that the transformer avoided resonance, but the simulation results were not verified via experimentation [10]. Foster S. L. and others used finite element numerical analysis to calculate the electromagnetic field and structural force field of large transformers, and obtained the vibration of the transformer core [11]. By combining electromagnetic-field theory with the theory of structural mechanics, Yang Qingxin and other scholars in China established a mathematical model of the electromagnetic vibration of the iron core of a power transformer [12,13,14]. The model was used to simulate magnetostriction of silicon steel sheets. On this basis, the distribution of the sound field around the core was analyzed. These researchers paid considerable attention to the vibration of the iron core, but the vibration of the windings at various working conditions was less important to them. Liu Dichen and other scholars established an electromagnetic mechanical sound field finite-element model of a transformer core and its winding [15]. In ANSYS Workbench, a finite-element model of the transformer winding, iron core, and oil tank were established. Transient electromagnetic-field analysis was used to obtain the alternating electromagnetic force of the transformer core and winding under the effect of alternating currents. Noise distribution was analyzed, but little attention was paid to the spectrum analysis of the windings under various fault conditions. Ji Shengchang and other scholars discussed in detail the relationship between the vibration of the winding, the iron core, the load current, and the no-load voltage, and proposed a method for extracting the characteristics of the vibration signal of the transformer based on wavelet analysis [16,17]. Through simulation and experimentation, Yu Xiaohui and others discussed the interaction between the tightening force and the natural frequency of the winding and concluded that the pretension of the windings can change their natural frequency [18]. A comprehensive analysis of the research conducted by experts around the world reveals that, although many effective diagnostic methods based on vibration signals have been proposed, there still exist problems, such as incomplete simulations of the various types of winding faults and poor diagnostic accuracy.
In recent years, various nondestructive testing methods for transformer-winding deformation have been developed, such as the frequency-response analysis method for comparing transformer frequency-response changes, and vibration analysis method for judging winding state based on the transformer-vibration signal. The principle of frequency-response analysis is to detect the amplitude-frequency response characteristics of each winding of the transformer, and compare the detection results horizontally or vertically. According to the difference of amplitude-frequency response characteristics, winding faults that may occur in the transformer are comprehensively judged. In recent years, scholars have paid more and more attention to vibration-detection transformer research. The vibration-analysis method discriminates the winding state of the transformer by detecting the vibration signal transmitted to the body surface [19,20]. The principle is to reflect the winding states by detecting a change in the mechanical characteristics of the winding. The frequency-response method has many factors that affect the test results, such as the position of the signal source, the length of test leads, the length of the test instrument grounding wire, the position of the transformer tap changer, and connection mode. Compared with the frequency-response method, the vibration-analysis method has fewer factors affecting the test results. The noise of the transformer cooling system will pollute the vibration signal. When collecting the signal, it should be as far away from the fan group as possible, or you should take noise-reduction measures. The vibration test results of transformer-winding deformation are affected by the vibration of the core. Power frequency 150 Hz and 250 Hz components appear in the frequency spectrum of transformer-vibration signals under a three-phase asymmetric operation. The severe overvoltage generated in the asymmetric phase increases the amplitude of the resonant frequency of the core, which interferes with the test results of winding. When a short-circuit fault occurs, the vibration of the iron core is far less than that of winding, and it can be approximated that the detected vibration contains only vibration signals of the winding. The frequency-response method is blackout detection, while the vibration-detection method is live detection [21,22]. It can continuously monitor transformer-winding deformation and reflect the decline trend of transformer short-circuit resistance after repeated short-circuit shocks, which reduces the difficulty of online monitoring and fault diagnosis of the power transformer.
Because the vibration of the transformer is a complicated process, the interaction between the magnetic field and the load current, as well as between the magnetostriction of the silicon steel sheet and the structural change in the transformer, produce changes in the vibration signal in both the time and frequency domains, thus increasing the difficulty in fault monitoring and diagnosis. In this paper, the SCB10-1000/10 dry-type transformer is studied in detail from the perspective of simulation modeling, fault simulation, and feature analysis to obtain state diagnostics on transformer winding via vibration analysis. Based on the mechanical-vibration characteristics of dry-type transformer windings, a short-circuit experiment was performed on the SCB10-1000/10 transformer, and the vibration signals at its surface were measured. A vibration-simulation model of the SCB10-1000/10 transformer was established using COMSOL Multiphysics 5.3, and the coupling calculations were performed with regard to the circuit, magnetic field, and solid mechanics of the transformer, among other areas of physics. By comparing the simulated data to the actual data of the transformer, the accuracy of the model was proven. Using this model, faults like loosening, deformation, and loss of insulation from the transformer windings were simulated, and the vibration characteristics of the winding fault were subsequently analyzed. The model utilizes multiphysical field-coupling simulation of the electromagnetic solid mechanics of dry transformer windings, which can provide a new basis for the state simulation and fault diagnosis of transformer windings.
2. Study of the Mechanical Vibration Characteristics of Transformer Windings
2.1. Vibration-Signal Conduction Process and Winding Electrodynamic Analysis of Dry-Type Transformers
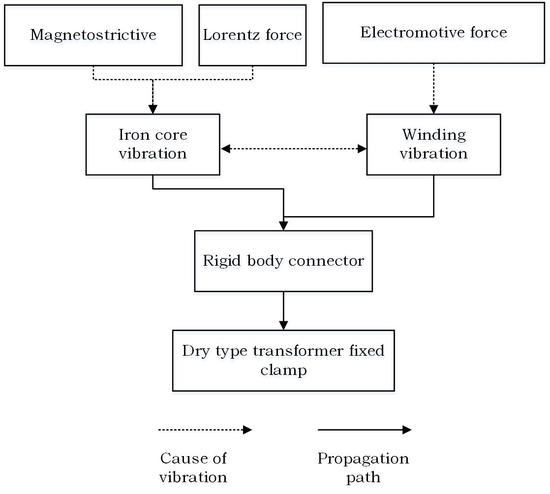
This paper focuses on dry-type transformers. To understand the mechanism behind the mechanical vibration of transformer windings, a short-circuit experiment of the SCB10-1000/10 dry-type transformer was conducted, and the vibration signal at the surface was measured. The vibration of power transformers during operation is complicated and influenced by many factors, but there are two main phenomena: the vibration caused by the electric force on the winding and the vibration caused by the Lorentz force and the magnetostrictive force on the silicon steel sheet [23]. Figure 1 shows the conduction process of a vibration wave for a dry-type transformer. The vibration caused by the winding and the iron core is transferred to the surface of the fixed clamp of the transformer through the rigid component that connects the two. A dry-type transformer consists of layer-type windings, which cause vibration from the effect of the electrical power. These windings pass through the rigid connecting component to the fixed-clamp surface. The iron core of a dry-type transformer is subjected to magnetostrictive force and the action of the Lorentz force, which is transmitted to the surface of the fixed clamp of the transformer by a support unit, such as the cushion block or the fastening bolt [24].
When the load current of the dry-type transformer is loaded, leakage of the magnetic field occurs in its vicinity, which produces electrical power and causes mechanical vibration of the transformer winding. This vibration is transferred through the connecting component to the surface of the transformer clamp. When the transformer is in a steady state, the load current inside the winding can be found as follows:
In Equation (1), the current effective value is presented, where ω represents the current angular frequency.
The vibration of the transformer body is mainly caused by core vibration, which, in turn, is caused by the magnetostriction of the silicon steel sheet and winding vibration resulting from load current. The vibration of the core is caused by the magnetostriction of the silicon steel sheet in a strong magnetic field [25]. The amplitude of the vibration is directly proportional to the square of the excitation voltage, and the fundamental frequency is two times greater than the voltage frequency. The vibration of the winding is caused by the electromagnetic force produced by the current in the winding. The amplitude of the vibration is proportional to the square of the winding current, and the basic frequency is two times greater than the current frequency. In the short-circuit test of the transformer winding, due to low excitation voltage, the vibration of the winding is far greater than the vibration of the core. Therefore, the detected vibration signals can be approximated as containing only the vibration signals of the winding.
The leakage of the magnetic field around the winding of the transformer is a function that changes with time. When the winding generates a change in position, the distribution of the leakage of the magnetic field around the winding also changes [26]. To calculate the force on a single conductor, the discrete magnetic field value is fitted to a continuous distribution function. By the Biot–Savart Law, magnetic flux density B at a certain point on the windings can be expressed as follows:
At a given point in space, all quantities except it are constant. Thus, in the calculation of the static electromagnetic field, the magnetic-flux leakage density Bt of the winding can be simplified to the following:
where is the proportionality constant between magnetic-flux density and load current.
The axial magnetic-field leakage induced by the load current flowing through the transformer winding is Bzt, and radial electromagnetic force Fx is induced by the action of the load current. Similarly, the magnetic leakage field Bxt, induced by radial induction, can induce axial electromagnetic force Fz through the load current. The axial force and radial force of the conductor can be calculated from the electric-force equation as follows:
By vector calculation, the axial and radial electric forces are integrated to simplify the electric power of the winding:
where it is the load current in the winding, ω represents the angular frequency of the power, and R represents the transformer-winding radius. Equation (5) shows that the magnitude of the electric force on the transformer winding is proportional to the square of the load current flowing through the transformer winding, and the fundamental frequency of the vibration signal is twice the power frequency of the power grid.
2.2. Transformer Short-Circuit Experiment
Based on the analysis above, when the secondary winding of the transformer is short-circuited, the vibration of the body is mainly caused by winding vibration. To eliminate the disturbance caused by vibration of the iron core and analyze only the vibration characteristics of the transformer winding, a short-circuit experiment was performed on an SCB10-1000/10 transformer, which is a 10 kV SCB11 epoxy resin-cast dry-type transformer.
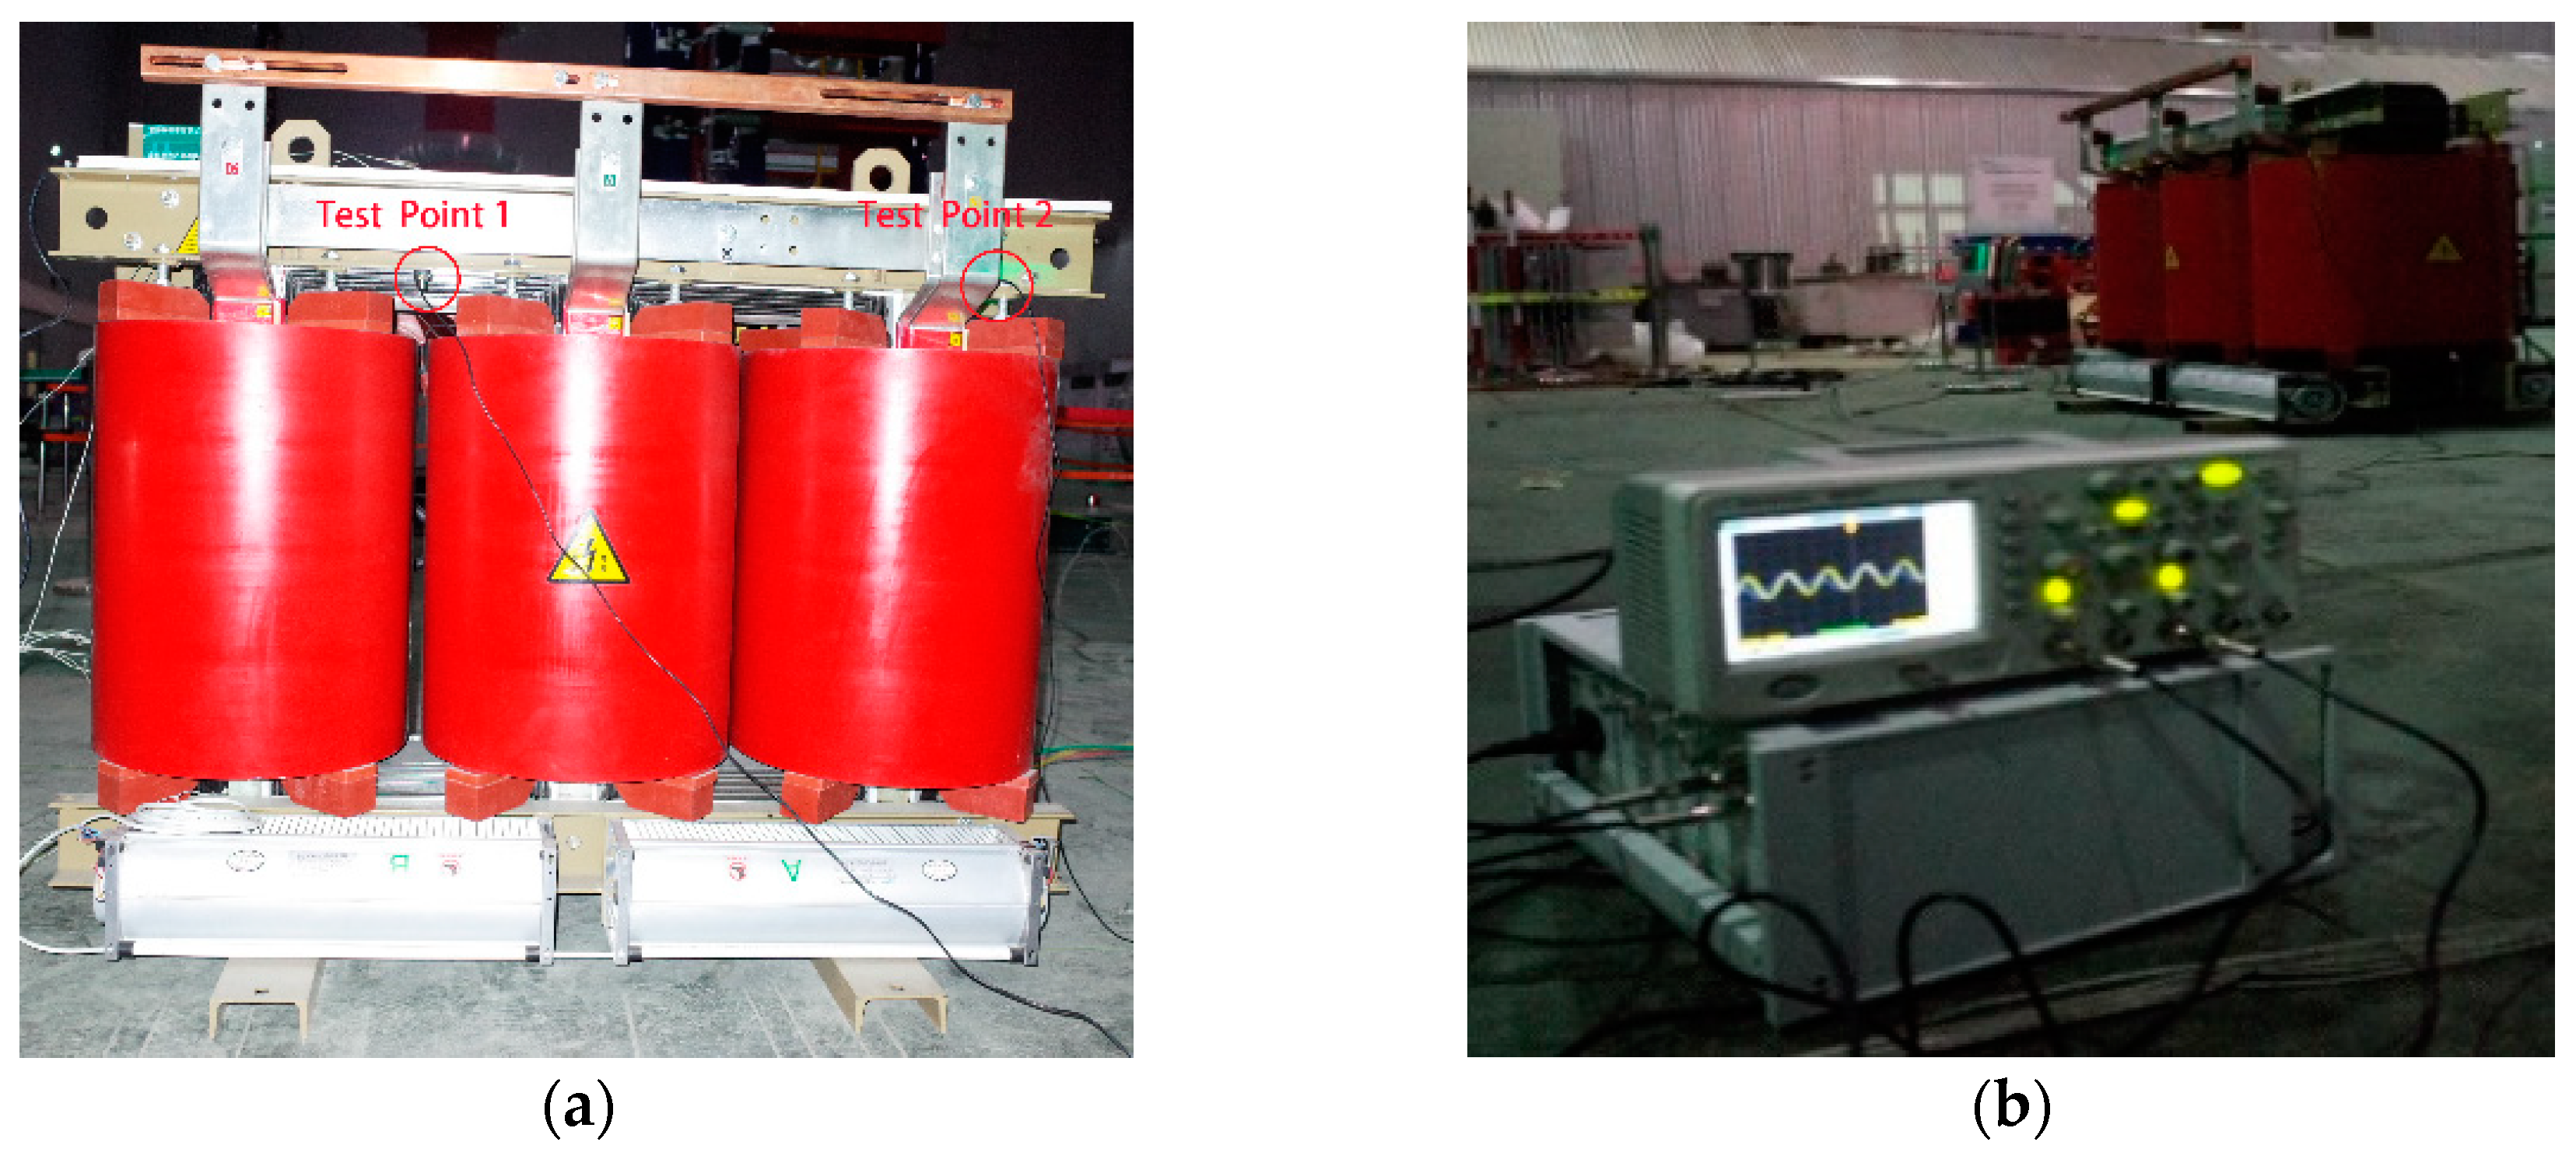
The parts with strong vibration signal are more likely to have fault accidents occur [27]. High signal-to-noise ratio can also be obtained by selecting a strong vibration area of the transformer winding [28]. According to the model studied in this paper, the vibration signal near the winding is strong. In order to understand the vibration condition of the winding, the inner side of the upper winding is the first choice, that is, the position selected in this experiment. During the experiment, the intensity of the vibration signal is tested in different areas. The results show that the vibration signal near the winding is tested. Considering the difficulty of installing the vibration sensor and the intensity of the vibration signal, the test point near the B-phase winding, the test point near the B-phase winding, and the test point on the inner and upper side of the C-phase winding are selected. Figure 2 shows the location of the vibration-acceleration sensor relative to the transformer for the field experiment. The key technical parameters are shown in Table 1.
When the transformer is short-circuit tested, the secondary low-voltage side is short-circuited, and a three-phase voltage is applied to the primary high-voltage side such that the load current in the winding attains its rated value. The vibration signals were measured using a vibration acceleration sensor (YD70C) (Xieli Science and Technology, Qinhuangdao, China), a charge amplifier (DHF-10), and a Tek oscilloscope.
Figure 3 shows a set of typical mechanical-vibration signals measured during the experiment. The ordinate axis in this picture represents vibration acceleration a. The relationship between vibration acceleration a and output voltage U of the charge amplifier is as follows:
The sensitivity S1 of the vibration acceleration sensor was 2 pC/ms−2, and the sensitivity S2 of the charge amplifier was 656 V/pC. The mechanical-vibration-signal diagram in Figure 3 can be obtained via transformation.
3. Multiphysical Field-Coupling Model for Winding Vibration of Dry-Type Transformer
In this paper, COMSOL Multiphysics software was used to simulate the vibration of the SCB10-1000/10 dry-type transformer winding, and coupling simulation analysis of the magnetic field and the solid mechanics was performed.
3.1. Establishment and Mesh Generation of a Vibration-Simulation Model for a Dry-Type Transformer
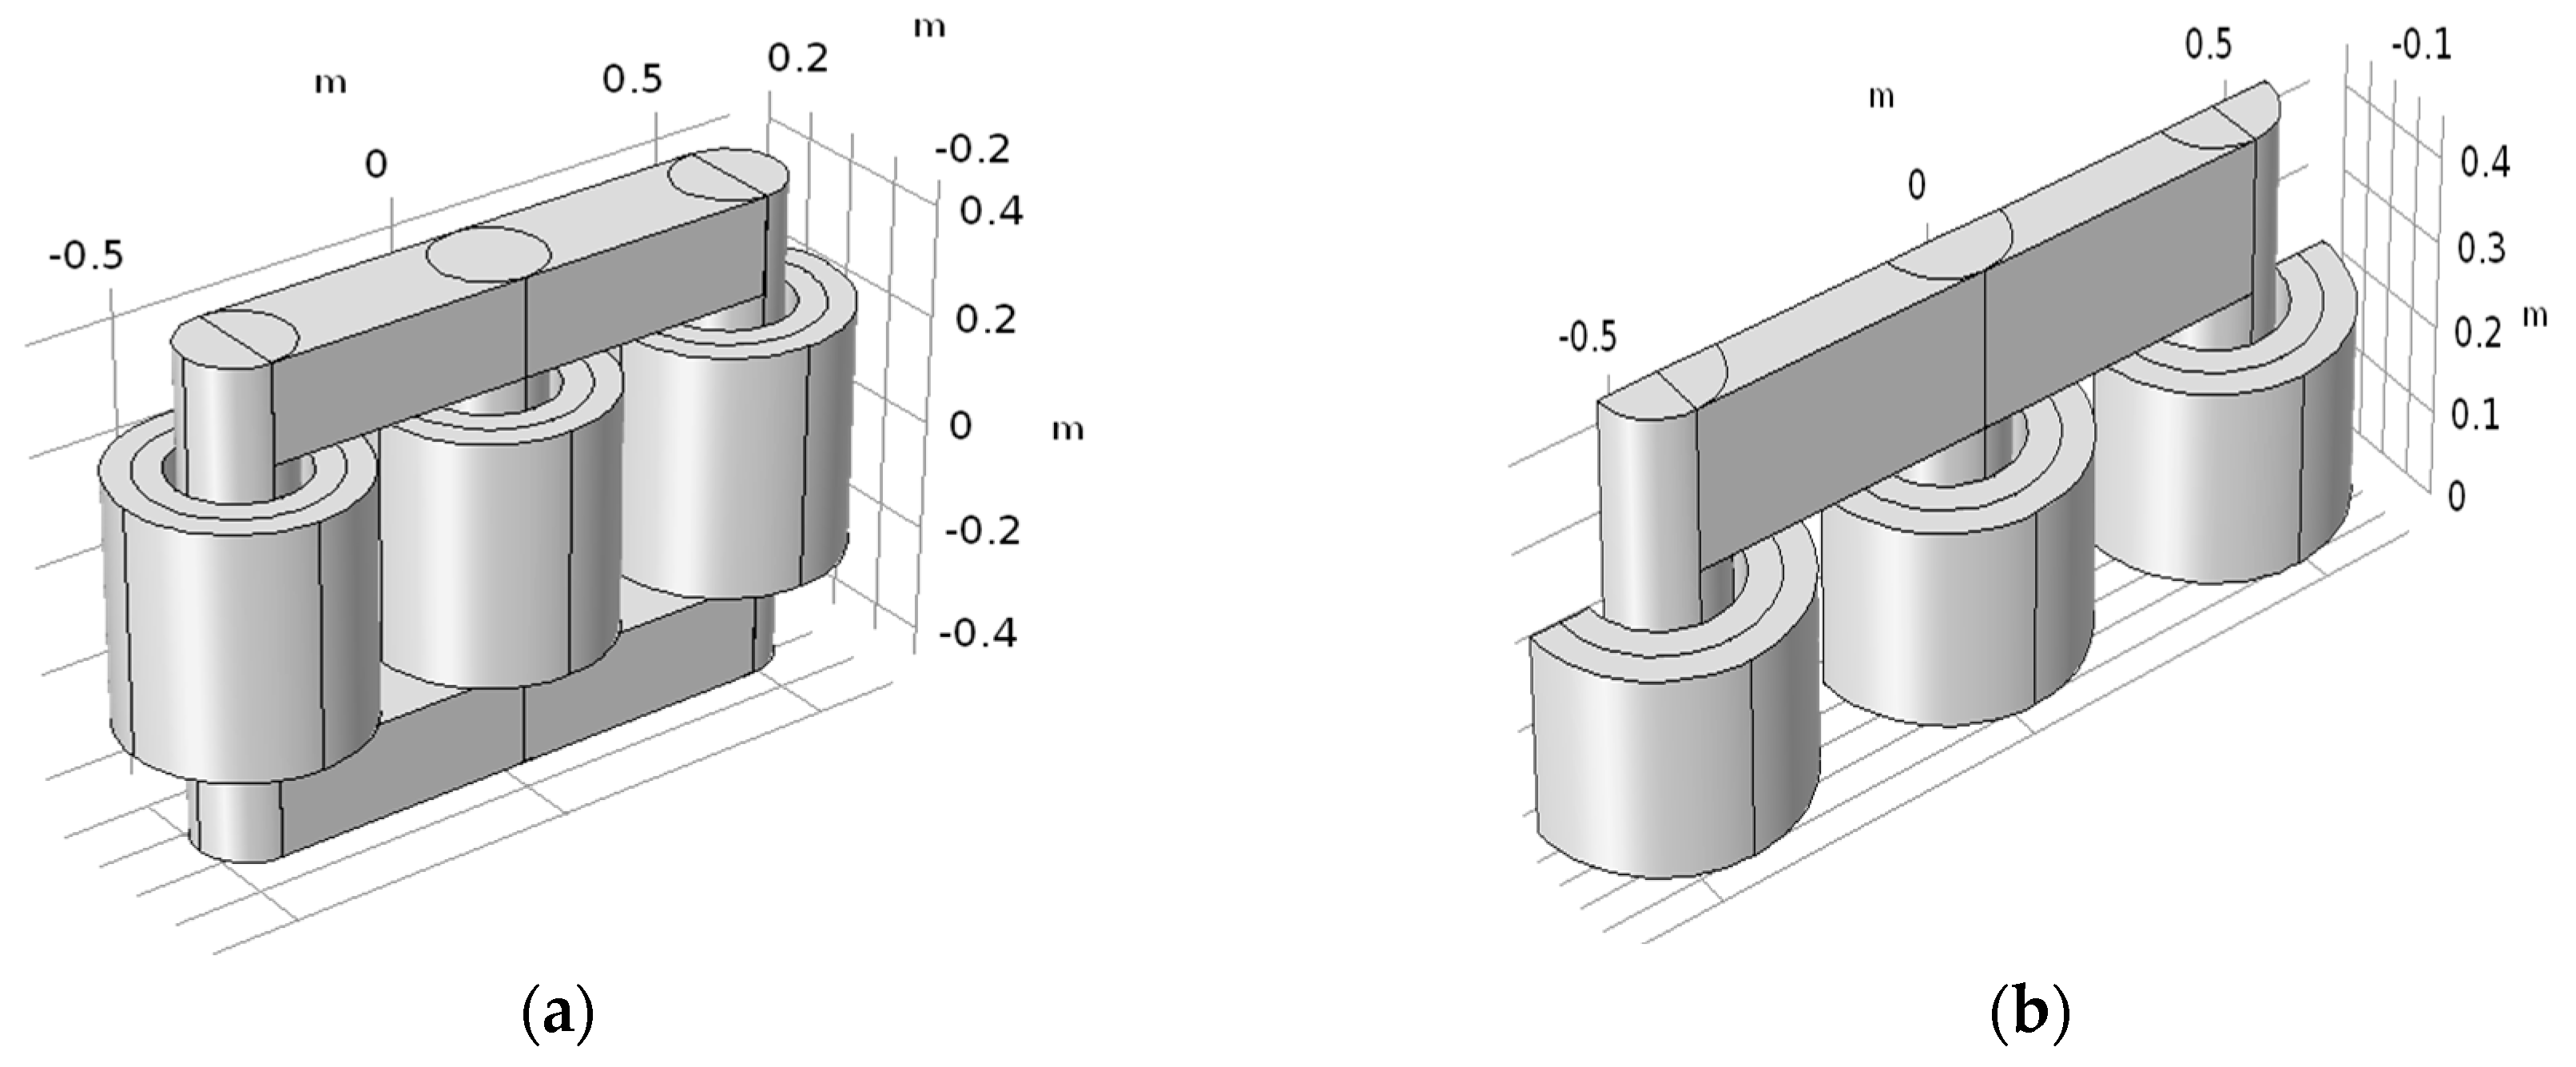
The structure of the transformer is complex and includes a variety of components such as the winding, iron core, and cooling device. For the purpose of the simulation, the transformer is simplified and treated as an ideal model in which the internal cooling device and supporting fastening components are neglected. The finite-element geometric model was set up based on the actual structural parameters of the SCB10-1000/10 dry-type transformer (Xuzhou Debon Electric Equipment Co., Ltd., Xuzhou, China), and a fixed constraint was applied at both ends of the winding to simulate clamping. To simulate the electrical insulation of the actual transformer, three-phase high- and low-voltage winding turns and layers were used, which allowed the electromagnetic field to be solved. The solid mechanics model was set up as a fully coupled solution to understand the connection between the differential equation of motion and the differential equation of the electromagnetic field. The simulation model is shown in Figure 4a. To improve efficiency, the geometric transformer model was simplified by considering it symmetric. Figure 4b illustrates the simplified geometric model of the body.
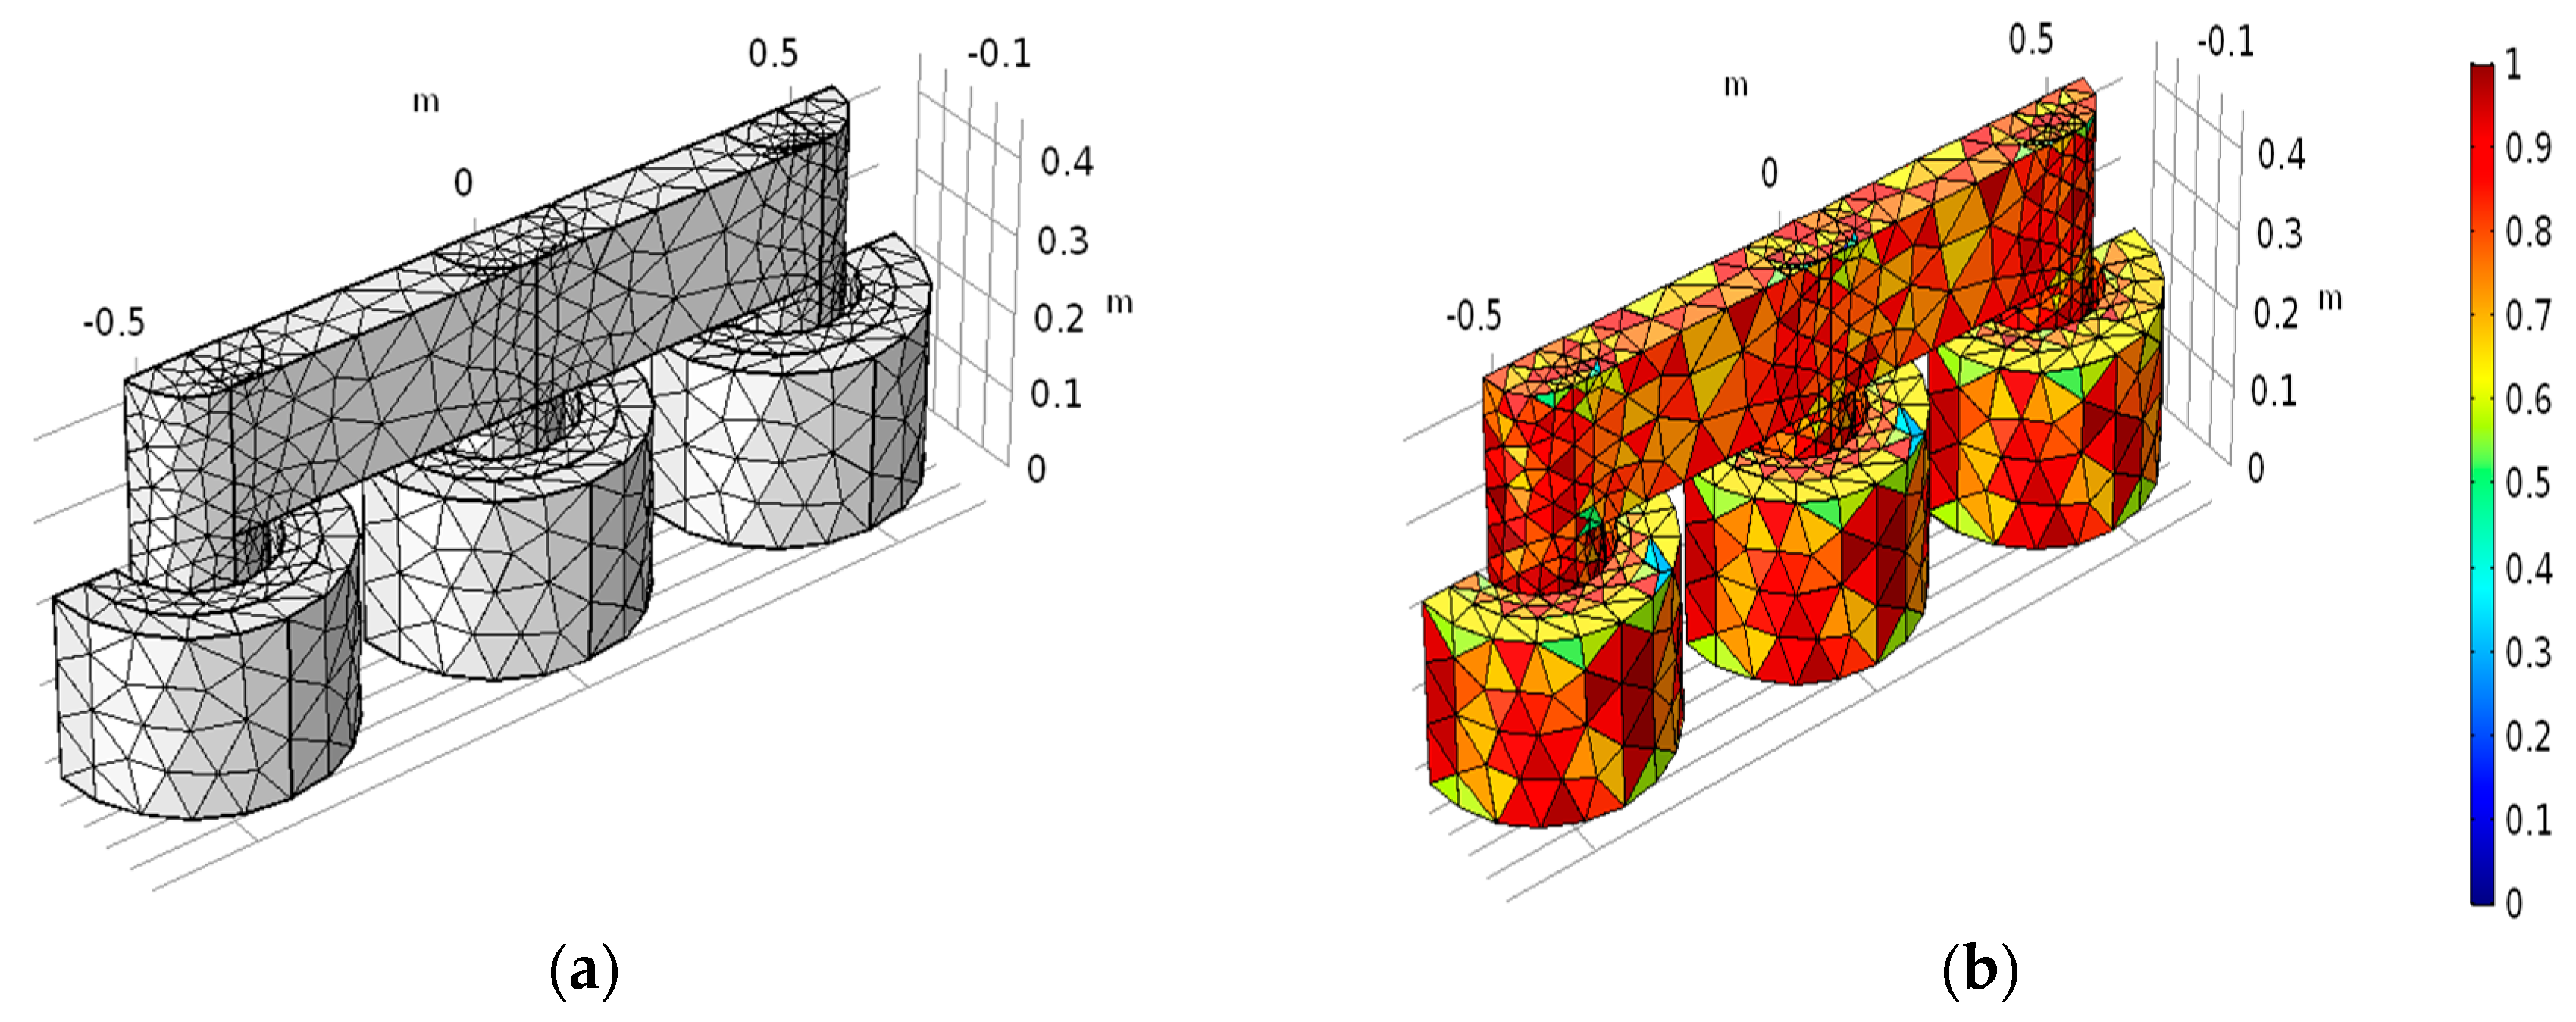
The geometric model of the transformer is meshed by means of a free tetrahedron network, and the mesh model shown in Figure 5a can be obtained. The mesh quality is shown in Figure 5b, and the closer the value is to 1, the higher the mesh quality is. The winding and core structural parameters of the SCB10-1000/10 dry-type transformer are shown in Table 2 and Table 3.
3.2. Simulation Model of Electromagnetic Field
Figure 6 shows the circuit diagram of the transformer. In the diagram, an AC voltage source with a 50 Hz frequency was applied to the three-phase high-voltage side, and the low-voltage side was short-circuited. A 50 Hz AC voltage to the rated current was applied to the high-voltage winding by an external voltage source. The three-phase induction current of the low-voltage winding was obtained by electromagnetic-coupling calculation, as shown in Figure 7. As a result, the amplitude of the three-phase induction current of the low-voltage winding was 2041 A, and its effective value was 1443.38 A. The simulation results are consistent with the rated current of the transformer, as shown in Table 1.
The current obtained from the circuit module is used as the excitation source of the magnetic-field model, and current density J was brought into the magnetic-field differential equation as follows:
In Equation (7), μ0 represents the permeability of free space and has a value of 4π *10−7H/m, R is the relative permeability, A is the vector magnetic potential, and Je is the current density. Additionally, the following relationship exists in the electromagnetic-field model:
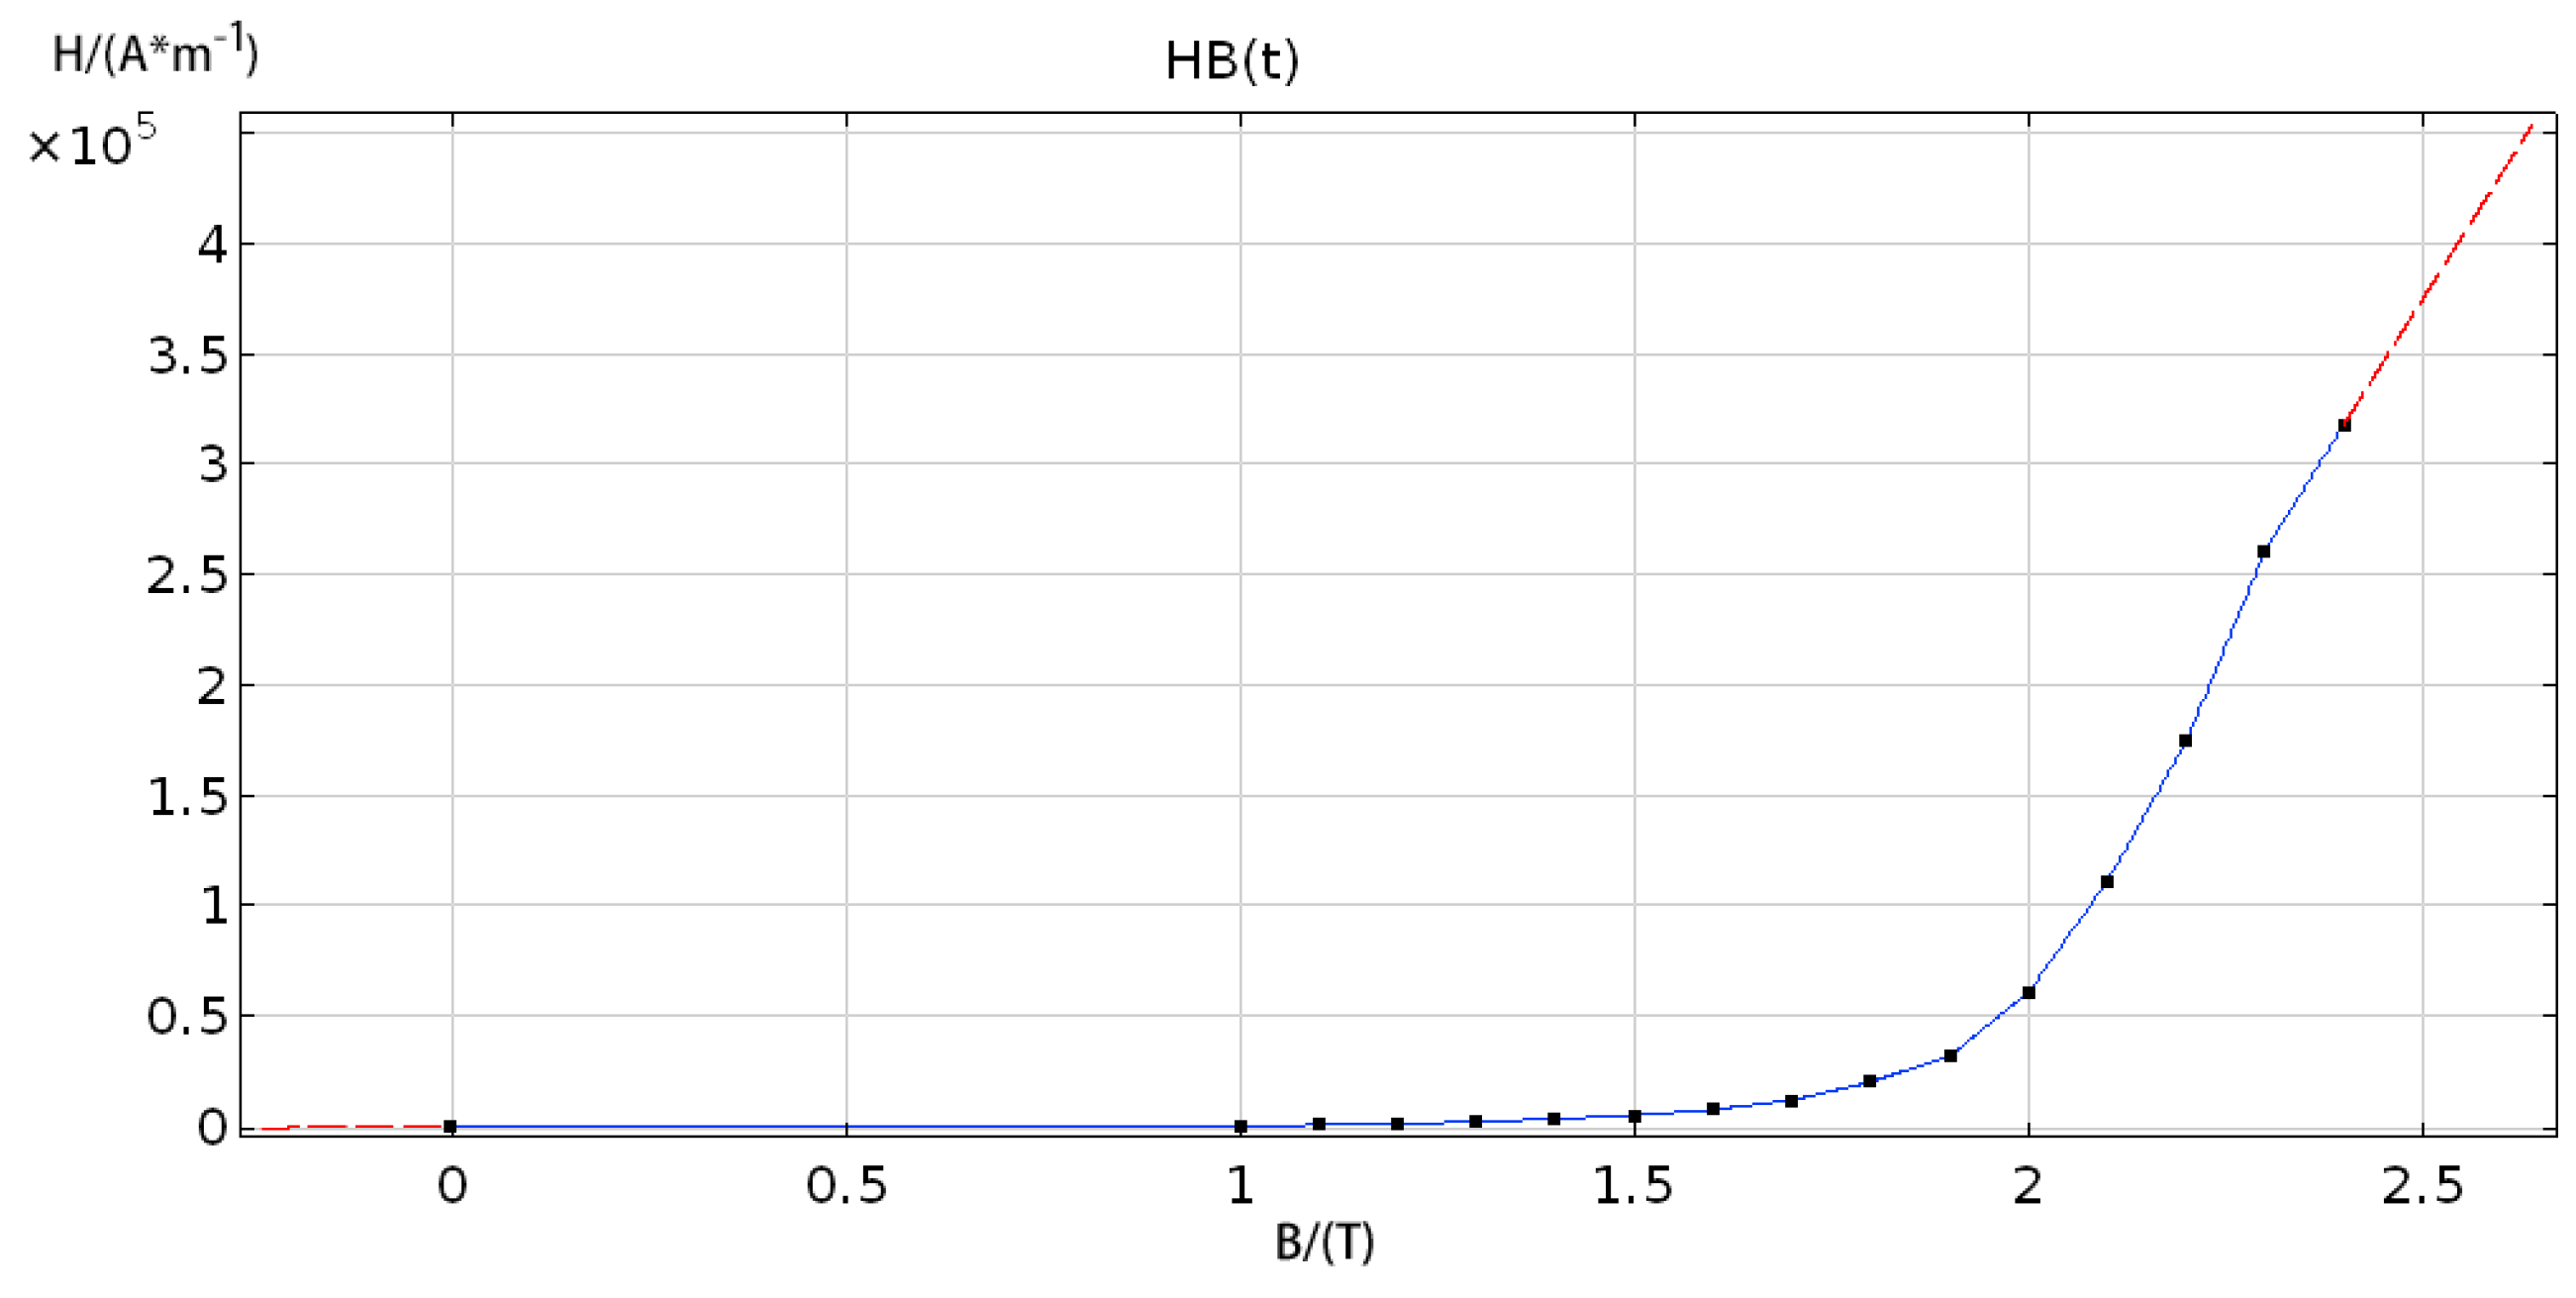
where B represents the magnetic-flux density, and H represents the magnetic-field intensity. Figure 8 shows the H–B curve of the transformer when it is in operation. The curve in Figure 8 also provides information on the material properties of the dry-type transformer core, which agrees with the actual material properties of the transformer.
The magnetic-flux density distribution around the winding and the core of the dry-type transformer during a short-circuit test was obtained by coupling the electromagnetic-field model.
As seen from Figure 9, the maximum flux-leakage density of the dry-type transformer winding was 0.08 T, and the maximum flux density of the core was 1.75 T. The results of the simulation are in line with the output parameters of the SCB10-1000/10 dry-type transformer. The results verify the correctness of the model, demonstrating that the model can be further used for the simulation of various faults in the windings.
3.3. Modeling of Solid Mechanics and Analysis of Winding Vibration
In the solid-mechanics model, the vibration characteristics of the dry-type transformer winding must be coupled. The mass inertia, elasticity, and damping of the winding are the key factors affecting its vibration. Equation (9) provides the differential equations of motion for the solid mechanics.
In Equation (9), Mi represents the mass matrix; Ci represents the damping coefficient matrix, represents the stiffness coefficient matrix, z represents the deformation (displacement) of the winding, represents the deformation velocity of the winding, represents the deformation acceleration of the winding, and f(t) represents the magnitude of the force on the winding. Equation (5) for electrodynamic force is incorporated into the differential equation of Motion (9).
To converge to a solution, it is necessary to impose fixed constraints on both ends of the transformer winding.
In Equation (10), mass matrix Mi, damping coefficient Ci, and stiffness coefficient ki are all constant, which makes it a constant coefficient differential equation. The solution of the equation is composed of the general solution and the special solution. For the homogeneous part,
the general solution is as follows:
In Equation (12), Y and θ are constants whose values are determined by the initial conditions, and represents the natural frequency of the vibration of the transformer winding, which is expressed as follows:
There are two special solutions for Equation (10):
In the equation: .
The total displacement of the transformer winding at any time can be expressed as follows in Equation (16):
where t, the total displacement of the winding, and the displacement velocity are zero. Integral constants Y and θ can then be obtained.
By quadratic derivation of the total displacement equation of the transformer winding, the vibration acceleration a of the transformer winding at any time t can be obtained as in Equation (17):
From the solution above, it can be seen that the vibration characteristics of a given transformer’s windings are mainly related to the elastic coefficient and the winding geometry, that is, when elastic coefficient K and the geometric structure of the transformer winding are changed, the vibration acceleration of the transformer-winding surface changes accordingly. Table 4 shows the main material properties of the winding and the core in the solid mechanics model [29].
The amplitude and axial forces on the transformer winding are obtained through a simulation of the solid mechanics, as demonstrated in Figure 10. The legend shows the magnitude of stress, and the red arrows indicate the direction of force. As seen in Figure 10a, the external high-voltage windings receive outward traction, while the inner low-voltage windings are pushed inward; the force of the outer winding is obviously lower than that of the inner winding. Figure 10b shows that the two ends of the transformer winding are subjected to inward extrusion pressure. Therefore, the above simulation results are in line with the actual force on the transformer windings.
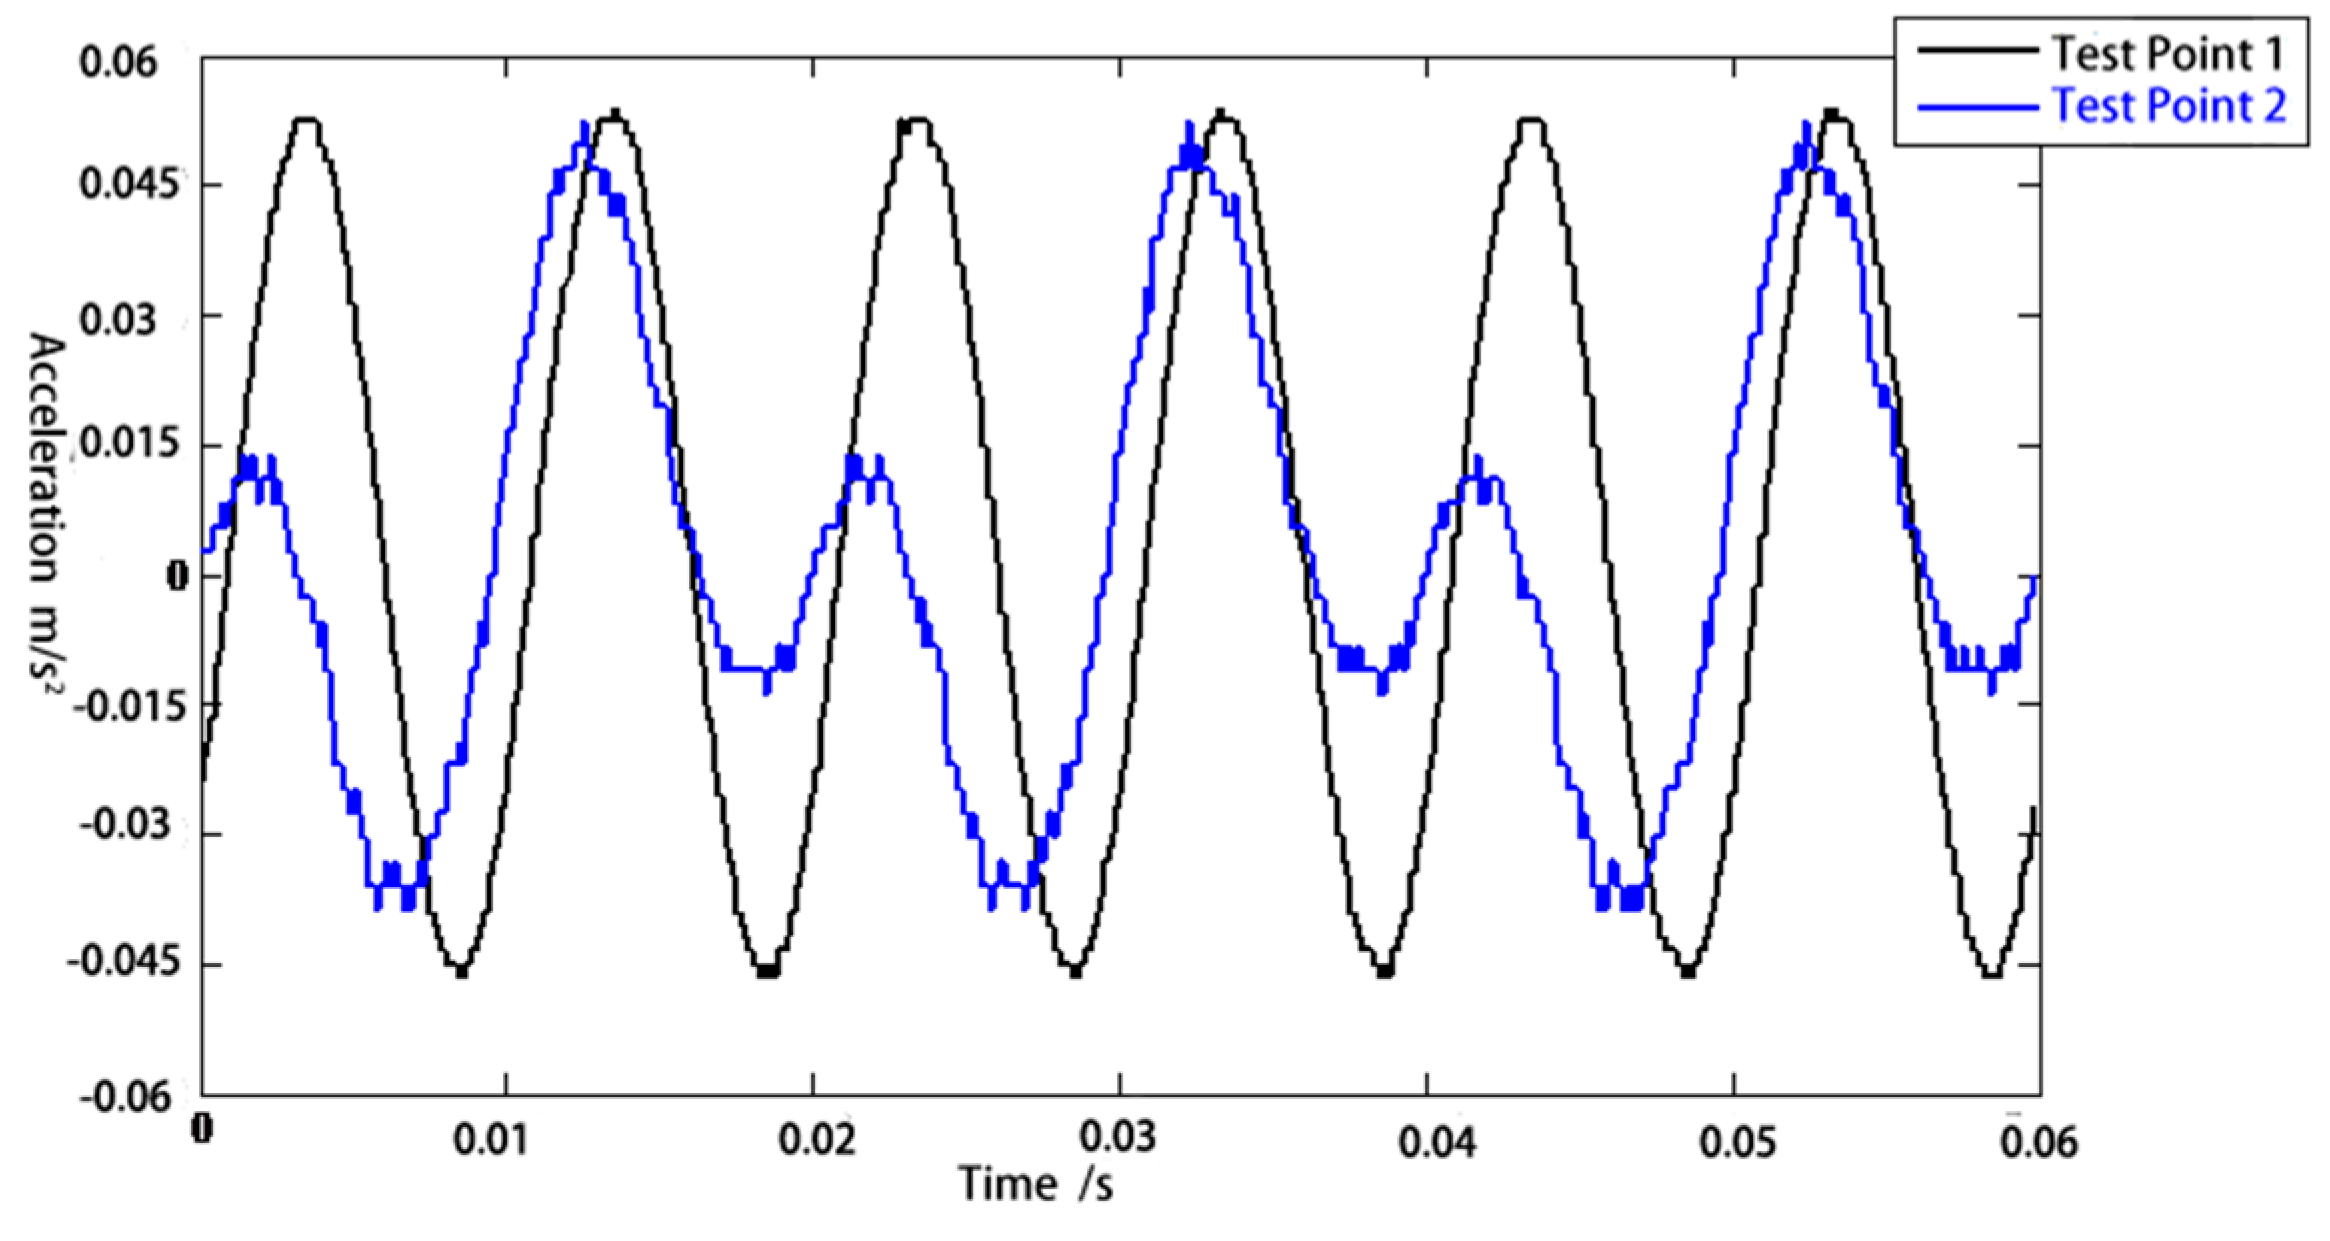
To further verify the accuracy of the above model, the vibration signals measured by the transformer short-circuit test were compared with the vibration signals from the simulation. Figure 11 shows the layout of the actual vibration-signal measurement points and the simulation-model measurement points. The locations in the simulation model are consistent with the vibration signal measured in the experiment.
Figure 12 shows the calculated results of vibration at the placement of the acceleration vibration sensor and the measured results. Because the current passing through the winding in the short-circuit experiment is rated current, the simulation-calculation conditions are close to the actual measurement conditions. As shown in Figure 12, the simulation results are in good agreement with the measured results, which further illustrates the validity of the finite-element model and the correctness of the calculation results. In addition, the vibration waveform of the test point appears in the shape of the top cusp, which may be due to the material characteristics [30].
4. Simulation and Analysis of the Mechanical Faults of Transformer Windings
4.1. Simulation Geometric Model of the Mechanical Faults of Transformer Winding
Models were simulated for winding-insulation loss, winding looseness, and winding deformation, with the number of coil turns held constant. The nonlinear characteristics of insulating pads and clamps in transformer windings cause their elastic modulus to vary with pretightening force. That is to say, the elastic coefficient of insulating pads on both sides of windings is related to the degree of tightening after assembly [31]. In this paper, as shown in Figure 13a, the core and clip were reasonably simplified. Pretightening force was reduced by changing the elastic coefficient of the B-phase winding material, and the loosening of the B-phase winding was simulated by slightly extending the length of the B-phase winding. Transformer-winding deformation is usually caused by the electric force formed by the short-circuit current and axial magnetic field. For the winding-deformation faults simulated in Figure 13b, the high-voltage windings were subjected to radial electrodynamic force of outward expansion, resulting in the windings bulging. The low-voltage winding was twisted by the internal radial electric force. In the model studied in this paper, in order to study the axial and radial displacement of winding after a winding-deformation fault more intuitively, circular winding was changed into an octagonal cylinder with obvious edges and angles to simulate the bulging condition after winding deformation. As shown in Figure 13c, the effect of the winding insulation was simulated by reducing the number of B-phase winding coils. During the simulation, the other conditions were not changed.
4.2. Analysis of the Simulation Results of Three Typical Faults
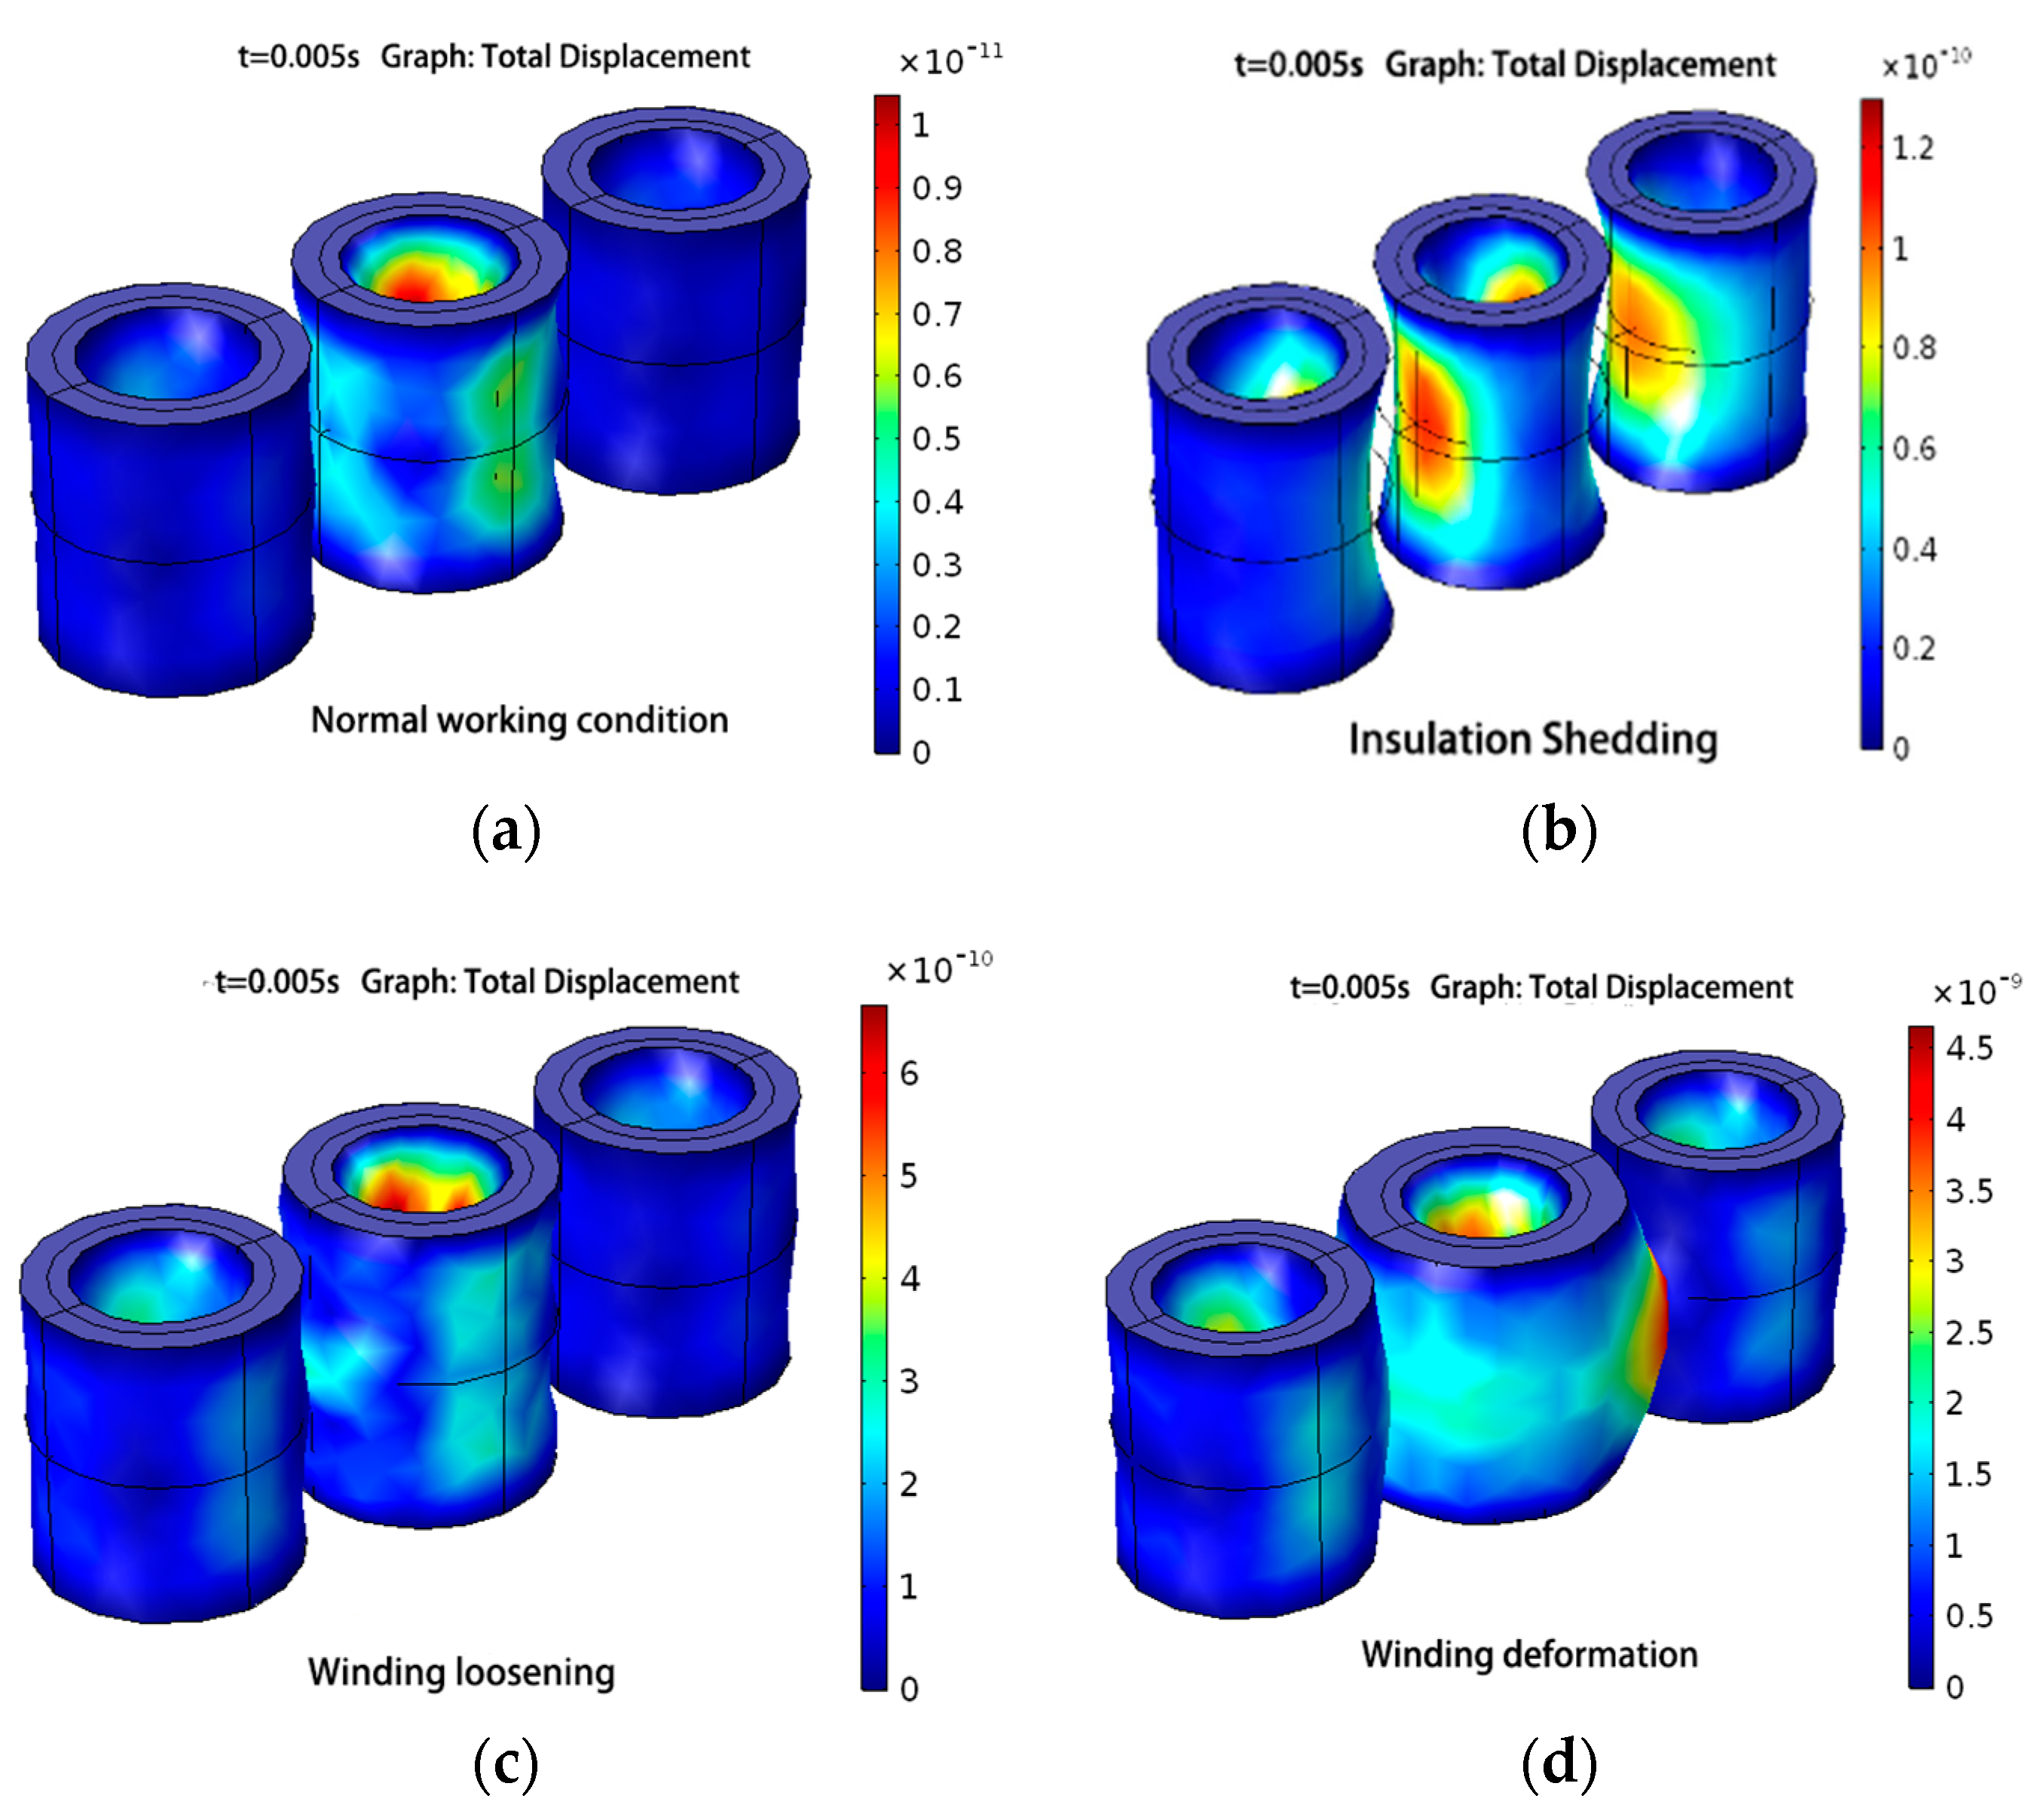
As shown in Figure 14 and Figure 15, the total displacement of normal windings and the total displacement of windings under the effect of insulation shedding, winding loosening, and winding deformation were compared for a time period of 0.005 s.
Figure 14 shows that the total displacement of the transformer windings was smallest under normal conditions, while the winding was more prone to displacement in the event of a fault. Total displacement was greatest in the case of winding deformation. The results validate the cumulative characteristics of winding mechanical faults, that is, small mechanical faults increase force on the winding, which makes it relatively easy for greater mechanical faults to occur. Therefore, considerable attention should be paid to the mechanical state of the winding. If a small mechanical failure occurs, it should be dealt with in a timely manner; if it is not, it becomes relatively easy for a serious accident to occur.
Figure 15 shows that the total displacement of the low-voltage winding in the inner part of the transformer was greater than the displacement of the lateral high-voltage winding, which indicates that the force of the low-voltage coil was greater than that of the high-voltage coil. This result is due to the opposing directions of current flow along the windings between the high- and low-voltage sides of the transformer, as well as the mutual exclusion of the electromagnetic force in the radial direction of the two windings, which is in accordance with the actual force. This result verifies the accuracy of the model.
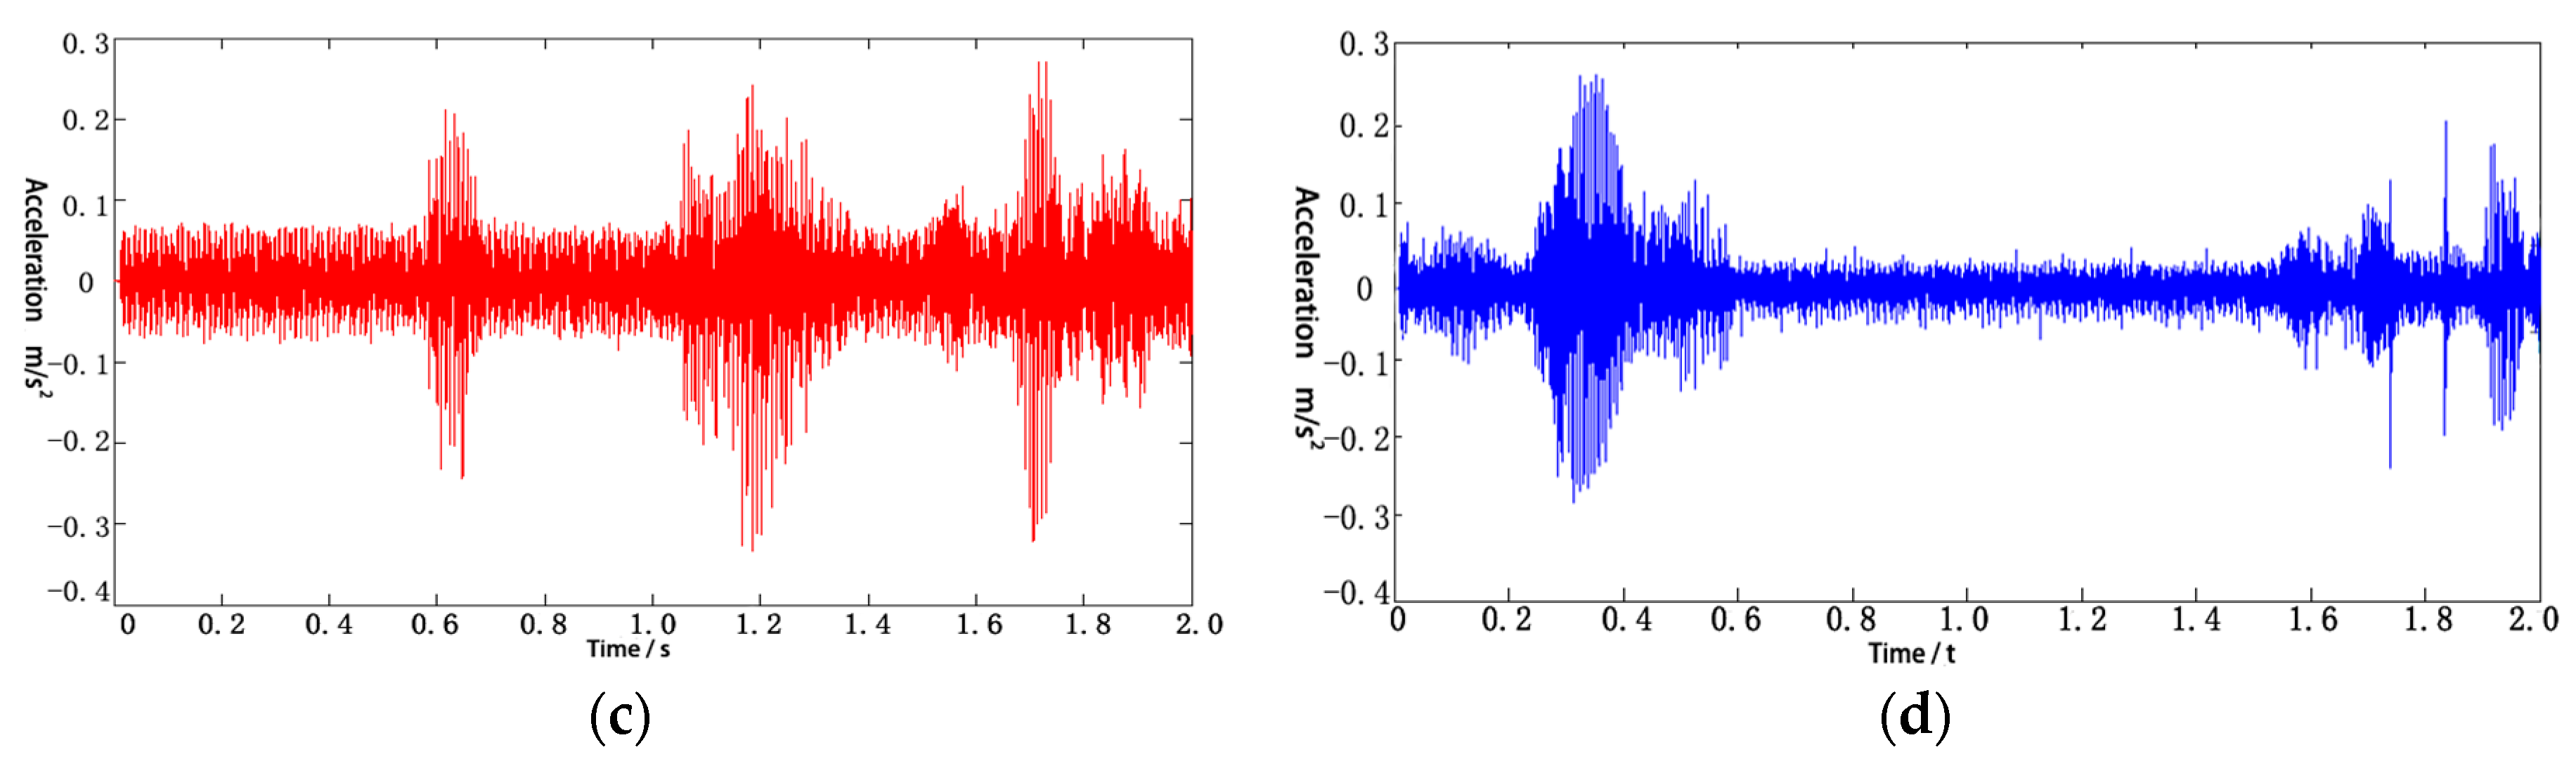
Figure 16 shows a time-domain diagram of the vibration-acceleration signal at measurement point 1 under normal working conditions, as well as in the cases of insulation shedding, winding loosening, and winding deformation.
As seen from Figure 16, the vibration signal at measurement point 1 under normal conditions was more stable than the vibration signal at the time of failure, and the average amplitude of the vibration signal was approximately 0.06 m/s2. When insulation shedding occurred, the maximum amplitude of the vibration-acceleration signal at measurement point 1 was 0.08 m/s2. When the winding was loose, the maximum amplitude of the vibration acceleration signal at measurement point 1 was 0.28 m/s2. When winding deformation occurred, the maximum amplitude of the vibration-acceleration signal at measurement point 1 was 0.25 m/s2. When a winding fault occurred, the amplitude of the vibration signal was nonstationary. Moreover, when the winding was loose, and the winding deformation failed, the change was more intense. When the transformer windings failed, vibration signals would obviously change. The amplitude of the vibration signal in the fault was higher than the amplitude of the normal vibration signal, and the fluctuation of the signal was intense.
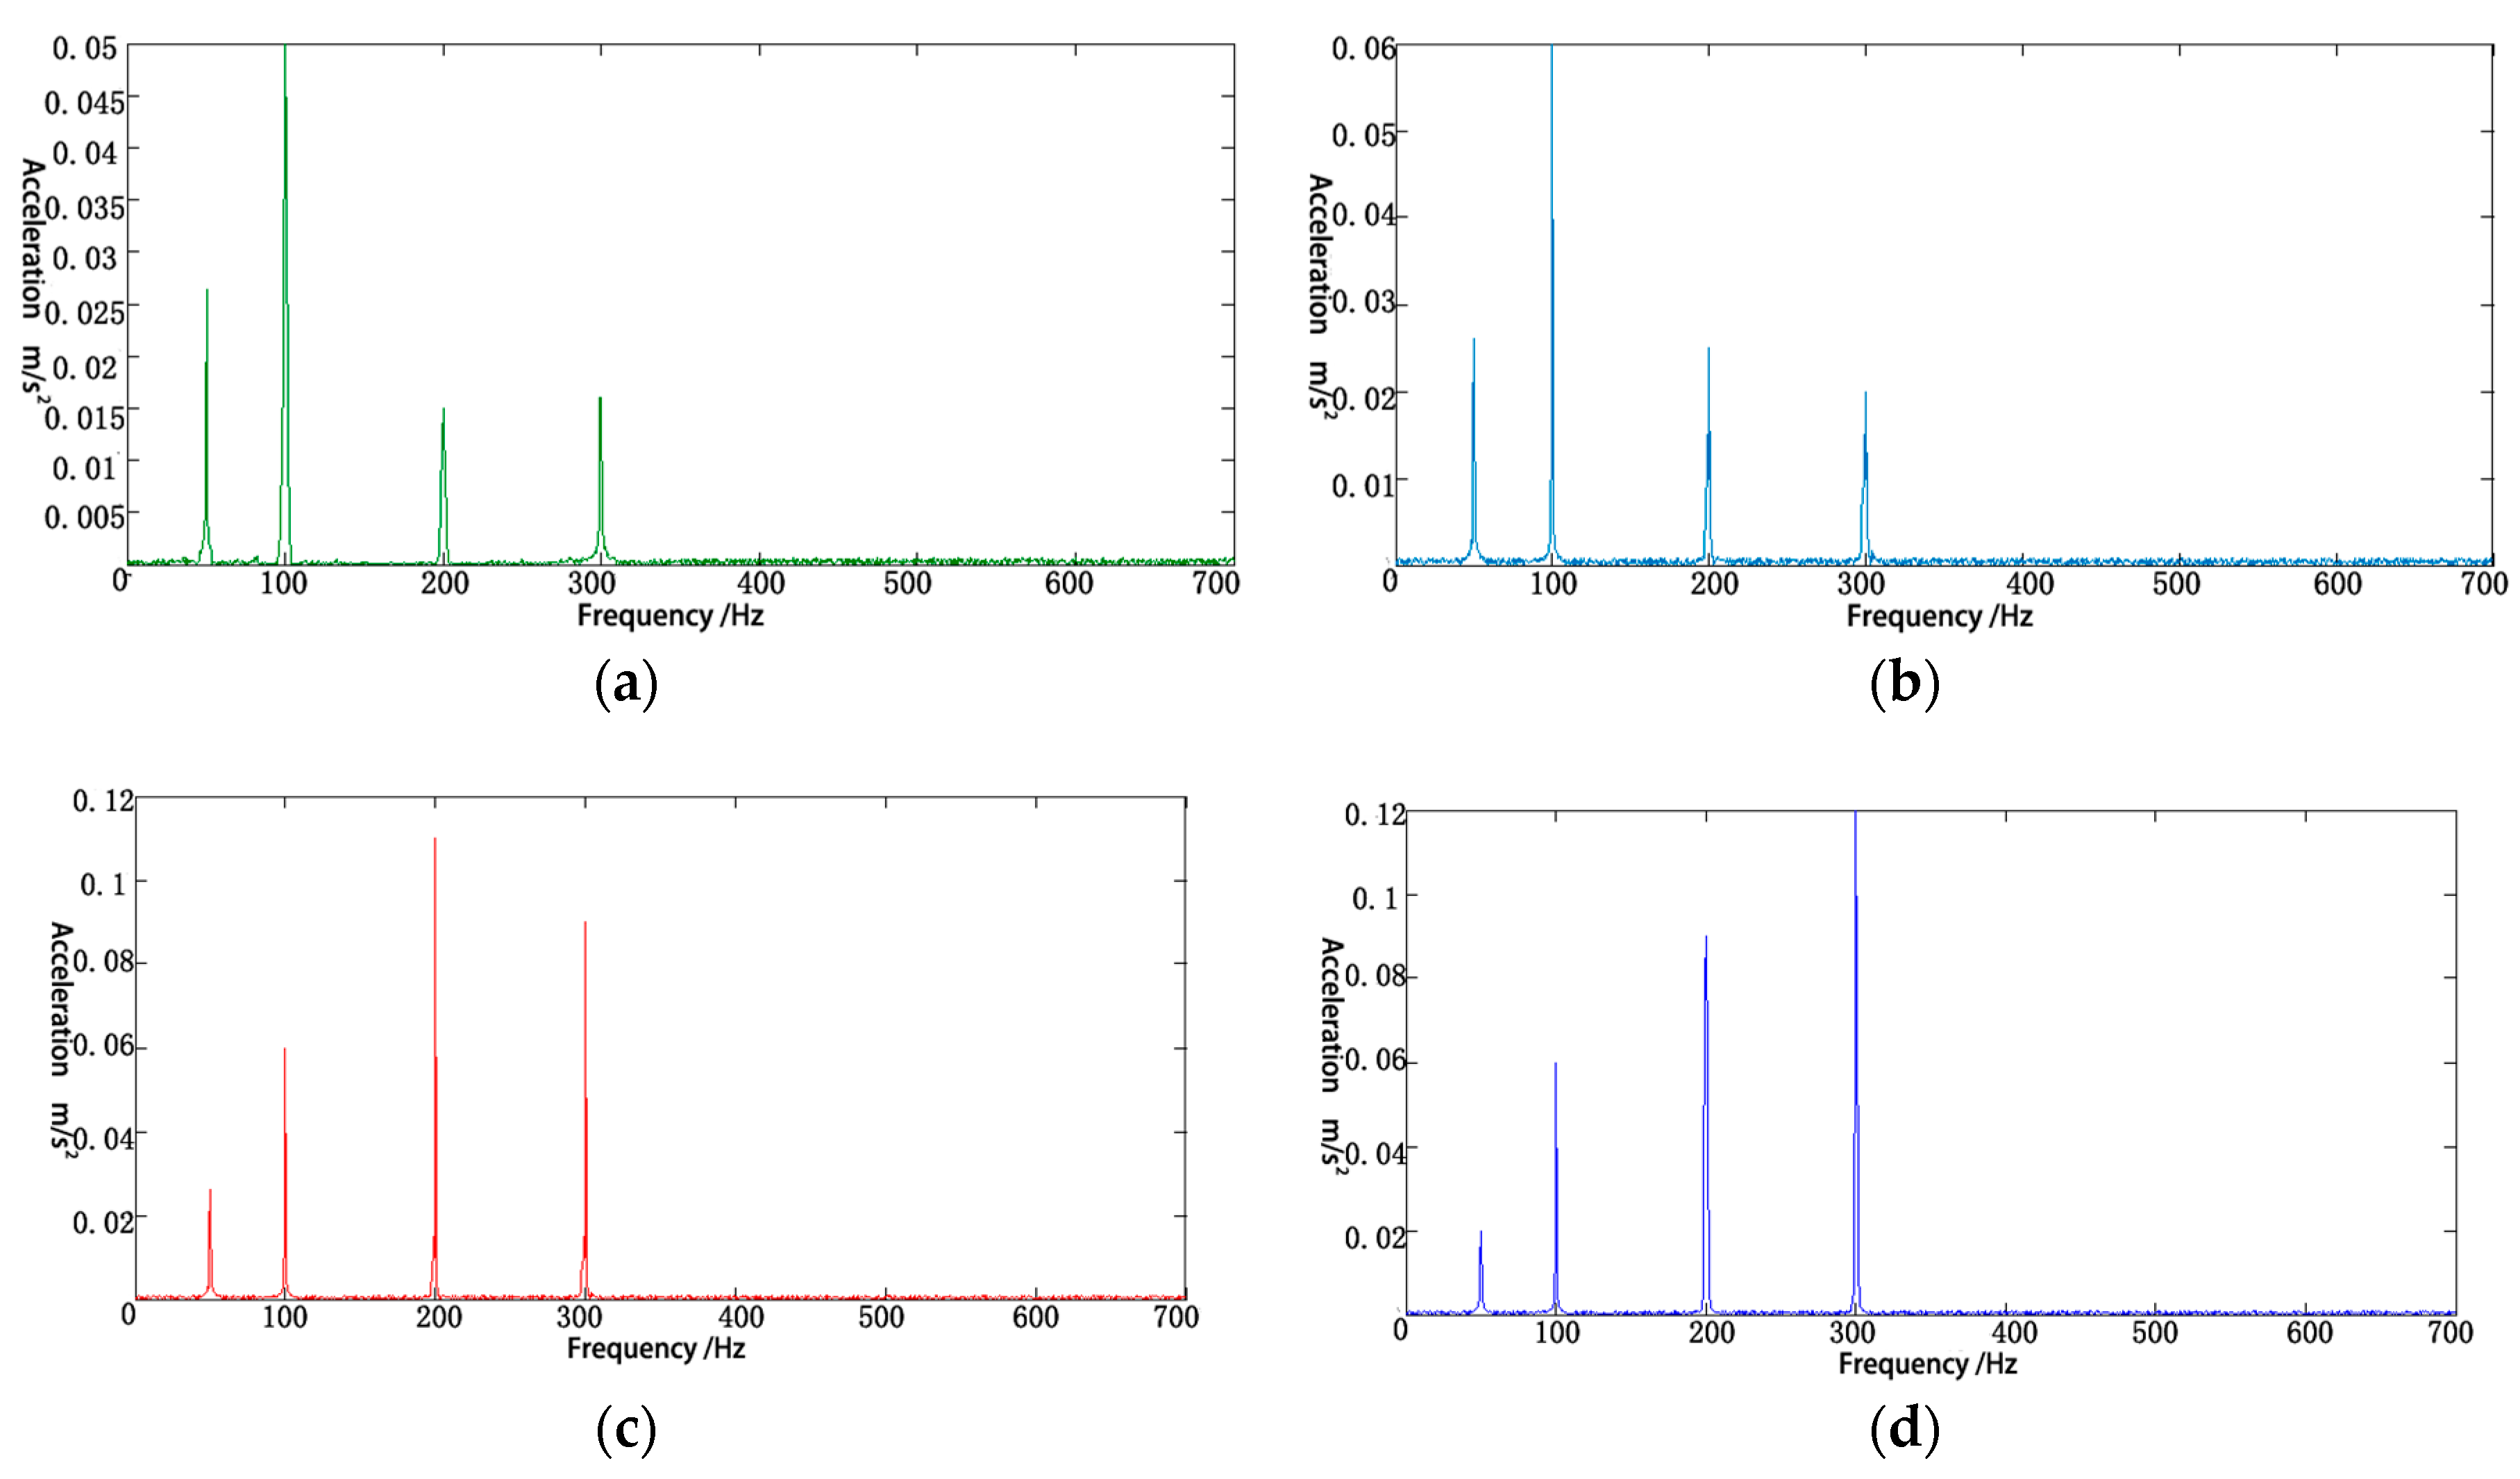
Figure 17 presents a spectrum-analysis diagram of the vibration signal at measurement point 1, when the transformer was working under normal conditions, as well as for the cases of insulation shedding, winding loosening, and winding deformation.
As shown in Figure 17, the maximum frequency attained by the vibration-acceleration signal at transformer measurement point 1 was 100 Hz under normal operating conditions, at which point the amplitude was 0.05. Signals with frequencies of 50 Hz, 200 Hz, and 300 Hz can also be seen in this diagram. When insulation was shed, the amplitudes of the 100 Hz, 200 Hz, and 300 Hz signals increased. When the windings were loose, the maximum amplitude of the signal in the frequency domain occurred at 200 Hz, and the amplitude of the signal of 300 Hz increased apparently as well. When winding deformation occurred, the maximum amplitude of the vibration signal occurred at 300 Hz, and the amplitude of the signal spectrum at 200 Hz was greater than the amplitude at 100 Hz. These results are consistent with the experimental results of transformer faults in Reference [32], which verifies the accuracy of the model.
By studying the vibration characteristics of transformer windings, it is known that the corresponding mechanical vibration will change when the mechanical state of the windings changes. In order to make the change more intuitive and distinguish the characteristics of different mechanical states, based on the analysis of transformer-winding vibration characteristics, some artificial-intelligence algorithms can be used to identify fault features, such as Improved Variational Mode Decomposition (IVMD)-Weight Divergence, which is a feature-extraction method presented for vibration signals of transformer windings. In the process of feature extraction, the mechanical vibration signals of transformer windings in different states are decomposed into a series of finite-bandwidth intrinsic-mode functions (IMFs) by means of Improved Variational Mode Decomposition; K-L divergence (K-L) between the IMF component and the original vibration signal is calculated, and the weighting coefficients are multiplied. Weight divergence is obtained to represent the time-frequency domain complexity of mechanical-vibration signals of transformer windings in different states. It can effectively extract the characteristics of a mechanical-vibration signal of transformer windings [33].
Many scholars have studied the vibration state of the transformer. Gu Hongxia of Kunming University of Technology, through the finite-element analysis of winding-loosening faults, showed that the natural frequency of the four orders in winding-loosening faults and the natural frequency of the normal state of the winding transfer to a low frequency [34]. The simulation experiment shows that it can be used. Natural frequency is used to judge the working condition of power-transformer windings. However, this paper only focuses on the loosening fault of windings, and other faults such as winding deformation and insulation shedding are not studied. From the point of view of acoustic measurement, C. Bartoletti extracts the weighted values and proportions of the middle-, low-, and high-frequency signals from the noise signals for transformer-fault diagnosis [35]. In this paper, the operation state of the transformer is diagnosed by the sound signal. But the vibration signal is transmitted through air, and noise reduction is needed to obtain the available vibration signal. The monitoring effect is not as accurate as the vibration of the transformer itself. Hyun-Mo Ahn has more analysis on the vibration and stress of short-circuit faults, but less research on the vibration caused by load changes in normal operation [36]. Ji Shengchang of Xi’an Jiaotong University has done long-term work on the vibration characteristics of the transformer. The radial vibration of the transformer winding, axial-vibration characteristics of the pressure plate, and influencing factors were studied [37]. The vibration law and propagation characteristics of transformer windings were revealed. There is no theoretical calculation of the radial vibration of the winding, and no research on the change rule of the vibration characteristics of the typical winding mechanical-fault state, which makes it difficult to judge the actual fault.
By setting winding looseness, winding deformation, and insulation shedding, and by means of simulation and experiment, the frequency-spectrum characteristics of winding-vibration signals under different conditions were analyzed. From the research, it can be seen that the transformer-vibration model provides a reliable basis for transformer-winding state simulation and fault diagnosis, and can be used to easily calculate the distribution of the magnetic field and the winding characteristics of the transformer. Moreover, this model can be used to analyze vibration control during the design of a transformer, thereby shortening the design cycle. It also provides a theoretical basis and method of calculation for further analysis and verification of new methods of reducing electromagnetic noise in transformers.
5. Conclusions
In this paper, the mechanical-vibration characteristics of transformer windings were studied theoretically. Changes in the mechanical state of the windings were reflected in their vibration signals. A simulation model of vibration was established for an SCB10-1000/10 dry-type transformer winding using COMSOL software, and a multifield-coupling simulation of the circuit, magnetic field, and solid mechanics was performed. The following conclusions were obtained through simulation and experimental analysis. By changing the geometry model and power parameters, similar conclusions can be obtained for other types of dry-type transformers, which can be extended to the study of winding-vibration characteristics of various types of dry-type power transformers. For the oil-immersed transformer, the simulation model was greatly changed, so it was necessary to add an oil-tank wall to the transformer model, replace the medium with insulation oil, and consider the vibration-signal propagation process in the insulation oil. At the same time, we also studied the occurrence and propagation of the winding vibration of oil-immersed transformers. Because the oil-immersed transformer was closed, the vibration-signal sensor could only be mounted on the wall of the oil tank. When analyzing the signal received by the vibration-signal sensor, we needed to consider the properties of the different insulating oil. Therefore, the vibration analysis in this paper was limited to dry-type transformers.
(1) A short-circuit experiment was performed on an SCB10-1000/10 transformer, which is a dry-type transformer. Information on the vibration acceleration at the surface of the transformer was obtained using a vibration-acceleration sensor (YD70C), a charge amplifier (DHF-10), and a Tek oscilloscope. Vibration-signal analysis showed that, when the secondary winding of the transformer was short-circuited, the signal was mainly composed of a 100 Hz component and contained relatively small components at 50 Hz, 200 Hz, and 300 Hz.
(2) Based on the vibration data obtained from the transformer short-circuit experiment, a multiphysical field-coupling vibration-simulation model of the dry-type transformer winding is established using the parameters of the actual transformer. The vibration-acceleration signal was obtained from actual measurement points, which was then compared to the corresponding points in the simulation. The similarity between the two exceeded 80%. Therefore, the model can be used to investigate the vibration of transformer windings and possesses high value in engineering applications.
(3) Based on the simulation model, for normal working conditions, fault simulations of the transformer windings were carried out. Specifically, winding loosening, deformation, and insulation shedding were simulated, and the vibration characteristics of these winding faults were analyzed. When insulation was shed, the amplitude in the frequency domain at 100 Hz, 200 Hz, and 300 Hz increased. When the winding was loose, the maximum amplitude in the frequency domain appeared at 200 Hz, and the amplitude at 300 Hz was also relatively larger. When winding deformation occurred, the maximum amplitude of the vibration signal occurred at 300 Hz, and the amplitude at 200 Hz exceeded the amplitude at 100 Hz. The simulation results are consistent with the experimental results, which verify the accuracy of the fault model. This method can provide a new basis for simulating and diagnosing transformer-winding faults.
Author Contributions
X.D. and J.L. designed the multiphysics field-coupling model for transformer-winding vibration, performed the data analysis, and prepared the manuscript. L.Z. (Li Zhang) and L.Z. (Liang Zou) assisted the project and managed to obtain the transformer-vibration signal. T.Z. led the project and research. All authors discussed the results and approved the publication.
Funding
This research was supposed by the Key Research and Development project of Shandong Province (2018GGX104009).
Conflicts of Interest
The authors declare no conflict of interest.
References
- Zhang, F.; Ji, S.; Shi, Y.; Lu, W.; Li, D.; Chen, L. Research on transformer winding vibration and propagation characteristics. Trans. China Electrotech. Soc. 2018, 38, 2790–2798. [Google Scholar]
- Ghoneim, S.S.M.; Taha, I.B.M. A New approach of DGA interpretation technique for transformer fault diagnosis. Int. J. Electr. Power Energy Syst. 2016, 81, 265–274. [Google Scholar] [CrossRef]
- Wang, J.; Li, D. Accidents and defects analysis of 110 kV and above voltage transformers. Guangxi Electr. Power 2014, 37, 63–64. [Google Scholar]
- Wang, Z. Cause analysis to deteriorate of 220 kV power transformer and its counter measure. Inner Mong. Electr. Power 2016, 59, 34–41. [Google Scholar] [CrossRef]
- Wang, M. 220 kV power transformer damage analysis and countermeasures 2005 year 110 (66) kV and above transformer accident and defect statistical analysis. Power Equip. 2006, 7, 99–102. [Google Scholar]
- Deng, Y. Typical Examples of Transformer Equipment Failure (2006–2010 Years); China Electric Power Press: Beijing, China, 2012; pp. 16–23. [Google Scholar]
- Wang, M. Statistic analysis of transformer′s faults and defects at voltage 110 kV and above. Distrib. Util. 2007, 24, 1–5. [Google Scholar]
- Report, A.C. Bibliography on transformer noise. Power Appar. Syst. Part III 1954, 73, 1760–1762. [Google Scholar] [CrossRef]
- Fahnoe, H. A Study of sound levels of transformers. Electr. Eng. 2013, 60, 277–282. [Google Scholar] [CrossRef]
- Masti, R.S.; Desmet, W.; Heylen, W.; Leuven, K. On the Influence of Core Laminations upon Power Transformer Noise. In Proceedings of the 2004 International Conference on Noise and Vibration Engineering, Heverlee, Belgium, 20–22 September 2004. [Google Scholar]
- Foster, S.L.; Reiplinger, E. Charcteristics and control of transformer sound. IEEE Trans. Power Appar. Syst. 1981, PAS-100, 1072–1077. [Google Scholar] [CrossRef]
- Xu, L.; Liu, X. Study on the Three dimension attenuated model and the algorithm of environmental noise in substations. Proc. CSEE 2012, 32, I0024. [Google Scholar]
- Wu, G.; Cheng, S.G.; Huang, L.; Huang, L.; Gao, F. Prediction on noise of 220 kV outdoor substation to environmental infection. Noise Vib. Control 2007, 27, 135–137. [Google Scholar]
- Zhu, L.; Yang, Q.; Yan, R.; Zhan, X. Research on vibration and noise of power transformer cores including magnetostriction effects. Trans. China Electrotech. Soc. 2013, 28, 1–6. [Google Scholar]
- Hu, J.; Liu, D.; Liao, Q.; Yan, Y.; Liang, S. Analysis of transformer electromagnetic vibration noise based on finite element method. Trans. China Electrotech. Soc. 2016, 31, 81–88. [Google Scholar]
- Ji, S.; Li, Y.; Fu, C. Application of on-load current method in monitoring the condition of transformer’s core based on the vibration analysis method. Proc. CSEE 2003, 2, 154–158. [Google Scholar]
- Ji, S.C. Vibration Characteristics of Transformer Winding and Core and Its Application in Fault Monitoring; Xi’an Jiaotong University: Xi’an, China, 2003. [Google Scholar]
- Yu, X.; Li, Y.; Jing, Y.; Li, H. Calculation and analysis of natural frequency of winding model of transformer. Transformer 2010, 47, 5–8. [Google Scholar]
- Zhang, B.; Xu, J.Y.; Chen, J.B.; Li, H.; Lin, X.; Zang, Z. Diagnosis method of winding deformation based on power transformer vibration information. High Volt. Eng. 2015, 41, 2341–2349. [Google Scholar]
- Cheng, J.; Li, Y.; Ji, S.; Hao, H. Application of vibration method on monitoring the winding and core condition of transformer. High Volt. Eng. 2005, 31, 43–45. [Google Scholar]
- Malewski, R.; Poulin, B. Impulse testing of power transformers using the transfer function method. IEEE Trans. Power Deliv. 1988, 3, 476–489. [Google Scholar] [CrossRef]
- Zhu, Y.; Ji, S.; Zhang, F.; Liu, Y.; Dong, H.; Cui, Z.; Wu, W. Vibration mechanism and influence factors in power transformers. J. Xi’an Jiaotong Univ. 2015, 49, 115–125. [Google Scholar]
- Zhang, B. The Study on Multi-Information Diagnosis Method of Power Transformer Winding Mechanical State; Shenyang University of Technology: Shenyang, China, 2015. [Google Scholar]
- Xie, P.; Rao, Z.; Zhu, Z. Finite element modeling and analysis on transformer windings. J. Vib. Shock 2006, 25, 134–137. [Google Scholar]
- Xu, J.; Shao, Y.; Jin, Z.; Rao, Z.; Jiang, Y.; Zhou, K. The detection of transformer windings’ deformation based on the method of frequency response analysis. Noise Vib. Control 2009, 29, 26–29. [Google Scholar]
- Wan, D.F. Magnetic Theory and Its Application; Huazhong University of Science and Technology Press: Wuhan, China, 1996; pp. 56–62. [Google Scholar]
- Cheng, J.; Ji, S.; Liu, J.; Li, Y. Analysis of the measuring position for on-line monitoring on vibration signal of the winding. High Volt. Eng. 2004, 30, 46–48. [Google Scholar]
- Zhang, L.; Zhang, W.; Liu, J.; Zhao, T.; Zou, L.; Wang, X. A New Prediction Model for Transformer Winding Hotspot Temperature Fluctuation Based on Fuzzy Information Granulation and an Optimized Wavelet Neural Network. Energies 2017, 10, 1998. [Google Scholar] [CrossRef]
- Nagata, T.; Hirai, K.; Iwasaki, S.; Ebisawa, Y. Estimation on On-load Vibration of Transformer Windings. In Proceedings of the 2002 IEEE International Conference on Power Engineering Society Winter, New York, NY, USA, 27–31 January 2002; pp. 1378–1382. [Google Scholar]
- Wang, F.; Duan, R.; Geng, C.; Qian, G.; Lu, Y. Research of Vibration Characteristics of Power Transformer Winding Based on Magnetic-mechanical Coupling Field Theory. Proc. CSEE 2016, 36, 2555–2562. [Google Scholar]
- Wang, X.; Hao, N.; Zhang, G. Simulation study on detection of transformer winding deformation by frequency response considering phase characteristic. Transformer 2018, 55, 25–31. [Google Scholar]
- Wang, H.; Wang, N.; Li, T. Axial Nonlinear Vibration of Large Power Transformer Winding. Power Syst. Technol. 2000, 24, 42–45. [Google Scholar]
- Liu, J.; Wang, G.; Zhao, T.; Zhang, L. Fault diagnosis of on-load tap-changer based on variational mode decomposition and relevance vector machine. Energies 2017, 10, 946. [Google Scholar] [CrossRef]
- Gu, H. Research on the Relationship between Winding Deformation and Vibration Signal of Power Transformer; Kunming University of Technology: Kunming, China, 2017. [Google Scholar]
- Bartoletti, C.; Desiderio, M.; Carlo, D.D.; Fazio, G. Vibro-acoustic techniques to diagnose power transformers. IEEE Trans. Power Deliv. 2004, 19, 221–229. [Google Scholar] [CrossRef]
- Ahn, H.M.; Oh, Y.H.; Kim, J.K.; Song, J.S.; Hahn, S.C. Experimental verification and finite element analysis of short-circuit electromagnetic force for dry-type transformer. IEEE Trans. Magn. 2012, 48, 819–822. [Google Scholar] [CrossRef]
- Ji, S.; Wang, S.; Li, Q.; Li, Y.; Sun, Q. The application of vibration method in monitoring the condition of transformer winding. High Volt. Eng. 2002, 28, 13–15. [Google Scholar]
Figure 1.
Dry-type transformer-vibration transmission route.
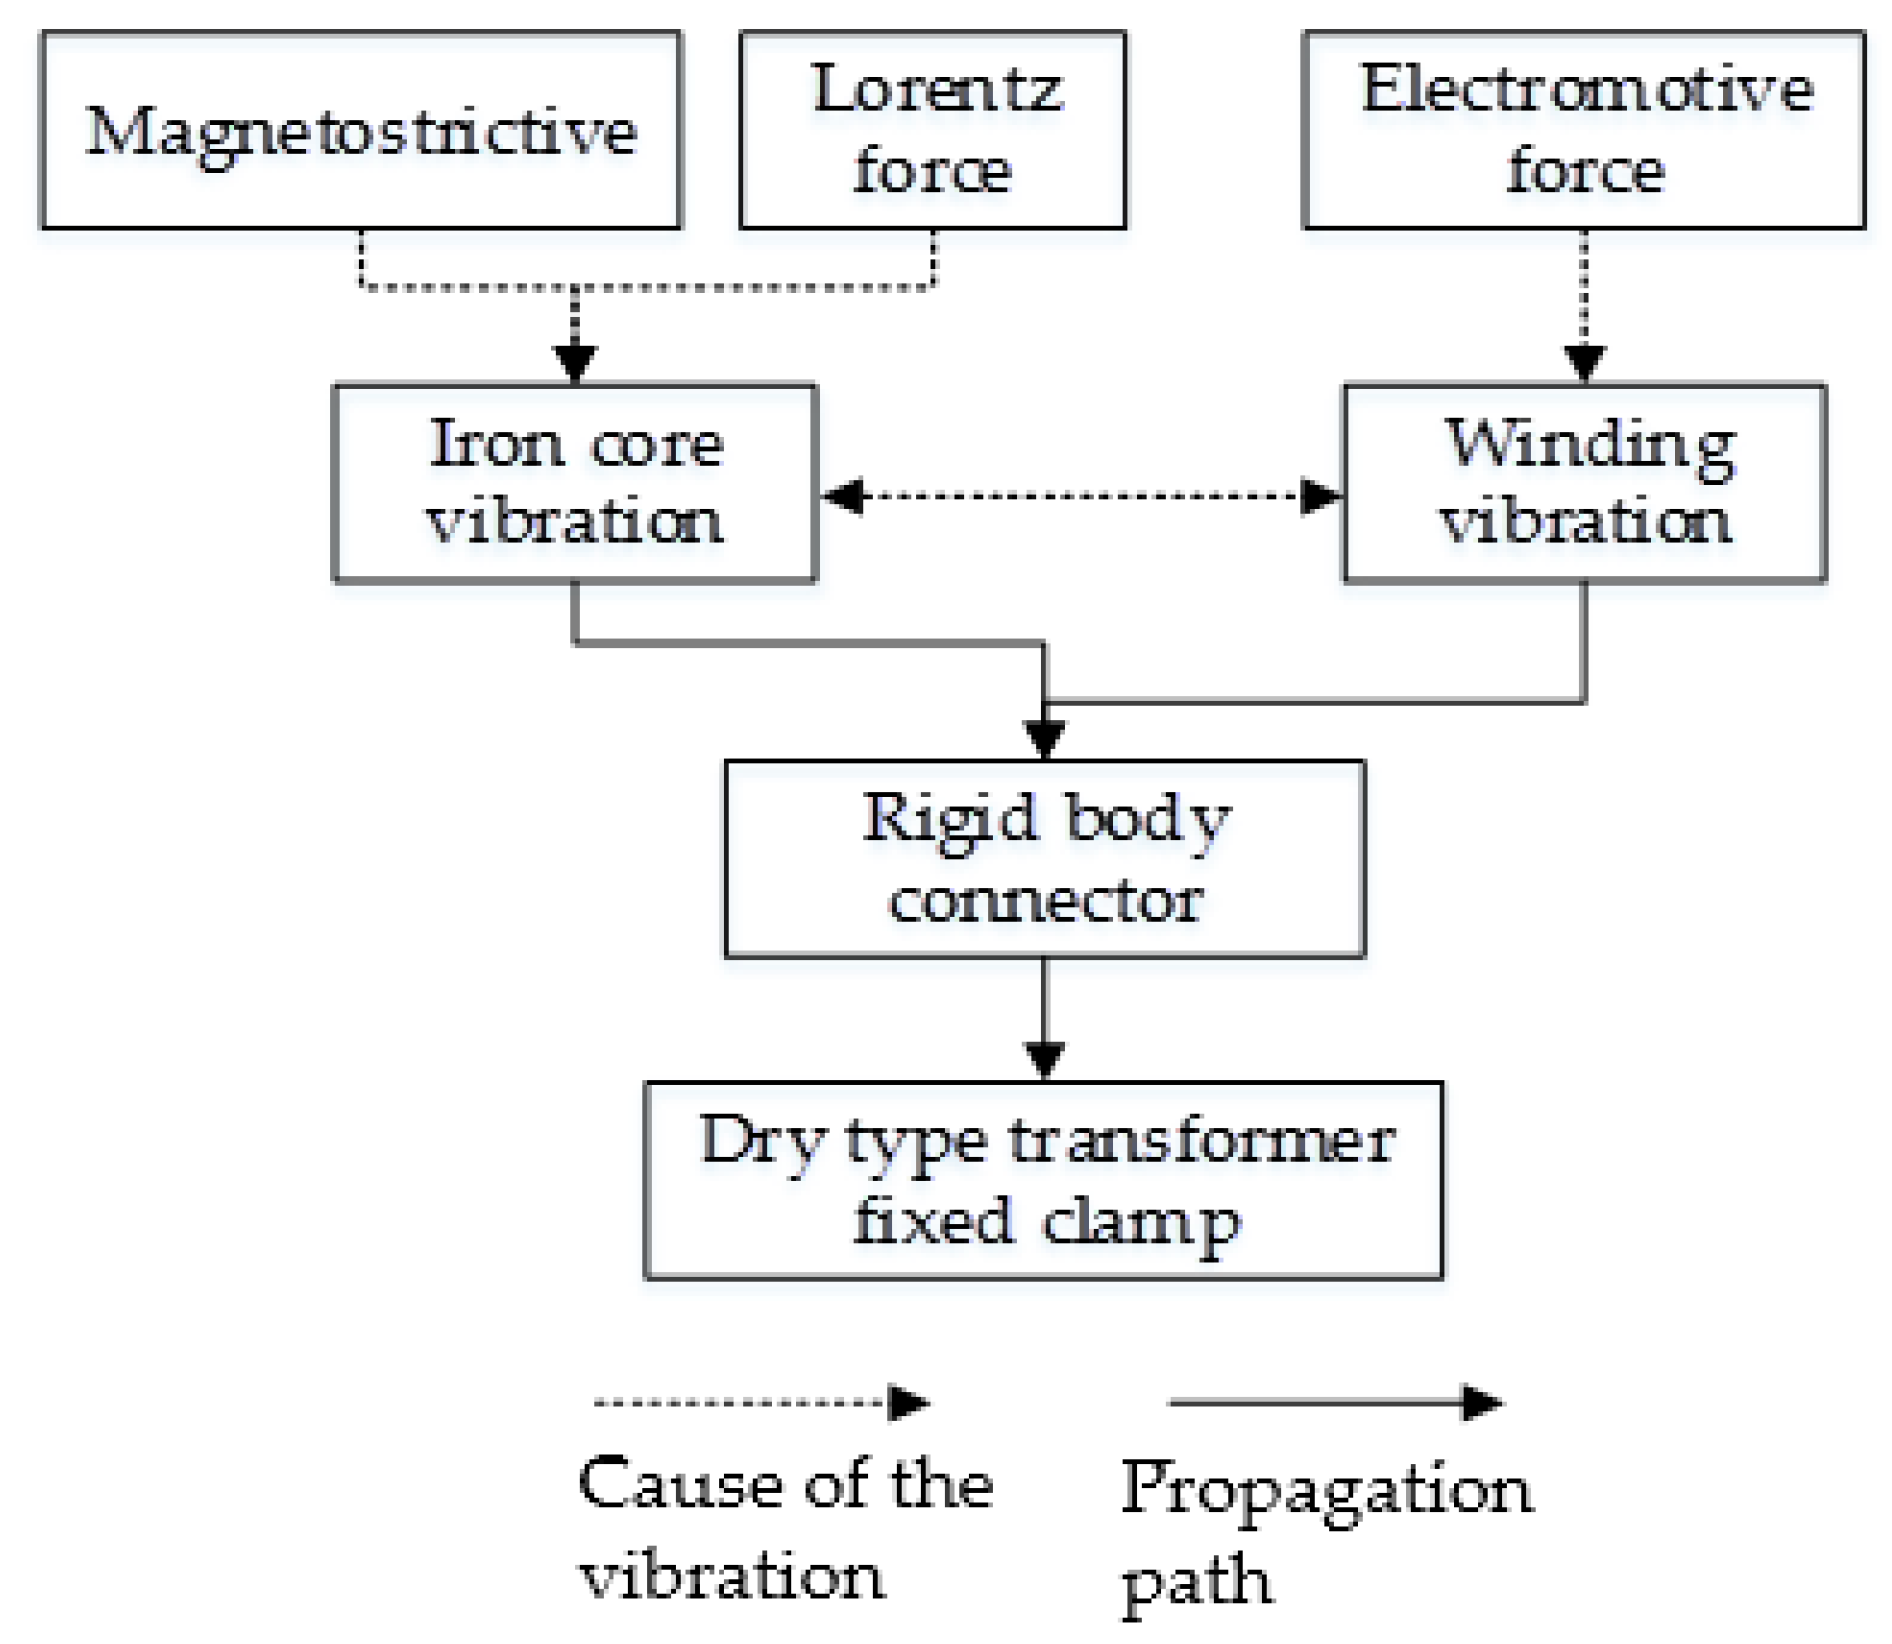
Figure 2.
(a) Position of vibration-acceleration sensor; (b) field experiment.

Figure 3.
A set of typical mechanical-vibration signals.

Figure 4.
(a) Integral model of transformer; (b) simplified model of transformer.

Figure 5.
(a) Mesh-generation results of geometric model; (b) quality diagram of grid division.

Figure 6.
External-circuit equivalent diagram.

Figure 7.
Transformer low-voltage coil three-phase induction current.
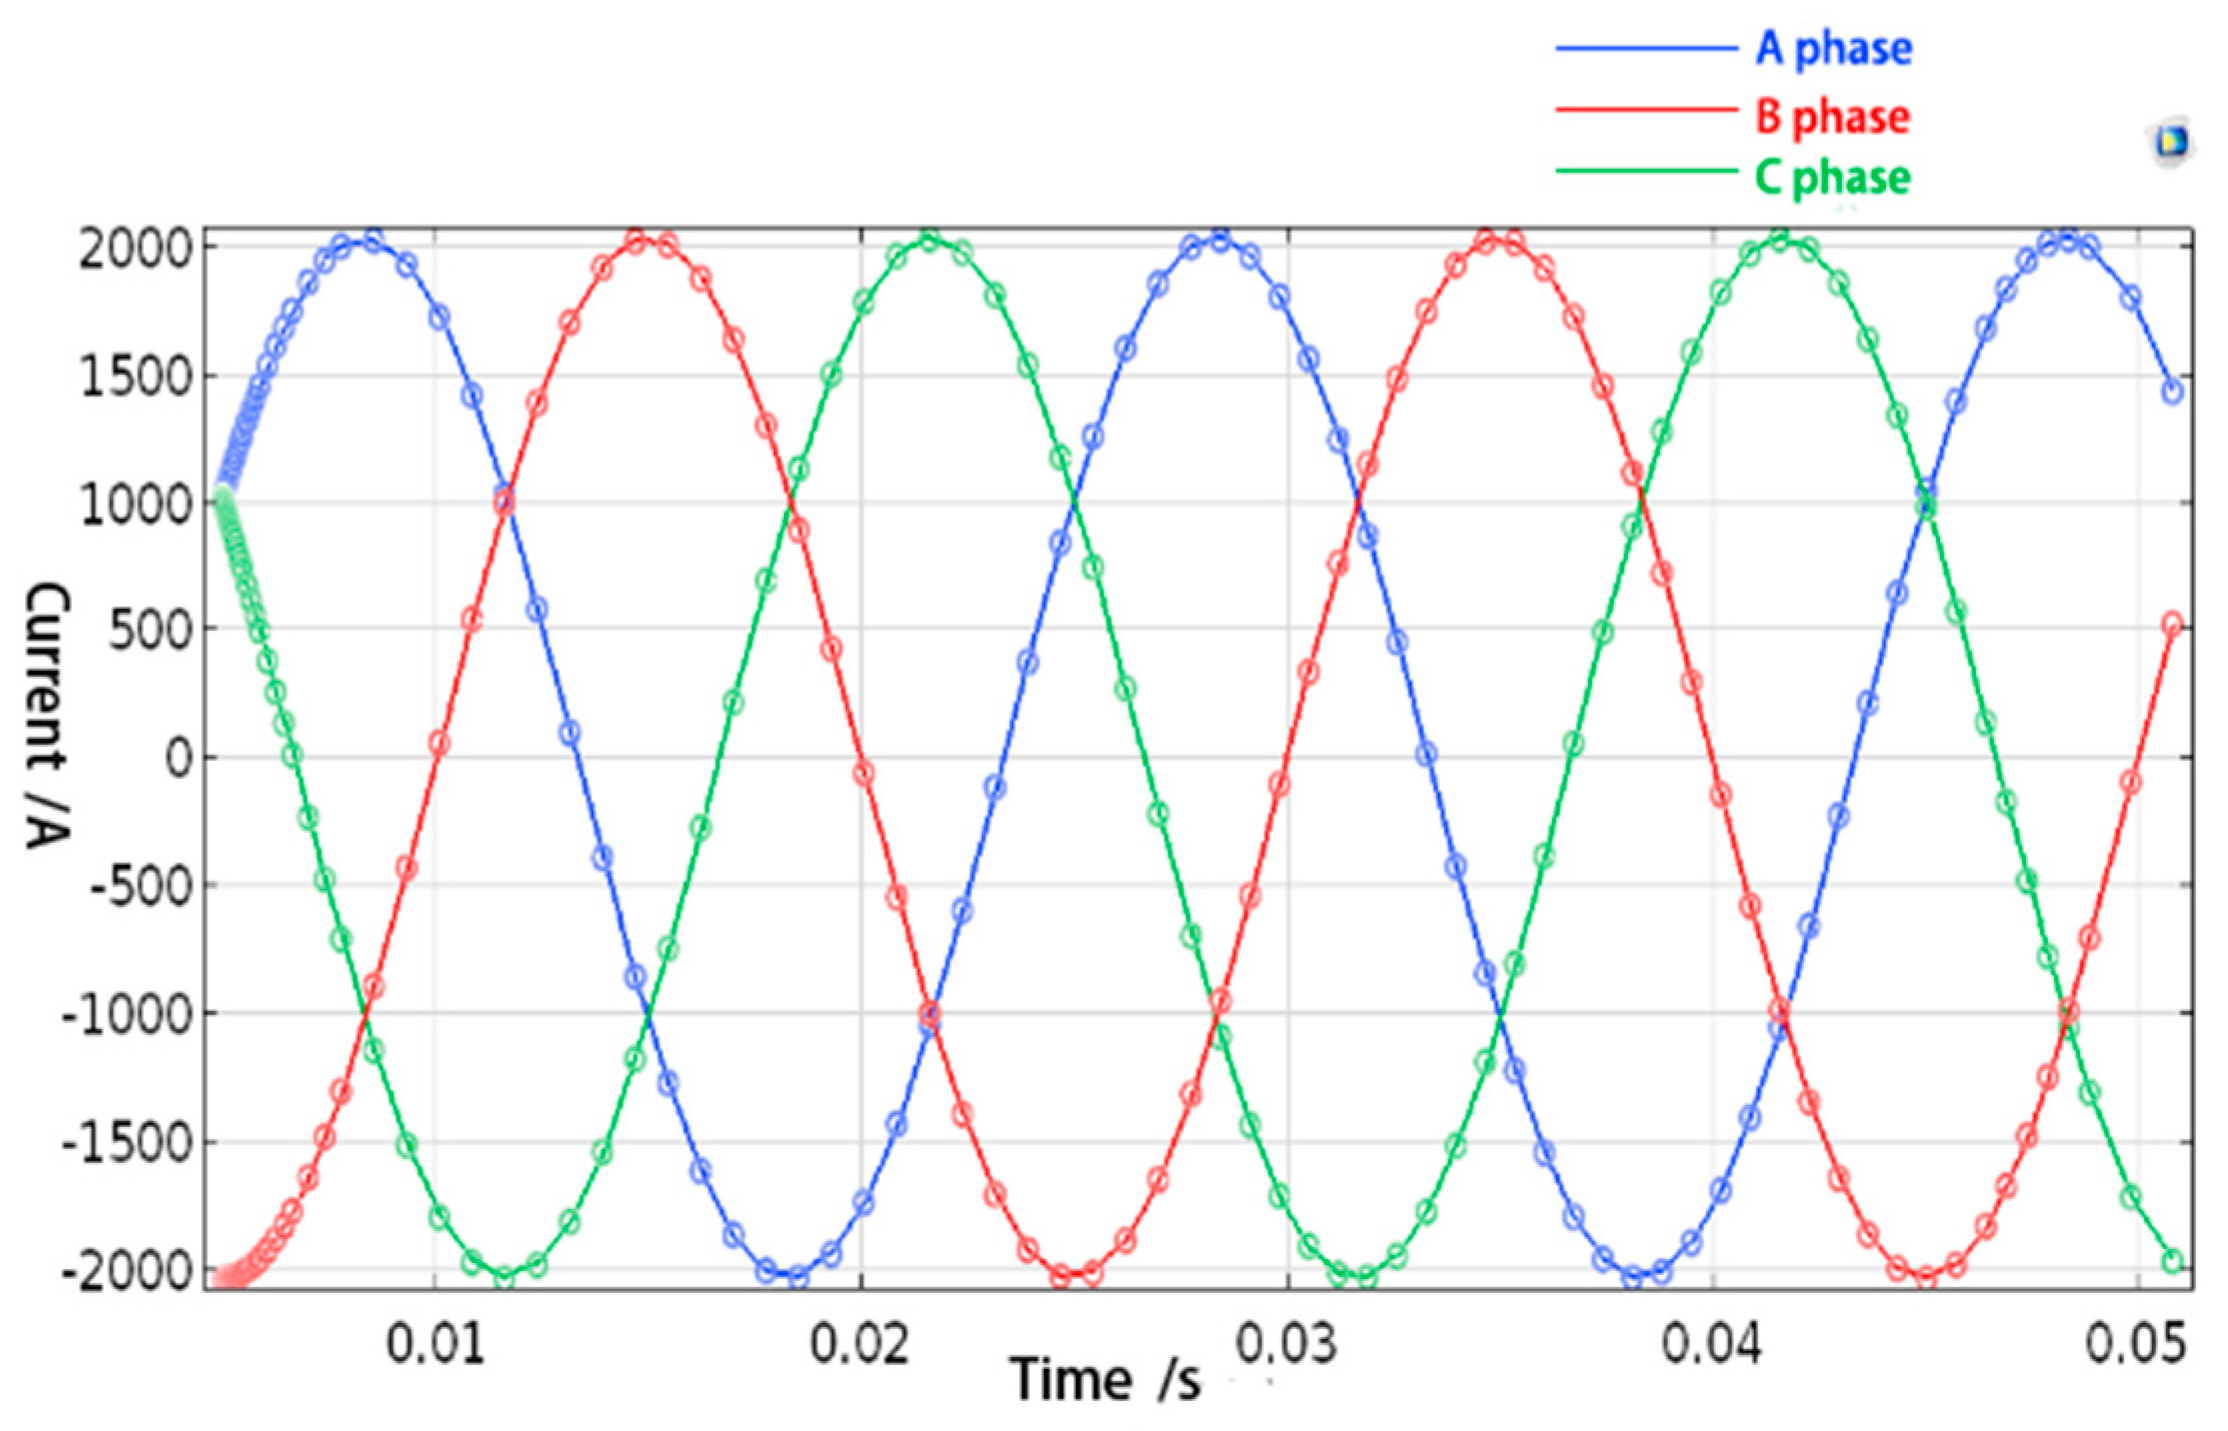
Figure 8.
H–B curve.

Figure 9.
(a) Flux-density distribution of the transformer winding; (b) Flux-density distribution of the transformer iron core.
Figure 9.
(a) Flux-density distribution of the transformer winding; (b) Flux-density distribution of the transformer iron core.
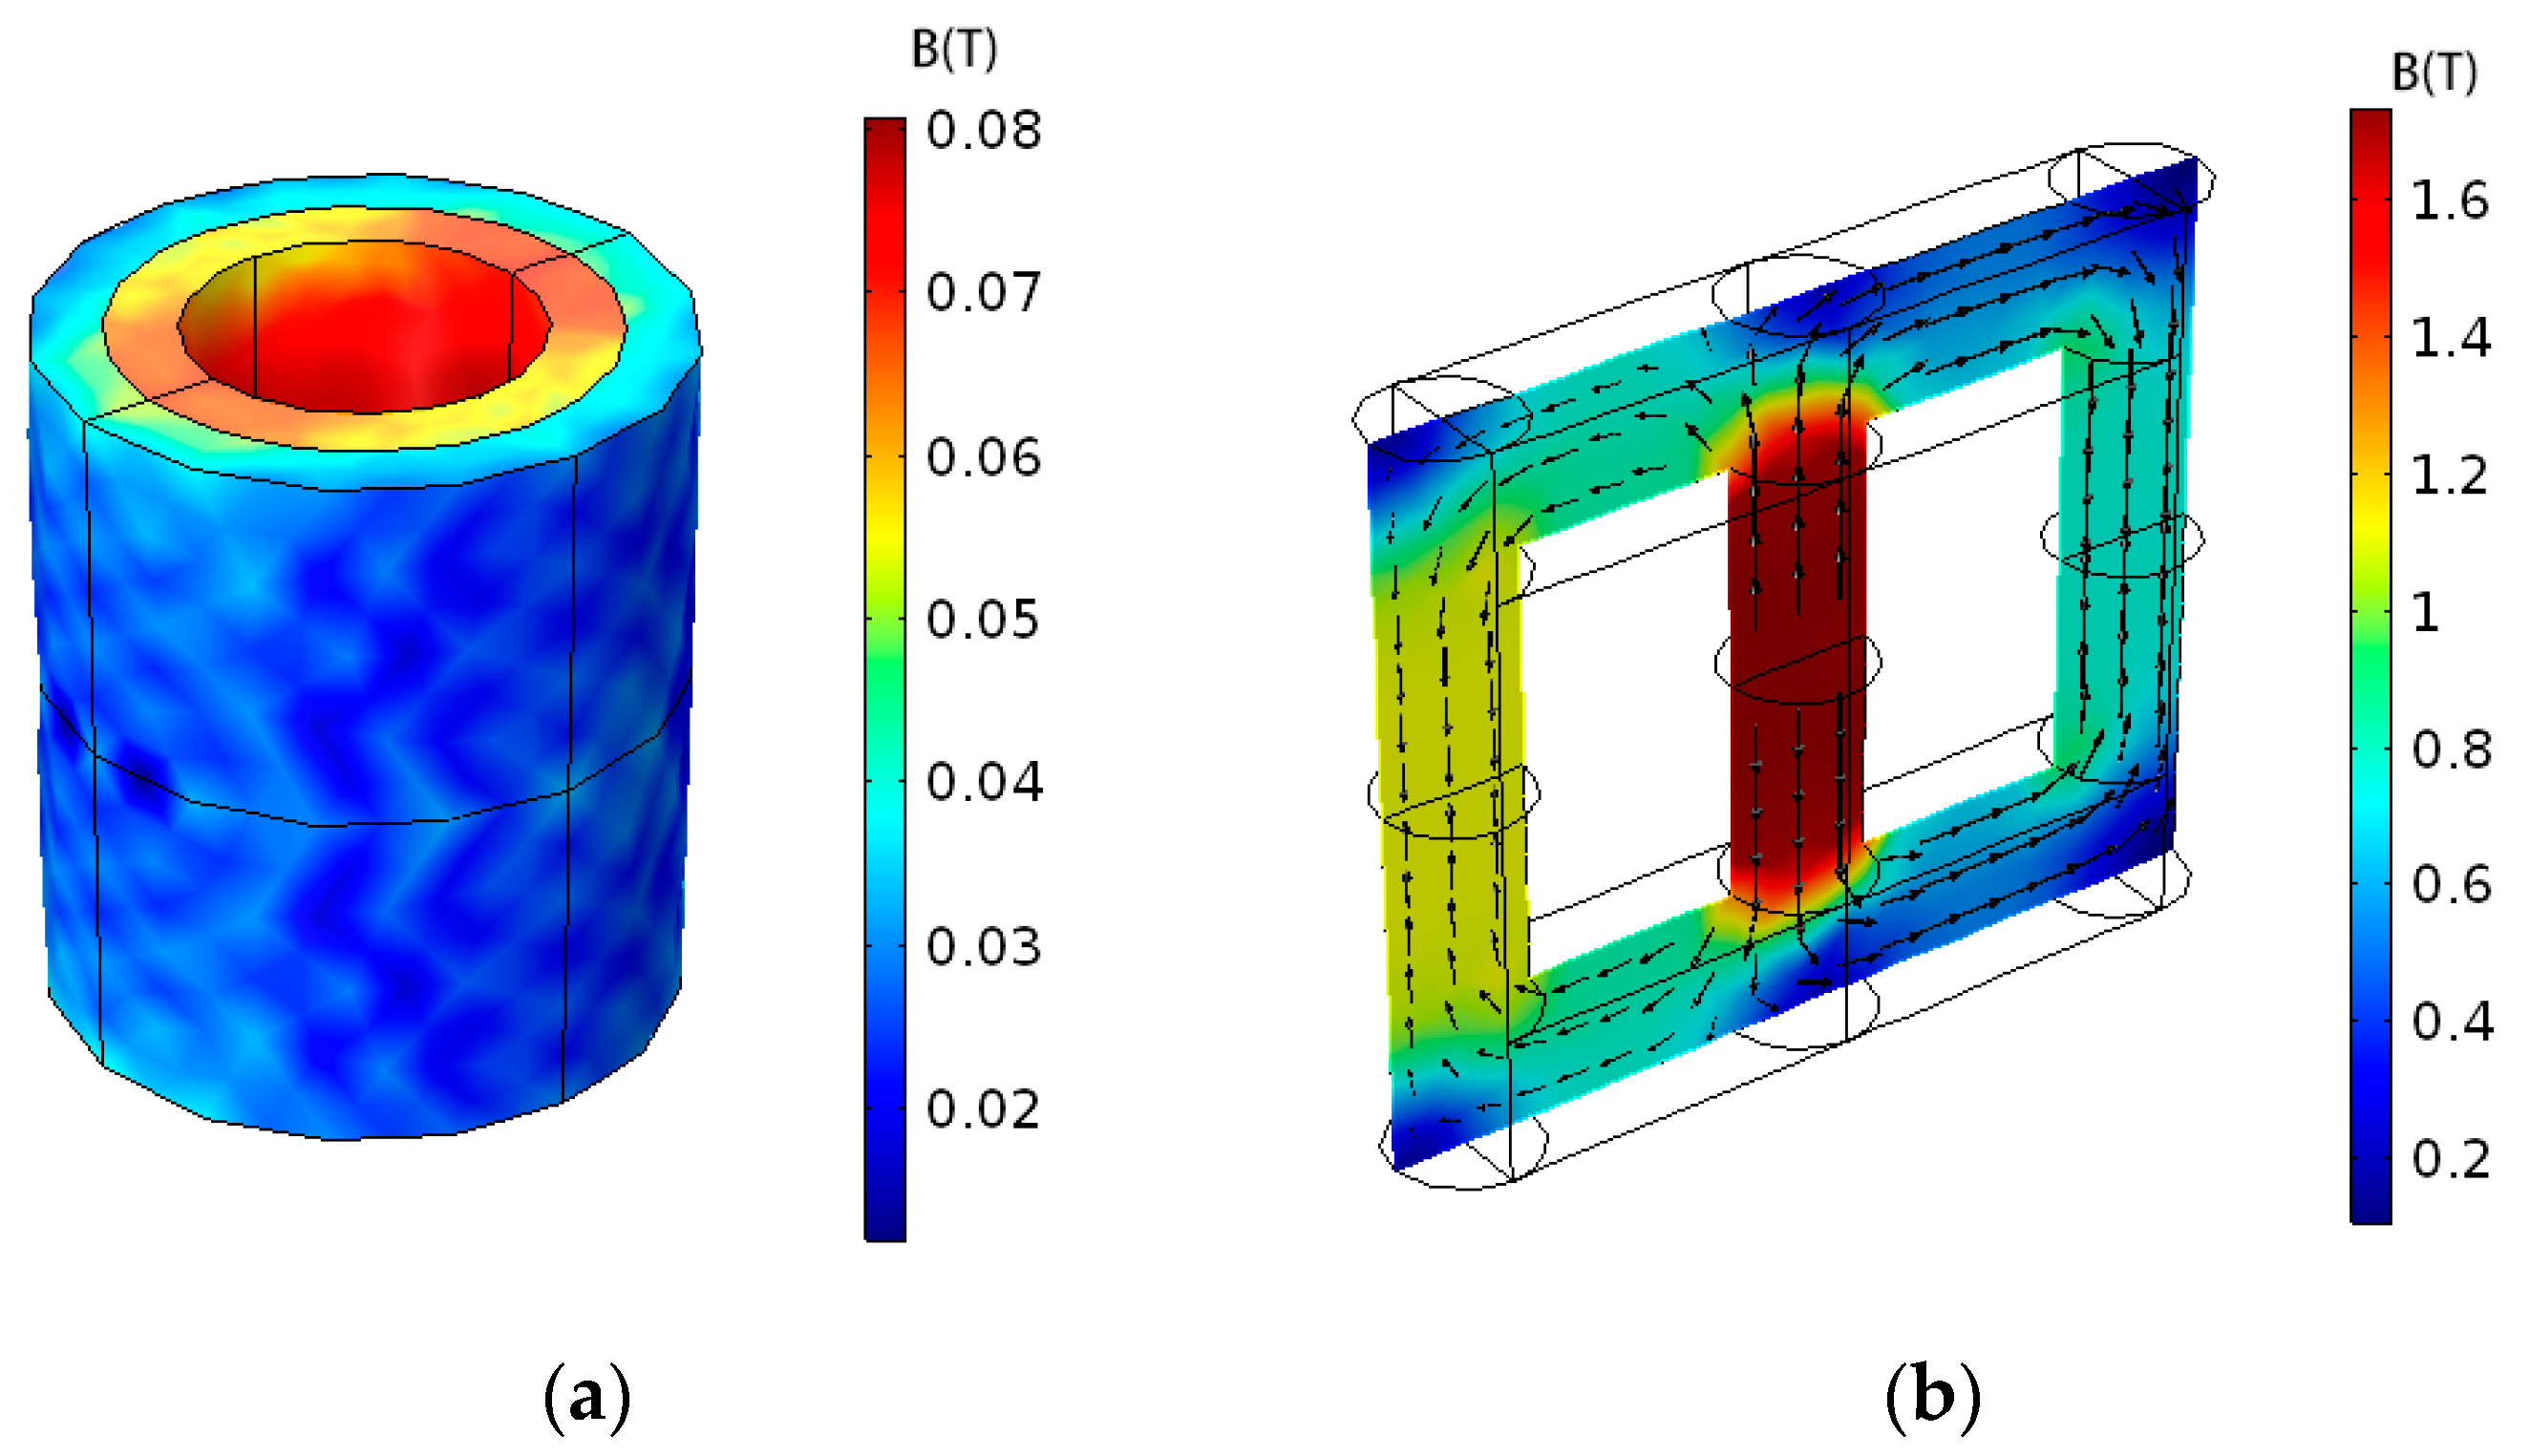
Figure 10.
(a) Radial-stress distribution diagram of transformer windings; (b) axial-stress distribution diagram of transformer winding.
Figure 10.
(a) Radial-stress distribution diagram of transformer windings; (b) axial-stress distribution diagram of transformer winding.
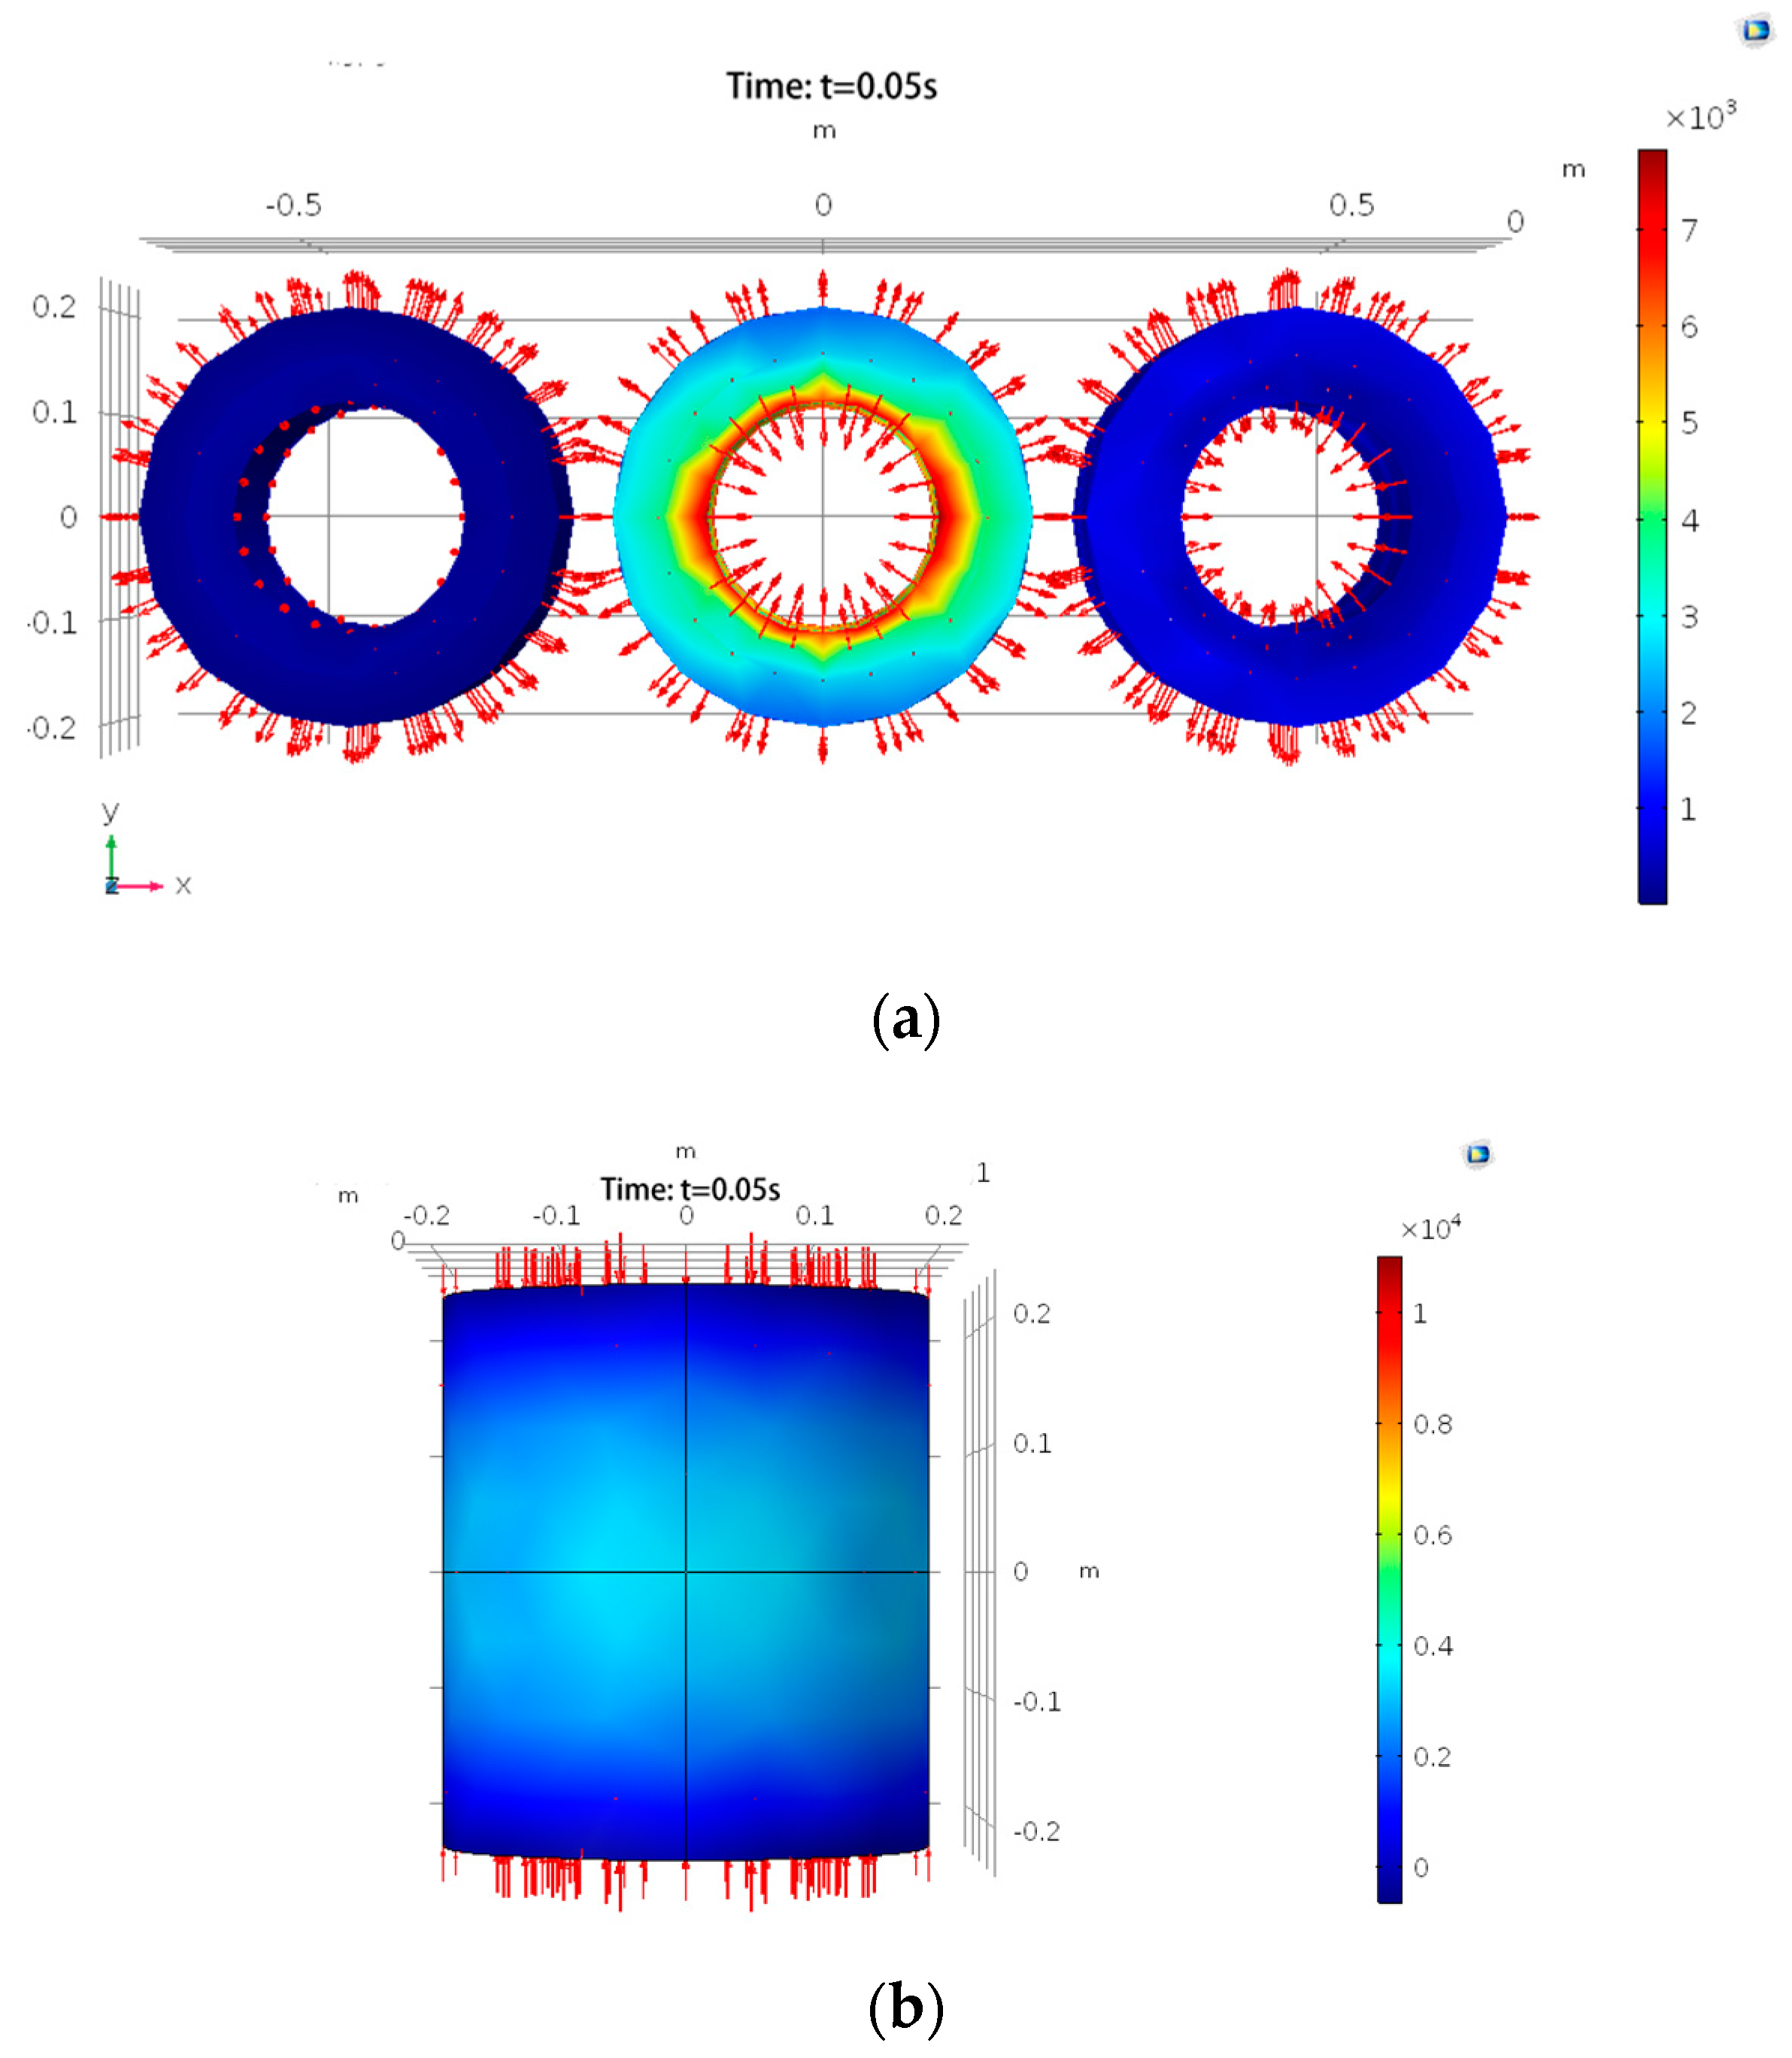
Figure 11.
(a) Experiment locations of measurement points; (b) Simulation locations of measurement points.
Figure 11.
(a) Experiment locations of measurement points; (b) Simulation locations of measurement points.
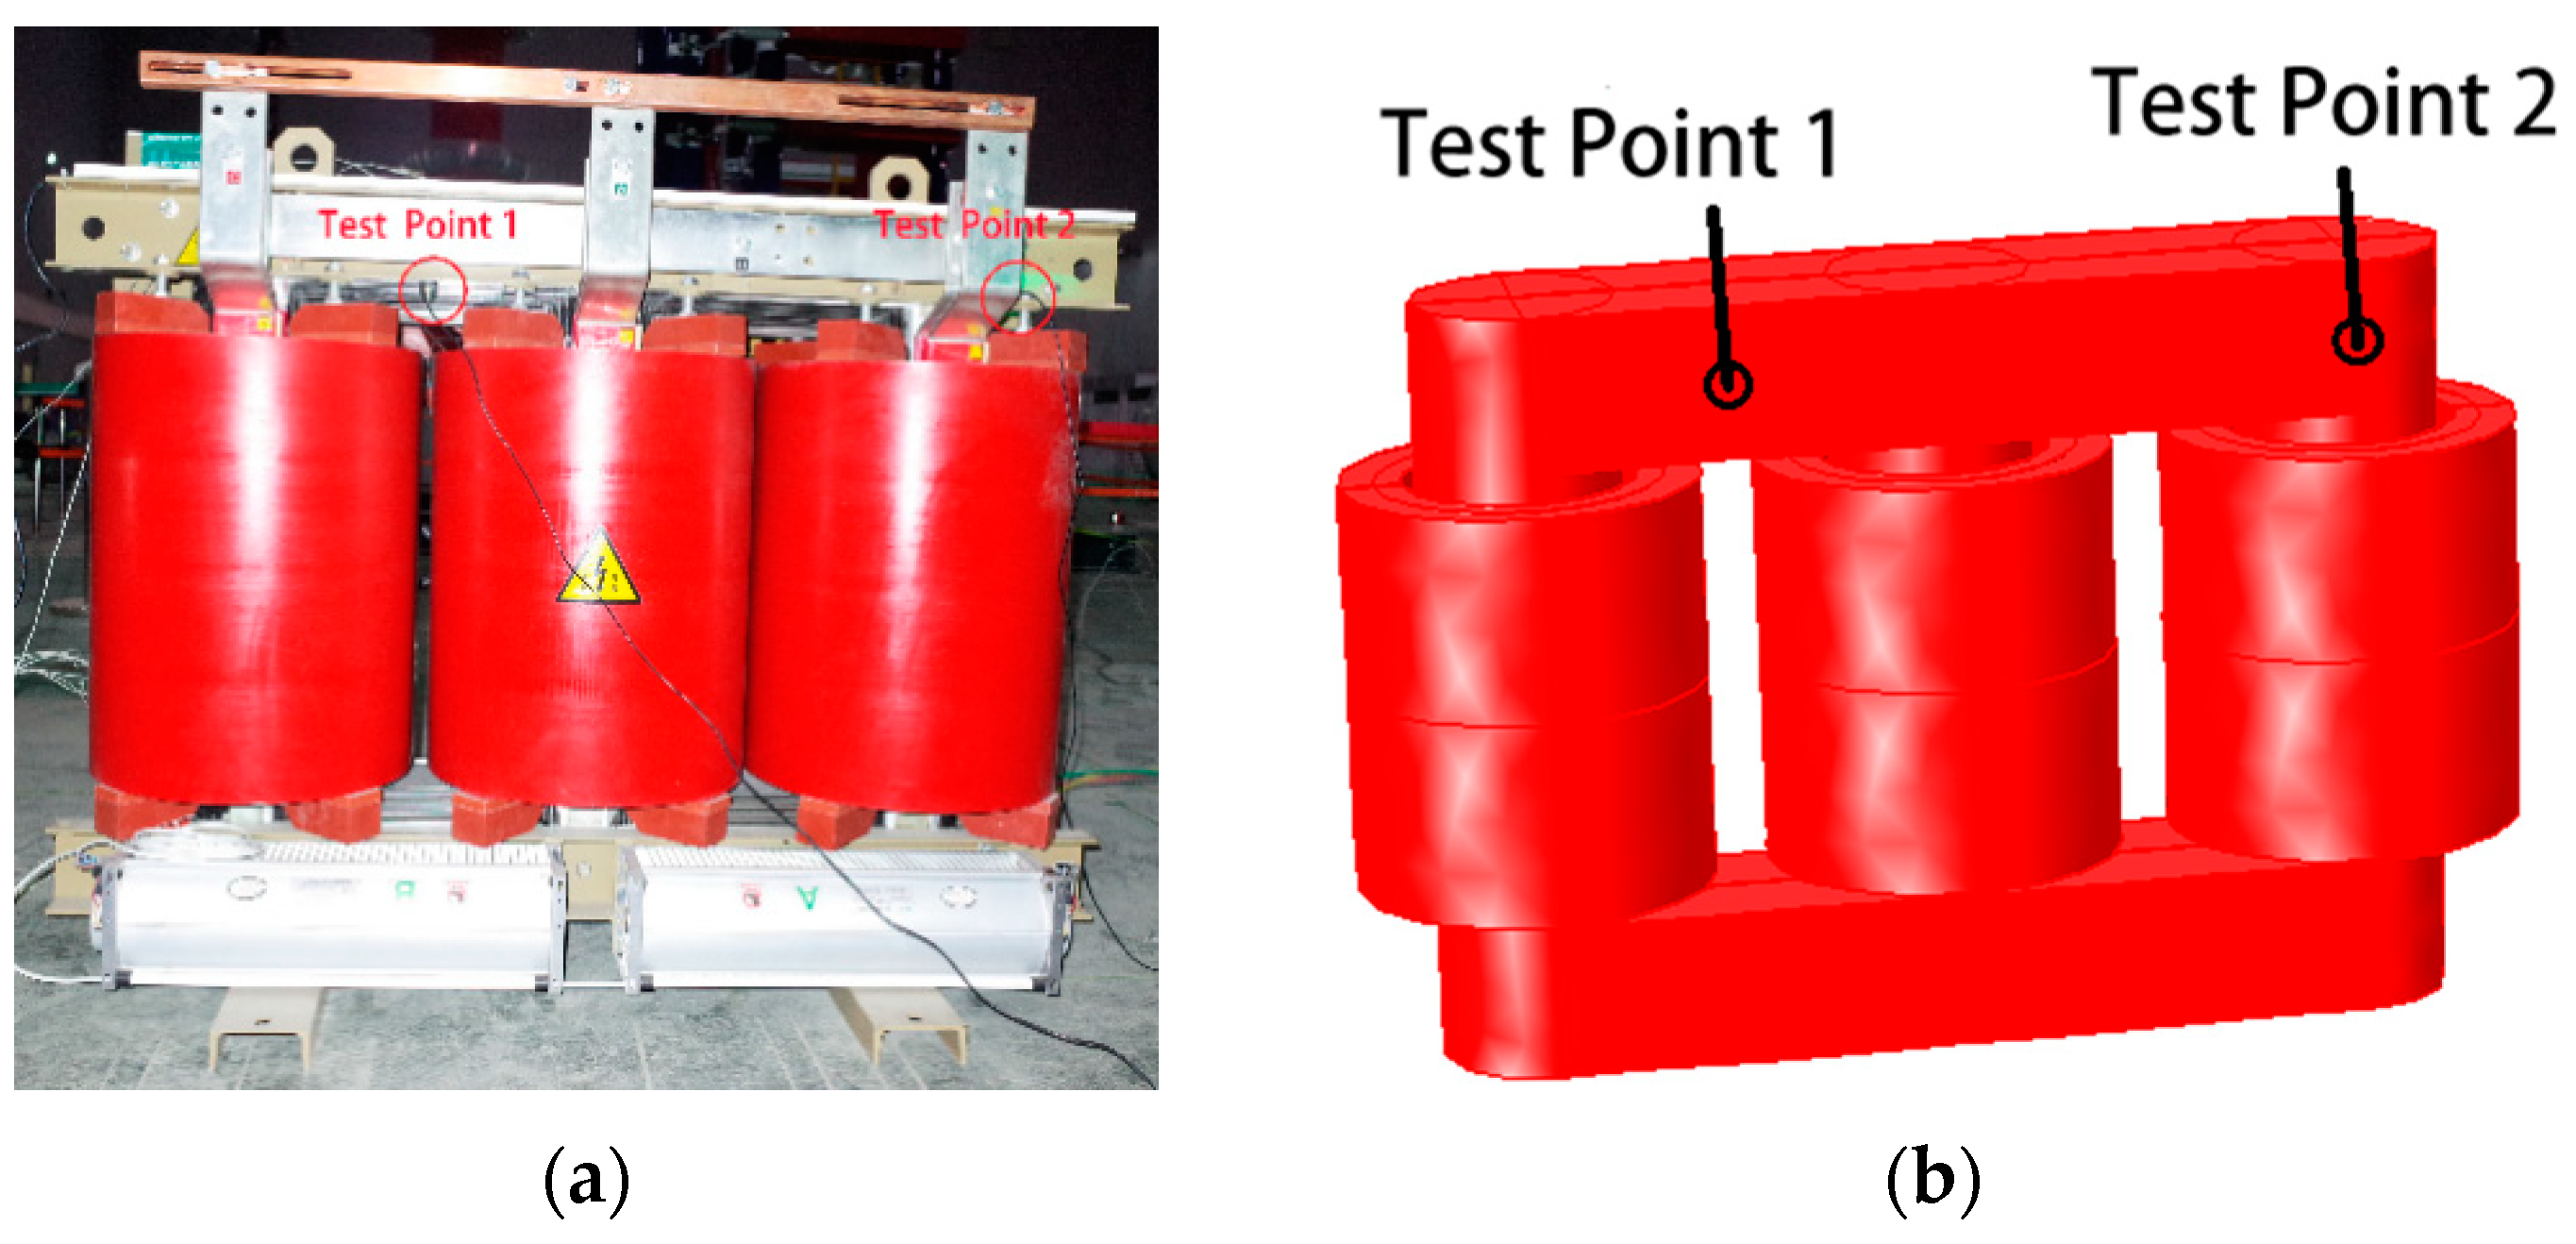
Figure 12.
Comparison of vibration signals at each test point.
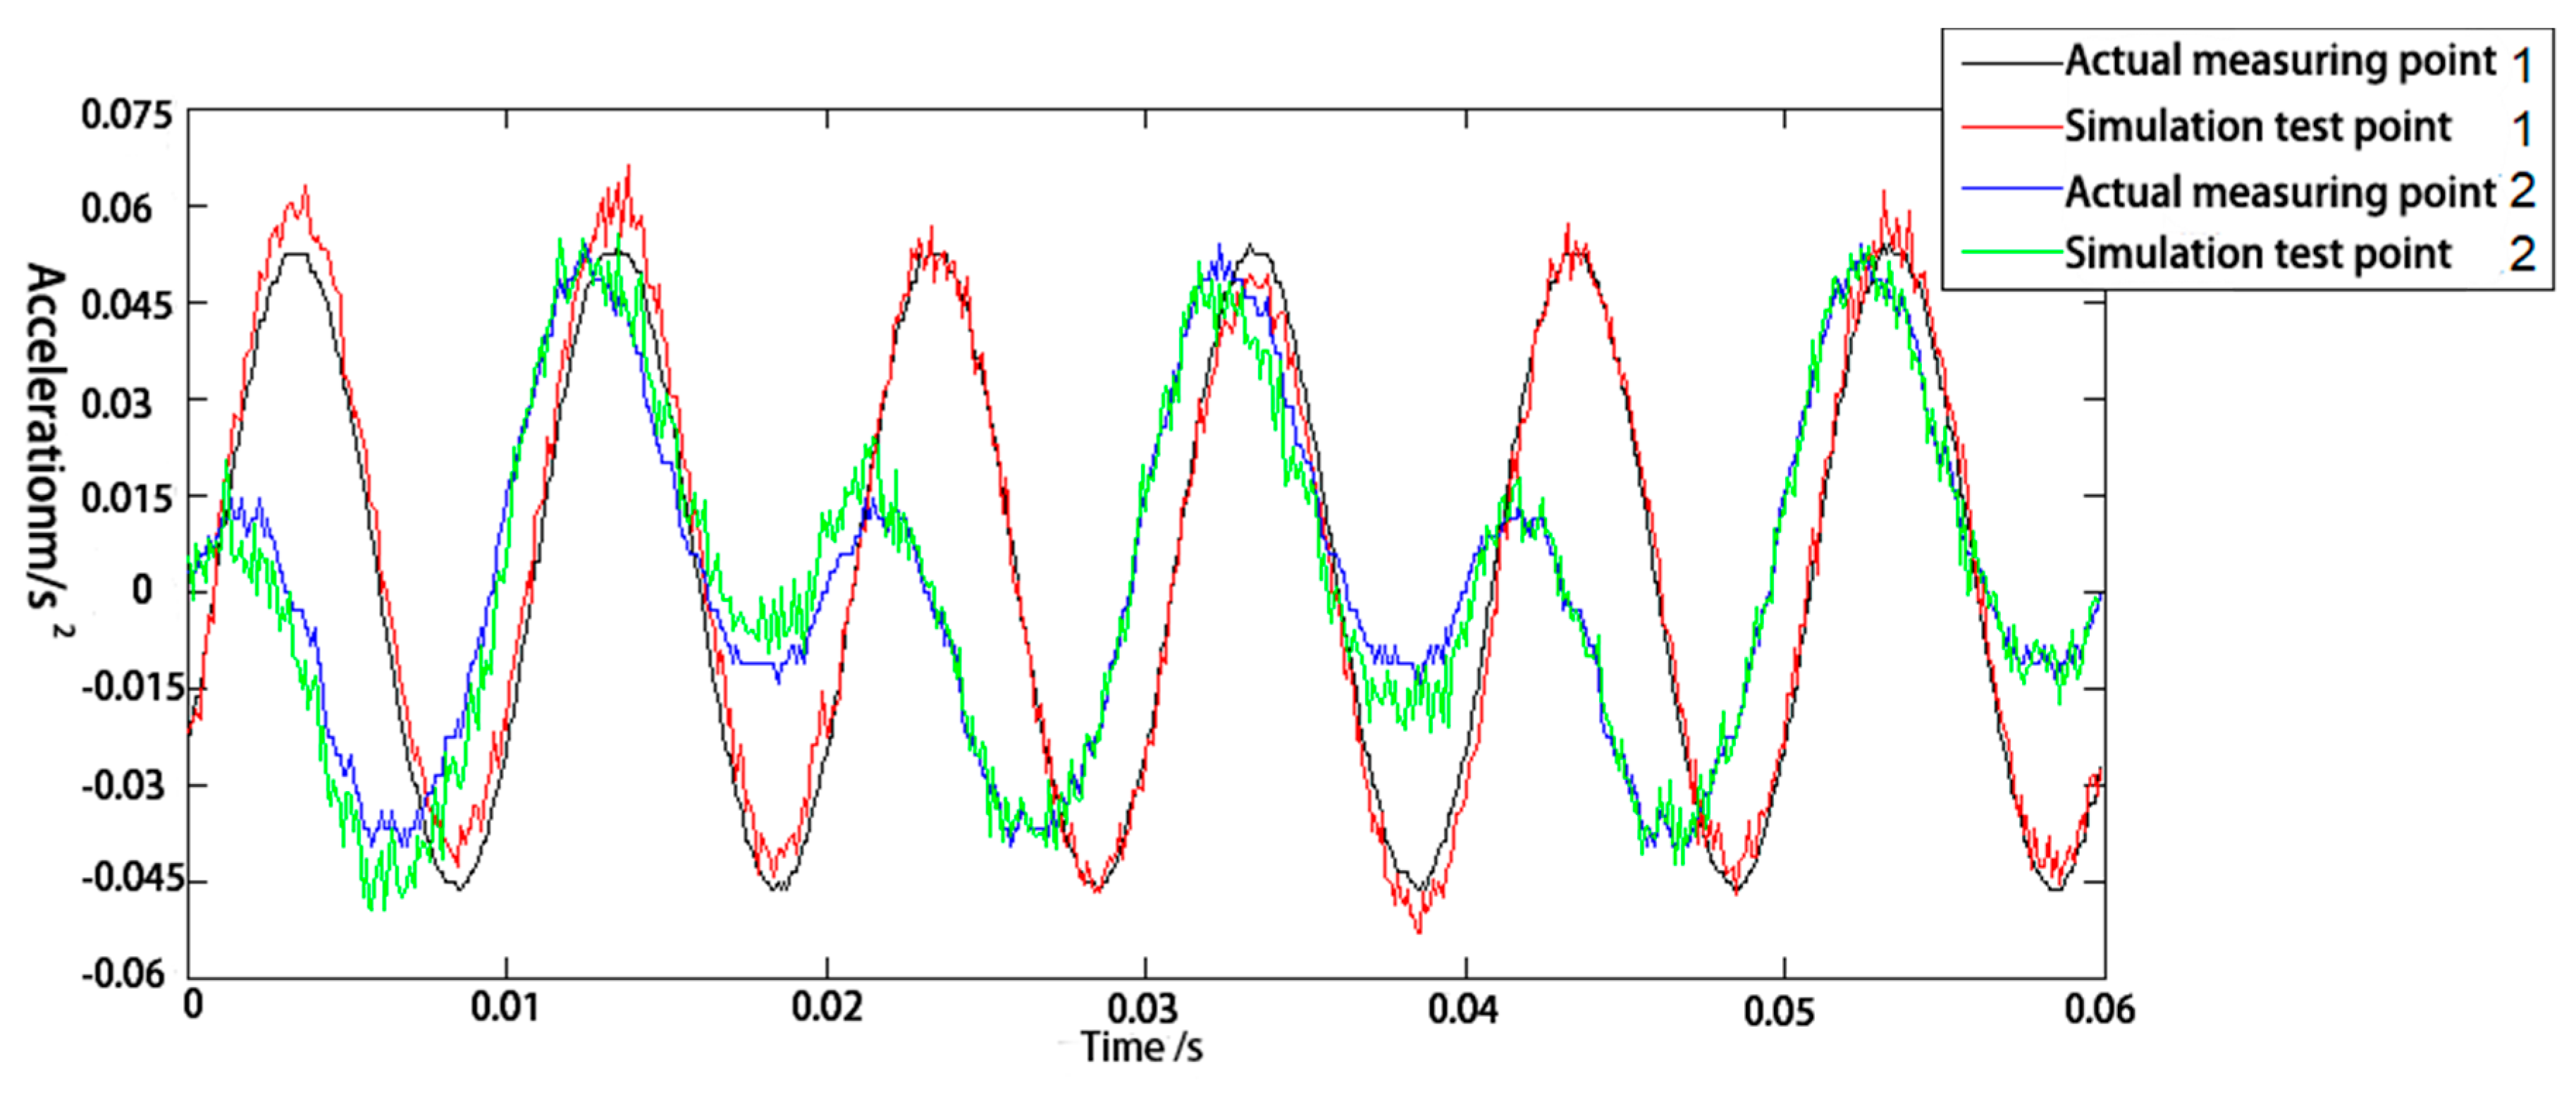
Figure 13.
(a) Simulation model of winding loosening; (b) simulation model of winding-insulation failure; (c) simulation model of winding deformation.
Figure 13.
(a) Simulation model of winding loosening; (b) simulation model of winding-insulation failure; (c) simulation model of winding deformation.
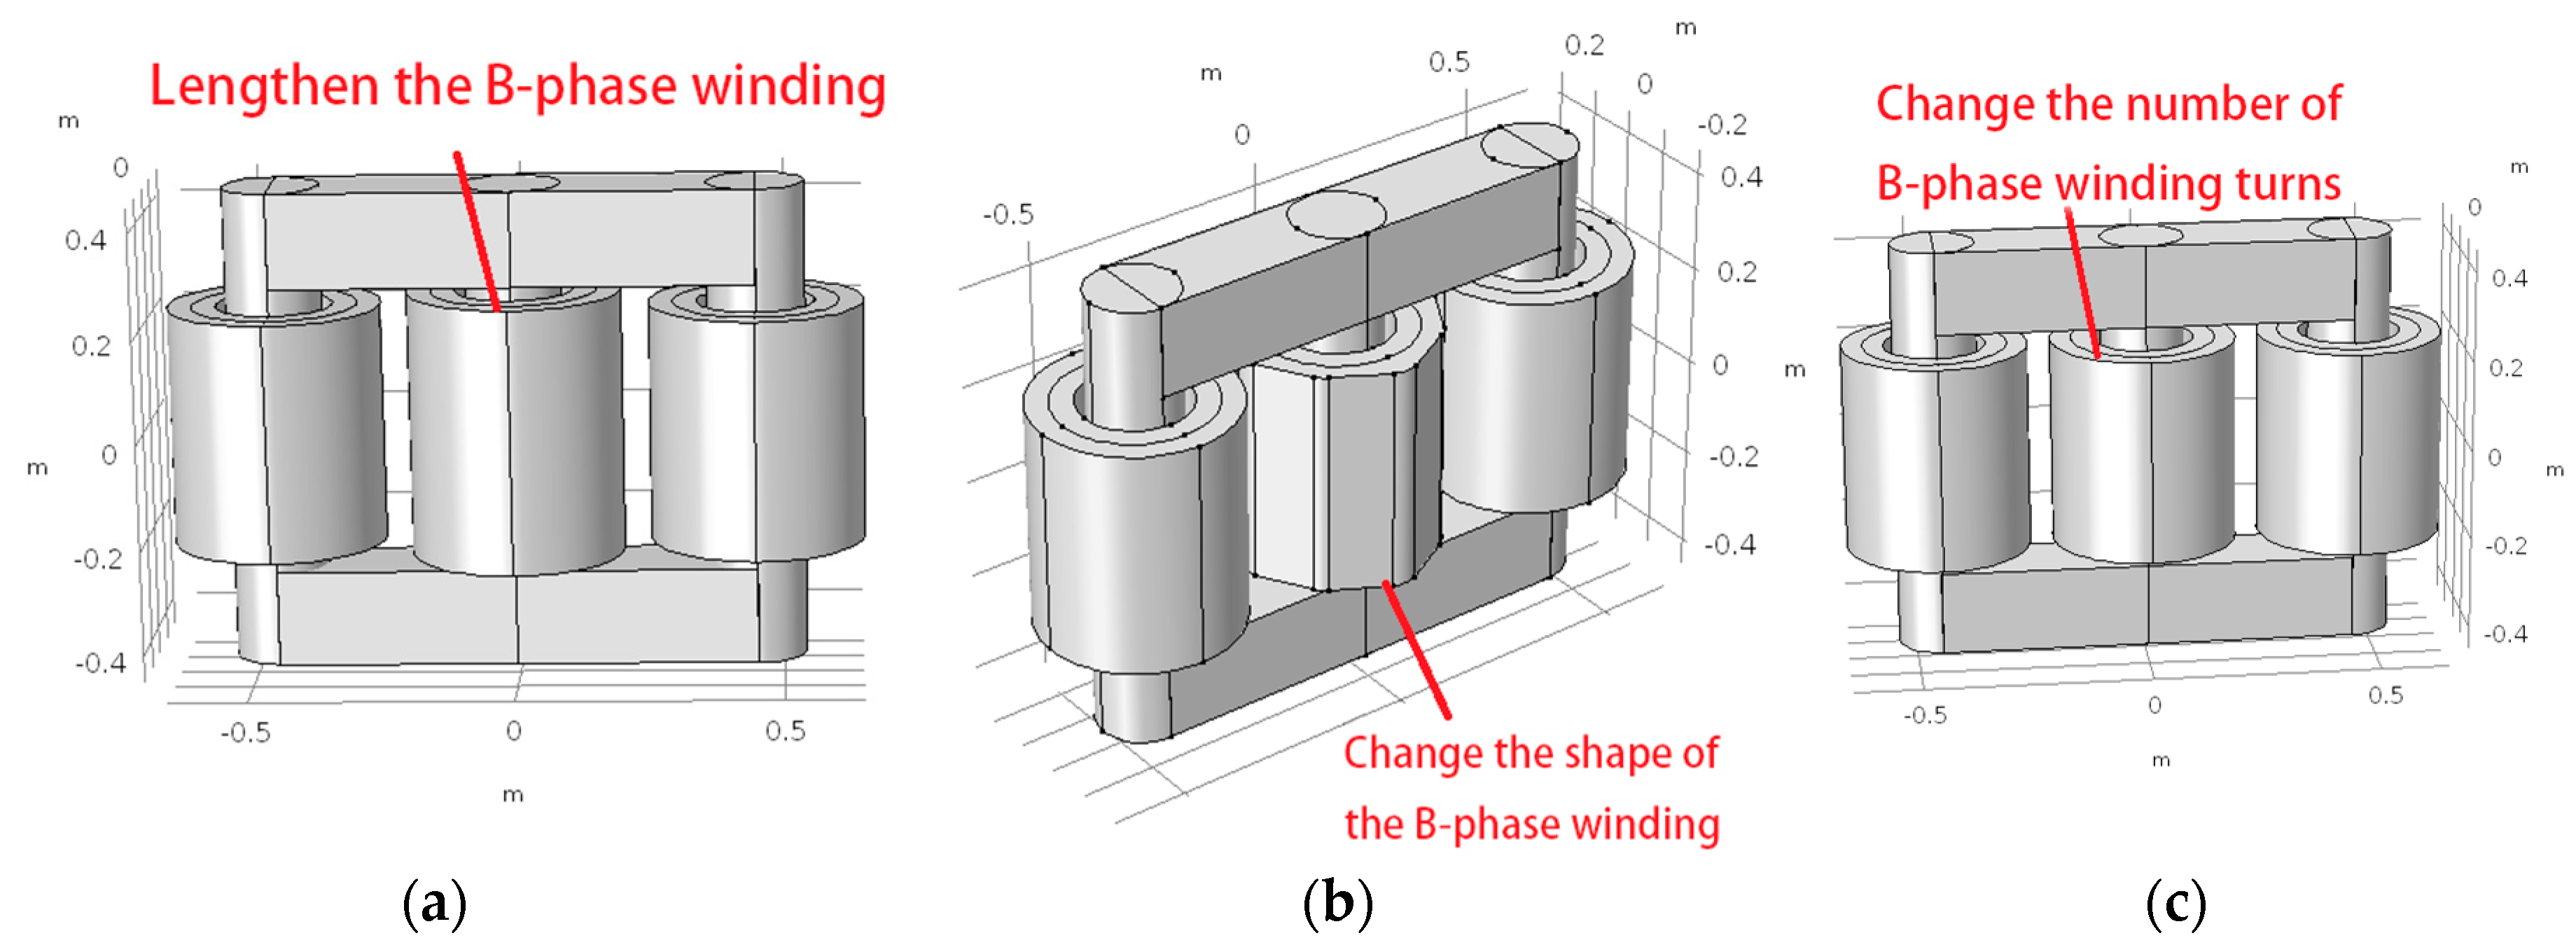
Figure 14.
Axial diagram of the total displacement of windings under various working conditions. (a) Normai working; (b) Insulation Shedding; (c) Winding loosing and (d) Winding deformation.
Figure 14.
Axial diagram of the total displacement of windings under various working conditions. (a) Normai working; (b) Insulation Shedding; (c) Winding loosing and (d) Winding deformation.

Figure 15.
Amplitude direction diagram of winding force displacement under various conditions. (a) Normal working; (b) Insulation Shedding; (c) Winding loosening and (d) Winding deformation.
Figure 15.
Amplitude direction diagram of winding force displacement under various conditions. (a) Normal working; (b) Insulation Shedding; (c) Winding loosening and (d) Winding deformation.
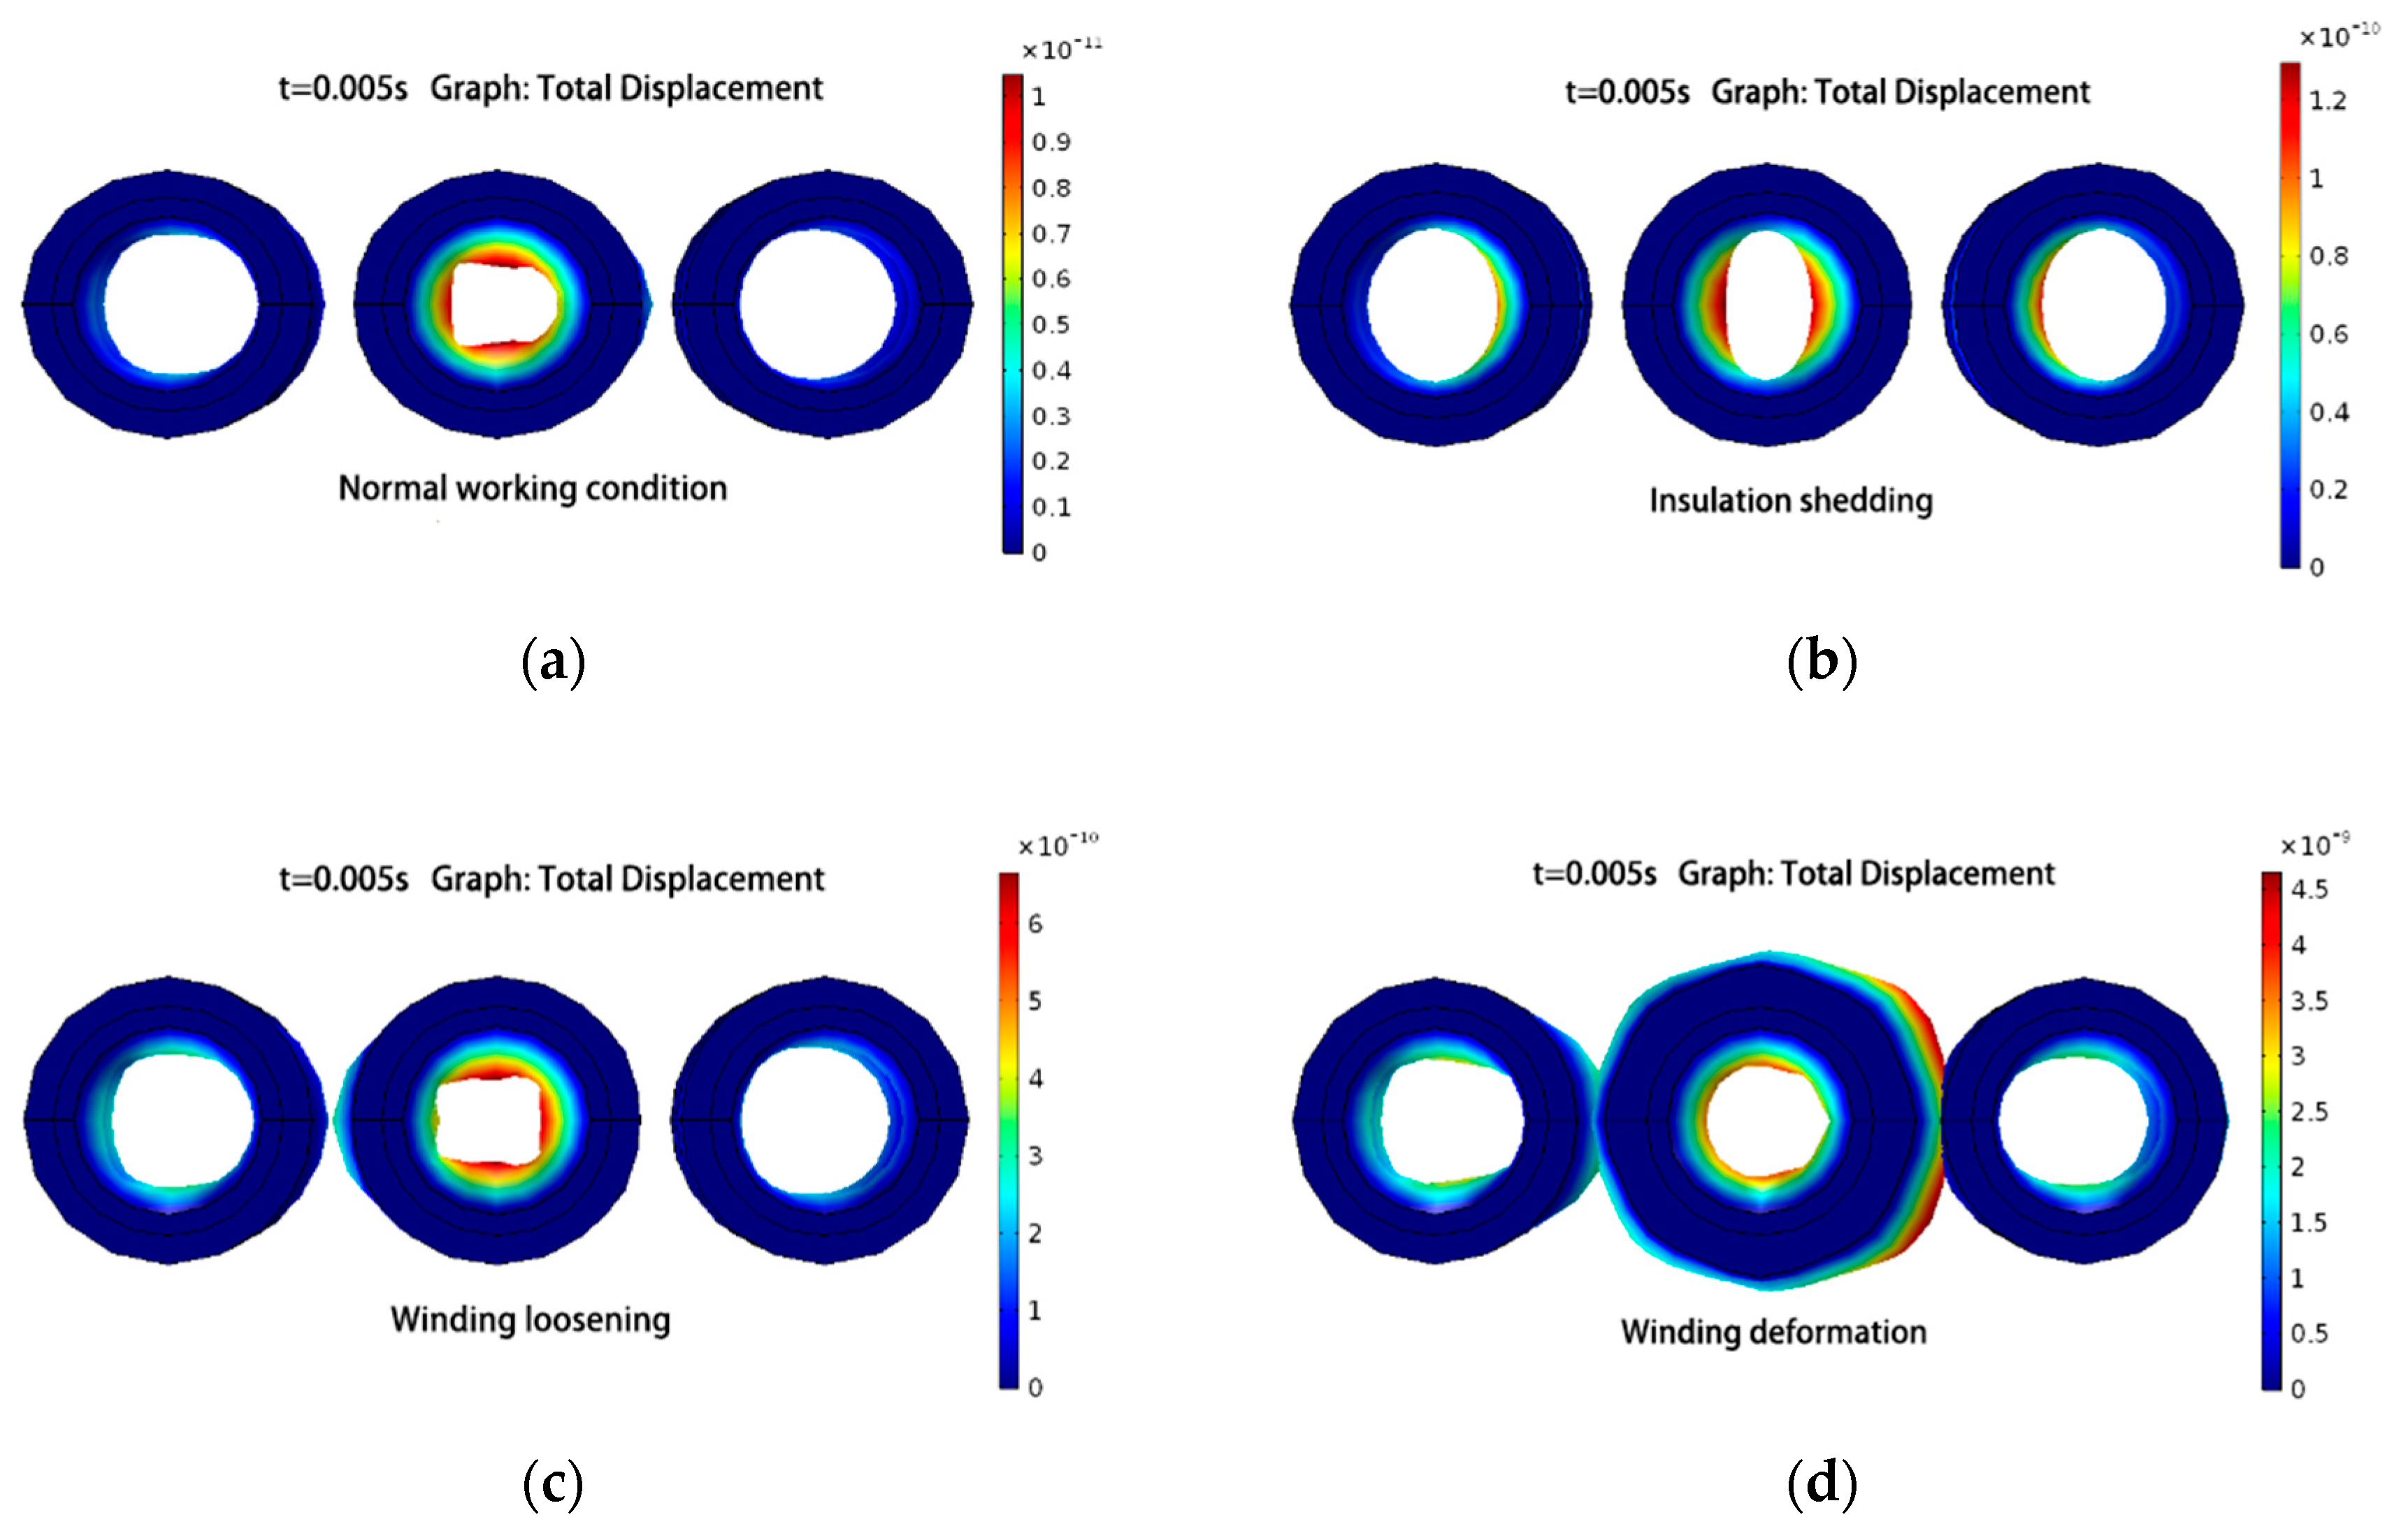
Figure 16.
Time-domain diagram of vibration-acceleration signals at measurement point 1 under various working conditions: (a) normal working conditions; (b) insulation shedding; (c) winding loosening; (d) winding deformation.
Figure 16.
Time-domain diagram of vibration-acceleration signals at measurement point 1 under various working conditions: (a) normal working conditions; (b) insulation shedding; (c) winding loosening; (d) winding deformation.
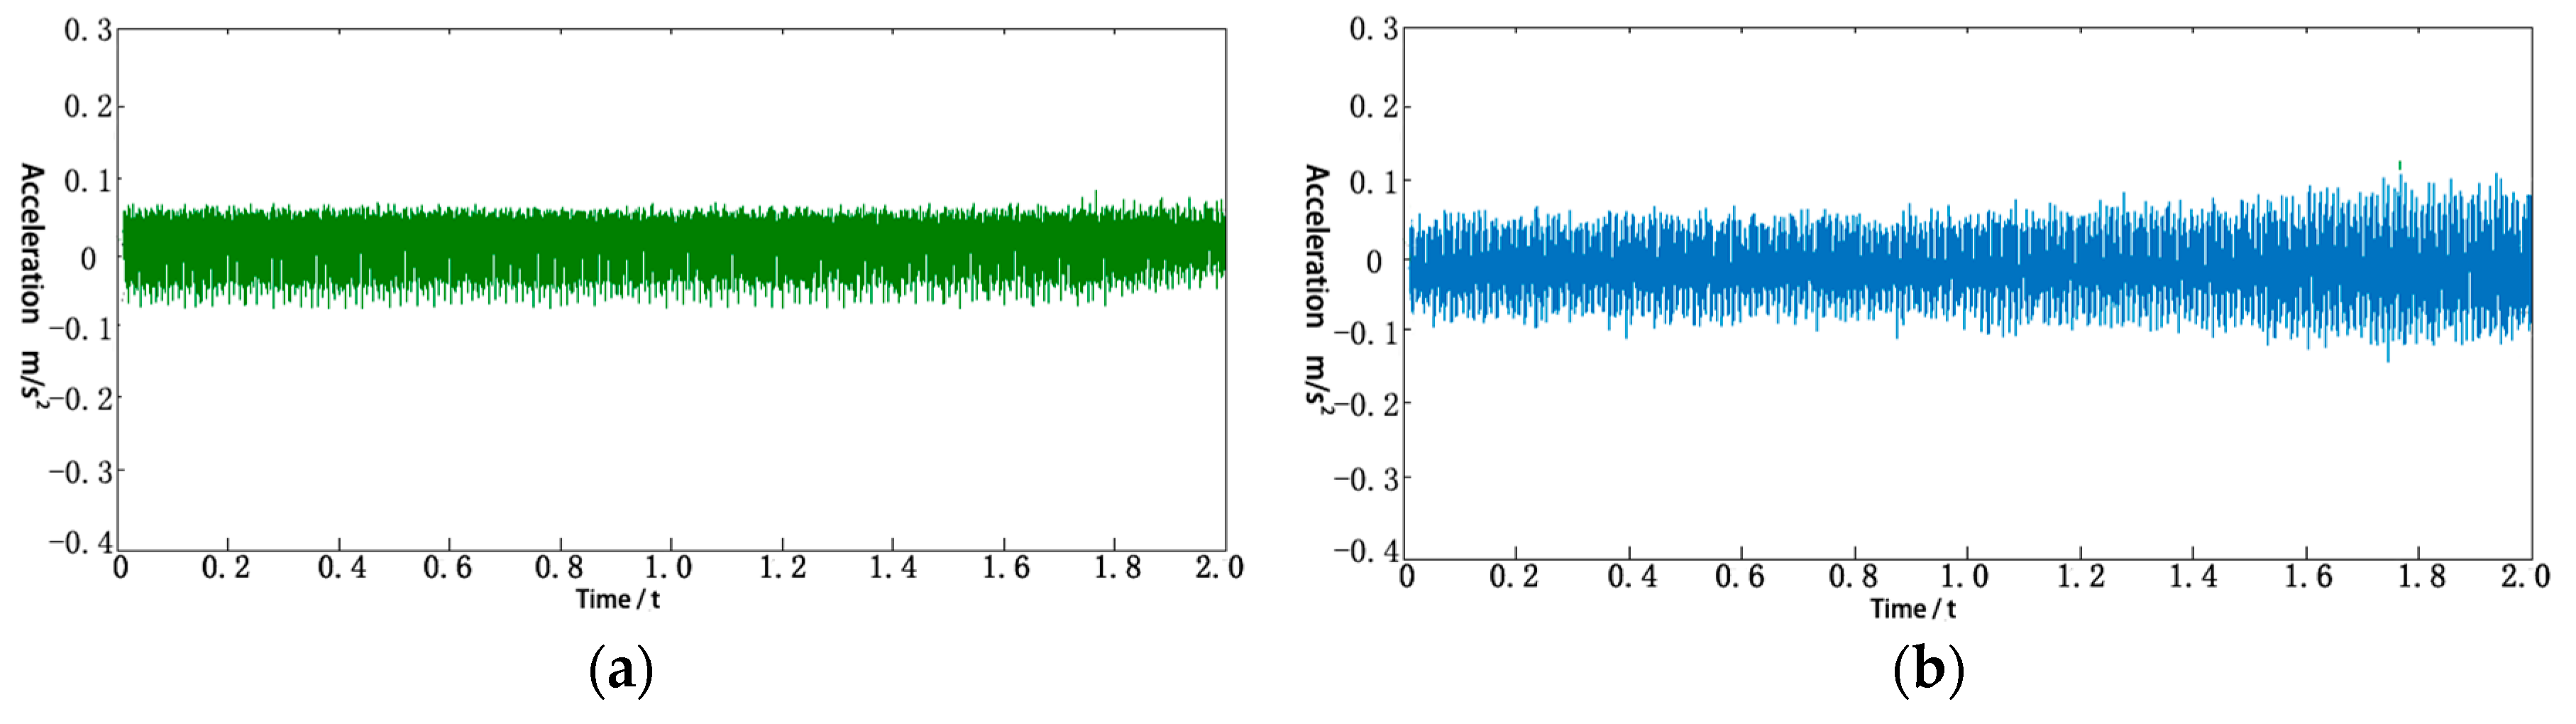

Figure 17.
Spectrum diagram of vibration signal at measurement point 1 under different working conditions: (a) normal condition; (b) insulation shedding; (c) winding loosening; (d) winding deformation.
Figure 17.
Spectrum diagram of vibration signal at measurement point 1 under different working conditions: (a) normal condition; (b) insulation shedding; (c) winding loosening; (d) winding deformation.

Table 1.
Main technical parameters of the SCB10-1000/10 dry-type transformer.
| Main Technical Indicators | Parameter |
|---|---|
| Phase number | Three-phase |
| Rated frequency | 50 Hz |
| Rated capacity | 1000 kVA |
| Rated voltage | 10,000/400 V |
| Rated current | 57.74/1443.38 |
| Connection mode | Dyn11 |
| Cooling mode | AN |
| Short-circuit impedance (%) | 5.91 |
Table 2.
Main parameters of the SCB10-1000/10 dry-type transformer coil structure.
| Coil | Parameter Type | Size (mm) | Coil | Parameter Type | Size (mm) |
|---|---|---|---|---|---|
| High pressure | Internal diameter | 286 | Low pressure | Internal diameter | 252 |
| External diameter | 369 | External diameter | 280 | ||
| Height | 405 | Height | 446 | ||
| Turn number | 1125 | Turn number | 45 | ||
| Type | Layer type | Type | Layer type |
Table 3.
Main parameters of the transformer core structure.
| Parameter Type | Parameter | Parameter Type | Size (mm) |
|---|---|---|---|
| Structure | Three-phase three-column | General length | 990 |
| Joint method of side column | Standard oblique connection | Total height | 900 |
| Silicon steel sheet material | 35Q165 | Thickness | 196 |
| Core column radius (mm) | 90 | Upper- and lower-yoke height | 180 |
Table 4.
The main material properties of the solid mechanics model.
| Structure | Modulus of Elasticity (Pa) | Density (g/cm3) | Poisson’s Coefficient |
|---|---|---|---|
| Winding | 1.16 × 10¹¹ | 3.2 | 0.32 |
| Iron core | 2 × 10¹¹ | 7.6 | 0.24 |
© 2018 by the authors. Licensee MDPI, Basel, Switzerland. This article is an open access article distributed under the terms and conditions of the Creative Commons Attribution (CC BY) license (http://creativecommons.org/licenses/by/4.0/).
Share and Cite
MDPI and ACS Style
Duan, X.; Zhao, T.; Liu, J.; Zhang, L.; Zou, L. Analysis of Winding Vibration Characteristics of Power Transformers Based on the Finite-Element Method. Energies 2018, 11, 2404. https://doi.org/10.3390/en11092404
AMA Style
Duan X, Zhao T, Liu J, Zhang L, Zou L. Analysis of Winding Vibration Characteristics of Power Transformers Based on the Finite-Element Method. Energies. 2018; 11(9):2404. https://doi.org/10.3390/en11092404
Chicago/Turabian StyleDuan, Xiaomu, Tong Zhao, Jinxin Liu, Li Zhang, and Liang Zou. 2018. "Analysis of Winding Vibration Characteristics of Power Transformers Based on the Finite-Element Method" Energies 11, no. 9: 2404. https://doi.org/10.3390/en11092404
Note that from the first issue of 2016, this journal uses article numbers instead of page numbers. See further details here.