Dimensional Analysis of Power Prediction of a Real-Scale Wind Turbine Based on Wind-Tunnel Torque Measurement of Small-Scaled Models


1
Department of Mechanical and Industrial Engineering, Faculty of Engineering, Universitas Gadjah Mada, Yogyakarta 55281, Indonesia
2
Department of Mechanical Engineering, Universitas Tidar, Magelang 56116, Indonesia
3
Department of Mechanical, Vocational College, Universitas Gadjah Mada, Yogyakarta 55281, Indonesia
*
Author to whom correspondence should be addressed.
Energies 2018, 11(9), 2374; https://doi.org/10.3390/en11092374
Submission received: 15 August 2018
/
Revised: 31 August 2018
/
Accepted: 5 September 2018
/
Published: 8 September 2018
(This article belongs to the Collection Wind Turbines)
Abstract
:A preliminary study of a horizontal-axis wind turbine (HAWT) design is carried out using a wind tunnel to obtain its aerodynamic characteristics. Utilization of data from the study to develop large-scale wind turbines requires further study. This paper aims to discuss the use of wind turbine data obtained the wind-tunnel measurements to estimate the characteristics of wind turbines that have field size. One should measure the torque of two small-scale turbines inside the wind tunnel. The first small-scale turbine has a radius of 0.14 m, and the radius of the second small turbine is 0.19 m. Torque measurement results from both turbines were analyzed using the Buckingham π theorem to obtain a correlation between torsion and diameter variations. The obtained correlation equation was used to estimate the field measurement of turbine power with a radius of 1.2 m. The resulting correlation equation can be applied to approximate the energy generated by the turbine using the size of the field well in the operating area and the tip-speed ratio (λ) of the turbine design.
1. Introduction
The study of horizontal-axis wind turbine (HAWT) design performance can be done quickly using various pieces of software. The results of the study can be employed as a basis to realize the design because the measurement results from the software are relatively accurate. However, real measurements are needed because the conditions used in computing are ideal conditions, while real conditions may differ considerably.
The research development progress in wind turbine technology grew rather slowly in the last few decades. Kuchemann further developed early mathematical works that Prandtl and Joukowsky started. He calculated the chord wise and span loading on swept and straight wings at subsonic speeds [1]. The concepts were deepened and sharpened with, for example, Goldstein’s rotational functionate for best blade design, shafts with a seat, and actuator discs with swirl [2,3,4,5].
Lutz described the practicality of the lifting-line concept, Ayati calculated the aerodynamic effects on HAWT with the lifting-line concept, and digitally, Lamar developed a simplified Multhopp concept for estimating camber and lifting pressure for combination platforms [6,7,8]. Moreover, Sutrisno et al., implementing the lifting-line concept, modeled the performances of three-dimensional (3D) blade plate styles of the wind turbine with helicopter-like propeller blade tips [9]. From the lifting-line concept, one could develop 3D HAWT blade patterns.
Kesler compared the propeller thrusts predicted by the lifting-line concept with experiment. Abedi developed a vortex filament theory on rotor blades, and de Oliveira et al., investigated how a body presence affected the actuator disk performance [10,11,12]. Experimental and lifting-line prediction of thrusts could be used to estimate blade loads.
Using a design blade of HAWT, Plaza et al., conducted a comparison between the blade element method (BEM) and computational fluid dynamics (CFD) results for rotor fluid dynamics. Bai et al., used numerical simulation to investigate a 10-kW HAWT blade and aerodynamic design. Chehouri et al., reviewed optimization techniques of performance applied to HAWT. Singh and Ahmed tested a small wind turbine rotor power and examined blade design for low HAWT utilization. Suzan investigated radical regenerations in HAWT blade construction. Velázquez et al., learned the construction and experiments of a 1-MW HAWT [13,14,15,16,17,18]. One could apply the study of blade design and optimization techniques on small wind-turbine rotor performance.
In implementing BEM for design, Schubel and Crossley investigated wind-turbine blade design. Lynch conducted progressive CFD methods for HAWT analysis. Elfarra examined the design and optimization of winglets and twisted aerodynamics using a CFD HAWT rotor blade. Maniaci et al., investigated the development of the numerical experimentation and model measurement of thick HAWT airfoils with front-edge erosion. Perfilev examined an optimization methodology for HAWT blade geometry. Some researchers analyzed subsonic airfoil sections employing the numerical shape for efficiency and effectiveness. Rahimi et al., compared experiments with CFD and investigated the validity of the BEM for the HAWT simulation in complicated load matter [19,20,21,22,23,24,25,26]. Blade design, and efficiency and effectiveness of winglets via rotor blades showed their related optimized geometries. The BEM computation reasonably revealed the validity of the simulation in complex load cases.
To enrich the insights, we need to compare the mathematical works and the BEM with the 3D approximation theory. It includes consideration for stall delay, turbulence, and separation. Sutrisno et al., studied the performance and flow dynamics of the 3D approximation theory of HAWT blades. Sutrisno et al., learned the power and stall mechanism of 3D HAWT blade-plate models. They also investigated the simulation model of the swept-back HAWT blades. Brocklehurst and Barakos reported a tip-shaped review of a helicopter rotor blade [9,27,28,29]. The 3D wind turbines studied through rolled-up and tip vortex investigations could be combined with the review of helicopter blade-tip vortices to strengthen their performances and stall delays.
In the HAWT stall delay, Dumitrescu and Cardos reported inboard stall delay due to the rotation. Hu et al., investigated research on the HAWT stall mechanism. Lee and Wu did a study of stall mechanism on an HAWT blade employing Particle Image Velocimetry (PIV). Sicot et al., studied rotation and disorder effects on the stall delay of an HAWT blade. Wu et al., performed, during stall mechanism, an investigation of frantic turbulence conditions. Yu et al., examined the separated flow and stall mechanism for wind turbines [30,31,32,33,34,35].
The 3D approximation theory relies heavily on a rolled-up vortex and Q-criterion. Gursul et al., studied the unsteady aerodynamics of non-slender delta wings. Gursul et al., reviewed the vortex control actions of the front-edge eddy. Chattot explained the blade-tip modification effects on HAWT power using the vortex concept. Pavese et al., learned the pattern of HAWT swept blades implementing load elucidation. Shen et al., analyzed the aerodynamic shape effectiveness of curved small HAWT blades. Adegas et al., observed an energy curve of a small HAWT generator lab and open-terrain test [6,36,37,38,39,40]. The 3D approximation theory is based on the aerodynamics of delta wings, swept wings, leading edge, and blade-tip vortex mechanisms. Studying the basics of small wind-turbine blade performance is essential.
Scientists introduced the Q-criterion to visualize the rolled-up vortex appearance. Calderon et al., analyzed 3D measurements of vortex breakdown. Haller explained an objective definition of a vortex. Muscari et al., learned to model the flow dynamics in the roll-out of maritime blades. Zhang and Wu observed the fluid dynamic properties of HAWT blades with a sinusoidal front-edge. Ibrahim and New reported the control of stream separation of maritime propellers implementing tubercle redesign [41,42,43,44,45]. The definition of a vortex, its modeling, and breakdown measurements significantly affect the accuracy of the vortex dynamics prediction.
Cai et al., learned the optimization of wing-trunk arrangement to suspend the start of asymmetrical vortex [46,47]. Using CFD, Bangga et al., explained the computational arrangement effect on a correct guess of an HAWT rotor. Kim did a power analysis and studied the fluid dynamic patterns of the hundred-MW class HAWT blade [48,49]. The effects of computational grids, methods, and optimal wing-body configurations are essential to provide an accurate prediction of a simulation.
Shafiqur Rehman et al., reported a review of HAWT blade design strategies for power improvement [50]. Reducing the cut-in velocity, by recalculating the blades, would increase the power of wind turbines. Identifying the usefulness of modifiers, such as the power coefficient, charge of energy, the constraints of mass, and design of the blade would solve the problem. Schubel and Crossley revealed the blade design of wind turbines exclusively with horizontal-axis rotors, including optimal power, practical optimization, HAWT blade configuration, and blade loads [19]. Manufacturers seek greater cost effectiveness by exploiting the possibility of increasing the scale.
We conducted two small-turbine torque measurements, and used the Buckingham π theorem to obtain a correlation between torsion and diameter variations. The correlation equation was developed and was used to estimate the field measurement of turbine power with a radius of 1.2 m. The resulting correlation formula can be applied to approximate the output generated by the turbine using the size of the field well in the operating area of the turbine design.
The measurement of small-scale wind turbine models with a wind tunnel is a commonly used way of obtaining design characteristics. However, the data obtained require further analysis capable of estimating the performance of wind turbines of various sizes in the field. In this paper, a dimensional analysis based on the Buckingham π theorem was used to estimate the power to be generated by wind turbines with an actual scale based on torque correlations with changes in the diameter measurement results in the wind tunnel.
2. Wind-Turbine Characteristics
2.1. Wind-Turbine Scaling, the Rule of Similarity, and the Buckingham π Theorem
We executed the work starting with the rule of similarity and the Buckingham π theorem. One could formulate importance modifiers that regulate the rotor characteristics, which depend on turbine radius [51]. In this study, we could scale all the geometrical parameters of the blade linearly.
Following the Buckingham π theorem, the number of dimensionless parameters (Np) needs to correlate with the associated data equal to the total number of variables (Nv) minus the number of independent dimensions needed to describe the problem (Nd) (Equation (1)) [52].
For any associated dimensional quantity Q,
Q0 has the same dimension as Q. If P0 ≡ Q/Q0 is defined as a dimensionless quantity, then Pi as the π factor is dimensionless. In Equation (2), ai is a coefficient that must be determined.
2.2. Torque–Diameter Correlation
The elementary quantities used in the experiment variables could be mass (M), length (L), and time (T). The experiment variables consist of five parameters, i.e., torque τ (ML2T−2), air density ρ (ML−3), wind speed U (LT−1), rotation speed RPM (T−1), and rotor diameter D (L). From the dimensional analysis, the correlation of torque and rotor diameter could be written as in Equation (3).
From Equation (3), we found that
3. Experimental Set-Up
3.1. Wind-Turbine Design
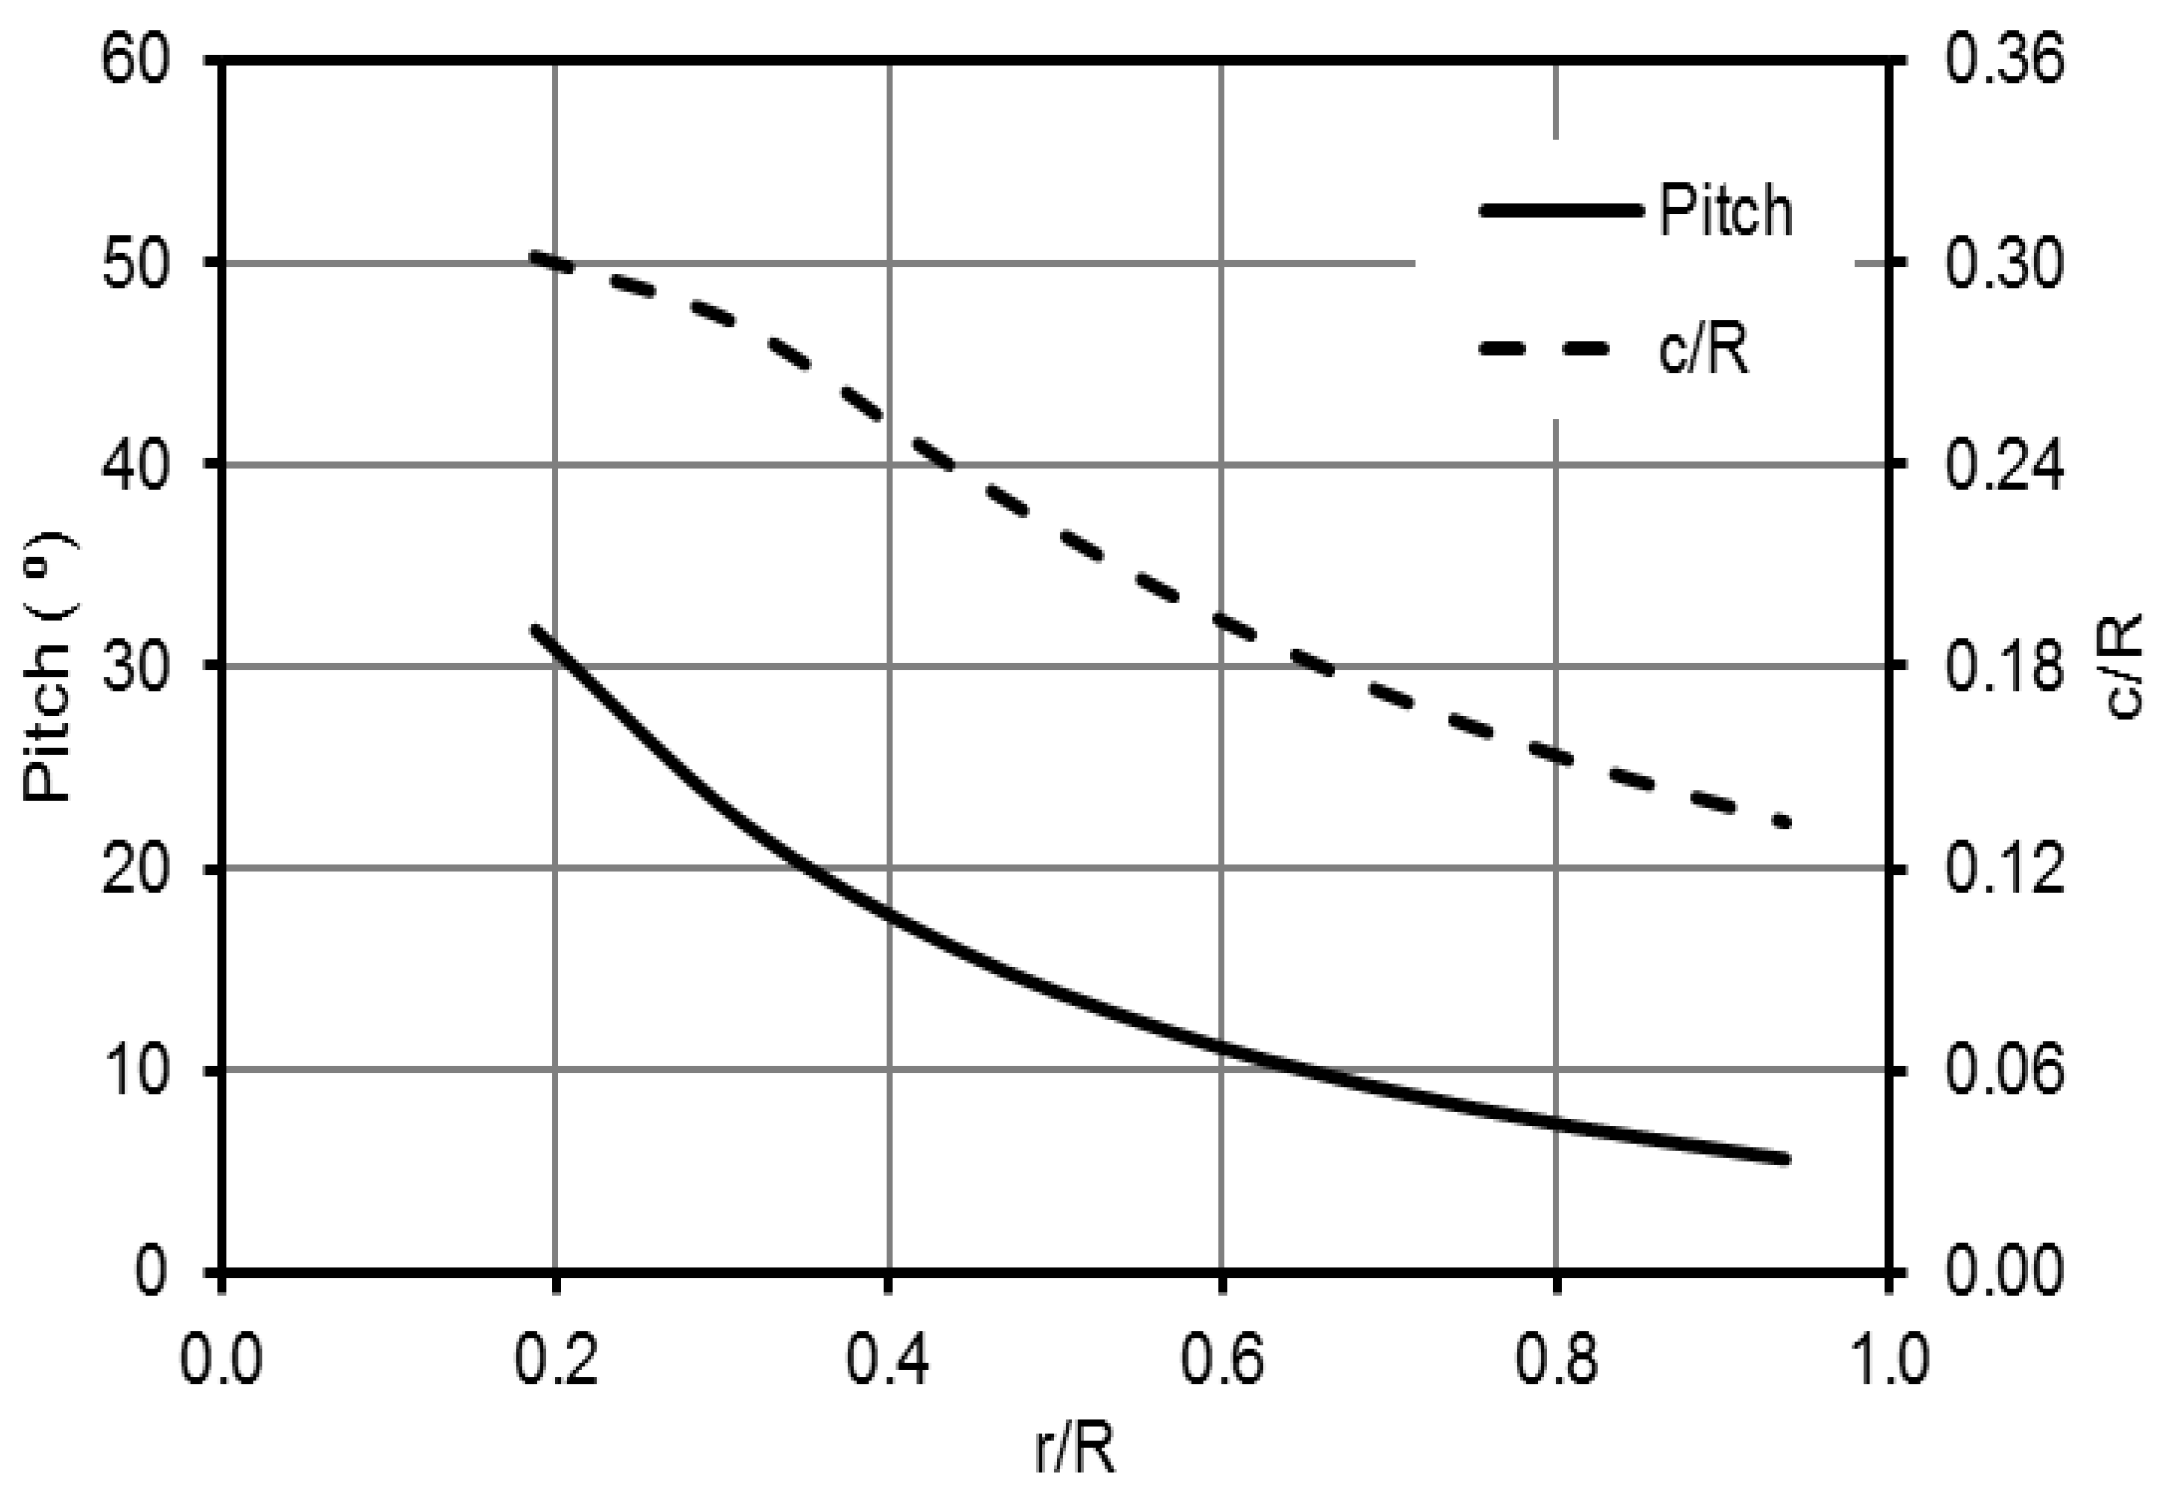
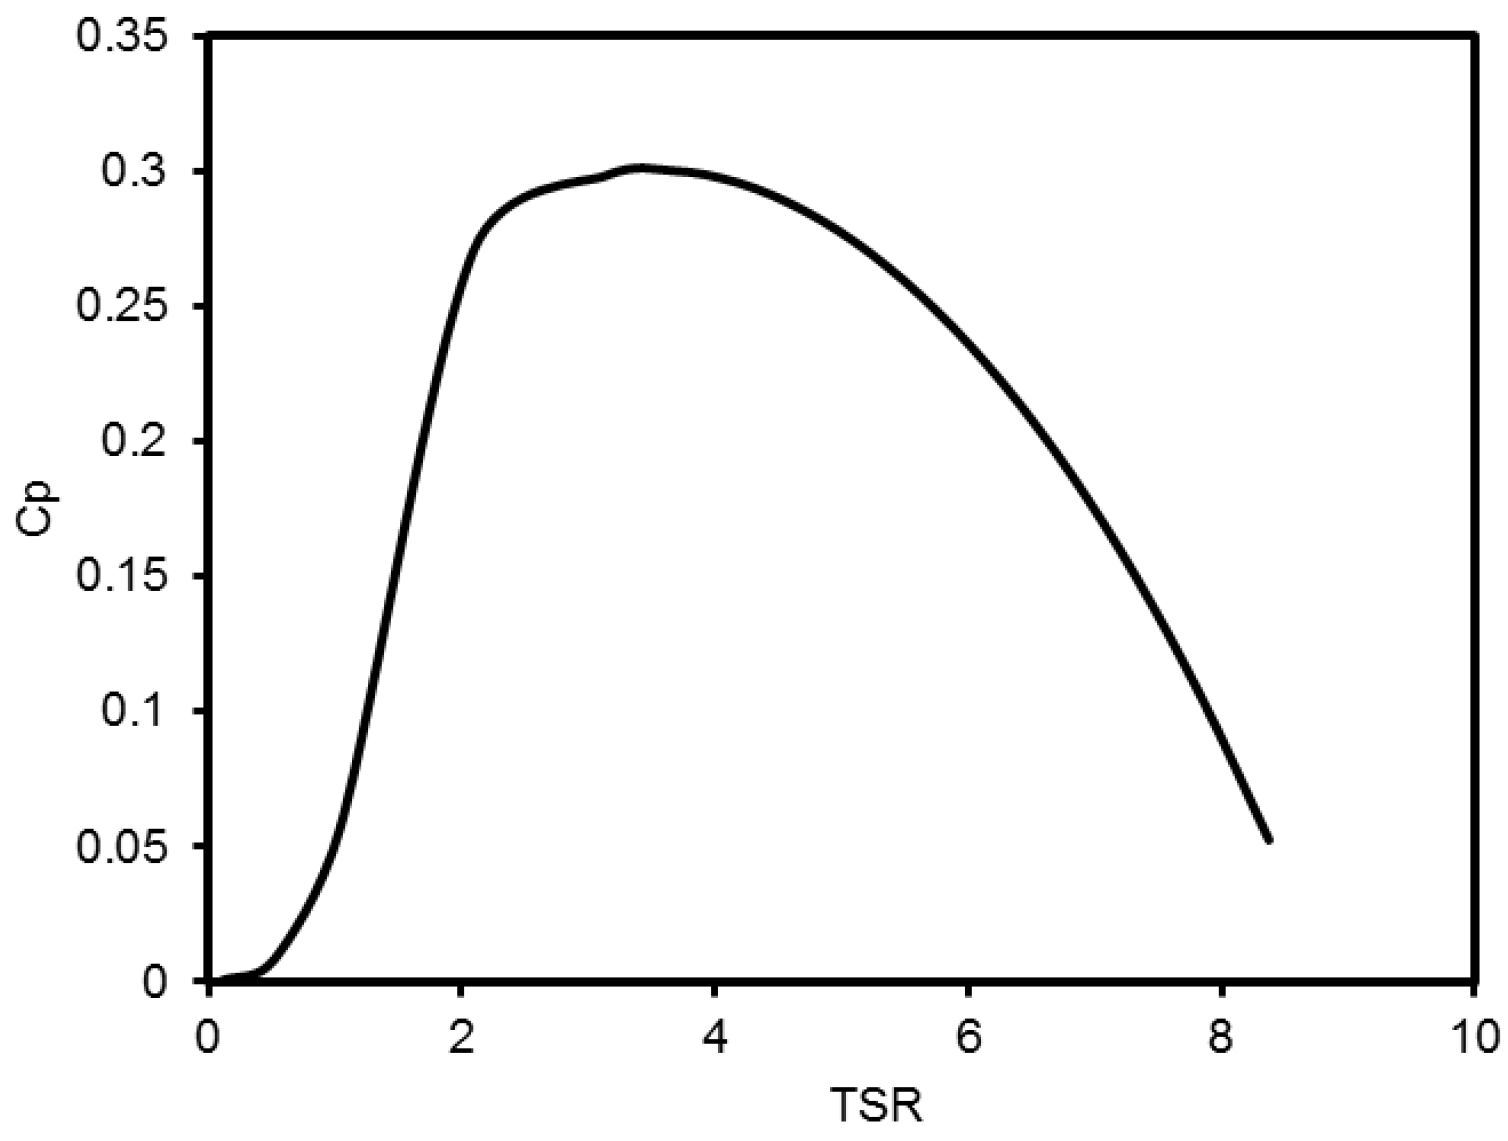
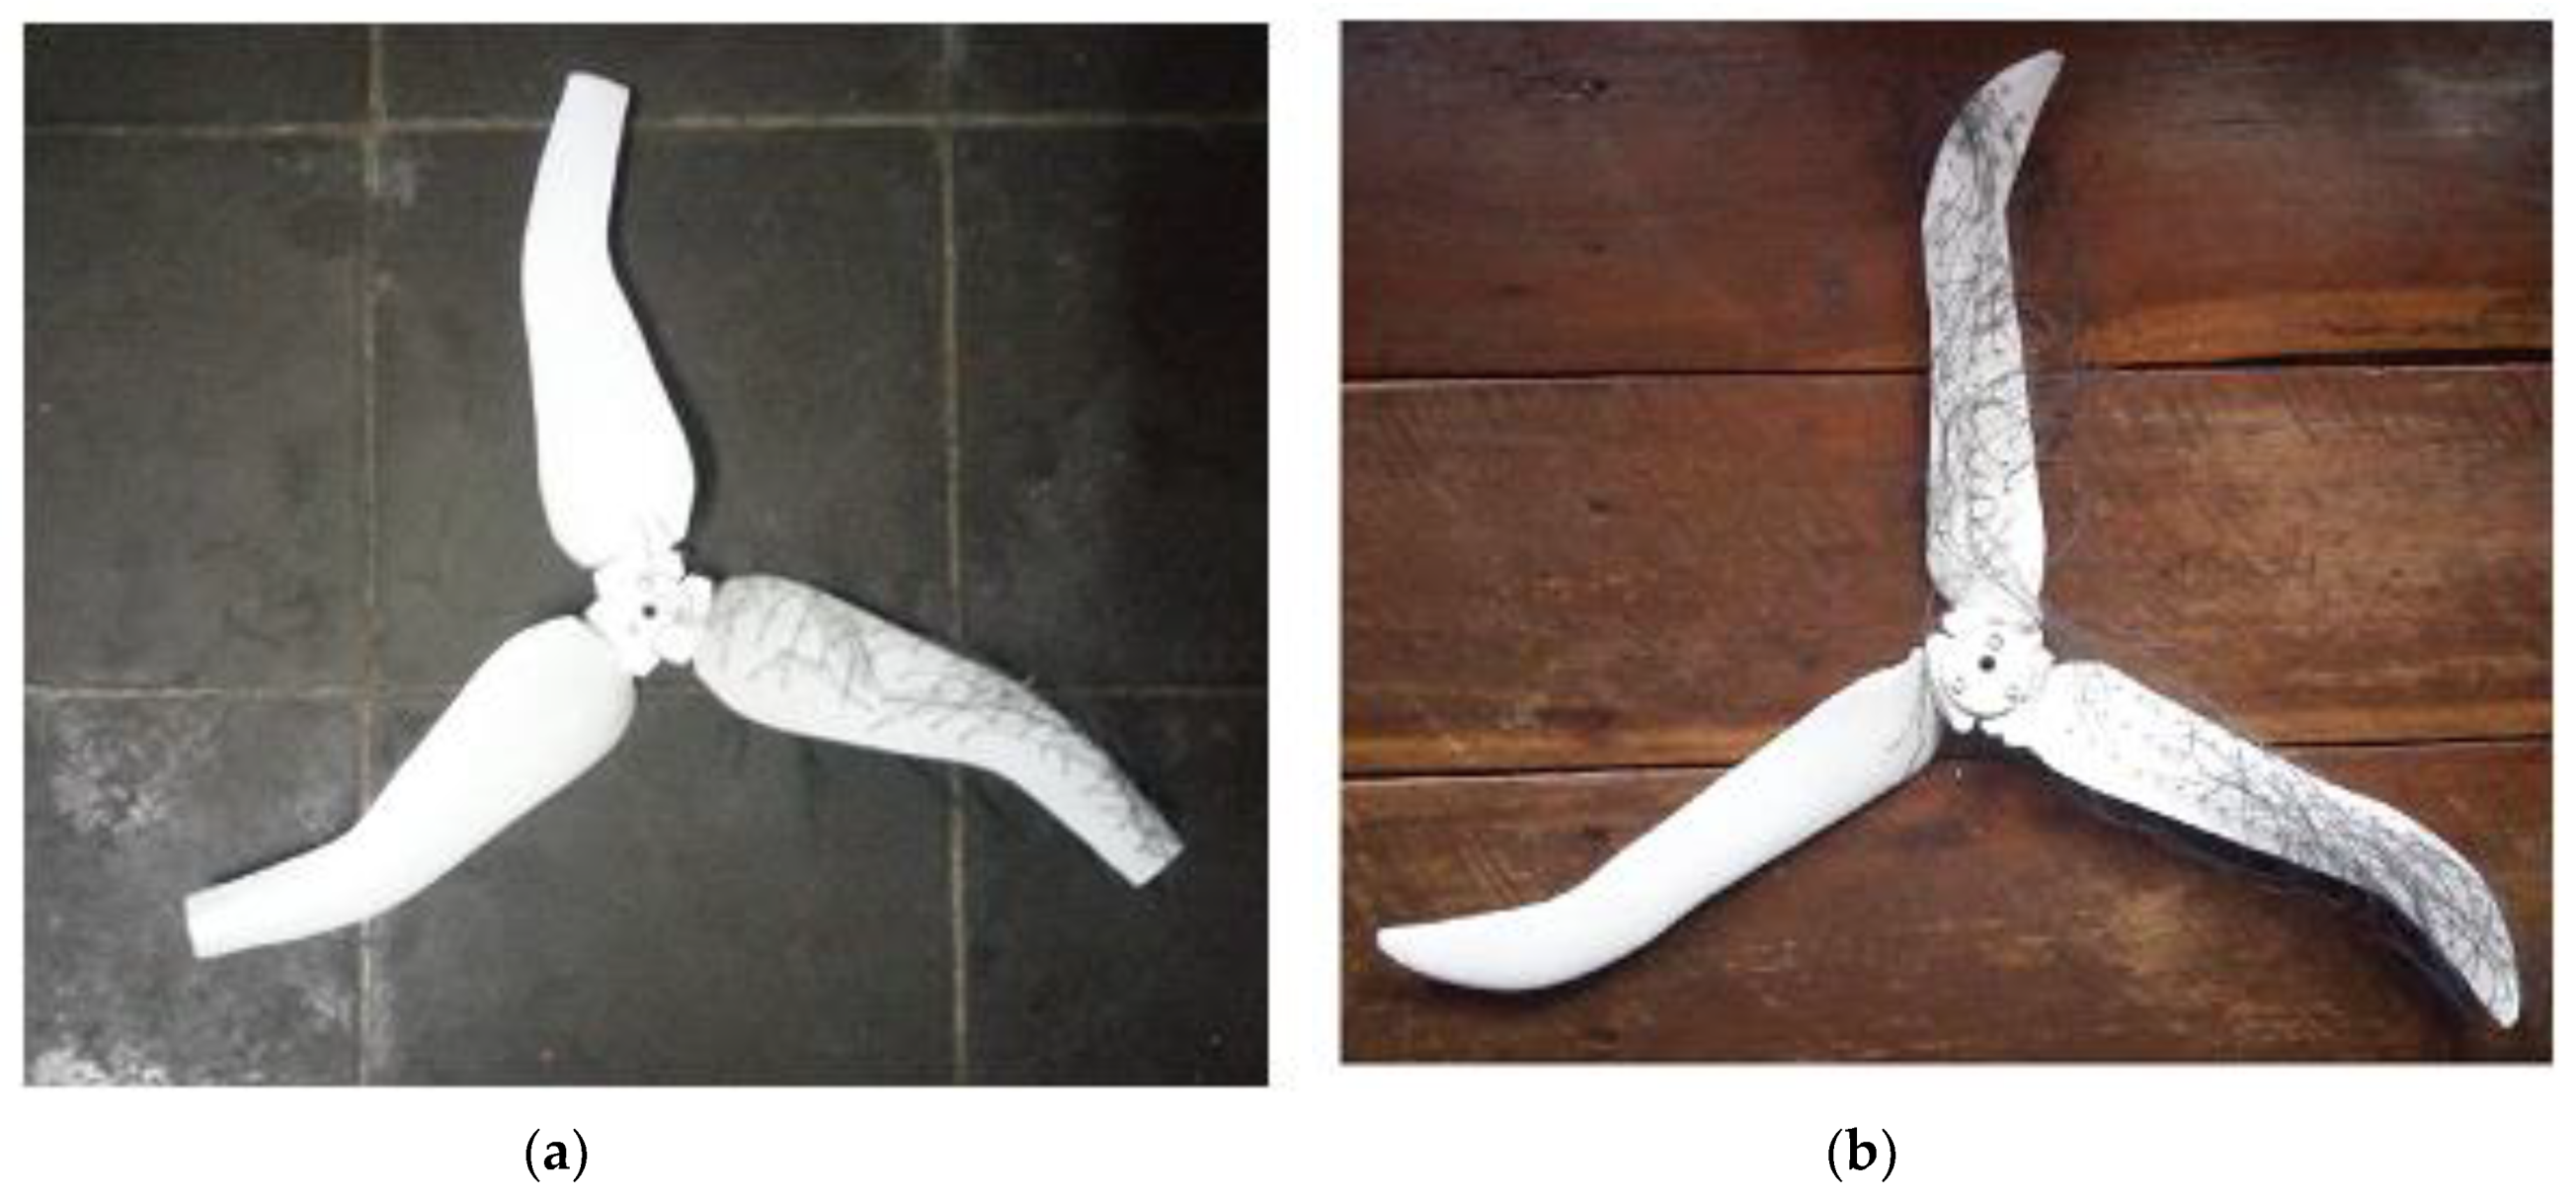
In this study, one could use BEM procedures to design the geometries of the wind-turbine blades. The rotors had three blades and applied airfoil NACA 4412 along their spans. The distributions of pitch angles and normalized chord lengths spanwise were approximated using the BEM optimal distribution (Equations (5) and (6)), as depicted in Figure 1. The design used a tip-speed ratio of 3.65. The calculated performance of the design is described in the form of Cp as a function of λ, as depicted in Figure 2. Figure 3 shows three-dimensional printed models that have a radius of 0.19 m.
3.2. Parameter Measurement in Wind Tunnel
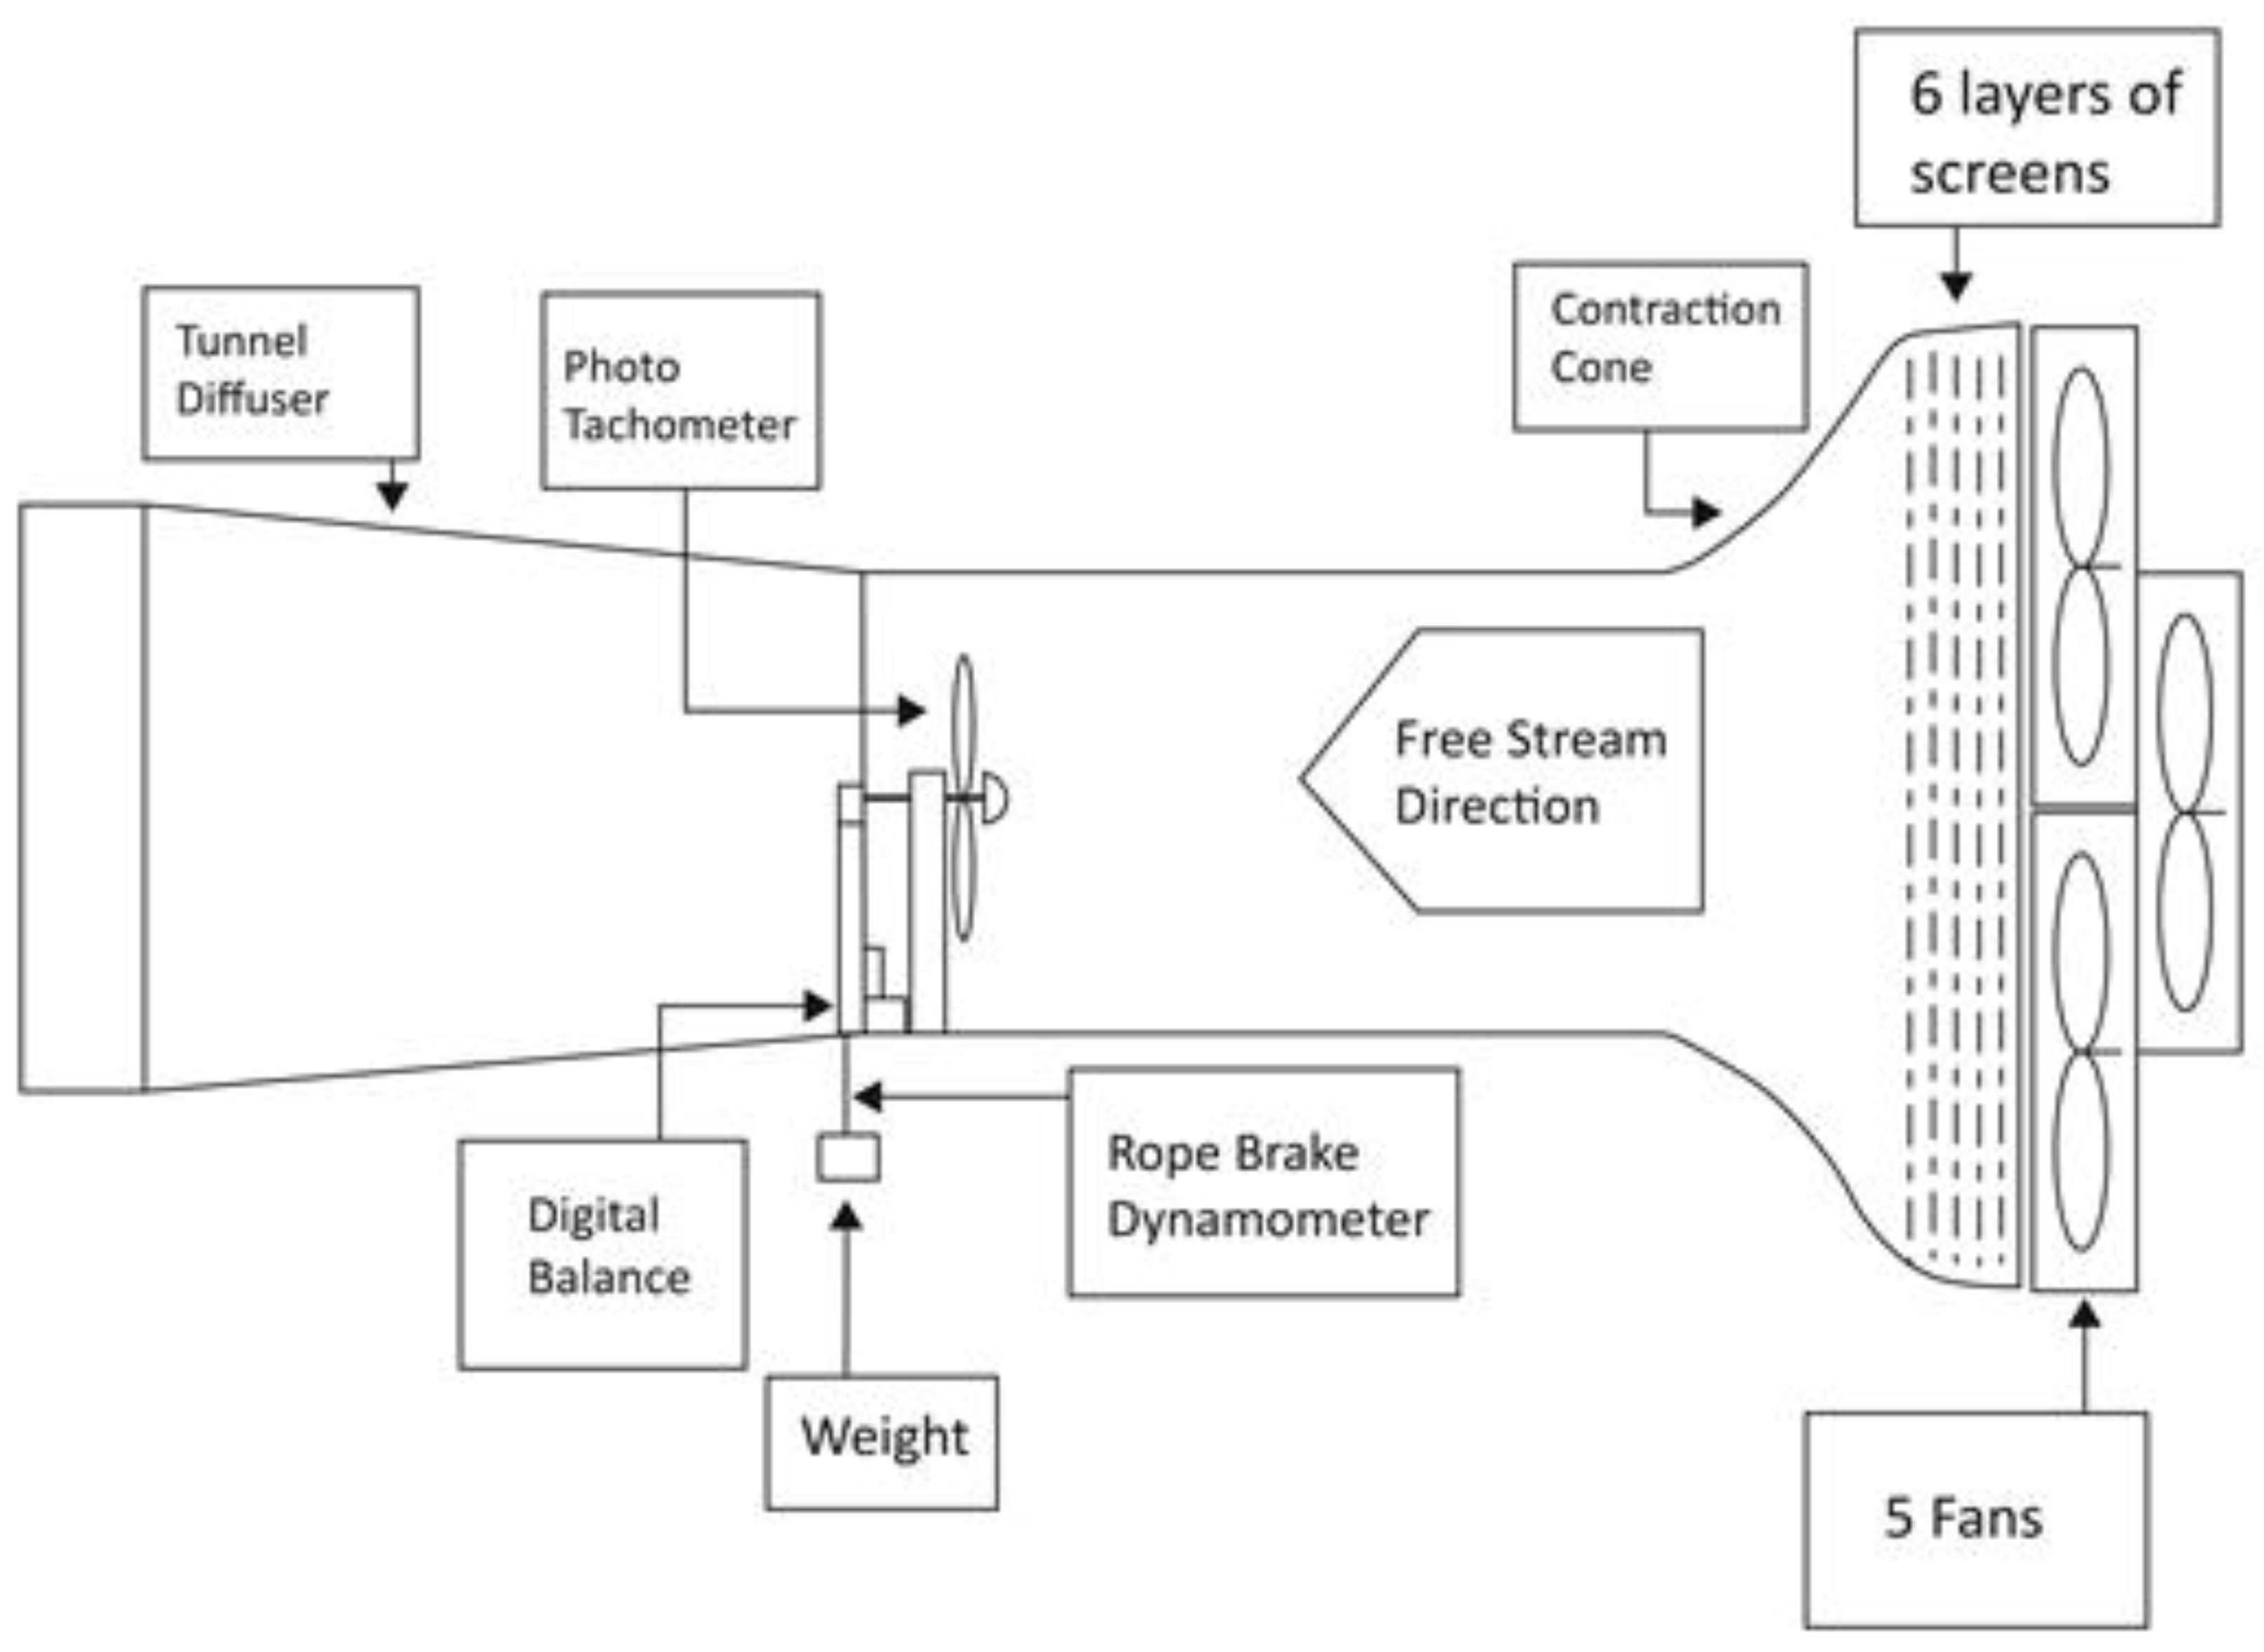
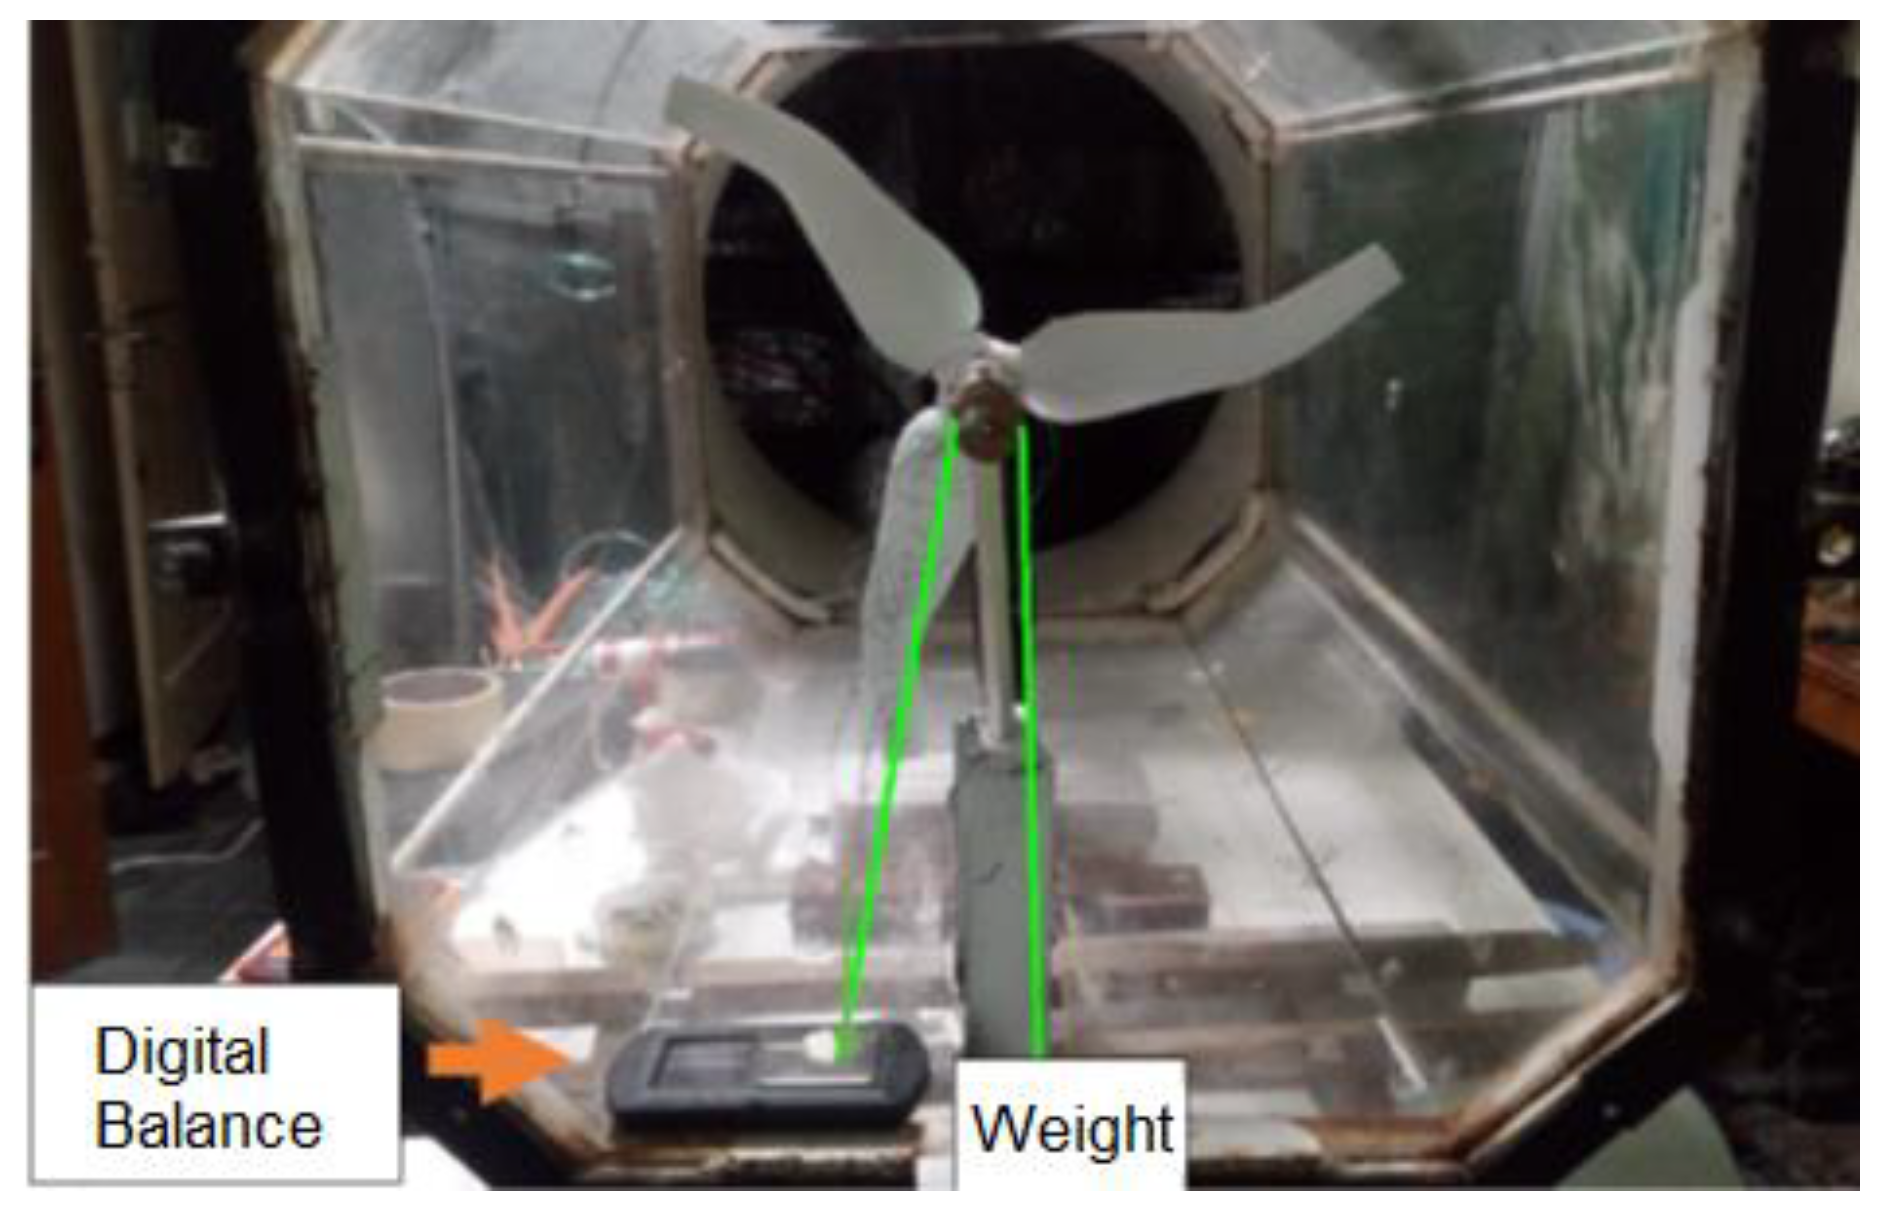
Figure 4 shows the schematic parameters of small-scale wind-turbine measurement. The wind tunnel uses five blowers, one of which is placed in the center so that the wind input distribution is uniform. The air filter uses six arranged screen layers. The first two screens are sparse screens with a size of 20 mm × 20 mm, the next two screens are medium sparse screens with a size of 10 mm × 10 mm, and the last two screens are tight screens with a size of 5 mm × 5 mm. The wind enters in a somewhat uniform manner from the blower; the speed is made more even employing the dissipation process that occurs along the way so that the wind is even more parallel at quite a low turbulence. The process becomes better by utilizing a good contraction cone. Conical contraction is designed with an electromagnetic theory so that the process of compressing the wind becomes as isentropic as possible. Figure 5 shows a rotor blade in the wind tunnel. The wind-tunnel parameters consist of wind speed, the rotation speed of the rotor, and the torque of the rotor. A rope-brake dynamometer system measured the torque. The torque was not measured directly. A balancing weight (W) was used to generate friction force on a pulley Dp in diameter. The torque values were calculated from the difference between balancing weight and the values shown in digital balance (S) using Equation (7) [53].
3.3. Field Measurement
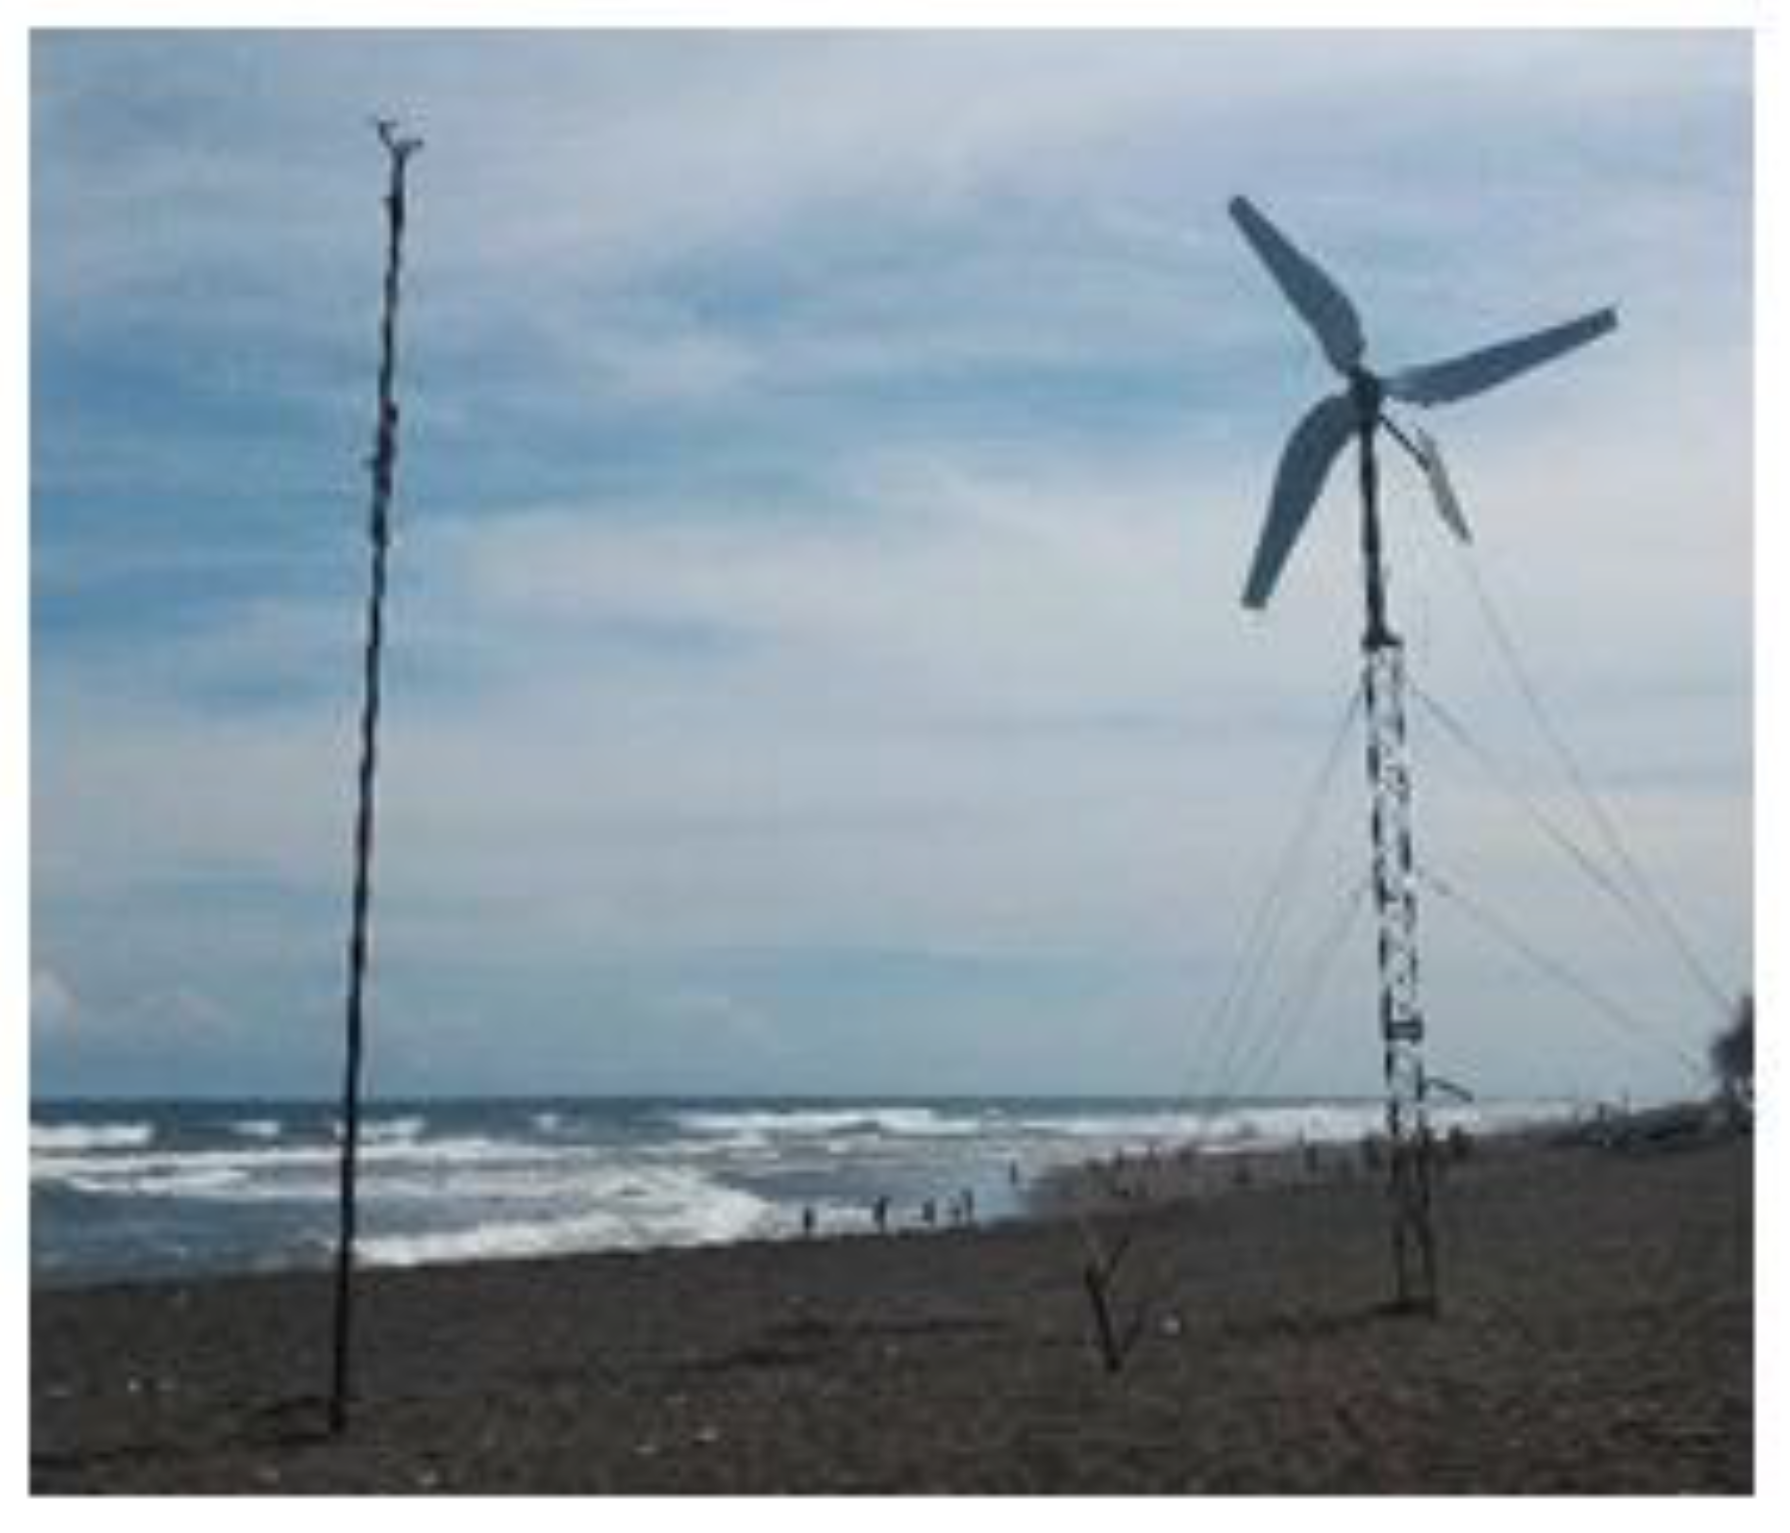
We conducted field measurements in the beach area (Figure 6). The location of the field was the coastal line of Pantai Baru, Jogjakarta, Indonesia, at a geographic location of about 7°59′20.8″ S 110°13′15.4″ E. The tests were done following the IEC 61400-12-1 standard. The generated voltages and current of a generator identified the rotor power. Then, we could couple the current with the field rotor. Wind velocity, the rotation of the shaft, and also wind direction became data results, which were collected on a hard disk. The bin method was applied to investigate the data. The bin width applied to the wind velocity in the analysis was 0.5 m/s [54].
3.4. From BEM to 3D HAWT Blade Concept
At the beginning of the HAWT rotor research, one could divide the HAWT blade into some independent spanwise partitions. Then, the induced speed could be estimated, and this infinite number of blades was addressed as the blade element momentum (BEM) theory.
At the moment, the concept has slightly shifted to an analogy of an airplane that first uses a planar wing, and then, for higher-speed implements, a swept wing. At first, the HAWT blade pattern uses the BEM concept, and afterward, shifts to the concept of 3D wind turbines.
On the aircraft, the addition of the swept wing slightly reduced performance, but induced the stall delay; thus, the high performance survived at higher angles of attack. As for wind turbines, the addition of the swept blade slightly reduced the performance, but delayed the stall; the blade survived at higher wind velocities. In wind-turbine blades, stall propagates from the bottom toward the edge [9]. The stall mechanism is very beneficial for regions with gusty winds. It is the 3D wind-turbine blade concept.
4. Results and Discussion
4.1. Measurement Results and Torque–Diameter Correlation
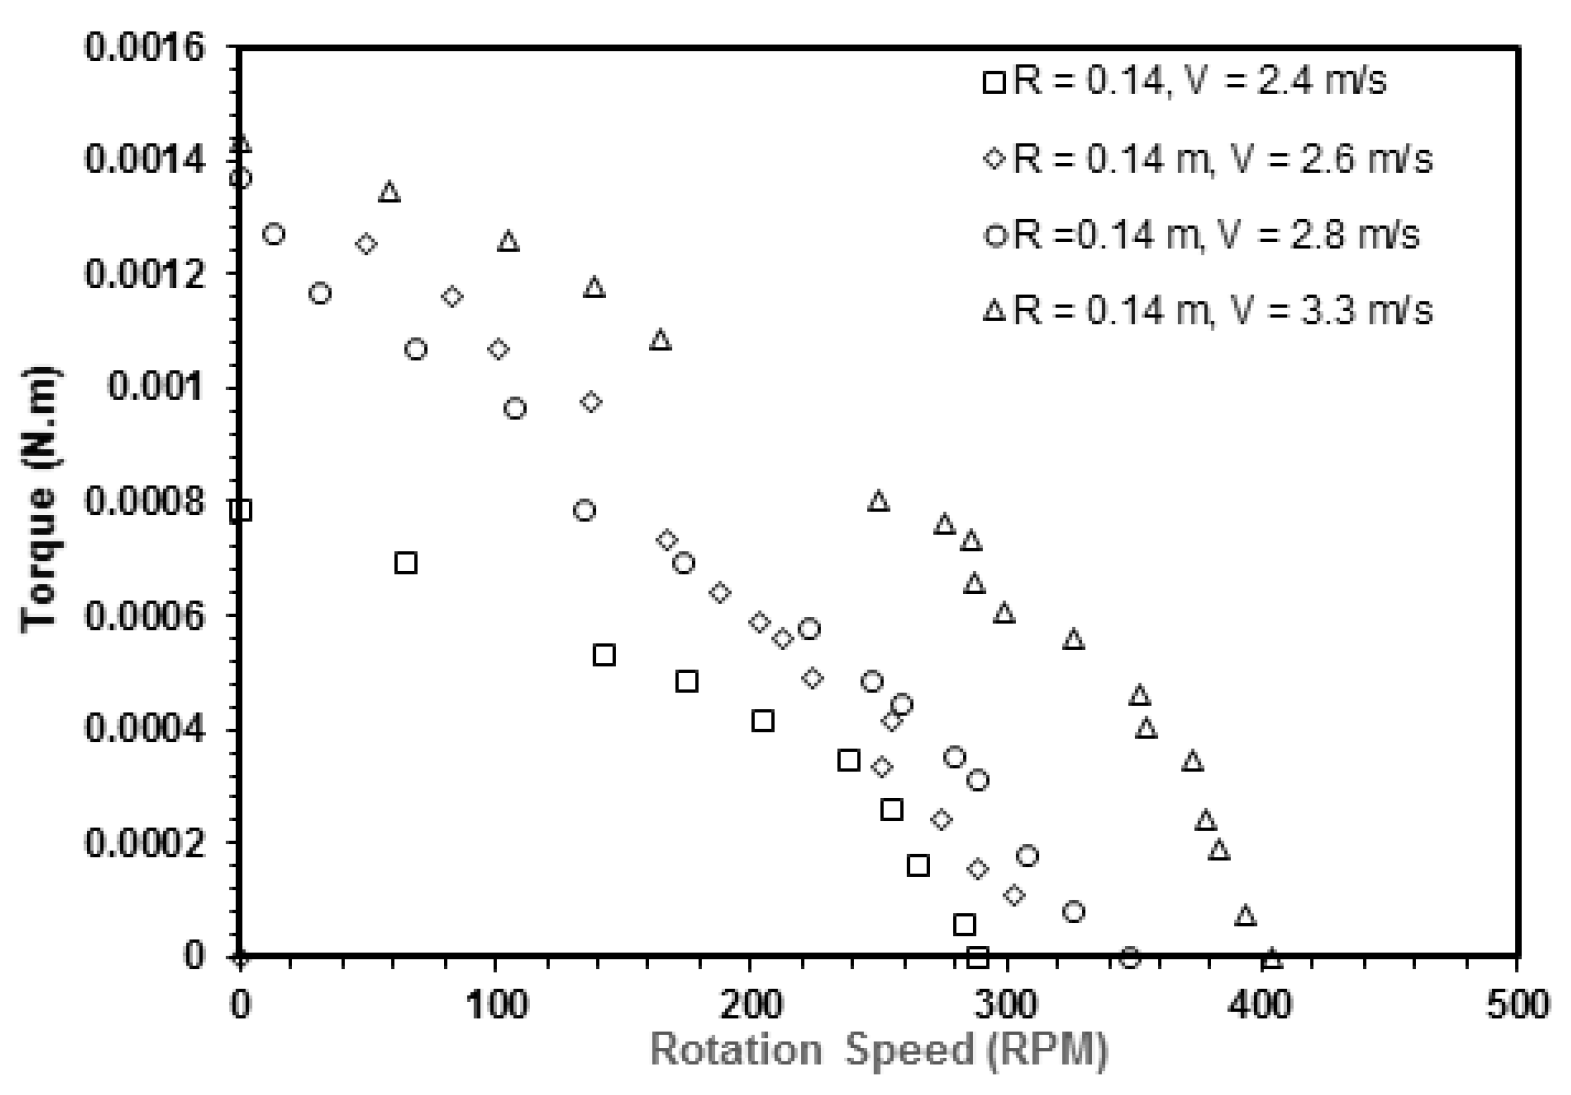
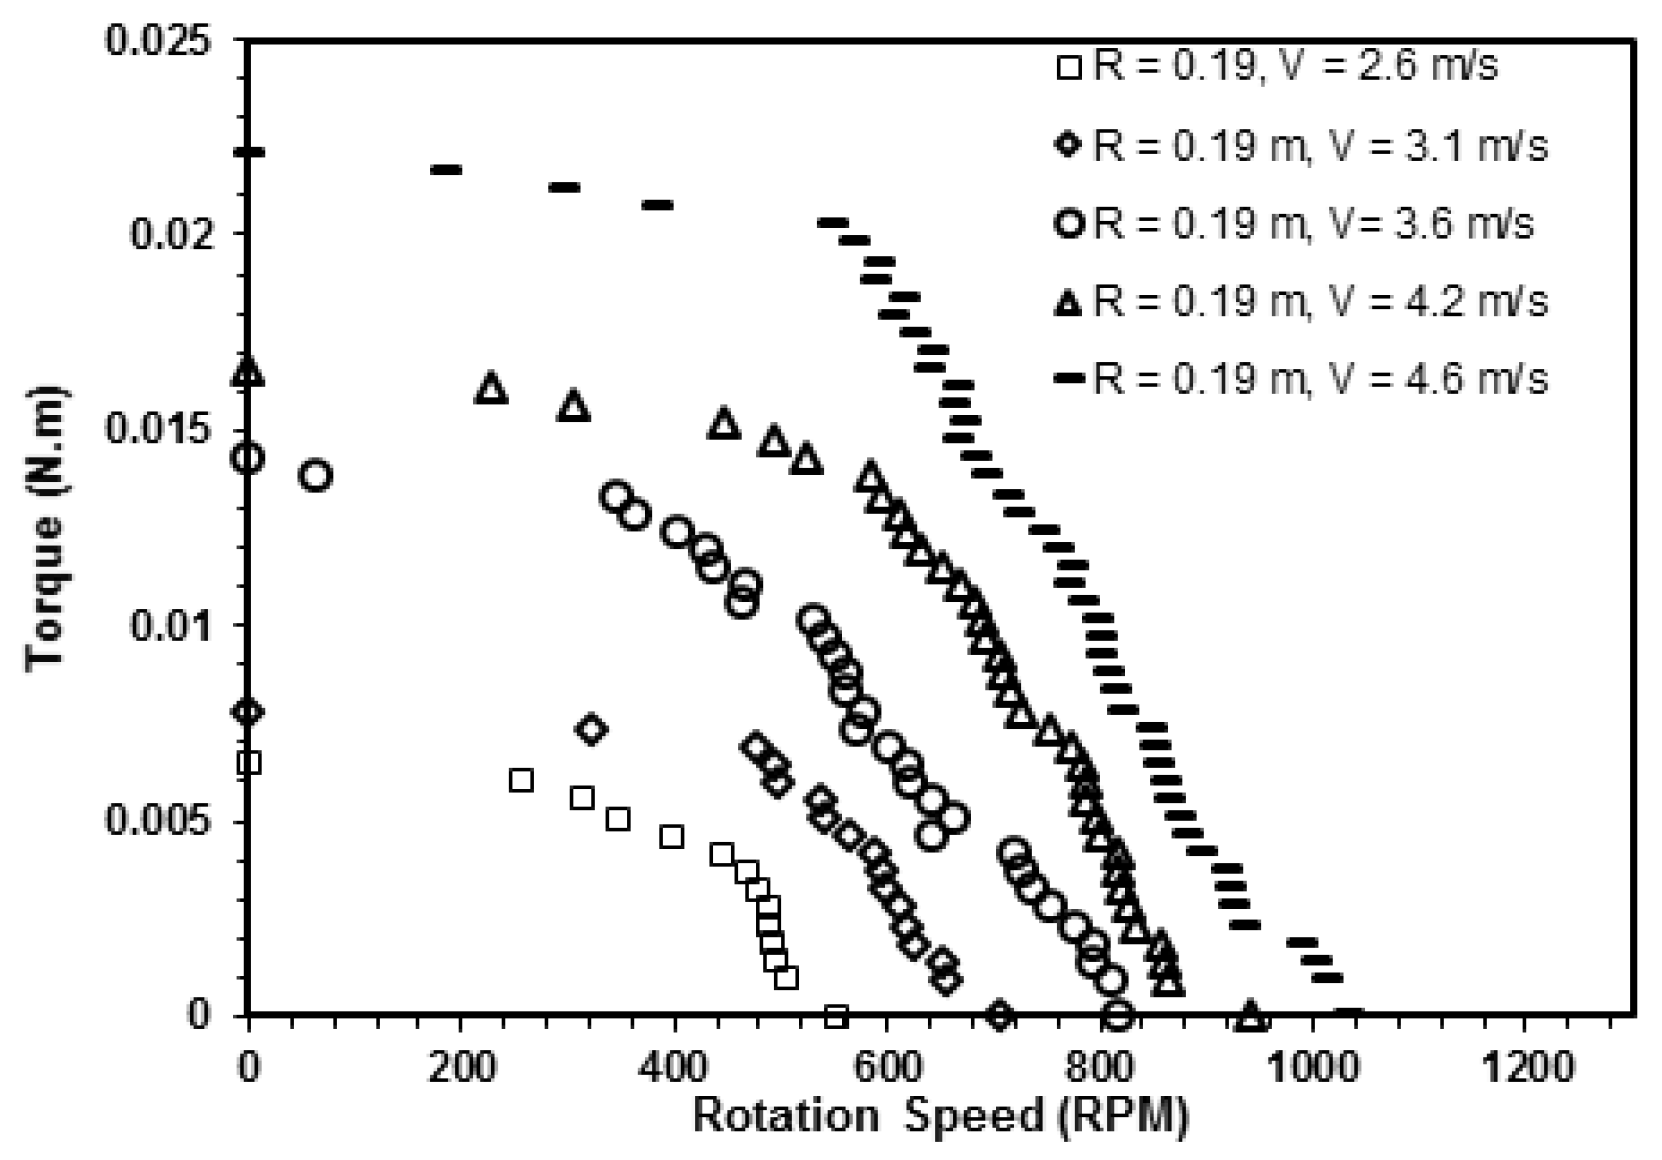
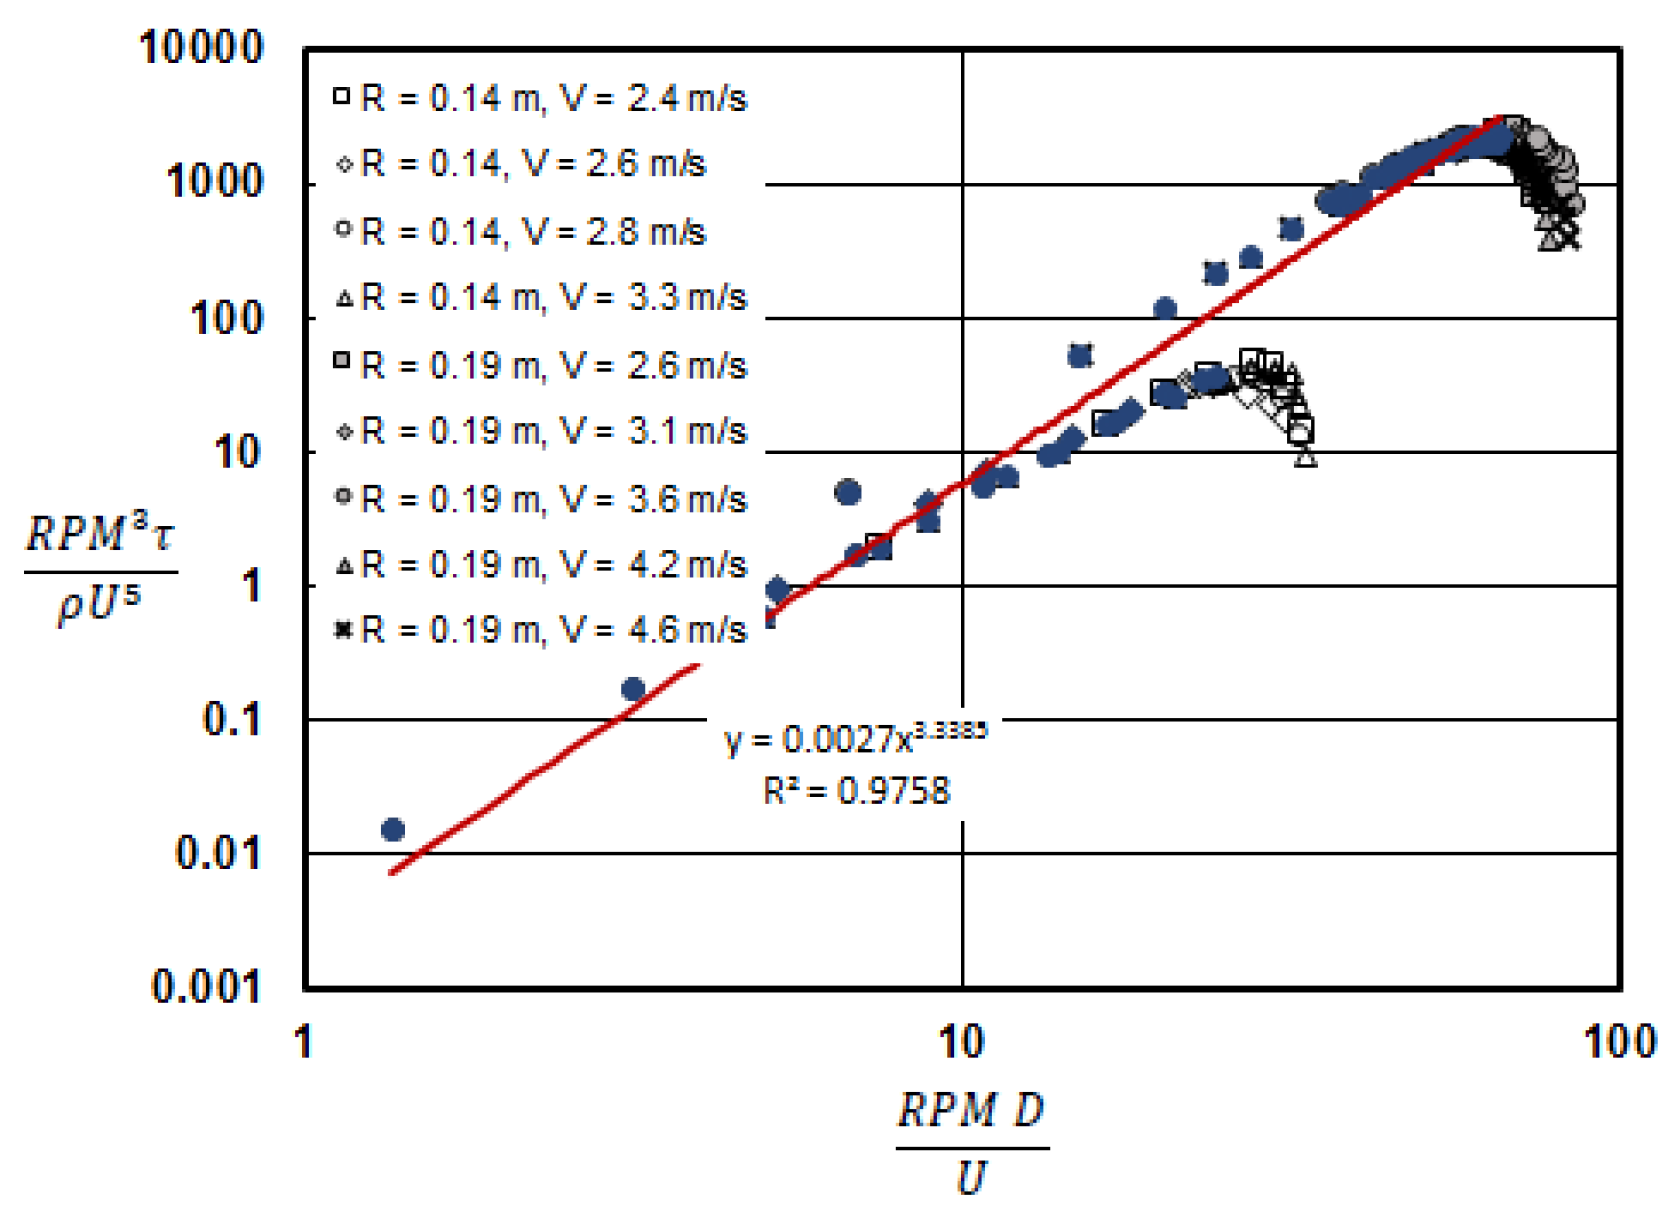
Figure 7 and Figure 8 show the results of the torque measurement of small-scaled rotors in the wind tunnel. Then, the measured data were evaluated using Equation (3). Figure 9 shows the plotted non-dimensional torque (P0) as a function of another non-dimensional parameter (P1). The figure indicates two regions of data. The first represents data that are relatively linear in the logarithmic of the P0 axis, and the second forms non-linearly. A correlation of torques associated with diameters of wind-turbine rotors could be created using data in the linear region, as stated in Equation (8). Then, one could choose the correlation for estimating the power of field measurement of a wind turbine.
4.2. Field Measurement and Computed Power
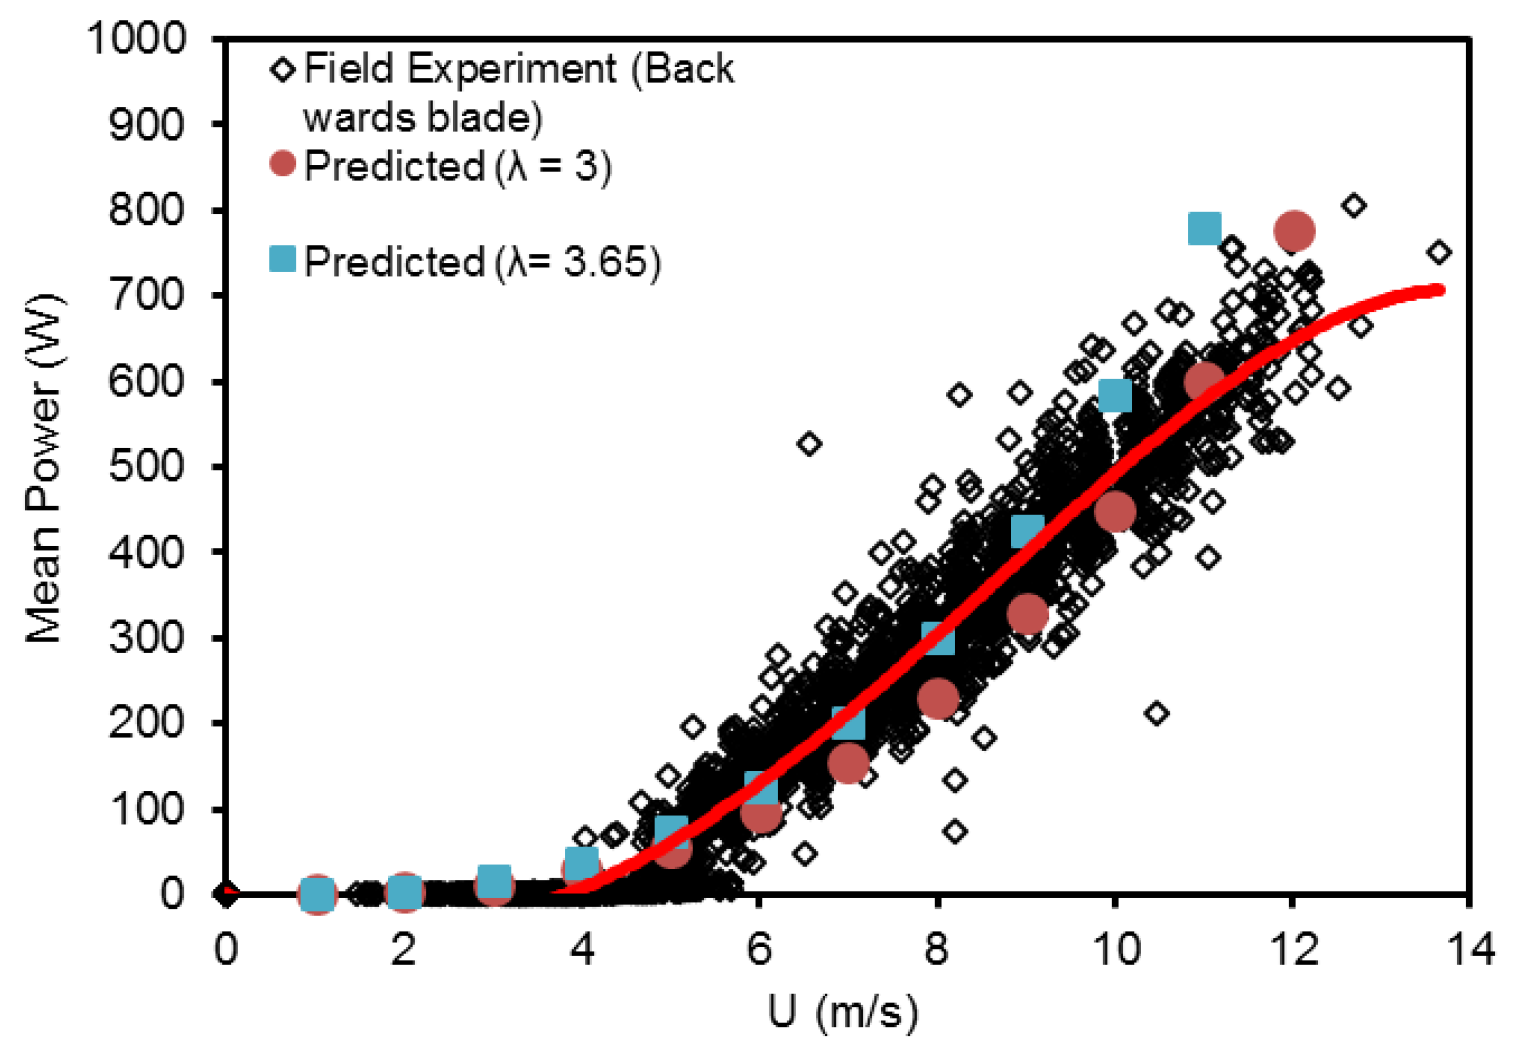
Based on Equation (7), the power of the rotor can be calculated using Equation (9). Figure 10 shows the computing power with selected tip-speed ratios (λ) of 3.65 and 3.0.
Figure 10 describes the results of the tests [54]. The maximum standard deviation of the power of the bin data in the field measurement was 161.5486 [54], whereas the error values from the correlation increased until reaching 92.2884 Watts at a 10 m/s wind speed. For wind velocities higher than 10 m/s, the estimated power was higher than the expected values. The rotor of the HAWT has lower expected values at high wind speeds, as it turns slower than its designed operation. Therefore, Equation (9) is accurate enough to be used for estimating the power measurement.
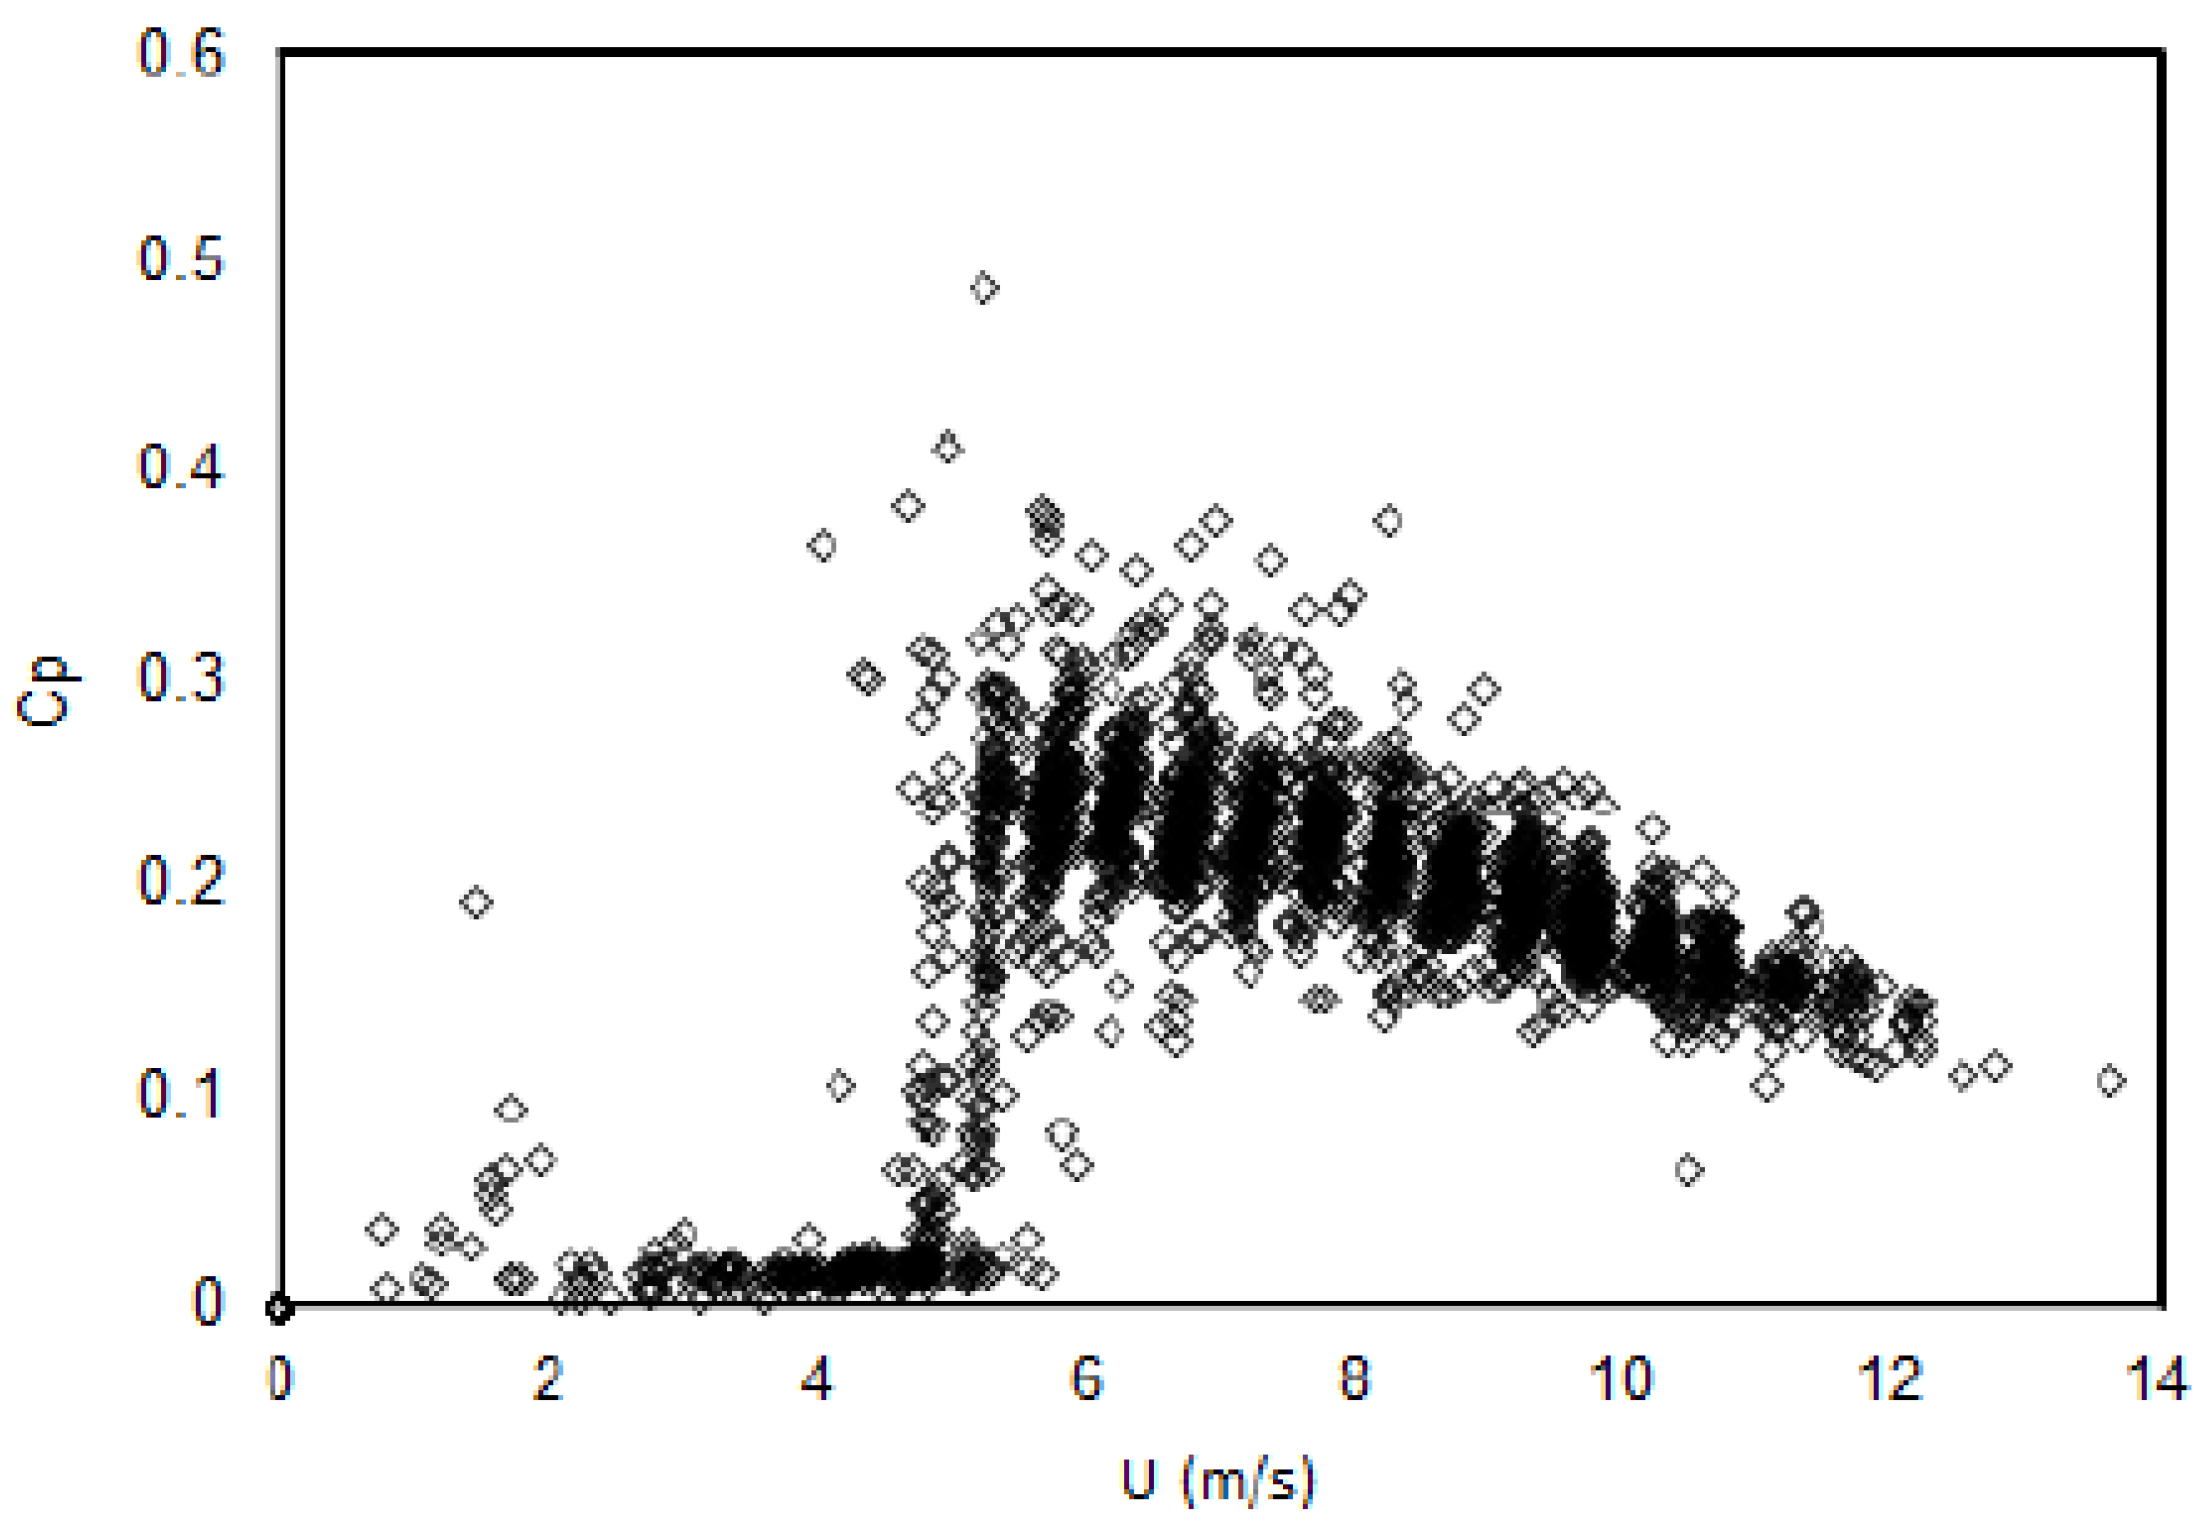
The correlation equation estimates that the power coefficient of the field rotor will be 0.21 constantly over all ranges of wind speed. The value is sound to be used in practice, but one should employ the correction of the ranges of the wind speed. Figure 11 describes the computed power coefficient based on field power measurement as a function of wind speed. Based on Figure 11, it is reasonable if the power coefficient of the rotor is estimated to be 0.21 in an air velocity spacing of 5 m/s to 12 m/s.
For the results comparison between the lifting-line theory and measured power, in the previous report [9], we compared performance coefficient concerning λ implementing the lifting-line concept based on the principle of Pistolesi with spin effect, concerning the results of the real calculation. The matching result was satisfactory.
5. Conclusions
Method selection in making experimental data on small-scale wind turbines valuable for designing a large-scale one is an important task. In this paper, dimensional analysis based on the Buckingham π theorem works well when applied. We made a pattern of the torque data from a small-scale wind-turbine test in a wind tunnel. Based on the results, the correlation of the torque data on the small rotor associated with rotor diameter could be used to confidently predict the result of field power measurements of the large one, as the errors were lower than expected from the field measurement error.
The theory in this paper is limited to rotor scaling up to 8.57. The use of the Buckingham π theorem gives a good result. In order to employ the method to higher scaling, an extended investigation is needed to study the effectiveness of the method. We can also conclude that the lifting-line concept supported the similarity in terms of the theory and its real measurement result, and rearward HAWT blade tuft patterns supported the stream visualization pattern similarity between small-scale and large-scale wind turbines.
Author Contributions
Conceptualization, S.; Methodology, S. and S.I.; Software, S.B.W.; Validation, S., S.I. and S.B.W.; Formal analysis, S.I.; Investigation, S.I.; Resources, S.B.W.; Data curation, S.B.W.; Writing—original draft preparation, S. and S.I.; Writing—review and editing, S., S.I., and S.B.W.; Visualization, S.B.W.; Supervision, S.; Project administration, S.; Funding acquisition, S.
Funding
This study was funded by the Government of the Republic of Indonesia Department of Research Technology and Higher Education, PTUPT-2018, under the contract 1859/UN1/DITLIT/DIT-LIT/LT/2018.
Acknowledgments
The authors would like to express heartfelt gratitude to Noer Ilman and Prajitno for a fruitful session, useful suggestions, and collaboration. We appreciate the help of our students Farhan, Fadhil, and Hasan, and the lab staff members, Ponimin and Wajiono, for giving their help in construction work and conducting data management, which we gratefully acknowledge.
Conflicts of Interest
The authors declare no conflict of interest. The funders had no role in the design of the study; in the collection, analyses, or interpretation of data; in the writing of the manuscript, and in the decision to publish the results.
Nomenclature
| Indices and Sets | |
| αD | angle of attack of an airfoil (design) |
| βr | twist angel of an airfoil |
| λ, λD | tip-speed ratio |
| ρ | air density (kg/m3) |
| τ | torque (Nm) |
| a | constant |
| c | chord length (m) |
| r | radius (m) |
| CL,D | coefficient of lift (design) |
| D | rotor diameter (m) |
| Dp | diameter of pulley |
| L | length |
| M | mass |
| N | total number of dimensionless parameters |
| P | computing power (W) |
| Pi | Buckingham π factor |
| Q | dimension quantity |
| RPM | rotation speed |
| S | digital balance |
| T | time (s) |
| U | wind speed (m/s) |
| W | balancing weight |
References
- Kuchemann, D. A Simple Method for Calculating the Span and Chordwise Loading on Straight and Swept Wings of any Given Aspect Ratio at Subsonic Speeds. Aeron. Res. Counc. Lond. (Engl.) 1956, 2935, 1–53. [Google Scholar]
- Okulov, V.L.; Sørensen, J.N.; Wood, D.H. The rotor theories by professor joukowsky: Vortex theories. Prog. Aerosp. Sci. 2015, 73, 19–46. [Google Scholar] [CrossRef]
- Okulov, V.L.; Sørensen, J.N.; Shen, W.Z. Extension of Goldstein’s circulation function for optimal rotors with hub. J. Phys. Conf. Ser. 2016, 753, 022018. [Google Scholar] [CrossRef]
- Sørensen, J.N.; Okulov, V.L.; Mikkelsen, R.F.; Naumov, I.V.; Litvinov, I.V. Comparison of classical methods for blade design and the influence of tip correction on rotor performance. J. Phys. Conf. Ser. 2016, 753, 022020. [Google Scholar] [CrossRef] [Green Version]
- Van Kuik, G.A.M. Momentum theory of Joukowsky actuator discs with swirl. J. Phys. Conf. Ser. 2016, 753, 022021. [Google Scholar] [CrossRef]
- Ayati, A. Aerodynamic Effects on Wind Turbine Blades Using the Lifting-Line Theory. Ph.D. Thesis, Universitetet i Oslo, Oslo, Norway, 2010. [Google Scholar]
- Lamar, J. A Modified Multhopp Approach for Predicting Lifting Pressures and Camber Shape for Composite Planforms in Subsonic Flow. 2018. Available online: https://ntrs.nasa.gov/archive/nasa/casi.ntrs.nasa.gov/19680022043.pdf (accessed on 15 July 2018).
- Lutz, T. Flugzeug-Aerodynamik; Universität Stuttgart: Stuttgart, Germany, 2014. [Google Scholar]
- Sutrisno, S.; Deendarlianto, D.; Indarto, I.; Iswahyudi, S.; Bramantya, M.A.; Wibowo, S.B. Performances and Stall Delays of Three Dimensional Wind Turbine Blade Plate-Models with Helicopter-Like Propeller Blade Tips. Mod. Appl. Sci. 2017, 11, 189. [Google Scholar] [CrossRef]
- Kesler, R. Propeller Thrust Analysis Using Prandtl’s Lifting Line Theory, A Comparison between the Experimental Thrust and the Thrust Predicted by Prandtl’s Lifting Line Theory. Master’ Thesis, The University of Utah, Salt Lake City, UT, USA, August 2014. [Google Scholar]
- Abedi, H. Development of Vortex Filament Method for Aerodynamic Loads on Rotor Blades; Chalmers University of Technology: Othenburg, Sweden, 2013. [Google Scholar]
- de Oliveira, G.; Pereira, R.B.; Ragni, D.; Avallone, F.; van Bussel, G. How does the presence of a body affect the performance of an actuator disk? J. Phys. Conf. Ser. 2016, 753, 1–11. [Google Scholar] [CrossRef]
- Plaza, B.; Bardera, R.; Visiedo, S. Comparison of BEM and CFD results for Mexico rotor aerodynamics. J. Wind Eng. Ind. Aerodyn. 2015, 145, 115–122. [Google Scholar] [CrossRef]
- Bai, C.J.; Hsiao, F.B.; Li, M.H.; Huang, G.Y.; Chen, Y.J. Design of 10 kw horizontal-axis wind turbine (HAWT) blade and aerodynamic investigation using numerical simulation. Procedia Eng. 2013, 67, 279–287. [Google Scholar] [CrossRef]
- Chehouri, A.; Younes, R.; Ilinca, A.; Perron, J. Review of performance optimization techniques applied to wind turbines. Appl. Energy 2015, 142, 361–388. [Google Scholar] [CrossRef]
- Singh, R.K.; Ahmed, M.R. Blade design and performance testing of a small wind turbine rotor for low wind speed applications. Renew. Energy 2013, 50, 812–819. [Google Scholar] [CrossRef]
- Tusavul, S.A. Radical Innovations in Wind Turbine Blade Design. Master’ Thesis, Tufts University, Medford, MA, USA, 2014. [Google Scholar]
- Velázquez, M.T.; Carmen, M.V.D.; Francis, J.A.; Pacheco, L.A.M.; Eslava, G.T. Design and experimentation of a 1 mw horizontal axis wind turbine. J. Power Energy Eng. 2014, 2, 9–16. [Google Scholar] [CrossRef]
- Schubel, P.J.; Crossley, R.J. Wind turbine blade design. Energies 2012, 5, 3425–3449. [Google Scholar] [CrossRef]
- Faculty, T.A.; Lynch, C.E.; Fulfillment, I.P. Advanced CFD Methods for Wind Turbine Analysis. Ph.D. Thesis, Georgia Institute of Technology, Atlanta, GA, USA, 2011. [Google Scholar]
- Elfarra, M.A. Horizontal Axis Wind Turbine Rotor Blade: Winglet and Twist Aerodynamic Design and Optimization Using CFD a Thesis Submitted to the Graduate School of Natural and Applied Sciences of Middle East Technical University by Monier Ali Elfarra in Partial Fulfi. Ph.D. Thesis, Middle East Technical University, Ankara, Turkey, 2011. [Google Scholar]
- Baldacchino, D.; Manolesos, M.; Ferreira, C.; Salcedo, A.G.; Aparicio, M.; Chaviaropoulos, T.; Sørensen, N.N. Experimental benchmark and code validation for airfoils equipped with passive vortex generators. J. Phys. Conf. Ser. 2016, 753, 1–13. [Google Scholar] [CrossRef]
- Maniaci, D.C.; White, E.B.; Wilcox, B.; Langel, C.M.; van Dam, C.P.; Paquette, J.A. Experimental Measurement and CFD Model Development of Thick Wind Turbine Airfoils with Leading Edge Erosion. J. Phys. Conf. Ser. 2016, 753, 022013. [Google Scholar] [CrossRef] [Green Version]
- Perfilev, D. Methodology for Wind Turbine Blade Geometry Optimization. Ph.D. Thesis, Lappeenranta University of Technology, Lappeenranta, Finland, 2013. [Google Scholar]
- Lutz, T.; Wagner, S. Numerical Shape Optimization of Subsonic Airfoil Sections. In Proceedings of the European Congress on Computational Methods in Applied Sciences and Engineering ECCOMAS, Barcelona, Spain, 11–14 September 2000. [Google Scholar]
- Rahimi, H.; Hartvelt, M.; Peinke, J.; Schepers, J. Investigation of the validity of BEM for simulation of wind turbines in complex load cases and comparison with experiment and CFD. J. Phys. Conf. Ser. 2016, 749, 012015. [Google Scholar] [CrossRef] [Green Version]
- Sutrisno; Prajitno; Purnomo, W.; Setyawan, B. The Performance & Flow Visualization Studies of Three dimensional (3-D) Wind Turbine Blade Models. Mod. Appl. Sci. 2016, 10. [Google Scholar] [CrossRef]
- Sutrisno; Rochmat, T.A.; Wibowo, S.B.; Iswahyudi, S.; Wiratama, C.; Erlambang, D.B.M. The Rolled-up and Tip Vortices Studies in the CFD Model of the 3-D Swept-Backward Wind Turbine Blades. Mod. Appl. Sci. 2017, 11, 118. [Google Scholar] [CrossRef]
- Brocklehurst, A.; Barakos, G.N. A review of helicopter rotor blade tip shapes. Prog. Aerosp. Sci. 2013, 56, 35–74. [Google Scholar] [CrossRef]
- Dumitrescu, H.; Cardos, V. Inboard stall delay due to rotation. J. Aircr. 2012, 49, 101–107. [Google Scholar] [CrossRef]
- Hu, D.; Hua, O.; Du, Z. A study on stall-delay for horizontal axis wind turbine. Renew. Energy 2006, 31, 821–836. [Google Scholar] [CrossRef]
- Lee, H.M.; Wu, Y. An experimental study of stall delay on the blade of a horizontal-axis wind turbine using tomographic particle image velocimetry. J. Wind Eng. Ind. Aerodyn. 2013, 123, 56–68. [Google Scholar] [CrossRef]
- Sicot, C.; Devinant, P.; Loyer, S.; Hureau, J. Rotational and turbulence effects on a wind turbine blade. Investigation of the stall mechanisms. J. Wind Eng. Ind. Aerodyn. 2008, 96, 1320–1331. [Google Scholar] [CrossRef]
- Wu, Y.; Mun, H.; Tang, H. A study of the energetic turbulence structures during stall delay. Int. J. Heat Fluid Flow 2015, 54, 183–195. [Google Scholar] [CrossRef]
- Yu, G.; Shen, X.; Zhu, X.; Du, Z. An insight into the separate flow and stall delay for HAWT. Renew. Energy 2011, 36, 69–76. [Google Scholar] [CrossRef]
- Gursul, I.; Gordnier, R.; Visbal, M. Unsteady aerodynamics of nonslender delta wings. Prog. Aerosp. Sci. 2005, 41, 515–557. [Google Scholar] [CrossRef] [Green Version]
- Gursul, I.; Wang, Z.; Vardaki, E. Review of flow control mechanisms of leading-edge vortices. Prog. Aerosp. Sci. 2007, 43, 246–270. [Google Scholar] [CrossRef] [Green Version]
- Chattot, J.J. Effects of blade tip modifications on wind turbine performance using vortex model. Comput. Fluids 2009, 38, 1405–1410. [Google Scholar] [CrossRef]
- Pavese, C.; Kim, T.; Murcia, J.P. Design of A Wind Turbine Swept blade Through Extensive Load Analysis. Renew. Energy 2016, 102, 21–34. [Google Scholar] [CrossRef]
- Adegas, F.D.; Pena, G.D.M.; Antonio, J.; Alé, V.; Simioni, G.S. Power curve of small wind turbine generators–Laboratory and field testing. In Proceedings of the RIO 3-World Climate Energy Event, Rio de Janeiro, Brazil, 1–5 December 2003; pp. 1–5. [Google Scholar]
- Calderon, D.E.; Wang, Z.; Gursul, I. Three-dimensional measurements of vortex breakdown. Exp. Fluids 2012. [Google Scholar] [CrossRef] [Green Version]
- Haller, G. An objective definition of a vortex. J. Fluid Mech. 2005, 525, 1–26. [Google Scholar] [CrossRef]
- Muscari, R.; Di Mascio, A.; Verzicco, R. Modeling of vortex dynamics in the wake of a marine propeller. Comput. Fluids 2013, 73, 65–79. [Google Scholar] [CrossRef]
- Zhang, R.-K.; Wu, V.D.J.-Z. Aerodynamic characteristics of wind turbine blades with a sinusoidal leading edge. Wind Energy 2011, 15, 407–424. [Google Scholar] [CrossRef]
- Ibrahim, I.; New, T. Flow Separation Control of Marine Propeller Blades through Tubercle Modifications. In Proceedings of the 10th Pacific Symposium on Flow Visualization and Image Processing, Naples, Italy, 15–18 June 2015. [Google Scholar]
- Han, C.; Kinnas, S.A. Study on the wake shape behind a wing in ground effect using an unsteady discrete vortex panel method. Open J. Fluid Dyn. 2013, 3, 261–265. [Google Scholar] [CrossRef]
- Cai, J.; Tsai, H.-M.; Luo, S.; Liu, F. Design of an optimal wing-body configuration to delay onset of vortex asymmetry. AIAA J. 2011, 49, 164–171. [Google Scholar] [CrossRef]
- Bangga, G.; Weihing, P.; Lutz, T.; Krämer, E. Effect of computational grid on accurate prediction of a wind turbine rotor using delayed detached-eddy simulations. J. Mech. Sci. Technol. 2017, 31, 2359–2364. [Google Scholar] [CrossRef]
- Kim, B.; Kim, W.; Bae, S.; Park, J.; Kim, M. Aerodynamic design and performance analysis of multi-mw class wind turbine blade. J. Mech. Sci. Technol. 2011, 25, 1995–2002. [Google Scholar] [CrossRef]
- Rehman, S.; Alam, M.; Alhems, L.; Rafique, M. Horizontal Axis Wind Turbine Blade Design Methodologies for Efficiency Enhancement-A Review. Energies 2018, 11, 506. [Google Scholar] [CrossRef]
- Ashuri, T. Beyond Classical Upscaling: Integrated Aeroservoelastic Design and Optimization of Large Offshore Wind Turbines. Ph.D. Thesis, Tufts University, Medford, MA, USA, 2012. [Google Scholar]
- McDonough, J.M. Lectures in Elementary Fluid Dynamics: Physics, Mathematics and Applications; University of Kentucky: Lexington, KY, USA, 2009. [Google Scholar]
- Brar, J.S.; Bansal, R.K. A Text Book of Theory of Machines; Laxmi Publications: New Delhi, India, 2004. [Google Scholar]
- Sutrisno, S.; Iswahyudi, S.; Wibowo, S.B.; Kartika, W.; Qomar, F. Field Performance Measurement of Small-Scale Three-Dimensional (3-D) Wind Turbines. In Proceedings of the 9th International Conference on Thermofluids, Yogyakarta, Indonesia, 9–10 November 2017. [Google Scholar]
Figure 1.
Designed pitch and normalized chord lengths spanwise.

Figure 2.
Calculated performance of the design was approximated by the blade element method (BEM).

Figure 3.
Three-dimensional printed models of the rotors with a radius of 0.19 m. (a) The blade has a backward swept at its tip; (b) the blade has a helicopter-head blade tip.
Figure 3.
Three-dimensional printed models of the rotors with a radius of 0.19 m. (a) The blade has a backward swept at its tip; (b) the blade has a helicopter-head blade tip.

Figure 4.
Test schematic in wind tunnel.

Figure 5.
Measurement set-up in wind tunnel.

Figure 6.
Field measurement set-up [54].
Figure 6.
Field measurement set-up [54].

Figure 7.
Torque measurement results of the rotor with a radius of 0.14 m.

Figure 8.
Torque measurement results of the rotor with a radius of 0.19 m.

Figure 9.
Correlated torque associated with rotor diameters.

Figure 10.
Results of power measurement of the rotor with a diameter of 2.4 m in the field [54] and predicted power values by data correlation from small-scaled rotors.
Figure 10.
Results of power measurement of the rotor with a diameter of 2.4 m in the field [54] and predicted power values by data correlation from small-scaled rotors.

Figure 11.
The altered power coefficient of field rotor by wind-speed changes.

© 2018 by the authors. Licensee MDPI, Basel, Switzerland. This article is an open access article distributed under the terms and conditions of the Creative Commons Attribution (CC BY) license (http://creativecommons.org/licenses/by/4.0/).
Share and Cite
MDPI and ACS Style
Sutrisno; Iswahyudi, S.; Wibowo, S.B. Dimensional Analysis of Power Prediction of a Real-Scale Wind Turbine Based on Wind-Tunnel Torque Measurement of Small-Scaled Models. Energies 2018, 11, 2374. https://doi.org/10.3390/en11092374
AMA Style
Sutrisno, Iswahyudi S, Wibowo SB. Dimensional Analysis of Power Prediction of a Real-Scale Wind Turbine Based on Wind-Tunnel Torque Measurement of Small-Scaled Models. Energies. 2018; 11(9):2374. https://doi.org/10.3390/en11092374
Chicago/Turabian StyleSutrisno, Sigit Iswahyudi, and Setyawan Bekti Wibowo. 2018. "Dimensional Analysis of Power Prediction of a Real-Scale Wind Turbine Based on Wind-Tunnel Torque Measurement of Small-Scaled Models" Energies 11, no. 9: 2374. https://doi.org/10.3390/en11092374
Note that from the first issue of 2016, this journal uses article numbers instead of page numbers. See further details here.