1. Introduction
Physical wave tank tests play an important role in validating numerical results and testing devices under realistic and repeatable conditions. They are an important, while cost efficient, step in the development of a wave energy converter (WEC) before going to full scale. In this paper a new power take-off (PTO) design for floating point absorbers is presented which has been developed especially for wave tank tests.
Despite extensive research on wave energy during the last decades [
1], the levelized cost of energy is too high compared to other energy sources [
2]. One way of lowering these costs is to simplify the mechanical design of the wave energy converter, and here especially the power take off (PTO) [
3]. One notable WEC design, which was also the inspiration for the WEC presented here, is the floating point absorber with linear generator, for example developed at Uppsala University [
4] (UU-WEC), CorPower [
5] or the Archimedes Wave Swing [
6]. A disadvantage of most of these devices, is the high natural frequency, leading to a poor capture width for sea states with long wave energy periods, if no additional control [
7] or similar mechanism [
8,
9] is applied.
A simple way to increase the natural frequency occurred while developing a power take-off device (PTO) mimicking an ideal generator for model scale wave tank tests of WEC arrays. Existing physical scale models of WECs can roughly be divided into two groups: Simple and cost-effective models neglecting the generator force or replacing it with a constant friction [
10], while advanced scale models may use electric actuators mimicking the generator [
11,
12,
13,
14]. The latter may mimic the generator behaviour very well, but relays heavily on a good control system. For the purpose of working under time-constraints with several physical scale WECs, a motor-based approach, seemed too complex and too susceptible to faults. But on the same side, when concentrating on the absorbed power a high accurate generator model is indispensable.
The physical model presented here combines the simplicity and cost-efficiency of inaccurate models, whilst providing a nearly ideal damping force and an improved power absorption. This is done by combining two fundamental concepts used for PTOs: The alternating linear generator and the unidirectional rotatory generator. Using rotatory generators for wave power requires a gearbox (hydraulic, pneumatic [
15] or mechanical [
16,
17]), transforming the linear alternating motion of the wave into a unidirectional rotatory motion. Direct-driven linear generators on the other hand generate the electric energy directly from the alternating motion without the losses of a gearbox, but require a rectifier for grid integration [
15]. For the physical model presented here, a direct-driven alternating rotatory PTO is used, that does not require a complex gearbox and has a much higher inertia than direct-driven linear generators or unidirectional rotatory generator. Direct-driven rotatory generators converters for low speeds, but with unidirectional motion, play already a significant role in wind power [
18,
19] and were also tested for WECs [
16]. Bi-directional direct-driven rotary converts however can be hardly found [
20,
21]. In this paper the characteristics of such a PTO, and especially the influence of the high inertia, compared to a direct-driven linear generator will be investigated. A similar analysis of the influence of the inertia on the absorbed power, but for a cylindrical bottom-hinged WEC was performed in [
22], while the effects in resonance frequency between fixed and self referenced point absorber are discussed in [
23].
PTO concepts using rotational electrical generators have been considered previously by a number of developers:
An innovative approach using a rotatory generator for wave energy and tuning the natural frequency is discussed in [
9], where a pendulum excited by the heave motion of the WEC turns a rotatory generator. The pendulum can be designed, so that it is in resonance at the frequency of the incident wave and so the power absorption is maximised.
The dynamo presented in [
16] converts the bi-directional movement of the buoy into a unidirectional rotation for the generator what might result in similar inertia effects as the PTO presented here. However, the design requires a complex gearbox and a rectifier to make the pulsed output of the WEC grid conforming. The effects of the increased inertia on the power absorption are not investigated.
Concepts based on flywheels, like in [
17] (and similarly in [
24,
25]) convert the linear bi-directional motion of the buoy into a bi-directional rotation, but the generator connected to a flywheel is run in uni-directional motion. A controllable clutch connects the generator with the buoy shaft whenever it might accelerate the generator shaft. In the meantime the generator is run by the energy stored in the flywheel. As the generator’s angular velocity does not follow the buoy’s velocity, it does not show the high inertia of the alternating generator and is only able to absorb energy while the buoy is moving downwards. The power output is very smooth and may need no or only little smoothing to be grid compatible, and so the peak-to-average power ratio is much lower than in conventional WEC designs.
A bi-directional winch based design, similar to the concept presented here, but with a gearbox and the PTO placed in the buoy is used in the WEC described in [
21]. The generator is a conventional electrical machine used in industrial servo applications. It only produces power while moving upwards and operates in motoring mode during downwards motion.
In this paper a numerical simulation and wave tank experiments were used to characterise the system. The numerical time-domain model uses linear potential flow theory to calculate the absorbed power of floating point absorber with ideal generator for different inertiae and damping coefficients. The physical model is characterised with experiments in the Ocean Basin in the COAST Laboratory at the University of Plymouth are conducted to test the influence of the inertia in different sea states.
In the following section the scale PTO model will be presented, showing its characteristics in comparison to a linear generator PTO. Theoretical background on wave body interactions, used for the numerical simulation, is given in
Section 3. In
Section 4 the physical and in
Section 5 the numerical test set-up are presented, the results and their discussion can be found in
Section 6, before the conclusions are drawn in
Section 7. Unless otherwise stated, all values in this paper refer to a full scale device, values obtained from the scale model are presented as full scale values using Froude scaling.
2. Design of the Physical Model PTO
The most important goal during the design of the physical scale PTO was a linear behaviour to ease the comparison of theoretical and practical results. High friction is often a problem in scale model tests and therefore it is necessary to aim for a low friction design. For the design of the PTO the issue is addressed by using a rotational generator, assuming that a low friction rotation bearing can be easier achieved than an equivalent translational bearing. Furthermore, having a rotational design, all deviations will reappear after each turn, what simplifies the identification, and the stroke length, which can influence the power absorption significantly [
26], can easily be extended. For hassle free utilisation in wave tank tests, the PTO should be easy to install and operate and, regarding array tests, cost-efficient and easy to replicate. This is achieved by using mostly standard parts.
To get an accurate and cost-effective speed-proportional damping, different principles are examined:
Viscous dampers create an accurate damping force by forcing a fluid through a small hole. The damping can be changed by varying the hole diameter.
Eddy-current breaks provide a nearly ideal, contactless velocity proportional force by moving a conductive material through a magnetic field. The damping can be adjusted by varying the magnetic field.
Small permanent electric generators, like automotive alternators or bicycle hub dynamos are cost effective and provide the absorbed power directly.
We choose the eddy current break, as it is, despite its simplicity, the most accurate principle and has been successfully used in scale models [
27,
28]. Viscous dampers were occasionally used to simulate PTO forces [
29], but their damping depends on the temperature, as the viscosity of most fluids changes significantly with the temperature, so monitoring the temperature is necessary for accurate results. Using a real generator comes with the advantage, that the absorbed power can be measured directly, rather than be calculated from the velocity. On the other hand, the characteristics of bicycle dynamos or car alternators differs from the three phase synchronous generator used in many direct-driven full scale WECs; static and dynamic friction, cogging forces, hysteresis, saturation are individual parameters of a generator; for general research it is beneficial to use an ideal linear generator instead.
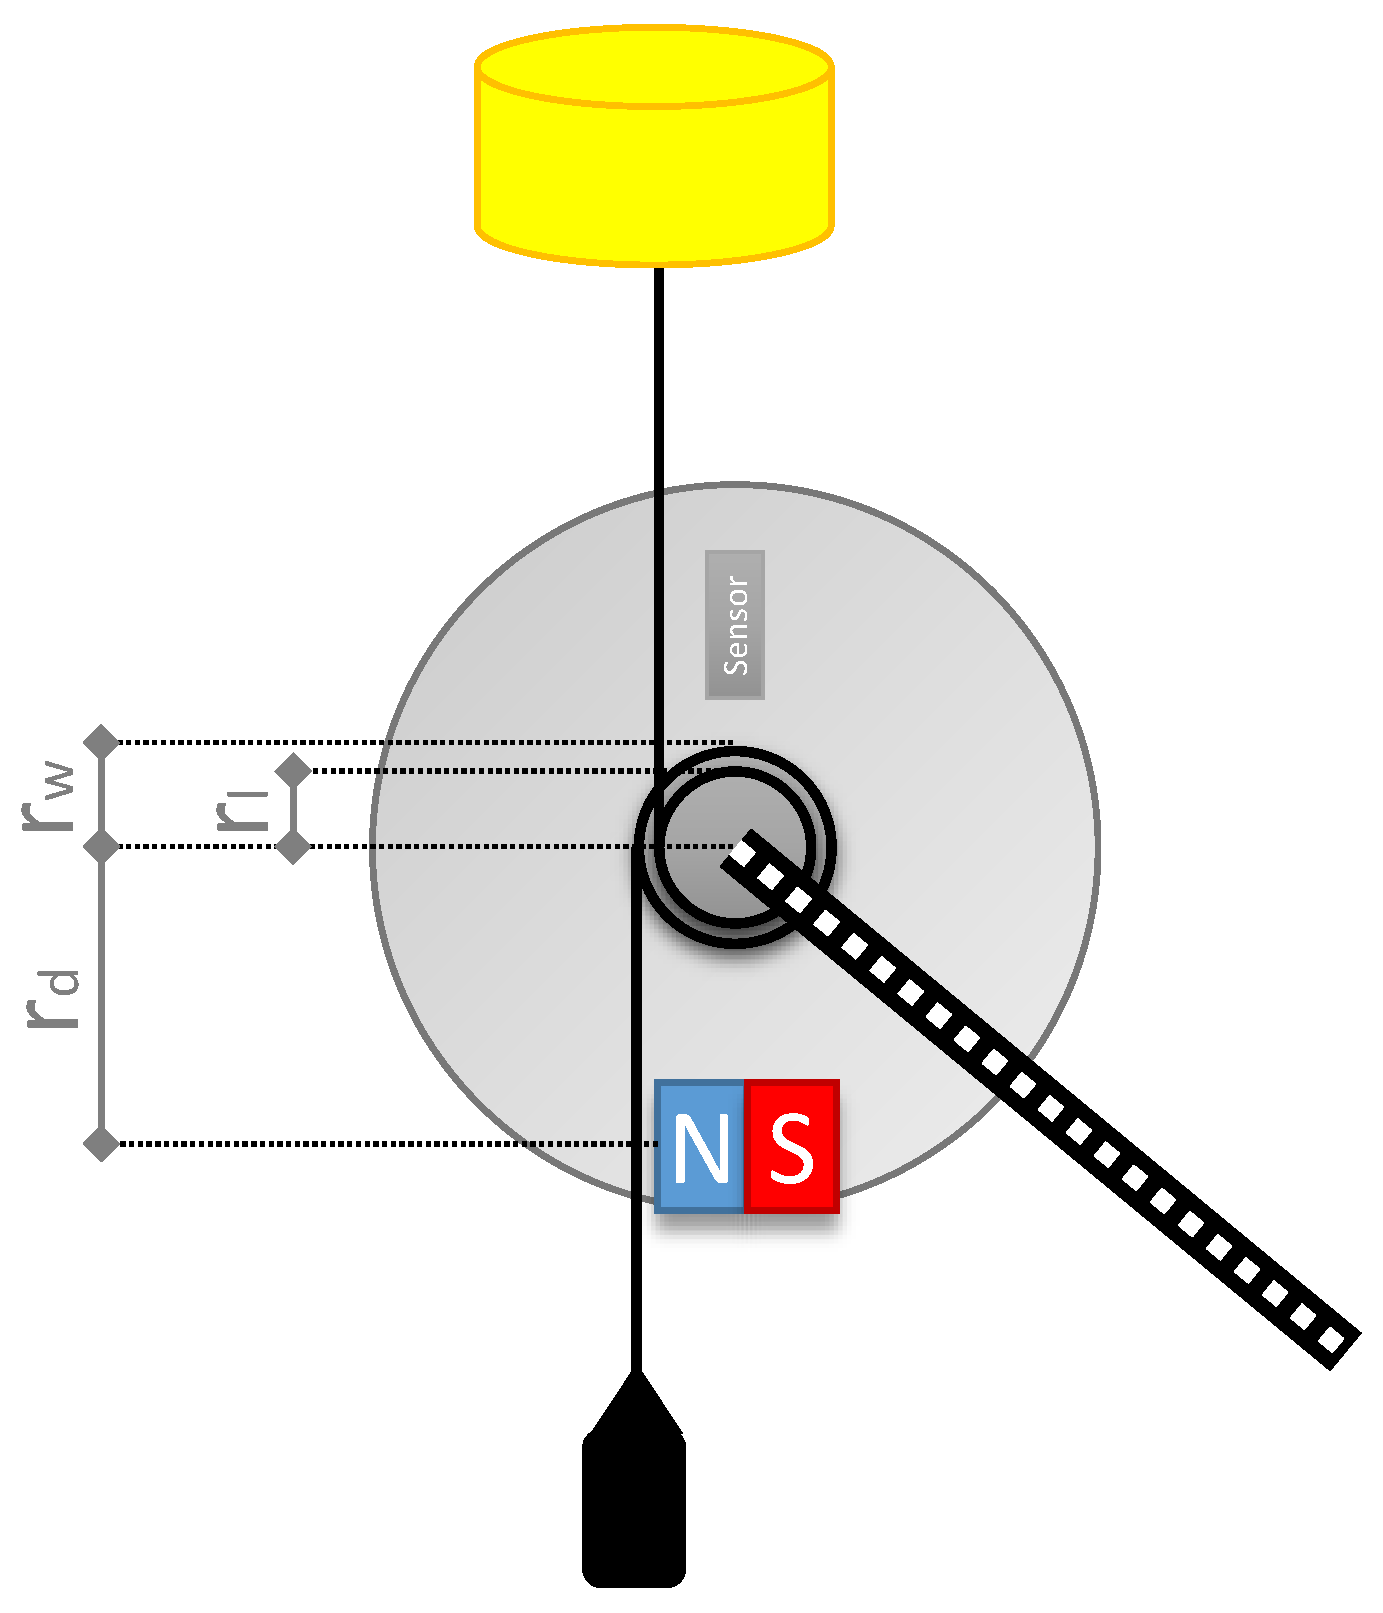
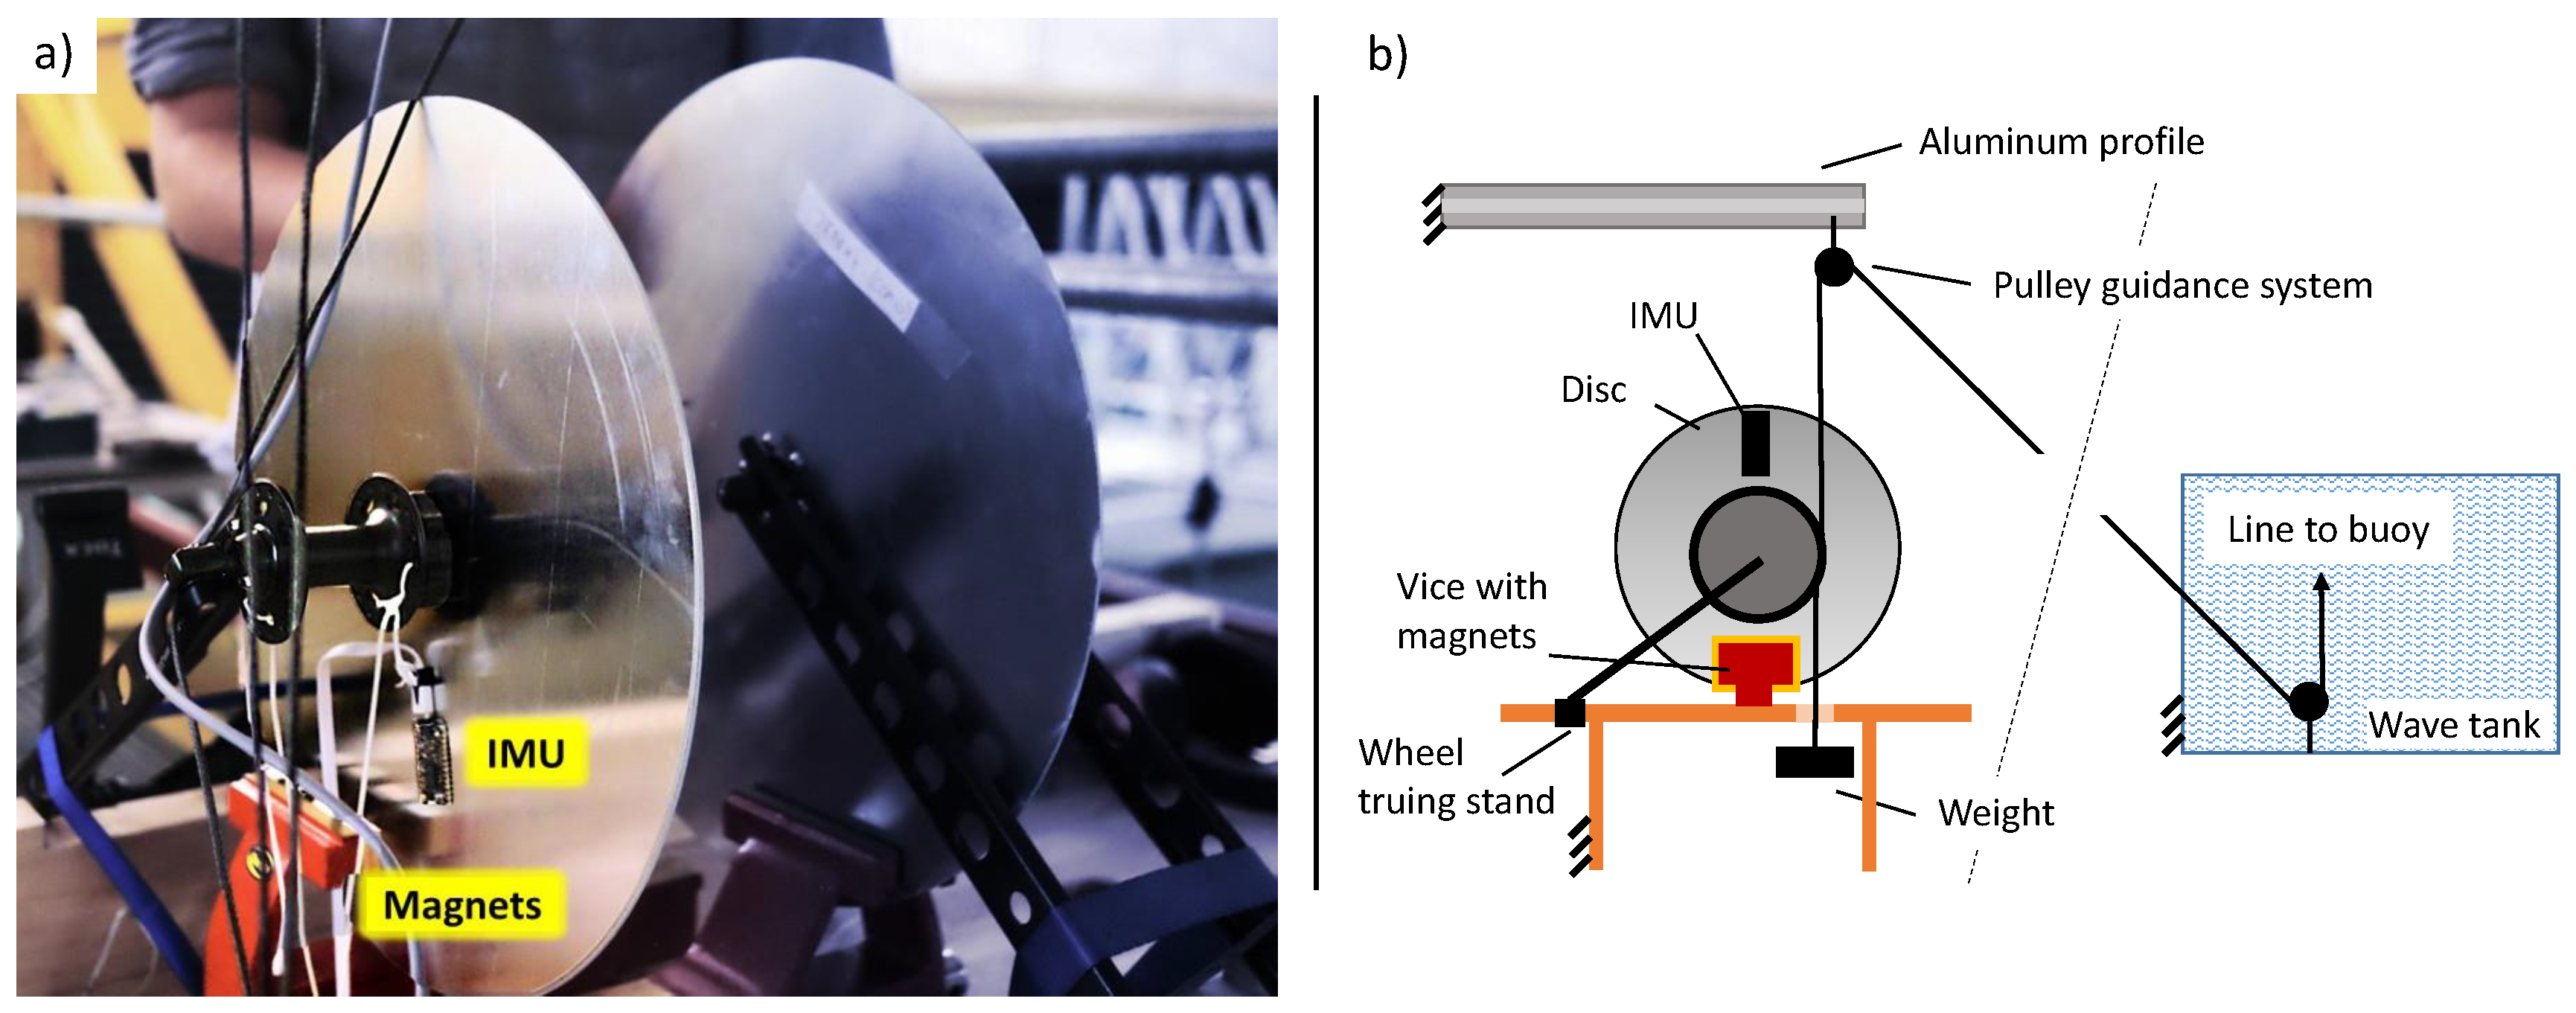
The final set-up developed consists of a bicycle wheel truing stand (Tacx T3175) screwed on a table; see the generalized sketch in
Figure 1 and the a photo and sketch of the device in the wave tank test in Figure 6 later in this paper. It is holding a bicycle front hub with disc break mounting holes (Shimano XT HB-M756). The bicycle hub has a low friction ball bearing. Instead of a disc break, a
thick aluminium disc with
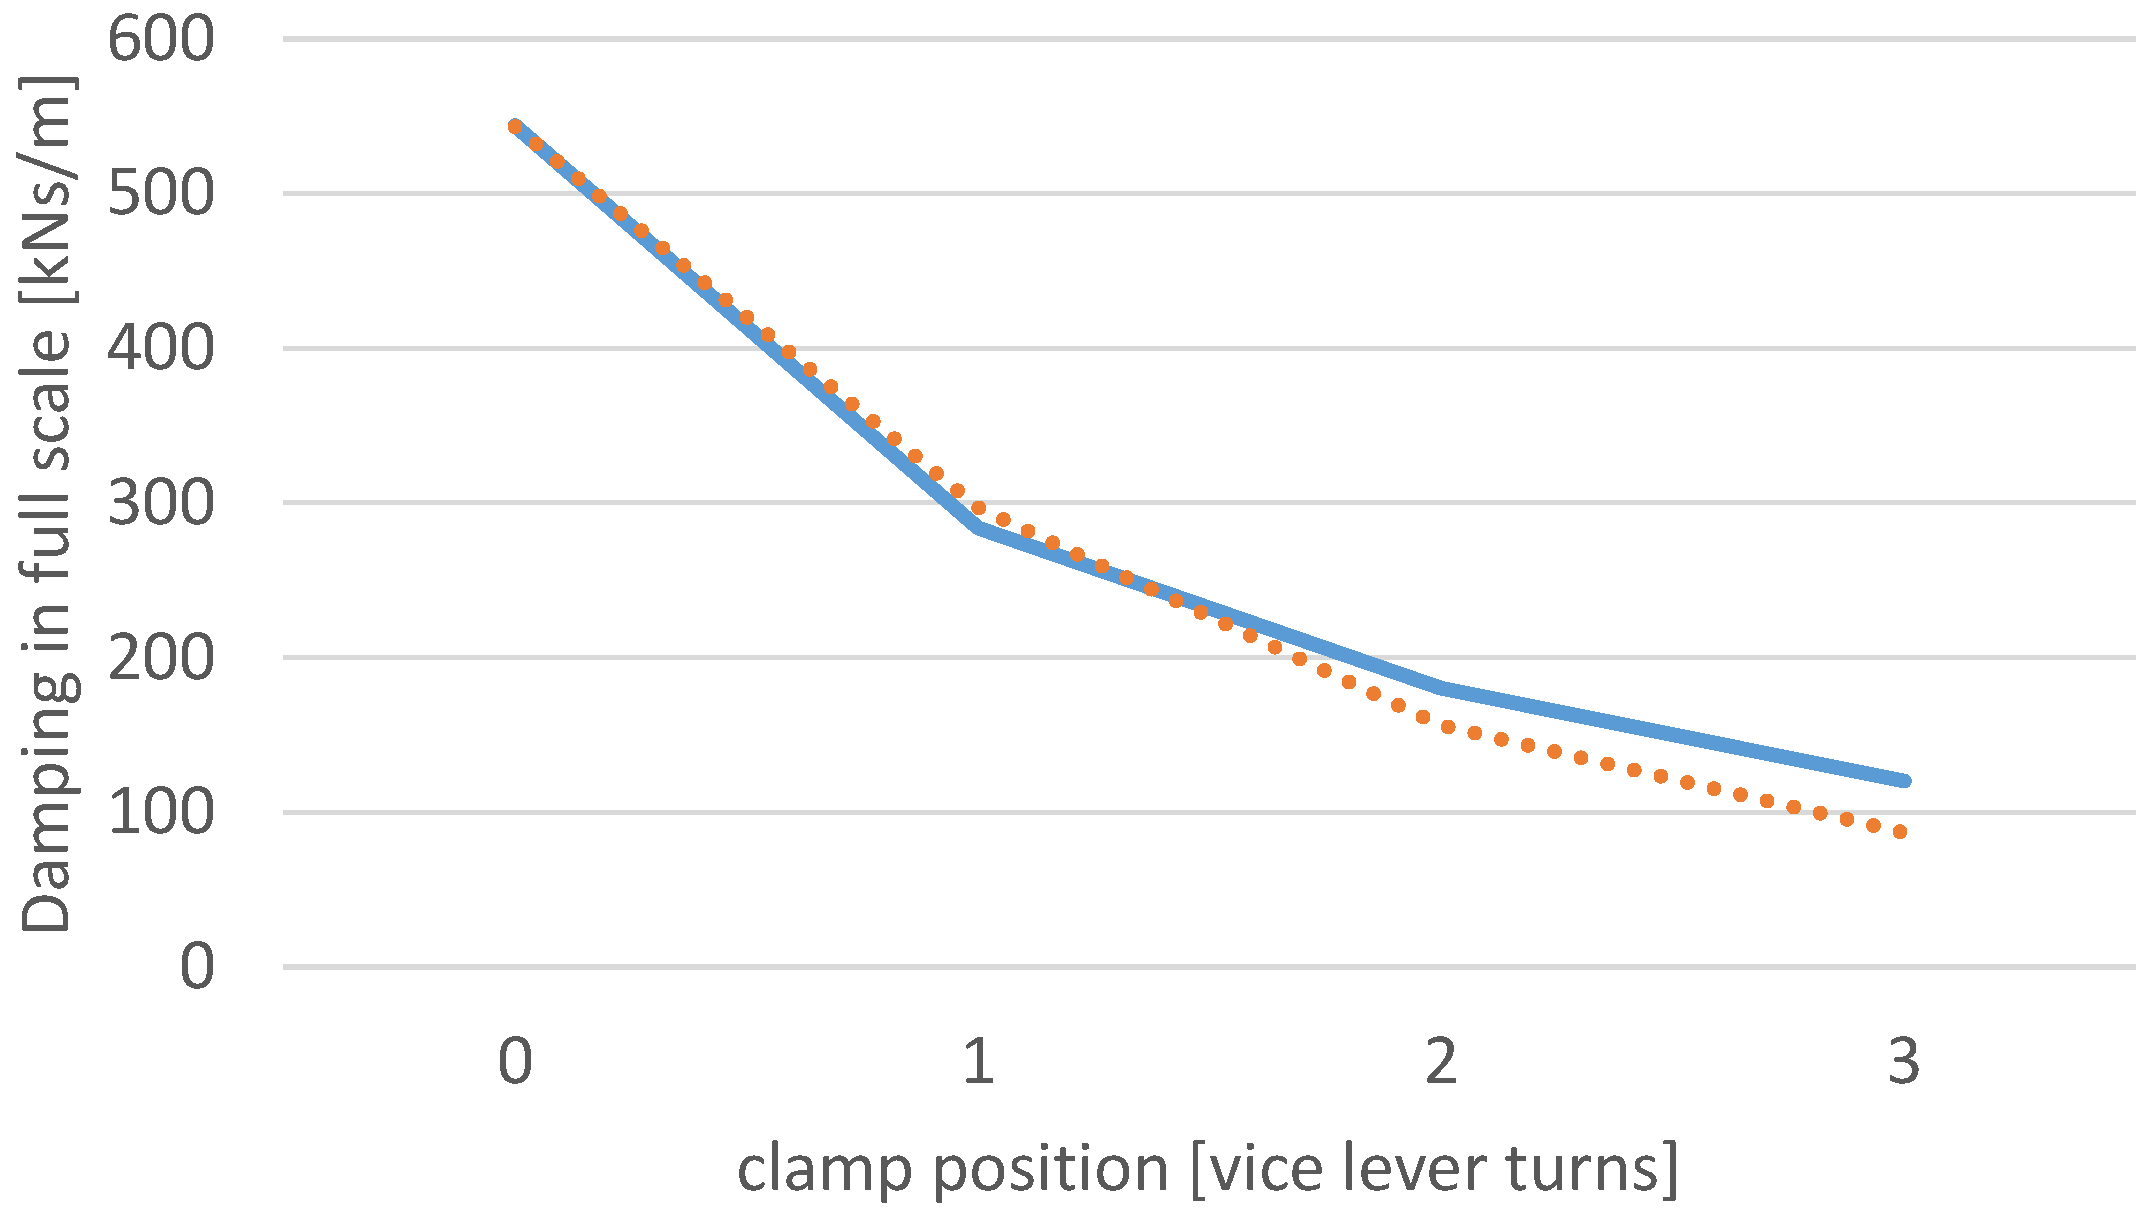
diameter is mounted. A vice (Clarke CSV4E 100 mm) is located on the table below the disc, the edge of the aluminium (AL1050) is positioned between its clamps. The movable clamp holds a set of magnets (5× Neodymium N42 20 × 20 × 10). Changing the gap between the clamps changes the magnetic flux through the disc and so the PTO damping
. An estimation of the magnetic flux in dependence of the air gap length
z is given in Equation (
1),
with
L,
W and
D being the length, width and thickness of the magnet and
its remanence field.
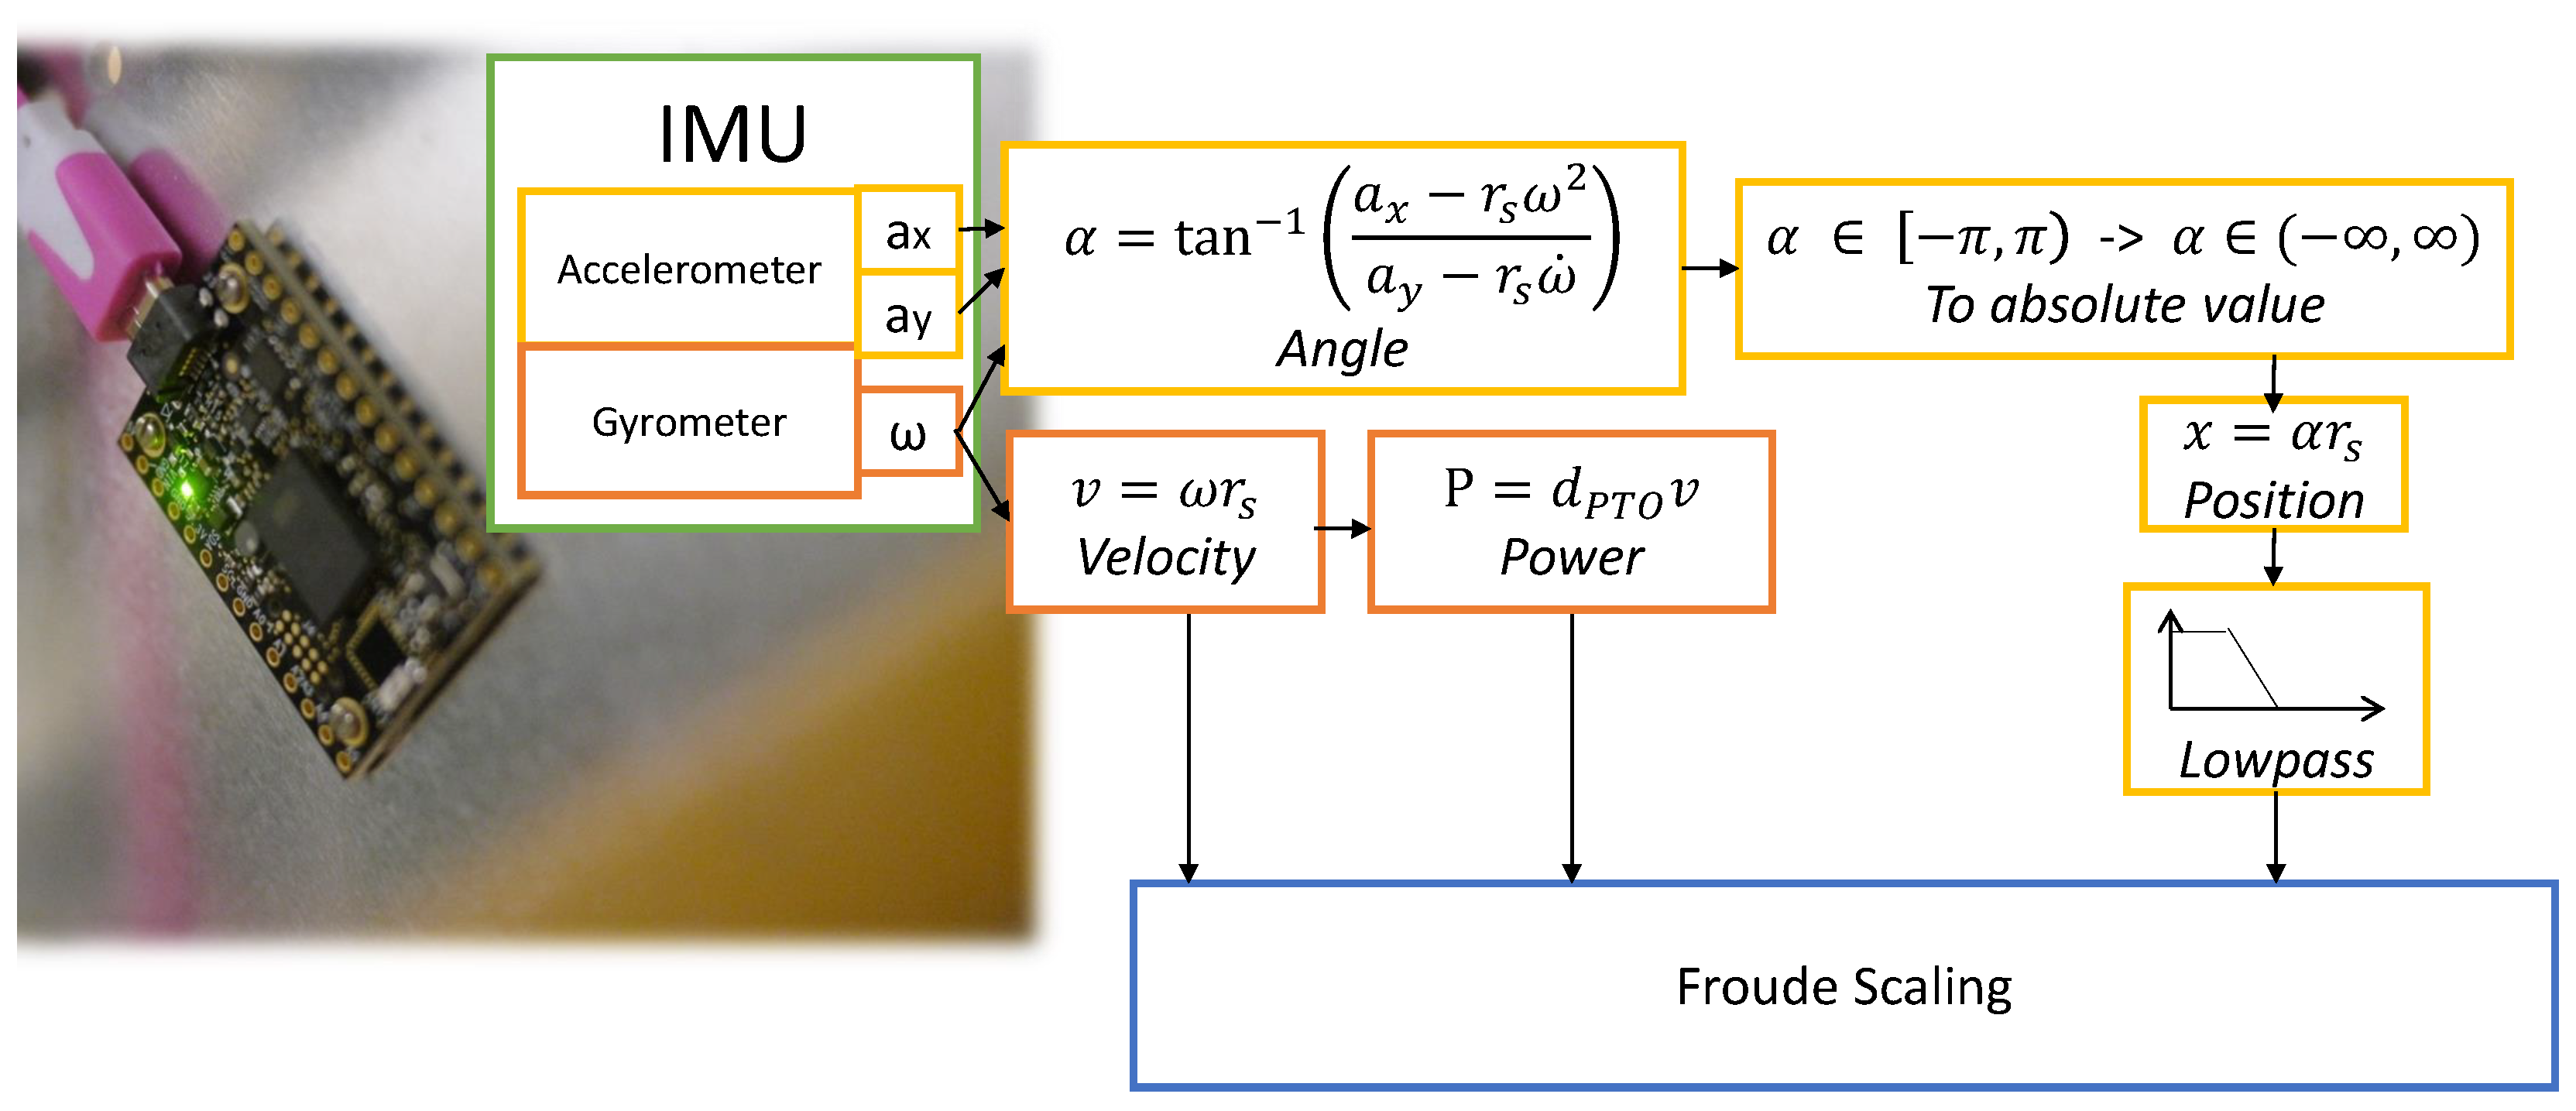
On the hub two ropes are installed, one is connected to the line going up to the buoy acting a positive moment on the hub, the other rope is connected to a weight acting as a counter moment on the hub. To capture the PTO position and speed, an Inertia Measurement Unit (IMU) based on the Intel Curie platform is mounted on the disc at distance
from the centre, recording acceleration in two directions and rotational speed. A similar position measurement system was used in [
30]. Knowing acceleration (
,
) and rotational speed (
), the angle
of the disc can be calculated:
and so the power:
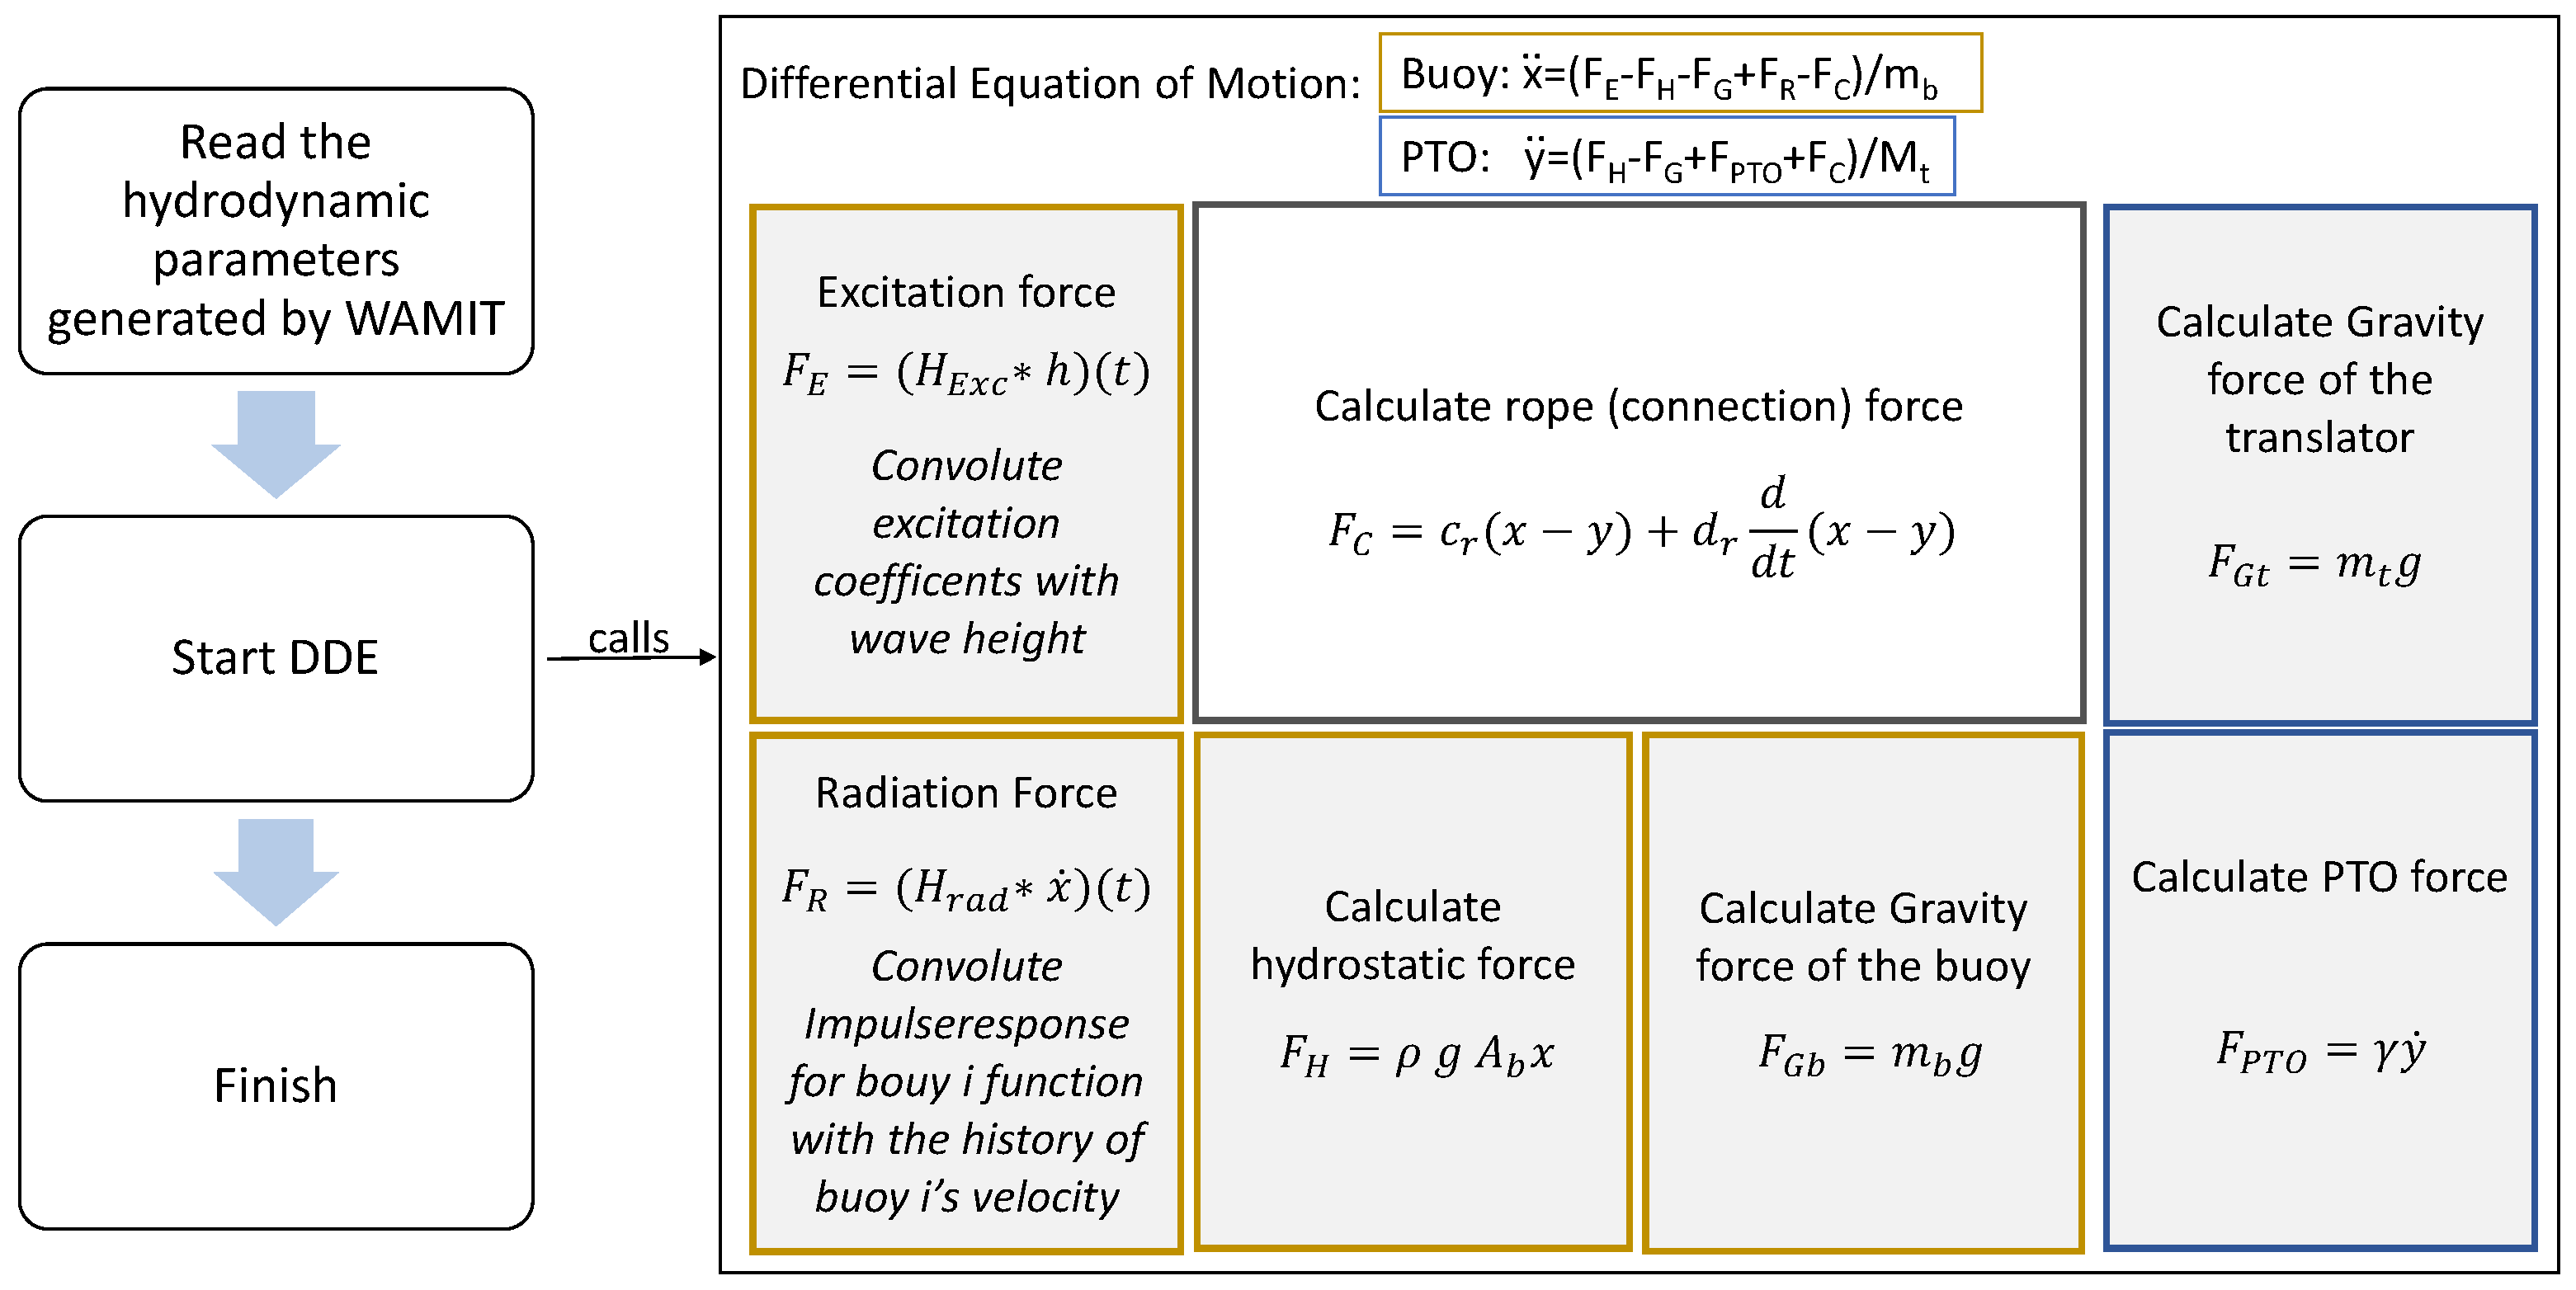
A detailed overview over the processing done can be found in
Figure 2.
2.1. Characteristics
A direct-driven linear generator, as used in many floating point absorbers wave energy converters is described by a mass-damper system. The force in the line
can be calculated as:
with
being the position of the weight,
the mass of the weight,
d the overall damping and g the gravity acceleration.
The line force
of a rotational electric generator as described above can be expressed as:
with
being the radius the rope to the weight winds to the disc,
being the radius the line to the buoy winds on the disc,
J is the moment of inertia of the rotor and
g being acceleration. A sketch with all relevant radii can be found in
Figure 1. Defining
and
, we get:
where
is the distance between the centre of the disc and the magnets. Comparing Equation (
4) with (
6), the gearbox effect of the disc can be seen: The applied damping
is amplified by the ratio
, thus for the 1:10
ratio in the physical scale model the magnetic field can be 100 times weaker than for a linear generator. Unlike the linear generator the weight pulling downwards
and the inertia of the PTO
M are not equal, latter includes also the disc inertia
. The inertia of a solid disc is:
with
being the radius of the disc,
being its density and
its thickness. By changing the ratio
, the disc can be designed to fit a specific inertia target.
2.2. Influence of Inertia on Absorbed Power
For simplification we assume the WEC to be a one body system with one degree of freedom (heave direction), assuming a stiff connection between buoy and the moving part of the PTO. In the presence of a flat water surface the system can be seen as an harmonic oscillator with the damped frequency:
where
k is the hydrostatic buoyancy stiffness of the buoy,
the total mass of inertia, including the mass and added mass of the buoy, the mass of the weights, the mass of the lines and the weight of the disc. The damping coefficient
d is the sum of the electrical damping coefficient of the PTO
and the hydrodynamical damping coefficient of the buoy. The optimal
d depends on the sea state [
7]. As
d has only a small influence compared to the natural frequency it is assumed to be fixed. Doing so the absorbed energy is proportional to the angular frequency respective velocity, and so:
From Equation (
9) follows that the most energy is absorbed when
Controlling a WEC so that Equation (
10) is always fulfilled, called complex conjugate control, requires an adjustable inertia or spring (an example for such and device can be found in [
5]), or a reactive generator. In many cases it may be enough, if the WEC is designed so that we get close to the condition of Equation (
10) for most sea states.
The hydrostatic buoyancy stiffness
k depends on the shape of the buoy. For a cylindrical buoy with radius
r,
k is
If we compare to a cylindrical buoy with a diameter of 5 m, which have been used by Uppsala University in the Lysekil project (UU-WEC) [
31],
k would be about
, according to Equation (
10) the inertia should be around
for the 3 s period and
for the 12 s case. For most WECs with direct-driven linear generators the total moving mass is much less (about 10 tonnes for the mentioned UU-WEC), as a higher mass makes the system, especially the deployment, very expensive. Those devices can be controlled by changing the generator damping or by latching the translator (which can be seen as a extreme form of the former). Both, especially damping control, are not as efficient as complex-conjugate control.
With the generator presented in this paper, changing the mass is possible by changing
. Regarding the trend to simplify devices to cut costs and increase reliability, in wave climates where the region of high energy sea states is centred around one sea state, it might be sufficient, if the WEC is designed so that it fulfils Equation (
10) only for this sea state.
Especially for direct-driven generators, changing the damped frequency of the system by changing the generator damping
is a cost effective way to adapt the WEC to different sea states [
32], but not as effective as changing the natural frequency. However, to achieve the optimal power absorption, both the natural frequency and the damping have to match the sea state.
Buoy and generator are connected with a line, in case the line is loose, both bodies can move independently. In that case Equation (
8) is not valid, as we have now two bodies with their own frequency. The linear approach is only valid if the line is stiff at all times.
2.3. Differences to Linear Generator
As a conclusion of this section, three differences between a rotational direct-driven generator compared to a linear one should be pointed out:
The damping is increased by factor for the rotational direct-driven generator, less magnets/coils are needed for the same damping.
If , the inertia of the rotatory PTO can be much higher with the same weight. The eigenfrequency decreases with the inertia.
The stroke length of the rotational PTO is not directly limited by the generator height.
For a rotatory motor a good bearing (e.g., roller bearing) is much easier to design than for a translatory generator. On the other hand, the force acting on the rotatory bearing is much higher than on a linear generator bearing. Furthermore a winch based rotatory generator has friction due to the rope unwinding.
3. Theory of Wave Body Interactions
In this paper, linear potential theory is used to describe the wave-body interaction, assuming an irrotational, incompressible fluid and non-steep waves. This assumption is a reasonable approximation for the non-steep, operational waves considered here [
33]. Using potential flow, a velocity potential
can be defined fulfilling the Laplace equation. The free kinematic and dynamic free surface boundary condition are:
where
is the surface elevation. The sea bed boundary condition is:
with
h being the height of the water surface above the sea bed.
The interaction between a buoy and a wave can be described with three waves: The excitation wave induces a force on the body, the movement of the buoy causes a radiated wave and the presence of the buoy’s shape is an obstacle for the incoming wave, resulting in a scattered wave.
The velocity potential is the sum of the undisturbed incident
, the scattered
and the radiated
part. The latter can be calculated from the motion of the buoy:
where
is the motion of the buoy in coordinate
j and
is the frequency of the wave. Integrating the velocity potential over the wetted surface
S results in the excitation force acting on the buoy:
with
being the normal vector in direction
j [
33,
34].
6. Results and Discussion
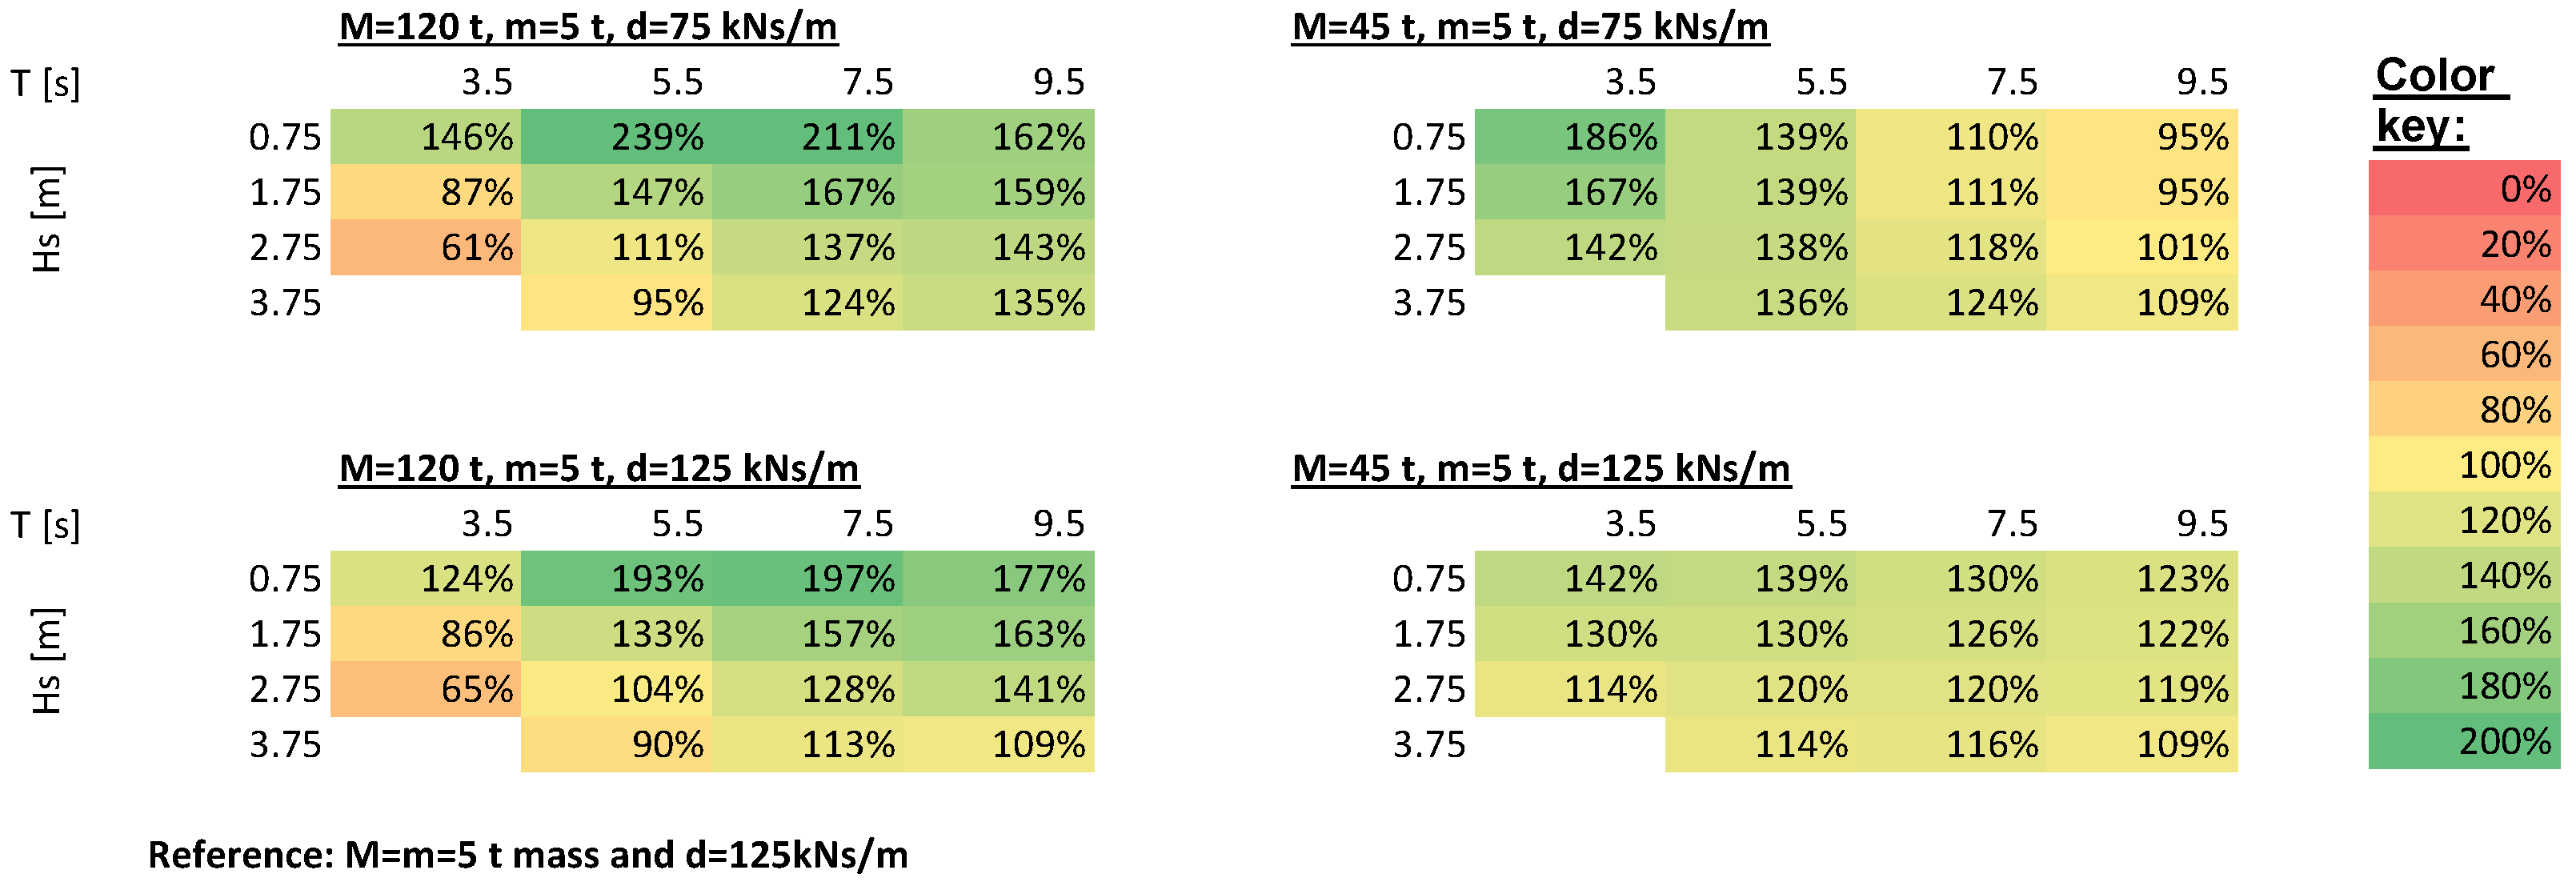
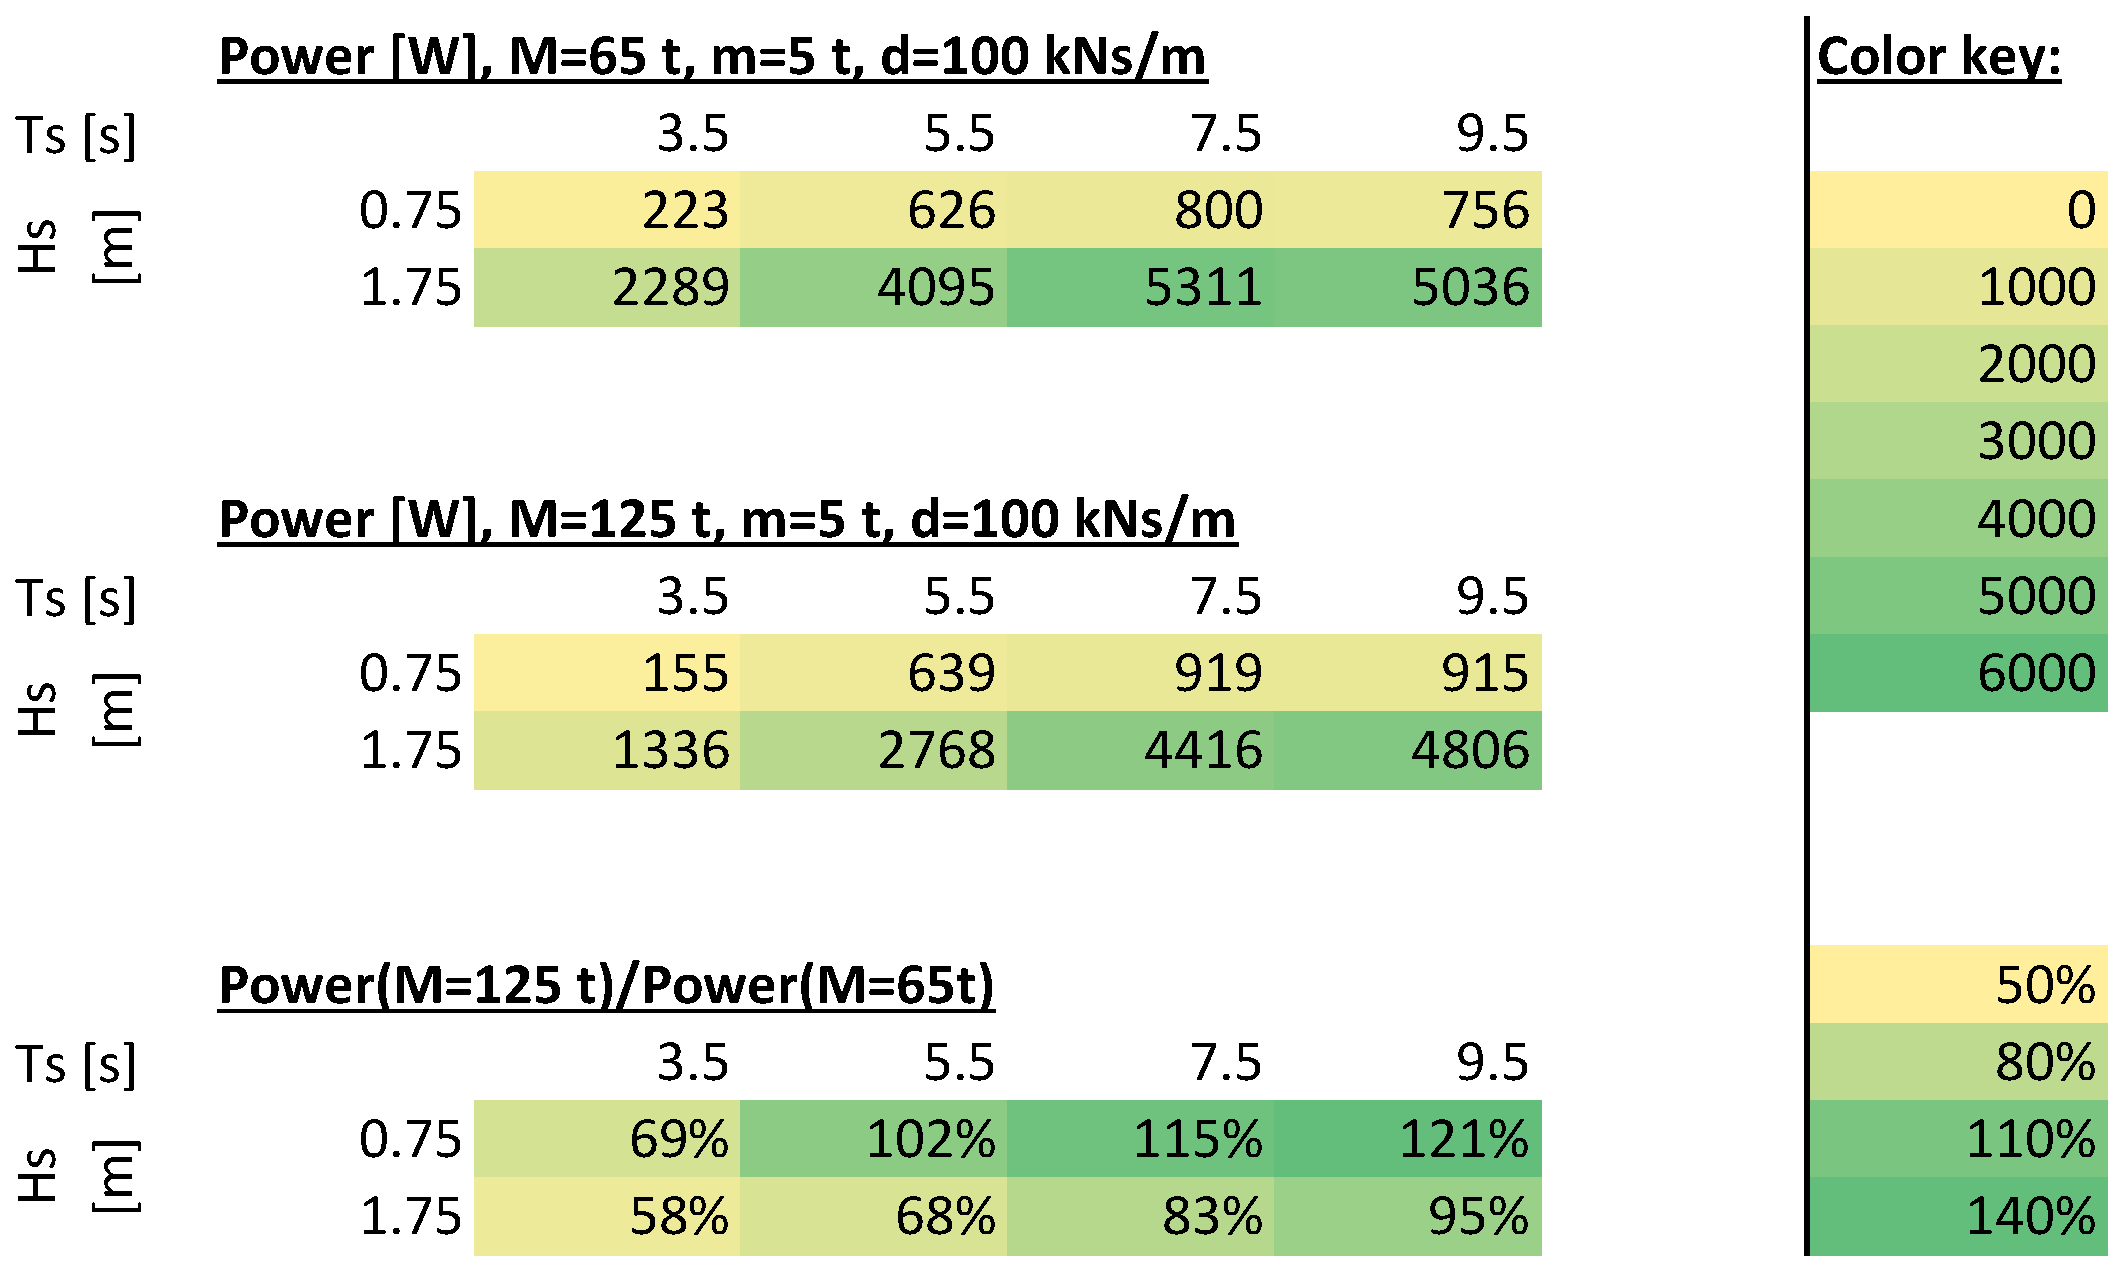
The simulated power matrix can be found in
Figure 8. For each inertia, a matrix with a low generator damping of
and a moderate damping of
is simulated. The power output of the high-inertia PTOs were set in relation to a PTO with
, which can be seen as a linear generator.
Figure 9 plots the velocity of the PTO with
and
.
Figure 10 shows the power matrices performed in the wave tank: The first matrix shows the absorbed power of the low inertia, the second matrix of the high inertia PTO; the third matrix shows the realtion between the low and high inertia PTO. The generator damping was fixed for all sea states to
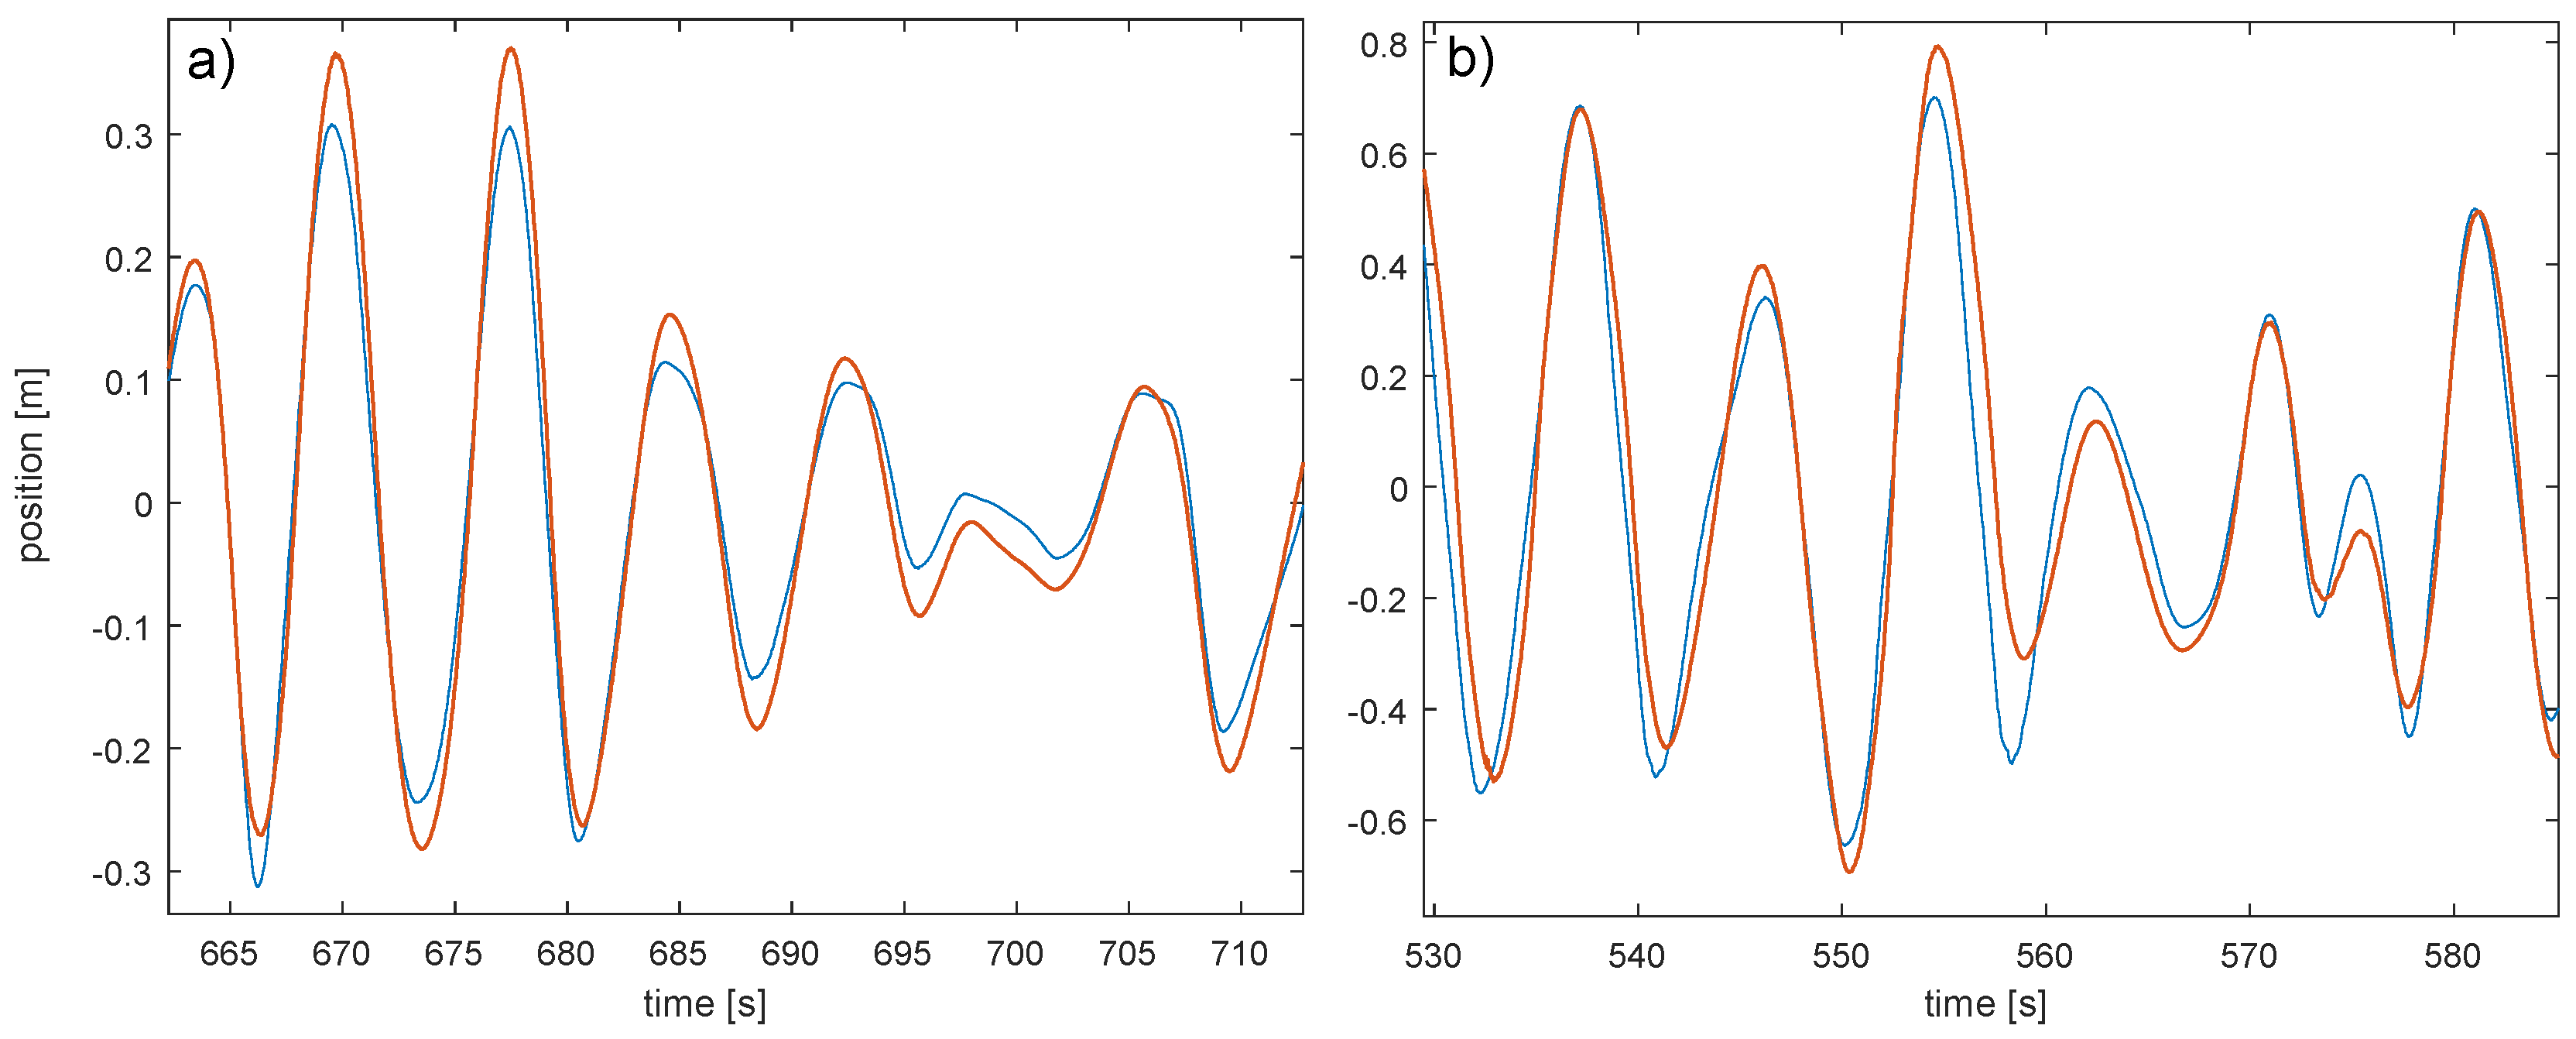
. The motion for both PTO in two sea states is plotted in
Figure 11. The recorded PTO data from the wave tank tests can be found in the
Supplementary Materials.
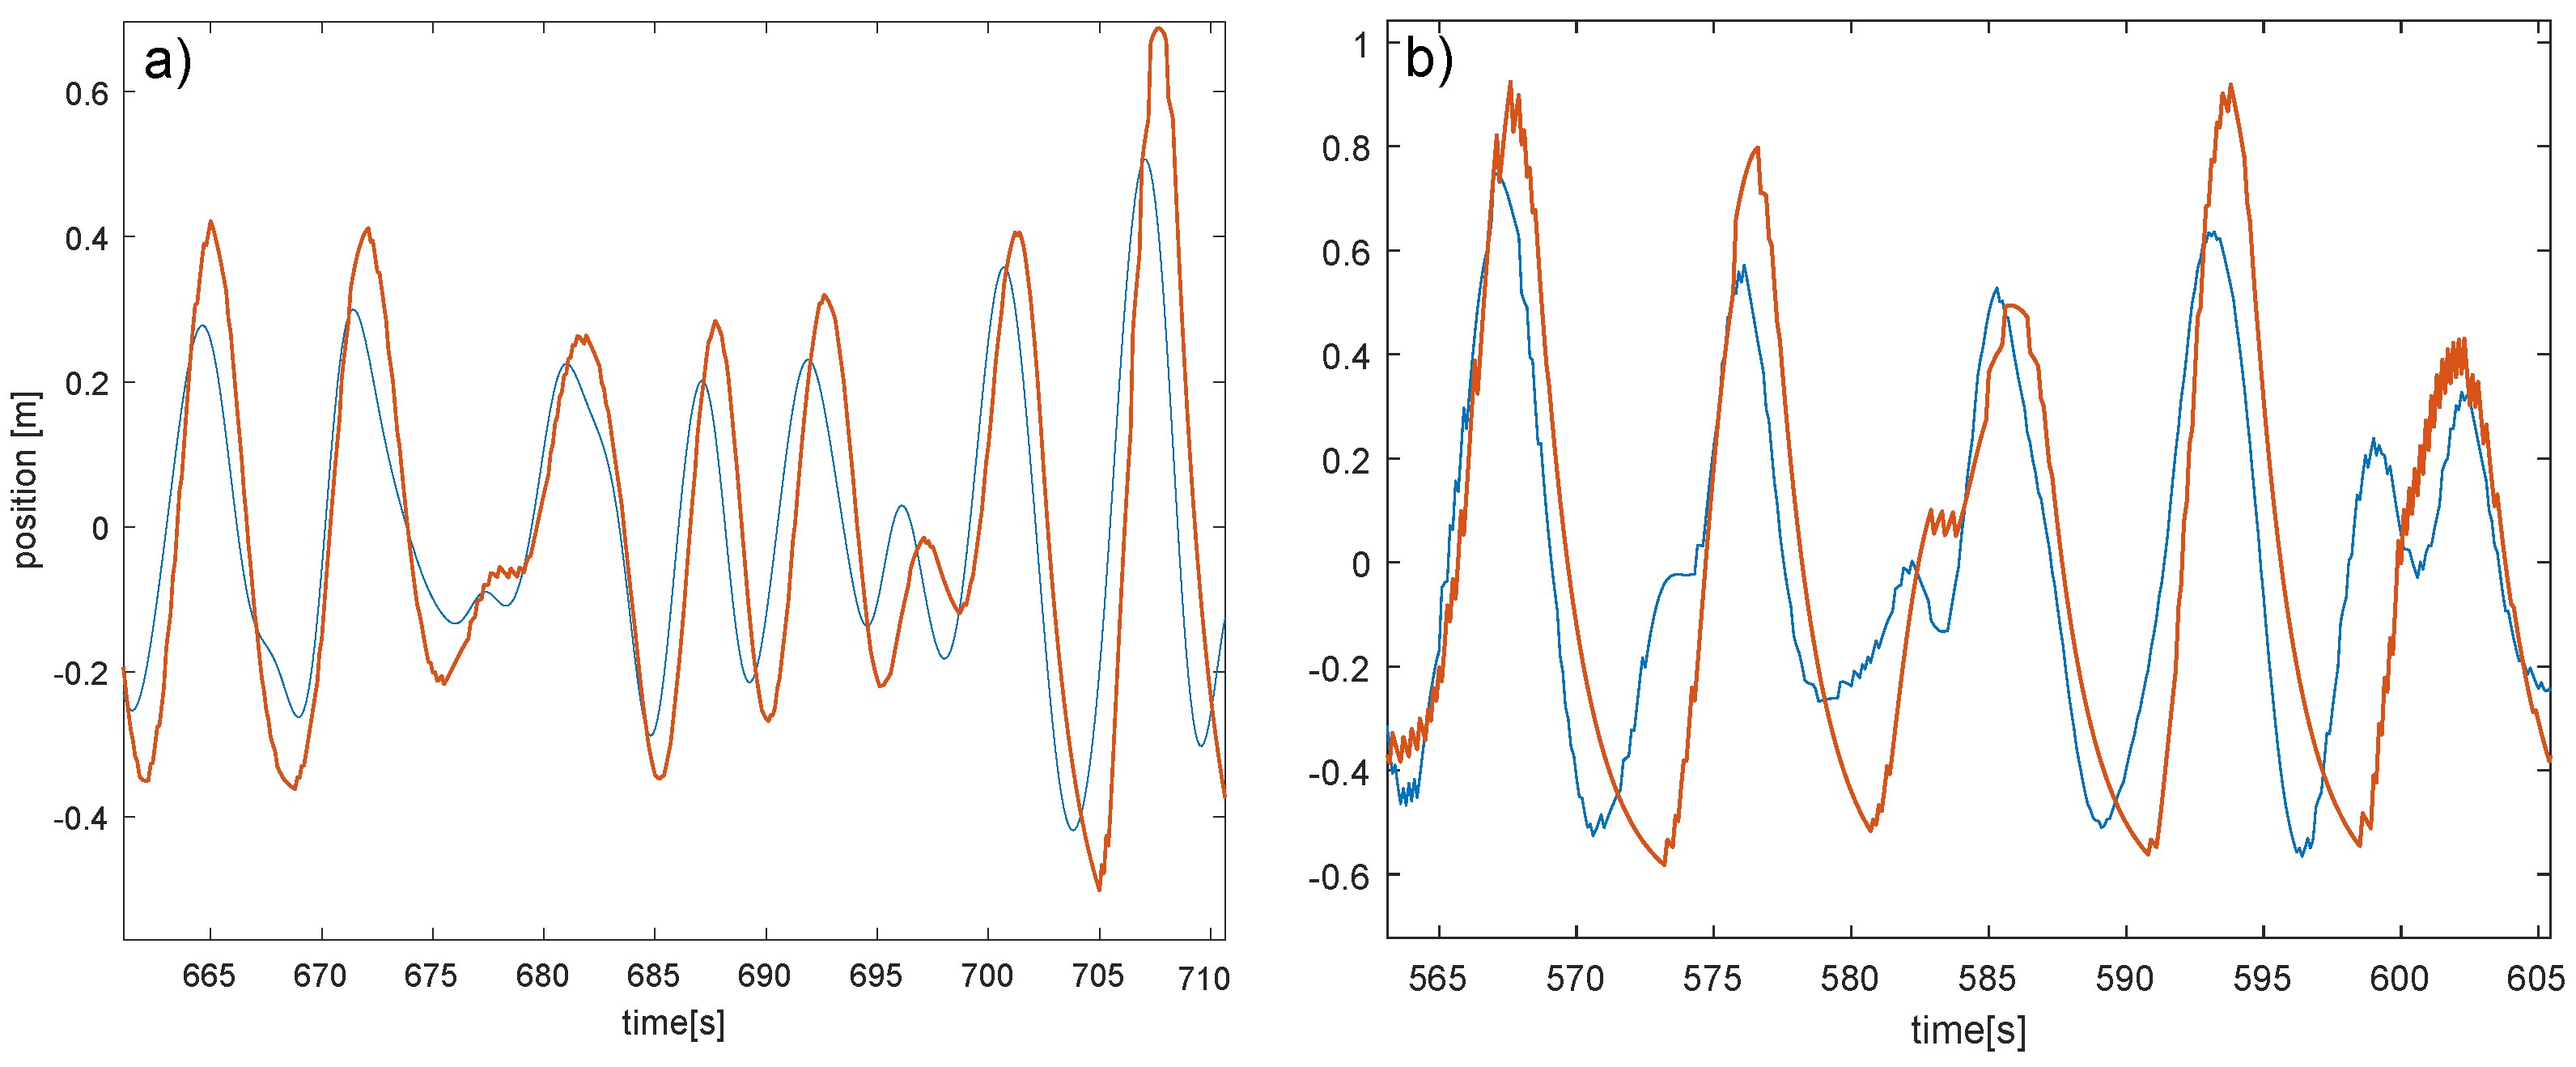
To compare the numerical simulation and physical wave tank test in
Figure 12, the numerical simulation was executed for the
case with a damping of
. For the line stiffness, firstly the nearly ideal parameter as used in the simulation of the power matrix are used and then the estimated parameter of the real line.
6.1. Numerical Simulations
For nearly all sea states (80–100%) the higher inertia is beneficial (see
Figure 8). Only for a few sea states with short periods and high waves, the linear reference PTO absorbs significantly more power. The predicted power increase when shifting the natural frequency towards the wave frequency, good to see for low sea states, with the power absorption increasing up to +139%. Outside the peak frequency the additional power is much less.
In the linear equation used in
Section 3, the wave height had no influence on the absorbed power. However, in the simulation the higher inertia PTOs advantage drops significantly when increasing the wave height. Here the non-linear effect of the line may play a role, limiting the downward speed of the PTO to
.
Figure 9 correspondents with this observation: For
both PTOs show a smooth curve; the high inertia PTO shows a nearly ideal sinusoidal shape, indicating a good frequency match. The high inertia PTO reaches a faster speed in the downwards movement than the low inertia PTO. For
, only the low inertia has a continuous movement, while the high inertia PTO has a sharp knick at the bottom position, caused by the frequency mismatch when the translator weight is still in the downwards movement, but the buoy, following the wave, is already moving upwards. The maximal downwards speed in this sea state is the same for both PTOs, it is limited by the generator damping and weight. A higher generator weight could reduce the negative effects on the absorbed power in higher sea states.
Focusing on the damping, the difference in the resonators bandwidth (characterized by the Q-factor) can be seen: The low damping leads to a higher Q-factor, and so to a higher peak power. While the peak power for the higher damping is smaller, the decrease in power off the resonance centre is smaller.
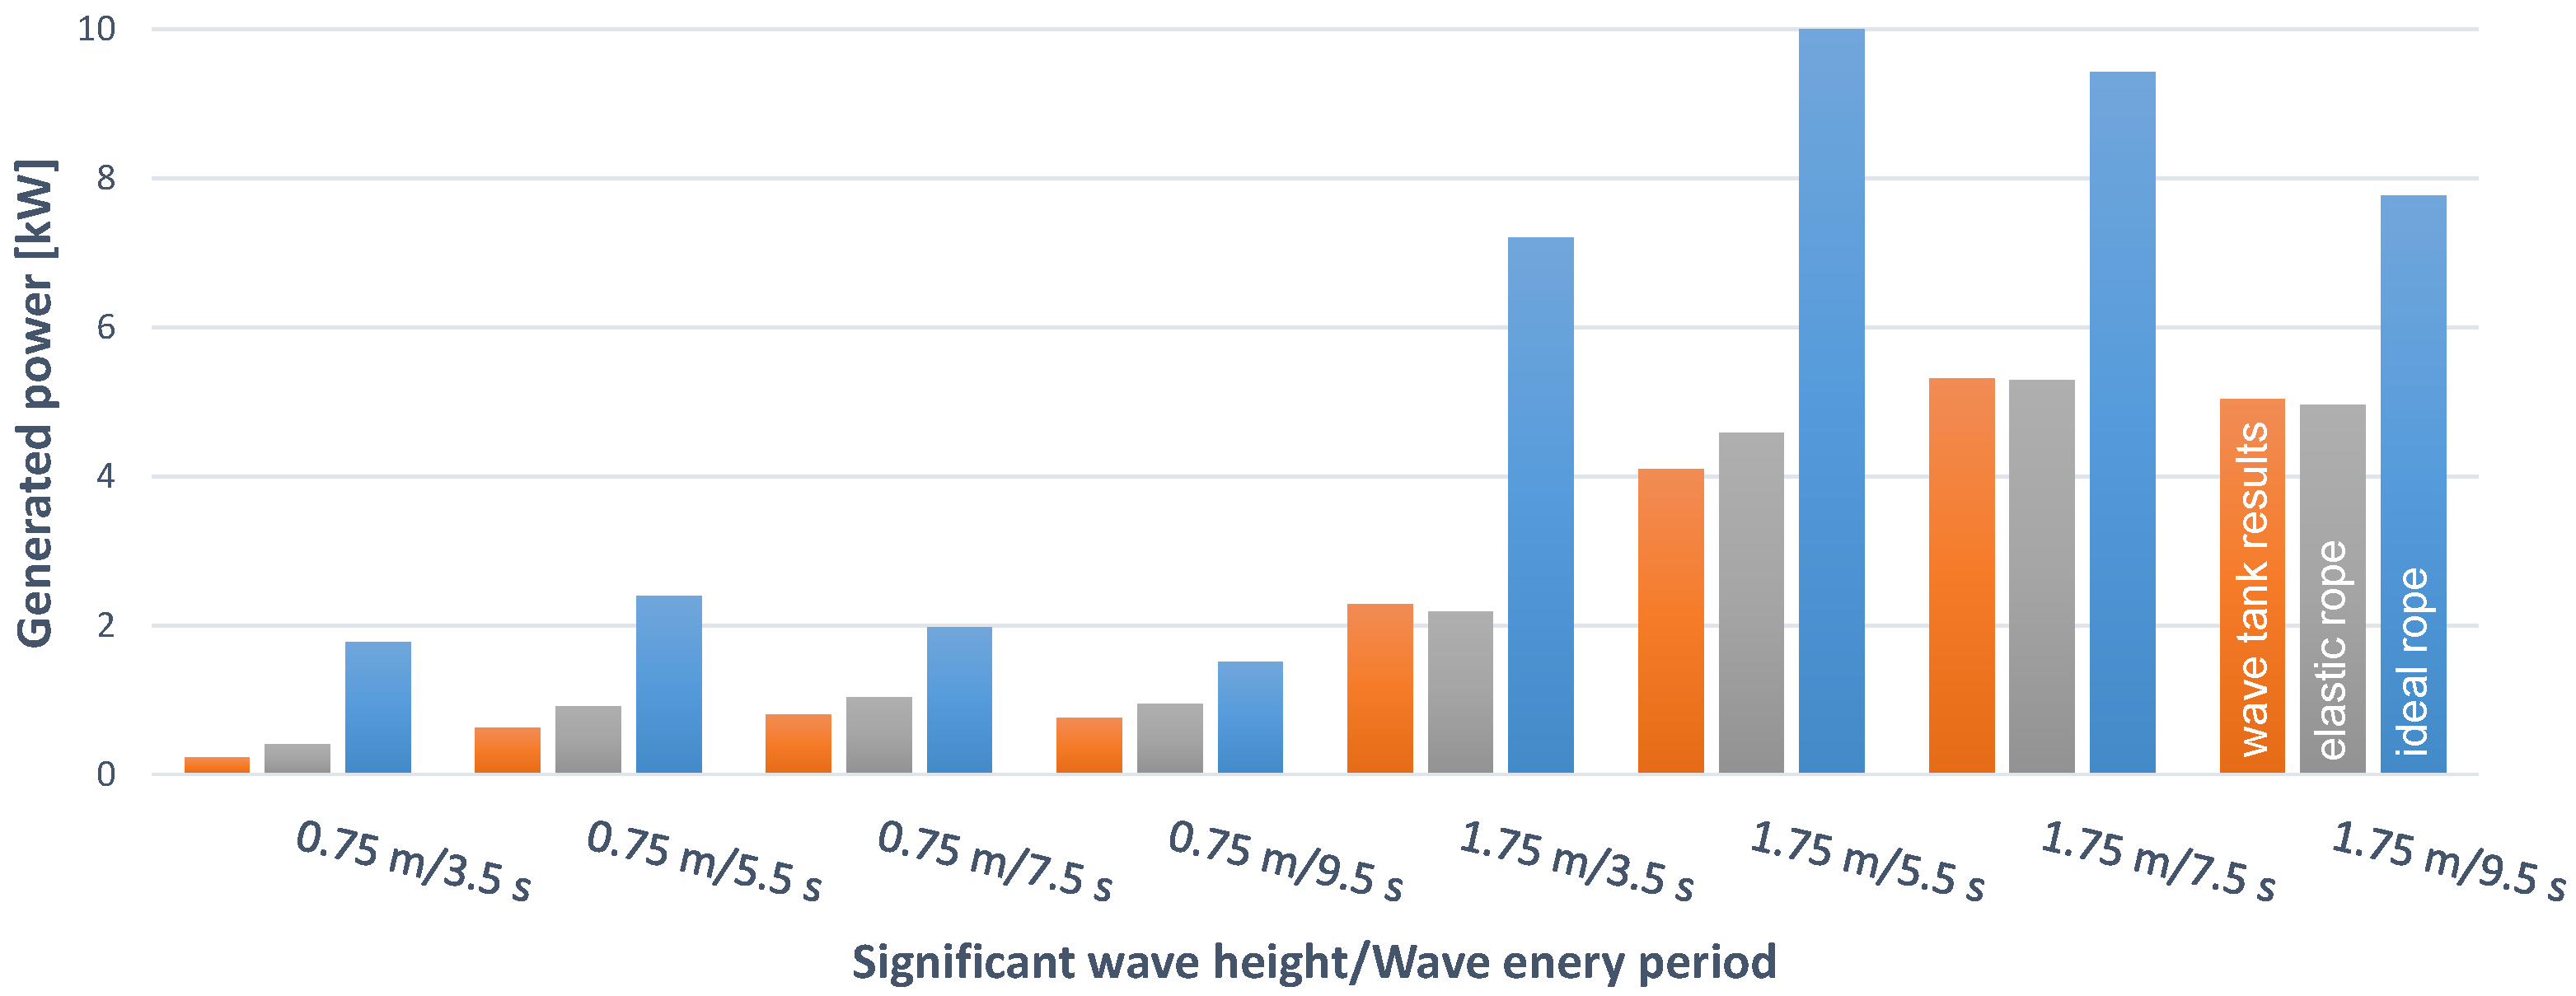
6.2. Numerical Simulations and Physical Tests
The results of the physical wave tank tests shown in
Figure 8 are slightly different: For the low amplitude waves and long wave periods, the high inertia PTO has an advantage over the low inertia PTO. For short periods the low inertia PTO generates more power. However, for
waves, the low inertia is beneficial for all tested periods. The difference is getting smaller as higher the wave period is, and for wave energy periods higher than
s the high inertia PTO may absorb more power. But comparing to the simulation power matrix in
Figure 8, the higher inertia should perform better from
upwards.
This may be explained with the ideal stiff line in the simulation.
Figure 12 shows the influence of the line stiffness: While using the ideal line, the numerical simulation absorbs approximately 2 times, in low sea states up to 10 times of the power of the physical tests. While reducing the stiffness of the line, the power rapidly plunges very close to the wave tank test result. Also the peak period changes towards the higher wave energy periods. The line reduced stiffness used was with
very low. We assume that the low stiffness results primary from the knots connecting the different part together and that the line stiffness itself plays a secondary role. The low line stiffness may therefore only be valid for small displacements.
The differences between numerical simulations with the non-ideal line and physical wave tank tests are very small. For the low waves, the predicted power from the simulation is slightly higher, what might be a result of the friction in the system. For the m waves, the agreement is very good, but the peak frequency for the simulation seems to be between s and s, while for the physical tests it seems to be between s and s. Differences may be caused by reflections in the wave tank, limits of the linear potential wave theory, the heave only simplification or inaccuracies of the PTO system. The cylindrical shape of the buoy in the simulation and the ellipsoidal shape in the wave tank test have nearly no influence on the results: In the numerical model the buoyancy stiffness is linearised at the steady state draft, where it is the same for both shapes.
Similar tests comparing a physical with a numerical point absorber WEC model were performed by [
11]. The physical scale model uses a motor to mimic the PTO and is designed without using connecting lines. The measured data from the physical tests agrees very well with the model data, and no line elasticity has to be considered. However, while the motor allows a wide range of control strategies to be simulated, it results in a clearly visible noise in the passive damping mode especially for high and short period waves.
The time series of the physical experiments matches in general the observation from the numerical simulation: The high inertia PTO matches the wave frequency very well in the low amplitude waves, what can be seen in the higher peaks in
Figure 11, but for the low inertia, the period is too high to catch all peaks.
In direct comparison with the numerical results of
Figure 9, the experimental curves look smoother. The sharp knick as seen for the high inertia PTO in the high wave in the simulation does not exist in the experimental results. Here the line elasticity may have smoothed the results.
6.3. Overall
Despite the differences in simulation and physical test, mostly caused by the line stiffness, the overall characteristics are the same: The peak frequency for a PTO increases with its inertia, and the benefit from the frequency matching decreases with the wave height. With the damping the resonance bandwidth can be adjusted and so the ratio between absorbed peak power and power off the resonance centre. This is especially important as an uncontrolled PTO can not adjust its frequency.
The experiments showed that tuning the undamped eigenfrequency of the PTO towards the energy period of the sea state is not always beneficial. While in sea states with low wave height sea states, the natural frequency from the linear estimation agrees well with the real behaviour of the PTO, in higher and steeper waves it leads to a slack line, thus reducing the benefit of the frequency tuning. On the other side, compared to a traditional low inertia PTO, the absorbed power is for nearly all sea states in the power matrix in
Figure 8 much higher. Control strategies, like latching or complex conjugate control, rely on a PTO with high frequency and may provide better results for a wider range of sea states, due to their ability to adapt to the sea state. But controllable PTO designs require additional electrical or mechanical mechanism, and suitable controller for real sea states are still a topic of ongoing research. For many wave climates, a well tuned, non adjustable frequency may be good enough. When designing the WEC converter to match a specific sea states, the energy adsorption for this sea state may increase significantly, however, on the other side, it will get out of tune for sea states far away. This can be used to automatically detune the device in storm conditions.
The results of the added inertia from
Figure 8 and
Figure 10 agree well with the effect of an additional submerged added mass sphere in [
8], where the absorbed power with the additional inertia sphere is increased up to the factor of 3 compared to the linear generator without the sphere. Even though the generator design was similar to the one used in this paper, the specific parametrization and sea states were different, so that the values can not be compared directly. In [
22], while analysing the influence of inertia on a cylindrical bottom-hinged WEC, the absorbed power of the increased inertia WEC correlates with the wave period. However, it also increases if the wave amplitude gets higher, which opposes the finding in this paper and is a good example of the fact that the characteristics between different WEC types alter.
7. Conclusions
In this paper a new design of a physical model PTO with constant damping was presented, showing a simple and accurate way to get low friction PTO with a nearly ideal velocity dependent force.
The alternating rotatory design combines the simplicity of a direct-driven generator by having no gearbox, beside a disc, with the advantages of a rotational system such as a decoupling of stroke and generator length.
The additional inertia allows to design the device for specific sea states and the PTO damping can be used to adjust the degree of specialisation. This can be used to build a simple control-free WEC, tuned for the most significant sea state in a certain wave climate. Away from this sea state, for example in harsh, stormy conditions, the WEC will automatically detune.
In numerical simulations with an ideal connection line between buoy and PTO, the additional inertia provided up to 239% of the power of a similar generator where the inertia is equivalent to the weights (direct-driven linear generator). For the parametrisation with the smallest Q-factor 80% of the tested sea states still had an increase in power absorption compared to a linear generator. However, at lower wave energy periods and higher waves heights the advantage in power absorption of the high inertia PTO compared to the linear generator gets smaller.
The findings of the numerical simulation are confirmed in wave tank tests. Here, the stiffness of the line showed a big influence on the system. A low line stiffness decreases the absorbed power and increased the peak wave period.
Due to the simple design and the the good performance without control, alternating rotatory generators might also be an interesting option for full-scale devices operating in wave climates with small energy spectrum bandwidth.
Further improvements of the physical model could include a replacement of the permanent magnets with electro magnets as used in [
27] which allow a quick and reliable change of the damping as well as adjustable damping control strategies.

 ,
, 


