Article

Optimisation of Tray Drier Microalgae Dewatering Techniques Using Response Surface Methodology

by
Ruth Chinyere Anyanwu
1,
Cristina Rodriguez
1,
Andy Durrant
1 and
Abdul Ghani Olabi
2,*
1
Institute of Engineering and Energy Technologies, School of Computing, Engineering and, Physical Sciences, University of the West of Scotland, Paisley PA1 2BE, UK
2
School of Engineering and Applied Science, Aston University, Aston Triangle, Birmingham B4 7ET, UK
*
Author to whom correspondence should be addressed.
Energies 2018, 11(9), 2327; https://doi.org/10.3390/en11092327
Submission received: 31 July 2018 / Revised: 20 August 2018 / Accepted: 29 August 2018 / Published: 4 September 2018
(This article belongs to the Special Issue 10 Years Energies - Horizon 2028)

Abstract

:
The feasibility of the application of a tray drier in dewatering microalgae was investigated. Response surface methodology (RSM) based on Central Composite Design (CCD) was used to evaluate and optimise the effect of air temperature and air velocity as independent variables on the dewatering efficiency as a response function. The significance of independent variables and their interactions was tested by means of analysis of variance (ANOVA) with a 95% confidence level. Results indicate that the air supply temperature was the main parameter affecting dewatering efficiency, while air velocity had a slight effect on the process. The optimum operating conditions to achieve maximum dewatering were determined: air velocities and temperatures ranged between 4 to 10 m/s and 40 to 56 °C respectively. An optimised dewatering efficiency of 92.83% was achieved at air an velocity of 4 m/s and air temperature of 48 °C. Energy used per 1 kg of dry algae was 0.34 kWh.

1. Introduction

Microalgae biofuels are becoming popular because of the high demand for sustainable, low-emission fuels. Microalgae productivity can be twenty times that of oilseed crops on a per-hectare basis, and is thus a more viable alternative [1]. Biomass-derived fuels are carbon neutral (i.e. they emit no net CO2 into the atmosphere), and the amount of CO2 fixed by the biomass equals that released upon the creation and combustion of biofuel [2]. The value of algae lies in their potential use in several fields such as biodiesel, bioethanol [3,4], biogas [5], fish feed [6], skin care products, pharmaceutical, bioremediation of metal polluted water [7], biomolecules [8], and hydrogen technologies [9,10,11]. Application of the biorefinery concept to produce biodiesel and other value-added product will enhance the economics of biodiesel production [12]. However, the major obstacle for using microalgae biomass on an industrial scale is dewatering, i.e., the removal of water after cultivation but before further processing. Dewatering accounts for 20–30% of the total costs associated with microalgae production and processing [9,10]. Dewatering and drying 1 kg of microalgae biomass is estimated to cost $0.048, or £0.038 (@ £0.79 per $1) [10]. Microalgae cultures need to be concentrated before processing, as their concentrations lie between 0.1–2.0 g of dried biomass per liter [9].
The development of commercially viable microalgae-derived biodiesel requires technological maturity of each of the following four steps [13]:
  • microalgae cultivation
  • dewatering
  • lipid extraction
  • transesterification.
Two common dewatering methods are bioflocculation and forward osmosis. Bioflocculation refers to the addition of bioflocculants or bacteria that naturally produce flocculants to a culture of microalgae [11,14]. This approach has been shown to enhance the bioflocculation processes. Microalgae dewatering costs could be greatly reduced with bioflocculation, because no chemical costs are incurred with little energy consumption [15,16]. The dewatering of microalgae with bioflocculation, using bacteria as a flocculating agent which is cultivated alongside the microalgae, presents the setback of microbiological contamination and possible interference with food or pharmaceutical applications [17,18]. Ndikubwimana et al. reported increased flocculation efficiency from 44.8 ± 0.1% to 96.0 ± 0.3% after 10 min [19]. Bioflocculation dewatering leads to pH disturbances in the reactor; this was attributed to contamination. The pH can be adjusted using NaOH when it deviates below 6 [20].
Forward osmosis (FO) involves the transport of water from the feed solution to the draw solution across a semi-permeable membrane. The unwanted component is removed effectively by the membrane [21,22]. The driving force for FO is the osmotic pressure gradient across the semi-permeable membrane, and no external driving force is required [23]. FO is currently applied to biosolid separation in wastewater treatment and food processing [24]. Buckwatter et al. reported that FO is considered as a partial dewatering method for microalgae growing on wastewater in a marine environment, using artificial seawater as the draw solution; average dewatering rates of 2 L/m2 membrane/h were observed [21]. Furthermore, the application of FO membranes has been reported for the recovery of microalgae from dilute broths to reduce power consumption. Son et al. studied dewatering based on electrically-facilitated forward osmosis using a proton exchange membrane [22]. Forward osmosis appeared to be effective, increasing the final biomass concentration by 86%. In addition, the chlorophyll content of microalgae solution was decreased from its original level of 7.041 ± 0.225 to 0.021 ± 0.015 mg/g after an electrically-facilitated forward osmosis process [22]. Chlorophyll is the only source of nitrogen in the extracted lipid from microalgae; nitrogen is not a problem at all if the microalgae is used to produce animal feed, as it is highly beneficial to the immune system. Foods which are high in nitrogen are usually converted to carbohydrate rather than fat. In contrast, nitrogen in lipids is a critical defect from a fuel point of view [22,25]. Hence, a holistic dewatering technique is indispensable to maximise the commercialisation and industrial application of both microalgae biofuel and value products. To help overcome this technological obstacle and to make microalgae dewatering all-inclusive, a tray drier dewatering technique on Scenedesmus quadricauda has been investigated in this paper. This technique is based on the concept of drying undertaken using a tray drier in drying sand, fruits, and vegetables. The response surface methodology (RSM) was applied in the experimental study to identify the dewatering parameters—air feed temperature and air velocity—that will result in the best dewatering efficiency.
The tray drier is the most extensively used drying method because of its simple and economic design. The tray drier technique uses air velocity to quickly dry the product. In a tray drier, more products can be loaded and spread out as the trays are arranged at different levels. A number of chemical engineering laboratory drying experiments, including the drying of sand, the performance analysis of a tray drier unit, and improving the exergetic performance of a tray drier for drying fresh fruit (apples), have been studied [26]. In this study, the dewatering of Scenedesmus quadricauda was carried out by the tray drier technique for the first time.

2. Materials and Methods

2.1. Microalgae Strain and Preparation

Scenedesmus quadricauda was obtained from Sciento (Manchester, UK). The microalgae sample was cultivated in a closed 2 L UTEX photobioreactor for 14 days in K10 medium at an ambient temperature of 25 °C. Measurement of the optical density of Scenedesmus quadricauda was determined by UV-visible spectrophotometer (Evolution 220 thermo scientific, USA). The biomass concentration was determined by correlating the optical density (OD550-750) with the dry weight. At the start of each experiment, 200 mL of microalgae samples were weighed and uniformly distributed on the trays. The initial moisture content (MC) of the samples was determined by drying a known amount of the microalgae sample at 105 °C in an oven for 24 h. The average MC of the samples was found to be 99.35% (wet basis).

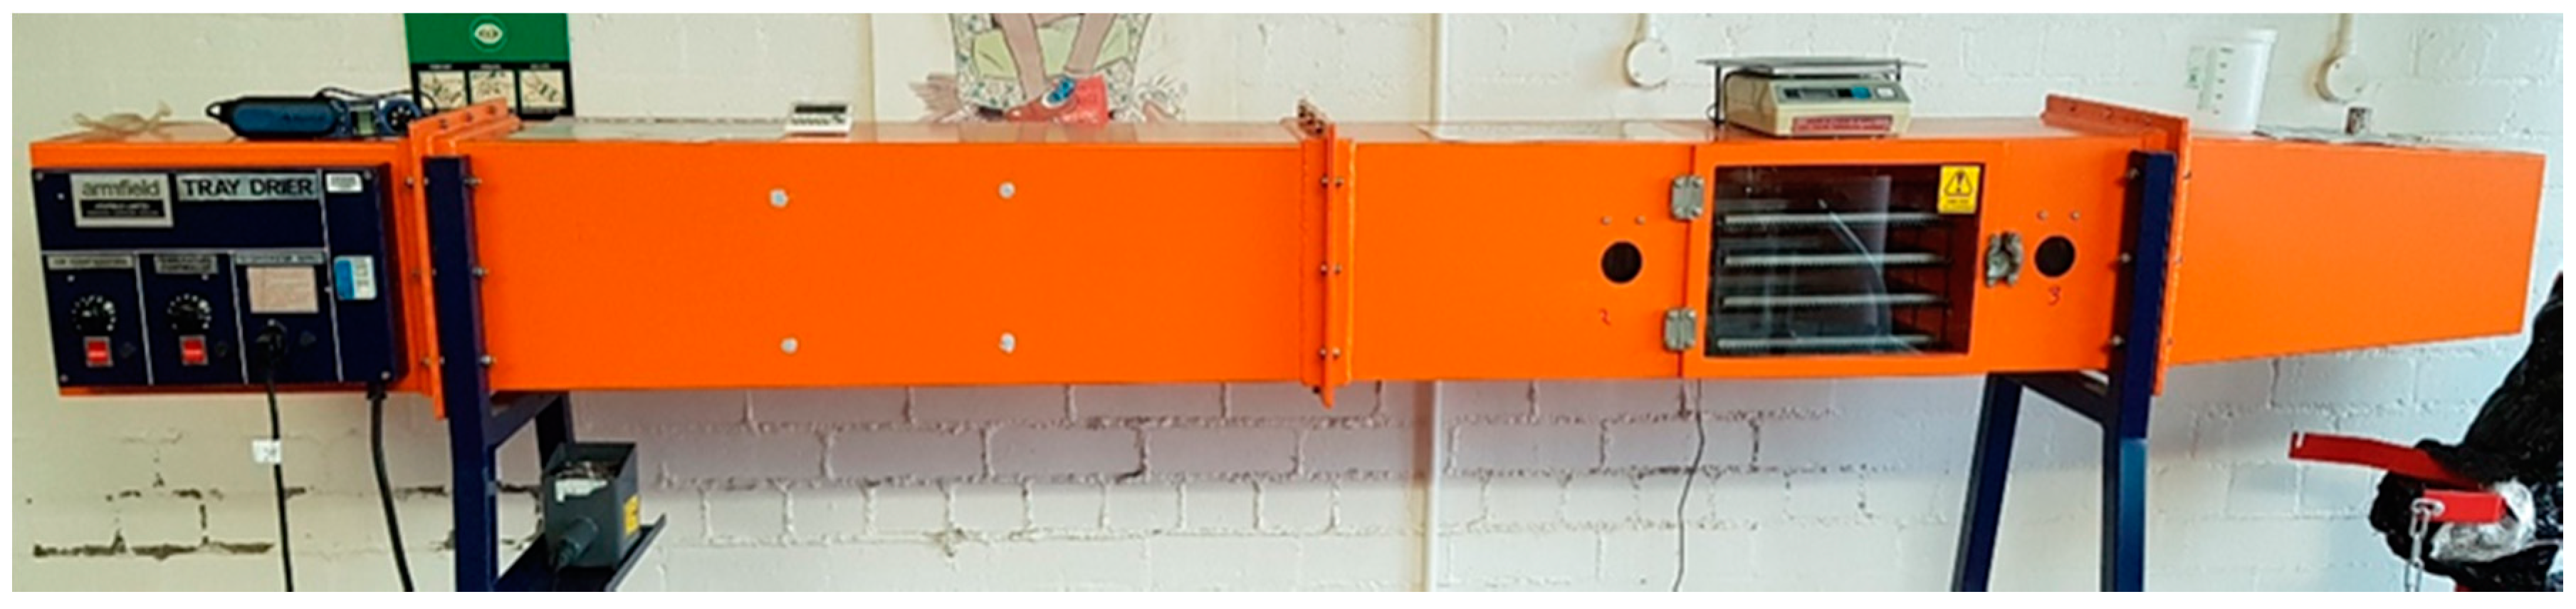
2.2. Tray Drier Description

A tray drier unit (Armfield Limited, Ringwood, Hamsphire, UK) was used in this research, as shown in Figure 1. The unit consisted of an air duct with a cross sectional area of 0.0784 m2 mounted on a frame standing firmly on the floor to provide a comfortable working height of 1.40 m, a length of 2.95 m, and a depth of 0.7 m, with total capacity of 3 kg of solids. Air is drawn into the duct through a mesh guard by a motor-driven axial-flow fan impeller with a controllable speed to produce a range of air velocities of 1–10 m/s. The air passes into the central section of the duct where four impermeable steel trays with a total area of 0.2035 m2 containing the microalgae samples to be dried are placed. The trays are mounted onto a support frame, which is attached to an electronic balance with which the total weight is continually indicated. The trays and samples are inserted and removed respectively from the duct through a latched side door with a glass panel for monitoring purposes. After passing over the drying trays, the air is discharged into the atmosphere through an outlet duct section where a digital anemometer is used to measure the air velocity.

2.3. Experimental Procedure

The tray drier consists of four trays; these were washed with water and dried before conducting experiments. The weight of the empty trays was determined and recorded. Air velocity control and temperature are set according to the design of experiment, as presented in Table 1. Two hundred milliliters of algae culture was weighed for each tray. The tray was placed in the tray drier, and parameters (temperature 40–56 °C, weight, air velocity 4–10 m/s) were monitored and recorded continuously every 5 min for the first half-hour, every 15 min for another half-hour, then every 30 min until 6 h had elapsed since the start of the experiment. An aspirated psychrometer (Papst 8550, Schenefeld, Germany) with two bulb thermometers was used to measure the wet- and dry-bulb temperatures of the air on its way into and out of the drier. The temperature data were manually collected while using a stop watch as a time guide. The outlet air velocity was monitored using a digital thermos-anemometer (Kestrel 1000, USA), at 2 m/s, and the air velocity was controlled using the control valve. The tray drier unit was reset at the end of each six-hour run; then the experiment was repeated with a different combination of air velocity and temperature.

2.4. Design of Experiments

The experiment was planned according to a response surface methodology (RSM) for two input factors air temperature and air velocity. RSM is a combination of statistical and mathematical methods used to select the best experimental conditions requiring the lowest number of experiments in order to get appropriate results [27,28]. This is normally between a response of interest, y, and a number of associated control (input) variables, denoted by x_1,x_2,…,x_(k.); typically, a second order polynomial as shown in Equation (1) is used in RSM to describe this functional relationship.
  Y = b 0 + b i x i + b i i   x 2 i i + b i i x i x j
A Central Composite Design (CCD) is flexible with respect to 2-way interactions. They are comprised of a standard 2k factorial, centre points, and axial points. In this study, a CCD design with two levels (high and low) and one centre point was used to analyse the effect of two input parameters: drying temperature and air velocity on the dewatering efficiency (response variable). The overall dewatering efficiency ( D E   % ) was calculated, as shown in Equation (2).
  D E ( % )   = ω 1 ω 2 ω 1 · 100
where ω1 is the moisture content of the sample before drying and ω2 is the moisture content of the sample after six hours of drying.
A total of 13 experimental runs were conducted in triplicate. The behaviour of the process is defined, as shown in Equation (1). The same statistical software Design-Expert v.10.5 was used to generate the analysis of variance (ANOVA) and the response plots that illustrate the relationship between the input parameters and output response, a ρ-value lower than 0.05 was considered significant in surface response analysis. The optimal values of the operation parameters were estimated by the three-dimensional response surface analysis of the independent variables: drying temperature (°C), and air velocity (m/s) and the dependent variable: dewatering efficiency (DE %). Range and levels of independent variables are shown in Table 1.

3. Results and Discussion

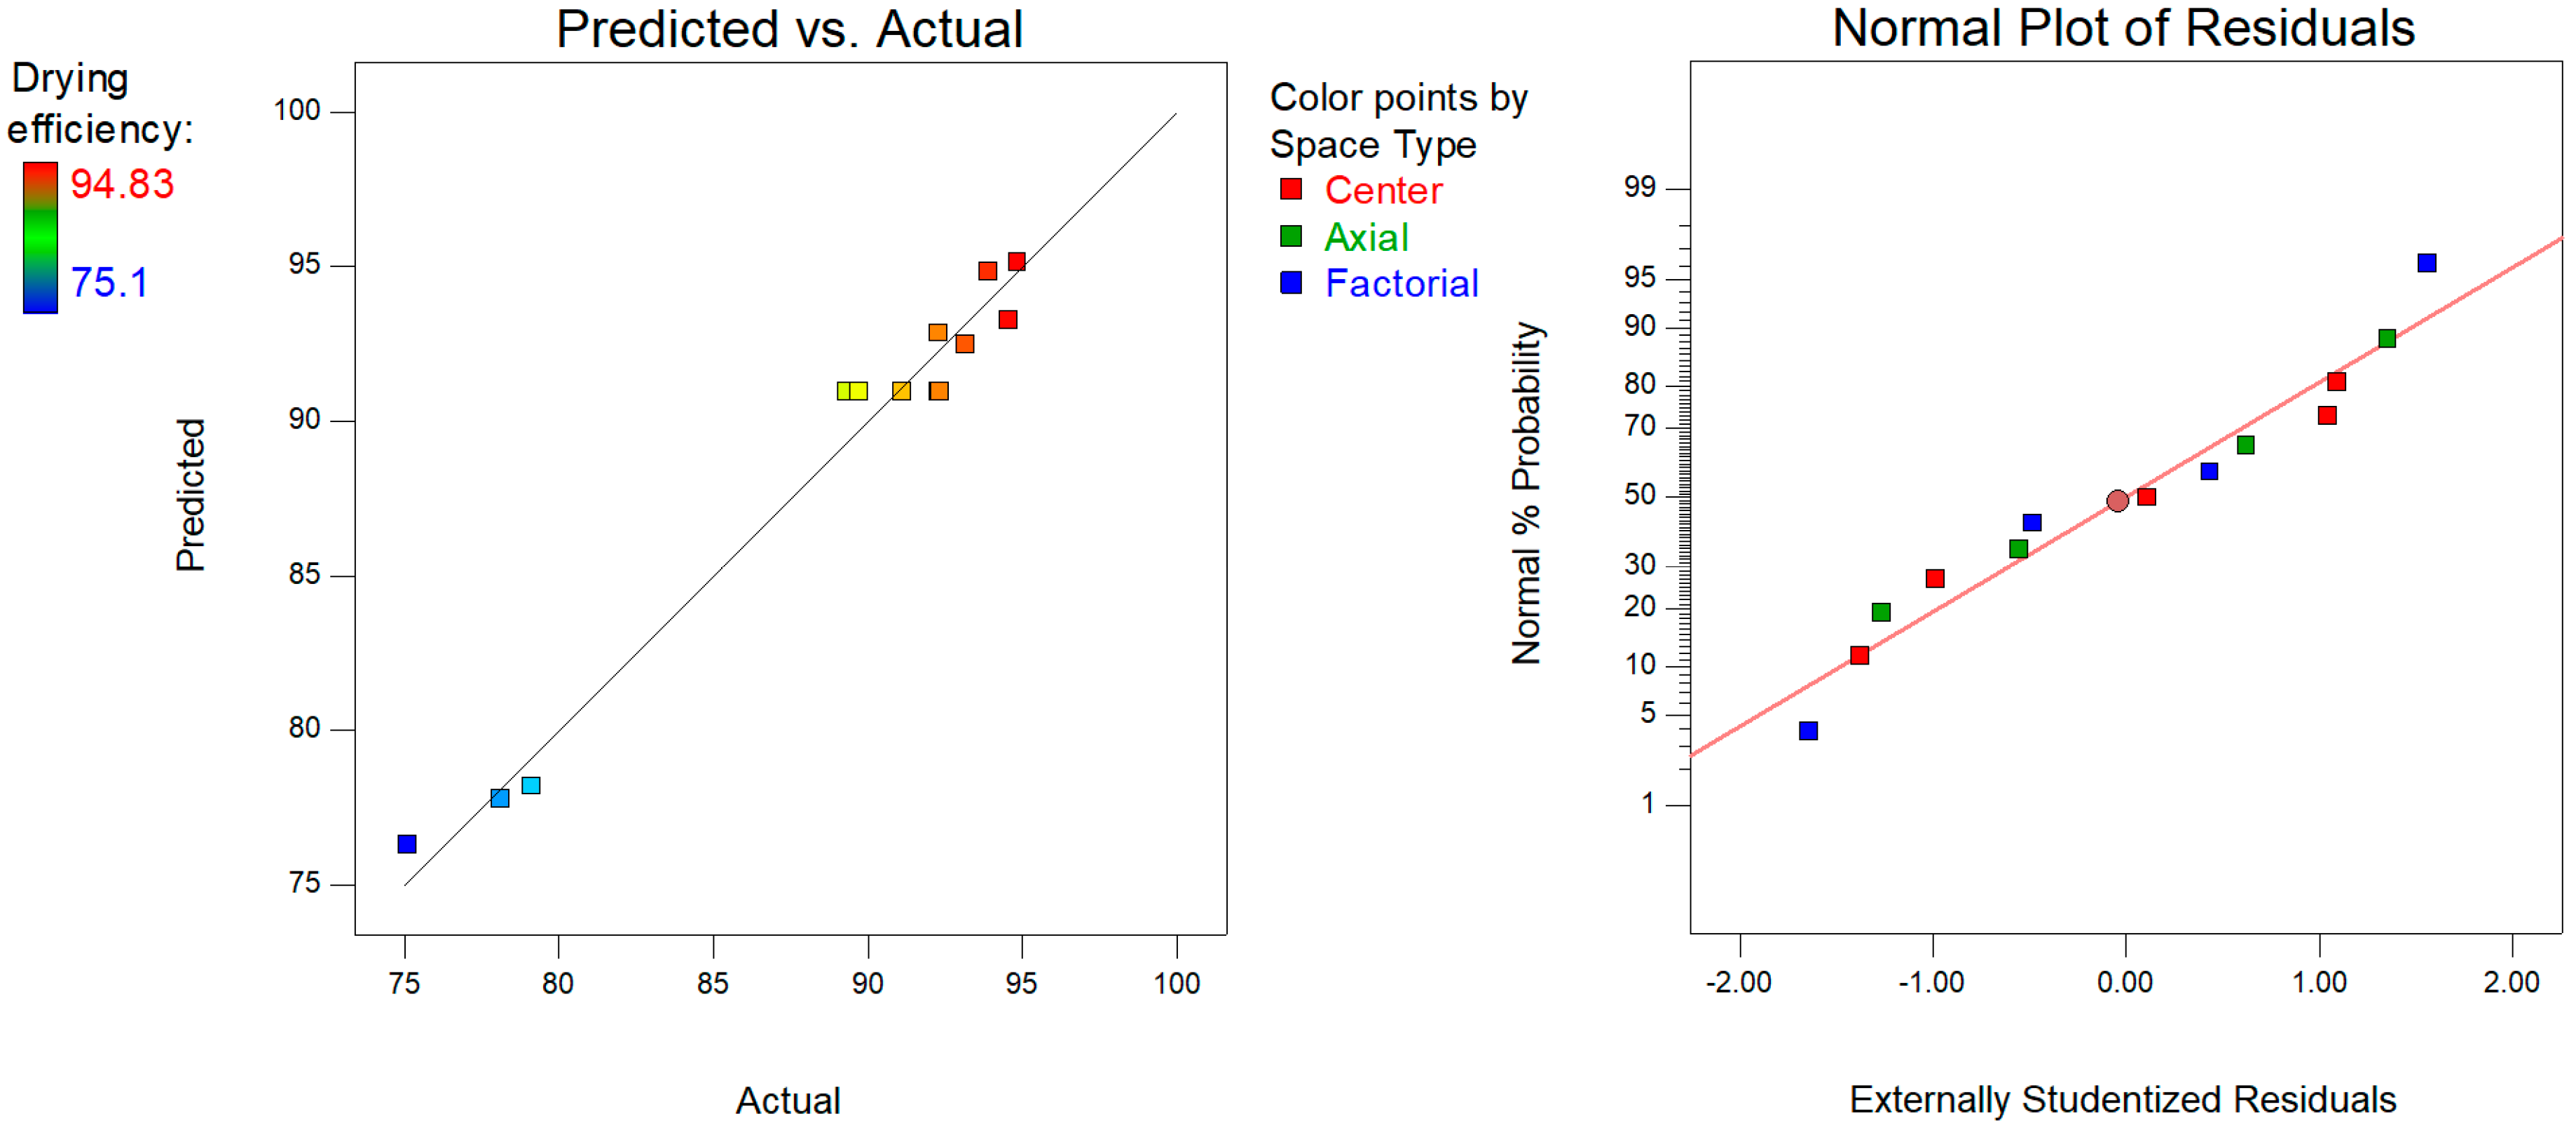
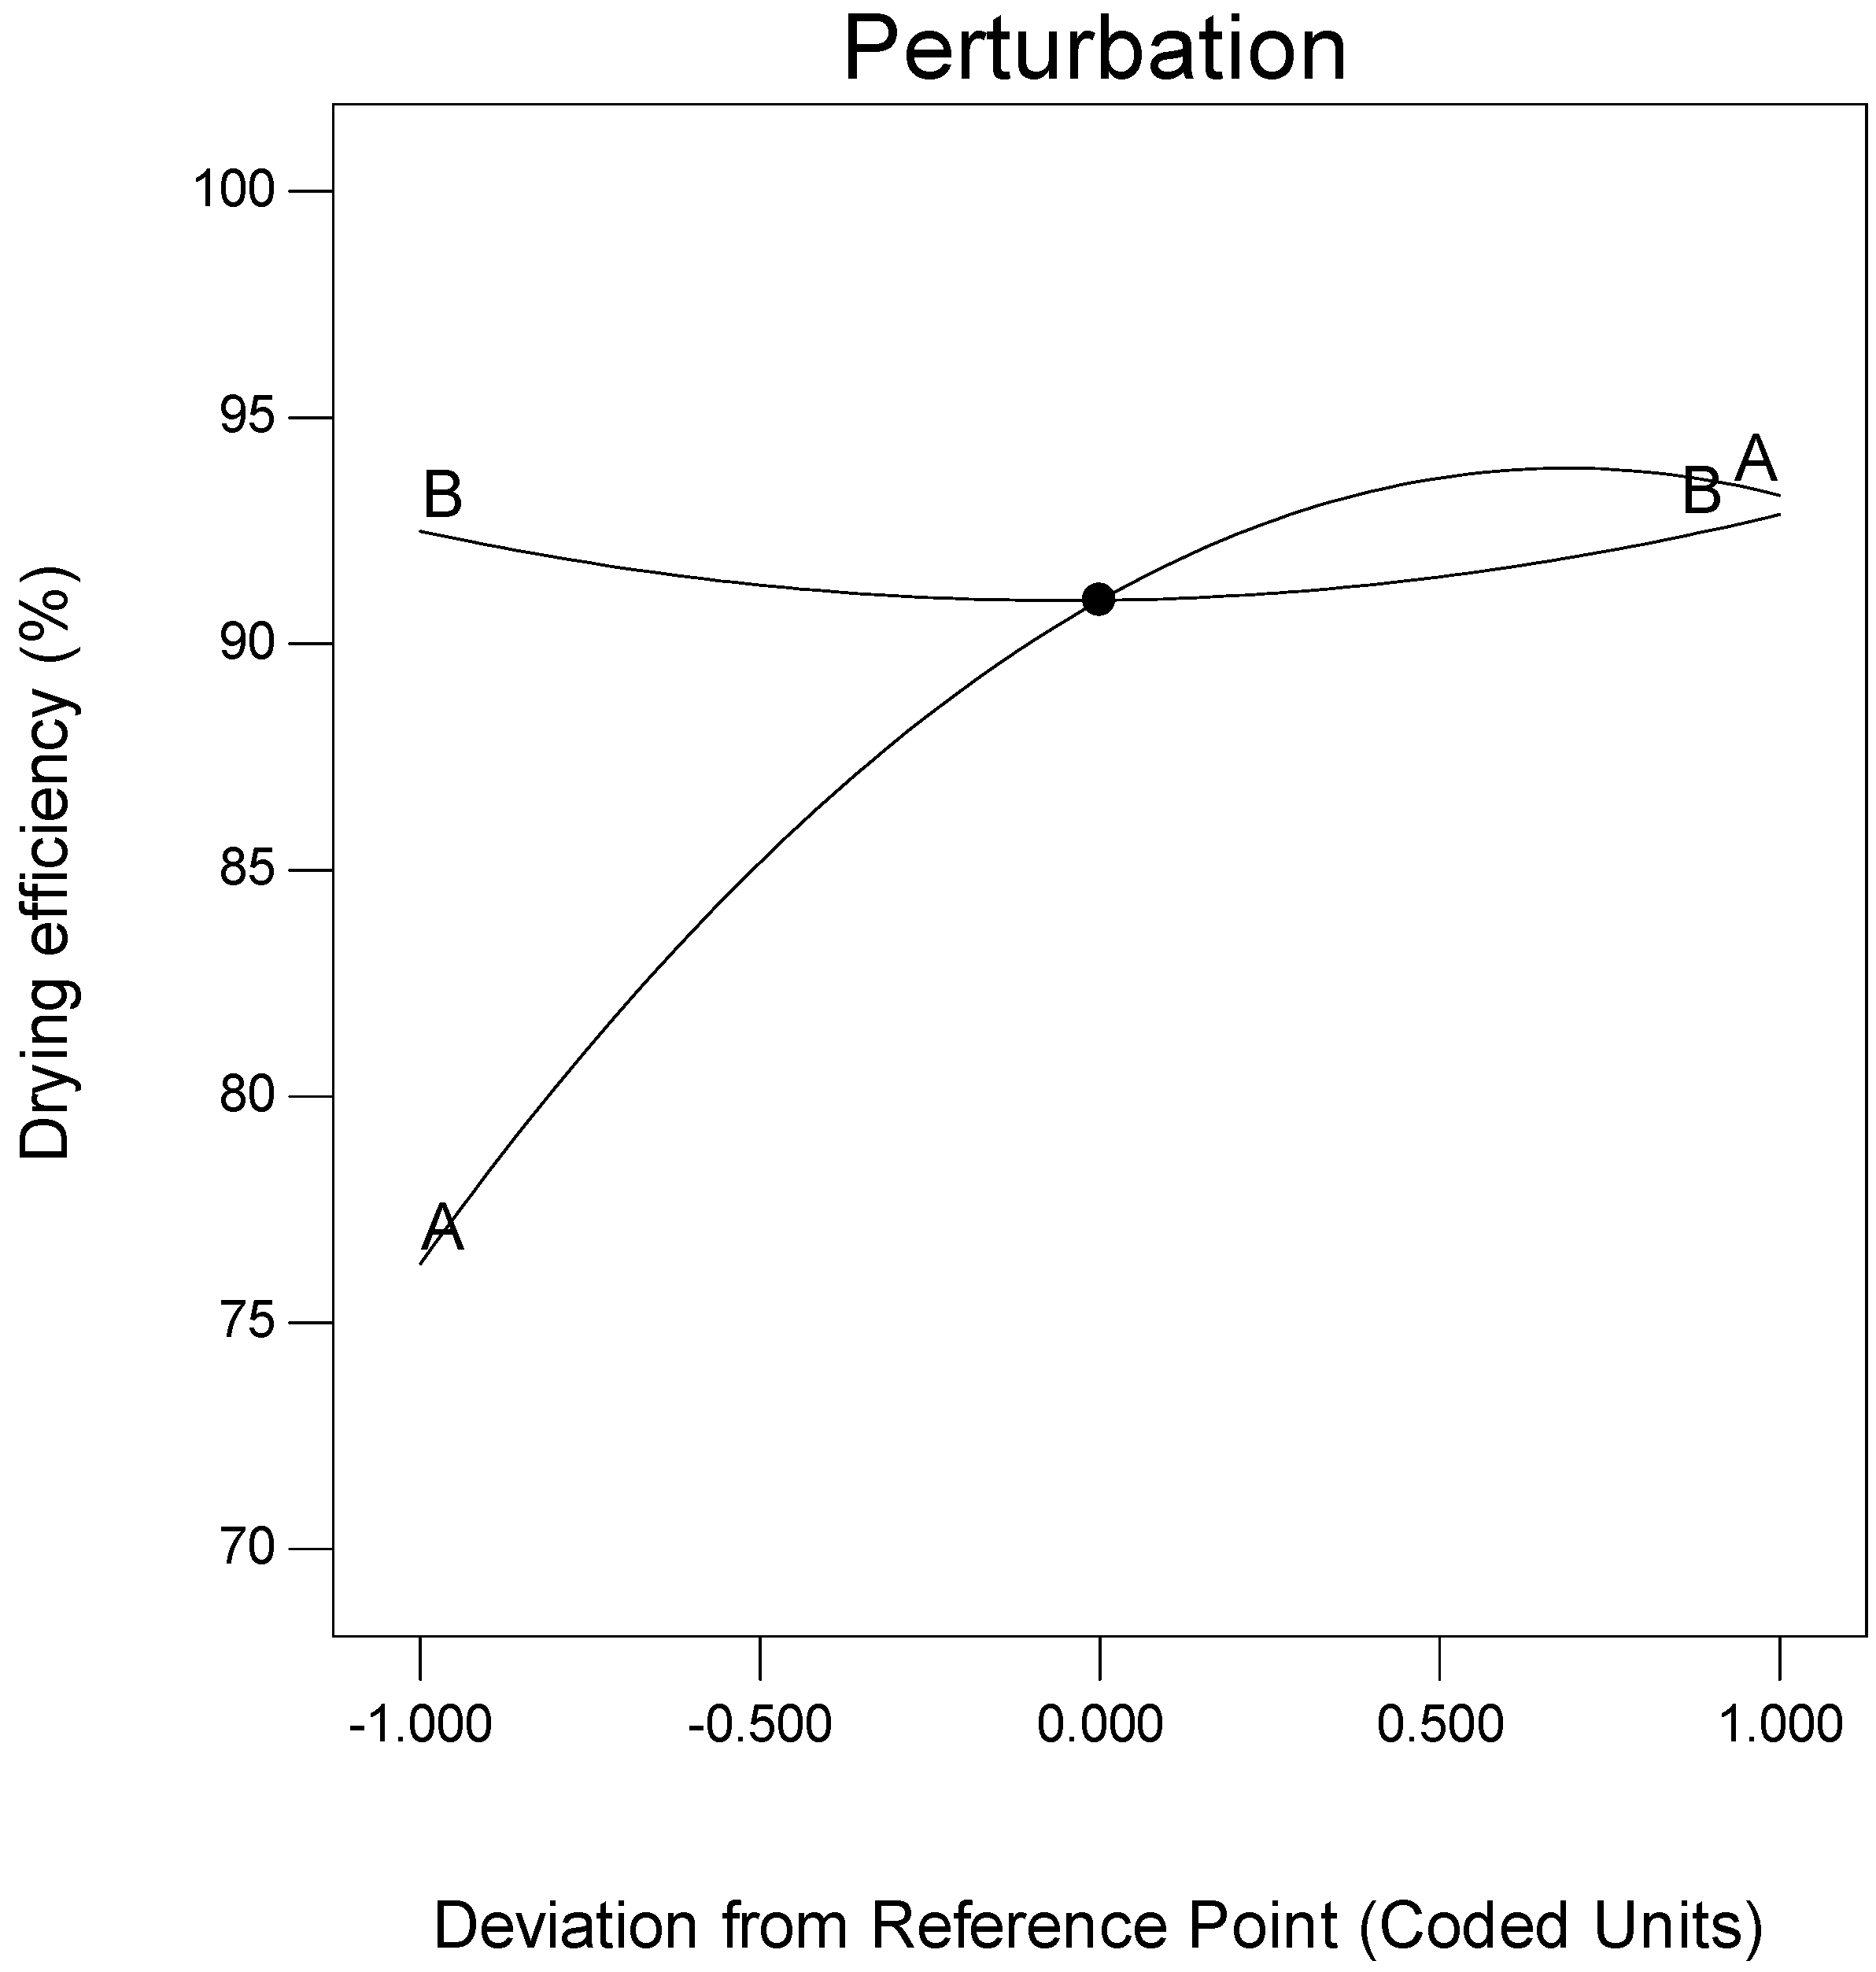
3.1. RSM Model Estimation

The RSM provided a correlation model between the process parameters (air temperature and velocity) and the process output (dewatering efficiency). Table 2 shows the result of dewatering efficiency according to the RSM design matrix, sorted by standard order.
The mathematical model associated to the response in terms of coded factors determined by the software is shown as:
  D E ( % )   = 173.51 + 10.324 A 2.5690 B 7.2917 · 10 4 AB 0.096439 A 2 + 0.19033 B 2
The fit summary outputs indicate that the quadratic model is statistically significant for further analysis. A reduced linear model analysis was adopted for response resulting in the model terms of R2 = 0.9754, adjusted R2 = 0.9578, predicted R2 = 0.8741, adequate precision = 19.9151 for dewatering efficiency. Normally, if the achieved adequate precision is >4, this indicates a good model [29]. The residuals are shown in Figure 2, as they relate to the predicted against the actual response this indicate better prediction and the normal plot residuals dewatering efficiency response. It was observed that the residuals are close to the diagonal on the normal probability plot. Thus, this infers that the developed models are appropriate and fit the data.
The perturbation plot in Figure 3 shows how the dewatering efficiency is affected by the input variables: temperature and air velocity. Temperature affects the dewatering efficiency in a concave way, while air velocity affects it in a convex way. By increasing A (temperature), the dewatering efficiency will increase exponentially. The effect of dewatering is observed to be less significant with air velocity, as can be seen from the plot.
This suggests the following: (i) increasing factor A (temperature) has a positive effect on the dewatering efficiency; and (ii) air velocity has little effect on the dewatering efficiency, because the dewatering rate increases with increasing temperature. The result from Zakir et al. [30] agreed with the increase in dewatering efficiency achieved in the present study, which is linked to high temperature. During the experimental runs, it was observed that increased temperature dewatered microalgae culture at greater rate, as temperature increases the level of water which is vaporised and removed by the flow of air over the culture. Furthermore, at a lower temperature, the kinetic energy of the molecules is reduced. This infers that the air has less energy to pass to the water and the water will increase in temperature for every unit volume of air that passes over the culture. Therefore, at a higher air temperature, a moderate unit volume of air is adequate to pass over the culture to dewater the same volume of water. This means that a shorter time would be required to reduce the water content of the culture [30].
Similar trends were obtained for other drying experiments where tray driers were used for drying fruits and vegetables. The tray drier technique for microalgae dewatering was found to be a very successful approach for dewatering microalgae compared to the drying of fruits. Misha et al. and Ghasemkhani et al. [31,32] applied a tray drier in order to dry fruit (apple); they concluded that a higher drying temperature unfavourably changed the colour of the apple. This was attributed to the fact that the higher temperature lead to dried apple slices with a more porous structures, thereby facilitating the dehydration process. Conversely, in the present study based on a quality (visual) analysis, drying temperature did not alter the colour of the dewatered microalgae. The quality of the apple was significantly influenced by air temperature when Shalini et al. [33] applied tray driers in drying apple pomace at different air temperatures (60, 70, 80 °C). Drying rates linearly increased with temperature; it was concluded that drying at 80 °C significantly lowered the protein and sugar content of apple pomace. The highest protein and sugar values observed respectively are (21.81%) and (22.57%) at 70 °C. Mahn et al. [34] studied broccoli drying with tray driers and concluded that there is a synthesis and degradation of sulforaphane (an anticancer compound found in broccoli), depending on the temperature. Drying at 70 °C for 4 h gave the highest yield of sulforaphane. Colak et al. [35] reported exergy efficiency values of 68.65% and 91.79% at 40 °C and 70 °C respectively for drying green olives in a tray drier. Thus, it can be seen in Figure 4 that increasing temperature influences microalgae dewatering rates.

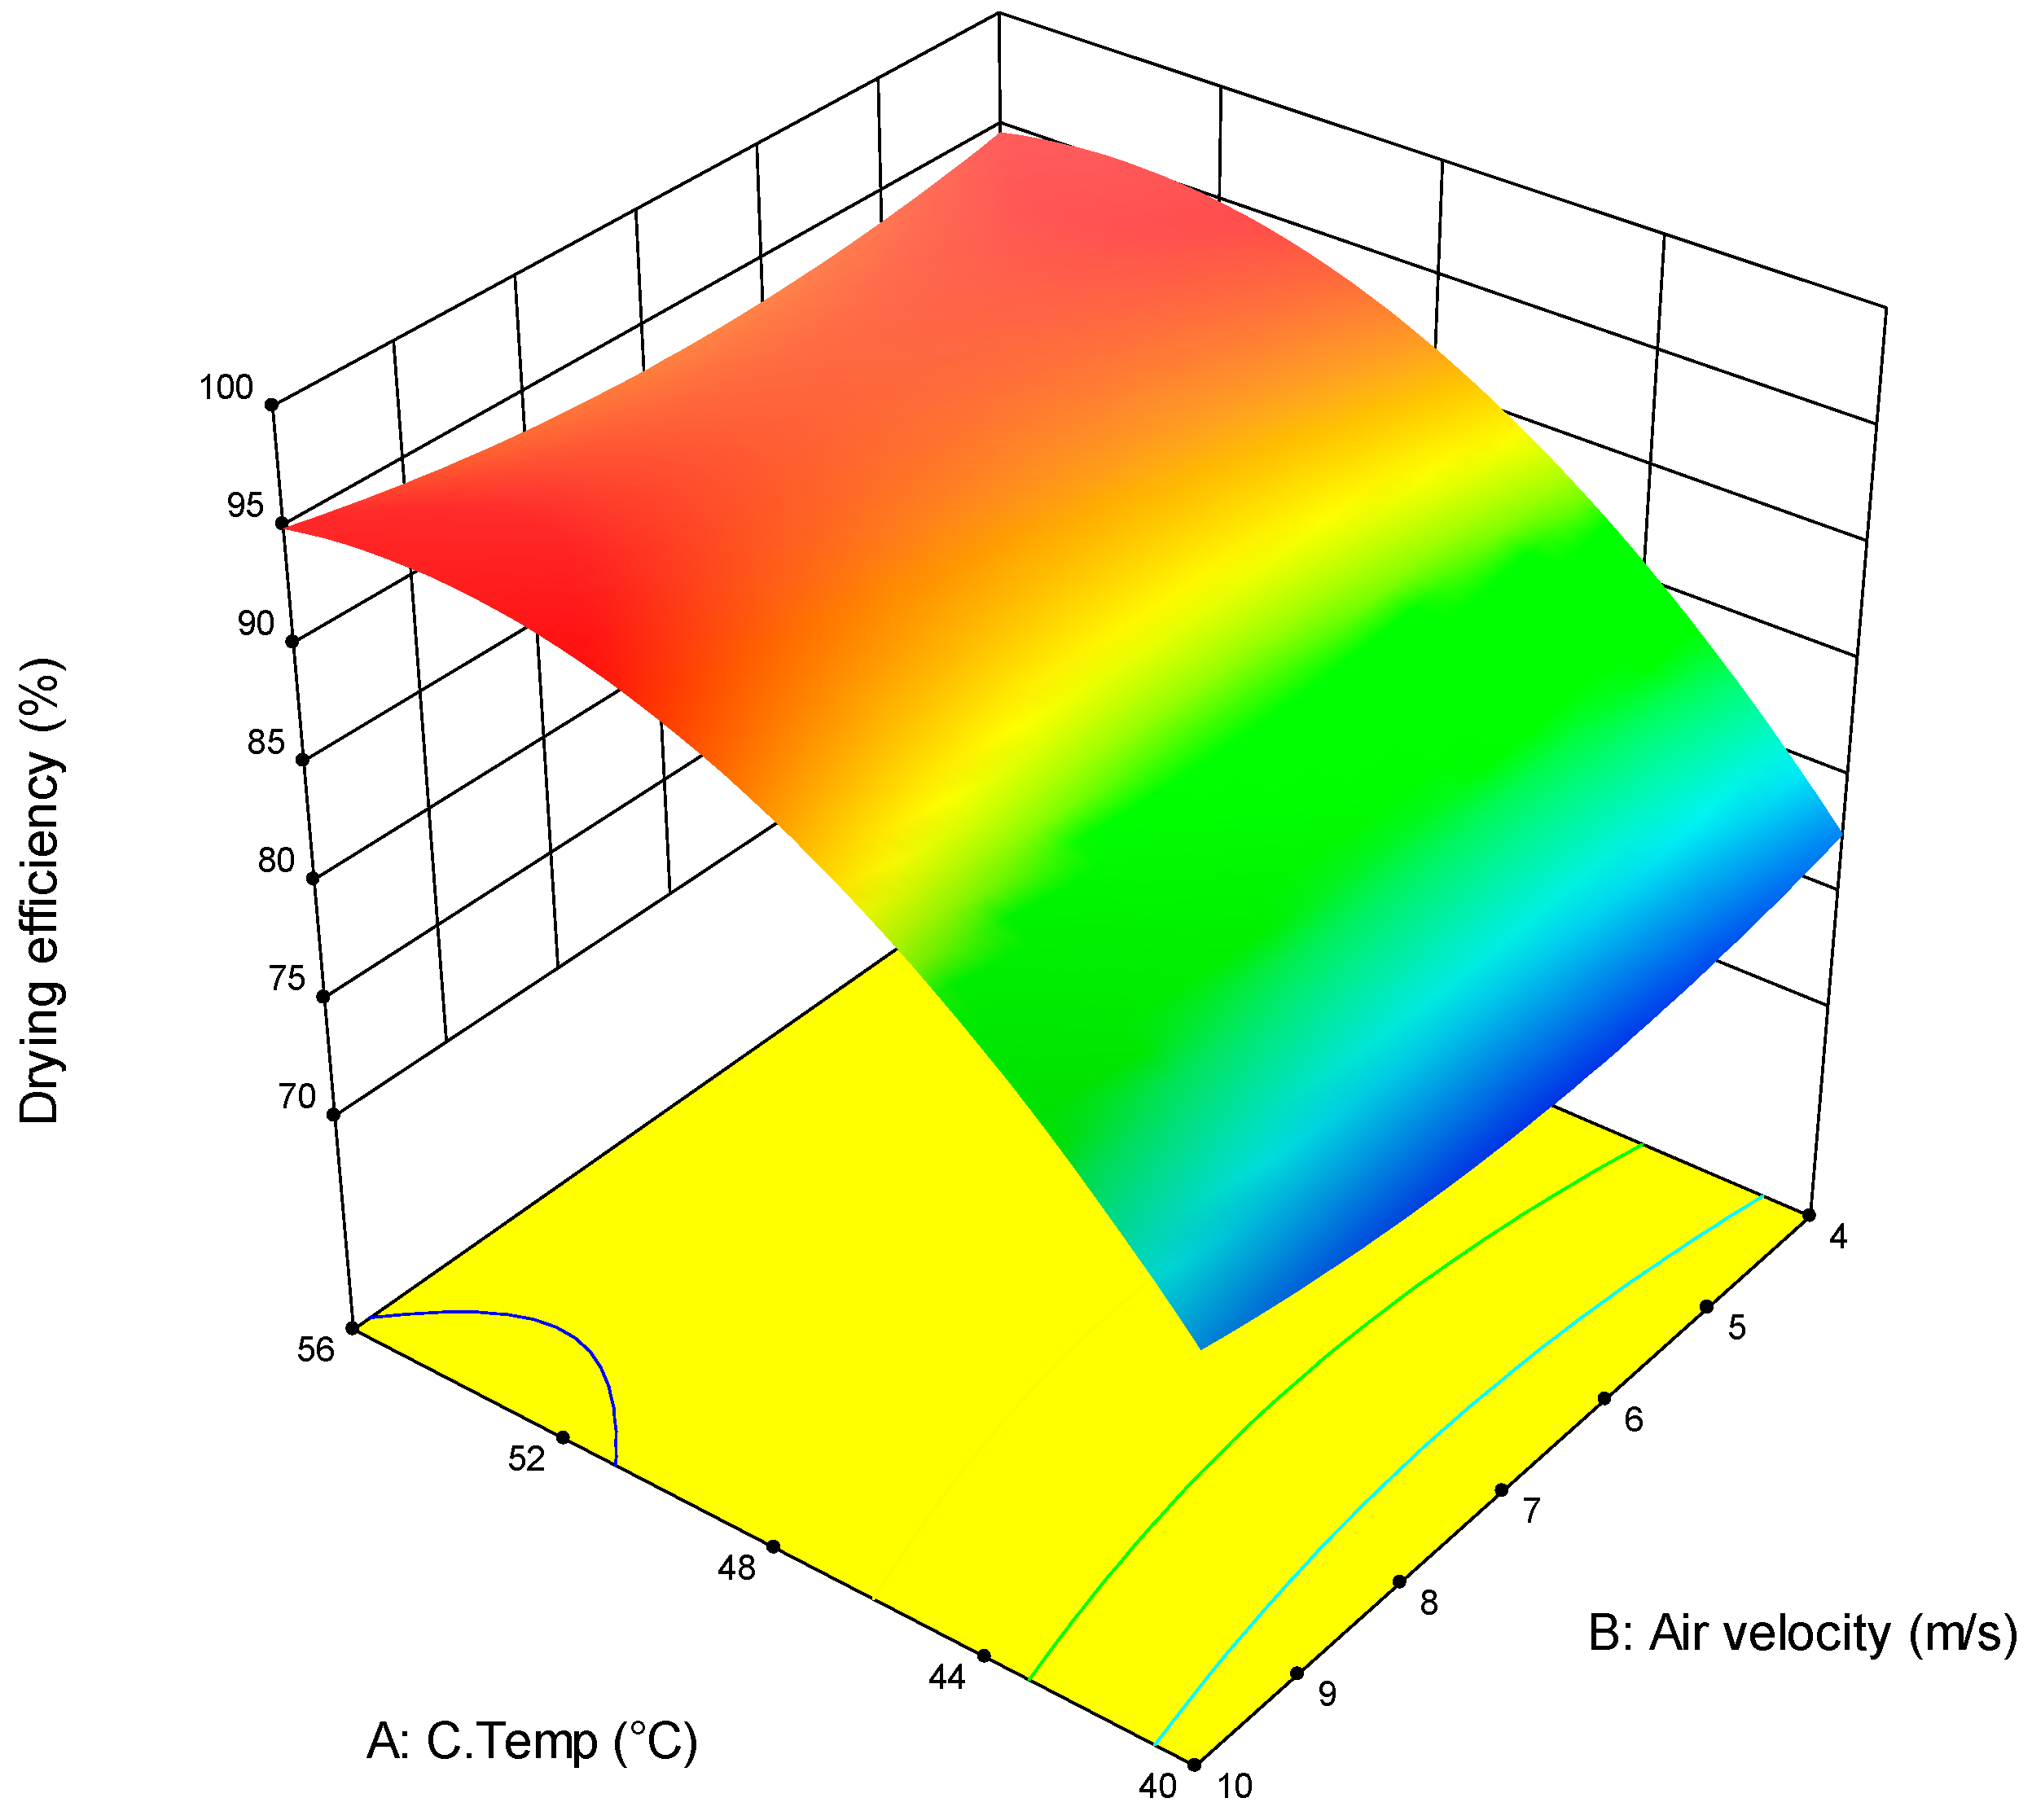
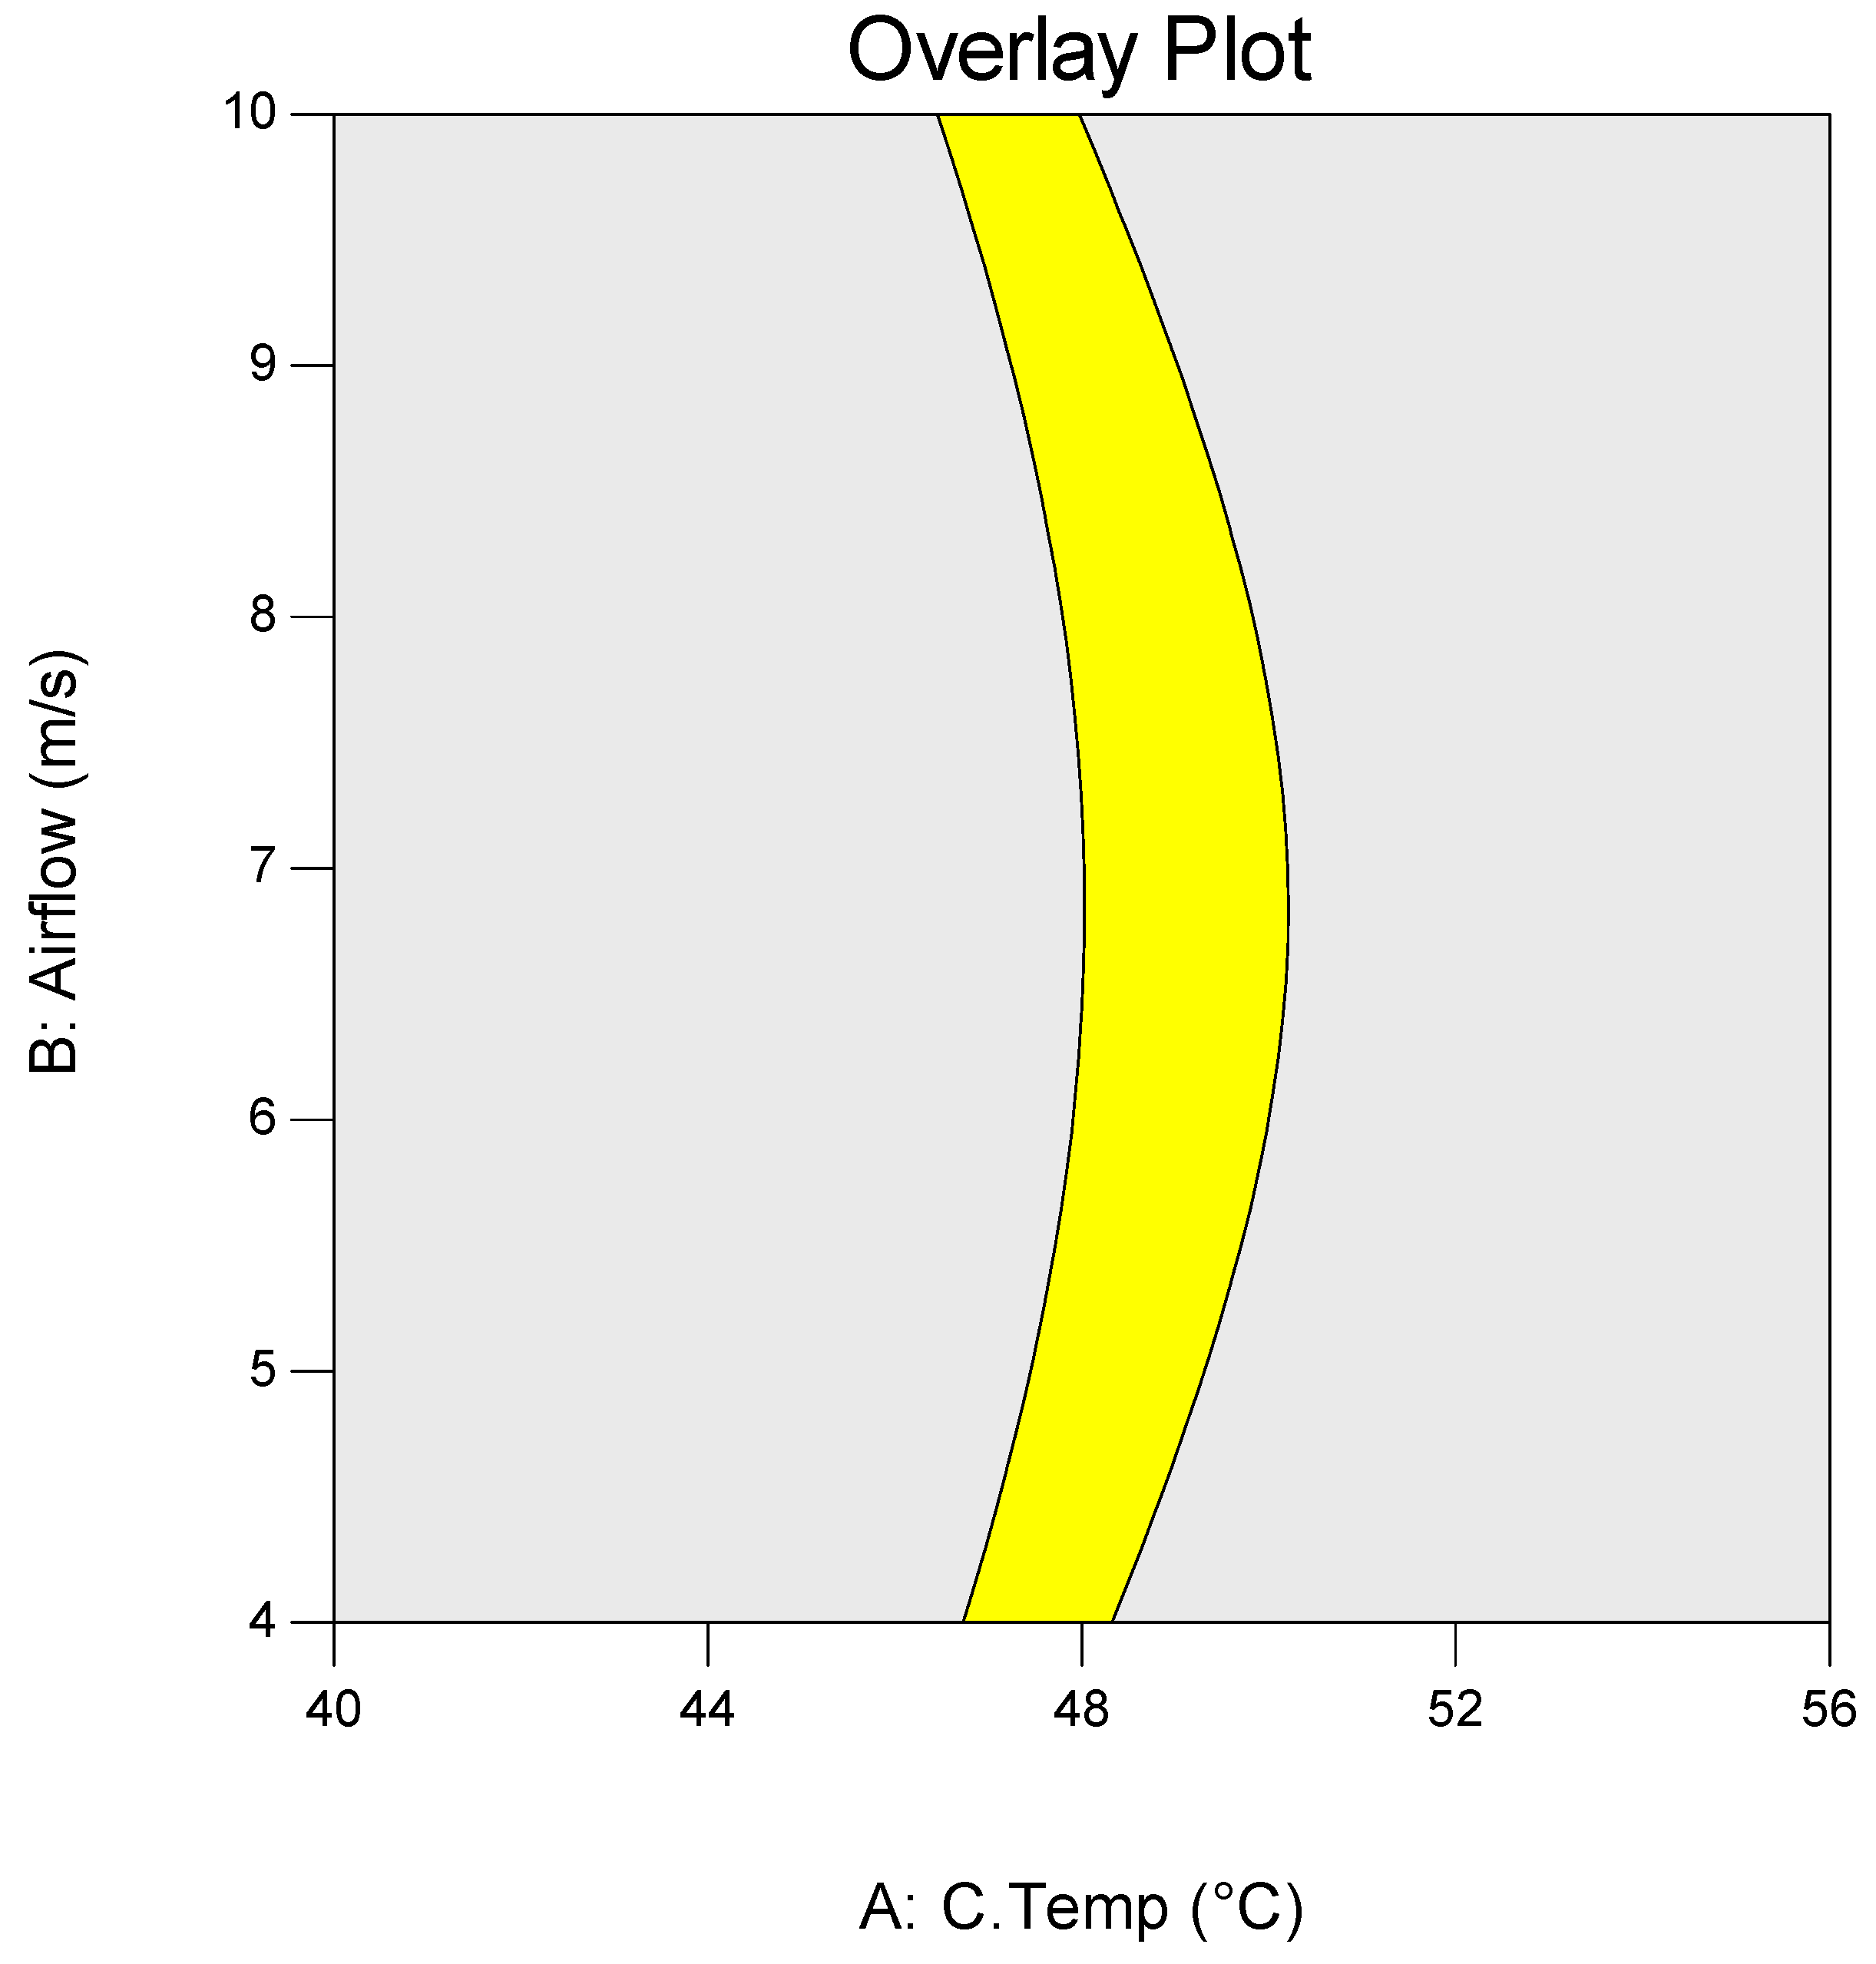
3.2. Dewatering Efficiency Optimisation

An optimisation study has been carried out to identify the highest efficiency achievable when the factors air temperature and air velocity are minimised. The response surface obtained is shown in Figure 4. A numerical optimisation provided by Design-Expert 10.5 (MN, USA) was applied to the RSM dataset, followed by a graphical optimisation. A numerical study will provide the ideal factor levels to achieve the highest dewatering efficiency, while the graphical method investigation will result in a chart that associates the factor levels to an area of target efficiency defined by the user. In numerical optimisation, levels of importance were attributed to each factor and response criteria. The optimization criteria consisted of maximising the dewatering efficiency while minimising the operating temperature. Factors A (temperature) and B (air velocity) were minimised with importances of 3 and 2 respectively, and the dewatering efficiency was maximised with an importance of 5. An optimal dewatering efficiency 92.83% was achieved at air velocity 4 m/s and air temperature 48 °C.
To verify the model fit, three confirmation experiments were carried out using test conditions which are within the initially defined experimental range. The experimental conditions, the observed and predicted values, and the percentages of error are summarised in Table 3. The errors are all within reasonable tolerances.
The graphical optimisation is shown in Figure 5, allowing a selection of the best process parameters by visual inspection. The target area in yellow is delimited by two curves corresponding to the criteria set by the authors. Lower and upper limits of such areas are respectively 90.99% and 92.83%; these values were obtained from numerical optimisation. The grey areas indicate the values that do not meet the criteria proposed by the authors.

4. Conclusions

In this study, a tray drier unit was used to dewater Scenedesmus quadricauda. The parameters essential for the tray drier dewatering conditions were identified and optimised. The optimisation criteria were set for a maximised dewatering efficiency while minimizing the air temperature and air velocity, since these parameters are directly linked to energy consumption, as energy per 1 kg of dry algae was 0.34 kWh. An optimum dewatering efficiency of 92.83% was achieved. From the present study, a tray drier unit was shown to be an effective method for dewatering microalgae. These results suggest that tray driers may be applied to other microalgae species for enhanced dewatering.

Author Contributions

R.C.A., A.D. and A.G.O. conceptualized the techniques, R.C.A. performed the experiments, R.C.A. and C.R. analysed and optimised the data, R.C.A. wrote the article, A.G.O. supervised and gave the final approval for the version to be published.

Funding

This research received no external funding.

Conflicts of Interest

The authors declare no conflict of interest.

References

  1. Rawat, I.; Ranjith Kumar, R.; Mutanda, T.; Bux, F. Biodiesel from microalgae: A critical evaluation from laboratory to large scale production. Appl. Energy 2013, 103, 444–467. [Google Scholar] [CrossRef]
  2. Cheruvu, S.; Van Ginkel, S.; Wei, X.; Zhang, X.; Steiner, D.; Rego De Oliveira, S.H.; Xu, C.; Kalil Duarte, L.H.; Salvi, E.; Hu, Z.; et al. Algae harvesting. Membr. Technol. Biorefining 2016, 309–328. [Google Scholar] [CrossRef]
  3. Onumaegbu, C.; Alaswad, A.; Rodriguez, C.; Olabi, A. Optimization of Pre-Treatment Process Parameters to Generate Biodiesel from Microalga. Energies 2018, 11, 806. [Google Scholar] [CrossRef]
  4. Chng, L.M.; Lee, K.T.; Chan, D.J.C. Synergistic effect of pretreatment and fermentation process on carbohydrate-rich Scenedesmus dimorphus for bioethanol production. Energy Convers. Manag. 2017, 141, 410–419. [Google Scholar] [CrossRef]
  5. González-González, L.M.; Zhou, L.; Astals, S.; Thomas-Hall, S.R.; Eltanahy, E.; Pratt, S.; Jensen, P.D.; Schenk, P.M. Biogas production coupled to repeat microalgae cultivation using a closed nutrient loop. Bioresour. Technol. 2018, 263, 625–630. [Google Scholar] [CrossRef] [PubMed]
  6. Shan, X.; Lin, M. Effects of algae and live food density on the feeding ability, growth and survival of miiuy croaker during early development. Aquaculture 2014, 428–429, 284–289. [Google Scholar] [CrossRef]
  7. Rugnini, L.; Costa, G.; Congestri, R.; Bruno, L. Testing of two different strains of green microalgae for Cu and Ni removal from aqueous media. Sci. Total Environ. 2017, 601–602, 959–967. [Google Scholar] [CrossRef] [PubMed]
  8. Skjånes, K.; Lindblad, P.; Muller, J. BioCO2—A multidisciplinary, biological approach using solar energy to capture CO2 while producing H2 and high value products. Biomol. Eng. 2007, 24, 405–413. [Google Scholar] [CrossRef] [PubMed]
  9. Hattab Al, M.; Ghaly, A.; Hammoud, A. Microalgae Harvesting Methods for Industrial Production of Biodiesel: Critical Review and Comparative Analysis. J. Fundam. Renew. Energy Appl. 2015, 5, 1000154. [Google Scholar] [CrossRef]
  10. Sahoo, N.K.; Gupta, S.K.; Rawat, I.; Ansari, F.A.; Singh, P.; Naik, S.N.; Bux, F. Sustainable dewatering and drying of self-flocculating microalgae and study of cake properties. J. Clean. Prod. 2017, 159, 248–256. [Google Scholar] [CrossRef]
  11. Hernández Leal, L.; Temmink, H.; Zeeman, G.; Buisman, C.J.N. Bioflocculation of grey water for improved energy recovery within decentralized sanitation concepts. Bioresour. Technol. 2010, 101, 9065–9070. [Google Scholar] [CrossRef] [PubMed]
  12. Anyanwu, R.C.; Rodriguez, C.; Durrant, A.; Olabi, A.G. Micro-Macroalgae Properties and Applications. In Reference Module in Materials Science and Materials Engineering; Hashmi, S., Ed.; Elsevier: New York, NY, USA, 2018. [Google Scholar]
  13. Anyanwu, R.C.; Rodriguez, C.; Durrant, A.; Olabi, A.G. Microalgae Cultivation Technologies. Modul. Mater. Sci. Mater. Eng. 2018. [Google Scholar] [CrossRef]
  14. Jakob, G.; Stephens, E.; Feller, R.; Oey, M.; Hankamer, B.; Ross, I.L. Triggered exocytosis of the protozoan Tetrahymena as a source of bioflocculation and a controllable dewatering method for efficient harvest of microalgal cultures. Algal Res. 2016, 13, 148–158. [Google Scholar] [CrossRef]
  15. Kim, D.G.; La, H.J.; Ahn, C.Y.; Park, Y.H.; Oh, H.M. Harvest of Scenedesmus sp. with bioflocculant and reuse of culture medium for subsequent high-density cultures. Bioresour. Technol. 2011, 102, 3163–3168. [Google Scholar] [CrossRef] [PubMed]
  16. Ummalyma, S.B.; Gnansounou, E.; Sukumaran, R.K.; Sindhu, R.; Pandey, A.; Sahoo, D. Bioflocculation: An alternative strategy for harvesting of microalgae—An overview. Bioresour. Technol. 2017, 242, 227–235. [Google Scholar] [CrossRef] [PubMed]
  17. Van De Staey, G.; Smits, K.; Smets, I. An experimental study on the impact of bioflocculation on activated sludge separation techniques. Sep. Purif. Technol. 2015, 141, 94–104. [Google Scholar] [CrossRef]
  18. Cho, K.; Hur, S.P.; Lee, C.H.; Ko, K.; Lee, Y.J.; Kim, K.N.; Kim, M.S.; Chung, Y.H.; Kim, D.; Oda, T. Bioflocculation of the oceanic microalga Dunaliella salina by the bloom-forming dinoflagellate Heterocapsa circularisquama, and its effect on biodiesel properties of the biomass. Bioresour. Technol. 2016, 202, 257–261. [Google Scholar] [CrossRef] [PubMed]
  19. Ndikubwimana, T.; Zeng, X.; He, N.; Xiao, Z.; Xie, Y.; Chang, J.-S.; Lin, L.; Lu, Y. Microalgae biomass harvesting by bioflocculation-interpretation by classical DLVO theory. Biochem. Eng. J. 2015, 101, 160–167. [Google Scholar] [CrossRef]
  20. Zhou, W.; Min, M.; Hu, B.; Ma, X.; Liu, Y.; Wang, Q.; Shi, J.; Chen, P.; Ruan, R. Filamentous fungi assisted bio-flocculation: A novel alternative technique for harvesting heterotrophic and autotrophic microalgal cells. Sep. Purif. Technol. 2013, 107, 158–165. [Google Scholar] [CrossRef]
  21. Buckwalter, P.; Embaye, T.; Gormly, S.; Trent, J.D. Dewatering microalgae by forward osmosis. Desalination 2013, 312, 19–22. [Google Scholar] [CrossRef]
  22. Son, J.; Sung, M.; Ryu, H.; Oh, Y.-K.; Han, J.-I. Microalgae dewatering based on forward osmosis employing proton exchange membrane. Bioresour. Technol. 2017, 244, 57–62. [Google Scholar] [CrossRef] [PubMed]
  23. Kim, D.I.; Choi, J.; Hong, S. Evaluation on suitability of osmotic dewatering through forward osmosis (FO) for xylose concentration. Sep. Purif. Technol. 2018, 191, 225–232. [Google Scholar] [CrossRef]
  24. Lee, S.; Shon, H.K.; Hong, S. Dewatering of activated sludge by forward osmosis (FO) with ultrasound for fouling control. Desalination 2017, 421, 79–88. [Google Scholar] [CrossRef]
  25. Morowvat, M.H.; Ghasemi, Y. Culture medium optimization for enhanced β-carotene and biomass production by Dunaliella salina in mixotrophic culture. Biocatal. Agric. Biotechnol. 2016, 7, 217–223. [Google Scholar] [CrossRef]
  26. Tiroutchelvame, D. Studies on the drying characteristics of ginger flakes. Master’s Thesis, Indira Gandhi Agricultural University, Chhattisgarh, India, 2000. [Google Scholar]
  27. Ekpeni, L.E.N.; Benyounis, K.Y.; Nkem-Ekpeni, F.F.; Stokes, J.; Olabi, A.G. Underlying factors to consider in improving energy yield from biomass source through yeast use on high-pressure homogenizer (hph). Energy 2015, 81, 74–83. [Google Scholar] [CrossRef] [Green Version]
  28. Sarrai, A.E.; Hanini, S.; Merzouk, N.K.; Tassalit, D.; Szabó, T.; Hernádi, K.; Nagy, L. Using central composite experimental design to optimize the degradation of Tylosin from aqueous solution by Photo-Fenton reaction. Materials 2016, 9, 428. [Google Scholar] [CrossRef] [PubMed]
  29. Tedesco, S.; Marrero Barroso, T.; Olabi, A.G. Optimization of mechanical pre-treatment of Laminariaceae spp. biomass-derived biogas. Renew. Energy 2014, 62, 527–534. [Google Scholar] [CrossRef]
  30. Zakir Hossain, S.M.; Mansour, N.; Sultana, N. Design of a laboratory experiment for the performance analysis of a retrofitted tray dryer unit. Educ. Chem. Eng. 2017, 18, 35–44. [Google Scholar] [CrossRef]
  31. Ghasemkhani, H.; Keyhani, A.; Aghbashlo, M.; Rafiee, S.; Mujumdar, A.S. Improving exergetic performance parameters of a rotating-tray air dryer via a simple heat exchanger. Appl. Therm. Eng. 2016, 94, 13–23. [Google Scholar] [CrossRef] [Green Version]
  32. Misha, S.; Mat, S.; Ruslan, M.H.; Sopian, K.; Salleh, E. The Prediction of Drying Uniformity in Tray Dryer System using CFD Simulation. Int. J. Mach. Learn. Comput. 2013, 3, 419–423. [Google Scholar] [CrossRef]
  33. Shalini, R.; Ranjan, A.; Kumar, N. Studies on the Drying Characteristics of apple pomace on Tray Drier. In Proceedings of the 16th International Drying Symposium (IDS 2008), Hyderabad, India, 9–12 November 2008; pp. 1636–1640. [Google Scholar]
  34. Mahn, A.; Martin, C.; Reyes, A.; Saavedra, A. Evolution of sulforaphane content in sulforaphane-enriched broccoli during tray drying. J. Food Eng. 2016, 186, 27–33. [Google Scholar] [CrossRef]
  35. Colak, N.; Hepbasli, A. Performance analysis of drying of green olive in a tray dryer. J. Food Eng. 2007, 80, 1188–1193. [Google Scholar] [CrossRef]
Figure 1. Tray drier working scheme and unit adopted in the experiment.
Energies 11 02327 g001
Figure 2. Residual plots: Predicted vs. actual (left); Normal residuals (right).
Energies 11 02327 g002
Figure 3. Perturbation plot showing the effect of the air temperature: A and air velocity: B.
Energies 11 02327 g003
Figure 4. Response surface plot showing the effect of temperature and airflow on dewatering efficiency.
Energies 11 02327 g004
Figure 5. Optimum region with the highest software estimated dewatering efficiency.
Energies 11 02327 g005
Table 1. Optimisation parameters, experimental range and level of independent variables.
Independent Variable−101
A: Temperature (°C)404856
B: Air Velocity (m/s)4710
Table 2. Design Matrix and measured dewatering efficiency yield.
RunFactor A
Temperature (°C)
Factor B
Air Velocity (m/s)
Response
Dewatering Efficiency (%)
140775.10 ± 0.17
256493.89 ± 2.08
3401079.12 ± 0.14
448493.14 ± 0.06
540478.11 ± 0.01
648792.33 ± 0.01
748791.11 ± 0.81
848789.71 ± 0.10
956794.55 ± 0.12
10561094.83 ± 0.22
1148789.32 ± 0.16
12481092.28 ± 0.04
1348792.28 ± 0.04
Table 3. Confirmation experiments.
ExperimentTemperature (°C)Air Velocity (m/s) DE (%)
14210Actual79.45
Predicted83.02
Error (%)−4.05
2506Actual93.89
Predicted92.81
Error (%)1.15
3554Actual93.64
Predicted95.19
Error (%)−1.66

