A Review of Tip Clearance in Propeller, Pump and Turbine


Abstract
:1. Introduction
- (1)
- Flow mechanism and vortex dynamics in the tip-clearance region;
- (2)
- Influence of tip clearance on the energy performance of pumps and turbines;
- (3)
- Operation stability of pumps and turbines with tip clearance;
- (4)
- Influence parameters of tip clearance and optimization strategies for propellers, pumps and turbines.
2. Experimental Study on Flow Mechanism near Tip-Clearance Region
2.1. Flow Pattern Near Hydrofoil
2.2. Two-Dimensional Structure and Evolution of Tip-Leakage Vortex (TLV)
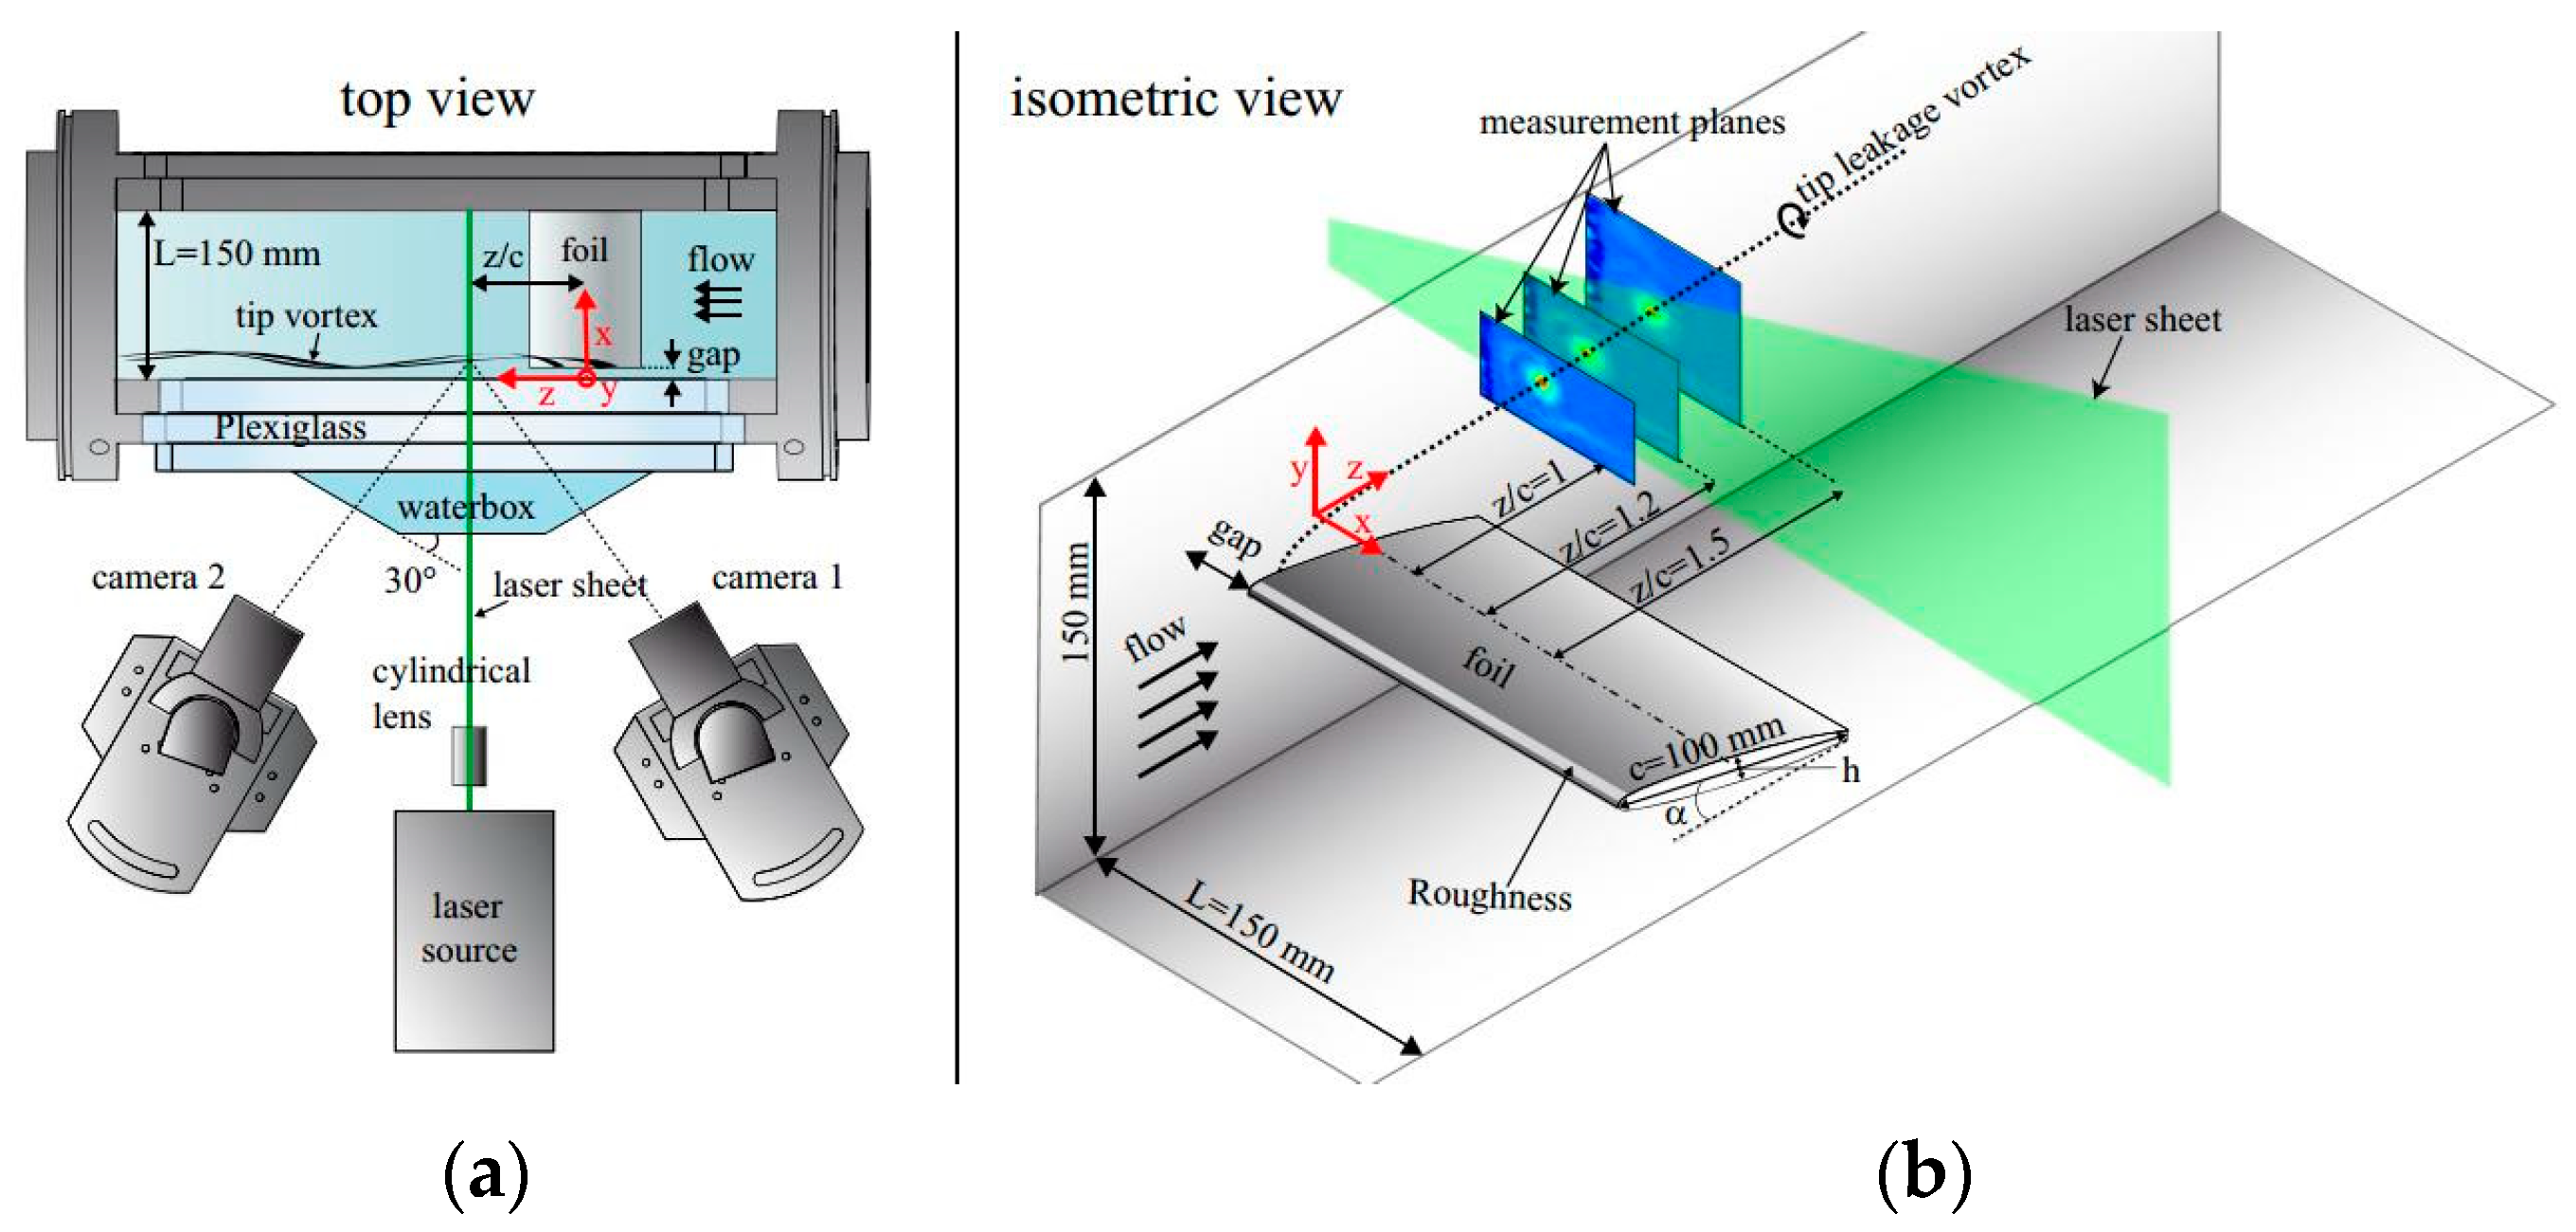
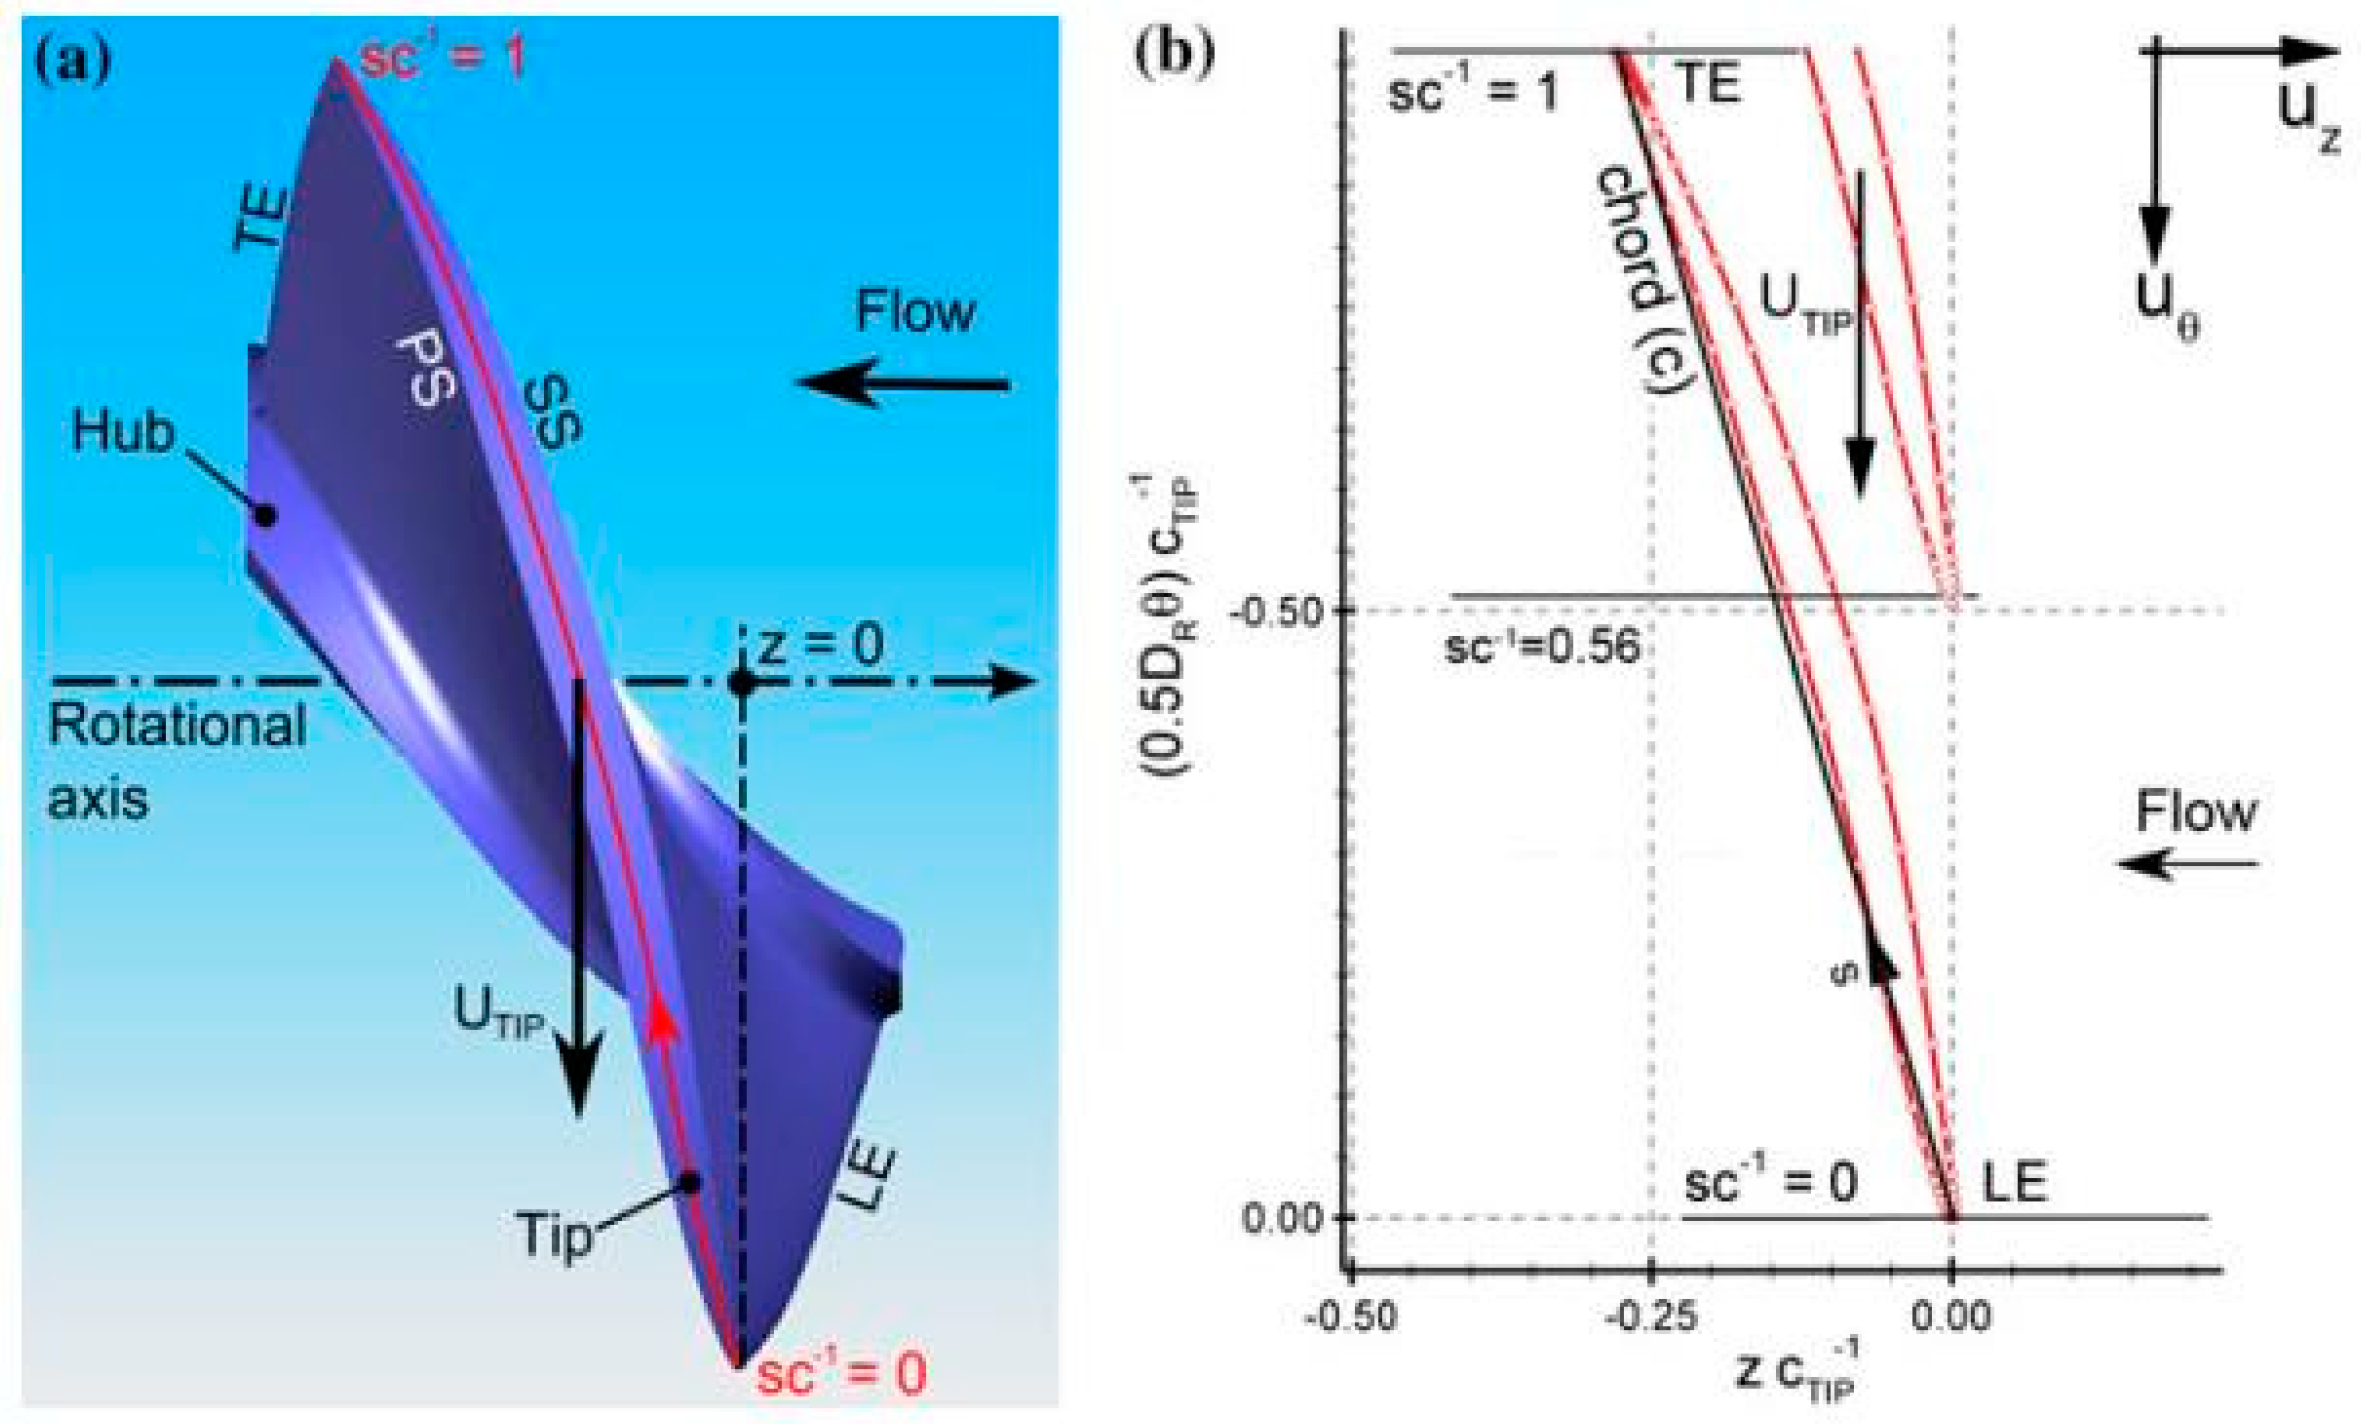
2.3. Three Dimensional Structure and Evolution of TLV
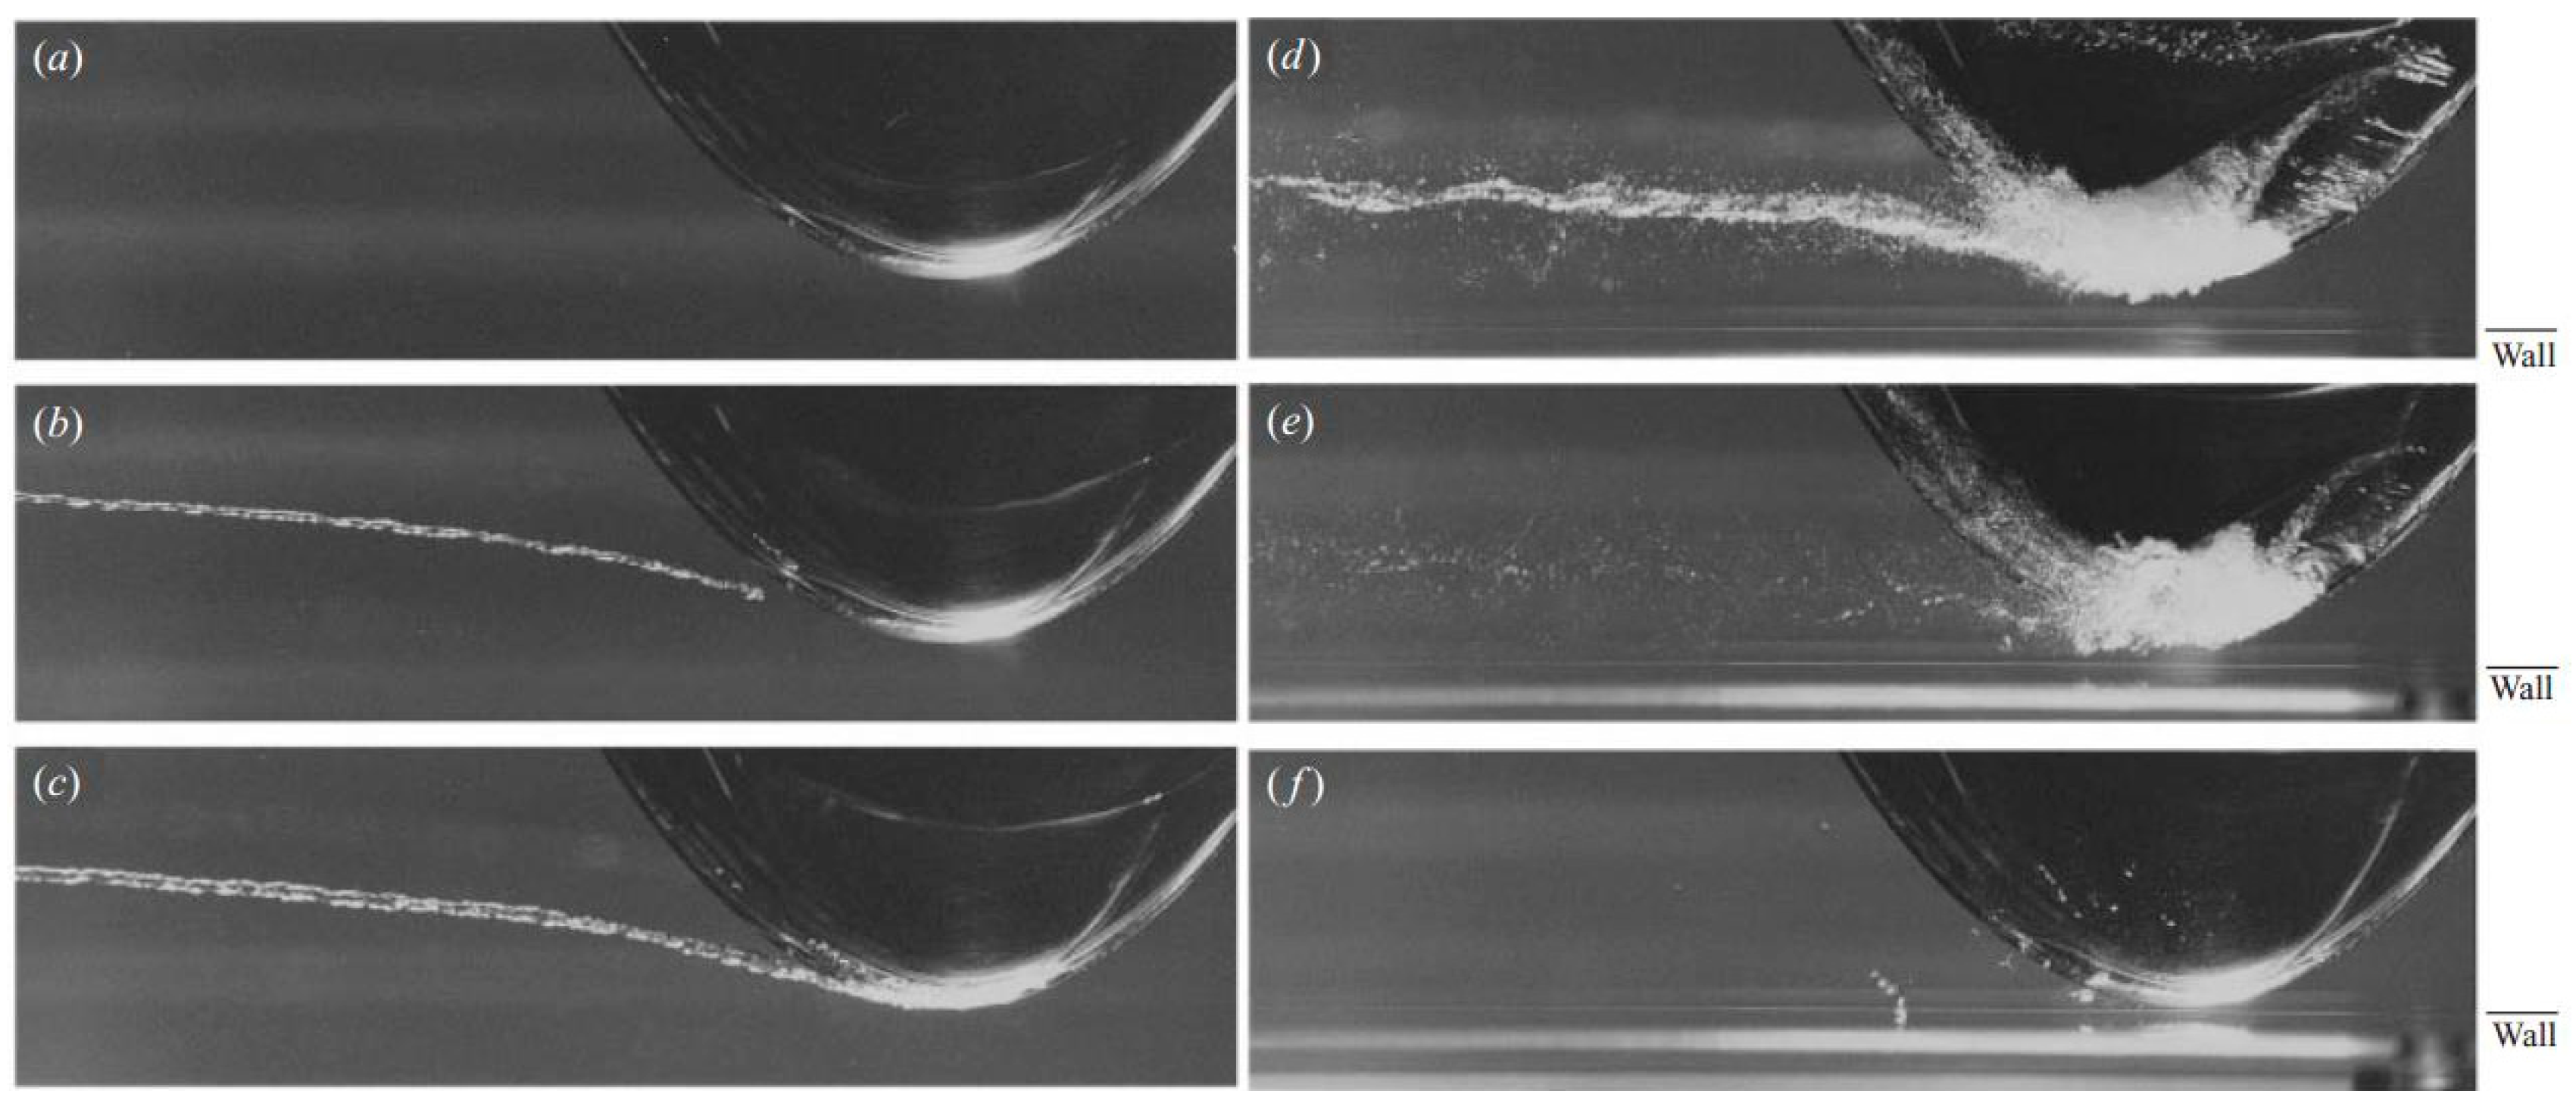
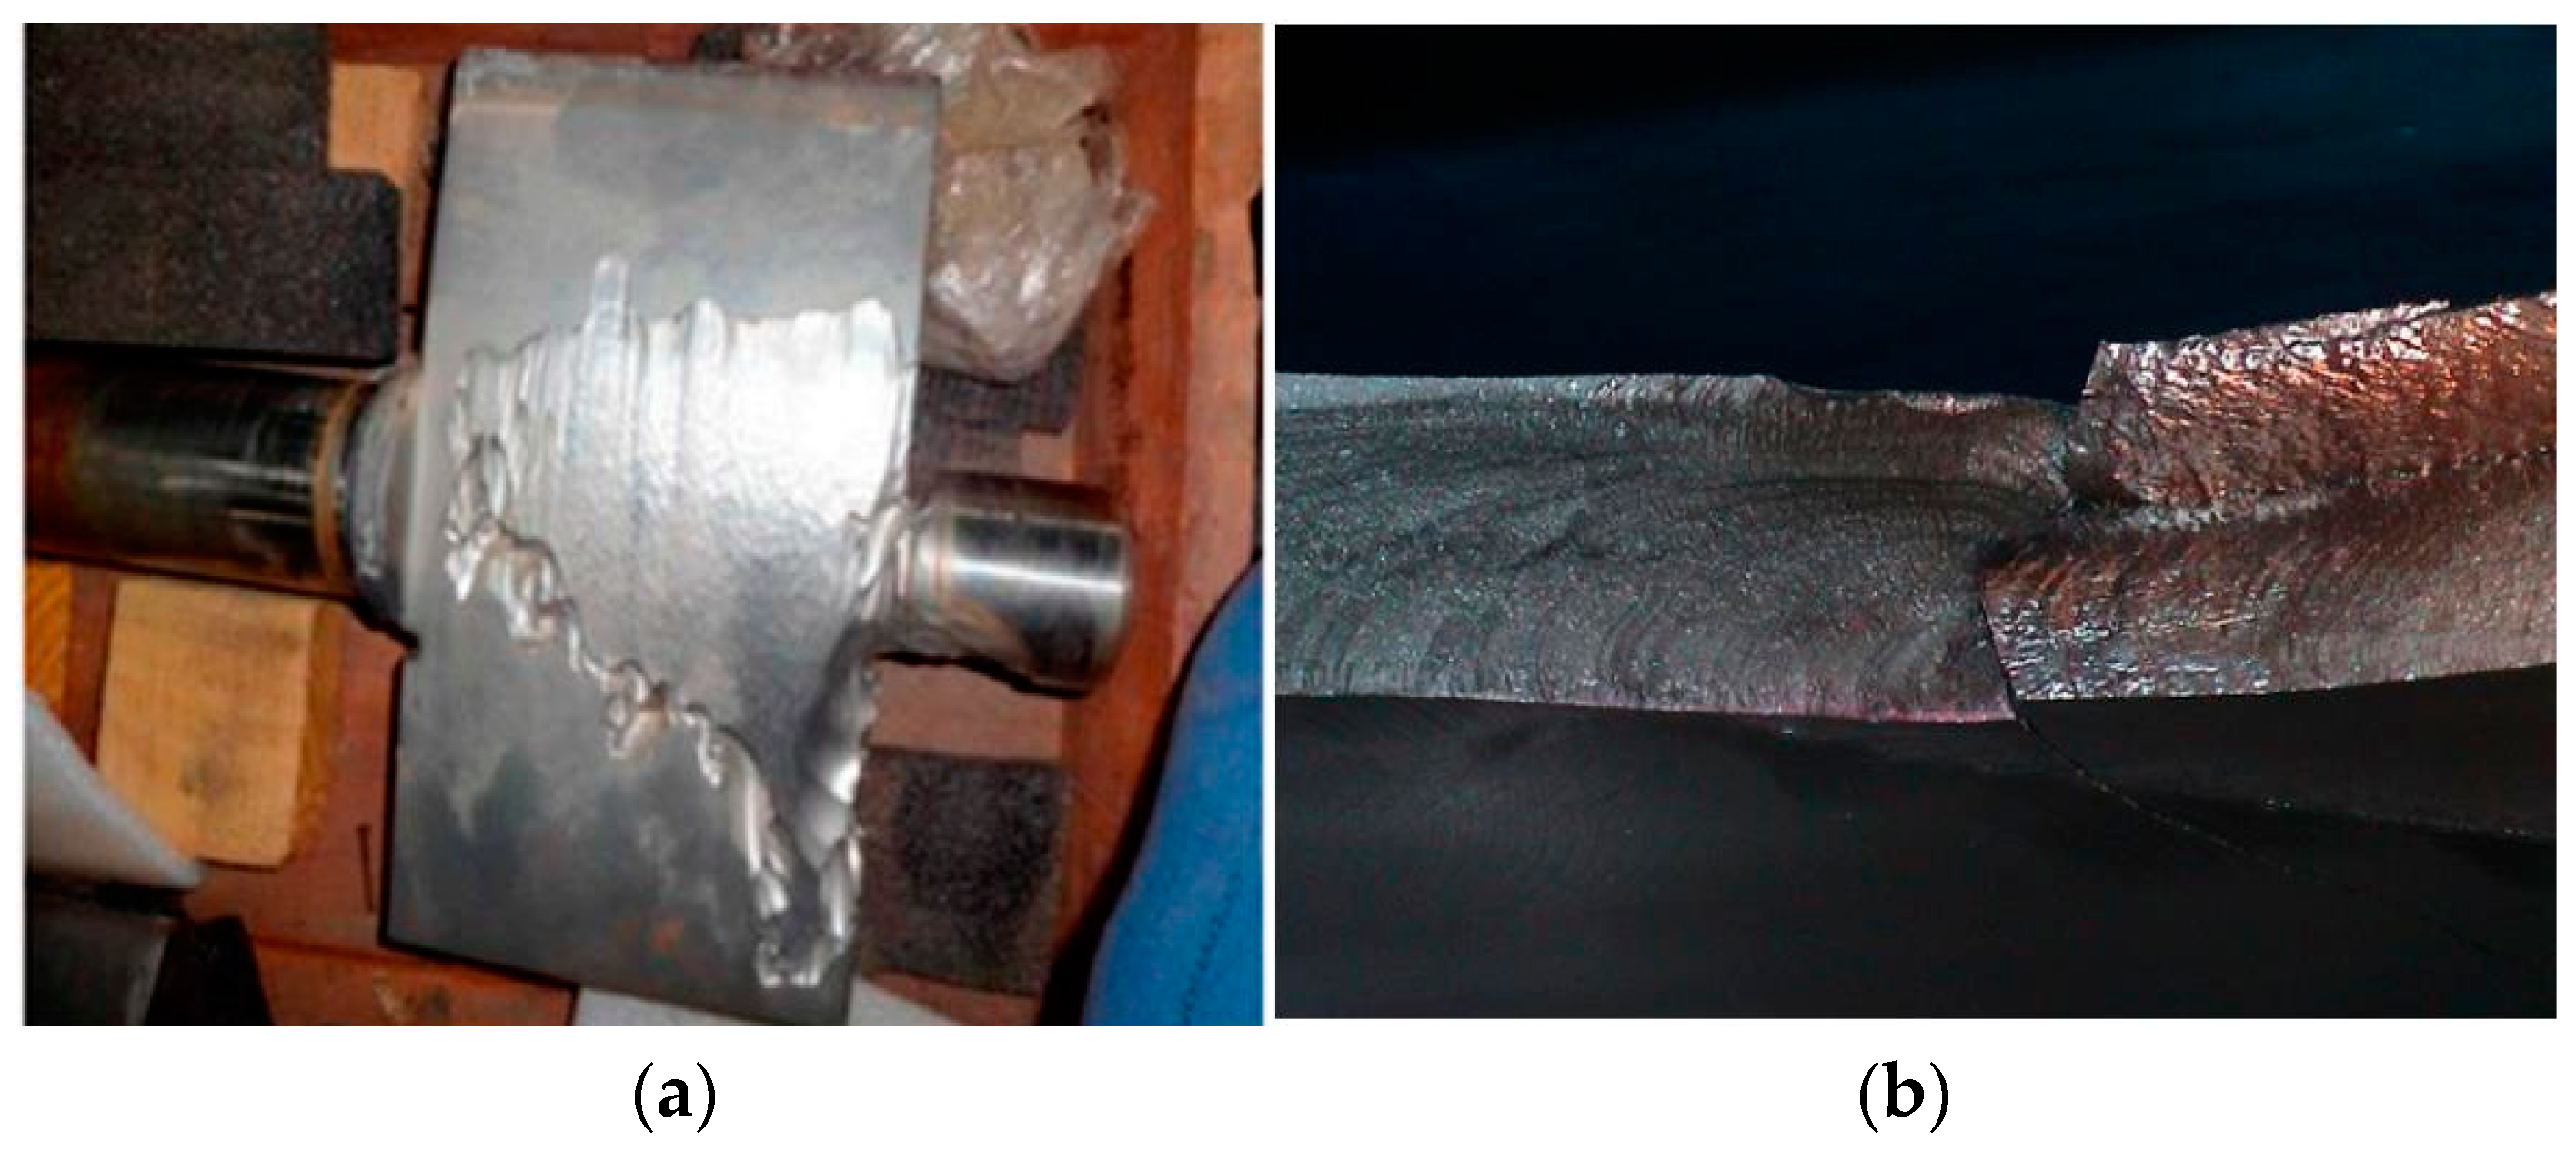
2.4. Cavitation Behavior
3. Numerical Study on Flow Mechanism near Tip-Clearance Region
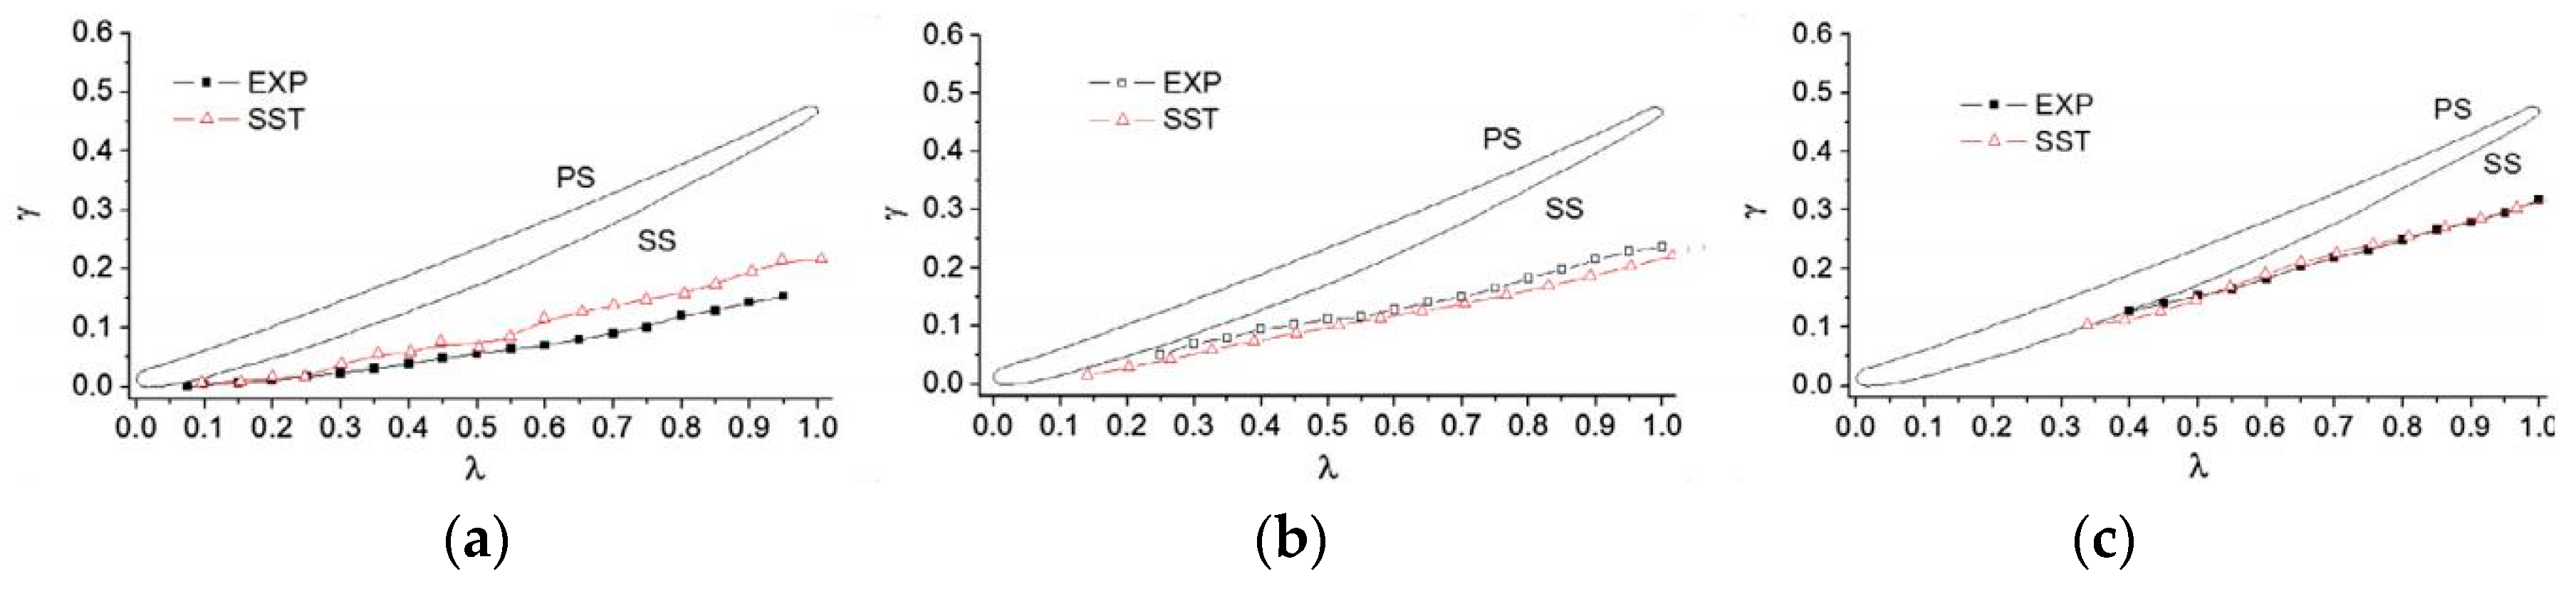
3.1. Comparison and Validation of Numerical Methods
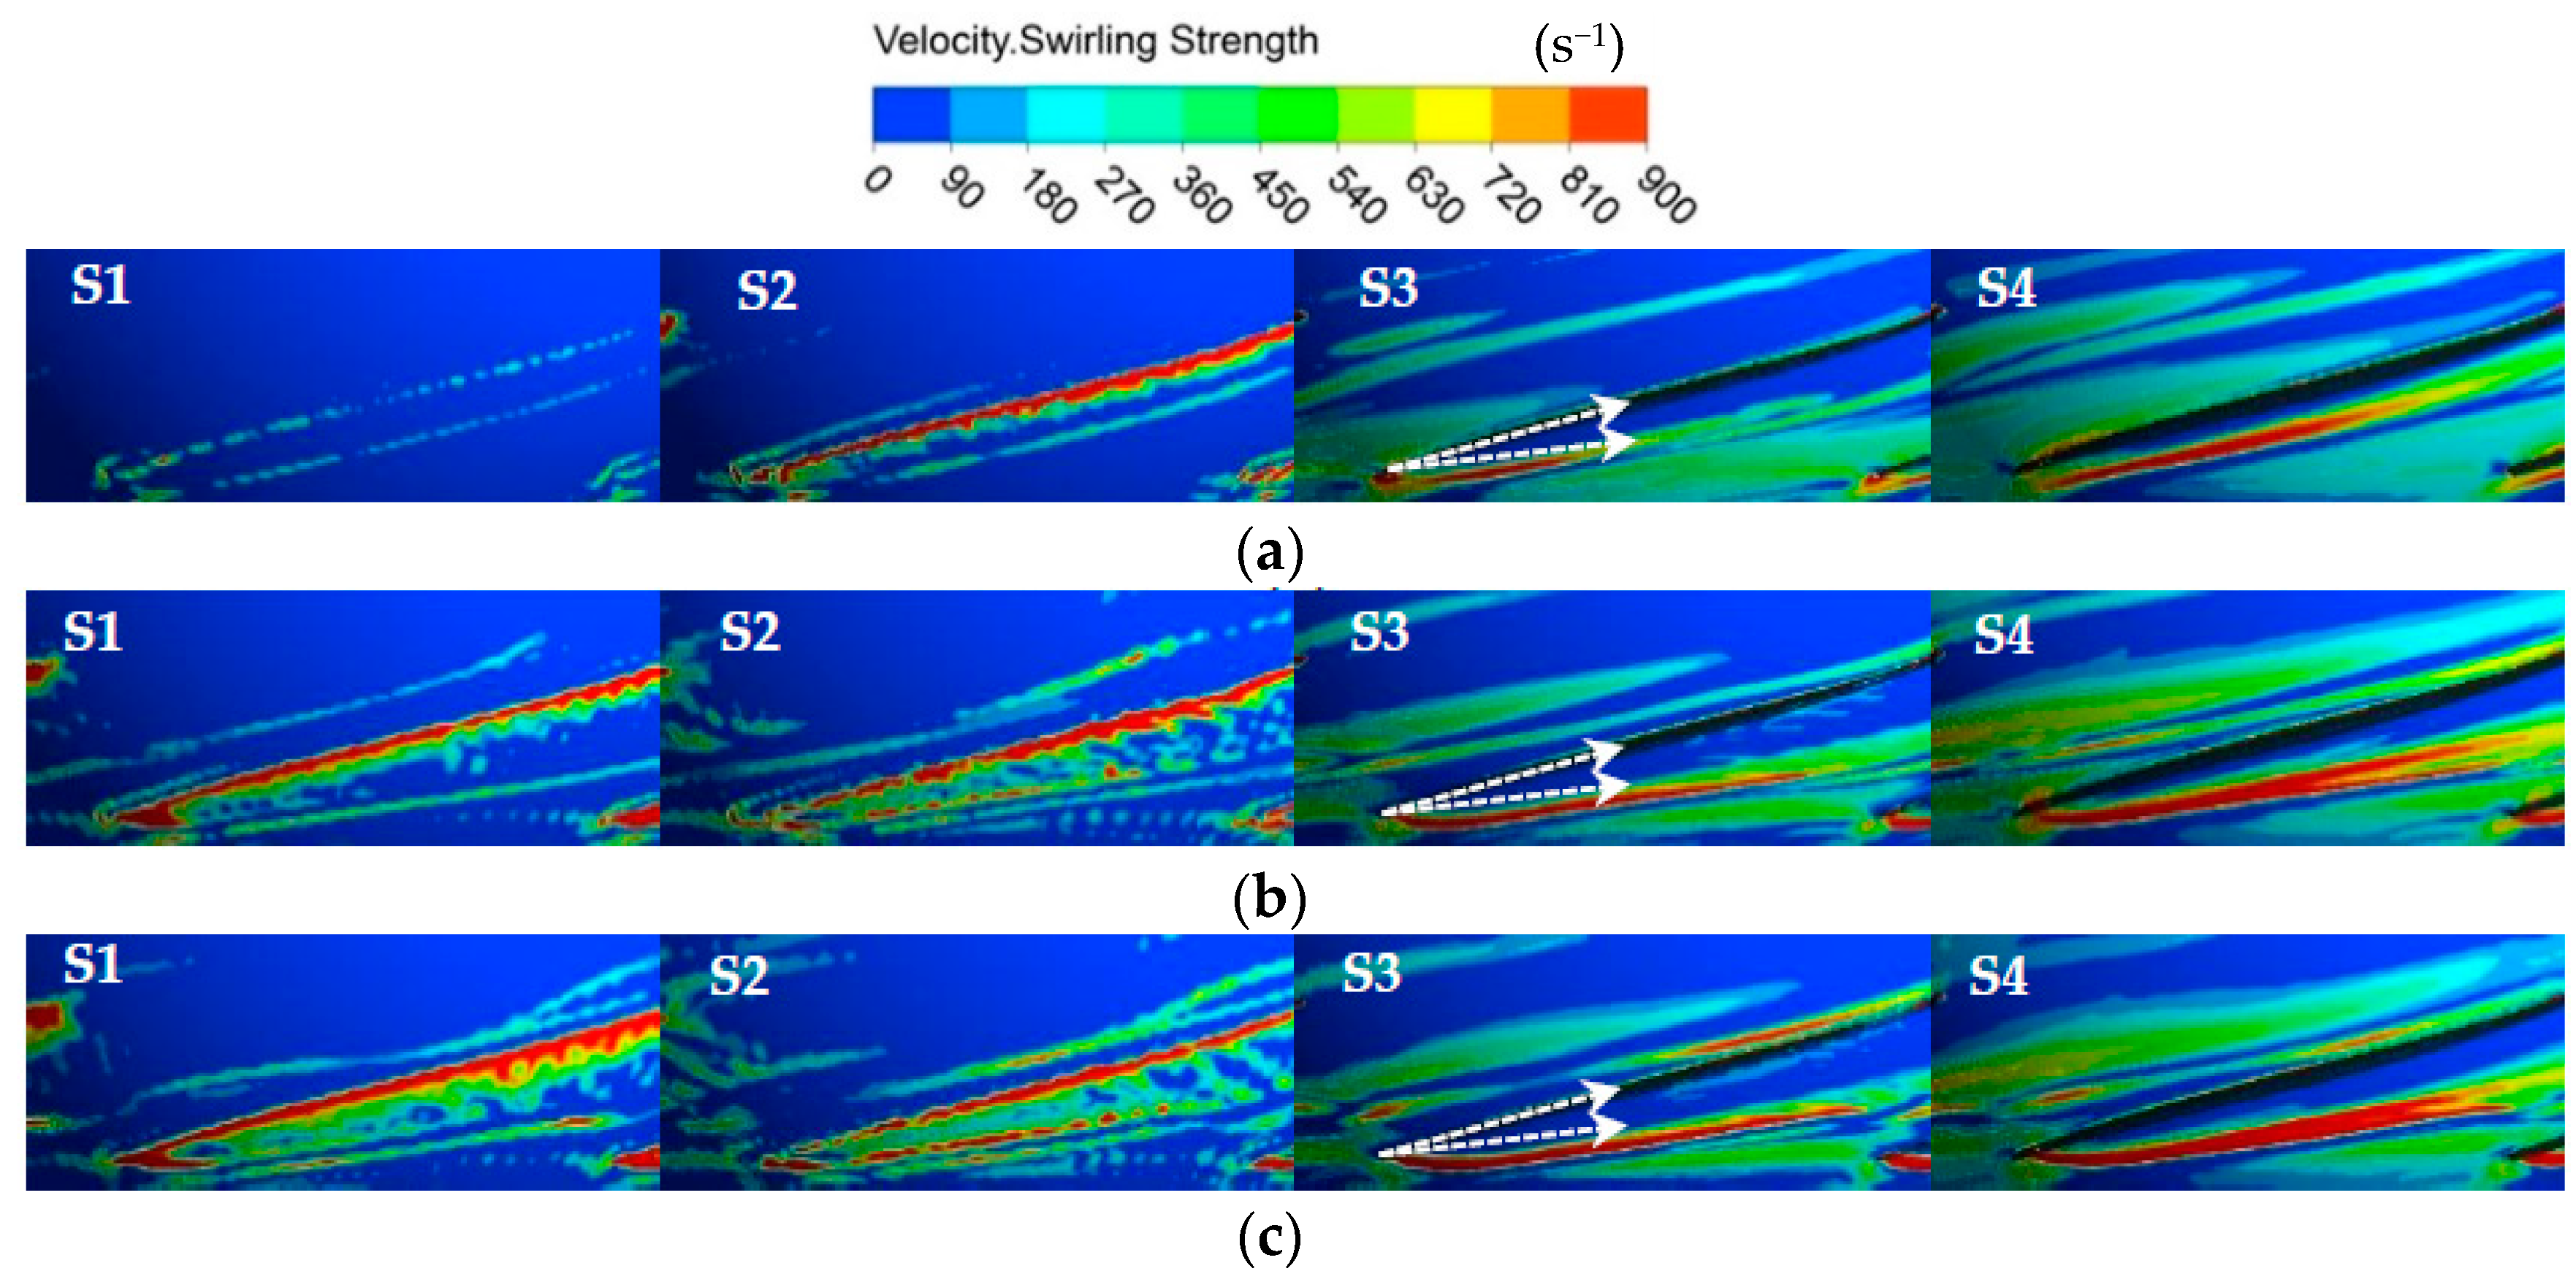
3.2. Vortex Types and Corresponding Characteristics
3.3. TLV Trajectory and Related Factors
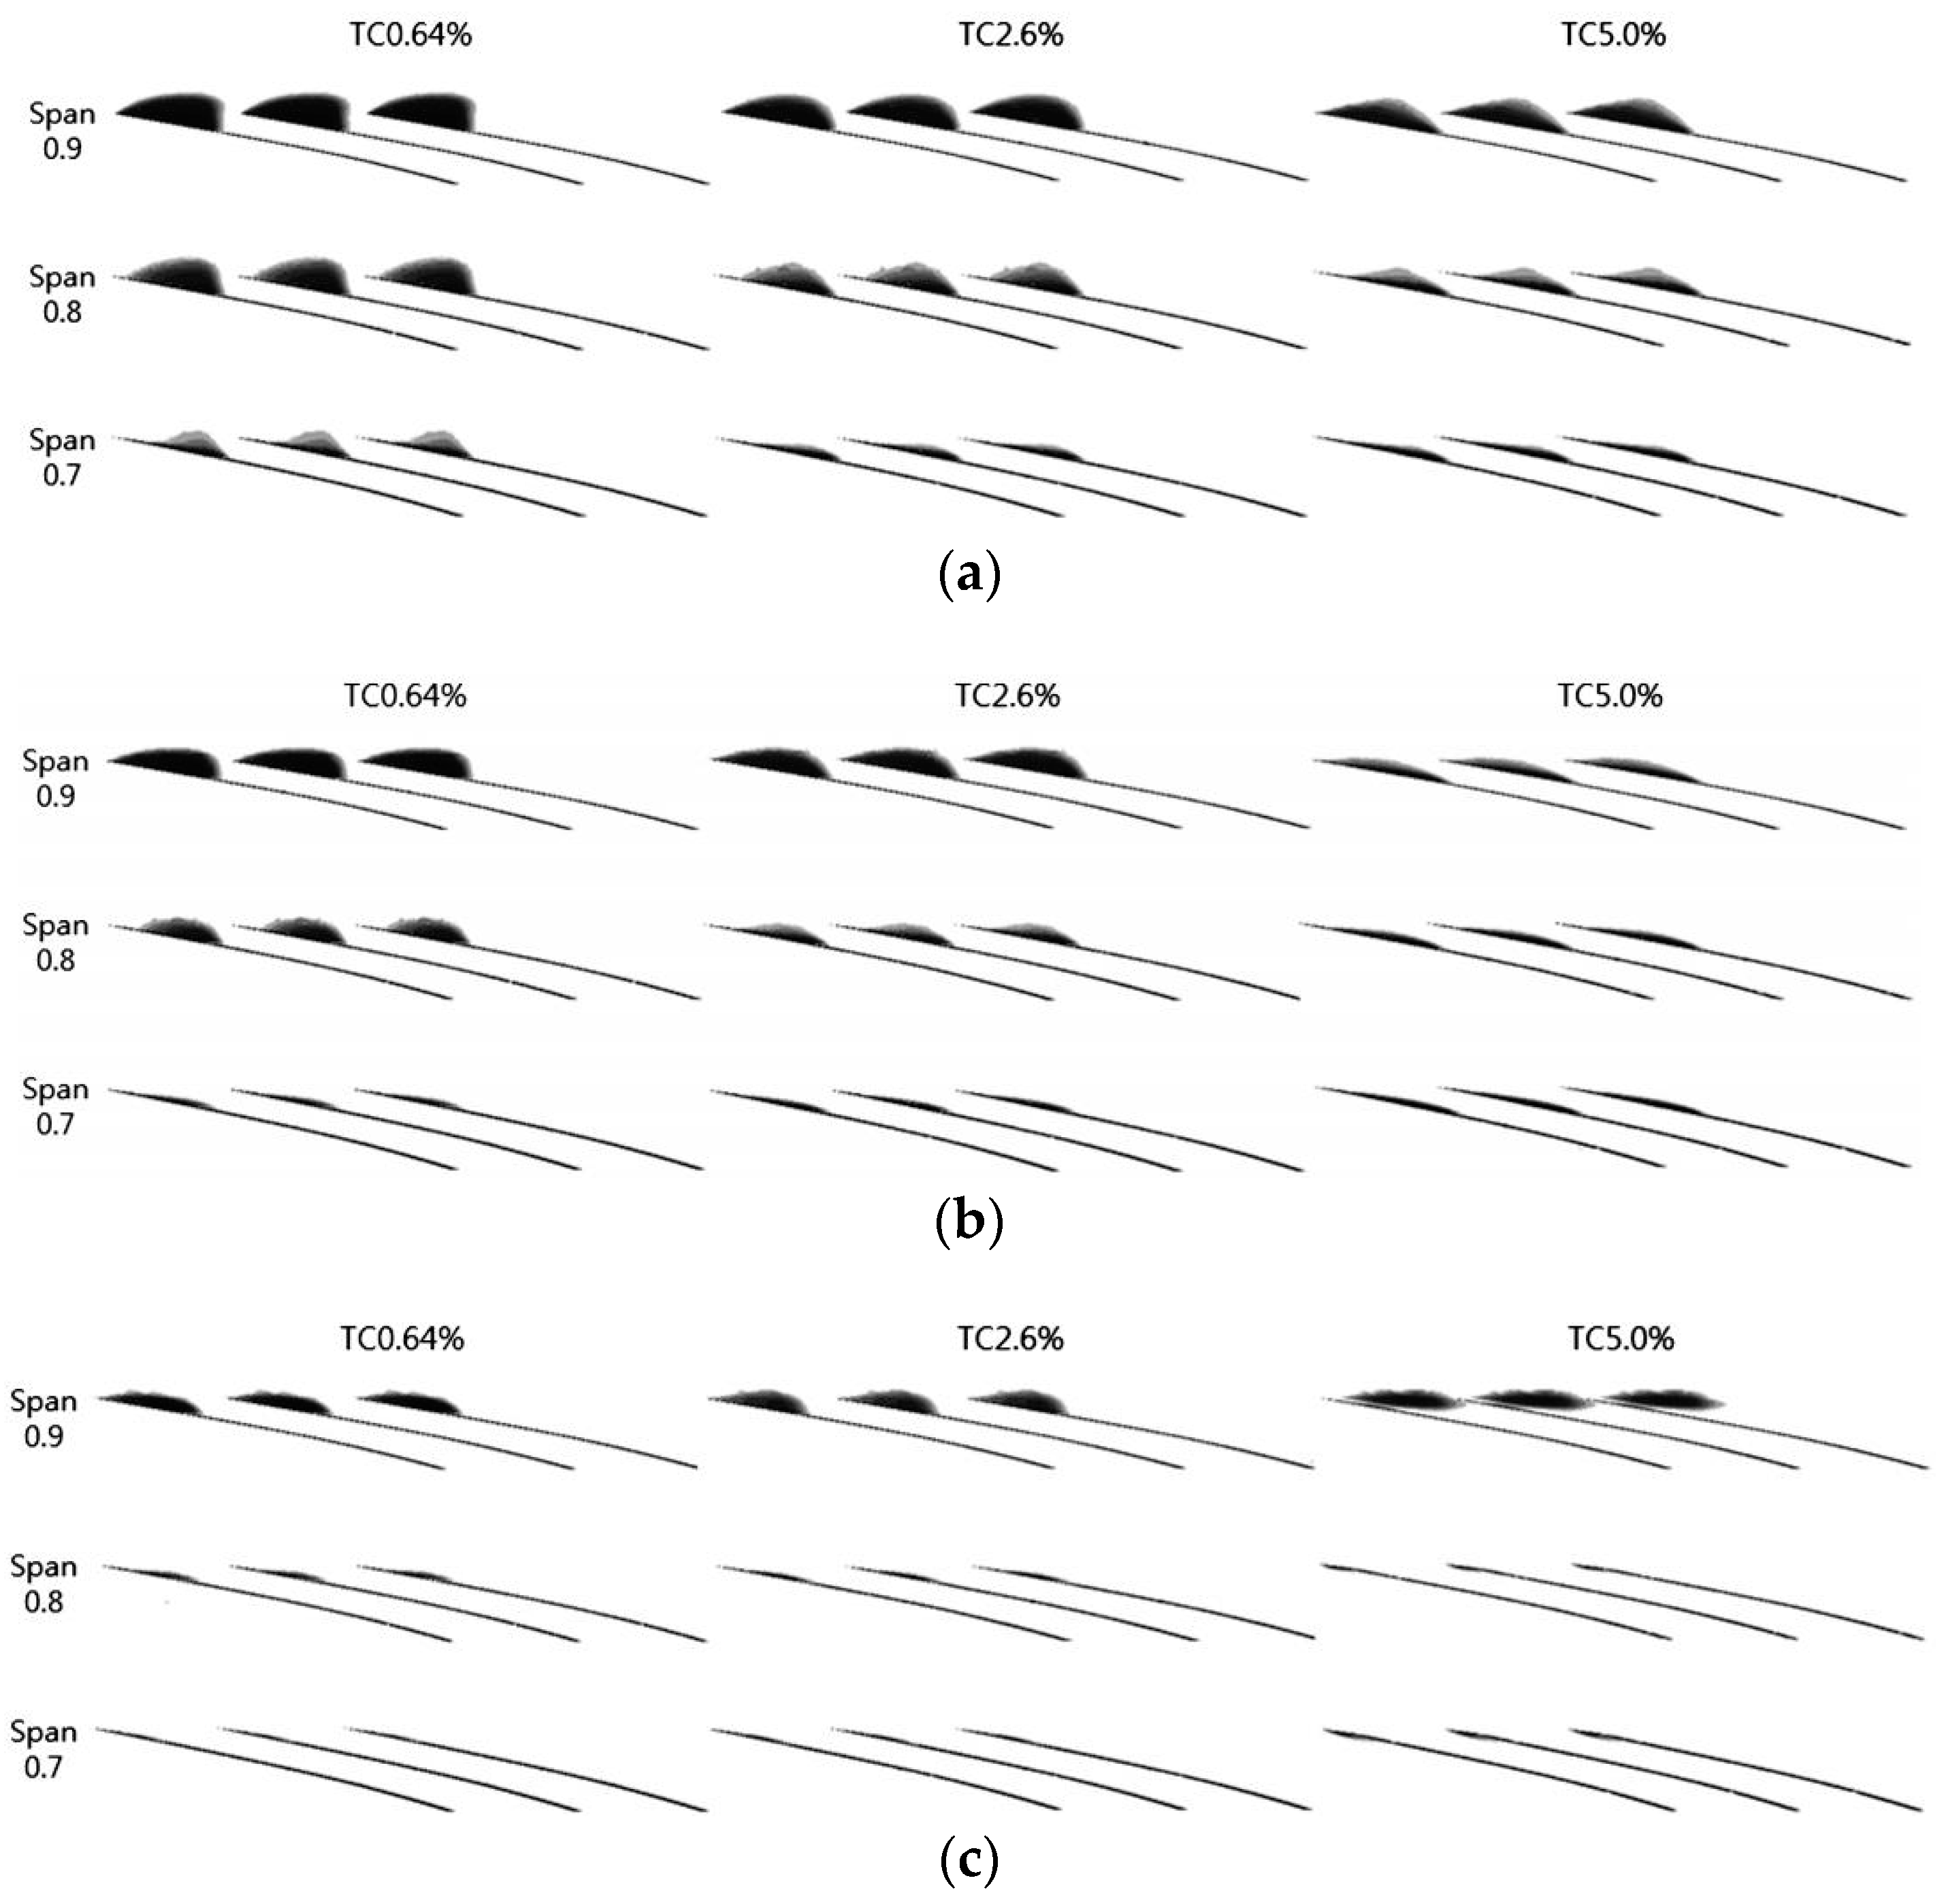
3.4. Cavitation Behavior
4. Energy Performance of Pumps and Turbines with Tip Clearance
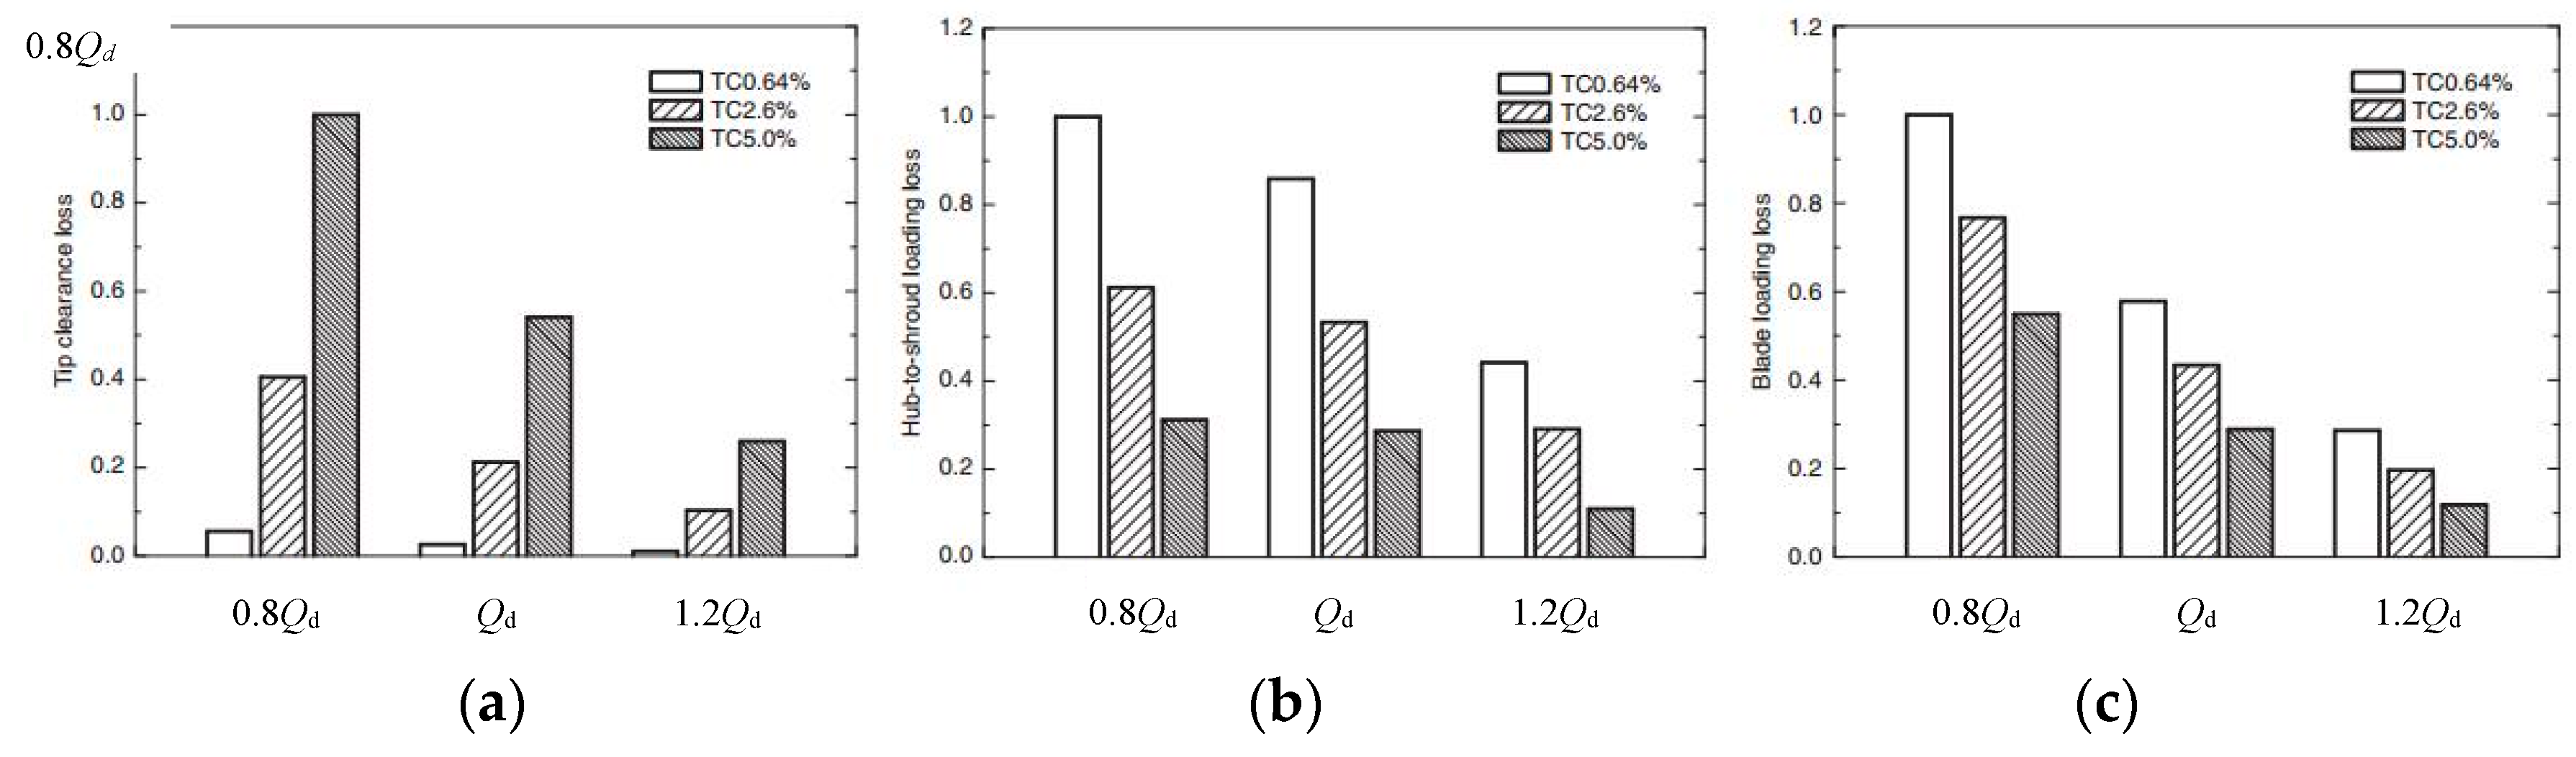
4.1. Energy Characteristics in Pumps
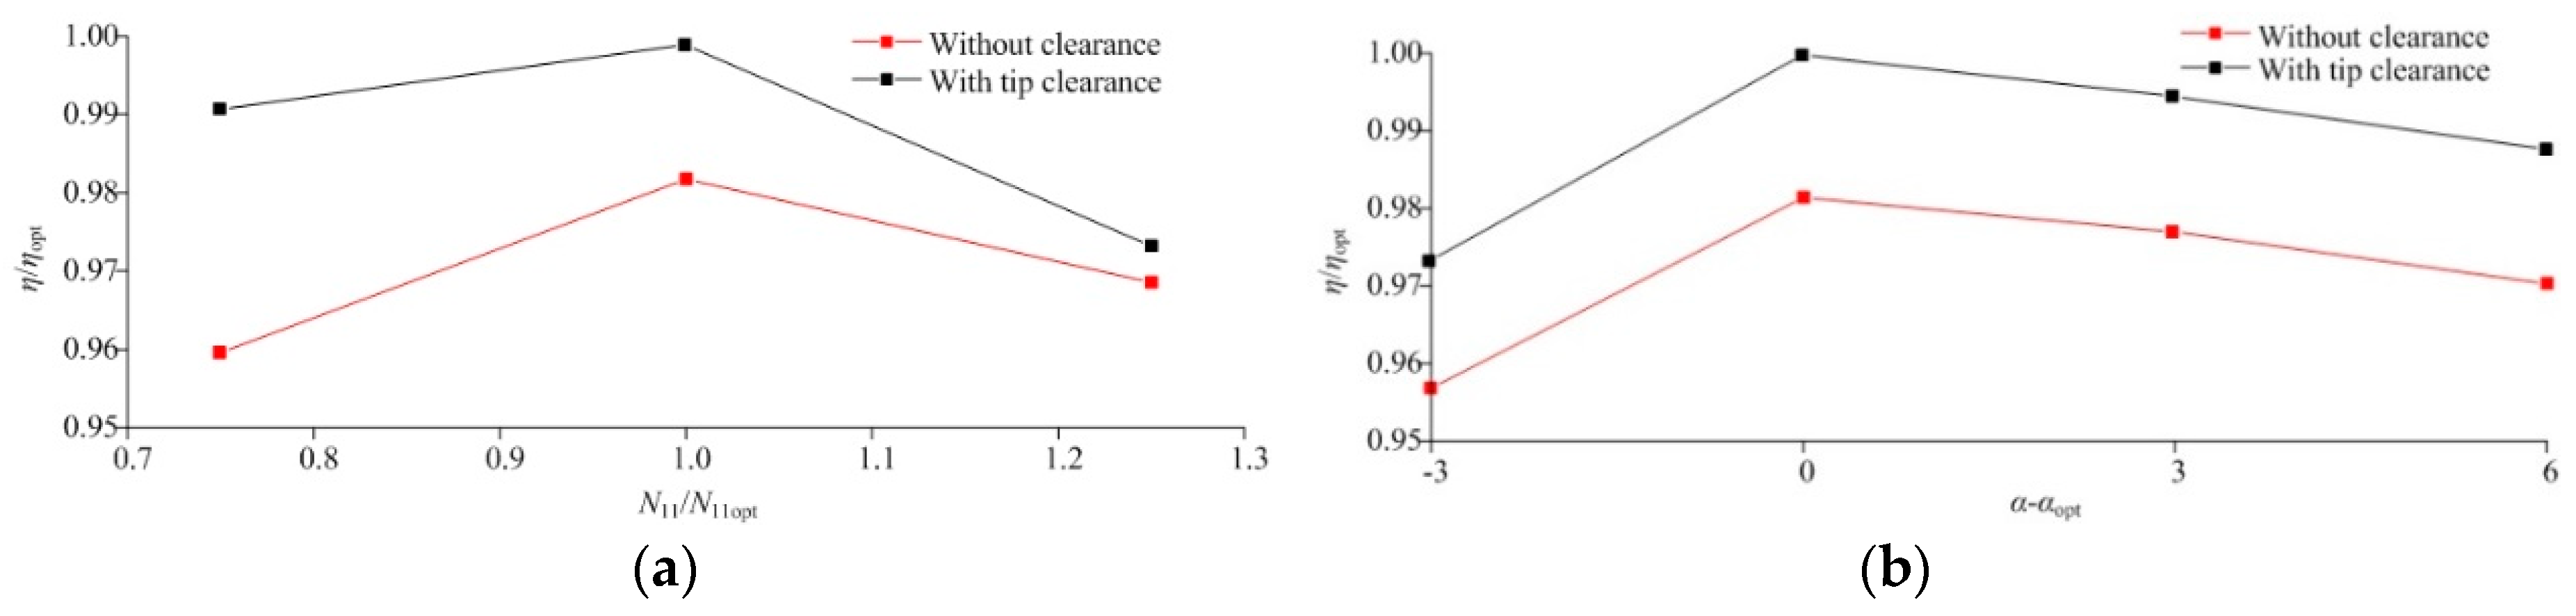
4.2. Energy Characteristics in Hydroturbines
4.3. Energy Characteristics in Inducer of Turbopumps
4.4. Other Hydraulic Machinery Types
5. Operation Stability of Pumps and Turbines with Tip Clearance
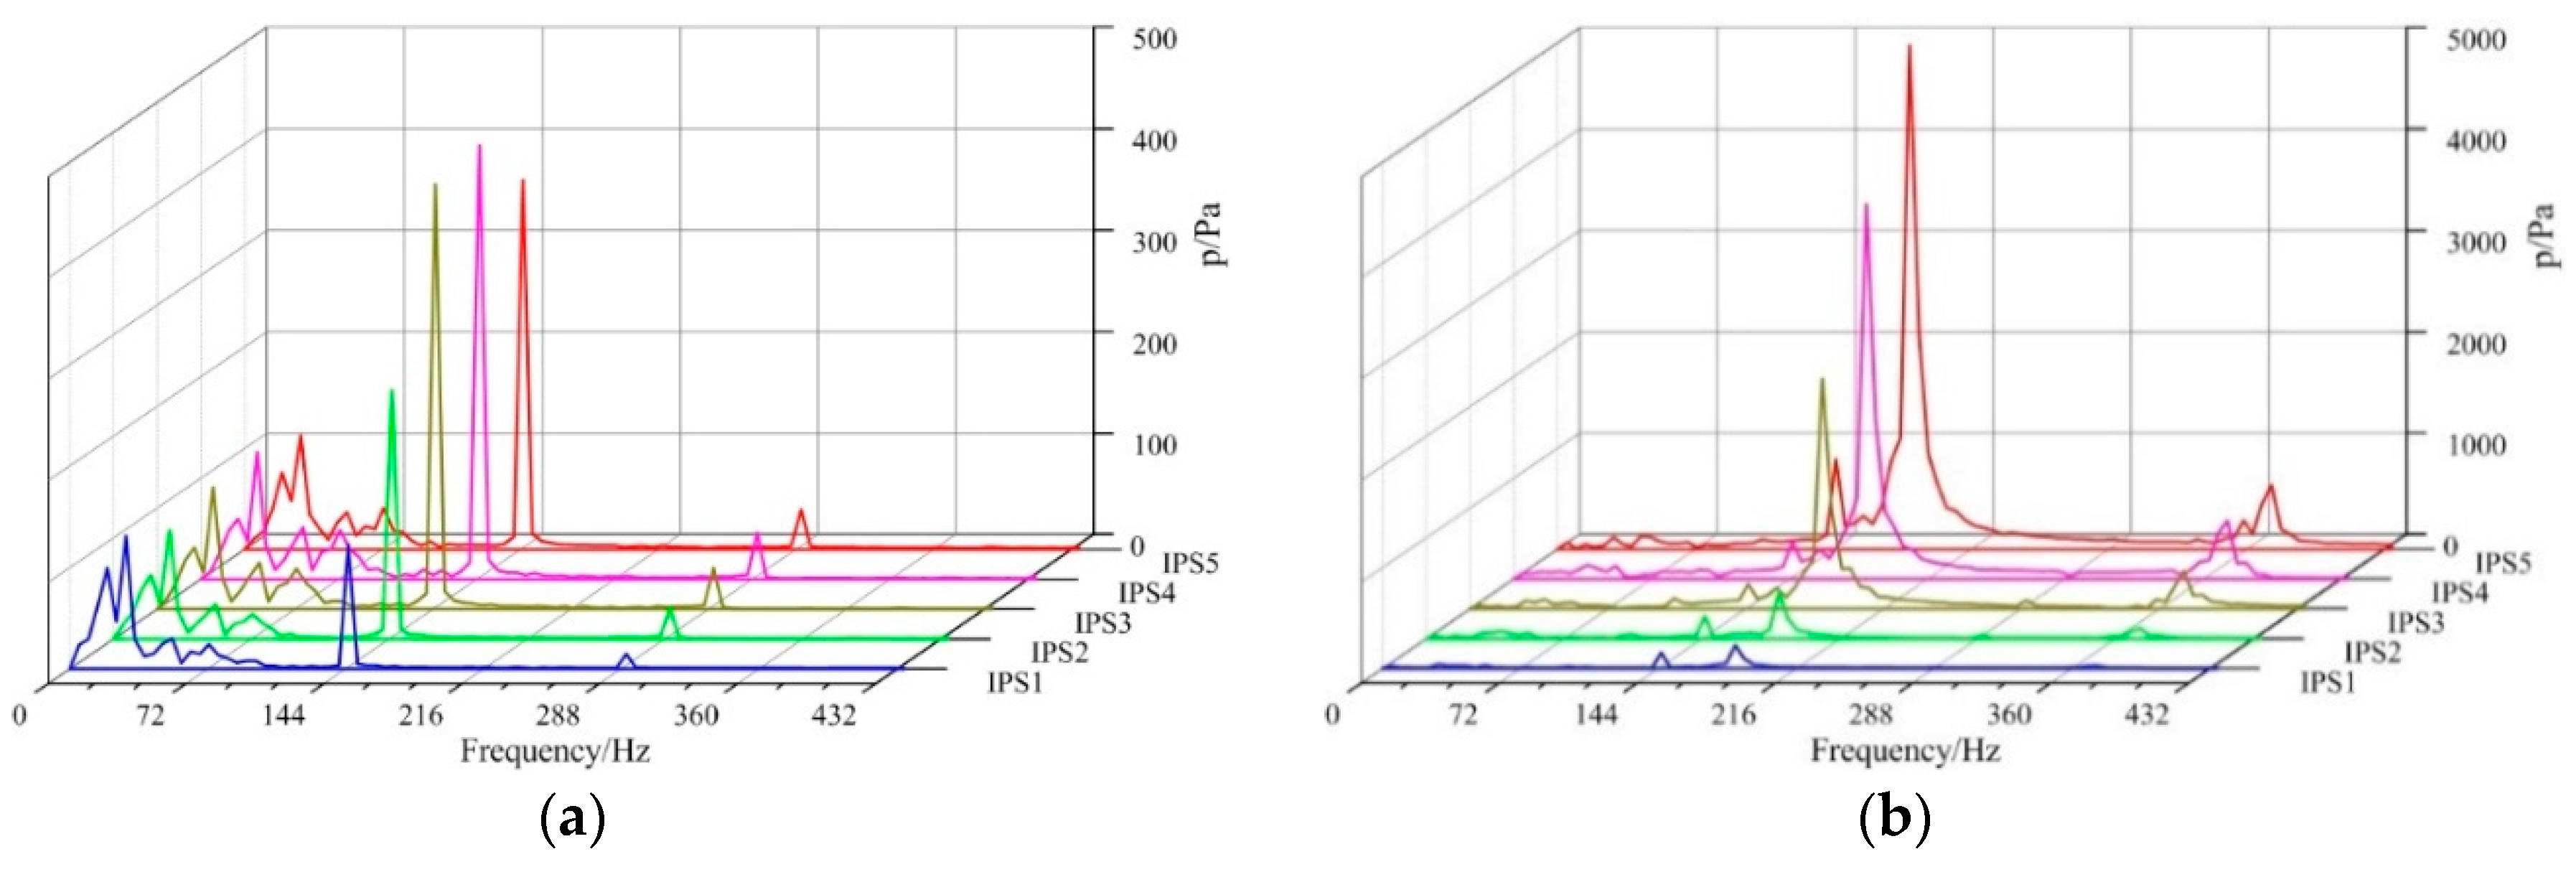
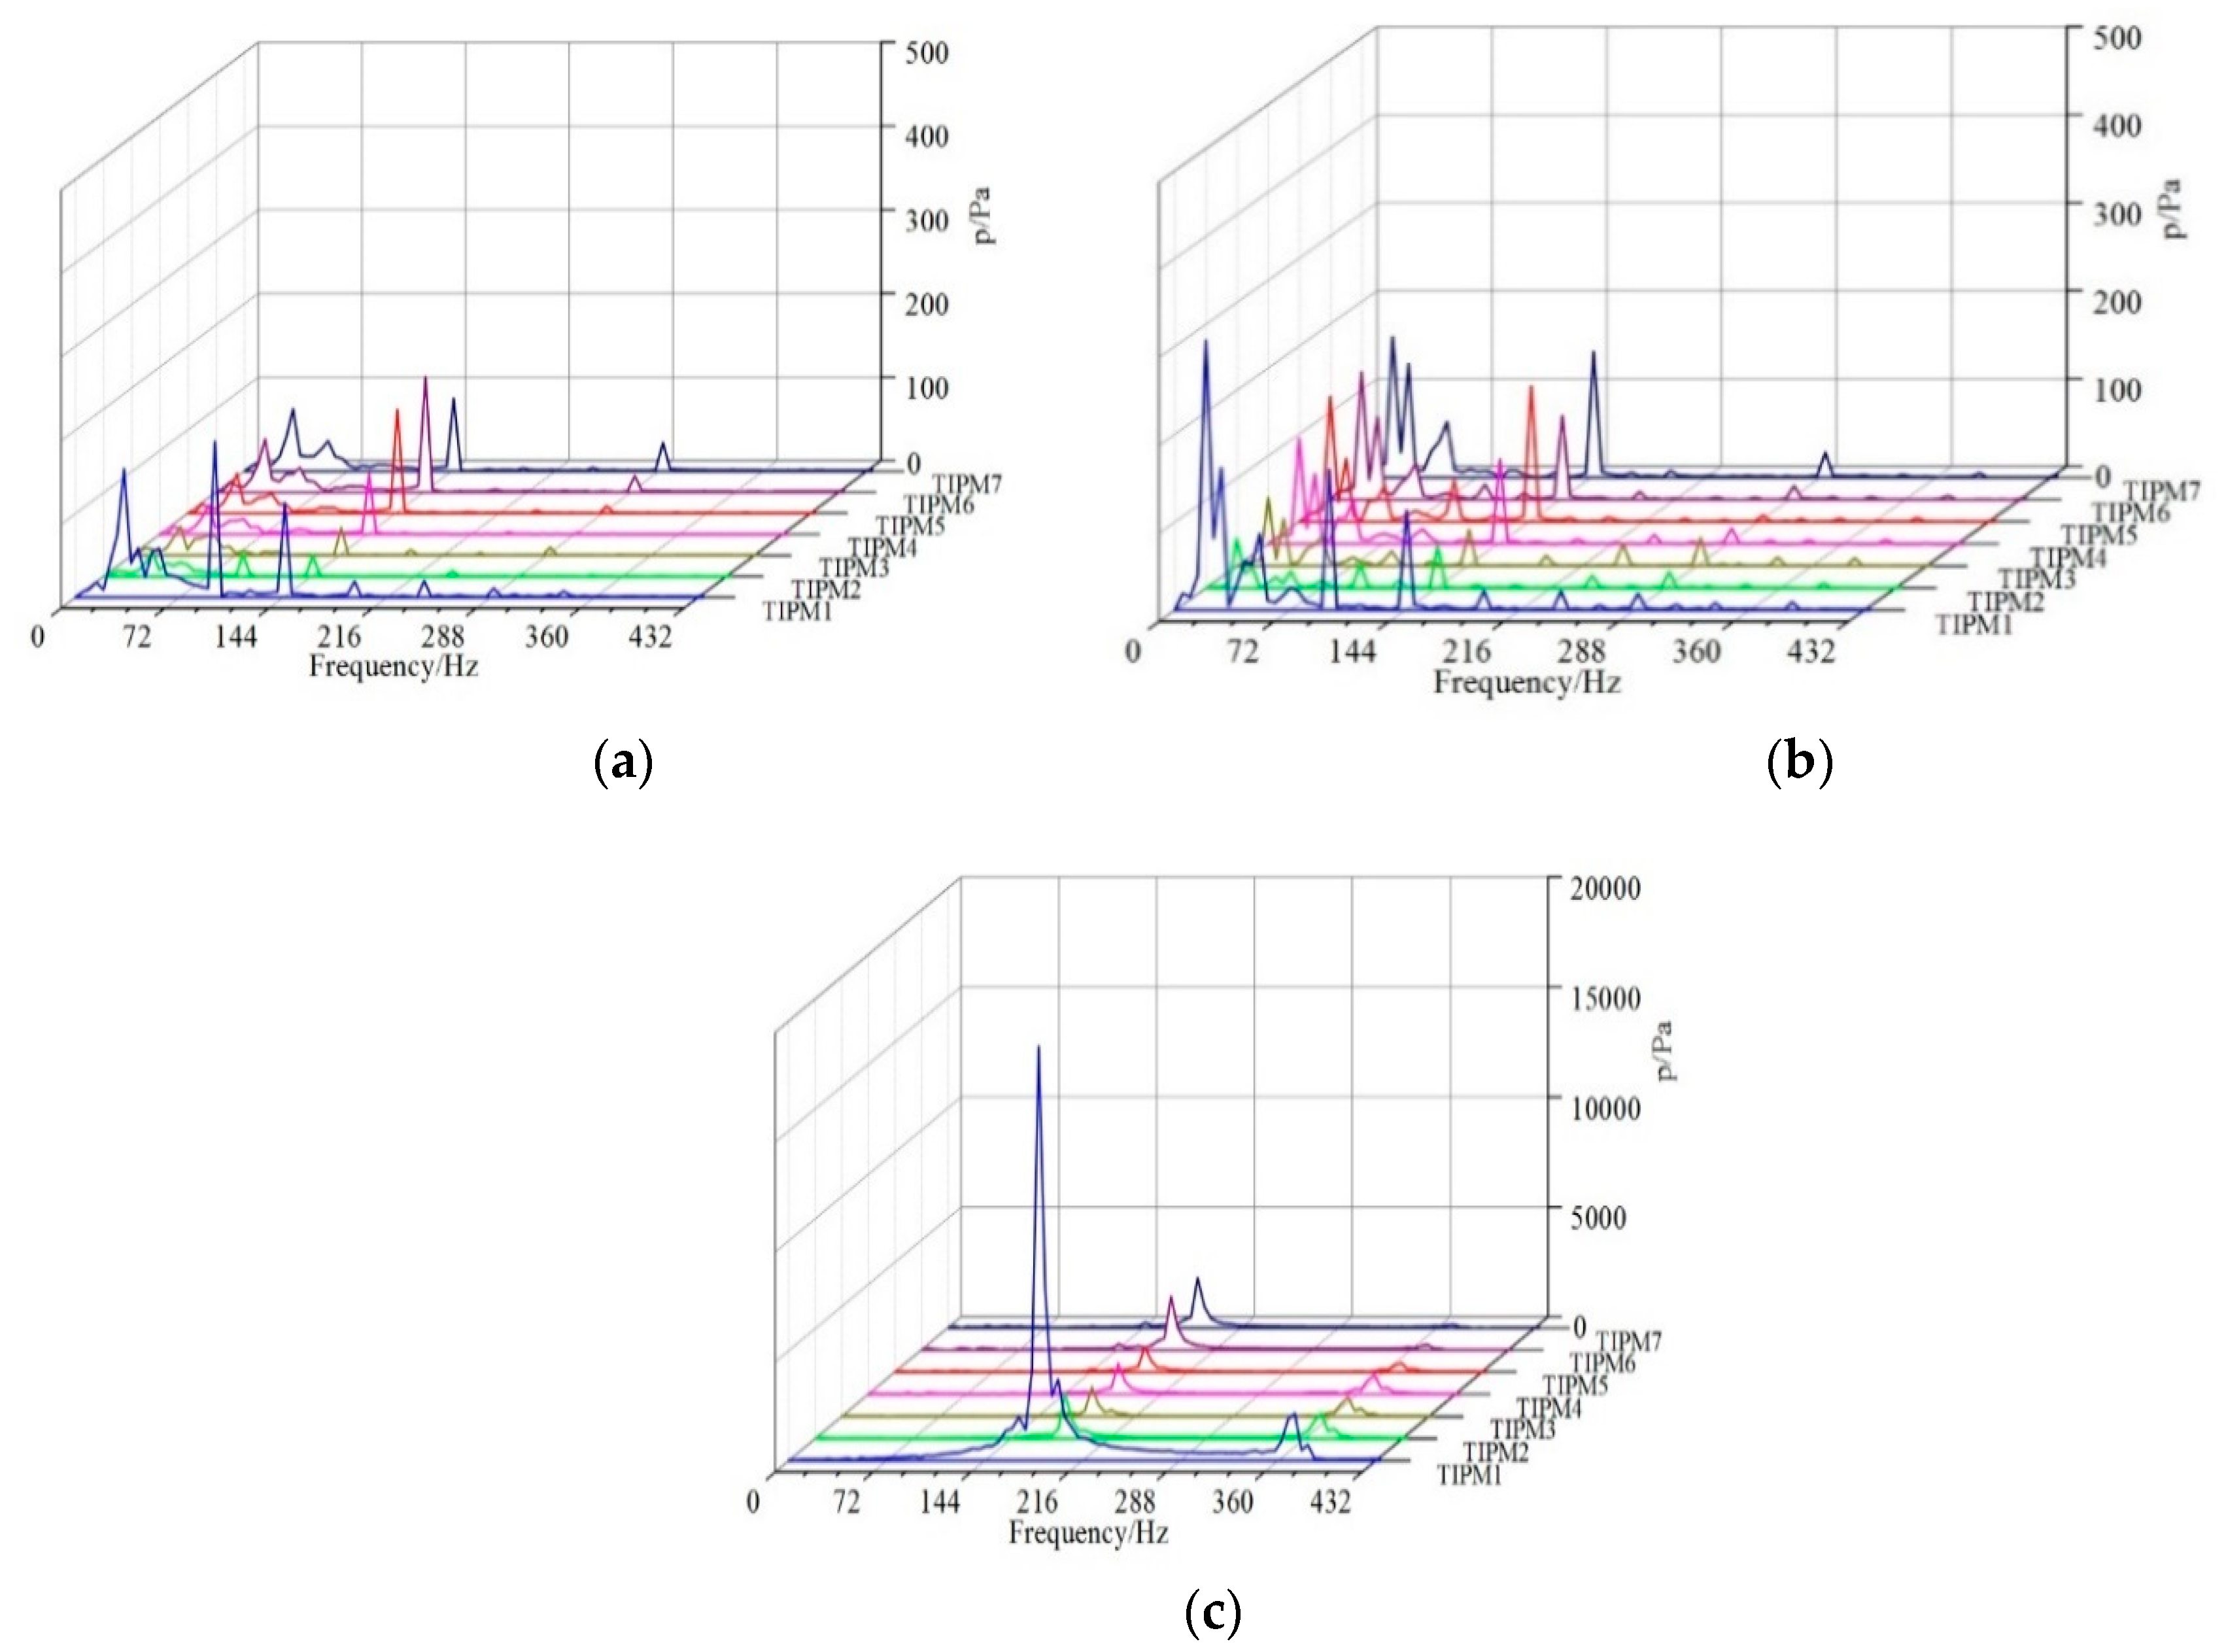
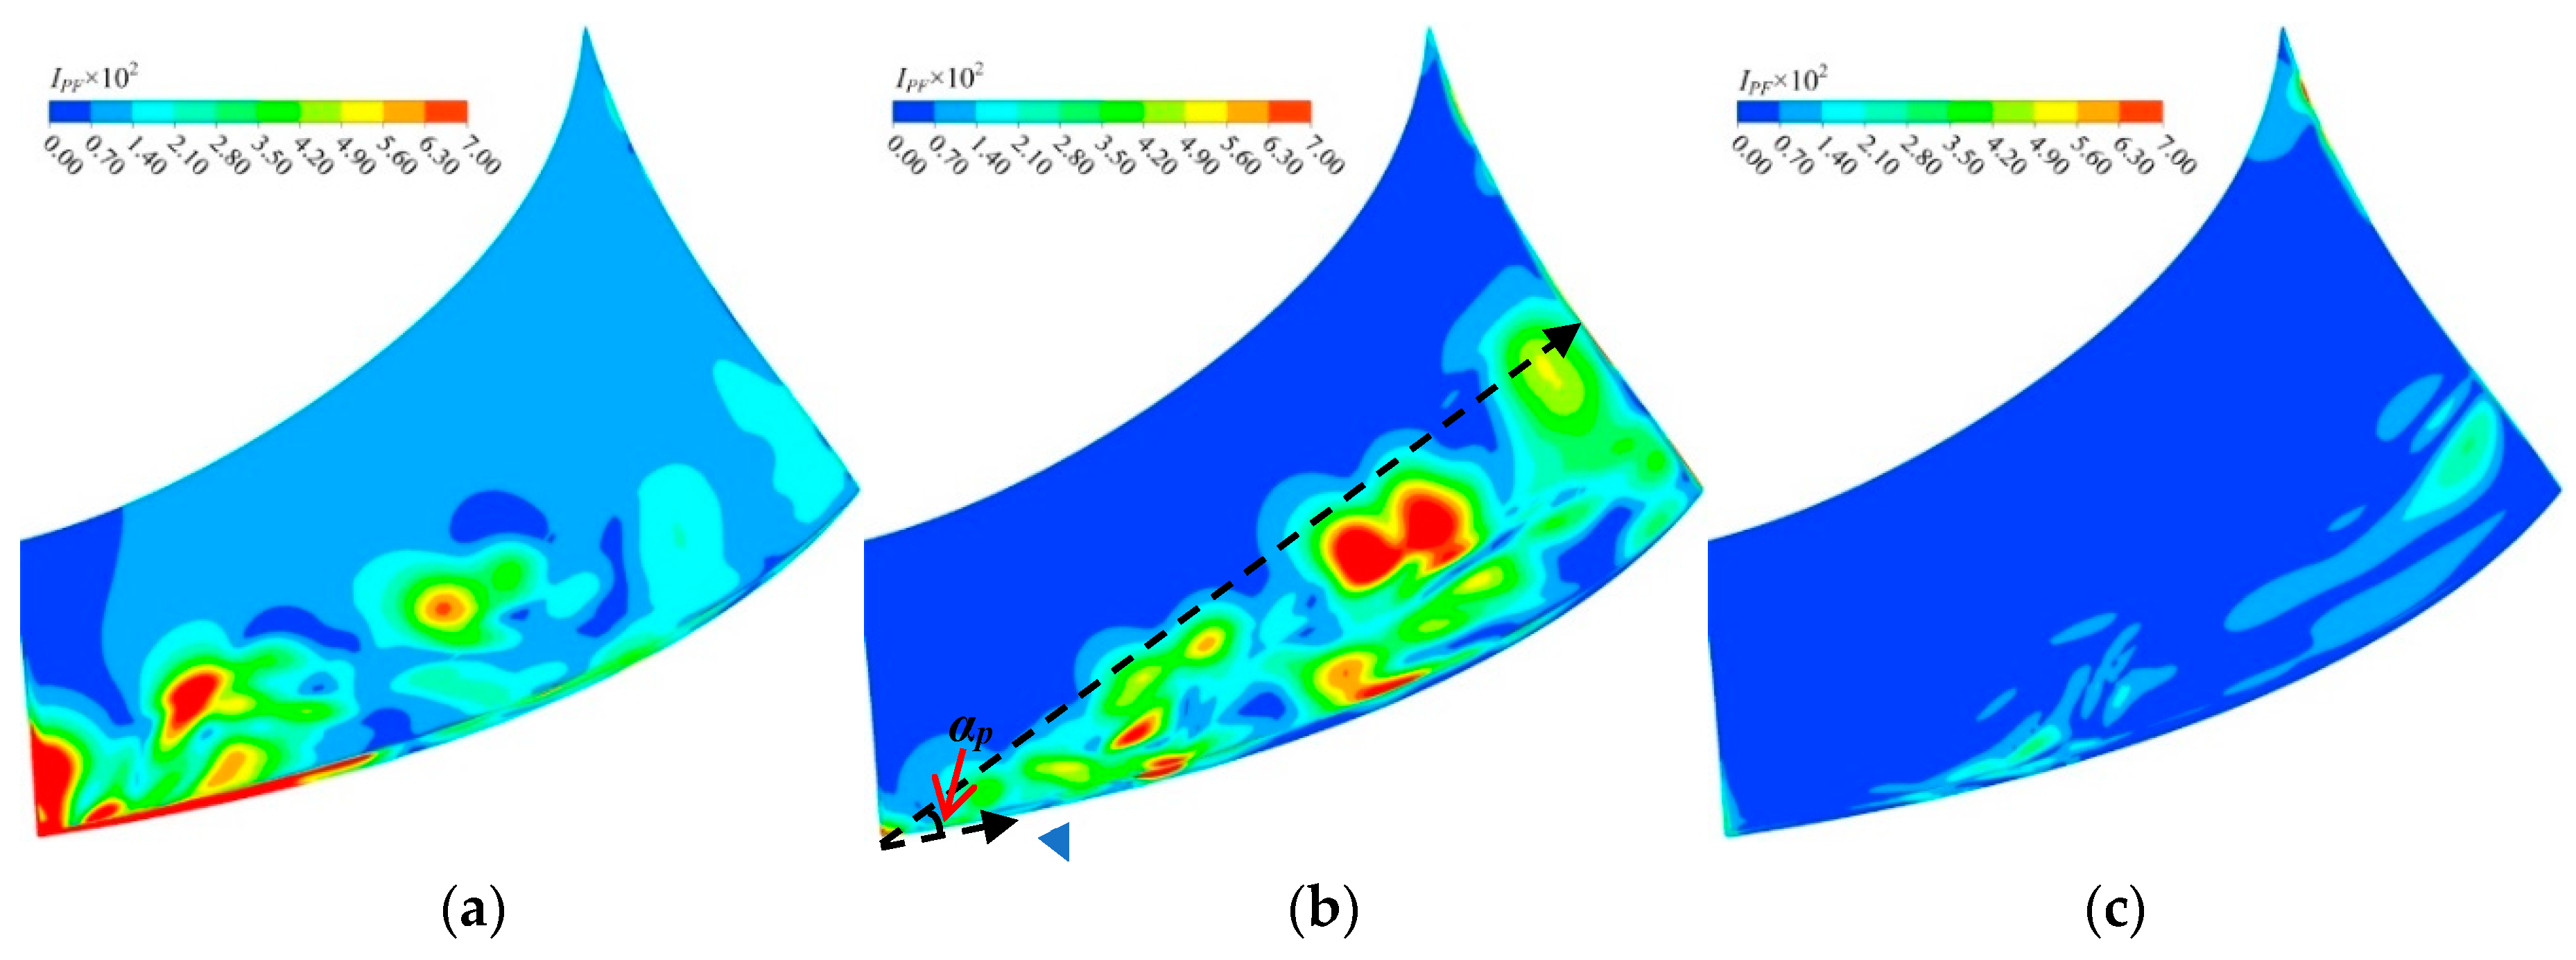
5.1. Pressure Fluctuation
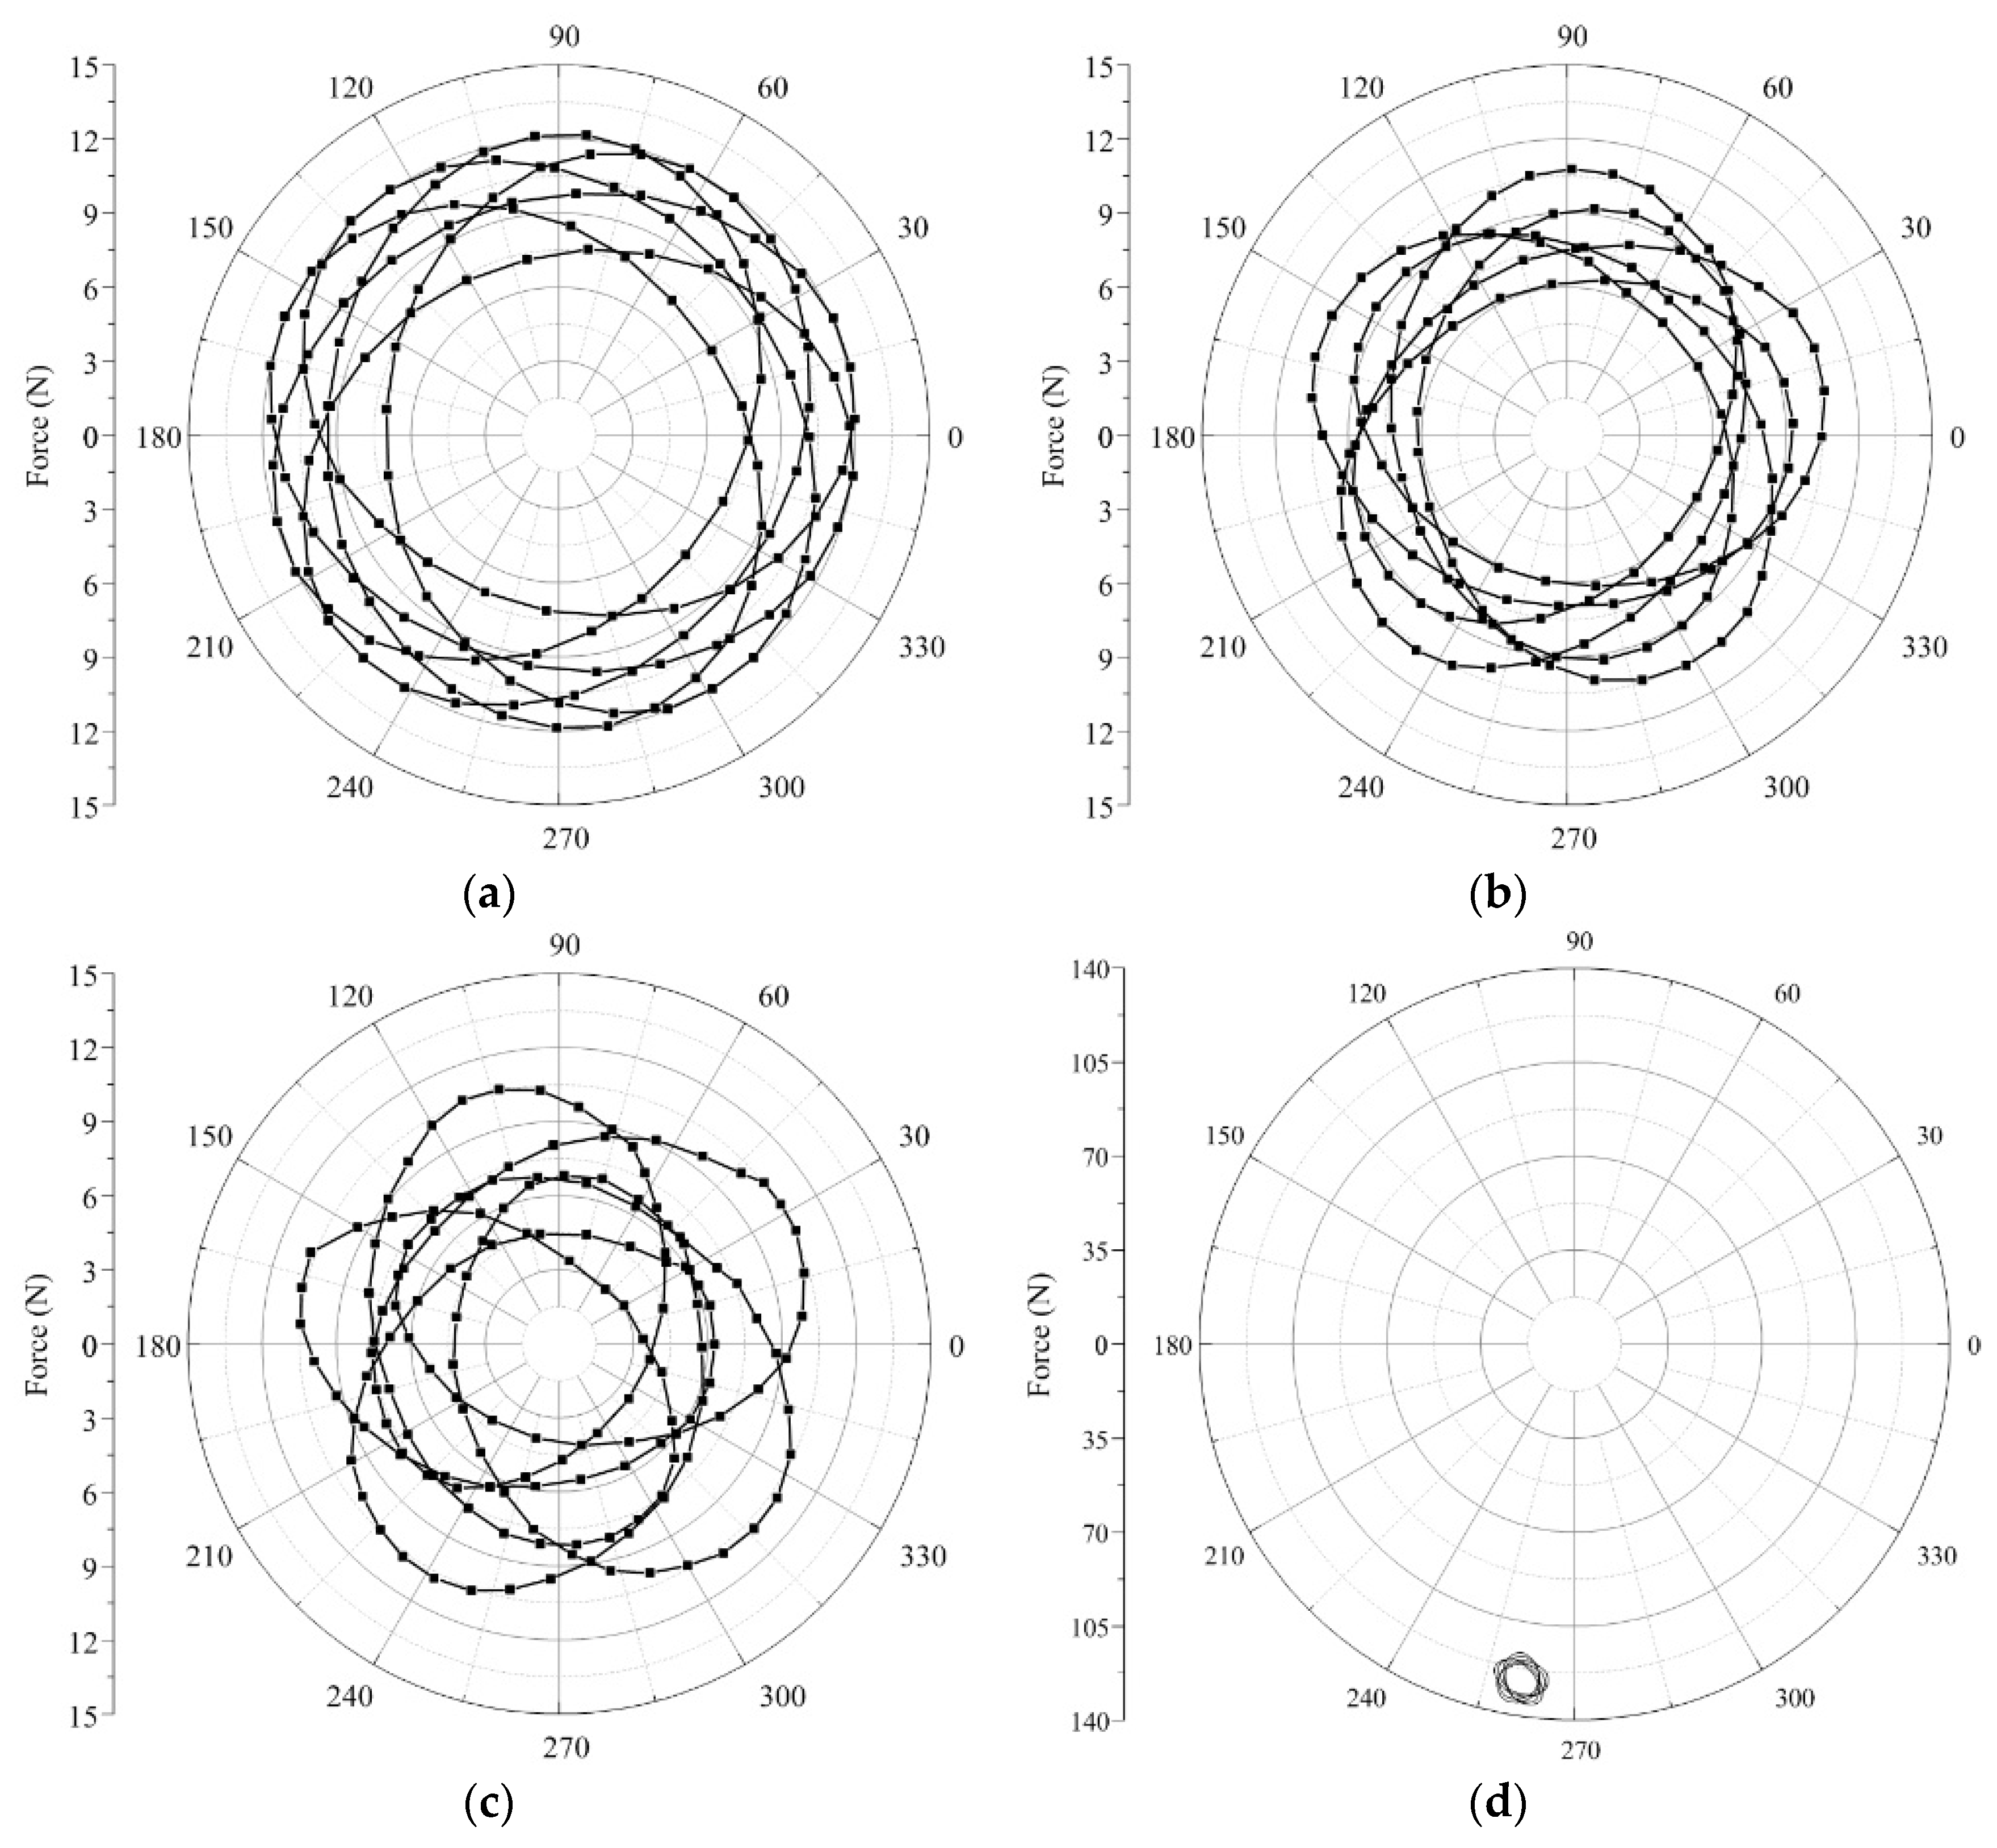
5.2. Radial Force
6. Key Parameters and Optimization
6.1. Tip-Clearance Size
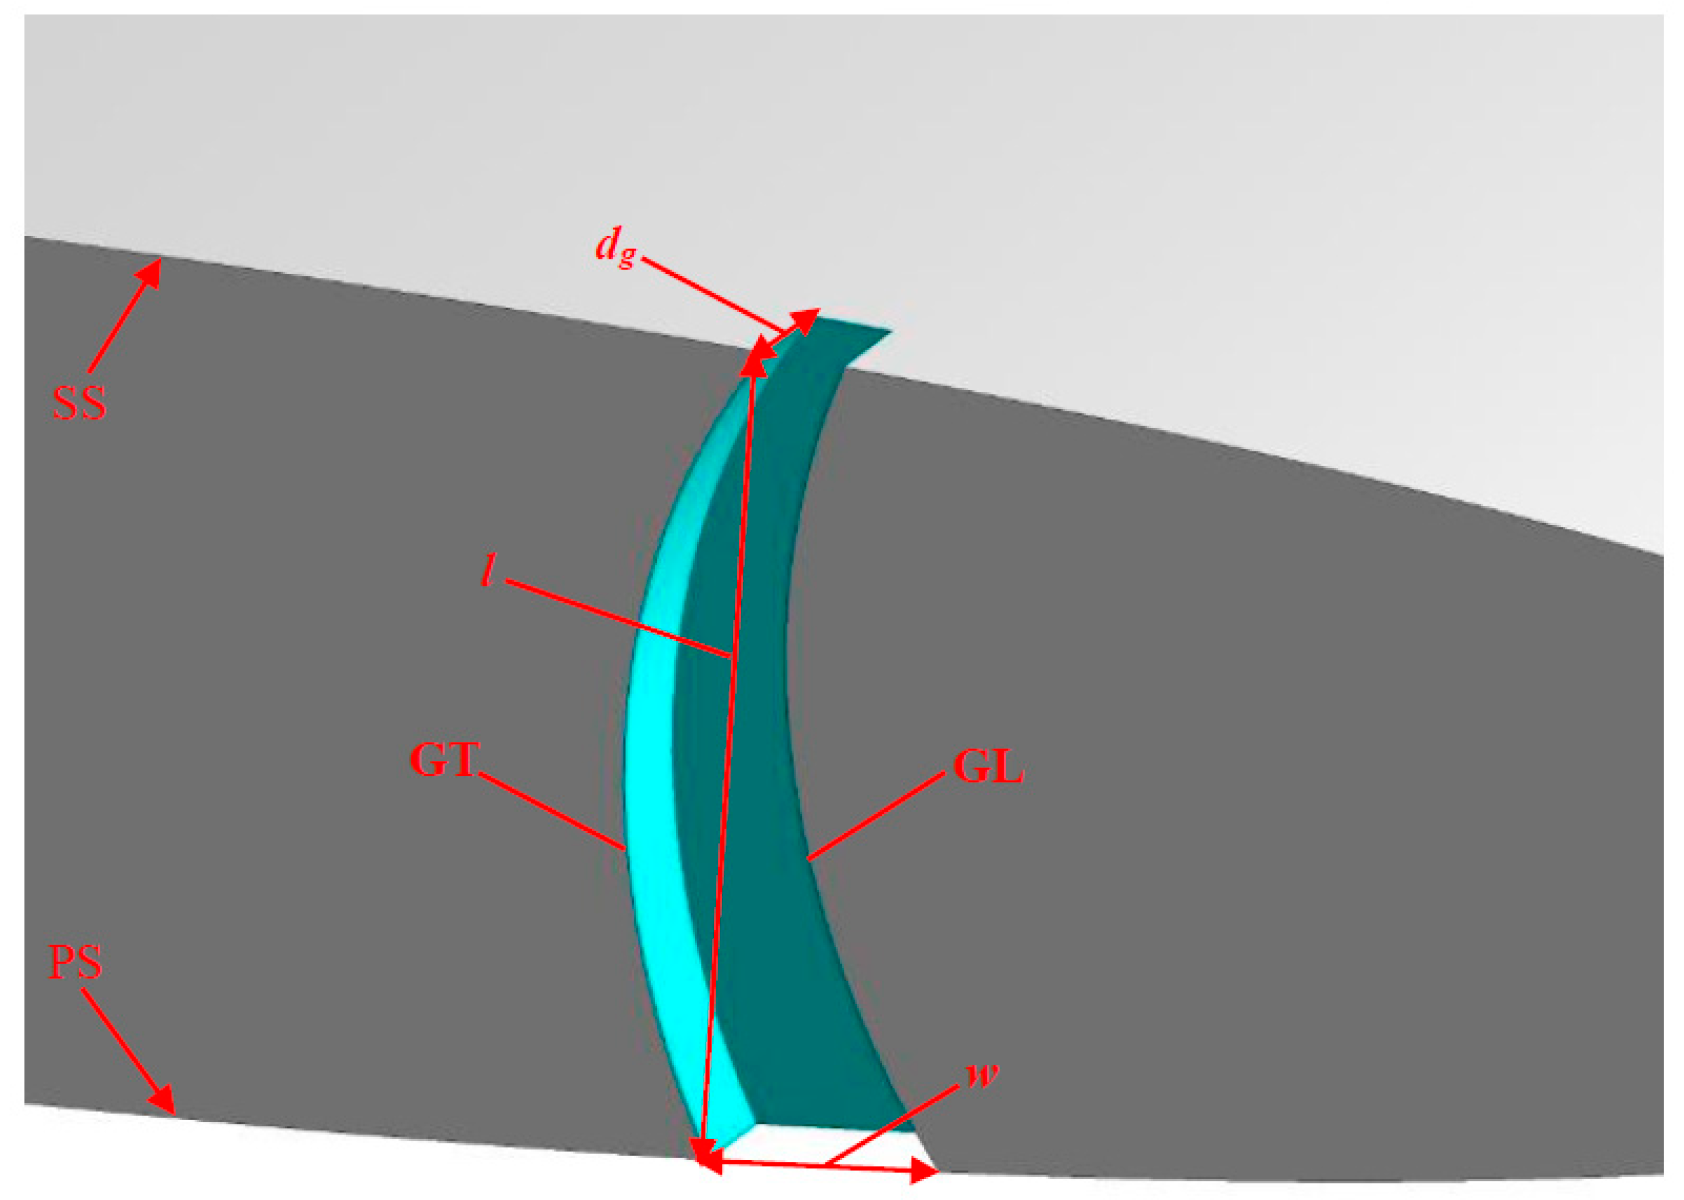
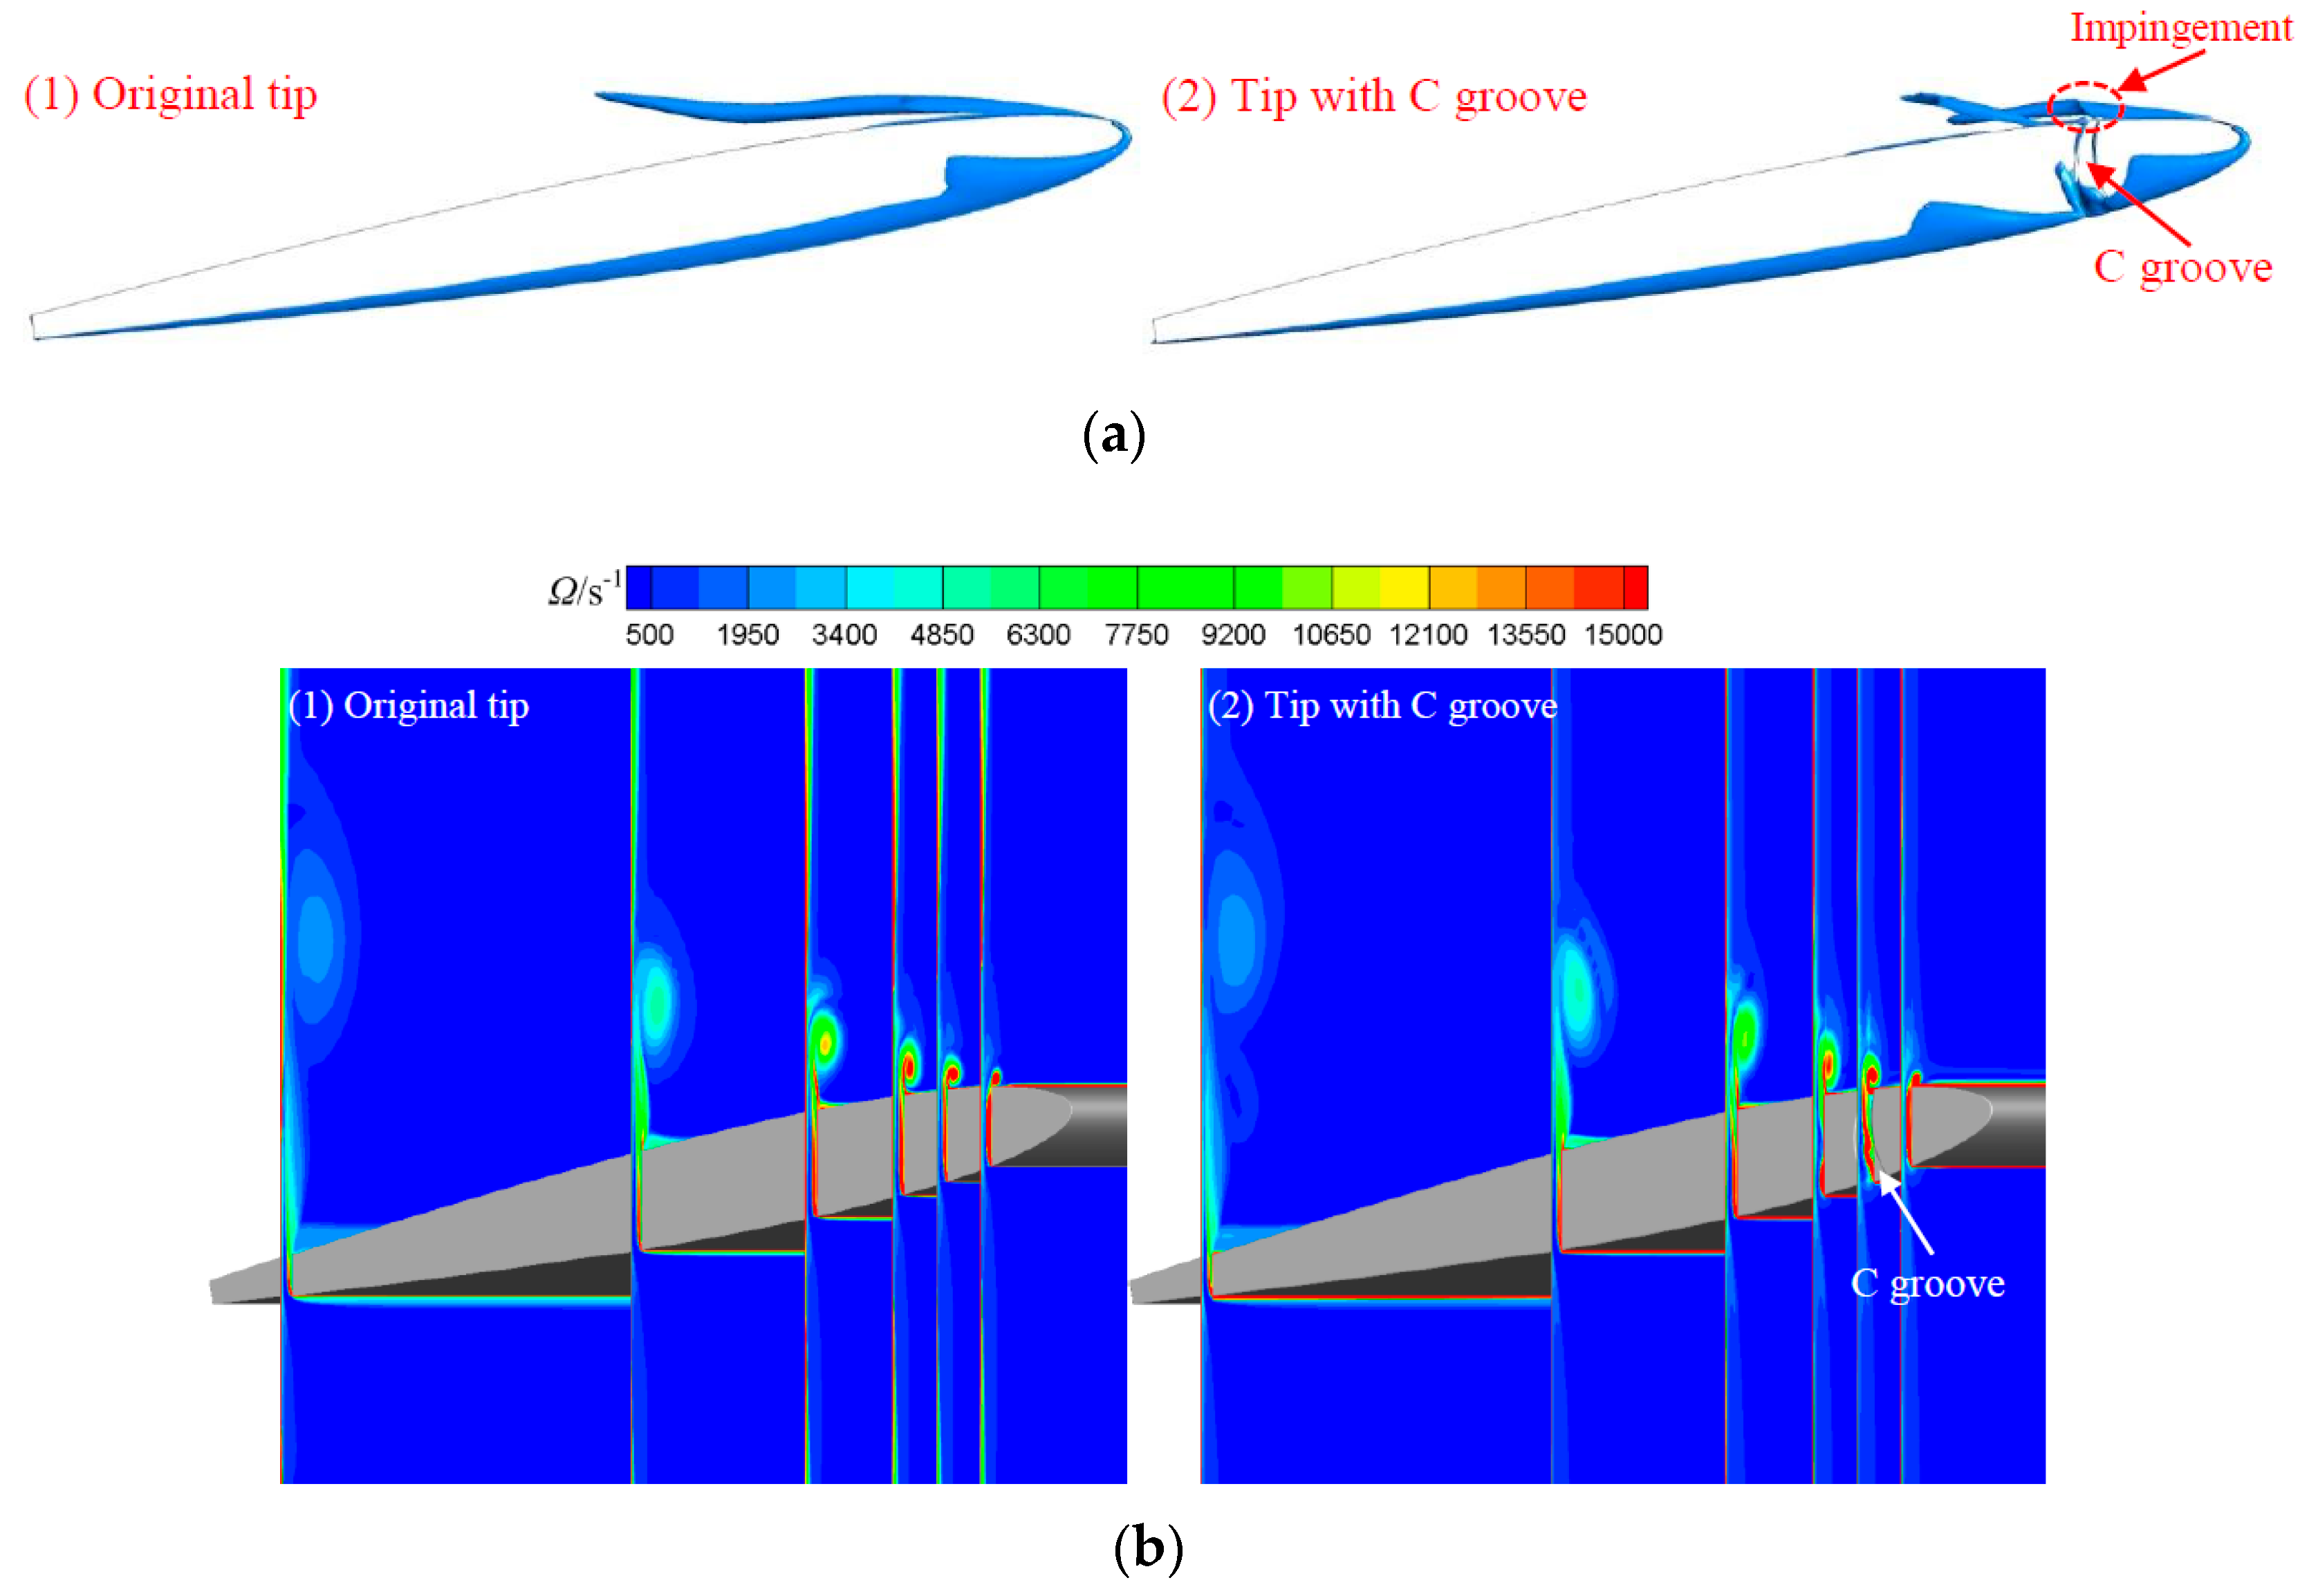
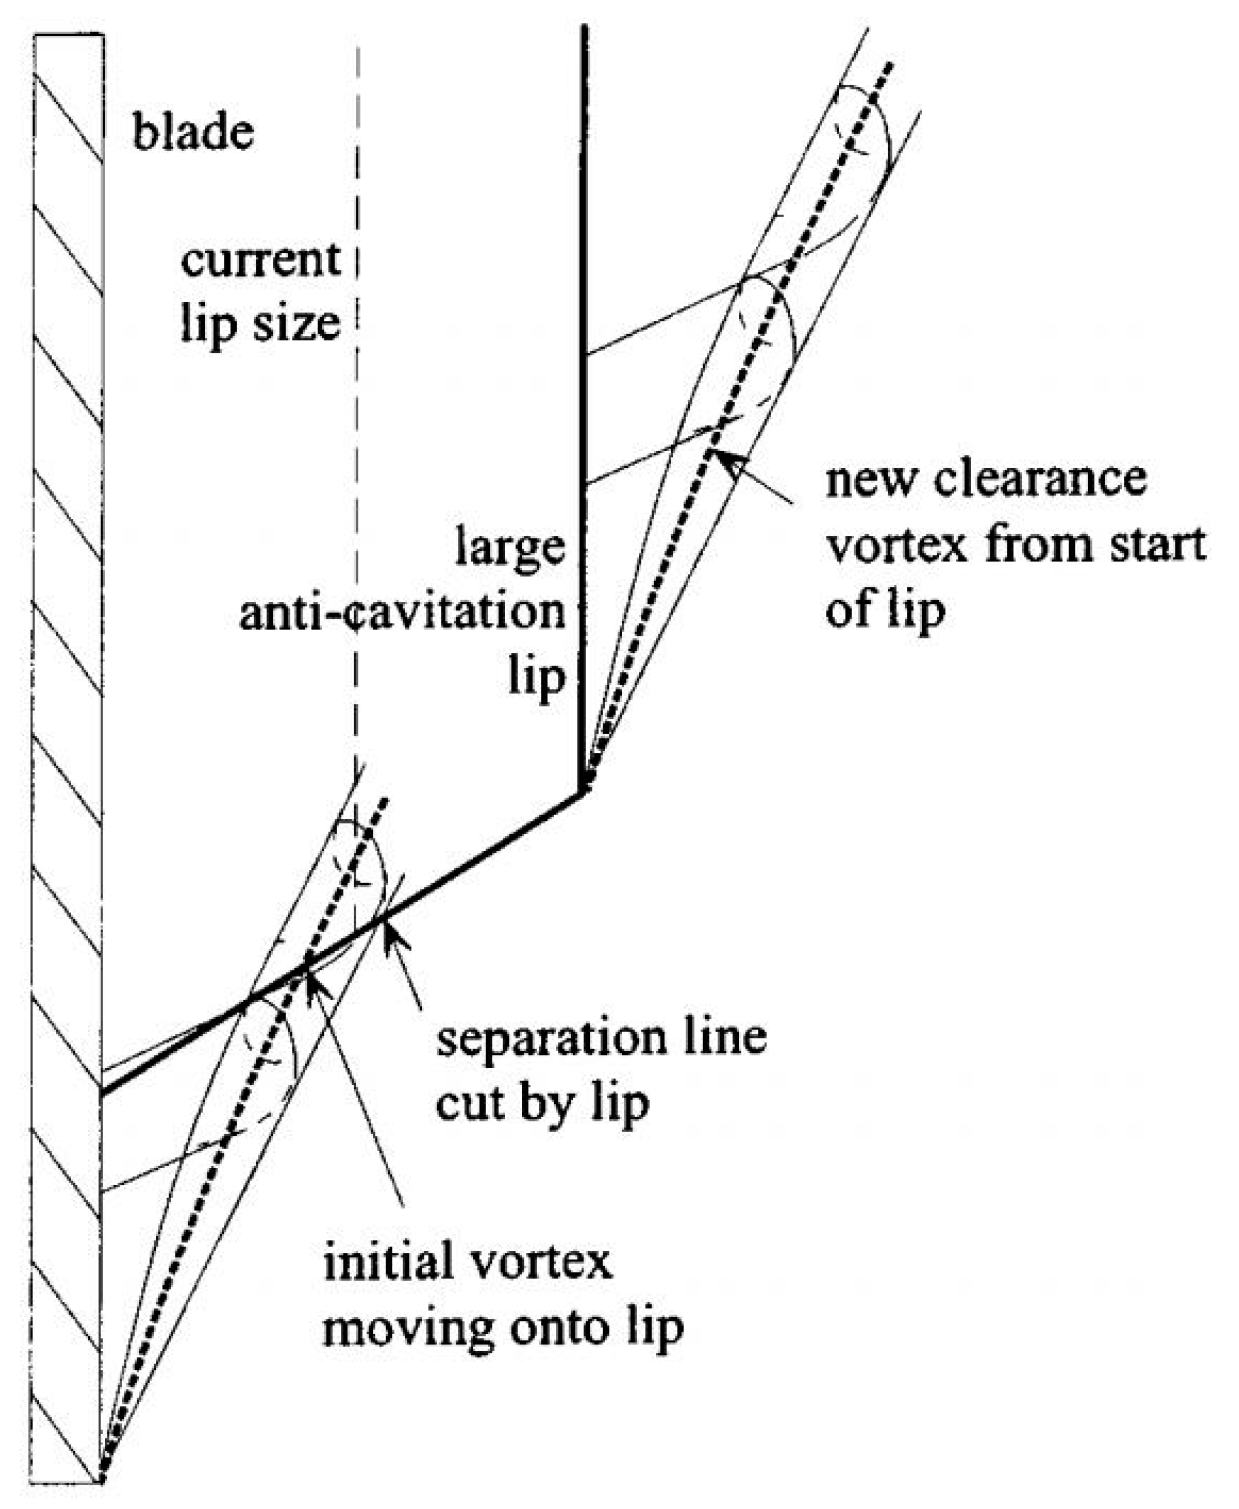
6.2. Tip Shape
6.3. Other Parameters and Optimization Methods
7. Conclusions
Author Contributions
Funding
Acknowledgments
Conflicts of Interest
References
- Amponsah, N.Y.; Troldborg, M.; Kington, B.; Aalders, I.; Hough, R.L. Greenhouse gas emissions from renewable energy sources: A review of lifecycle considerations. Renew. Sustain. Energy Rev. 2014, 39, 461–475. [Google Scholar] [CrossRef]
- Pérez-Sánchez, M.; Sánchez-Romero, F.J.; Ramos, H.M.; López-Jiménez, P.A. Energy recovery in existing water networks: Towards greater sustainability. Water 2017, 9, 97. [Google Scholar] [CrossRef]
- Coelho, B.; Andrade-Campos, A. Efficiency achievement in water supply systems—A review. Renew. Sustain. Energy Rev. 2014, 30, 59–84. [Google Scholar] [CrossRef]
- Laborde, R.; Chantrel, P.; Mory, M. Tip clearance and tip vortex cavitation in an axial flow pump. J. Fluids Eng. 1997, 119, 680–685. [Google Scholar] [CrossRef]
- Liu, Y.; Tan, L.; Hao, Y.; Xu, Y. Energy performance and flow patterns of a mixed-flow pump with different tip clearance sizes. Energies 2017, 10, 191. [Google Scholar] [CrossRef]
- Hao, Y.; Tan, L. Symmetrical and unsymmetrical tip clearances on cavitation performance and radial force of a mixed flow pump as turbine at pump mode. Renew. Energy 2018, 127, 368–376. [Google Scholar] [CrossRef]
- Goto, A. The effect of tip leakage flow on part-load performance of a mixed-flow pump impeller. J. Turbomach. 1992, 114, 383–391. [Google Scholar] [CrossRef]
- Zhang, D.; Shi, W.; Pan, D.; Dubuisson, M. Numerical and experimental investigation of tip leakage vortex cavitation patterns and mechanisms in an axial flow pump. J. Fluids Eng. 2015, 137, 121103–121114. [Google Scholar] [CrossRef]
- Feng, J.; Luo, X.; Guo, P.; Wu, G. Influence of tip clearance on pressure fluctuations in an axial flow pump. J. Mech. Sci. Technol. 2016, 30, 1603–1610. [Google Scholar] [CrossRef]
- Maines, B.H.; Arndt, R.A. Tip vortex formation and cavitation. J. Fluids Eng. 1997, 119, 413–419. [Google Scholar] [CrossRef]
- Higashi, S.; Yoshida, Y.; Tsujimoto, Y. Tip leakage vortex cavitation from the tip clearance of a single hydrofoil. JSME Int. J. 2002, 45, 662–671. [Google Scholar] [CrossRef]
- Boulon, O.; Callenaere, M.; Franc, J.P.; Michel, J.-M. An experimental insight into the effect of confinement on tip vortex cavitation of an elliptical hydrofoil. J. Fluid Mech. 1999, 390, 1–23. [Google Scholar] [CrossRef]
- Murayama, M.; Yoshida, Y.; Tsujimoto, Y. Unsteady tip leakage vortex cavitation originating from the tip clearance of an oscillating hydrofoil. J. Fluids Eng. 2006, 128, 421–429. [Google Scholar] [CrossRef]
- Dreyer, M.; Decaix, J.; Münch-Alligné, C.; Farhat, M. Mind the gap: A new insight into the tip leakage vortex using stereo-PIV. Exp. Fluids 2014, 55, 1–13. [Google Scholar] [CrossRef]
- Dreyer, M.; Decaix, J.; Münch-Alligné, C.; Farhat, M. Mind the gap-tip leakage vortex in axial turbines. In Proceedings of the 27th IAHR Symposium on Hydraulic Machinery and Systems (IHAR 2014), Montreal, QC, Canada, 22–26 September 2014. [Google Scholar]
- Miorini, R.L.; Wu, H.; Katz, J. The inner structure and turbulent evolution of the tip leakage vortex in an axial pump: Part I: Instantaneous results. In Proceedings of the ASME Fluids Engineering Division Summer Conference 2009 (FEDSM 2009), Vail, CO, USA, 2–6 August 2009. [Google Scholar]
- Wu, H.; Miorini, R.L.; Katz, J. Measurements of the tip leakage vortex structures and turbulence in the meridional plane of an axial water-jet pump. Exp. Fluids 2011, 50, 989–1003. [Google Scholar] [CrossRef]
- Miorini, R.L.; Wu, H.; Katz, J. The internal structure of the tip leakage vortex within the rotor of an axial waterjet pump. J. Turbomach. 2012, 134, 031018. [Google Scholar] [CrossRef]
- Wu, H.; Miorini, R.L.; Tan, D.; Katz, J. Turbulence within the tip-leakage vortex of an axial waterjet pump. AIAA J. 2012, 50, 2574–2587. [Google Scholar] [CrossRef]
- Wu, H.; Tan, D.; Miorini, R.L.; Katz, J. Three-dimensional flow structures and associated turbulence in the tip region of a waterjet pump rotor blade. Exp. Fluids 2011, 51, 1721–1737. [Google Scholar] [CrossRef]
- Miorini, R.L.; Wu, H.; Tan, D.; Katz, J. Three-dimensional structure and turbulence within the tip leakage vortex of an axial waterjet pump. In Proceedings of the ASME-JSME-KSME Joint Fluids Engineering Conference 2011 (AJK, 2011), Shizuoka, Japan, 24–29 July 2011; pp. 271–281. [Google Scholar]
- Tan, D.; Miorini, R.L.; Keller, J.; Katz, J. Flow visualization using cavitation within blade passage of an axial waterjet pump rotor. In Proceedings of the ASME Fluids Engineering Division Summer Meeting 2012 (FEDSM 2012), Puerto Rico, USA, 8–12 July 2012; pp. 395–404. [Google Scholar]
- Tan, L.; Zhu, B.; Cao, S.; Wang, Y. Cavitation flow simulation for a centrifugal pump at a low flow rate. Chin. Sci. Bull. 2013, 58, 949–952. [Google Scholar] [CrossRef] [Green Version]
- Tan, D.; Li, Y.; Wilkes, I.; Vagnoni, E.; Miorini, R.L.; Katz, J. Experimental investigation of the role of large scale cavitating vortical structures in performance breakdown of an axial waterjet pump. J. Fluids Eng. 2015, 137, 317–320. [Google Scholar] [CrossRef]
- Yang, C.; Chen, C.; Wang, J.; Ji, Q. Three-dimensional viscous numerical simulation of tip clearance flow in axial-flow pump. J. Therm. Sci. 2003, 12, 231–233. [Google Scholar] [CrossRef]
- Hah, C. Investigation of turbulent tip leakage vortex in an axial water jet pump with large eddy simulation. In Proceedings of the ASME Fluids Engineering Division Summer Meeting 2012 (FEDSM 2012), Puerto Rico, USA, 8–12 July 2012; pp. 135–142. [Google Scholar]
- Masuda, N.; Austen, F.; Maeda, H. The effect of tip leakage vortex on cavitation performance in axial hydro turbine. In Proceedings of the ASME-JSME-KSME Joint Fluids Engineering Conference 2015 (AJKFluids 2015), Seoul, Korea, 26–31 July 2015. [Google Scholar]
- Flaszyński, P.; Szantyr, J.A.; Biernacki, R.; Dymarski, P.; Kraskowski, M. A method for the accurate numerical prediction of the tip vortices shed from hydrofoils. Pol. Marit. Res. 2010, 17, 10–17. [Google Scholar]
- Decaix, J.; Dreyer, M.; Balarac, G.; Farhatb, M.; Müncha, C. RANS computations of a confined cavitating tip-leakage vortex. Eur. J. Mech. B Fluids 2017, 67, 198–210. [Google Scholar] [CrossRef]
- Szantyr, J.; Flaszyński, P.; Tesch, K.; Suchecki, W.; Alabrudziński, S. An experimental and numerical study of tip vortex cavitation. Pol. Marit. Res. 2012, 18, 14–22. [Google Scholar] [CrossRef]
- Decaix, J.; Balarac, G.; Dreyer, M.; Münch, C. RANS and LES computations of the tip-leakage vortex for different gap widths. J. Turbul. 2015, 16, 309–341. [Google Scholar] [CrossRef]
- Decaix, J.; Balarac, G.; Dreyer, M. RANS computations of tip vortex cavitation. In Proceedings of the 9th International Symposium on Cavitation (CAV 2015), Lausanne, Switzerland, 6–10 December 2015. [Google Scholar]
- Guo, Q.; Zhou, L.; Wang, Z.; Liua, M.; Cheng, H. Numerical simulation for the tip leakage vortex cavitation. Ocean Eng. 2018, 151, 71–81. [Google Scholar] [CrossRef]
- You, D.; Mittal, R.; Wang, M.; Moin, P. Computational methodology for large-eddy simulation of tip-clearance flows. AIAA J. 2003, 42, 271–279. [Google Scholar] [CrossRef]
- You, D.; Mittal, R.; Wang, M.; Moin, P. Large-eddy simulation of a rotor tip-clearance flow. In Proceedings of the 40th AIAA Aerospace Sciences Meeting & Exhibit (AIAA 2002), Reno, NV, USA, 14–17 January 2002. [Google Scholar]
- You, D.; Wang, M.; Moin, P. Study of tip-clearance flow in turbomachines using large-eddy simulation. Comput. Sci. Eng. 2004, 6, 38–46. [Google Scholar]
- You, D.; Wang, M.; Moin, P.; Mittal, R. Prediction and analysis of rotor tip-clearance flows using large-eddy simulation. In Proceedings of the Users Group Conference 2004 (DOD_UGC 2004), Washington, DC, USA, 7–11 June 2004; pp. 174–181. [Google Scholar]
- Moin, P.; Wang, M.; You, D.; Mittal, R. Large-eddy simulation of rotor tip-clearance flows: Computational challenges and accomplishments. In Proceedings of the Users Group Conference 2005 (DOD_UGC 2005), Washington, DC, USA, 27–30 June 2005; pp. 134–141. [Google Scholar]
- You, D.; Wang, M.; Moin, P.; Mittal, R. Large-eddy simulation analysis of mechanisms for viscous losses in a turbomachinery tip-clearance flow. J. Fluid Mech. 2007, 586, 177–204. [Google Scholar] [CrossRef]
- You, D.; Wang, M.; Moin, P.; Mittal, R. Vortex dynamics and mechanisms for viscous losses in the tip-clearance flow. In Proceedings of the ASME Fluids Engineering Division Summer Meeting 2005 (FEDSM 2005), Houston, TX, USA, 19–23 June 2005; pp. 1601–1610. [Google Scholar]
- You, D.; Wang, M.; Moin, P.; Mittal, R. Vortex dynamics and low-pressure fluctuations in the tip-clearance flow. J. Fluids Eng. 2007, 129, 1002–1014. [Google Scholar] [CrossRef]
- Zhang, D.; Shi, W.; van Esch, B.P.M.; Shi, L.; Dubuisson, M. Numerical and experimental investigation of tip leakage vortex trajectory and dynamics in an axial flow pump. Comput. Fluids 2015, 112, 61–71. [Google Scholar] [CrossRef]
- Liu, Y.; Tan, L. Tip clearance on pressure fluctuation intensity and vortex characteristic of a mixed flow pump as turbine at pump mode. Renew. Energy 2018, 129, 606–615. [Google Scholar] [CrossRef]
- Zhang, D.; Shi, L.; Shi, W.; Zhao, R.; Wang, H.; van Esch, B.P.M. Numerical analysis of unsteady tip leakage vortex cavitation cloud and unstable suction-side-perpendicular cavitating vortices in an axial flow pump. Int. J. Multiph. Flow 2015, 77, 244–259. [Google Scholar] [CrossRef]
- Okita, K.; Ugajin, H.; Matsumoto, Y. Numerical analysis of the influence of the tip clearance flows on the unsteady cavitating flows in a three-dimensional inducer. J. Hydrodyn. 2009, 21, 34–40. [Google Scholar] [CrossRef]
- Saha, T.K.; Soundranayagam, S. Performance of a mixed flow pump with varying tip clearance: Part 1. Proc. Inst. Mech. Eng. Part A J. Power Energy 1996, 210, 305–318. [Google Scholar] [CrossRef]
- Soundranayagam, S.; Saha, T.K. Performance of a mixed flow pump with varying tip clearance: Part 2. Proc. Inst. Mech. Eng. Part A J. Power Energy 1996, 210, 319–327. [Google Scholar] [CrossRef]
- Engin, T.; Gur, M. Performance characteristics of a centrifugal pump impeller with running tip clearance pumping solid-liquid mixtures. J. Fluids Eng. Trans. ASME 2001, 123, 532–538. [Google Scholar] [CrossRef]
- Kim, N.J.; Diao, C.; Ahn, K.H.; Lee, S.J.; Kameneva, M.V.; Antaki, J.F. Parametric study of blade tip clearance, flow rate, and impeller speed on blood damage in rotary blood pump. Artif. Organs 2009, 33, 468–474. [Google Scholar] [CrossRef] [PubMed]
- Wu, J.; Paden, B.E.; Borovetz, H.S.; Antaki, J.F. Computational fluid dynamics analysis of blade tip clearances on hemodynamic performance and blood damage in a centrifugal ventricular assist device. Artif. Organs 2010, 34, 402–411. [Google Scholar] [CrossRef] [PubMed]
- Thakker, A.; Dhanasekaran, T.S. Computed effects of tip clearance on performance of impulse turbine for wave energy conversion. Renew. Energy 2004, 29, 529–547. [Google Scholar] [CrossRef]
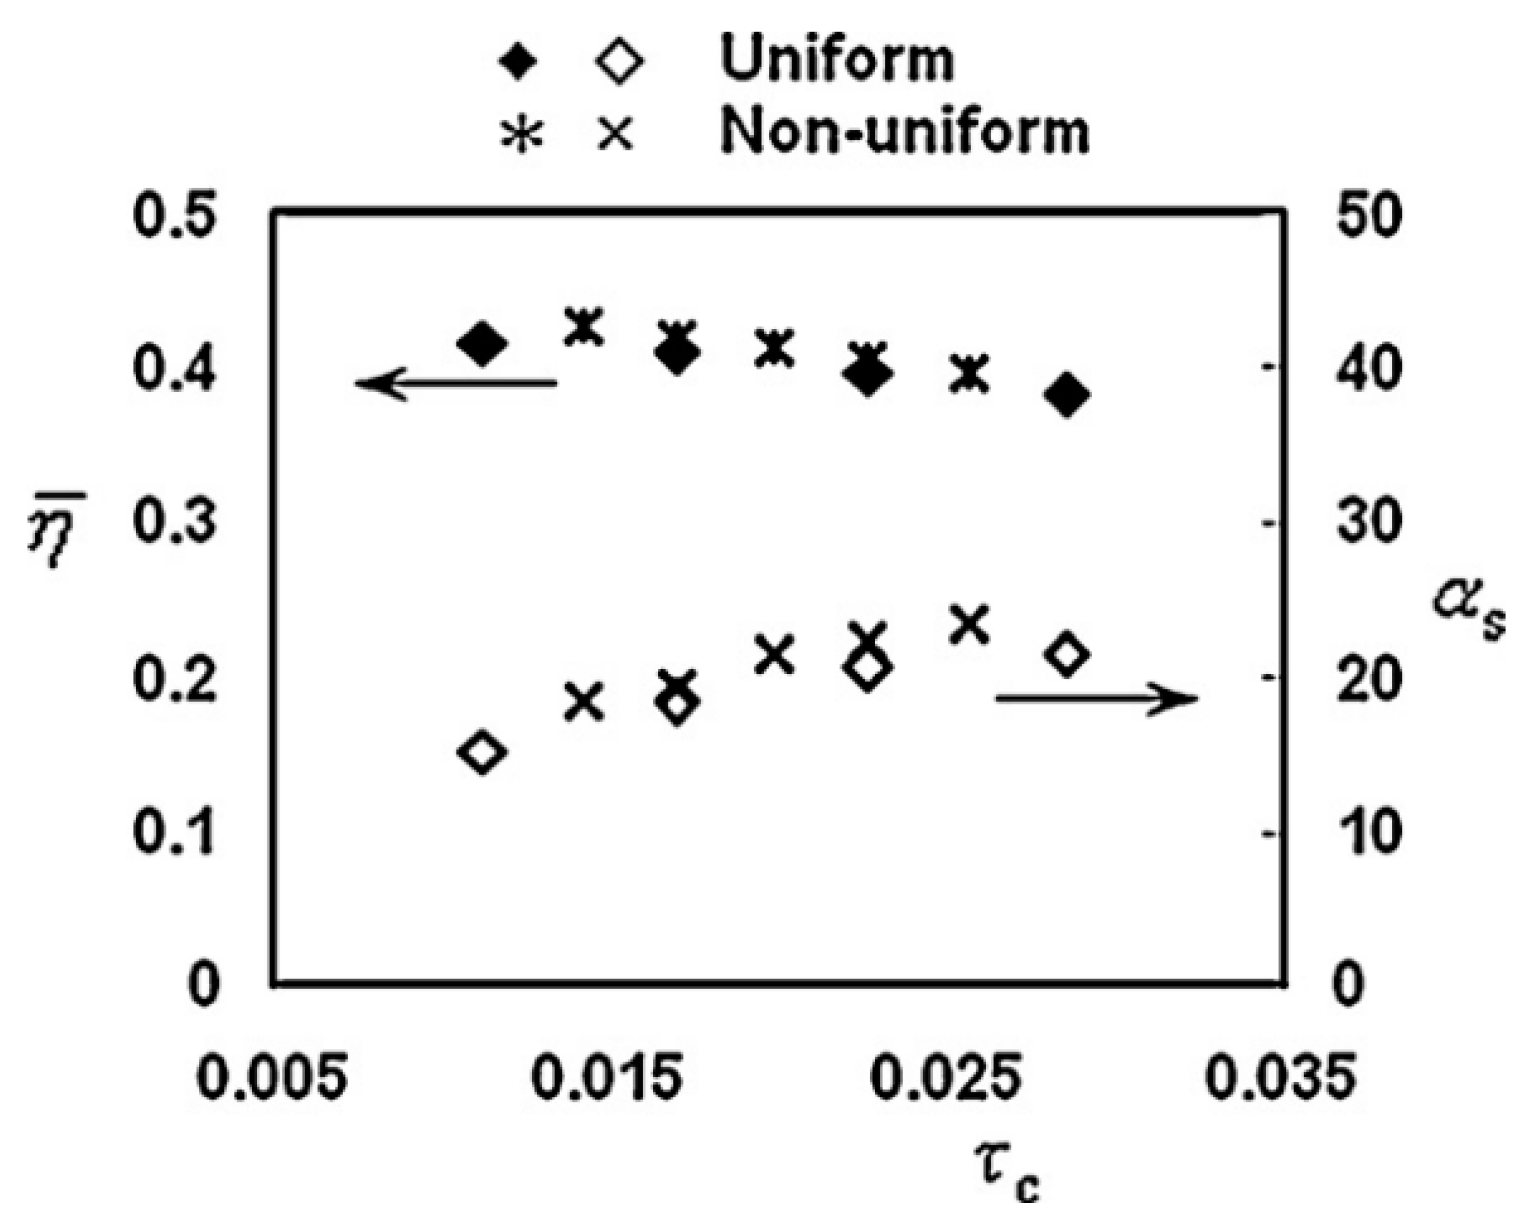
- Taha, Z.; Sugiyono; Ya, T.M.Y.S.T.; Sawada, T. Numerical investigation on the performance of Wells turbine with non-uniform tip clearance for wave energy conversion. Appl. Ocean Res. 2011, 33, 321–331. [Google Scholar] [CrossRef]
- Guénette, V.; Houde, S.; Ciocan, G.D.; Dumas, G.; Huang, J.; Deschênes, C. Numerical prediction of a bulb turbine performance hill chart through RANS simulations. In Proceedings of the 26th IAHR Symposium on Hydraulic Machinery and Systems (IHAR 2012), Beijing, China, 19–23 August 2012. [Google Scholar]
- Kim, S.; Choi, C.; Kim, J.; Park, J.; Baek, J. Effects of tip clearance on performance and characteristics of backflow in a turbopump inducer. Proc. Inst. Mech. Eng. Part A J. Power Energy 2013, 227, 847–857. [Google Scholar] [CrossRef]
- Kim, S.; Choi, C.; Kim, J.; Park, J.; Baek, J. Tip clearance effects on cavitation evolution and head breakdown in turbopump inducer. J. Propuls. Power 2013, 29, 1357–1366. [Google Scholar] [CrossRef]
- Torre, L.; Pasini, A.; Cervone, A.; Pace, G.; Miloro, P.; D’Agostino, L. Effect of tip clearance on the performance of a three-bladed axial inducer. J. Propuls. Power 2015, 27, 890–898. [Google Scholar] [CrossRef]
- Kim, M.C.; Chun, H.H. Experimental investigation into the performance of the axial-flow-type waterjet according to the variation of impeller tip clearance. Ocean Eng. 2007, 34, 275–283. [Google Scholar] [CrossRef]
- Ding, Y.; Song, B.; Peng, W. Numerical investigation of tip clearance effects on the performance of ducted propeller. Int. J. Nav. Archit. Ocean Eng. 2015, 7, 795–804. [Google Scholar]
- Oweis, G.F.; Fry, D.; Chesnakas, C.J.; Jessup, S.D.; Ceccio, S.L. Development of a tip-leakage flow—Part 1: The flow over a range of Reynolds numbers. J. Fluids Eng. 2006, 128, 751–764. [Google Scholar] [CrossRef]
- Oweis, G.F.; Fry, D.; Chesnakas, C.J.; Jessup, S.D.; Ceccio, S.L. Development of a tip-leakage flow part 2: Comparison between the ducted and un-ducted rotor. J. Fluids Eng. 2006, 128, 765–773. [Google Scholar] [CrossRef]
- Lu, L.; Pan, G.; Wei, J.; Pan, Y. Numerical simulation of tip clearance impact on a pumpjet propulsor. Int. J. Nav. Archit. Ocean Eng. 2016, 8, 219–227. [Google Scholar] [CrossRef]
- Lu, L.; Gao, Y.; Li, Q.; Du, L. Numerical investigations of tip clearance flow characteristics of a pumpjet propulsor. Int. J. Nav. Archit. Ocean Eng. 2017, 10, 307–317. [Google Scholar] [CrossRef]
- Koirala, R.; Zhu, B.; Neopane, H.P. Effect of guide vane clearance gap on francis turbine performance. Energies 2016, 9, 275. [Google Scholar] [CrossRef]
- Egusquiza, E.; Valero, C.; Huang, X.; Jou, E.; Guardo, A.; Rodriguez, C. Failure investigation of a large pump-turbine runner. Eng. Fail. Anal. 2012, 23, 27–34. [Google Scholar] [CrossRef] [Green Version]
- Ran, H.; Luo, X.; Lei, Z.; Zhang, Y.; Wang, X.; Xu, H. Experimental study of the pressure fluctuations in a pump turbine at large partial flow conditions. Chin. J. Mech. Eng. 2012, 25, 1205–1209. [Google Scholar] [CrossRef]
- Tan, L.; Zhu, B.S.; Cao, S.L.; Wang, Y.C.; Wang, B.B. Numerical simulation of unsteady cavitation flow in a centrifugal pump at off-design conditions. ARCH. Proc. Inst. Mech. Eng. Part C J. Mech. Eng. Sci. 1994, 228, 1994–2006. [Google Scholar]
- Wang, Y.; Tan, L.; Wang, B.; Cao, S.; Zhu, B. Numerical investigation on frequency jump of flow over a cavity using large eddy simulation. J. Fluids Eng. 2015, 137, 081203. [Google Scholar] [CrossRef]
- Tan, L.; Zhu, B.; Wang, Y.; Cao, S.; Gui, S. Numerical study on characteristics of unsteady flow in a centrifugal pump volute at partial load condition. Eng. Comput. 2015, 32, 1549–1566. [Google Scholar] [CrossRef]
- Rodriguez, C.G.; Mateosprieto, B.; Egusquiza, E. Monitoring of Rotor-Stator Interaction in Pump-Turbine Using Vibrations Measured with On-Board Sensors Rotating with Shaft. Shock Vib. 2014, 2014, 118–124. [Google Scholar] [CrossRef]
- Liu, Y.; Tan, L.; Liu, M.; Hao, Y.; Xu, Y. Influence of prewhirl angle and axial distance on energy performance and pressure fluctuation for a centrifugal pump with inlet guide vanes. Energies 2017, 10, 695. [Google Scholar] [CrossRef]
- Tan, L.; Yu, Z.; Xu, Y.; Liu, Y.; Cao, S. Role of blade rotational angle on energy performance and pressure fluctuation of a mixed-flow pump. Proc. Inst. Mech. Eng. Part A J. Power Energy 2017, 231, 227–238. [Google Scholar]
- Zhang, W.; Yu, Z.; Zhu, B. Influence of tip clearance on pressure fluctuation in low specific speed mixed-flow pump passage. Energies 2017, 10, 148. [Google Scholar] [CrossRef]
- Xu, Y.; Tan, L.; Liu, Y.; Cao, S. Pressure fluctuation and flow pattern of a mixed-flow pump with different blade tip clearances under cavitation condition. Adv. Mech. Eng. 2017, 9. [Google Scholar] [CrossRef] [Green Version]
- Guo, S.; Okamoto, H. An experimental study on the fluid forces induced by rotor-stator interaction in a centrifugal pump. Int. J. Rotat. Mach. 2003, 9, 135–144. [Google Scholar] [CrossRef]
- González, J.; Parrondo, J.; Santolaria, C.; Blanco, E. Steady and unsteady radial forces for a centrifugal pump with impeller to tongue gap variation. J. Fluids Eng. 2006, 128, 454–462. [Google Scholar] [CrossRef]
- Hao, Y.; Tan, L.; Liu, Y.; Xu, Y.; Zhang, J.; Zhu, B. Energy performance and radial force of a mixed-flow pump with symmetrical and unsymmetrical tip clearances. Energies 2017, 10, 57. [Google Scholar] [CrossRef]
- Gopalan, S.; Katz, J.; Liu, H.L. Effect of gap size on tip leakage cavitation inception, associated noise and flow structure. J. Fluids Eng. 2002, 124, 994–1004. [Google Scholar] [CrossRef]
- Guo, Q.; Zhou, L.; Wang, Z. Numerical evaluation of the clearance geometries effect on the flow field and performance of a hydrofoil. Renew. Energy 2016, 99, 390–397. [Google Scholar] [CrossRef]
- Wu, S.; Shi, W.; Zhang, D.; Yao, J.; Cheng, C. Influence of blade tip rounding on tip leakage vortex cavitation of axial flow pump. In Proceedings of the 6th International Conference on Pumps and Fans with Compressors and Wind Turbines (ICPF 2013), Beijing, China, 19–22 September 2013. [Google Scholar]
- Mei, L.; Zhou, J. Effects of blade tip foil thickening on tip vortexes in ducted propeller. In Proceedings of the 3rd International Conference on Material, Mechanical and Manufacturing Engineering (IC3ME 2015), Guangzhou, China, 27–28 June 2015. [Google Scholar]
- Tan, L.; Xie, Z.; Liu, Y.; Hao, Y.; Xu, Y. Influence of T-shape tip clearance on performance of a mixed-flow pump. Proc. Inst. Mech. Eng. Part A J. Power Energy 2018, 232, 386–396. [Google Scholar]
- Liu, Y.; Tan, L. Method of C groove on vortex suppression and energy performance improvement for a NACA0009 hydrofoil with tip clearance in tidal energy. Energy 2018, 155, 448–461. [Google Scholar] [CrossRef]
- Roussopoulos, K.; Monkewitz, P.A. Measurements of tip vortex characteristics and the effect of an anti-cavitation lip on a model kaplan turbine blade. Flow Turbul. Combust. 2000, 64, 119–144. [Google Scholar] [CrossRef]
- Gesaimart, W.S. Tip clearance cavitation in shrouded underwater propulsors. J. Aircr. 2015, 3, 185–192. [Google Scholar] [CrossRef]
- Yang, X.; Qin, Y.; Qu, Z. Leakage loss study of a synchronal rotary multiphase pump with a full range of inlet gas volume fractions. J. Fluids Eng. 2016, 138, 071301–071301-11. [Google Scholar] [CrossRef]
- Ganesh, H.; Chang, N.; Ceccio, S. Tip vortex cavitation suppression by mass injection. J. Fluids Eng. 2011, 133, 337–340. [Google Scholar]
- Rivetti, A.; Angulo, M.; Lucino, C.; Liscia, S. Pressurized air injection in an axial hydro-turbine model for the mitigation of tip leakage cavitation. In Proceedings of the 9th International Symposium on Cavitation (CAV 2015), Lausanne, Switzerland, 6–10 December 2015. [Google Scholar]


| Tip-Clearance Range | Machinery Type | Performance Change |
|---|---|---|
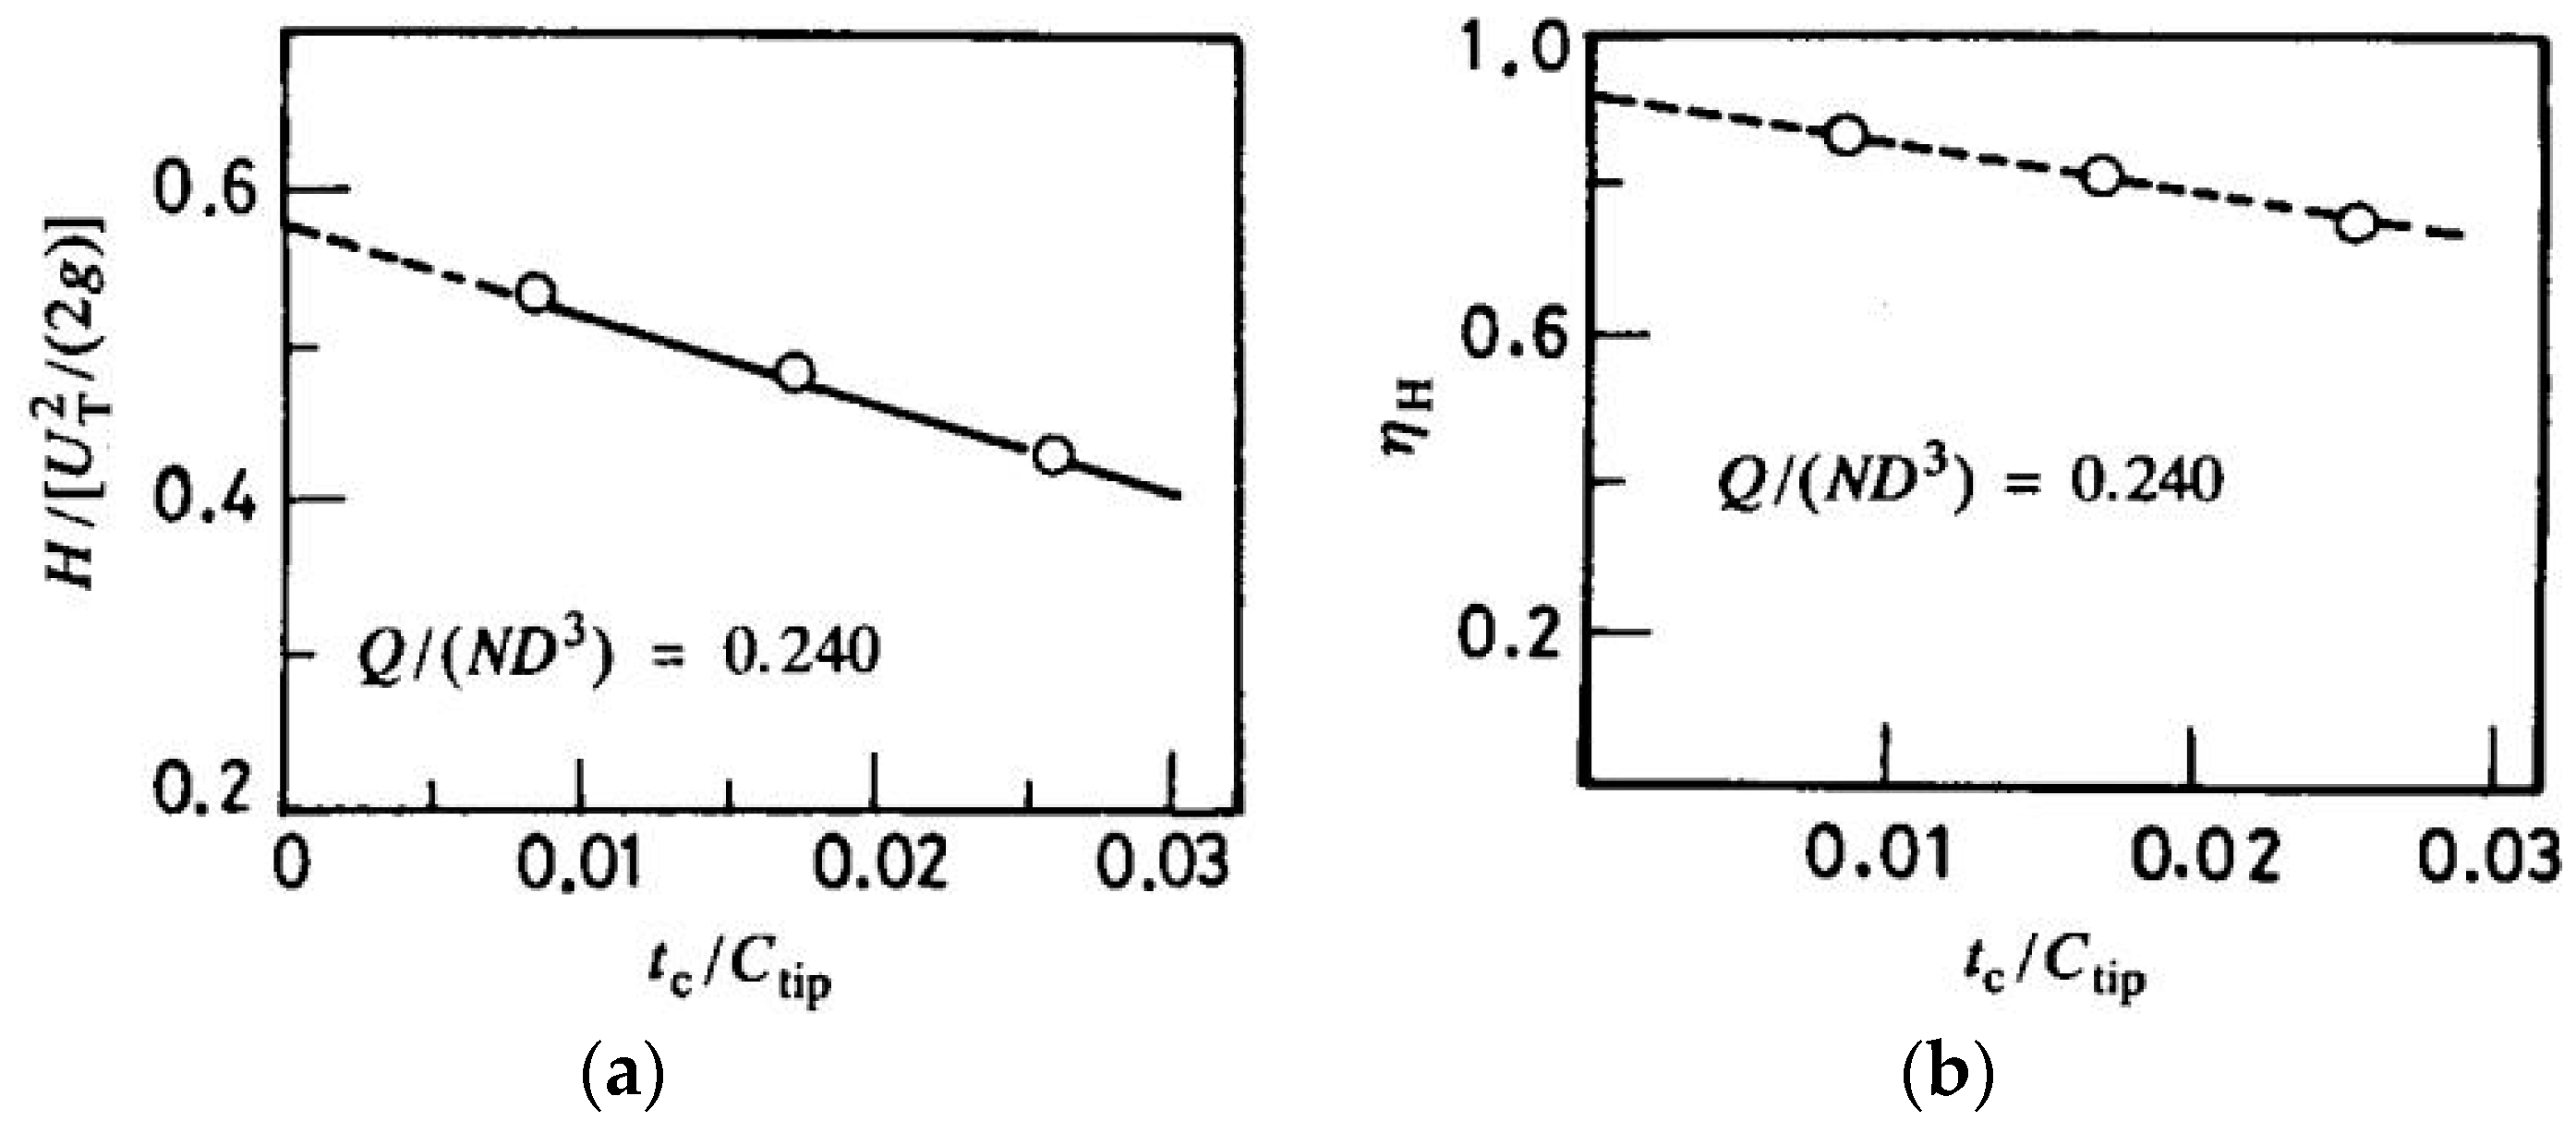
| 0–1 mm | Mixed-flow pump [5,6] | Head drops by 10% at design flow rate; efficiency drops by 4% at design flow rate; pressure fluctuation near blade-trailing edge increases by 20 times; unsymmetrical tip clearance deteriorates cavitation performance and increases radial-force fluctuation. |
| 0.5–1.5 mm | Mixed-flow pump [7] | Head drops by about 8% at design flow rate; tip-leakage reverse flow becomes stronger, and further thickens the casing boundary layer and intensifies vortexes in flow passage. |
| 0–1 mm | Axial-flow pump [8] | Significant pressure drop and cavitation inception in tip-clearance region. |
| 0–0.3 mm | Axial-flow pump [9] | Head drops by 3% at design flow rate; pressure fluctuation on blade increases by 34%. |
| Authors | Techniques | Conclusions |
|---|---|---|
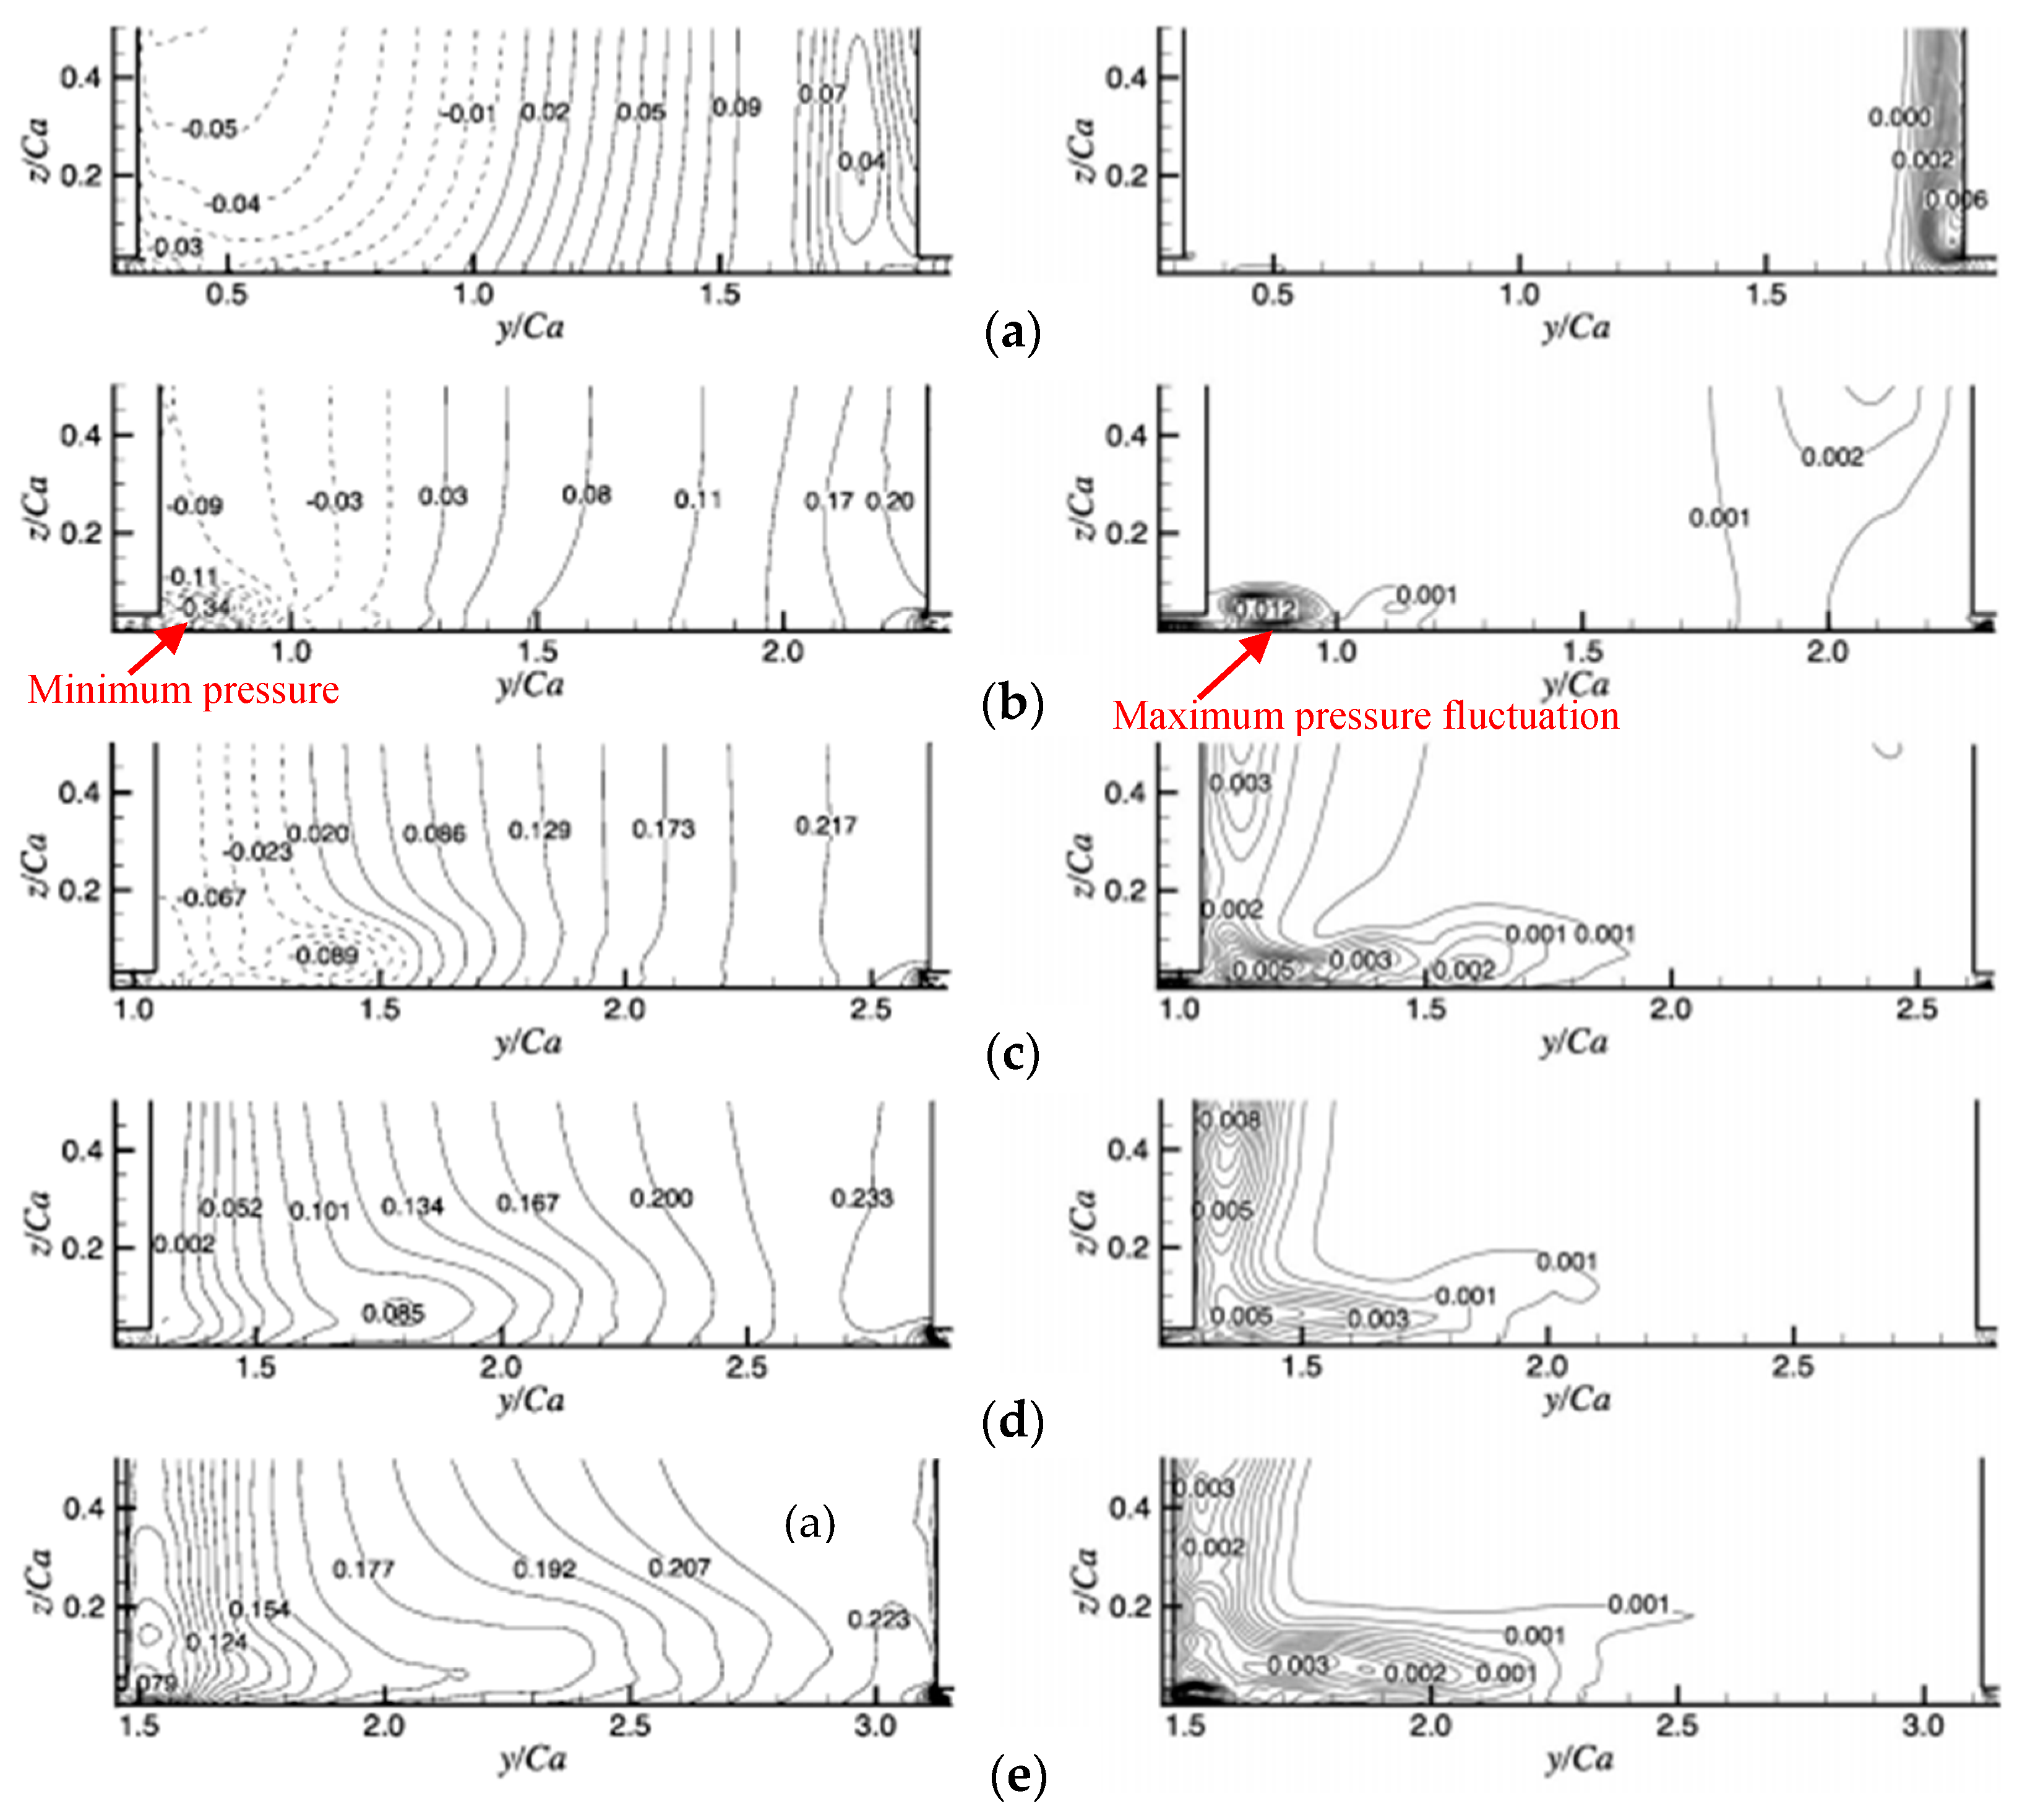
| Boulon et al. [12] | Laser-Doppler Velocimetry | The clearance size (confinement) influences the minimum pressure at vortex core and associated tip-vortex cavitation around a hydrofoil. Strong tip-vortex cavitation occurs in the range of 4–20 mm. |
| Dreyer et al. [14,15] | Particle-Imaging Velocimetry | Distance between the TLV and the hydrofoil with decreasing tip-clearance size, and the changing tip clearance shifts the TLV trajectory after the trailing edge. |
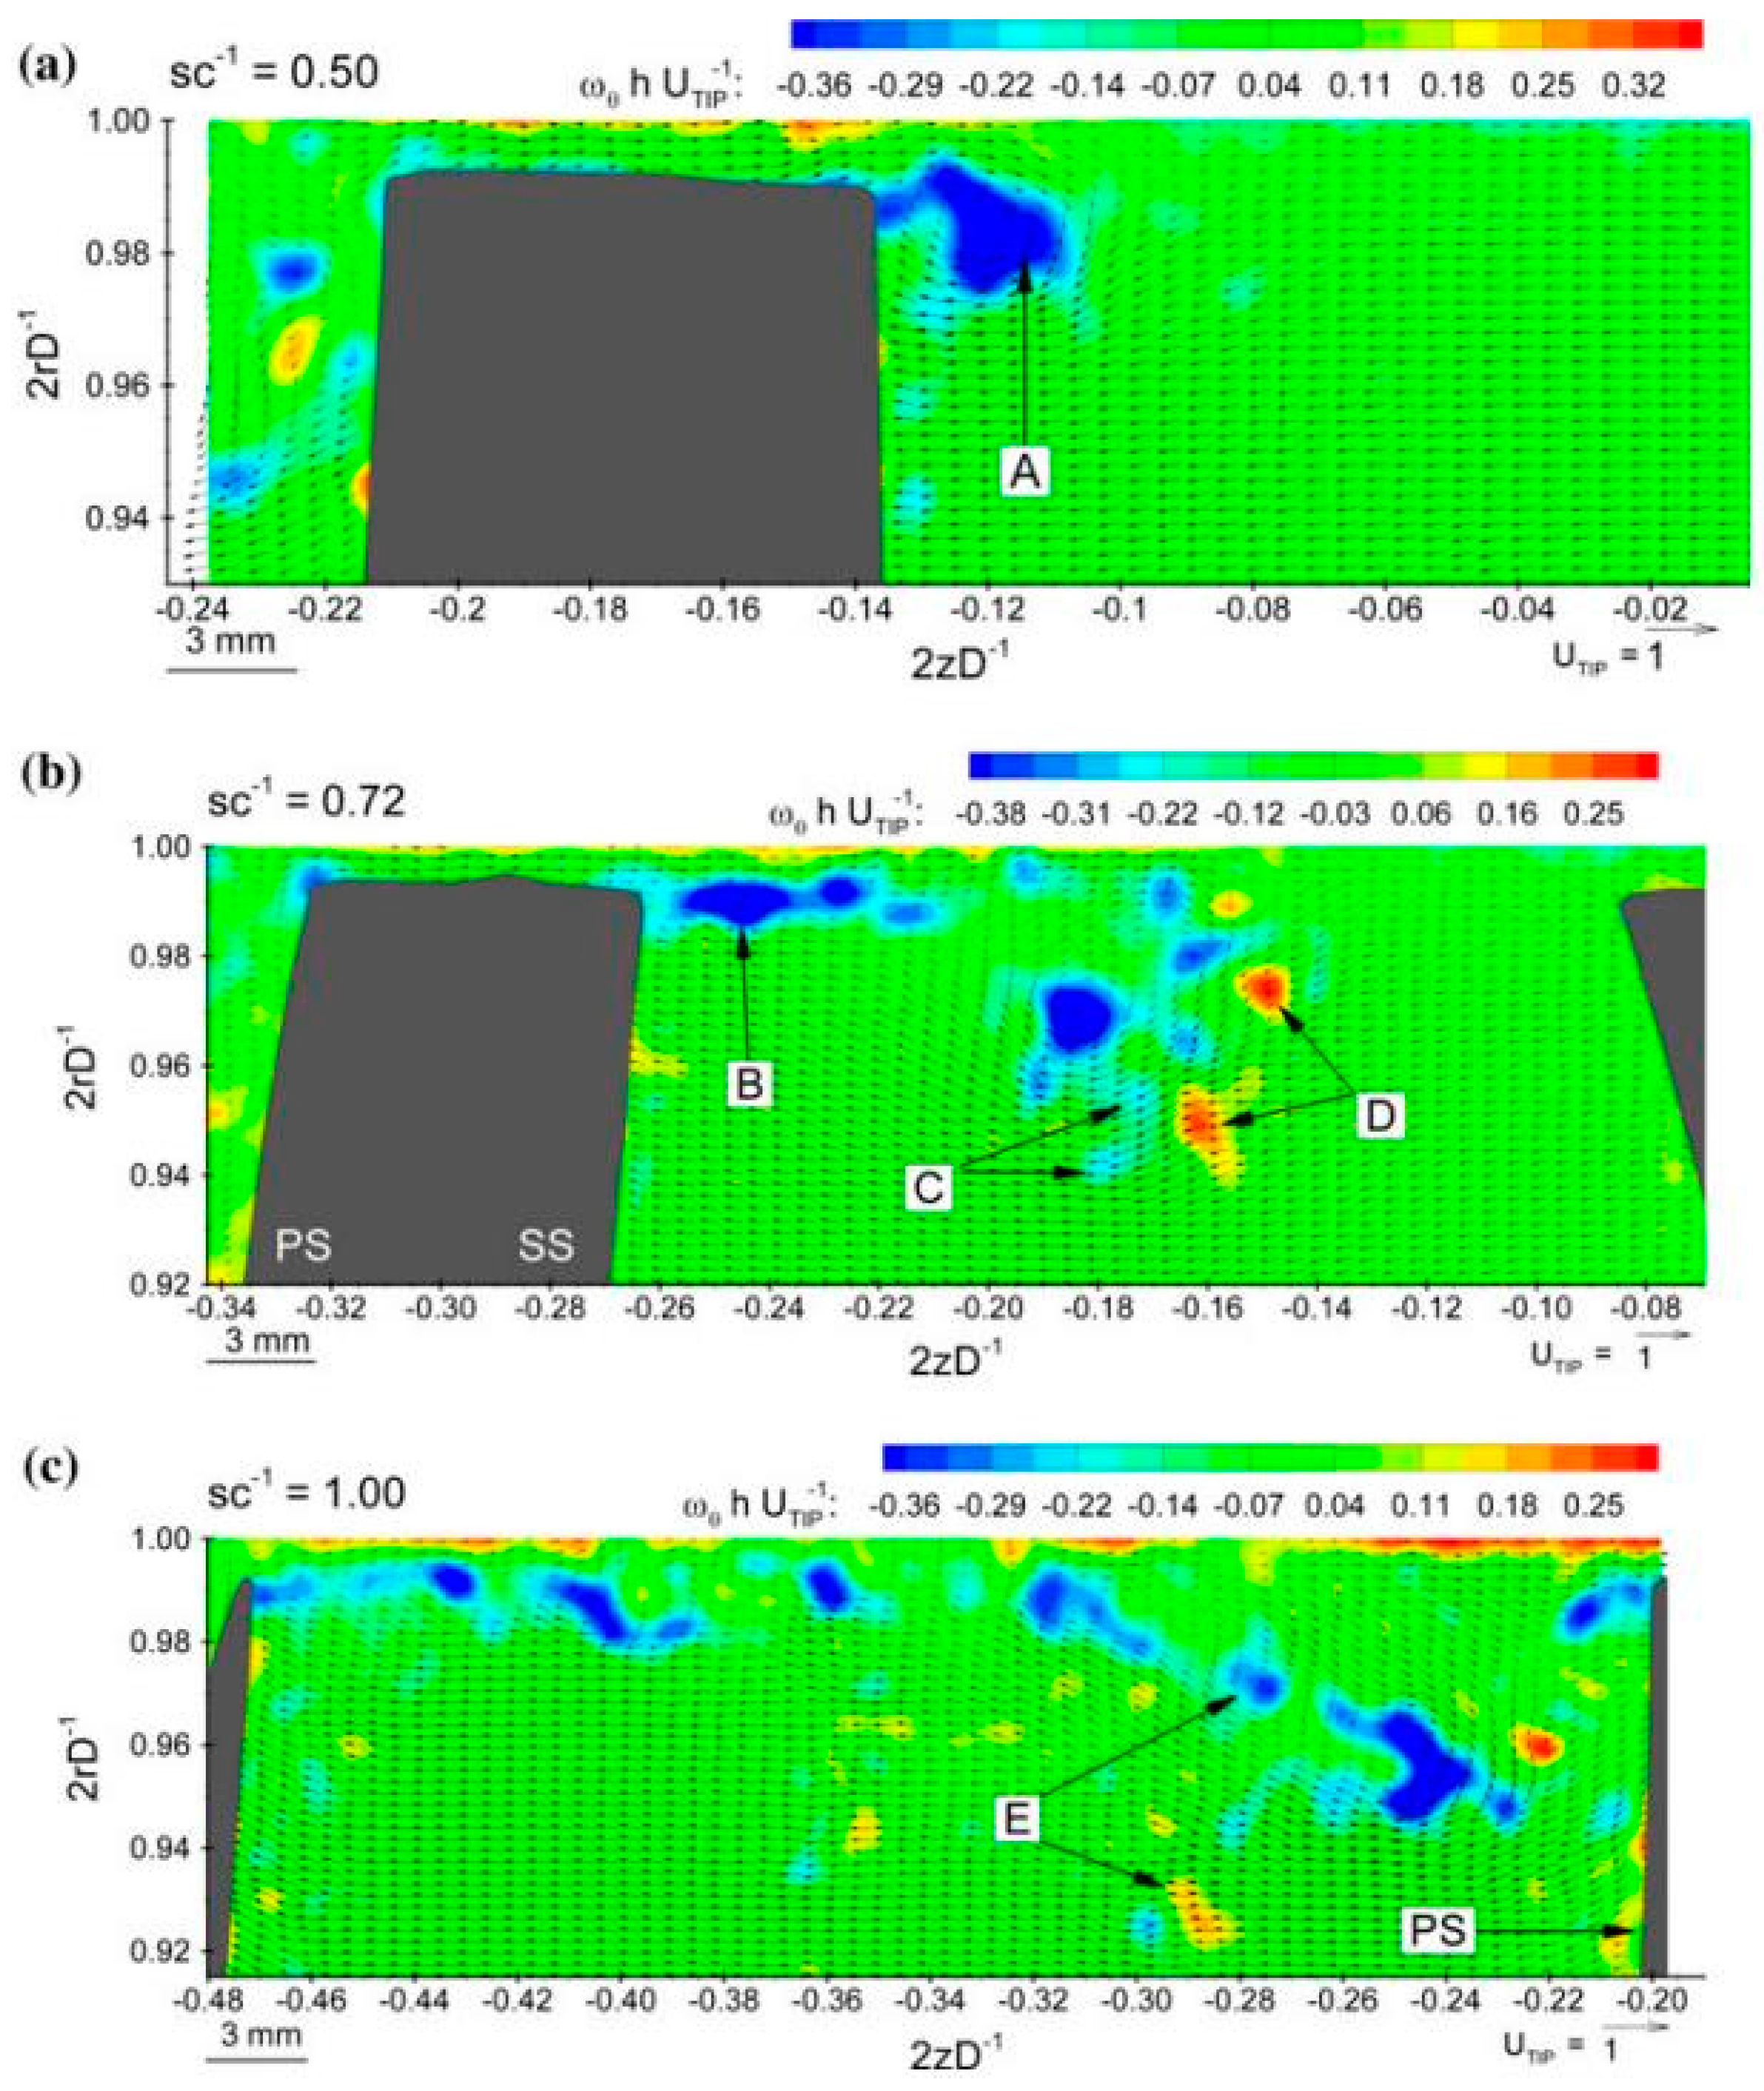
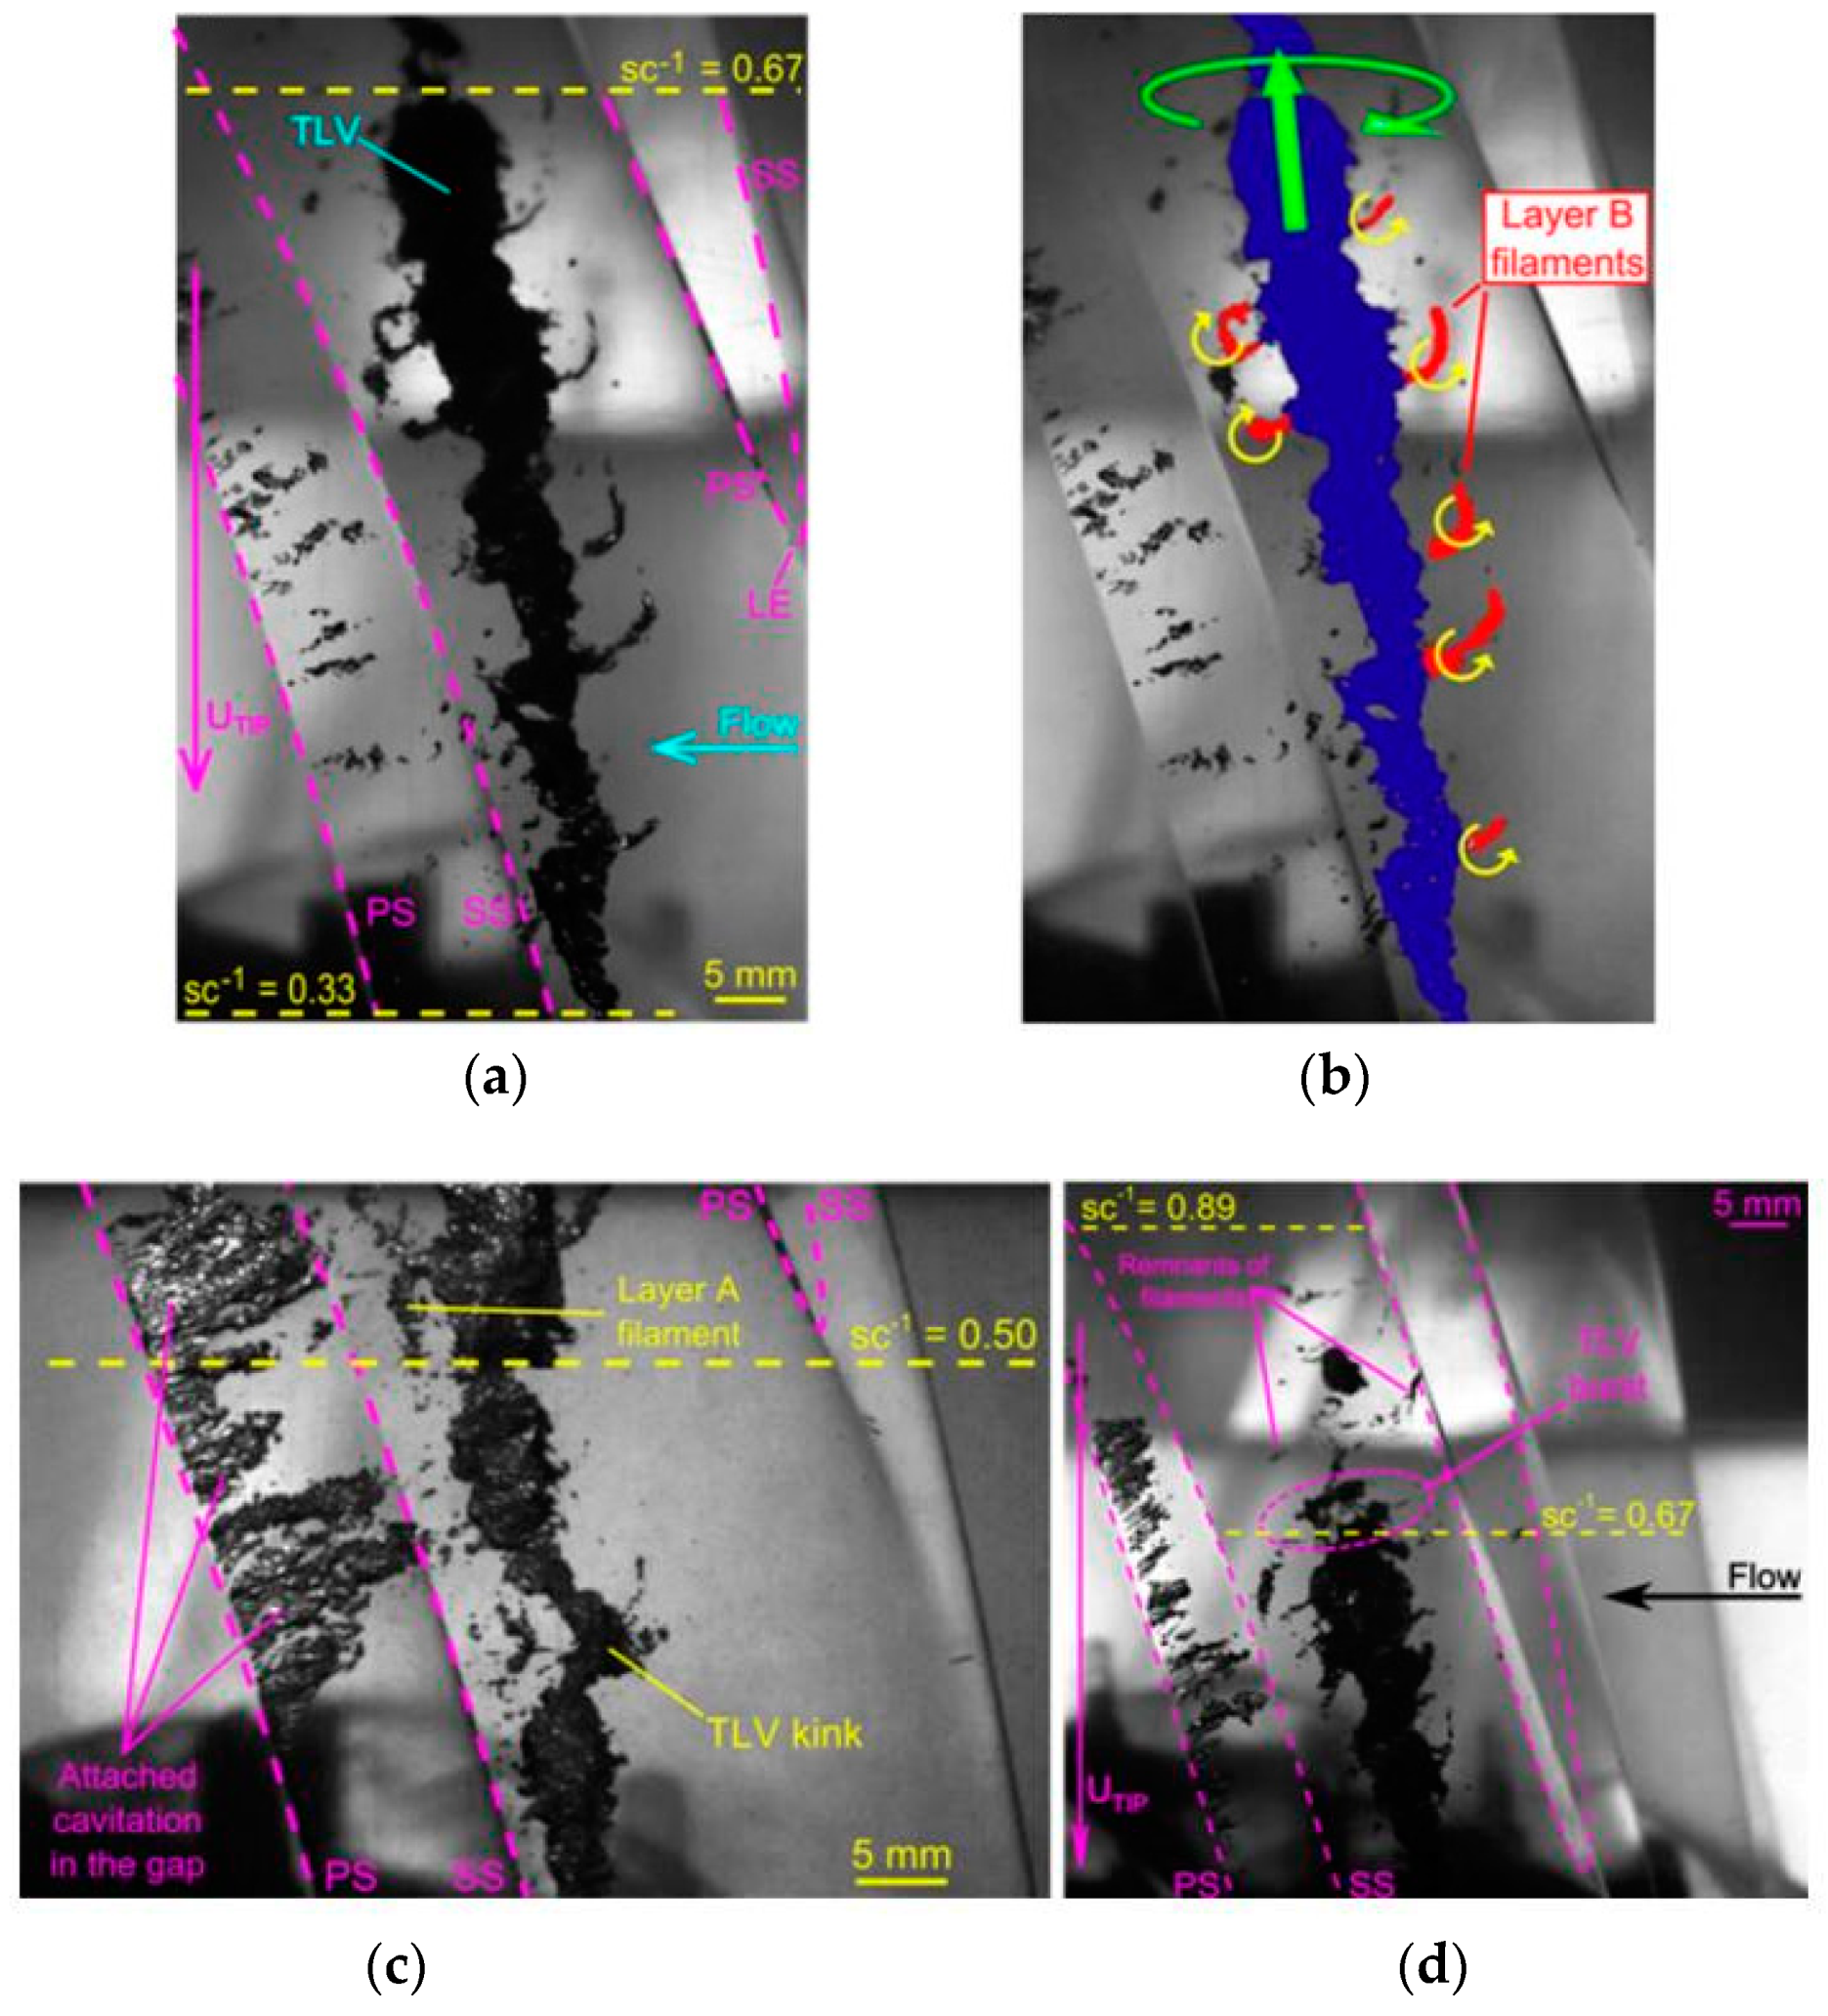
| Miorini, Wu, and Tan [16,17,18,19,20,21,22] | Particle-Imaging Velocimetry High-Speed Imaging | Two-dimensional and three-dimensional structure of TLV in an axial waterjet pump; five periods the evolution of TLV; vortex structures and corresponding flow characteristics along blade-chord direction. |
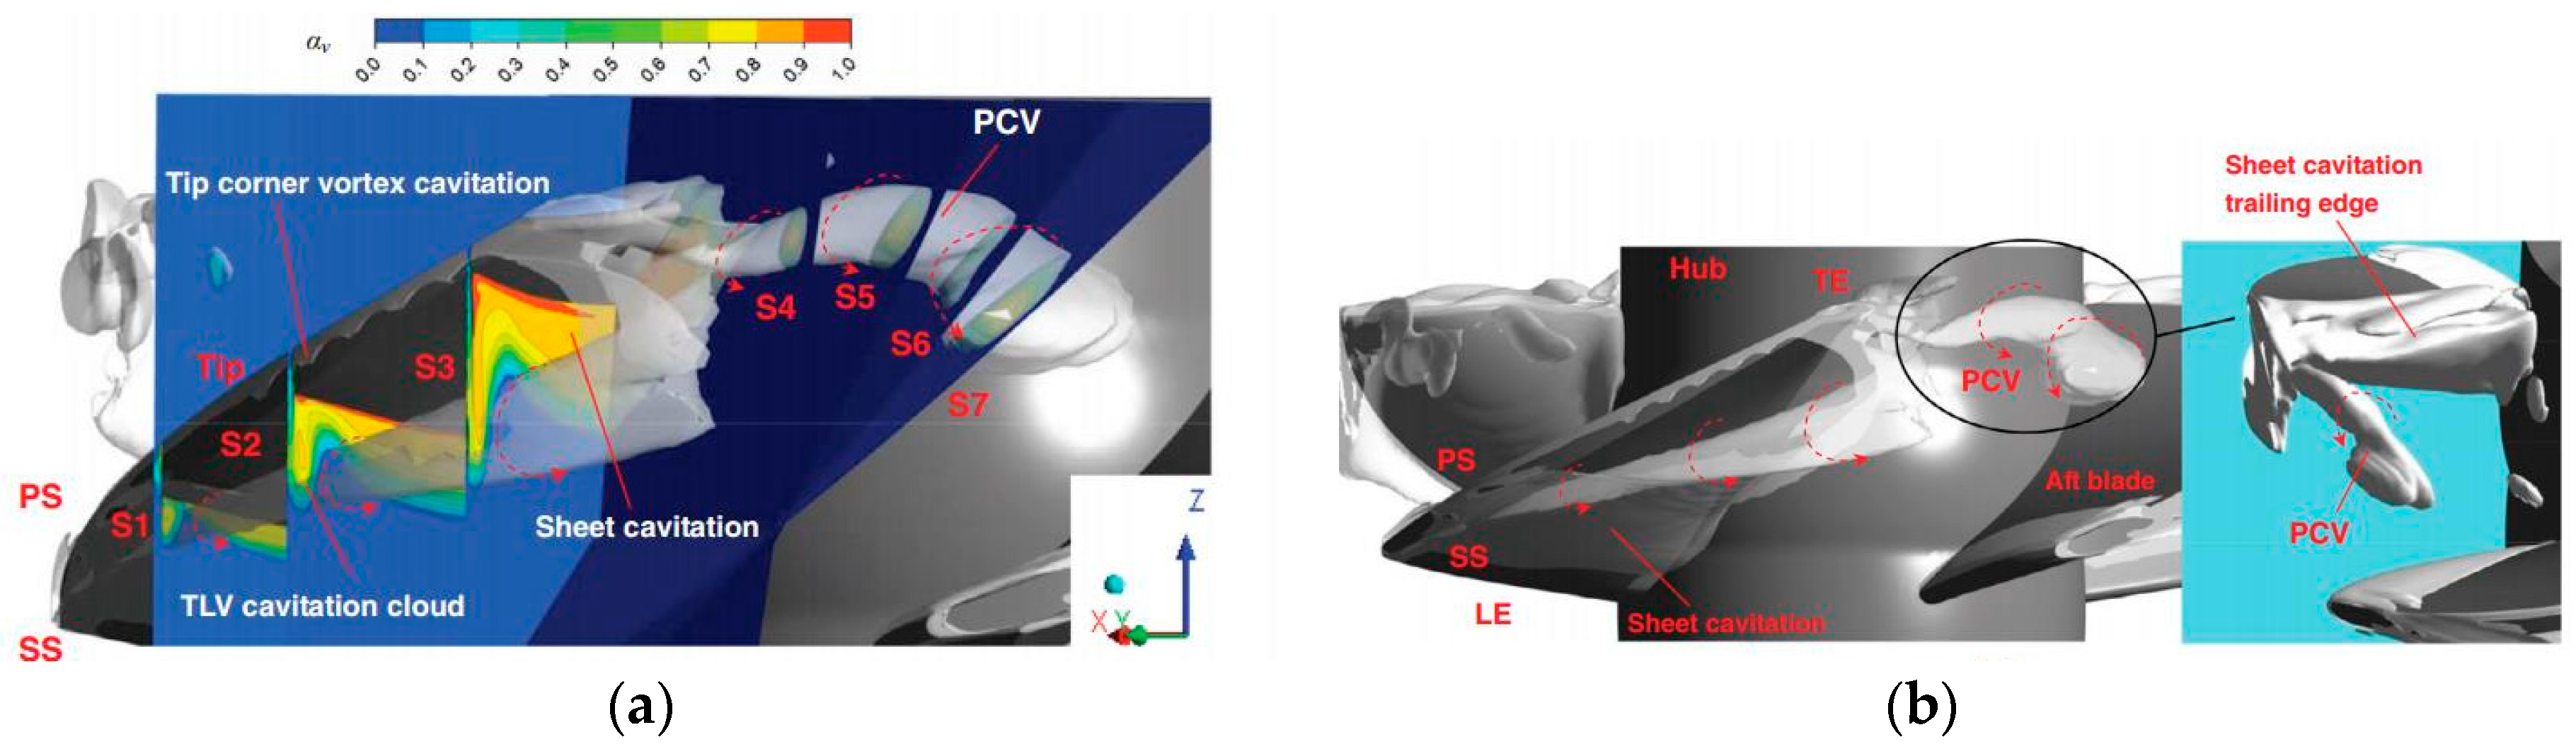
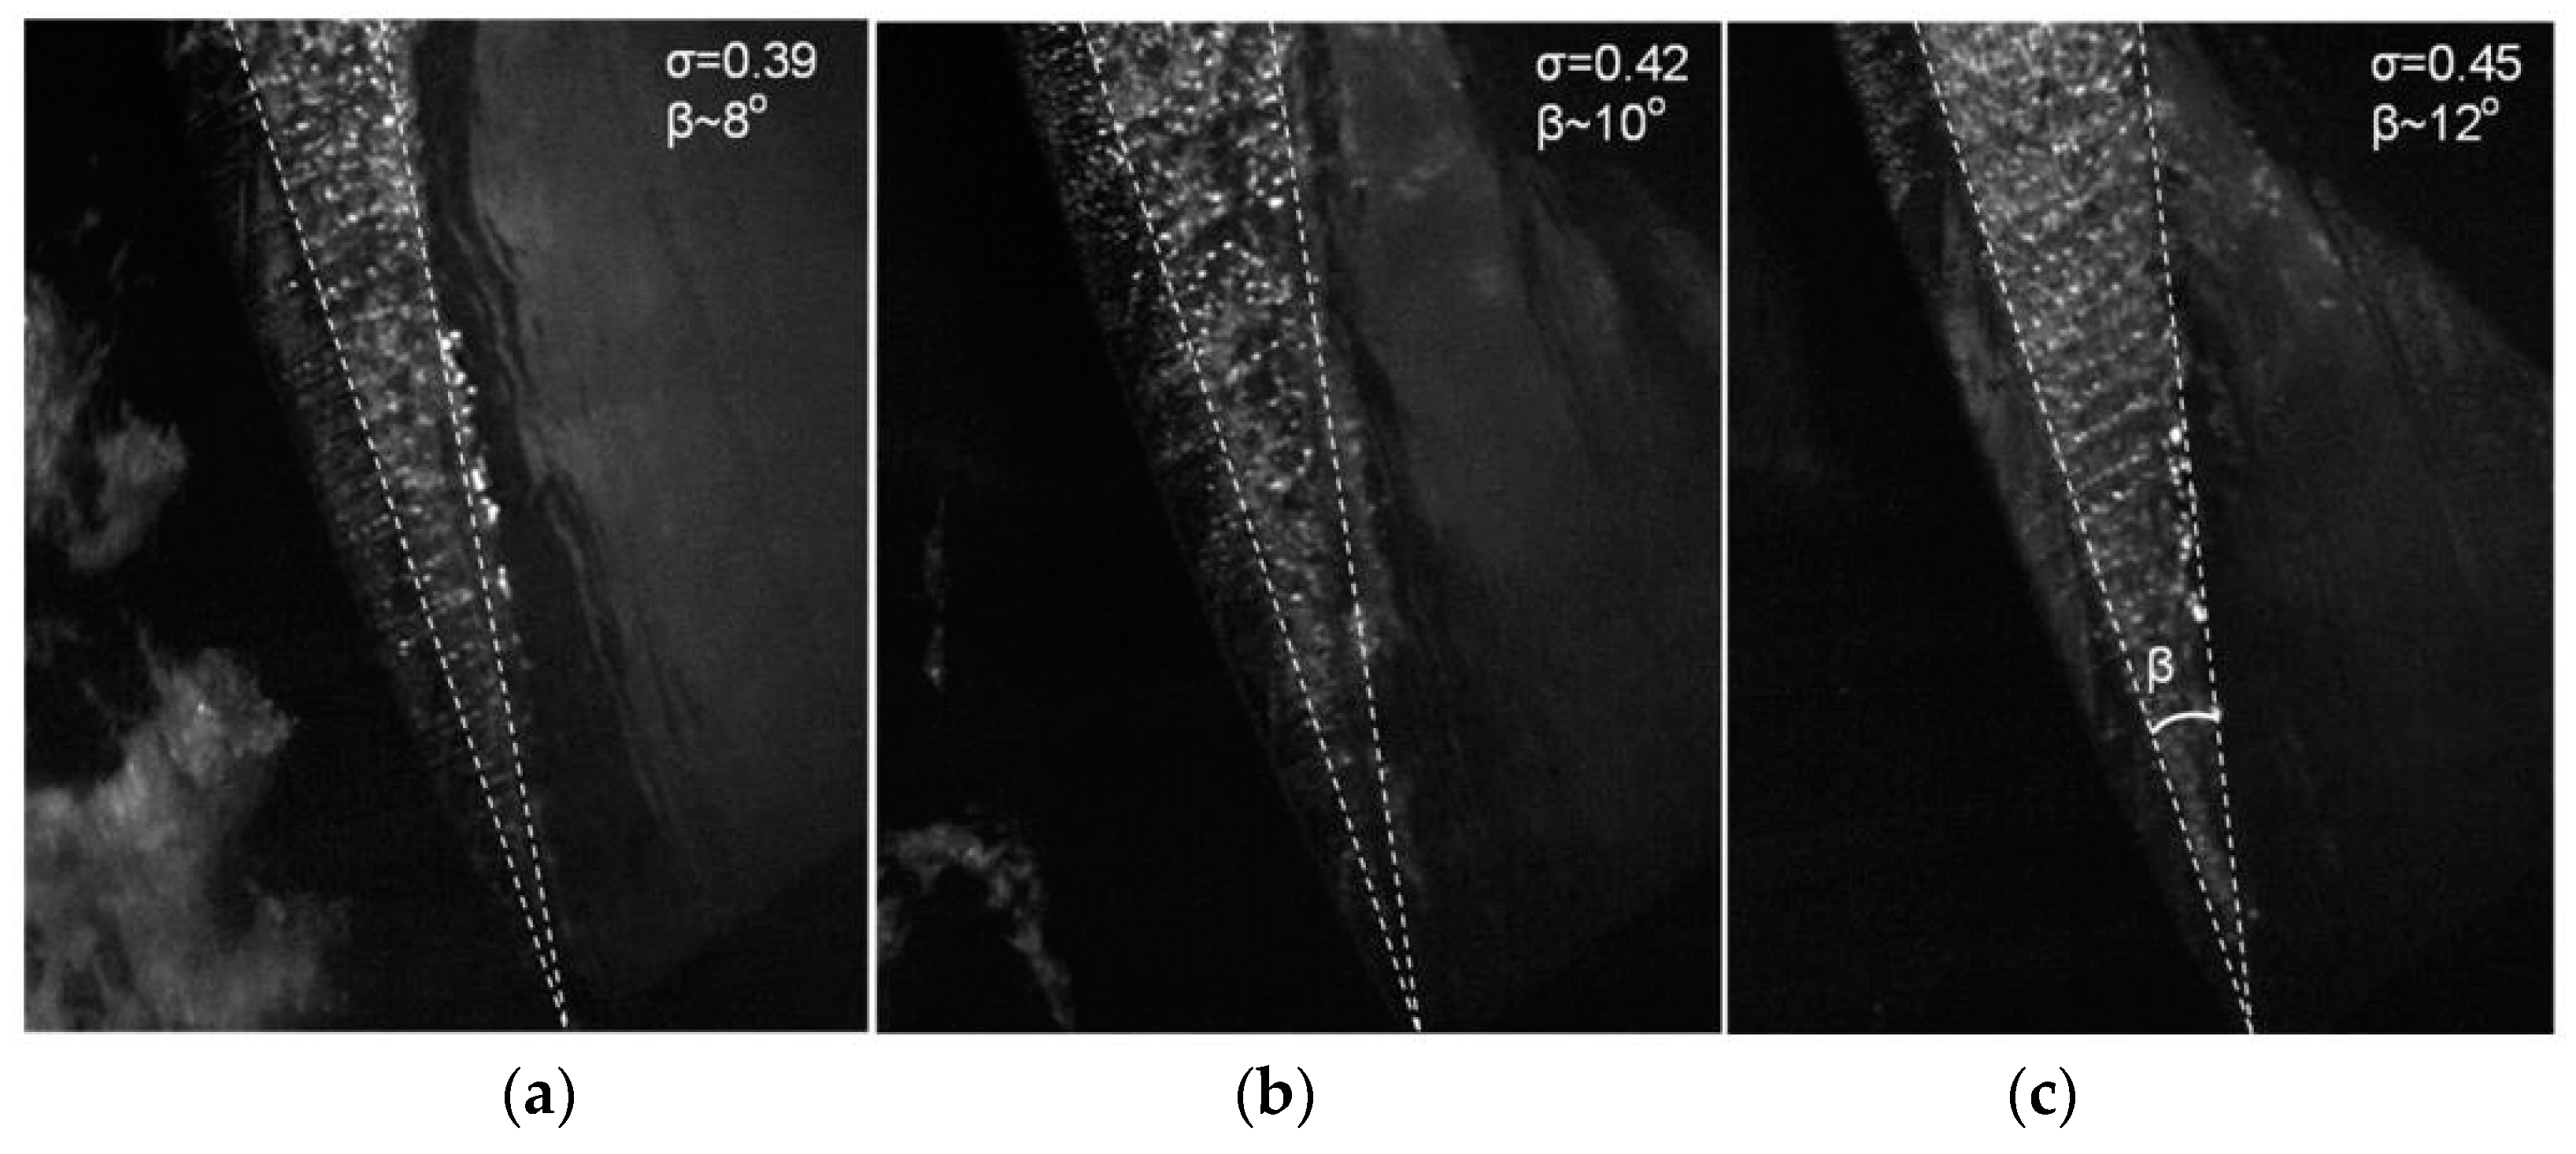
| Tan et al. [24] | High-Speed Imaging | The separation angle between the perpendicular cavitation vortex (PCV) and the blade tip increases from 8° to 12° when the cavitation number varies from 0.39 to 0.45 in an axial waterjet pump. |
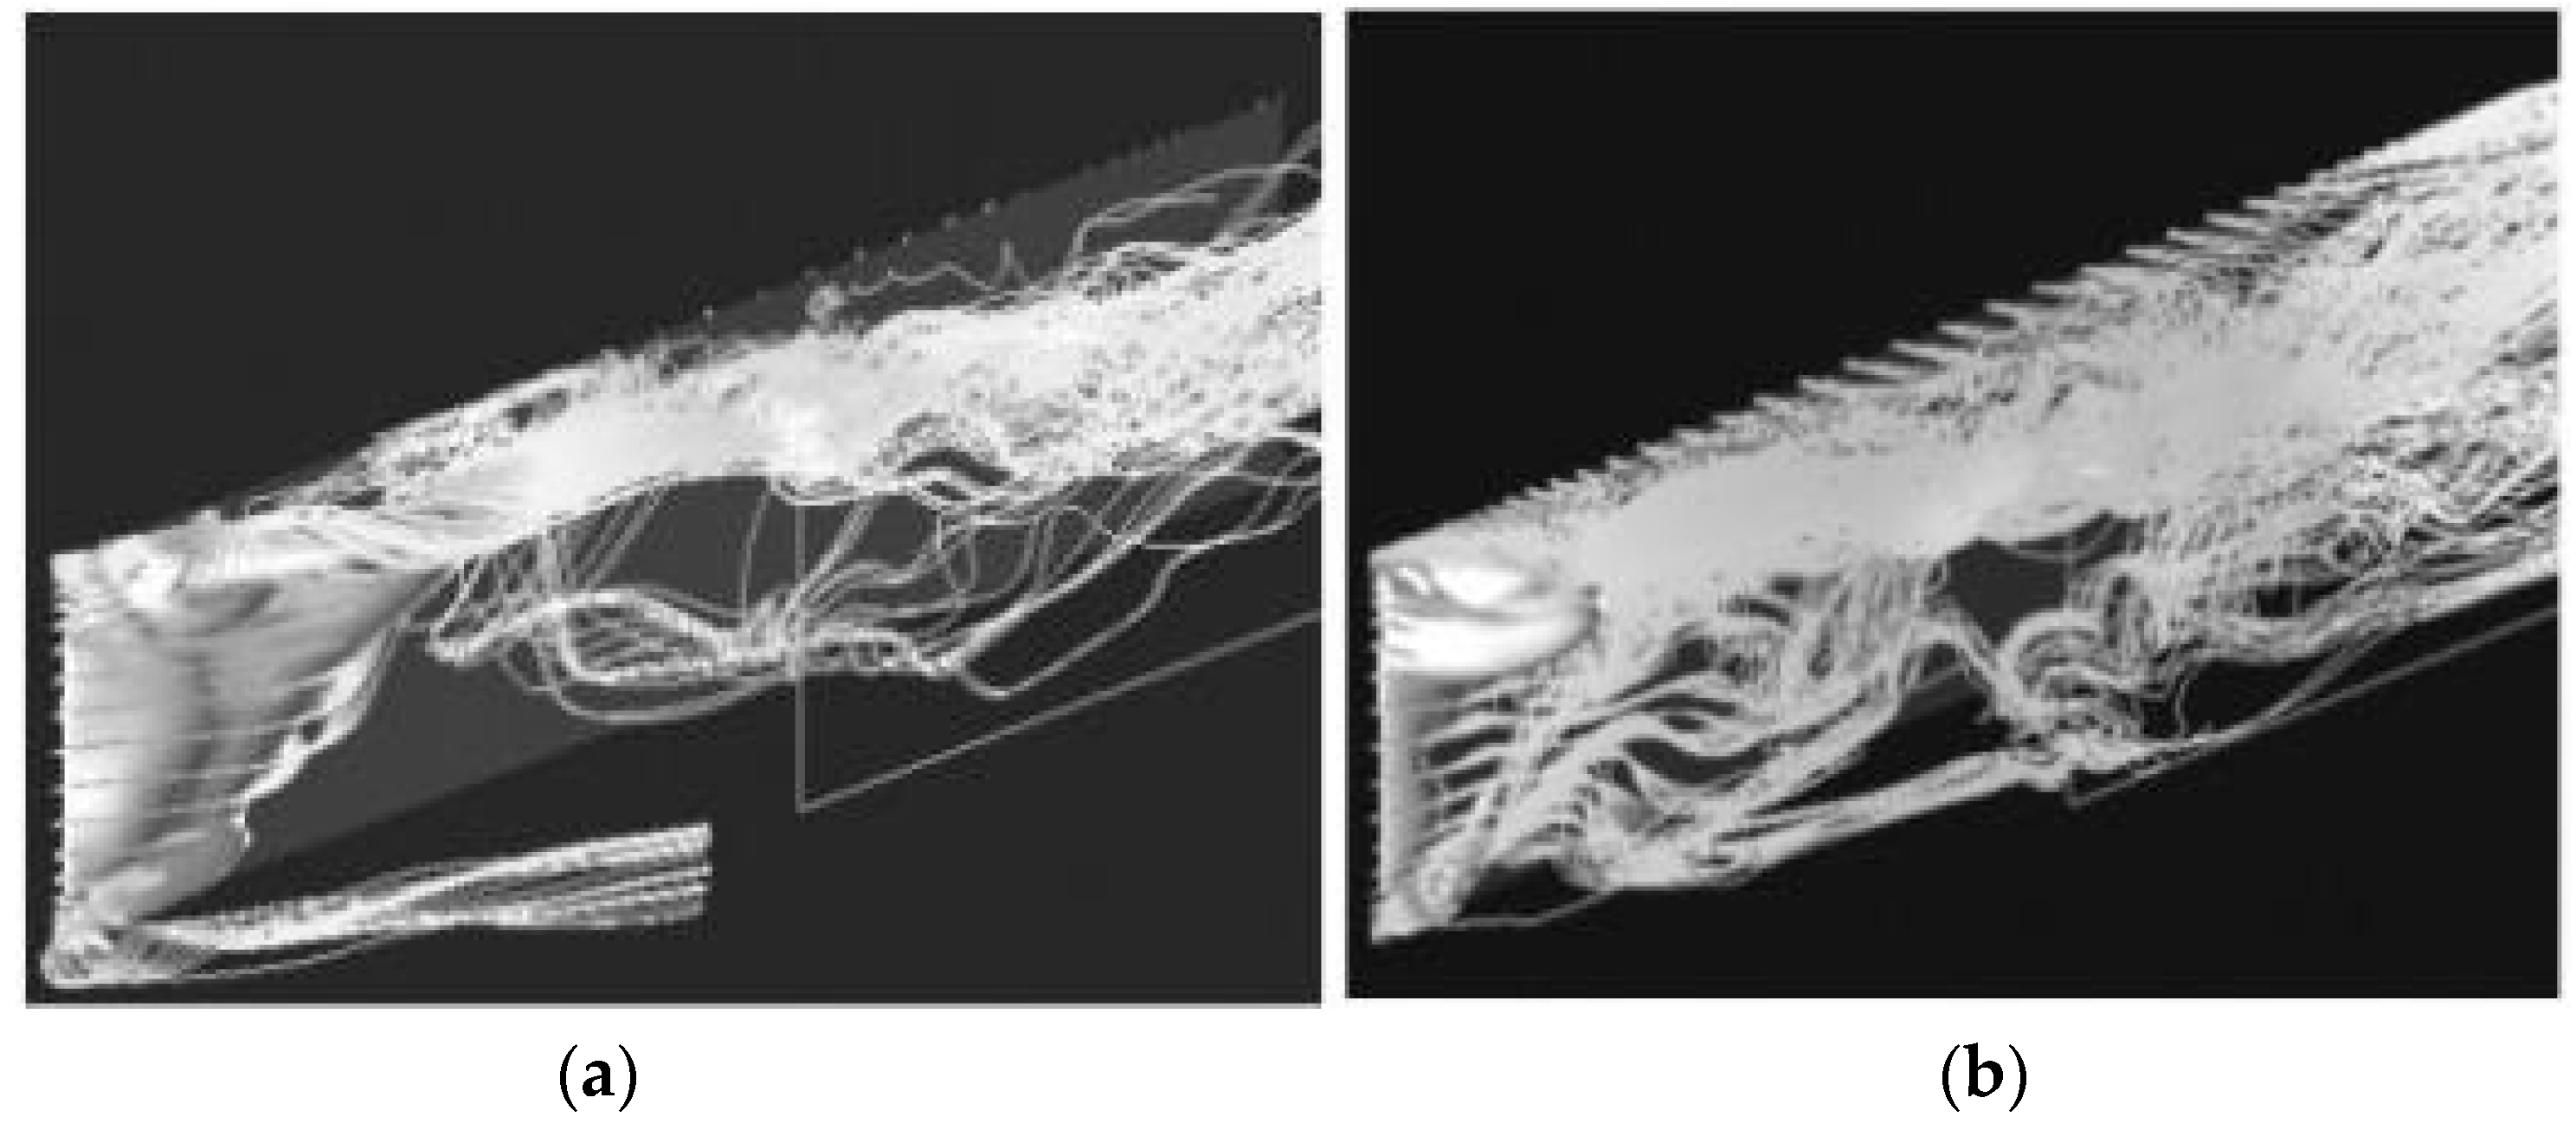
| Zhang et al. [8] | High-Speed Imaging | TLV cloud cavitation keeps a quite-persistent triangular structure from the leading edge to 80% chord, but the cavitation pattern is quite unstable near the trailing edge in an axial pump. |
| Authors | Method and Object | Conclusions |
|---|---|---|
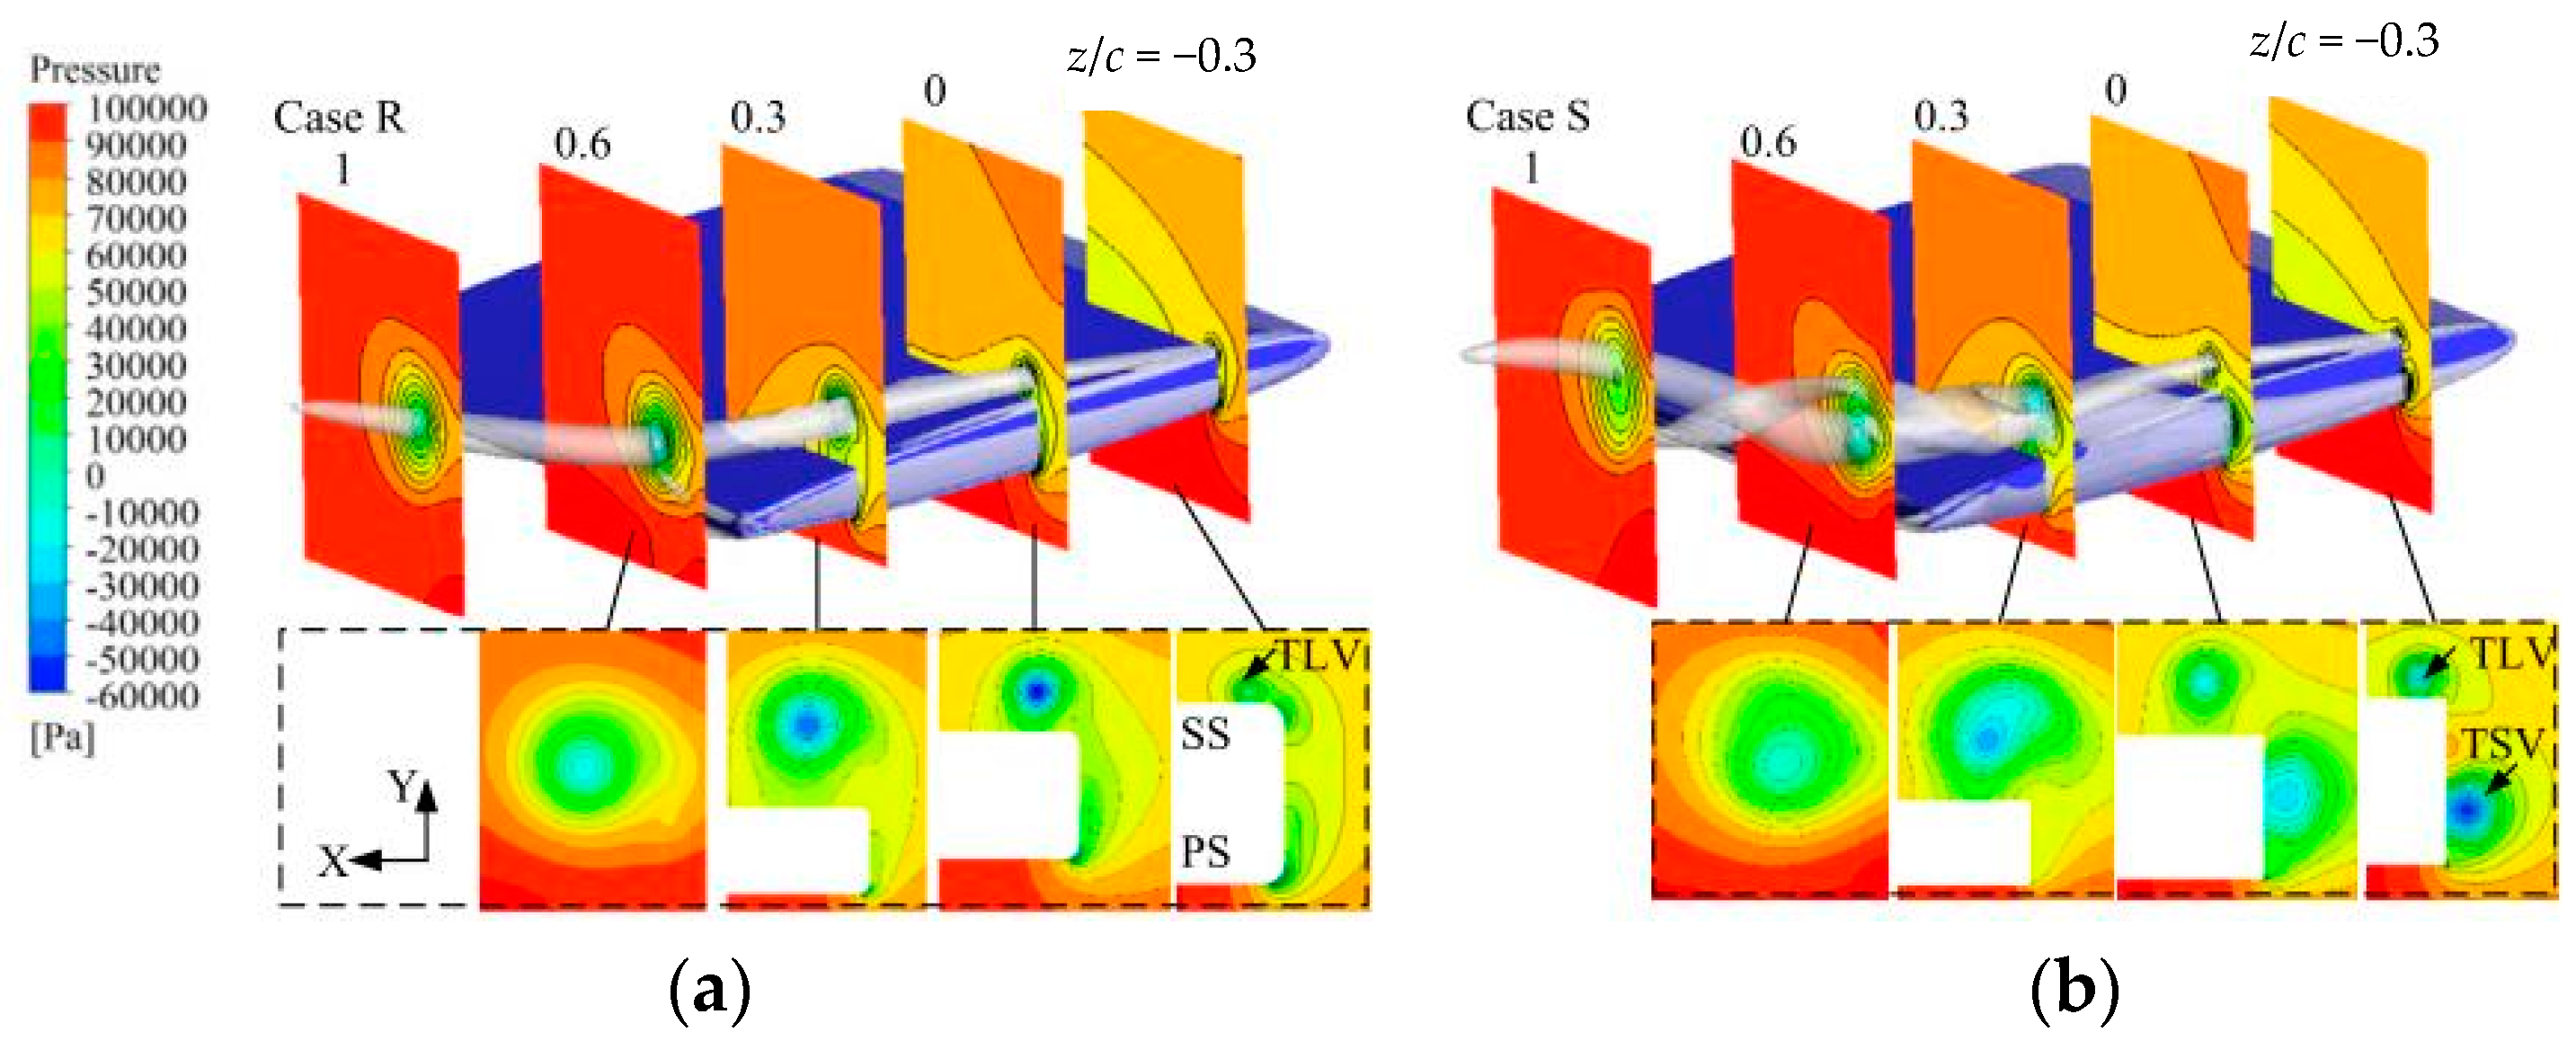
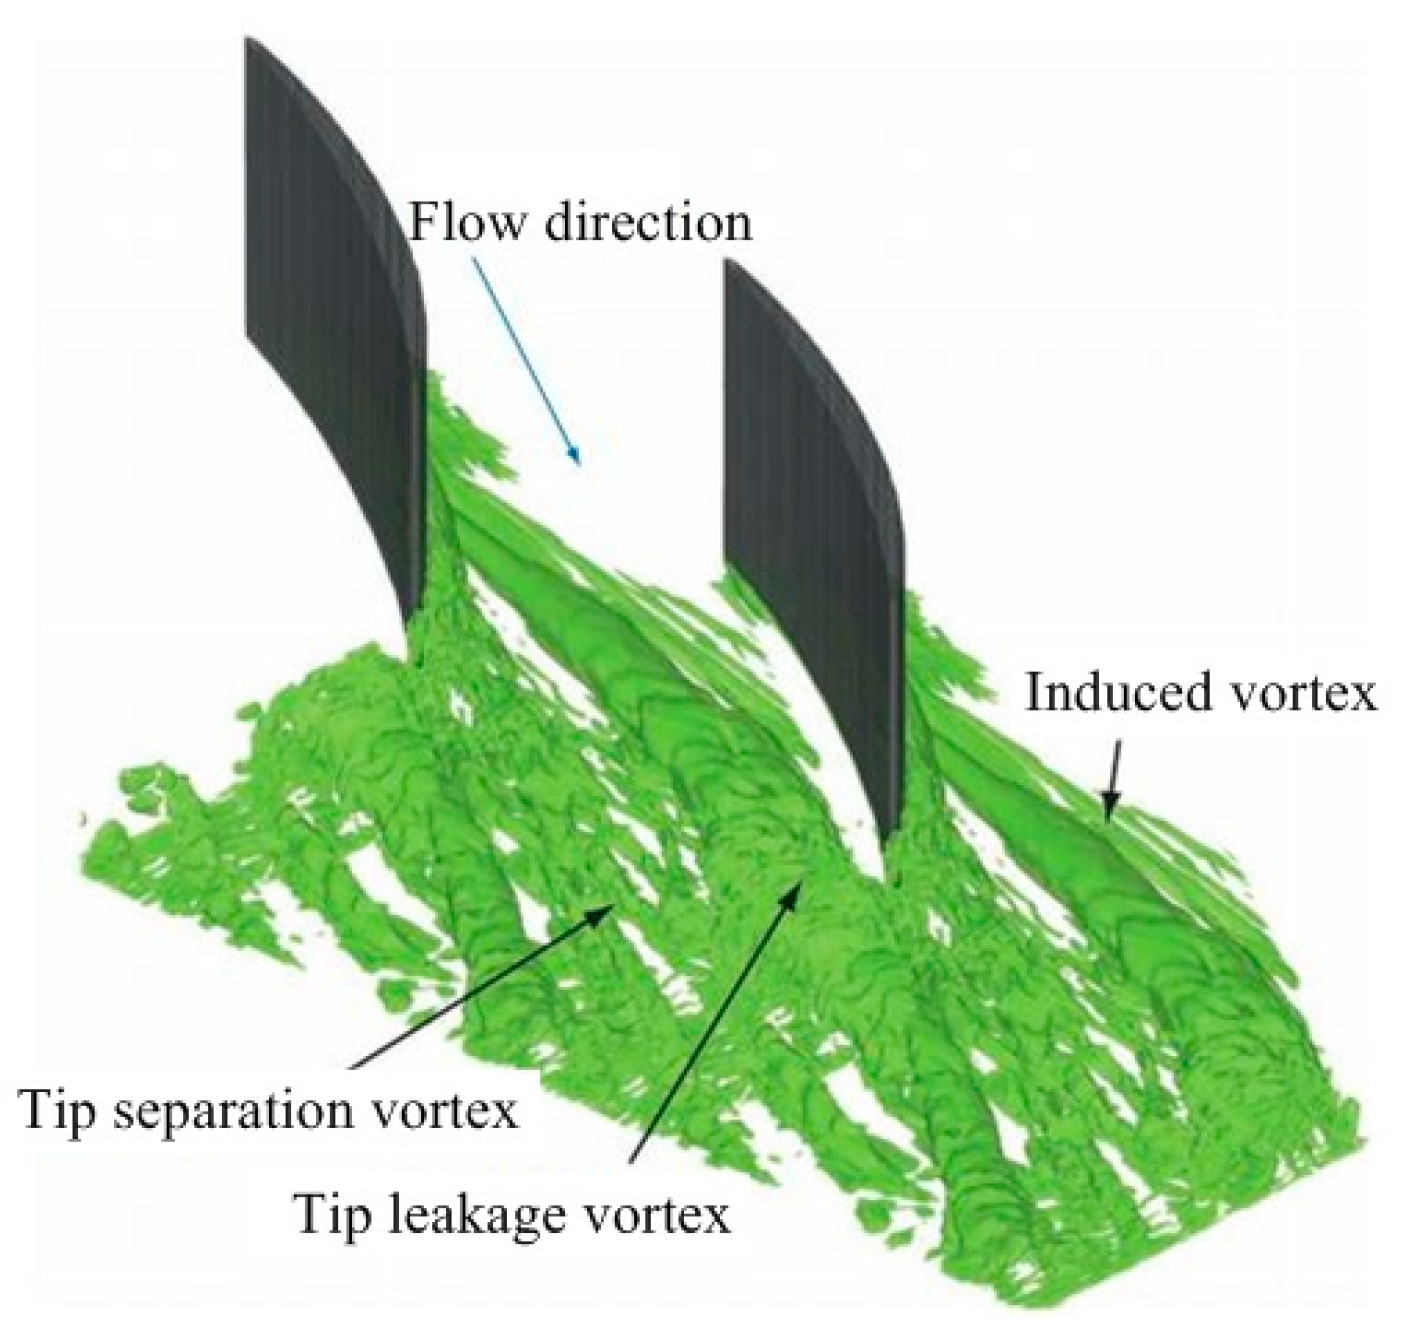
| You and Moin [34,35,36,37,38] | LES model Hydraulic turbomachine | The tip-clearance flow can be divided into three parts: the tip-leakage vortex, the tip-separation vortex, and the induced vortex. The three parts vary in volume and swirling direction, and TLV is the dominant structure among them. |
| You and Moin [39,40,41] | LES model hydraulic turbomachine | Tip-clearance flow leads to violent turbulence intensity, which increases the viscous losses near the tip clearance; Optimizing the direction of leakage flow by changing the tip shape is proposed; Cavitation is mostly prone to occur at TLV core in inception stage, and local optimization is recommended. |
| Zhang et al. [42] | SST model Axial pump | When the flow rate increases from 0.85Qd to 1.2Qd, the formation point of TLV shifts from 5% blade chord to 40% blade chord. The separation angle between the TLV and blade tip shows an increasing trend with increasing flow rate. |
| Liu et al. [5] | RNG model Mixed-flow pump | The separation angle between the TLV and the blade tip remained 10° for different tip-clearance sizes at the design flow rate. The separation angle is likely dependent on the flow rate [39], not the tip-clearance size [2]. |
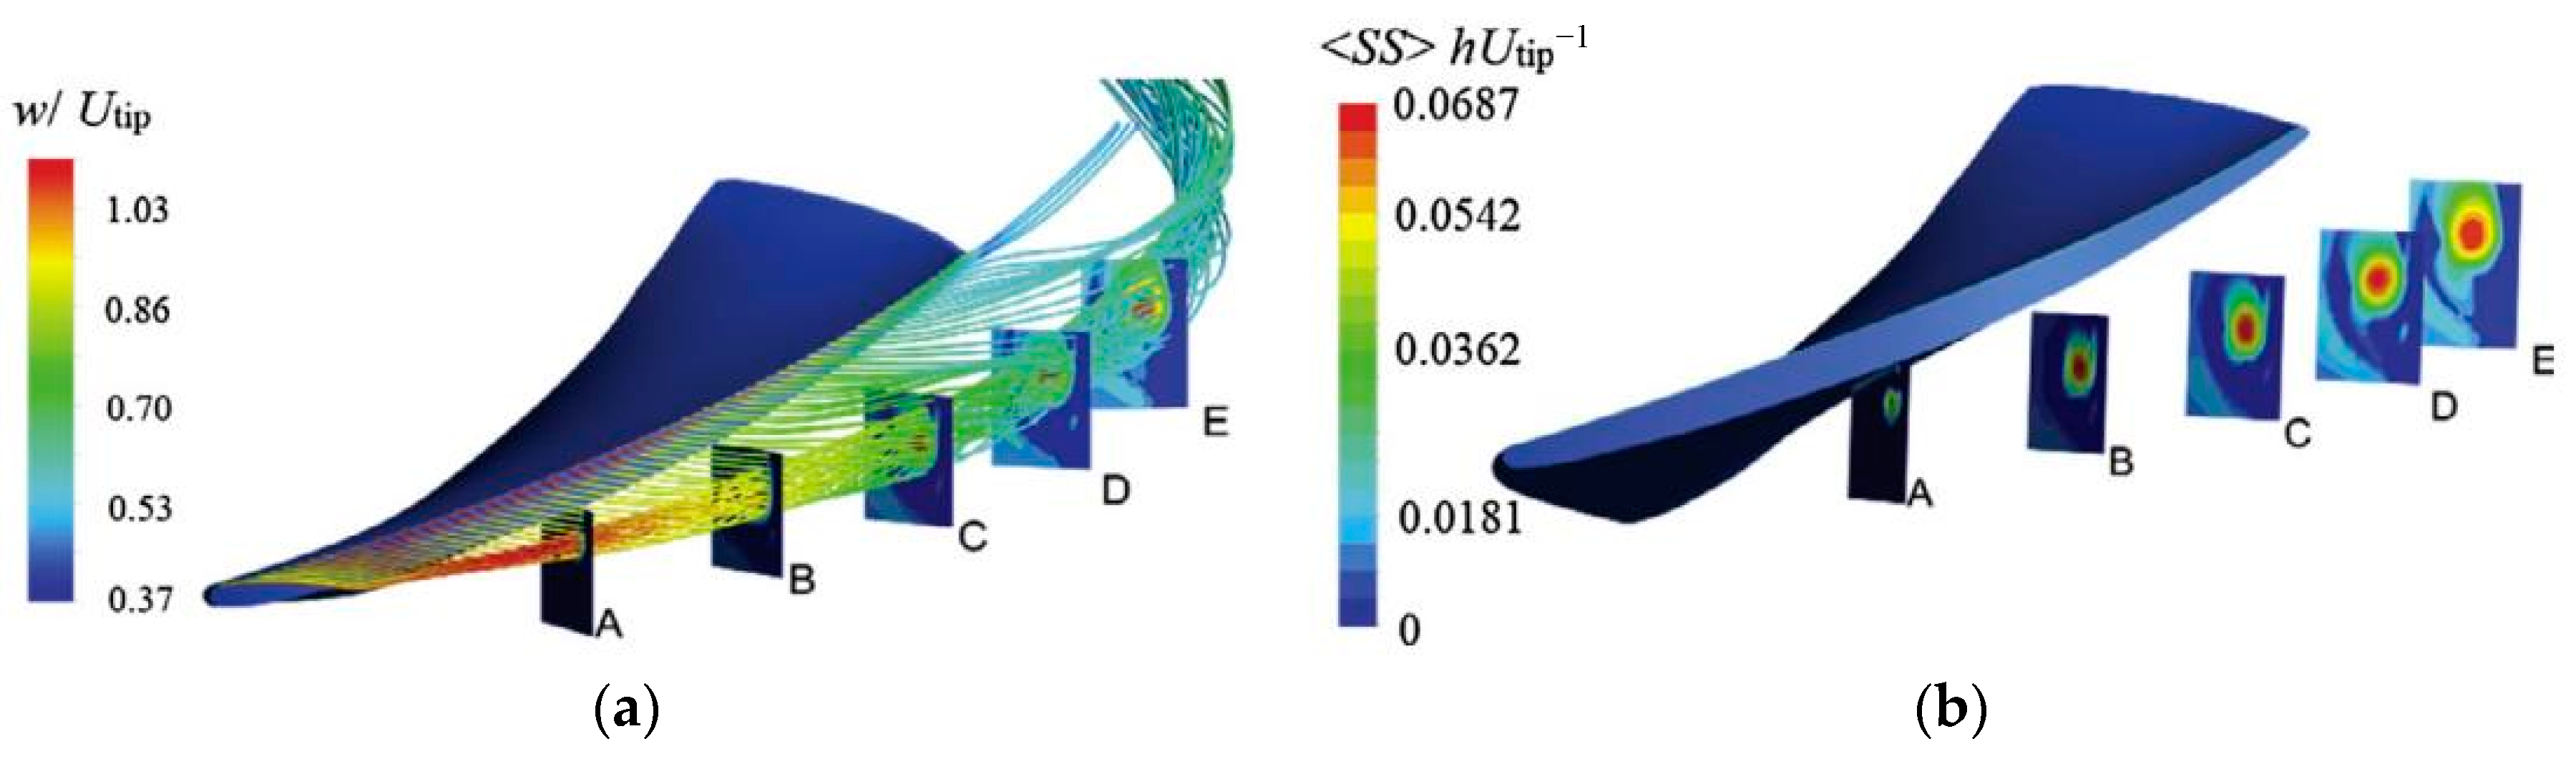
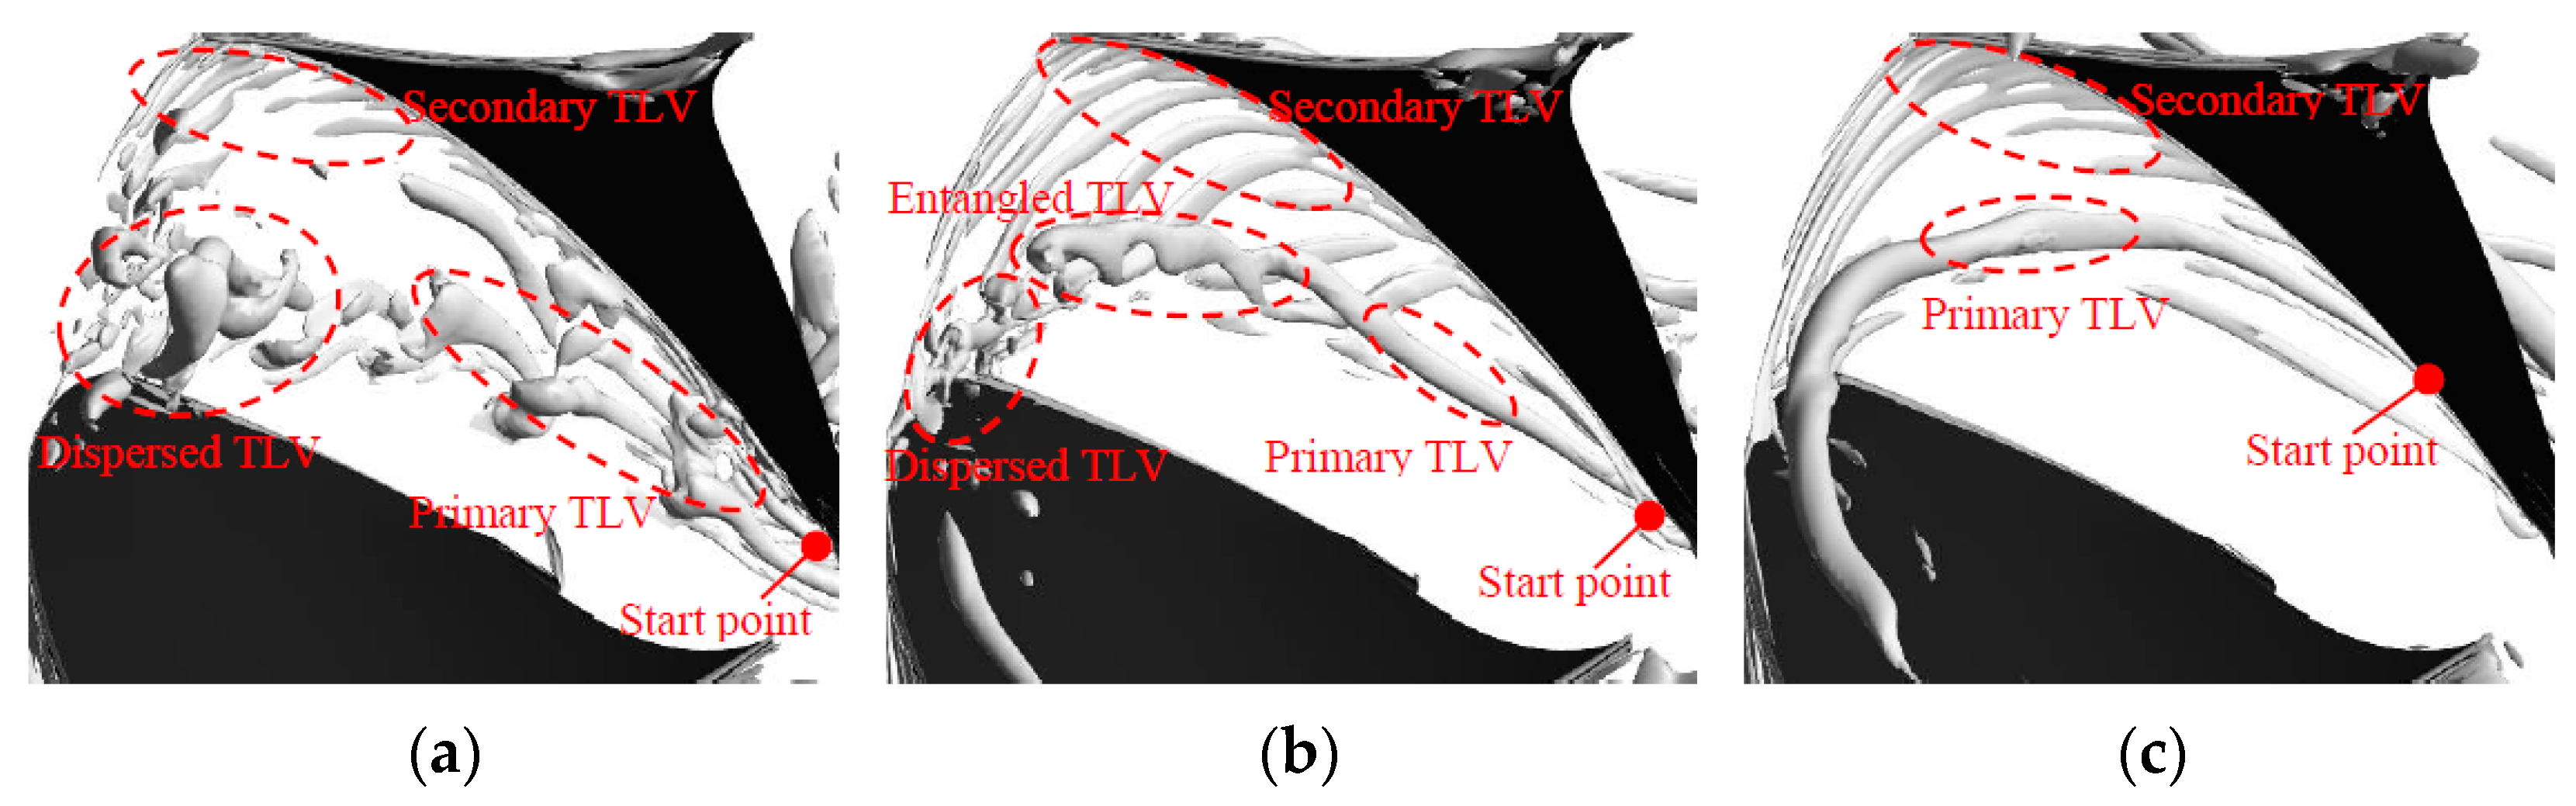
| Liu et al. [43] | LES model Mixed-flow pump | the TLV is classified into four categories, namely, primary TLV, secondary TLV, entangled TLV, and dispersed TLV; the corresponding vortex derivation mechanism is analyzed by the relative vorticity transport equation. |
| Zhang et al. [44] | SST model Axial pump | The evolution of cavitation patterns related to tip-clearance flow, including TLV cavitation cloud, perpendicular cavitation vortex, and sheet cavitation. There are interactions among these cavitation patterns. |
| Okita et al. [45] | DES model Three-dimensional inducer | A horseshoe-shaped cavitation structure is observed near the casing wall at the leading edge under the impact of tip-clearance flow. This structure makes more streamlines blocked at the leading edge and flow interaction more intensive. |
| Tip-Clearance Size (mm) | Head (m) | NPSHC (m) |
|---|---|---|
| 0.0 | 17.34 | 13.58 |
| 0.2 | 16.73 | 13.67 |
| 0.65 | 16.00 | 13.95 |
| 1.0 | 15.46 | 14.23 |
| Optimization Scheme | Machinery Type | Conclusion |
|---|---|---|
| Round tip and sharp tip | Hydrofoil [78] | Sharp tip decreases TLV and round tip decreases TSV |
| Blade-tip rounding | Axial-flow pump [79] | twice tip rounding is optimal to the pump performance |
| Blade-tip thickening | Ducted propeller [80] | Both the strength of TLV and pressure drop in the TLV core on the middle chord section are reduced |
| T-shape tip | mixed-flow pump [81] | This tip shape can improve pump efficiency by 1.86% and reduce leakage flow rate by 15.95% |
| C groove | Hydrofoil [82] | C groove maximally suppresses tip-leakage vortex by 67.94%, and improves energy performance by 2.79%. |
| Anticavitation lip | Kaplan turbine [83] | Large lip can suppress cavitation on the blade, but may intensify cavitation in the closing-gap region |
| Gap configuration | Underwater propulsors [84] | Convergent gap shows the best cavitation performance |
| Mass injection | Hydrofoil [86] | Flow instability in the tip-vortex core region is decreased and cavitation inception is suppressed. |
| Pressurized-air injection | Kaplan turbine [87] | The fluid force driven by the guide vanes is decreased and the operation vibration is weakened |
© 2018 by the authors. Licensee MDPI, Basel, Switzerland. This article is an open access article distributed under the terms and conditions of the Creative Commons Attribution (CC BY) license (http://creativecommons.org/licenses/by/4.0/).
Share and Cite
Liu, Y.; Tan, L.; Wang, B. A Review of Tip Clearance in Propeller, Pump and Turbine. Energies 2018, 11, 2202. https://doi.org/10.3390/en11092202
Liu Y, Tan L, Wang B. A Review of Tip Clearance in Propeller, Pump and Turbine. Energies. 2018; 11(9):2202. https://doi.org/10.3390/en11092202
Chicago/Turabian StyleLiu, Yabin, Lei Tan, and Binbin Wang. 2018. "A Review of Tip Clearance in Propeller, Pump and Turbine" Energies 11, no. 9: 2202. https://doi.org/10.3390/en11092202
APA StyleLiu, Y., Tan, L., & Wang, B. (2018). A Review of Tip Clearance in Propeller, Pump and Turbine. Energies, 11(9), 2202. https://doi.org/10.3390/en11092202