Embodied Energy and Environmental Impact of Large-Power Stand-Alone Photovoltaic Irrigation Systems

 , , , and
Abstract
:1. Introduction
2. Materials and Methods
2.1. Scope and Data Source
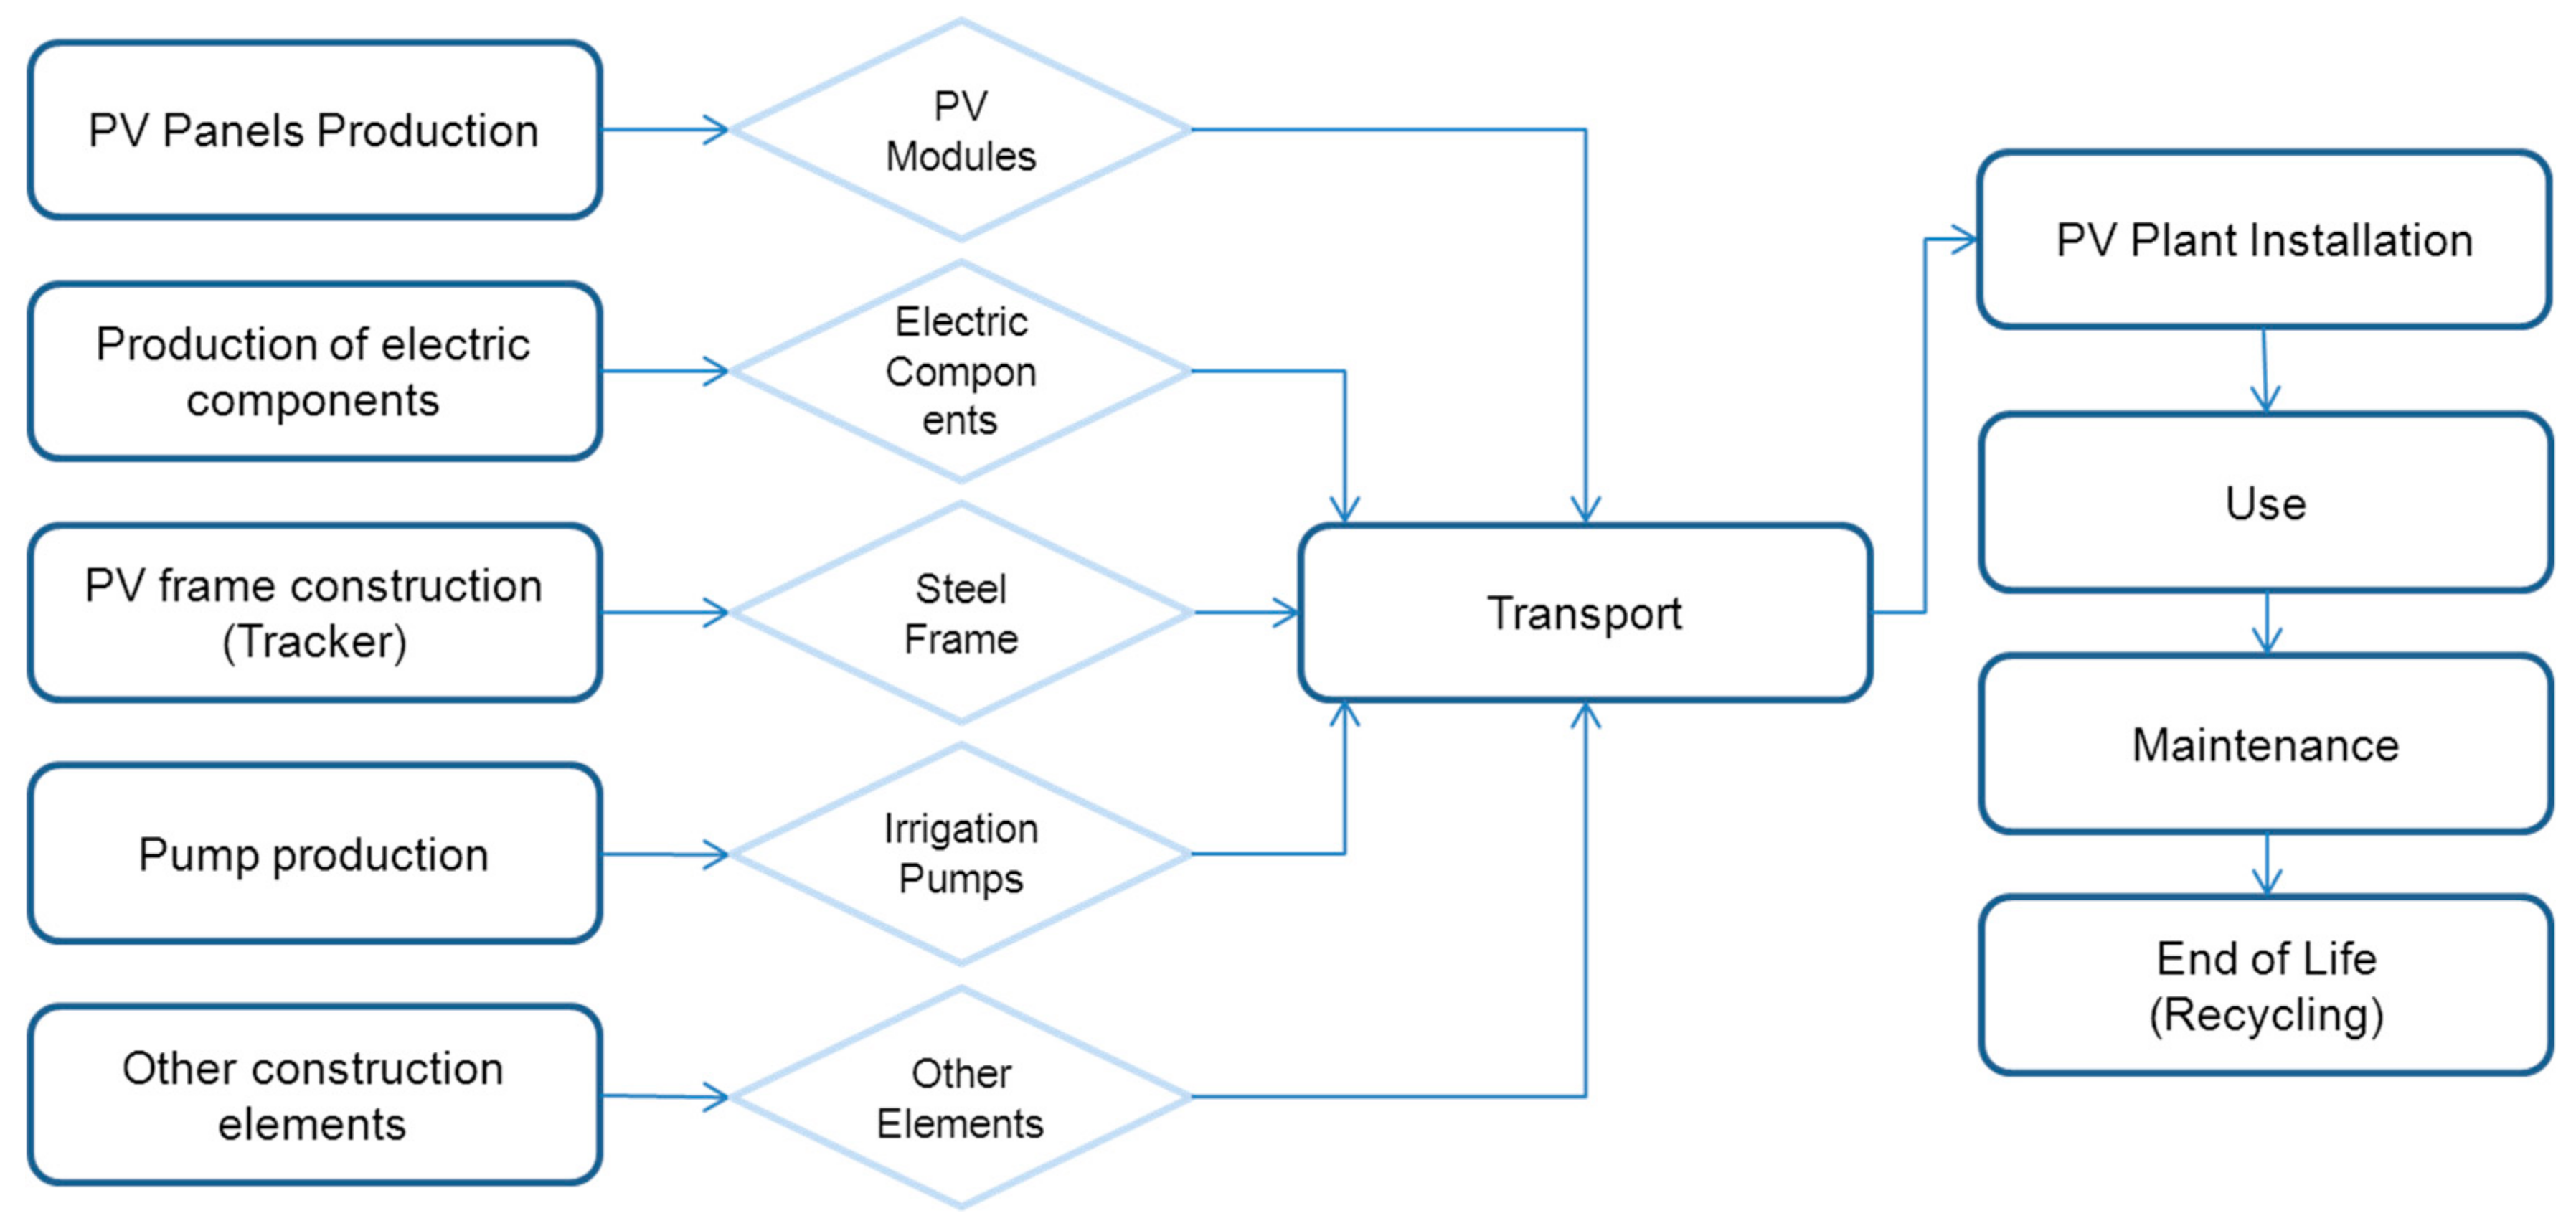
2.2. System Boundaries and Functional Unit
2.3. Life Cycle Inventory
- PV panels of 250 Wp;
- Wiring;
- Inverters;
- Other electric components;
- Pumps;
- Galvanized steel PV plant frame;
- N-S solar trackers;
- Foundation (reinforced concrete);
- Civil works (digging, excavation, etc.);
- Fence.
2.4. Impact Assessment
3. Results and Discussions
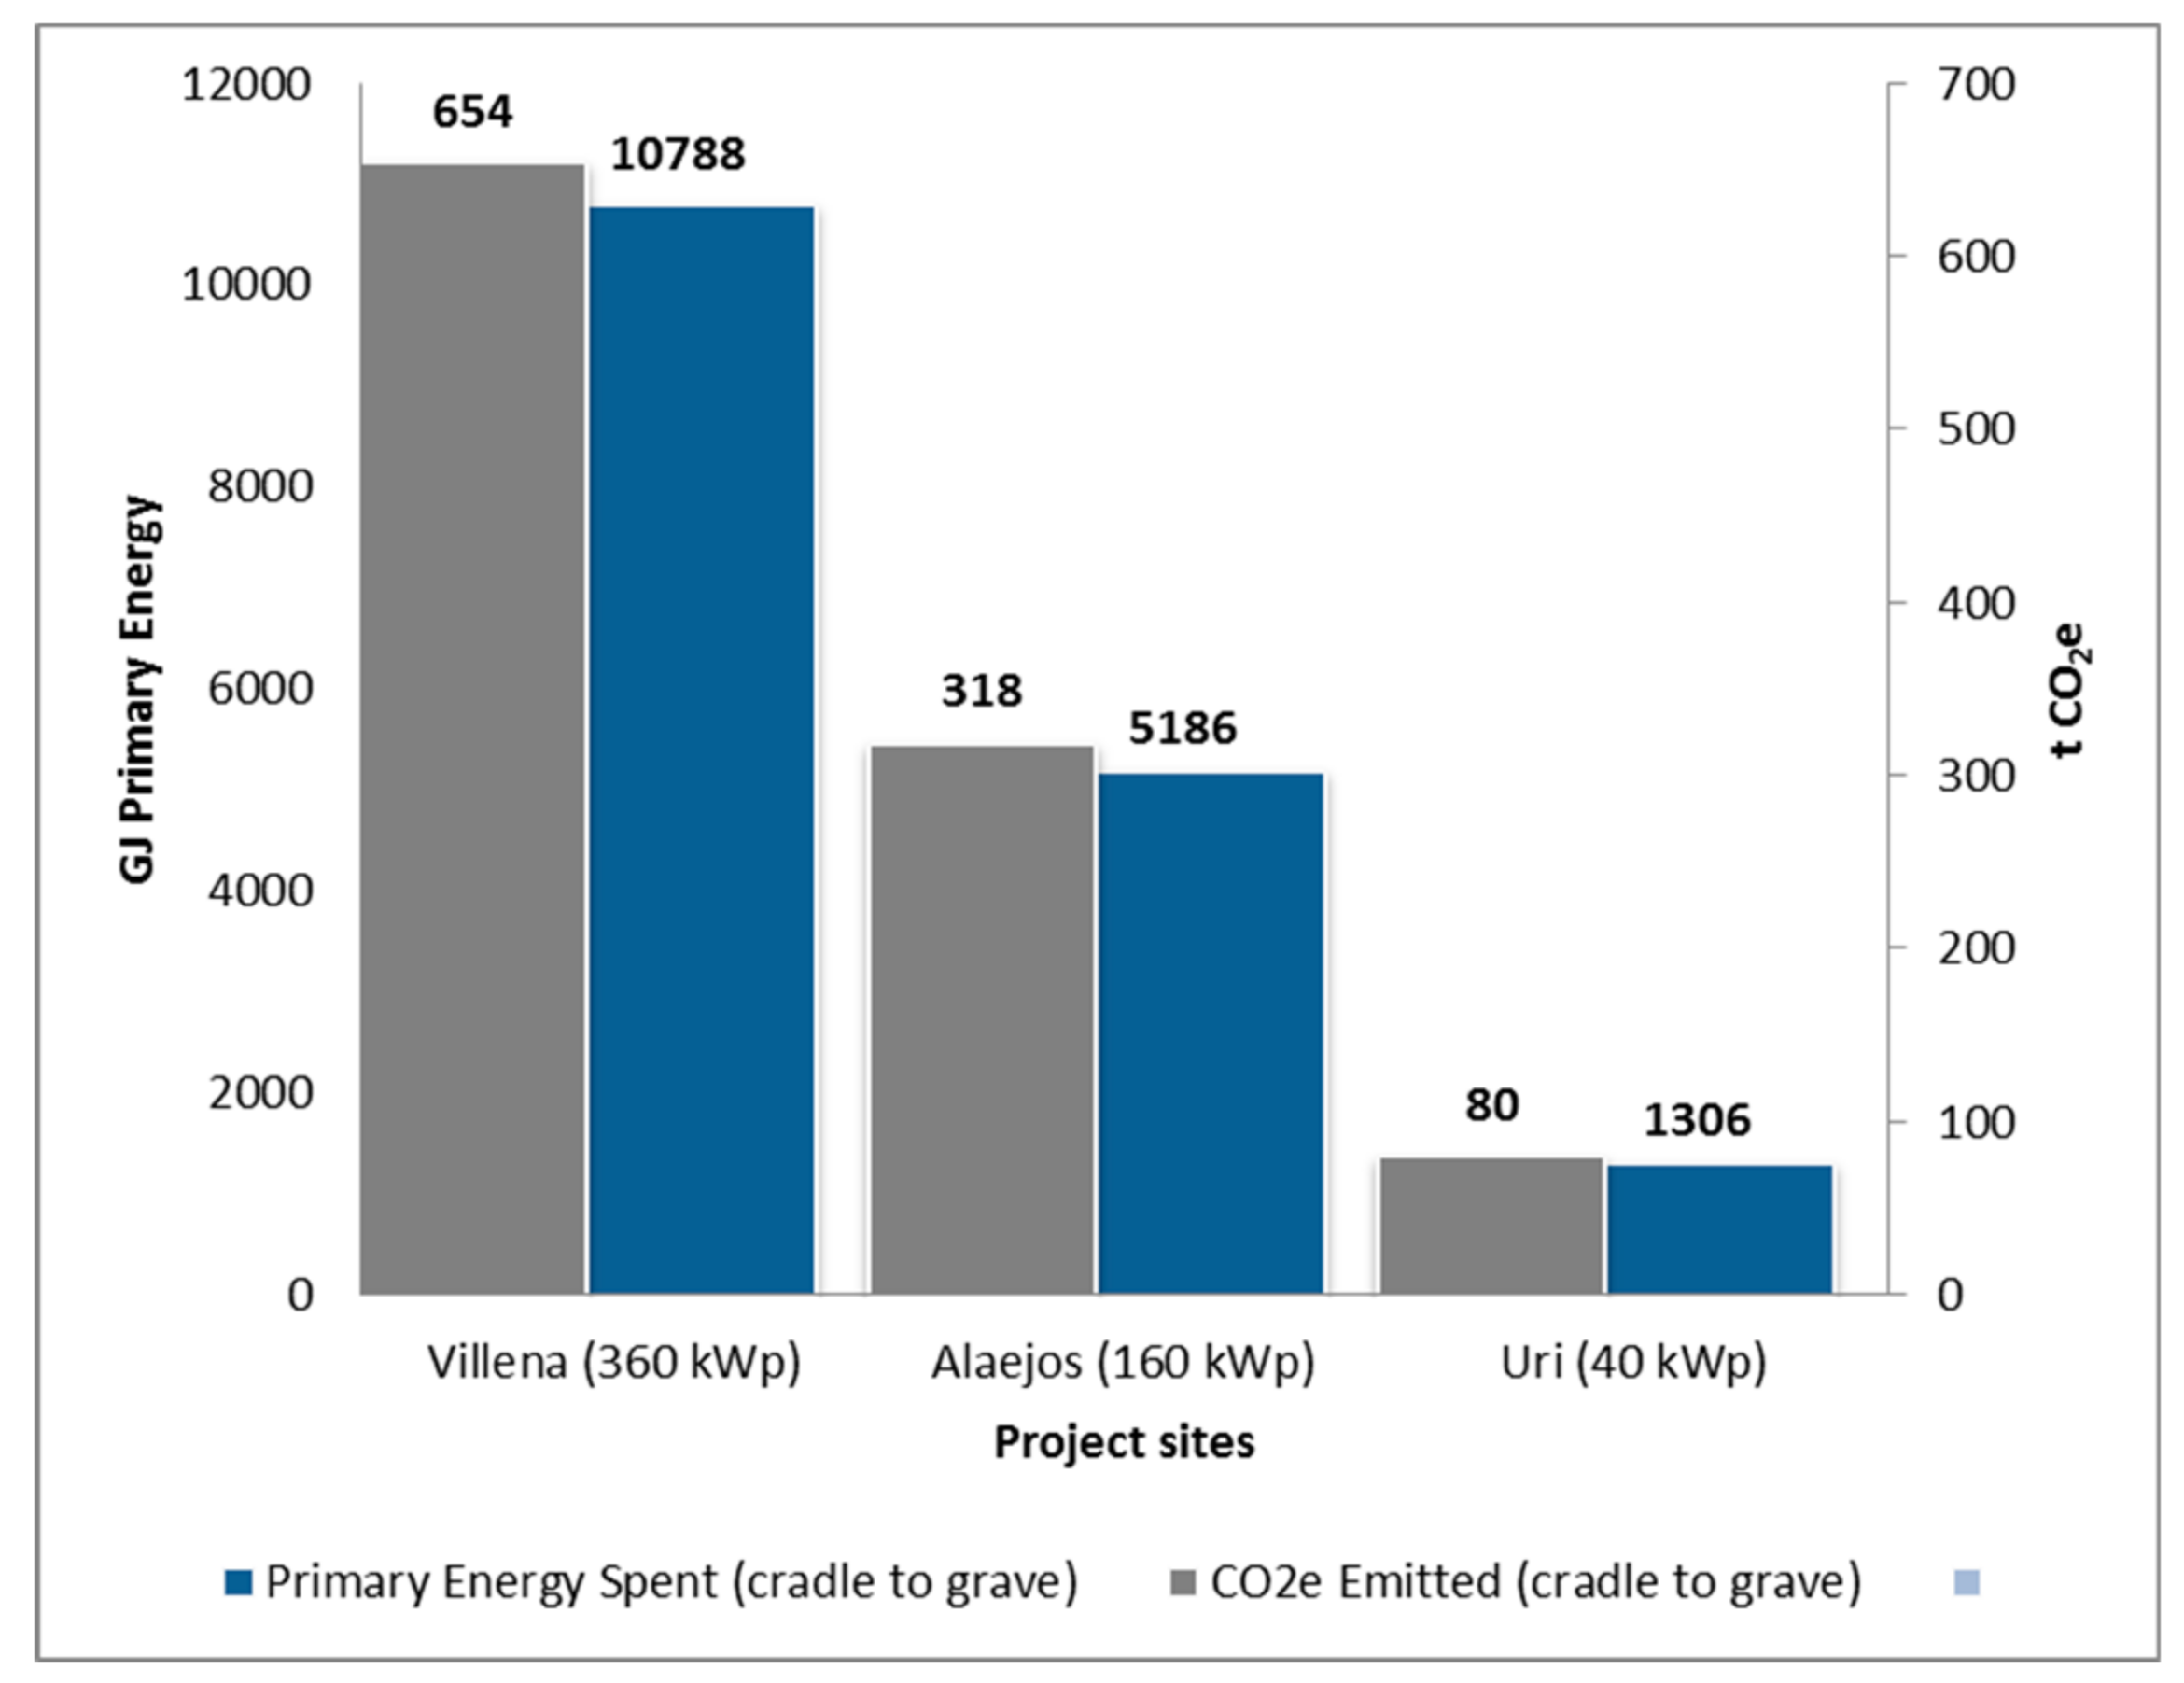
3.1. CED and GHG Emissions
3.2. EPBT, CPBT and EROI
3.3. Balance of Energy and Carbon Dioxide Emissions
4. Conclusions
Author Contributions
Funding
Conflicts of Interest
References
- Renewable Energy in Europe 2017: Recent Growth and Knock-on Effects-European Environmental Agency. Available online: https://www.eea.europa.eu/publications/renewable-energy-in-europe-2017 (accessed on 18 April 2018).
- Delfanti, L.; Colantoni, A.; Recanatesi, F.; Bencardino, M.; Sateriano, A.; Zambon, I.; Salvati, L. Solar plants, environmental degradation and local socioeconomic contexts: A case study in a Mediterranean country. Environ. Impact Assess. 2016, 61, 88–93. [Google Scholar] [CrossRef]
- Desideri, U.; Proietti, S.; Zepparelli, F.; Sdringola, P.; Bini, S. Life Cycle Assessment of a ground-mounted 1778 kWp photovoltaic plant and comparison with traditional energy production systems. Appl. Energy 2012, 97, 930–943. [Google Scholar] [CrossRef]
- Xu, L.; Zhang, S.; Yang, M.; Li, W.; Xu, J. Environmental effects of China’s solar photovoltaic industry during 2011–2016: A life cycle assessment approach. J. Clean. Prod. 2018, 170, 310–329. [Google Scholar] [CrossRef]
- Ghafoor, A.; Munir, A. Design and economics analysis of an off-grid PV system for house hold electrification. Renew. Sustain. Energy Rev. 2015, 42, 496–502. [Google Scholar] [CrossRef]
- Booth, S. Here comes the sun: How securities regulations cast a shadow on the growth of community solar in the United States. UCLA Law Rev. 2014, 61, 760–811. [Google Scholar]
- Barelli, L.; Bidini, G.; Bonucci, F.; Castellini, L.; Castellini, S.; Ottaviano, A.; Pelosi, D.; Zuccari, A. Dynamic Analysis of a Hybrid Energy Storage System (H-ESS) Coupled to a Photovoltaic (PV) Plant. Energies 2018, 11, 396. [Google Scholar] [CrossRef]
- Cucchiella, F.; D’Adamo, I.; Gastaldi, M. Economic Analysis of a Photovoltaic System: A Resource for Residential Households. Energies 2017, 10, 814. [Google Scholar] [CrossRef]
- 2016 Snapshot of Global Photovoltaic Markets. Available online: http://www.iea-pvps.org/fileadmin/dam/public/report/statistics/IEA-PVPS_-_A_Snapshot_of_Global_PV_-_1992-2016__1_.pdf (accessed on 2 August 2018).
- Wong, J.H.; Royapoor, M.; Chan, C.W. Review of life cycle analyses and embodied energy requirements of single-crystalline and multi-crystalline silicon photovoltaic systems. Renew. Sustain. Energy Rev. 2016, 58, 608–618. [Google Scholar] [CrossRef]
- Li, T.; Roskilly, A.P.; Wang, Y. Life cycle sustainability assessment of grid-connected photovoltaic power generation: A case study of Northeast England. Appl. Energy 2017. [Google Scholar] [CrossRef]
- Beccali, M.; Cellura, M.; Longo, S.; Guarino, F. Solar heating and cooling systems versus conventional systems assisted by photovoltaic: Application of a simplified LCA tool. Sol. Energy Mater. Sol. C 2016, 156, 92–100. [Google Scholar] [CrossRef]
- Asdrubali, F.; Baldinelli, G.; D’Alessandro, F.; Scrucca, F. Life cycle assessment of electricity production from renewable energies: Review and results harmonization. Renew. Sustain. Energy Rev. 2015, 42, 1113–1122. [Google Scholar] [CrossRef]
- Bayod-Rújula, A.A.; Lorente-Lafuente, A.M.; Cirez-Oto, F. Environmental assessment of grid connected photovoltaic plants with 2-axis tracking versus fixed modules systems. Energy 2011, 36, 3148–3158. [Google Scholar] [CrossRef]
- Koppelaara, R.H.E.M. Solar-PV energy payback and net energy: Meta-assessment of study quality, reproducibility, and results harmonization. Renew. Sustain. Energy Rev. 2017, 72, 1241–1255. [Google Scholar] [CrossRef]
- Fu, Y.; Liu, X.; Yuan, Z. Life-cycle assessment of multi-crystalline photovoltaic (PV) systems in China. J. Clean. Prod. 2015, 86, 180–190. [Google Scholar] [CrossRef]
- Colombo, E.; Rocco, M.V.; Toro, C.; Sciubba, E. An exergy-based approach to the joint economic and environmental impact assessment of possible photovoltaic scenarios: A case study at a regional level in Italy. Ecol. Model. 2015, 318, 64–74. [Google Scholar] [CrossRef]
- Yu, M.; Halog, A. Solar Photovoltaic Development in Australia-A Life Cycle Sustainability Assessment Study. Sustainability 2015, 7, 1213–1247. [Google Scholar] [CrossRef]
- Yang, D.; Liu, J.; Yang, J.; Ding, N. Life-cycle assessment of China’s multi-crystalline silicon photovoltaic modules considering international trade. J. Clean. Prod. 2015, 94, 35–45. [Google Scholar] [CrossRef]
- Stylos, N.; Koroneos, C. Carbon footprint of polycrystalline photovoltaic systems. J. Clean. Prod. 2014, 64, 639–645. [Google Scholar] [CrossRef]
- Akinyele, D.O.; Rayudu, R.K. Comprehensive techno-economic and environmental impact study of a localised photovoltaic power system (PPS) for off-grid communities. Energy Convers. Manag. 2016, 124, 266–279. [Google Scholar] [CrossRef]
- Petrillo, A.; De Felice, F.; Jannelli, E.; Autorino, C.; Minutillo, M.; Lubrano, L.A. Life cycle assessment (LCA) and life cycle cost (LCC) analysis model for a stand-alone hybrid renewable energy system. Renew. Energy 2016, 95, 337–355. [Google Scholar] [CrossRef]
- Sharma, R.; Tiwari, G.N. Life cycle assessment of stand-alone photovoltaic (SAPV) system under on-field conditions of New Delhi, India. Energy Policy 2013, 63, 272–282. [Google Scholar] [CrossRef]
- Kaldellis, J.K.; Zafirakis, D.; Kondili, E. Energy pay-back period analysis of stand-alone photovoltaic systems. Renew. Energy 2010, 35, 1444–1454. [Google Scholar] [CrossRef]
- Chel, A.; Tiwari, G.N. A case study of a typical 2.32 kWP stand-alone photovoltaic (SAPV) in composite climate of New Delhi (India). Appl. Energy 2011, 88, 1415–1426. [Google Scholar] [CrossRef]
- Garcıa-Valverde, R.; Miguel, C.; Martınez-Be´jar, R.; Urbina, A. Life cycle assessment study of a 4.2 kWp stand-alone photovoltaic system. Sol. Energy 2009, 83, 1434–1445. [Google Scholar] [CrossRef]
- Muhsen, D.H.; Ghazali, A.B.; Khatib, T.; Abdulabbas, T.E. Techno-economic study and optimal sizing of a stand-alone photovoltaic water pumping system. Int. Trans. Electr. Energy Syst. 2017, 27, e2355. [Google Scholar] [CrossRef]
- Valer, L.R.; Melendez, T.A.; Fedrizzi, M.C.; Zilles, R.; de Moraes, A.M. Variable-speed drives in photovoltaic pumping systems for irrigation in Brazil. Sustain. Energy Technol. Assess. 2016, 15, 20–26. [Google Scholar] [CrossRef]
- Petroselli, A.; Biondi, P.; Colantoni, A.; Monarca, D.; Cecchini, M.; Marucci, A.; Cividino, S. Photovoltaic Pumps: Technical and Practical Aspects for Applications in Agriculture. Math. Probl. Eng. 2012, 2012, 343080. [Google Scholar] [CrossRef]
- Fernandez, J.; Narvarte, L.; Poza, F. Improvement of photovoltaic pumping systems based on standard frequency converters by means of programmable logic controllers. Sol. Energy 2010, 84, 101–109. [Google Scholar] [CrossRef]
- Zhang, W.; He, X.; Zhang, Z.; Gong, S.; Zhang, Q.; Zhang, W.; Liu, D.; Zou, C.; Chen, X. Carbon footprint assessment for irrigated and rainfed maize (Zea mays L.) production on the Loess Plateau of China. Biosyst. Eng. 2018, 167, 75–86. [Google Scholar] [CrossRef]
- Tahmasebi, M.; Feike, T.; Soltani, A.; Ramroudi, M.; Ha, N. Trade-off between productivity and environmental sustainability in irrigated vs. rainfed wheat production in Iran. J. Clean. Prod. 2018, 174, 367–379. [Google Scholar] [CrossRef]
- Grant, T.; Beer, T. Life cycle assessment of greenhouse gas emissions from irrigated maize and their significance in the value chain. Anim. Prod. Sci. 2008, 48, 375–381. [Google Scholar] [CrossRef]
- Ali, B. Comparative assessment of the feasibility for solar irrigation pumps in Sudan. Renew. Sustain. Energy Rev. 2018, 81, 413–420. [Google Scholar] [CrossRef]
- Wettstein, S.; Muir, K.; Scharfy, D.; Stucki, M. The Environmental Mitigation Potential of Photovoltaic-Powered Irrigation in the Production of South African Maize. Sustainability 2017, 9, 1172. [Google Scholar] [CrossRef]
- Cherif, H.; Champenois, G.; Belhadj, J. Environmental life cycle analysis of a water pumping and desalination process powered by intermittent renewable energy sources. Renew. Sustain. Energy Rev. 2016, 59, 1504–1513. [Google Scholar] [CrossRef]
- Yang, J.; Olsson, A.; Yan, J.; Chen, B.A. Hybrid Life-Cycle Assessment of CO2 Emissions of a PV Water Pumping System in China. Energy Procedia 2014, 61, 2871–2875. [Google Scholar] [CrossRef]
- High Power Photovoltaic Irrigation Systems. Available online: http://maslowaten.eu/?page_id=579&lang=en (accessed on 15 February 2018).
- Environmental Management—Life Cycle Assessment—Principles and Framework. International Standard Organization. Available online: https://web.stanford.edu/class/cee214/Readings/ISOLCA.pdf (accessed on 15 February 2018).
- Environmental Management—Life Cycle Assessment—Requirements and Guidelines. European Standard. Available online: https://www.iso.org/obp/ui/#iso:std:iso:14044:ed-1:v1:en (accessed on 23 July 2018).
- ISO 14064-1, 2012. Greenhouse Gases—Part 1: Specification with Guidance at the Organization Level for Quantification and Reporting of Greenhouse Gas Emissions and Removals. European Standard. Available online: https://www.iso.org/obp/ui/#iso:std:iso:14064:-1:ed-1:v1:en (accessed on 23 July 2018).
- Greenhouse Gases—Carbon Footprint of Products—Requirements and Guidelines for Quantification and Communication. European Standard. Available online: https://www.iso.org/obp/ui/#iso:std:iso:ts:14067:ed-1:v1:en (accessed on 23 July 2018).
- Kommalapati, R.; Kadiyala, A.; Shahriar, M.T.; Huque, Z. Review of the Life Cycle Greenhouse Gas Emissions from Different Photovoltaic and Concentrating Solar Power Electricity Generation Systems. Energies 2017, 10, 350. [Google Scholar] [CrossRef]
- Vellini, M.; Gambini, M.; Prattella, V. Environmental impacts of PV technology throughout the life cycle: Importance of the end-of-life management for Si-panels and CdTepanels. Energy 2017, 138, 1099–1111. [Google Scholar] [CrossRef]
- Huang, B.; Zhao, J.; Chai, J.; Xue, B.; Zhao, F.; Wang, X. Environmental influence assessment of China’s multi-crystalline silicon (multi-Si) photovoltaic modules considering recycling process. Sol. Energy 2017, 143, 132–141. [Google Scholar] [CrossRef]
- Gerbinet, S.; Belboom, S.; Léonard, A. Life Cycle Analysis (LCA) of photovoltaic panels: A review. Renew. Sustain. Energy Rev. 2014, 38, 747–753. [Google Scholar] [CrossRef]
- Latunussa, C.E.L.; Ardente, F.; Blengini, G.A.; Mancini, L. Life Cycle Assessment of an innovative recycling process for crystalline silicon photovoltaic panels. Sol. Energy Mater. Sol. C 2016, 156, 101–111. [Google Scholar] [CrossRef]
- Directive 2012/19/EU. European Parliament and of the Council. Waste Electrical and Electronic Equipment (WEEE) Text with EEA Relevance. Available online: https://eur-lex.europa.eu/legal-content/EN/TXT/?uri=CELEX:32012L0019 (accessed on 13 January 2018).
- Bogacka, M.; Pikon, K.; Landrat, M. Environmental impact of PV cell waste scenario. Waste Manag. 2017, 70, 198–203. [Google Scholar] [CrossRef] [PubMed]
- IPCC. Climate Change 2014: Synthesis Report. Contribution of Working Groups I, II and III to the Fifth Assessment Report of the Intergovernmental Panel on Climate Change; Pachauri, R.K., Meyer, L.A., Eds.; IPCC: Geneva, Switzerland, 2014; p. 151. [Google Scholar]
- Wernet, G.; Bauer, C.; Steubing, B.; Reinhard, J.; Moreno-Ruiz, E.; Weidema, B. The ecoinvent database version 3 (part I): Overview and methodology. Int. J. Life Cycle Assess. 2016, 21, 1218–1230. [Google Scholar] [CrossRef]
- Nassiri, S.M.; Singh, S. Study on energy use efficiency for paddy crop using data envelopment analysis (DEA) technique. Appl. Energy 2009, 86, 1320–1325. [Google Scholar] [CrossRef]
- Rotz, C.A.; Montes, F.; Chianese, D.S. The carbon footprint of dairy production systems through partial life cycle assessment. J. Dairy Sci. 2010, 93, 1266–1282. [Google Scholar] [CrossRef] [PubMed]
- Life Cycle Inventories of Electricity Mixes and Grid. Version 1.3. Available online: http://studylib.net/doc/18476974/life-cycle-inventories-of-electricity-mixes-and-grid---esu (accessed on 15 December 2017).
- Fattori di Emissione Atmosferica di CO2e Altri Gas a Effetto Serra del Settore Elettrico. Available online: http://www.isprambiente.gov.it/files2017/pubblicazioni/rapporto/R_257_17.pdf (accessed on 20 October 2017).
- International Energy Agency. CO2 Emissions from Fuel Combustion. Statistics...# IPCC 2006. Revised IPCC Guidelines for National Greenhouse Gas Inventories: Reference Manual. Available online: http://www.iea.org/stats/index.asp (accessed on 10 January 2018).
- Luo, W.; Khoo, Y.S.; Kumara, A.; Low, J.S.C.; Lia, Y.; Tan, Y.S.; Wang, Y.; Aberle, A.G.; Ramakrishna, S. A comparative life-cycle assessment of photovoltaic electricity generation in Singapore by multicrystalline silicon technologies. Sol. Energy Mater. Sol. C 2018, 174, 157–162. [Google Scholar] [CrossRef]
- Chen, W.; Hong, J.; Yuan, X.; Liu, J. Environmental impact assessment of monocrystalline silicon solar photovoltaic cell production: A case study in China. J. Clean. Prod. 2016, 112, 1025–1032. [Google Scholar] [CrossRef]
- Hou, G.; Sun, H.; Jiang, Z.; Pan, Z.; Wang, Y.; Zhang, X.; Zhao, Y.; Yao, Q. Life cycle assessment of grid-connected photovoltaic power generation from crystalline silicon solar modules in China. Appl. Energy 2016, 164, 882–890. [Google Scholar] [CrossRef]
- Leccisi, E.; Raugei, M.; Fthenakis, F. The Energy and Environmental Performance of Ground-Mounted Photovoltaic Systems—A Timely Update. Energies 2016, 9, 622. [Google Scholar] [CrossRef]
- Mann, S.A.; de Wild-Scholten, M.J.; Fthenakis, V.; van Sark, W.G.J.H.M.; Sinke, W.C. The energy payback time of advanced crystalline silicon PV modules in 2020: A prospective study. Prog. Photovolt. Res. Appl. 2014, 22, 1180–1194. [Google Scholar] [CrossRef]
- Bhandari, K.P.; Collier, J.M.; Ellingson, R.J.; Apul, D.S. Energy payback time (EPBT) and energy return on energy invested (EROI) of solar photovoltaic systems: A systematic review and meta-analysis. Renew. Sustain. Energy Rev. 2015, 47, 133–141. [Google Scholar] [CrossRef]
- Hall, C.A.S.; Balogh, S.; Murphy, D.J.R. What is the Minimum EROI that a Sustainable Society Society Must Have? Energies 2009, 2, 25–47. [Google Scholar] [CrossRef]
- Masakazu, I.; Lespinats, S.; Merten, J.; Malbranche, P.; Kurokawa, K. Life cycle assessment and cost analysis of very largescale PV systems and suitable locations in the world. Prog. Photovolt. Res. Appl. 2016, 24, 159–174. [Google Scholar]
- Beylot, A.; Payet, J.; Puech, C.; Adra, N.; Jacquin, P.; Blanc, I.; Beloin-Saint-Pierre, D. Environmental impacts of large-scale grid-connected ground-mounted PV installations. Renew. Energy 2014, 61, 2–6. [Google Scholar] [CrossRef] [Green Version]


| Demonstrators | Spain (Villena) | Spain (Alaejos) | Italy (Uri) |
|---|---|---|---|
| Longitude | 0°50′32” W | 5°16′36” W | 40.62° N |
| Latitude | 38°14′19” N | 41°16′21” N | 8.47° E |
| Altitude (m) | 593 | 794 | 128 |
| Crop systems | Various | Rapeseed-poppy-potato-sugar beet | Artichoke-Wheat |
| Water needs (m3/y) | 650,000 | 360,000 | 60,000 |
| Water source | Well | Well | 2 Wells |
| Well depth (m) | 290 | 140 | 68/98 |
| Well flow (l/s) | 63 | 45 | 3 + 5/10 |
| Pumps (n) | 1 | 2 | 2 |
| Pumps power (kW) | 250 | 92 + 30 | 3+18.5 |
| Photovoltaic power (kWp) | 360 | 160 | 40 |
| Inverters (n × power) | 1 × 355 kW | 1 × 110 kW 1 × 37 kW | 1 × 22 kW 1 × 5.5 kW 1 × 11 kW |
| Photovoltaic Tracker Systems (n × type) | 2× H1250 multi-rows (8 axis) 2× H160 single-row (1 axe) | 1× H1250 multi-rows (6 axis) 2× H160 single-row (1 axe) | 2× H160 single-row (1 axis) |
| Area occupied (m2) | 7206 | 3203 | 801 |
| Item | ENERGY | EMISSION | References | LifeTime (y) | ||
|---|---|---|---|---|---|---|
| PV panels | 3640 | MJ/m2 | 213 | kg CO2e/m2 | [51] | 25 |
| PV recycling | 2780 | MJ/t | 370 | kg CO2e/t | [47] | 25 |
| Inverter small | 1085 | MJ/kW | 71 | kg CO2e/kW | [51] | 15 |
| Inverter large | 492 | MJ/kW | 29.6 | kg CO2e/kW | [51] | 15 |
| Other components | 992 | MJ/kg | 65 | kg CO2e/kg | [51] | 20 |
| Wiring | 183 | MJ/m | 4.473 | kg CO2e/m | [51] | 20 |
| Pumps | 64.8 | MJ/kg | 3.54 | kg CO2e/kg | [52] [53] | 20 |
| Steel | 24.2 | MJ/kg | 1.76 | kg CO2e/kg | Our Calculation | 20 |
| Reinforced concrete | 1.56 | MJ/kg | 0.18 | kg CO2e/kg | Our Calculation | 20 |
| Excavation digger | 8.41 | MJ/m3 | 0.552 | kg CO2e/m3 | [51] | 25 |
| Road Transport | 2.76 | MJ/tkm | 0.17 | kg CO2e/tkm | [51] | 20 |
| Transport sea ship | 0.179 | MJ/tkm | 0.0116 | kg CO2e/tkm | [51] | 20 |
| Electricity (Italy) | 9.67 | MJ/kWh | 0.3306 | kg CO2e/kWh | [54,55] | - |
| Electricity (Spain) | 9.76 | MJ/kWh | 0.2483 | kg CO2e/kWh | [54,56] | - |
| Title | Villena (360 kWp) | Alaejos (160 kWp) | Uri (40 kWp) |
|---|---|---|---|
| Primary Energy (MJ/kWp per year) | 1199 | 1295 | 1306 |
| Carbon dioxide (kg CO2e/kWp per year) | 72.6 | 79.4 | 79.8 |
| Energy production (kWh/kWp per year) | 1582 | 1213 | 644 |
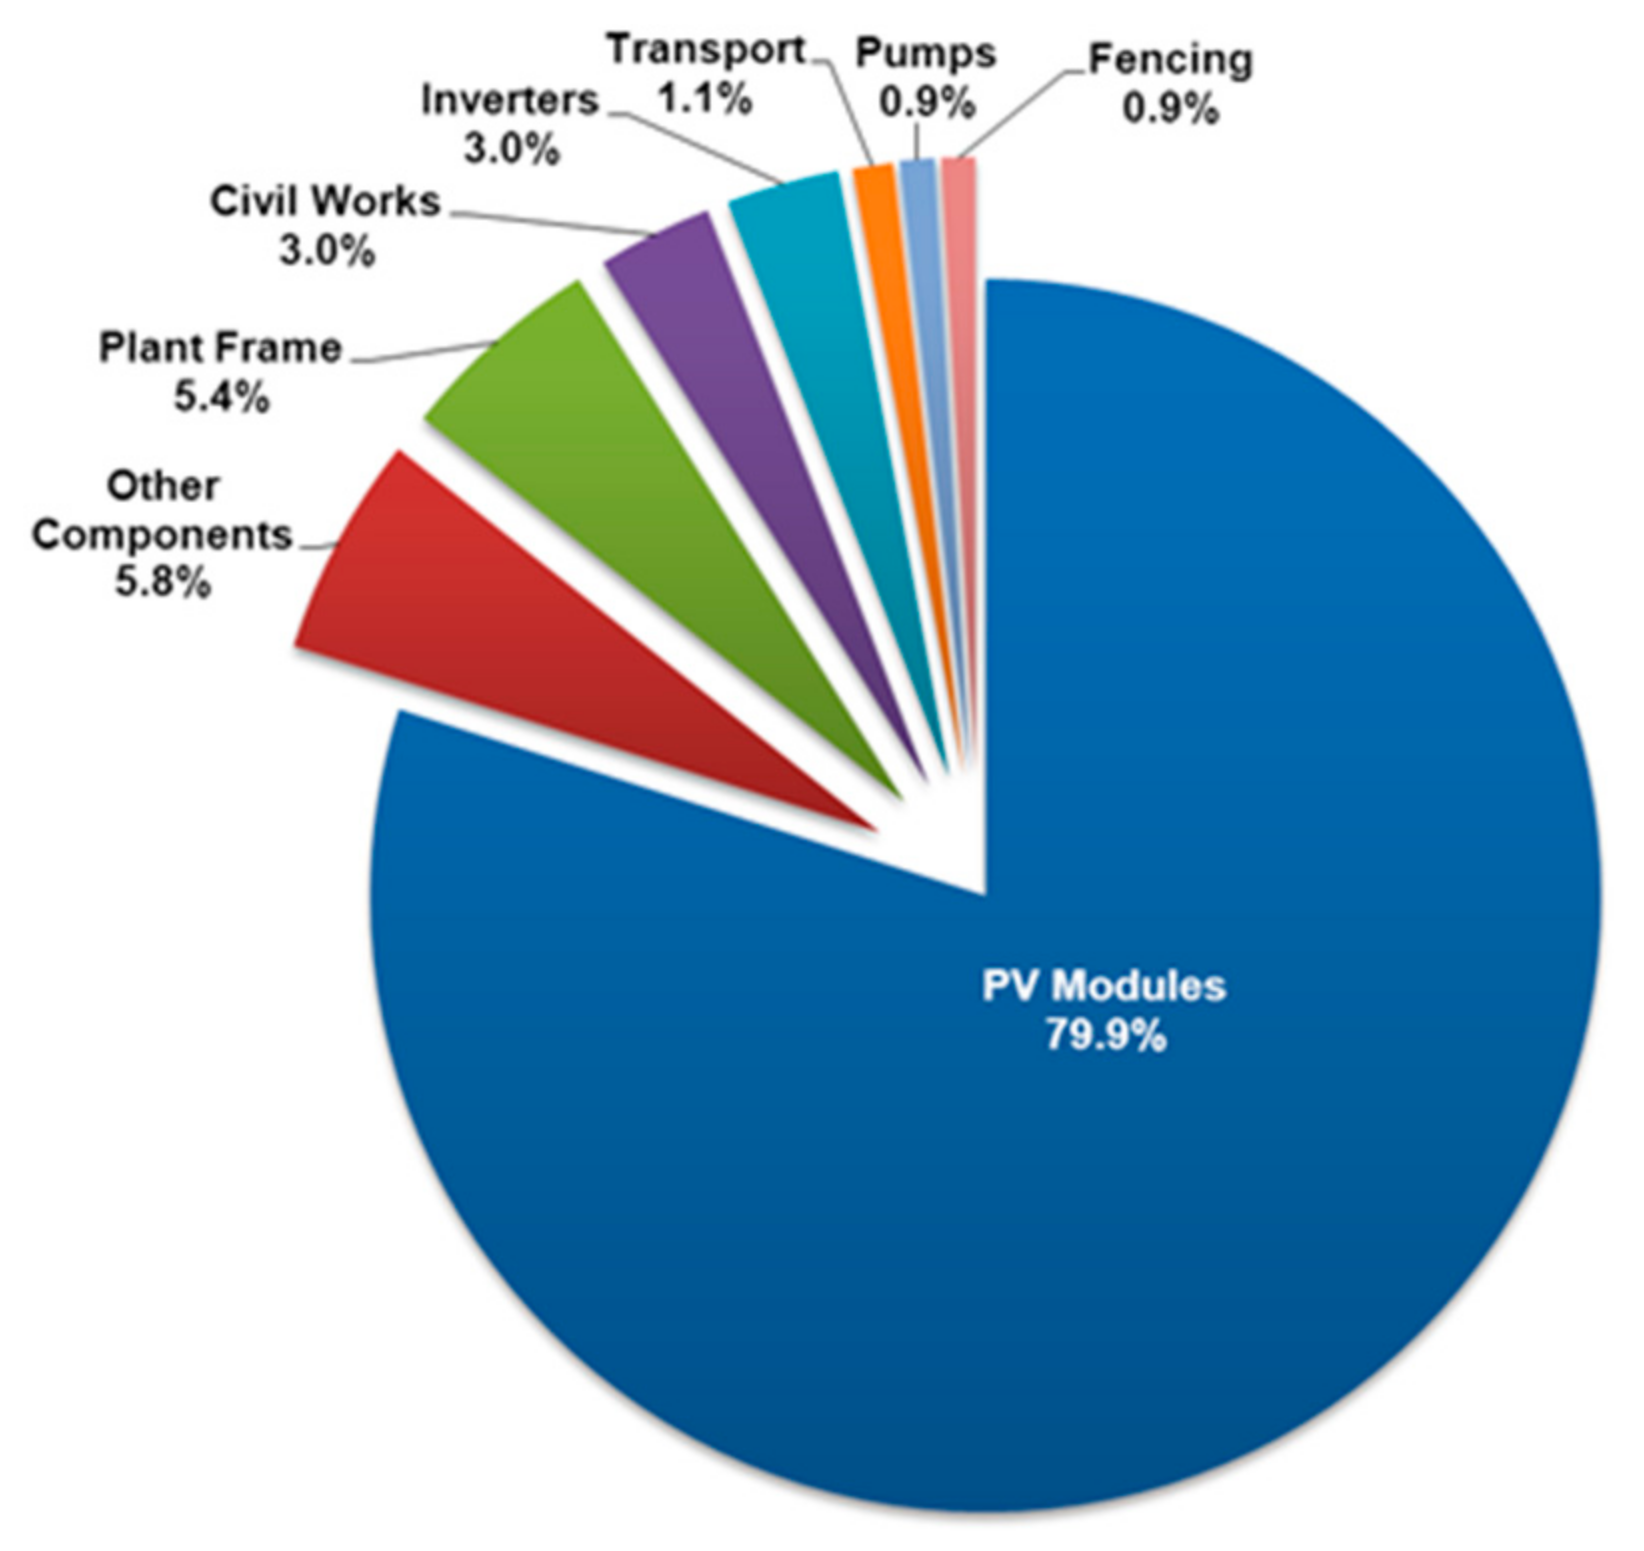
| Equipment | Villena (360 kWp) | Alaejos (160 kWp) | Uri (40 kWp) |
|---|---|---|---|
| PV Modules | 58.1 | 58.1 | 58.1 |
| Plant Frame | 4.9 | 4.9 | 4.8 |
| Civil Works | 4.1 | 4.2 | 4.1 |
| Inverters | 2.0 | 2.4 | 3.9 |
| Other Components | 1.4 | 7.3 | 3.5 |
| Transport | 0.8 | 0.6 | 1.4 |
| Pumps | 0.6 | 0.7 | 0.9 |
| Fence | 0.5 | 1.0 | 2.7 |
| Maintenance | 0.2 | 0.3 | 0.3 |
| Items | Energy and Emissions | Villena | Alaejos | Uri |
|---|---|---|---|---|
| Before PV system | Diesel (L) | 0 | 75,462 | 0 |
| Electricity (kWh) | 612,138 | 0 | 16,884 | |
| Diesel (MJ) | 0 | 3,471,252 | 0 | |
| Electricity (MJ) | 5,974,467 | 0 | 163,268 | |
| Diesel (kg CO2e) | 0 | 237,705 | 0 | |
| Electricity (kg CO2e) | 151,994 | 0 | 5,582 | |
| After PV system | Diesel (L) | 0 | 23,370 | 0 |
| Electricity (kWh) | 0 | 0 | 1,644 | |
| Diesel (MJ) | 0 | 1,075,020 | 0 | |
| Electricity (MJ) | 0 | 0 | 15,894 | |
| Diesel (kg CO2e) | 0 | 73,616 | 0 | |
| Electricity (kg CO2e) | 0 | 0 | 543 | |
| Energy-Carbon Balance | Diesel (L) | 0 | 52,092 | 0 |
| Electricity (kWh) | 612,138 | 0 | 15,240 | |
| Diesel (MJ) | 0 | 2,396,232 | 0 | |
| Electricity (MJ) | 5,974,467 | 0 | 147,374 | |
| Diesel (kg CO2e) | 0 | 164,090 | 0 | |
| Electricity (kg CO2e) | 151,994 | 0 | 5,038 | |
| Energy Saved (MJ) | 5,974,467 | 2,396,232 | 147,374 | |
| Energy saved (%) | 100 | 69 | 90 | |
| Emissions Avoided (kg CO2e) | 151,994 | 164,090 | 5,038 | |
© 2018 by the authors. Licensee MDPI, Basel, Switzerland. This article is an open access article distributed under the terms and conditions of the Creative Commons Attribution (CC BY) license (http://creativecommons.org/licenses/by/4.0/).
Share and Cite
Todde, G.; Murgia, L.; Carrelo, I.; Hogan, R.; Pazzona, A.; Ledda, L.; Narvarte, L. Embodied Energy and Environmental Impact of Large-Power Stand-Alone Photovoltaic Irrigation Systems. Energies 2018, 11, 2110. https://doi.org/10.3390/en11082110
Todde G, Murgia L, Carrelo I, Hogan R, Pazzona A, Ledda L, Narvarte L. Embodied Energy and Environmental Impact of Large-Power Stand-Alone Photovoltaic Irrigation Systems. Energies. 2018; 11(8):2110. https://doi.org/10.3390/en11082110
Chicago/Turabian StyleTodde, Giuseppe, Lelia Murgia, Isaac Carrelo, Rita Hogan, Antonio Pazzona, Luigi Ledda, and Luis Narvarte. 2018. "Embodied Energy and Environmental Impact of Large-Power Stand-Alone Photovoltaic Irrigation Systems" Energies 11, no. 8: 2110. https://doi.org/10.3390/en11082110