Article

Enhancing Biochemical Methane Potential and Enrichment of Specific Electroactive Communities from Nixtamalization Wastewater using Granular Activated Carbon as a Conductive Material

by
David Valero
1,
Carlos Rico
2,
Blondy Canto-Canché
3,
Jorge Arturo Domínguez-Maldonado
1,
Raul Tapia-Tussell
1,
Alberto Cortes-Velazquez
4 and
Liliana Alzate-Gaviria
1,*
1
Renewable Energy Unit, Yucatan Center for Scientist Research, Mérida CP 97302, Mexico
2
Department of Water and Environmental Science and Technologies, University of Cantabria, 39005 Santander, Spain
3
Biotechnology Unit, Yucatan Center for Scientist Research, Mérida CP 97205, Mexico
4
GeMBio Laboratory, Yucatan Center for Scientist Research, Mérida CP 97205, Mexico
*
Author to whom correspondence should be addressed.
Energies 2018, 11(8), 2101; https://doi.org/10.3390/en11082101
Submission received: 11 July 2018 / Revised: 29 July 2018 / Accepted: 1 August 2018 / Published: 13 August 2018
(This article belongs to the Special Issue Biofuel and Bioenergy Technology)

Abstract

:
Nejayote (corn step liquor) production in Mexico is approximately 1.4 × 10¹⁰ m3 per year and anaerobic digestion is an effective process to transform this waste into green energy. The biochemical methane potential (BMP) test is one of the most important tests for evaluating the biodegradability and methane production capacity of any organic waste. Previous research confirms that the addition of conductive materials significantly enhances the methane production yield. This study concludes that the addition of granular activated carbon (GAC) increases methane yield by 34% in the first instance. Furthermore, results show that methane production is increased by 54% when a GAC biofilm is developed 10 days before undertaking the BMP test. In addition, the electroactive population was 30% higher when attached to the GAC than in control reactors. Moreover, results show that electroactive communities attached to the GAC increased by 38% when a GAC biofilm is developed 10 days before undertaking the BMP test, additionally only in these reactors Geobacter was identified. GAC has two main effects in anaerobic digestion; it promotes direct interspecies electron transfer (DIET) by developing an electro-active biofilm and simultaneously it reduces redox potential from −223 mV to −470 mV. These results suggest that the addition of GAC to biodigesters, improves the anaerobic digestion performance in industrial processed food waste.

1. Introduction

The Mexican corn tortilla industry produces between 2.2–3.5 m3·t−1 of wastewater from processed corn [1,2]. The wastewater (Nejayote) presents an environmental problem for Mexican society due to its malodorous nature and its composition. It is imperative to have an explicit waste management strategy to deal with the unpleasant by-products, and it is also essential to ascertain the potential uses of the wastewater in order to harness and capitalise on the large quantities that are produced through nixtamalization. Nixtamalization is the ancient Aztec process of cooking corn with lime to produce corn masa [3]. Water, corn, and lime are cooked at 80 °C during three hours and is then steeped for 15 hours [4]. Nowadays, the process was carried out on an industrial scale but based on the process carried out by the Aztecs known as nixtamalization. This complex waste has a pH in the 9–14 range, a chemical oxygen demand (COD) between 3.5 and 40 g·L−1 and a phenol concentration of 4.2 g·L−1 [3,4,5,6]. This wide range is a result of the proportions of water corn and lime that vary in different nixtamal plants [4,5,7]. Its organic matter content makes nejayote a suitable waste for anaerobic digestion process rather than any aerobic process due to the huge amount of energy that is required to degrade its high organic load [8,9,10]. A biochemical methane potential (BMP) test is the most efficient means of identifying the methane production capacity, in anaerobic digestion, for any organic waste [11,12,13]. Additionally, it can be useful to identify future inhibition and adaptation problems before scaling the process [14]. Given the lack of previous studies in relation to BMP testing of nejayote, this article is the first step in determining the biochemical methane potential via direct interspecies electro transfer (DIET) of nejayote in anaerobic digestion and it provides an opportunity to develop a perspective on its possible performance on a larger scale.
Anaerobic digestion process is based in four main steps: hydrolysis, acidogenesis, acetogenesis, and methanogenesis. In methanogenesis, step electrons are transported from acetoclastic bacteria to hydrogenotrophic archaea to reduce carbon dioxide to methane. This transport can be done by shuttle moleculas as hydrogen or formate. Traditionally, interspecies hydrogen transfer (IHT) and interspecies formate transfer (IFT) have been intrinsically linked with interspecies electron transfer (IET). However, these can present problems in relation to H2 partial pressure and formate concentration, respectively [15]. More recently, there has been a greater production of studies referring to DIET, which has become more widely accepted. DIET is another form of IET that can be produced through pili or employing conductive materials [16,17,18,19]. Exoelectrogenic bacteria and electrotrophic methanogens are the partners that participate in DIET [20,21,22]. Short chain volatile fatty acids (VFA) and alcohols are the biodegradable compounds in the syntrophic association between exoelectrogenic bacteria and electrotrophic methanogens [23,24]. For the first time in 2014, the DIET between exoelectrogenic bacteria and electrotrophic methanogens was evidenced through pili in a Geobacter-Methanosaeta co-culture [18]. Not all exoelectrogenic bacteria are able to generate pili; however, the addition of conductive materials increases the genera of bacteria that are able to supply pili the genera of bacteria that are able to participate in DIET. In cases where the bacteria are not able to generate pili, conductive materials fulfil the role of pili in terms of facilitating electron exchange [23,25,26]. Granular activated carbon has shown high performance in promoting DIET in different studies [26,27]. Moreover, its low cost [28,29] and its high conductivity (3000 µS·cm−1) [21] when compared to other conductive materials such as biochar (4 µS·cm−1) [30], magnetite (160 µS·cm−1) [31], or stainless steel (667 µS·cm−1) [32], make it a preferential material to promote DIET in order to improve methane production yields [17,33]. Additionally, metallic materials, such as stainless steel, have corrosion problems [34].
Within the past three years, through the microorganism identification of biofilms developed in conductive materials, new exoelectrogenic bacteria have been discovered, such as Thauera, Sporanaerobacter, Enterococcus, Pseudomonas, Anaerolinaceae, Bacteroides, Streptococcus, Syntrophomonas, Sulfurospirillum, Caloramator, Tepidoanaerobacter, Coprothermobacter, Clostridium senso stricto, Peptococcaceae, and Bacillaceae, also new electrotrophic methanogen genera have been found able to participate in DIET, such as Methanosarcina, Methanobacterium, Methanolinea, Methanothrix, Methanoregula, and Methanospirillum [17,27,35,36,37,38,39,40,41,42,43,44]. However, the number of bacteria that are capable of participating in DIET through conductive materials is still unknown [45].
Industrial processed food is one of the most important industries that employ anaerobic digestion to degrade water pollution due to its high COD [10]. Most previous studies have used simple substrates such as ethanol or short chain VFA, or commercial waste, such as dog food [17,23,27]. At present, there are no studies that use a substrate of industrial food waste using conductive materials to promote DIET.
This study is the first step towards developing an understanding of the behaviour and growth of electroactive communities in a real wastewater, and thus providing an indication of the improvements in methane production and VFA and COD degradation, which can be made by implementing DIET through conductive materials on a large scale.

2. Materials and Methods

2.1. Nejayote and Inoculum

Nejayote was collected from an industrial corn flour plant in Yucatan State (Mexico). Nejayote was preserved in a cold box at 4 °C from the corn flour plant to the laboratory, which is in accordance with the Standard Test Method 1060 for the collection and preservation of samples [46]. Prior to undertaking the BMP test, the nejayote was characterized according to the following parameters: pH, total suspended solids (TSS), total solids (TS) and volatile solids (VS), COD, total nitrogen (TN), phosphates (PO4−3), ammonia nitrogen (NH3N), sulfate (SO4−2), and total alkalinity (TA).
The inoculum composition employed was made according to Poggi Varaldo et al. [47], while using 30 g·L−1 of deep soil, 300 g·L−1 of cattle manure, 150 g·L−1 of pig manure, 1.5 g·L−1 of commercial Na2CO3, and 1 L of tap water. The inoculum was characterized for TA, TS, and VS.

2.2. BMP Test

The trial was carried out in triplicate in 110 mL serum bottles that were capped with rubber septum sleeve stoppers. Three experimental conditions were assayed. In controls, the reactors (N) were filled with 60 g of inoculum and nejayote at a ratio of 2 based on VS [12]. In three reactors (N0) 3 g of GAC was added [33] at the beginning of the BMP test. In the other three reactors (N10), inoculum and 3 g of GAC were added to serum bottles ten days before undertaking the BMP test. After this time, nejayote was introduced in anoxic conditions. All of the tests were carried out for 30 days at 38 °C with an automatic agitation of 100 rpm [48]. All reactors were flushed with nitrogen in an anoxic chamber to avoid the presence of oxygen. Three blanks with 60 g of inoculum were tested to measure the inoculum methane potential. The methane production measurements are expressed at 0 °C and standard pressure of 760 mmHg (NCTP) in dry conditions.
Gas production measurement and numerical calculation was according to Valero et al. [49]. Headspace pressure was measured employing a digital pressure transducer (ifm Germany type PN78 up to 2 bars) with a syringe that was connected to pierce the septum. Statistical analysis was performed with the Analysis ToolPak in Microsoft Excel (Excel 2016 (v16.0)).
Once the BMP test was finished, COD, VFA, and redox potential were measured for all of the assays.

2.3. GAC Conductivity

GAC was introduced in PVC tubes, of specific lengths and known surface areas, to calculate its conductivity. A source meter (Keithley 2400, Cleveland, OH, USA) was used to measure the resistance of GAC. Once the resistance was determined, conductivity was calculated employing the following equations:
R   =   ρ A L
K   =   1 ρ
where R is the resistance measured with Keithley 2400, A is the area of PVC tube, L is the tube length, ⍴ is the GAC resistivity, and K is the GAC conductivity. The process was undertaken in triplicate and the result was 3690 µS·cm−1 [50].

2.4. Analytical Methods

Biogas characterization was determined on a Molesieve column (30 m long, 0.53 mm internal diameter, and 0.25 µm film thickness) in a gas chromatograph (Clarus 500-Perkin Elmer, Waltham, MA, USA) with the thermal conductivity detector (TCD). Nitrogen was used as gas carrier and temperatures of 75, 30 and 200 °C were used for the injector, oven and detector, respectively. VFA were determined by gas chromatography using (Clarus 500-Perkin Elmer, Waltham, MA, USA). The column employed was Agilent J&W (30 m long, 0.53 mm internal diameter) with a flame ionization detector (FID). Before determinating VFA by chromatography, samples were filtered, acidified with phosphoric acid, and then centrifuged. Conductivity, temperature, pH, TSS, TS, and VS were analyzed, following standard methods [46]. Colorimetric methods (Hach Company DR-890, Loveland, CO, USA) were used to determine COD, TN, PO4−3, NH3-N, and SO4−2. Redox potential was determined employing a redox potential sensor (Extech RE300, Nashua, NH, USA).

2.5. Microbial Community Analysis

After the BMP test, sludge from N, N0, and N10 and GAC from N0 and N10 was kept at −80 °C [27]. DNA was extracted from the five samples N sludge (S), N0 sludge (S0), N10 sludge (S10), GAC biofilm from N0 (C0), and GAC biofilm from N10 (C10). Three DNA extraction of each sample were undertook, and then the DNA from each of samples were mixed before perform the sequencing. DNA from each sample was isolated with a DNA extraction kit ZymoBIOMICSTM DNA miniprep Kit, (Zymo Research, Irvine, CA, USA), in accordance with manufacturer´s protocol. The DNA pellet was resuspended in 50 µL of TE buffer (10mM Tris-HCl (pH 8) and 1mM EDTA (pH 8)). DNA purity and DNA concentration were checked by employing a NanoDrop ND-1000 spectrophotometer (NanoDrop Technologies, Seattle, WA, USA). The A260/280 ratios were over 1.6 and DNA concentration in the range of 50–100 ng·µL−1. The primers employed for amplifying 16S rRNA genes (bacteria and archaea) were 341F and 805R. DNA was sent to Macrogen Inc. (Seoul, Korea) who performed sequencing on an Illumina MiSeq platform. MG-RAST software was used to analyze bacteria and archaeal communities through GREENGENES and RDP II databases [51].

2.6. Scanning Electron Microscopy (SEM)

GAC was analyzed by SEM (SEM, model JSM-6360LV, JEOL, Tokyo, Japan). In order to establish the existence of microbial communities attached to GAC, three samples of N10 were mounted on a metallic stub using double-sided adhesive tape, each being coated with a 15 nm gold layer and observed at 20 kV.

3. Results

3.1. Nejayote and Inoculum
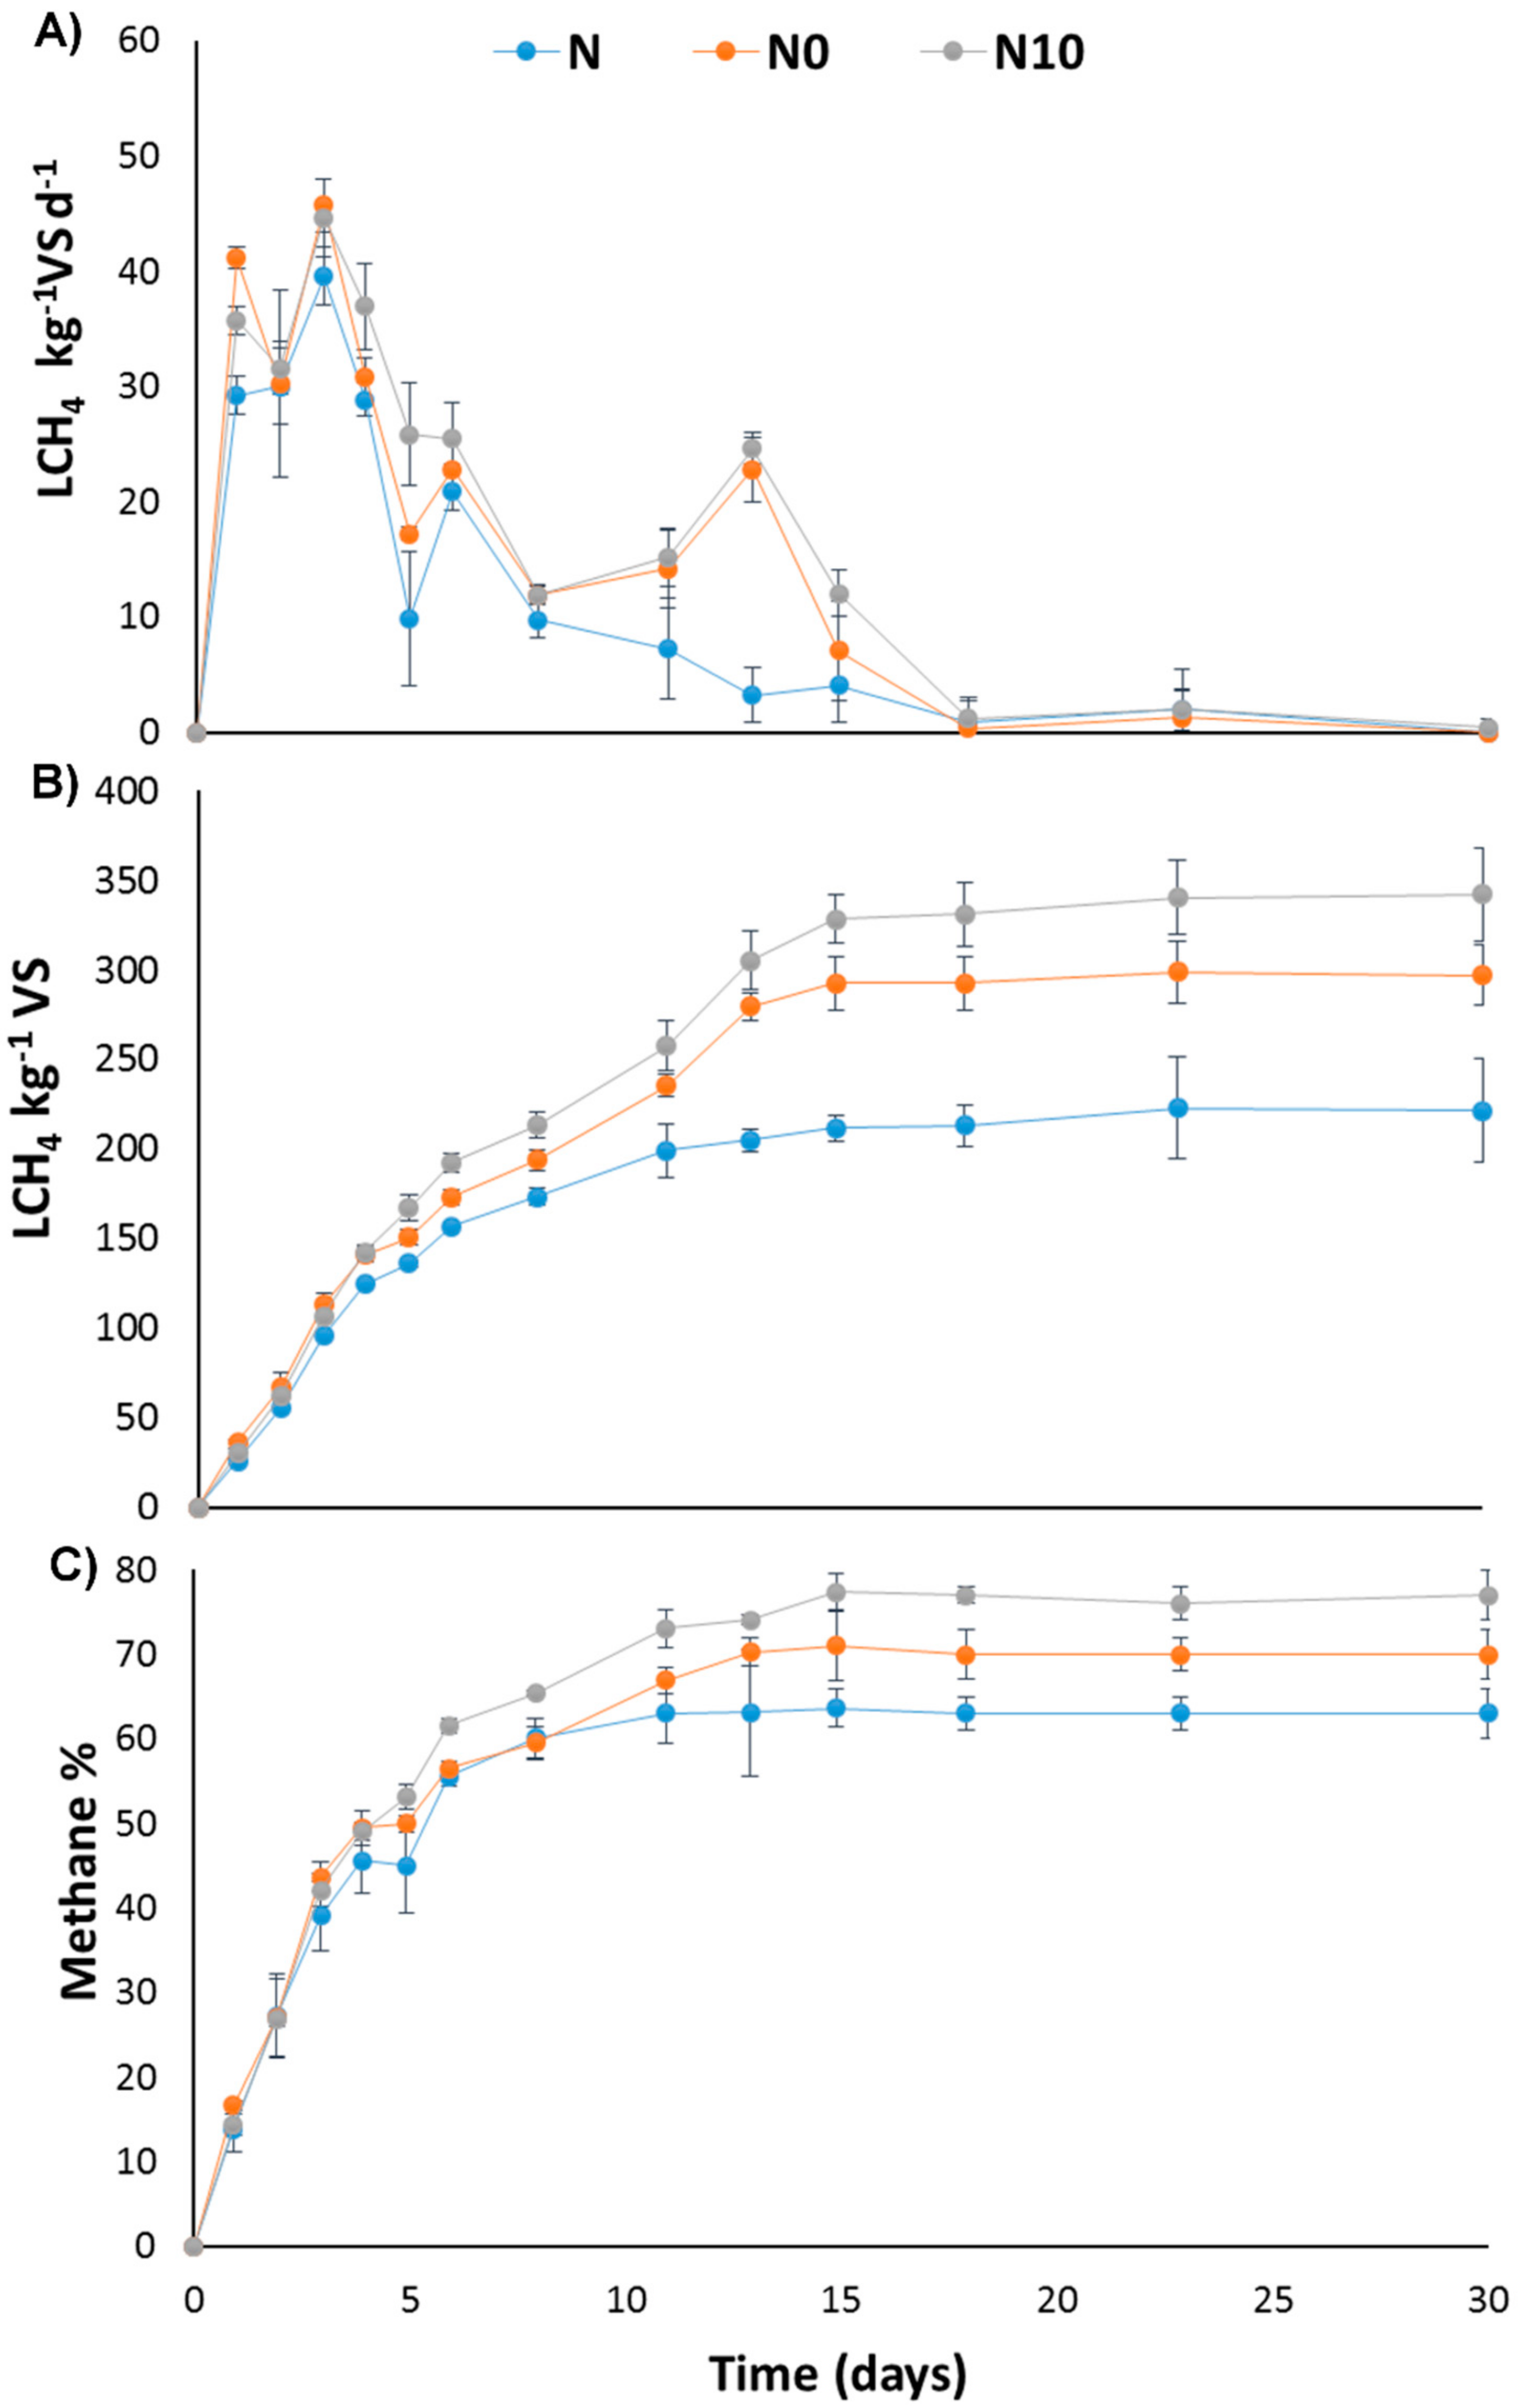
Nejayote collected from industrial corn flour plant showed basic pH values of 10.2. The inoculum, developed in the laboratory, had a basic pH but with values that were lower than nejayote, in this case, the pH reached 8.1. The VS percentage obtained for nejayote was 0.85 ± 0.01%, whereas inoculum values reached 2.69 ± 0.01%. TS results were 1.22 ± 0.01% and 4.62 ± 0.01% for nejayote and inoculum, respectively. Nejayote and inoculum VS/TS ratios that were obtained were 0.69 and 0.55, respectively. TA concentration results were similar for nejayote and inoculum, reaching values of 1799 ± 116 and 1652 ± 147 mg CaCO3 L−1, respectively. COD concentration determined for nejayote was 15,433 ± 827 mg·L−1. TSS levels for nejayote of 2676 ± 512 mg·L−1 were recorded. Other parameters that were characterized for nejayote were NH3-N 4.6 ± 0.1 mg·L−1, TN 95 ±4 mg·L−1, SO4−2 22 ± 2 mg·L−1, and PO4−3 59 ± 1.2 mg·L−1.

3.2. BMP Test

Methane production did not peak for the three assays N, N0, and N10 until the third day of BMP testing. The rate at which methane was produced spiked during the third day and it resulted in 39, 46, and 45 L CH4 kg−1VS day−1 for N, N0, and N10, respectively. As shown in Figure 1A, the first significant difference between N10 reactors and N and N0 reactors, was on the fifth day (t-student p < 0.05). N10 reactors resulted in higher methane production levels of 26 L CH4 kg−1VS day−1, whilst N and N0 reactors produced 17 and 10 L CH4 kg−1VS day−1, respectively.
DIET or IHT occurs in the last step of the anaerobic digestion process, however adding GAC promotes DIET instead of IHT in N0 and N10 reactors [45]. The only compounds that can be oxidized by exoelectrogenic bacteria are alcohols and VFA [24,52]. When these compounds are available to stimulate the production of methane through DIET, a significant difference can be seen between DIET reactors through GAC and those reactors without conductive materials (t-student analyses p < 0.05). As shown in Figure 1A, from the tenth day until the fifteenth day of experimentation, N0 and N10 consistently produced methane over 10 L CH4 kg−1VS day−1, while N methane production was under 10 L CH4 kg−1VS day−1. Moreover, on one occasion during the same period, N0 and N10 actually reached more than 22 L CH4 kg−1VS day−1, while N did not produce values above 10 L CH4 kg−1VS day−1.
As highlighted in Figure 1B, the cumulative methane production results draws focus to the significant differences between N, N0, and N10 (t-student analysis p < 0.05). The final methane generation for N, N0 and N10 reached values of 222 ± 23 L CH4 kg−1VS, 297 ± 10 L CH4 kg−1VS and 342 ± 29 L CH4 kg−1VS, respectively. N0 methane production was 34% higher than N, however the difference between N10 and N soared staggeringly to register an increase of 54%. Additionally, results show that the N10 methane volume generated was 15% higher than N0.
Methane production was predicted relative to biochemical oxygen demand (BOD) concentration. Nejayote BOD is around 5870 ± 1900 mg L−1 [3,5,53,54]. Theoretically, 1 kg of BOD produces 350 L methane [55]. Thus, the methane production from nejayote expected through anaerobic digestion process without DIET promotion was 73.96 mL CH4 (C6H12O6 (DBO) → 3 CO2 + 3 CH4) [55]. In this study, real methane production in N reactors was 69.12 ± 8.96 mL CH4. Likewise, through the DIET process an increase between 20–33% in the production of methane has been reported due to a greater recovery of electrons in the reduction of CO2 to CH4 through VFA (acetate, propionate, and butyrate) and alcohol (ethanol) degradation [18,25,38,56,57,58]. According to these increments, the methane production promoting DIET expected was in the range of 88.75–98.36 mL CH4. In this study, real methane production for N0 and N10 was 92.71 ± 5.38 and 106.69 ± 8.15 mL CH4, respectively. These values are in the expected range.
The first difference in the biogas composition came after the sixth day, when N10 methane percentage was recorded as 5% higher than N and N0, as illustrated in Figure 1C. This difference remained constant between N10 and N0 throughout the BMP test.
Between days eleven and eighteen, N0 methane composition was 5% higher than N. Thus, N10 was 10% higher than N. The maximum methane concentration was reached on the fifteenth day with values of 64%, 71%, and 77% for N, N0, and N10, respectively. After the eighteenth day, there was no further biogas production in all of the reactors, and therefore the biogas composition plateaued to show similar levels of methane concentration in all reactors.
Once the BMP test was completed, the contents of the different reactors were analyzed to determine pH, redox potential, VFA, and COD, as shown in Table 1. There were no significant differences in pH values between the three assays. A huge reduction of redox potential was produced in reactors with GAC, with the measured value for N being recorded as −222 ± 7 mV, when compared with −466 ± 1 mV and −471 ± 2 mV for N0 and N10, respectively. VFA composition was formed by acetic acid 203 mg·L−1 and butyric acid 90 mg·L−1 in N reactors, while in N0 and N10 assays the VFA composition was made up solely of acetic acid because butyric acid was only present in N reactors. COD concentration was higher in N reactors than in N0 and N10, with values of 532 ± 10 mg·L−1, 307 ± 21 mg·L−1, and 218 ± 14 mg·L−1, respectively.

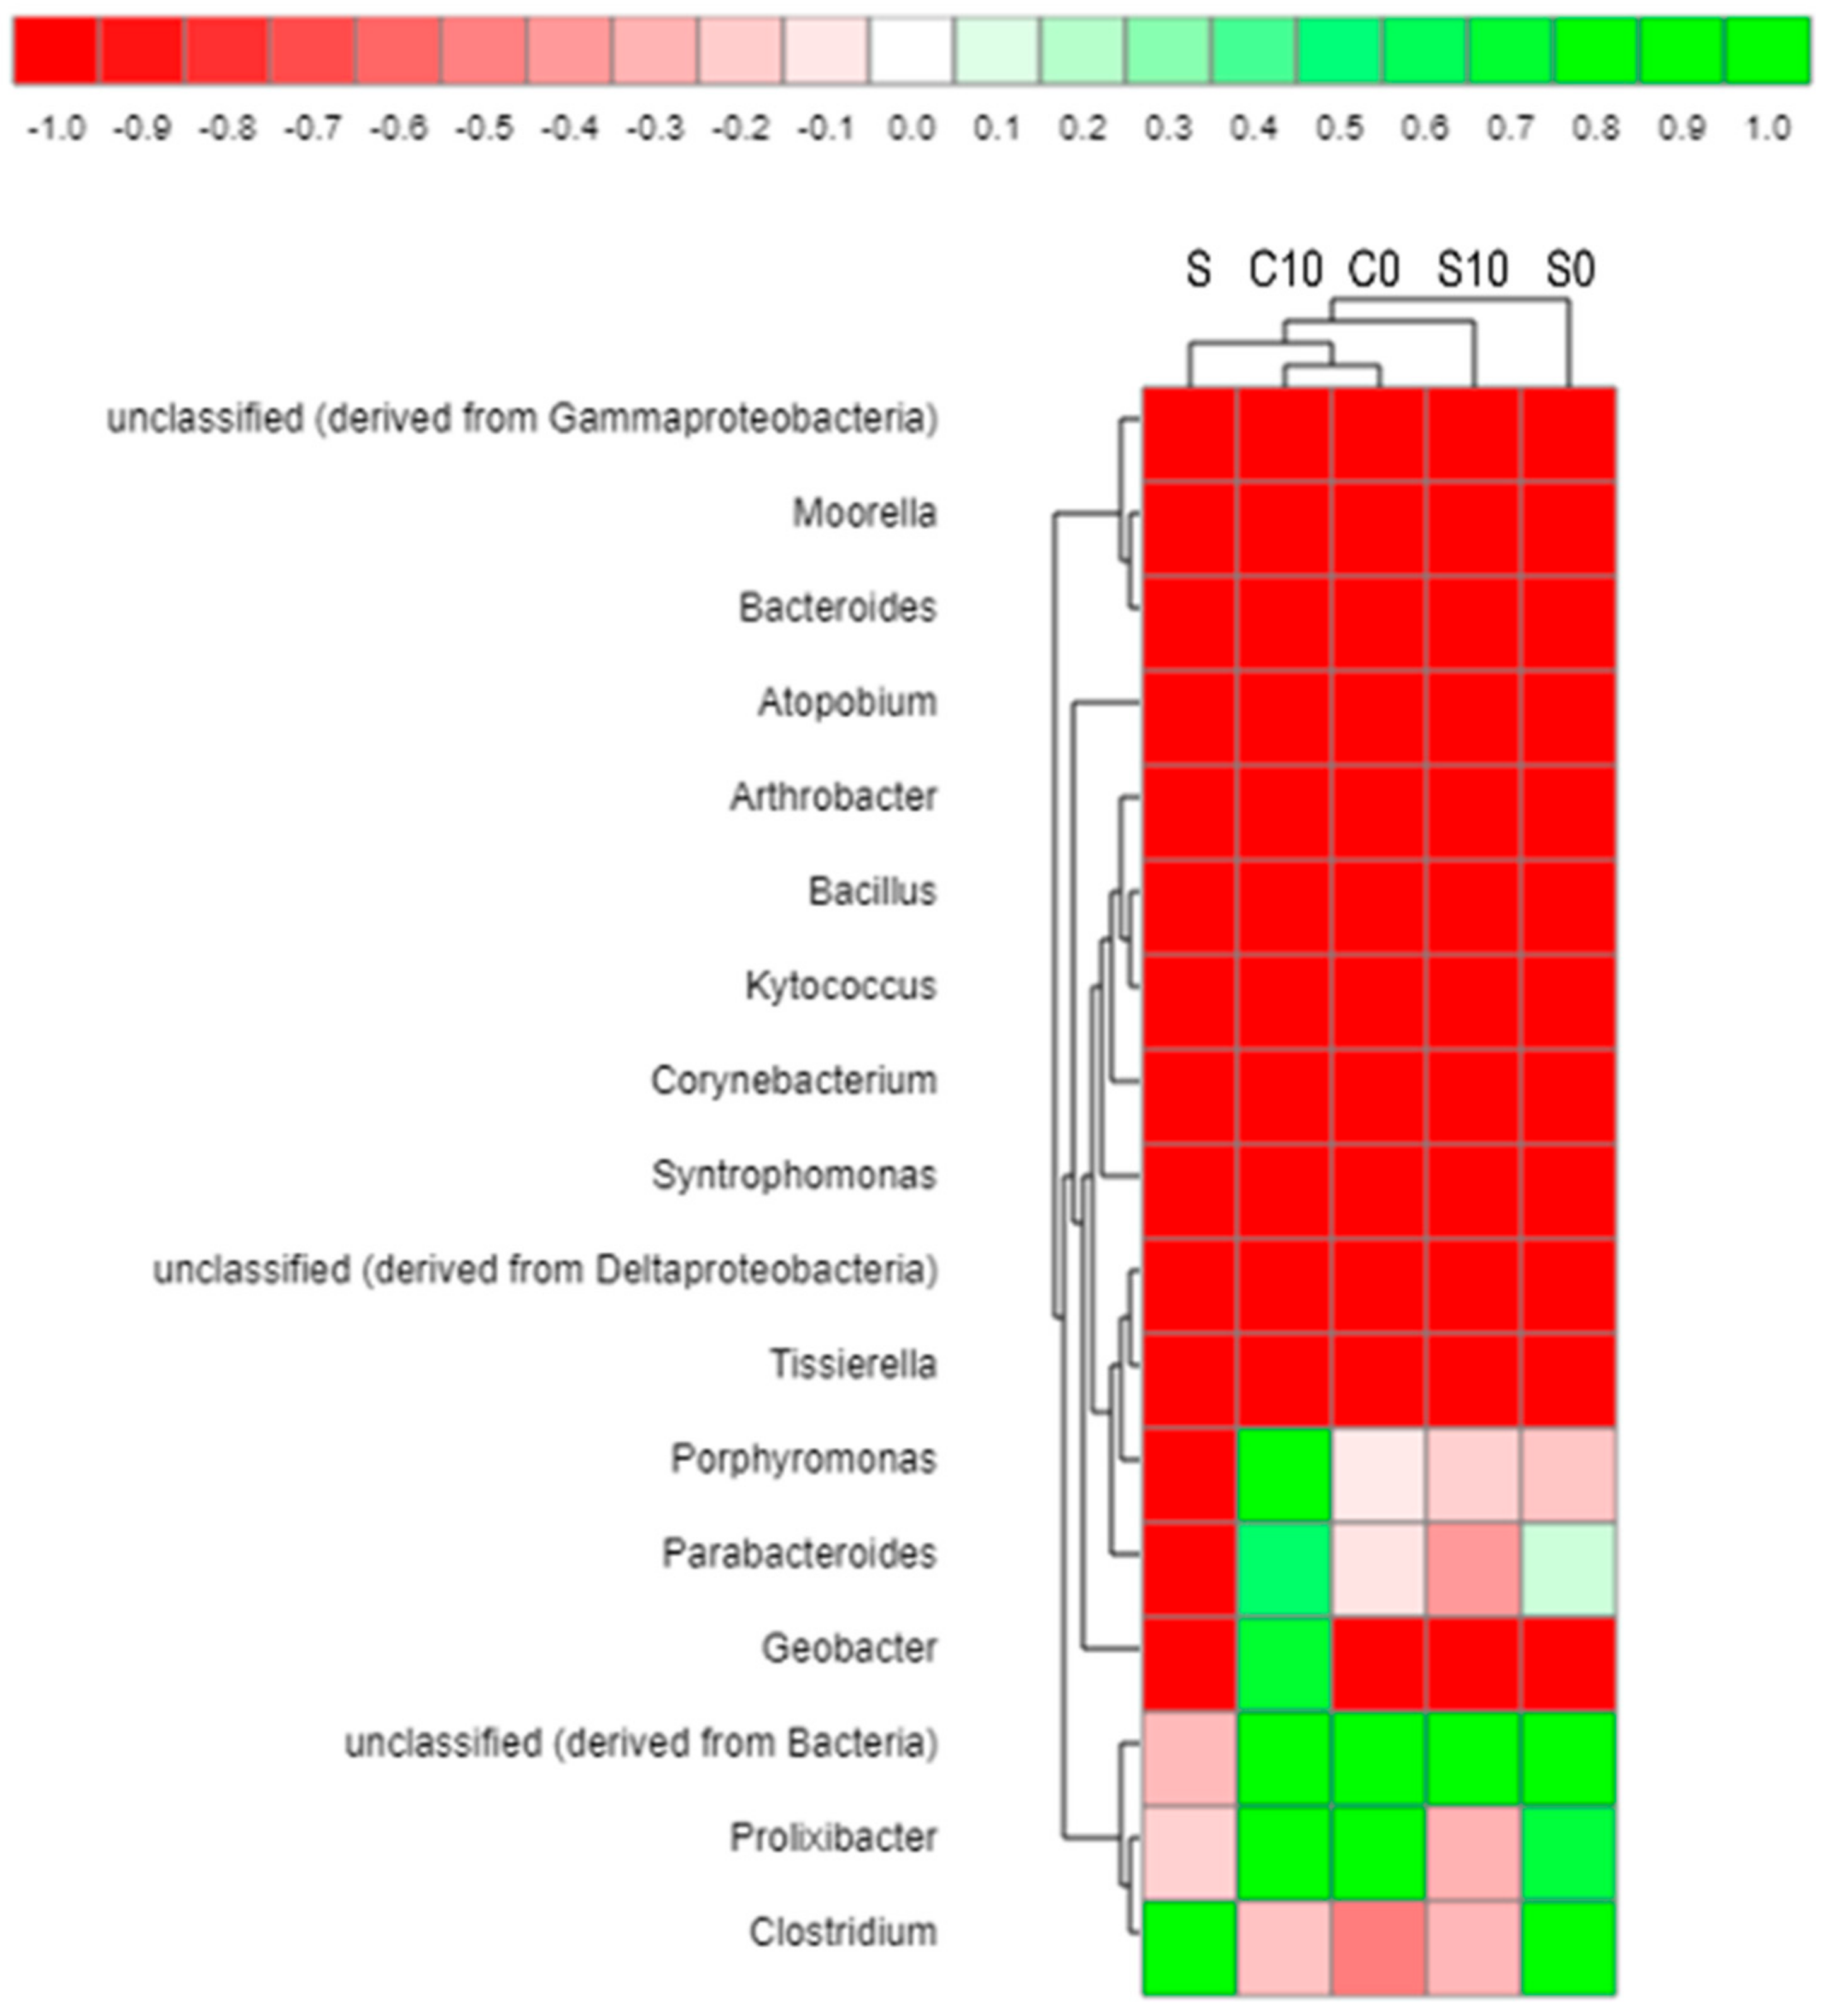
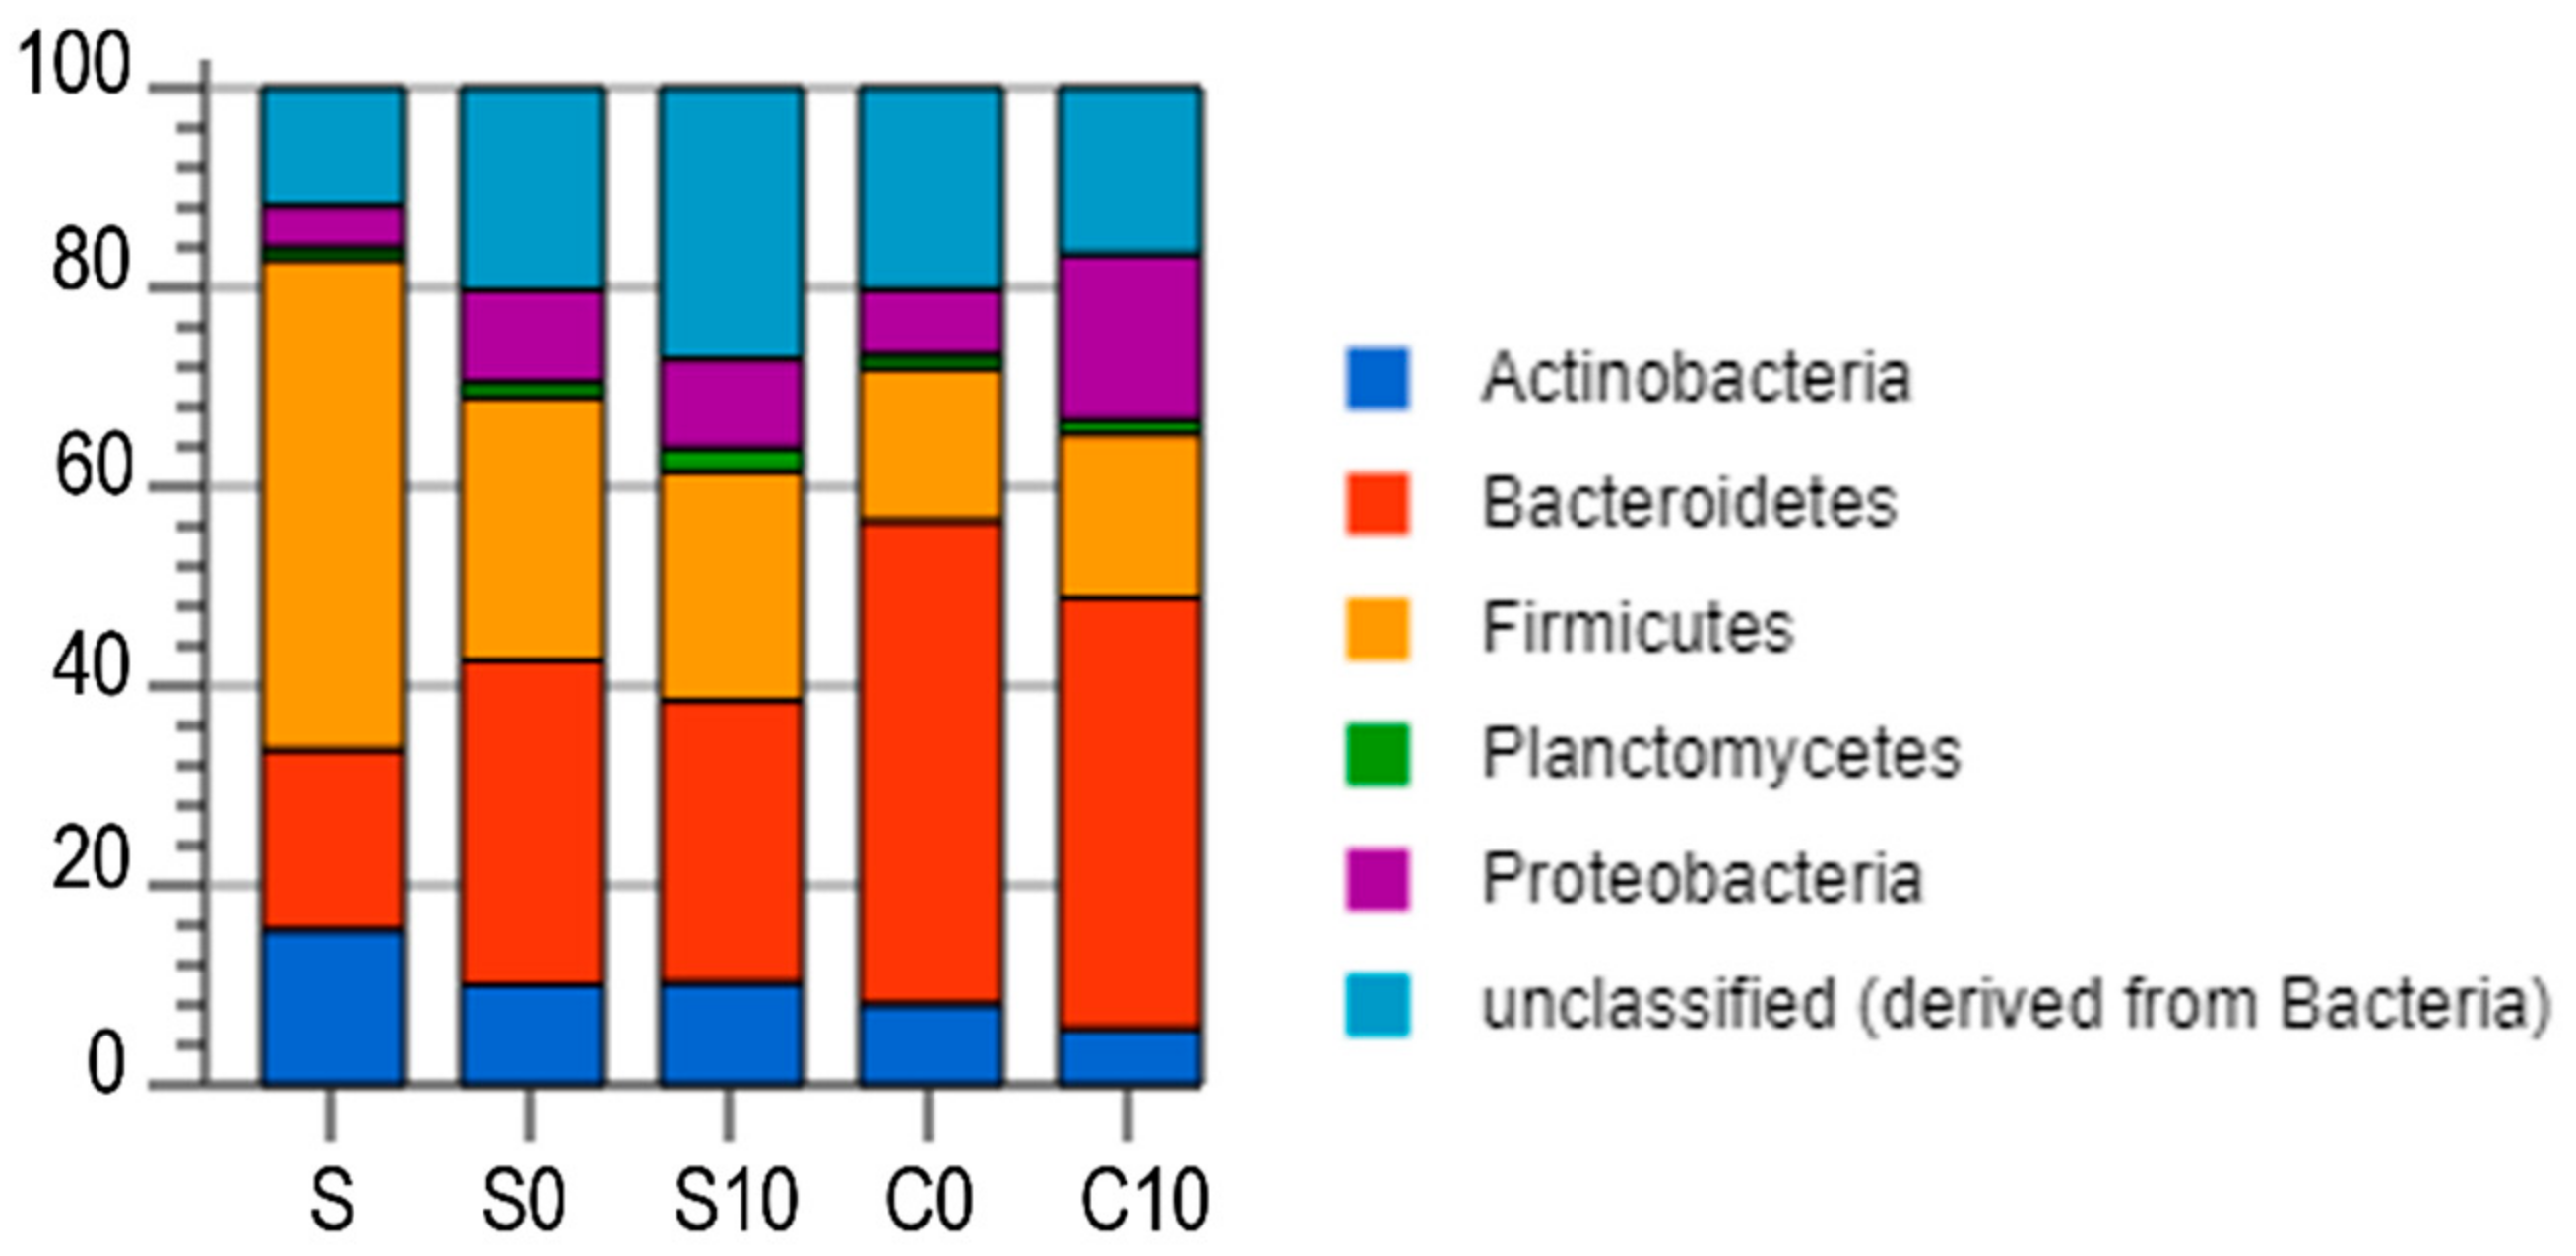
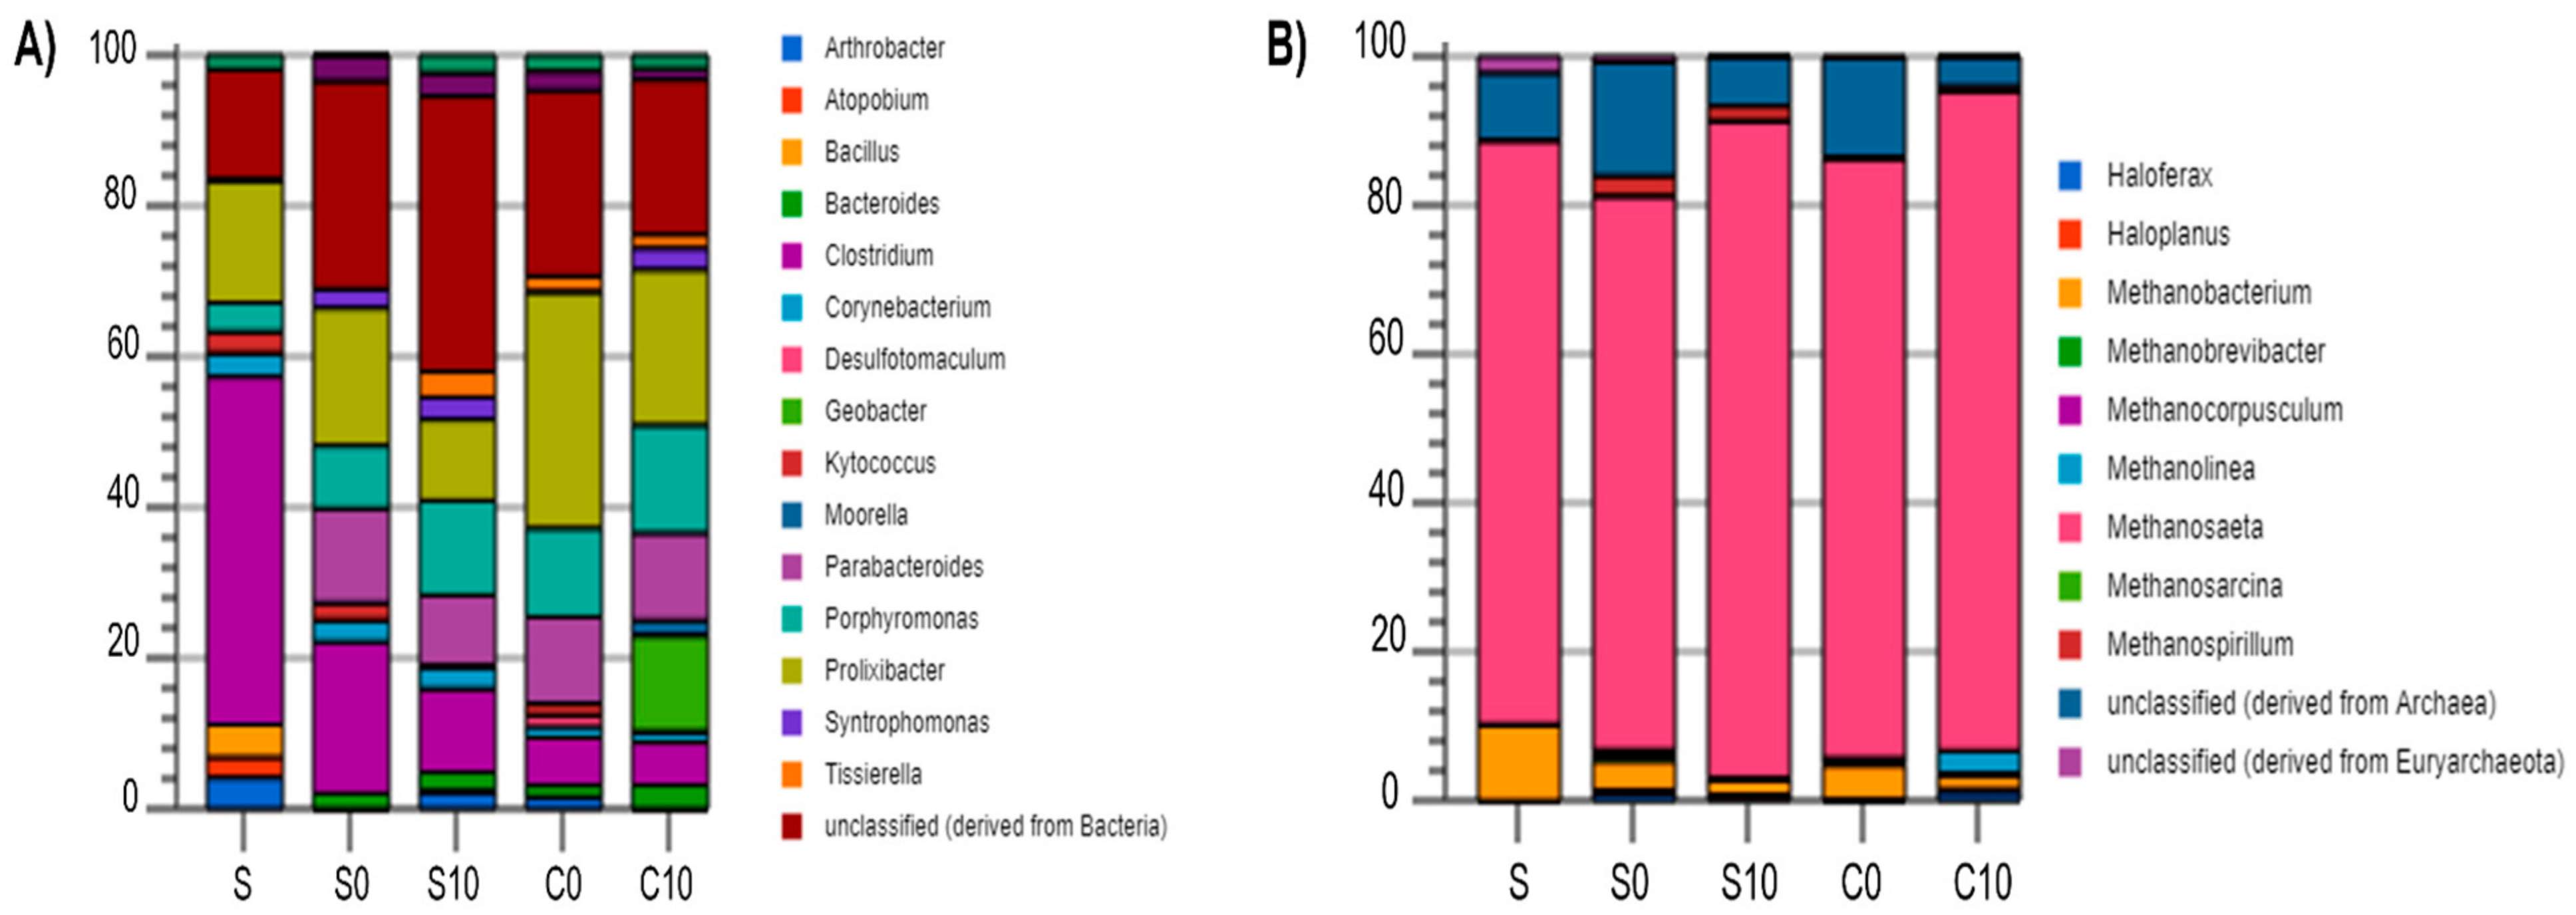
3.3. Microbial Community Analysis

As shown in Figure 2, the four main bacteria phylum in all of the samples were Actinobacteria, Bacteroidetes, Firmicutes, and Proteobacteria. Firmicutes was the dominant phylum in S, comprising almost 50% of the total bacteria. In sludges S0 and S10, there was a lower percentage of Firmicutes, forming 26% and 25% of the total bacteria, respectively. Furthermore, the percentage of Firmicutes was even lower in C0 and C10, measuring 15% and 16%, respectively. In contrast, Bacteroidetes follows the opposite trend to Firmicutes. Bacteroidetes had its highest percentage in C0 and C10, attached to the carbon, reaching 48% in C0 and 43% in C10, while in S it accounted for 18% of the microbial community. The Proteobacteria phylum presented a difference between the samples: it was detected at 17% in the C10 biofilm; whilst, for the other samples, it never reached 10%.
Figure 3A illustrates the classification of bacteria by genus proportion. Clostridium anaerobic fermentative bacteria was highly developed in S, comprising 46% of the bacterial community, whereas it was less than 21% in S0 and S10, and interestingly, it accounted for 7% of the bacterial community attached to GAC in C0 and C10. Parabacteroides were developed in GAC biofilm and the sludge of GAC reactors with a relative abundance of 8%, 13%, 12%, and 14% for S0, S10, C0, and C10, respectively; however, there was no presence detected in S. Parabacteroides that is is able to produce VFA as an end product of fermentation. This, in turn, can be oxidized by exoelectrogenic bacteria. Additionally, an enrichment of this genus in microbial fuel cells [31] and microbial electrolysis cells [32] has been observed.
Geobacter, an exoelectrogenic bacteria widely accepted as an exoelectrogen DIET partner [7,8], was only detected in the C10 sample, where the biofilm was developed 10 days before undertaking the BMP test. The amount of Geobacter in C10, whilst not dominant, remains a substantive 14% of the overall bacteria community and 82% of Proteobacteria phylum. The most dominant genus on the surface of both GAC samples C0 and C10 was Prolixibacter, with 31% and 21%, respectively. Prolixibacter had a relative abundance of 16%, 18%, and 11% in S, S0, and S10, respectively. It must be mentioned that Prolixibacter has been reported as a possible exoelectrogenic bacteria in microbial electrolysis cells [33] and in marine-sediment fuel cells [34].
A low enrichment for Syntrophomonas and Bacteroides was detected in the microbial community analysis. Both showed a relative abundance of 3% in C0 and C10, but contrastingly they were not detected in S. Both genera have only been reported as exoelectrogen DIET partners in studies with complex waste [19], as similar to nejayote.
In this study, the total amount of electroactive bacteria (Geobacter, Proxilibacter, Bacteroides, and Syntrophomonas) was 41%, 37%, 17%, 22%, and 16% for C10, C0, S10, S0, and S, respectively. This indicates an exoelectrogenic bacteria enrichment of 24% in C10 when compared with the control reactor, and an 18% higher electroactive bacteria community in C0 than S.
The archaeal community was dominated by Methanosaeta in all of the reactors, attached to the carbons and suspended in all sludges. It was most prevalent in C10, reaching 89% of the archaeal community, while in S, its percentage was 78%. Methanosaeta has been established as one of the main methanogens able to accept electrons in DIET [7]. Methanolinea, another methanogen associated with electrotrophic capacity in DIET [35], only appeared on the carbon surface of C10 with a relative abundance of less than 5% of the archaeal community.
The similiarities of the microbial community structures in the five samples were analyzed at the genus level by hierarchically clustered heat analysis (Figure 4). The heatmap includes 17 genera. C10 is the sample with the highest concentration of different genera. The communities attached to GAC, C10, and C0 clustered together finally. These samples share a high similitude when compared with sludge samples (S, S0, S10).

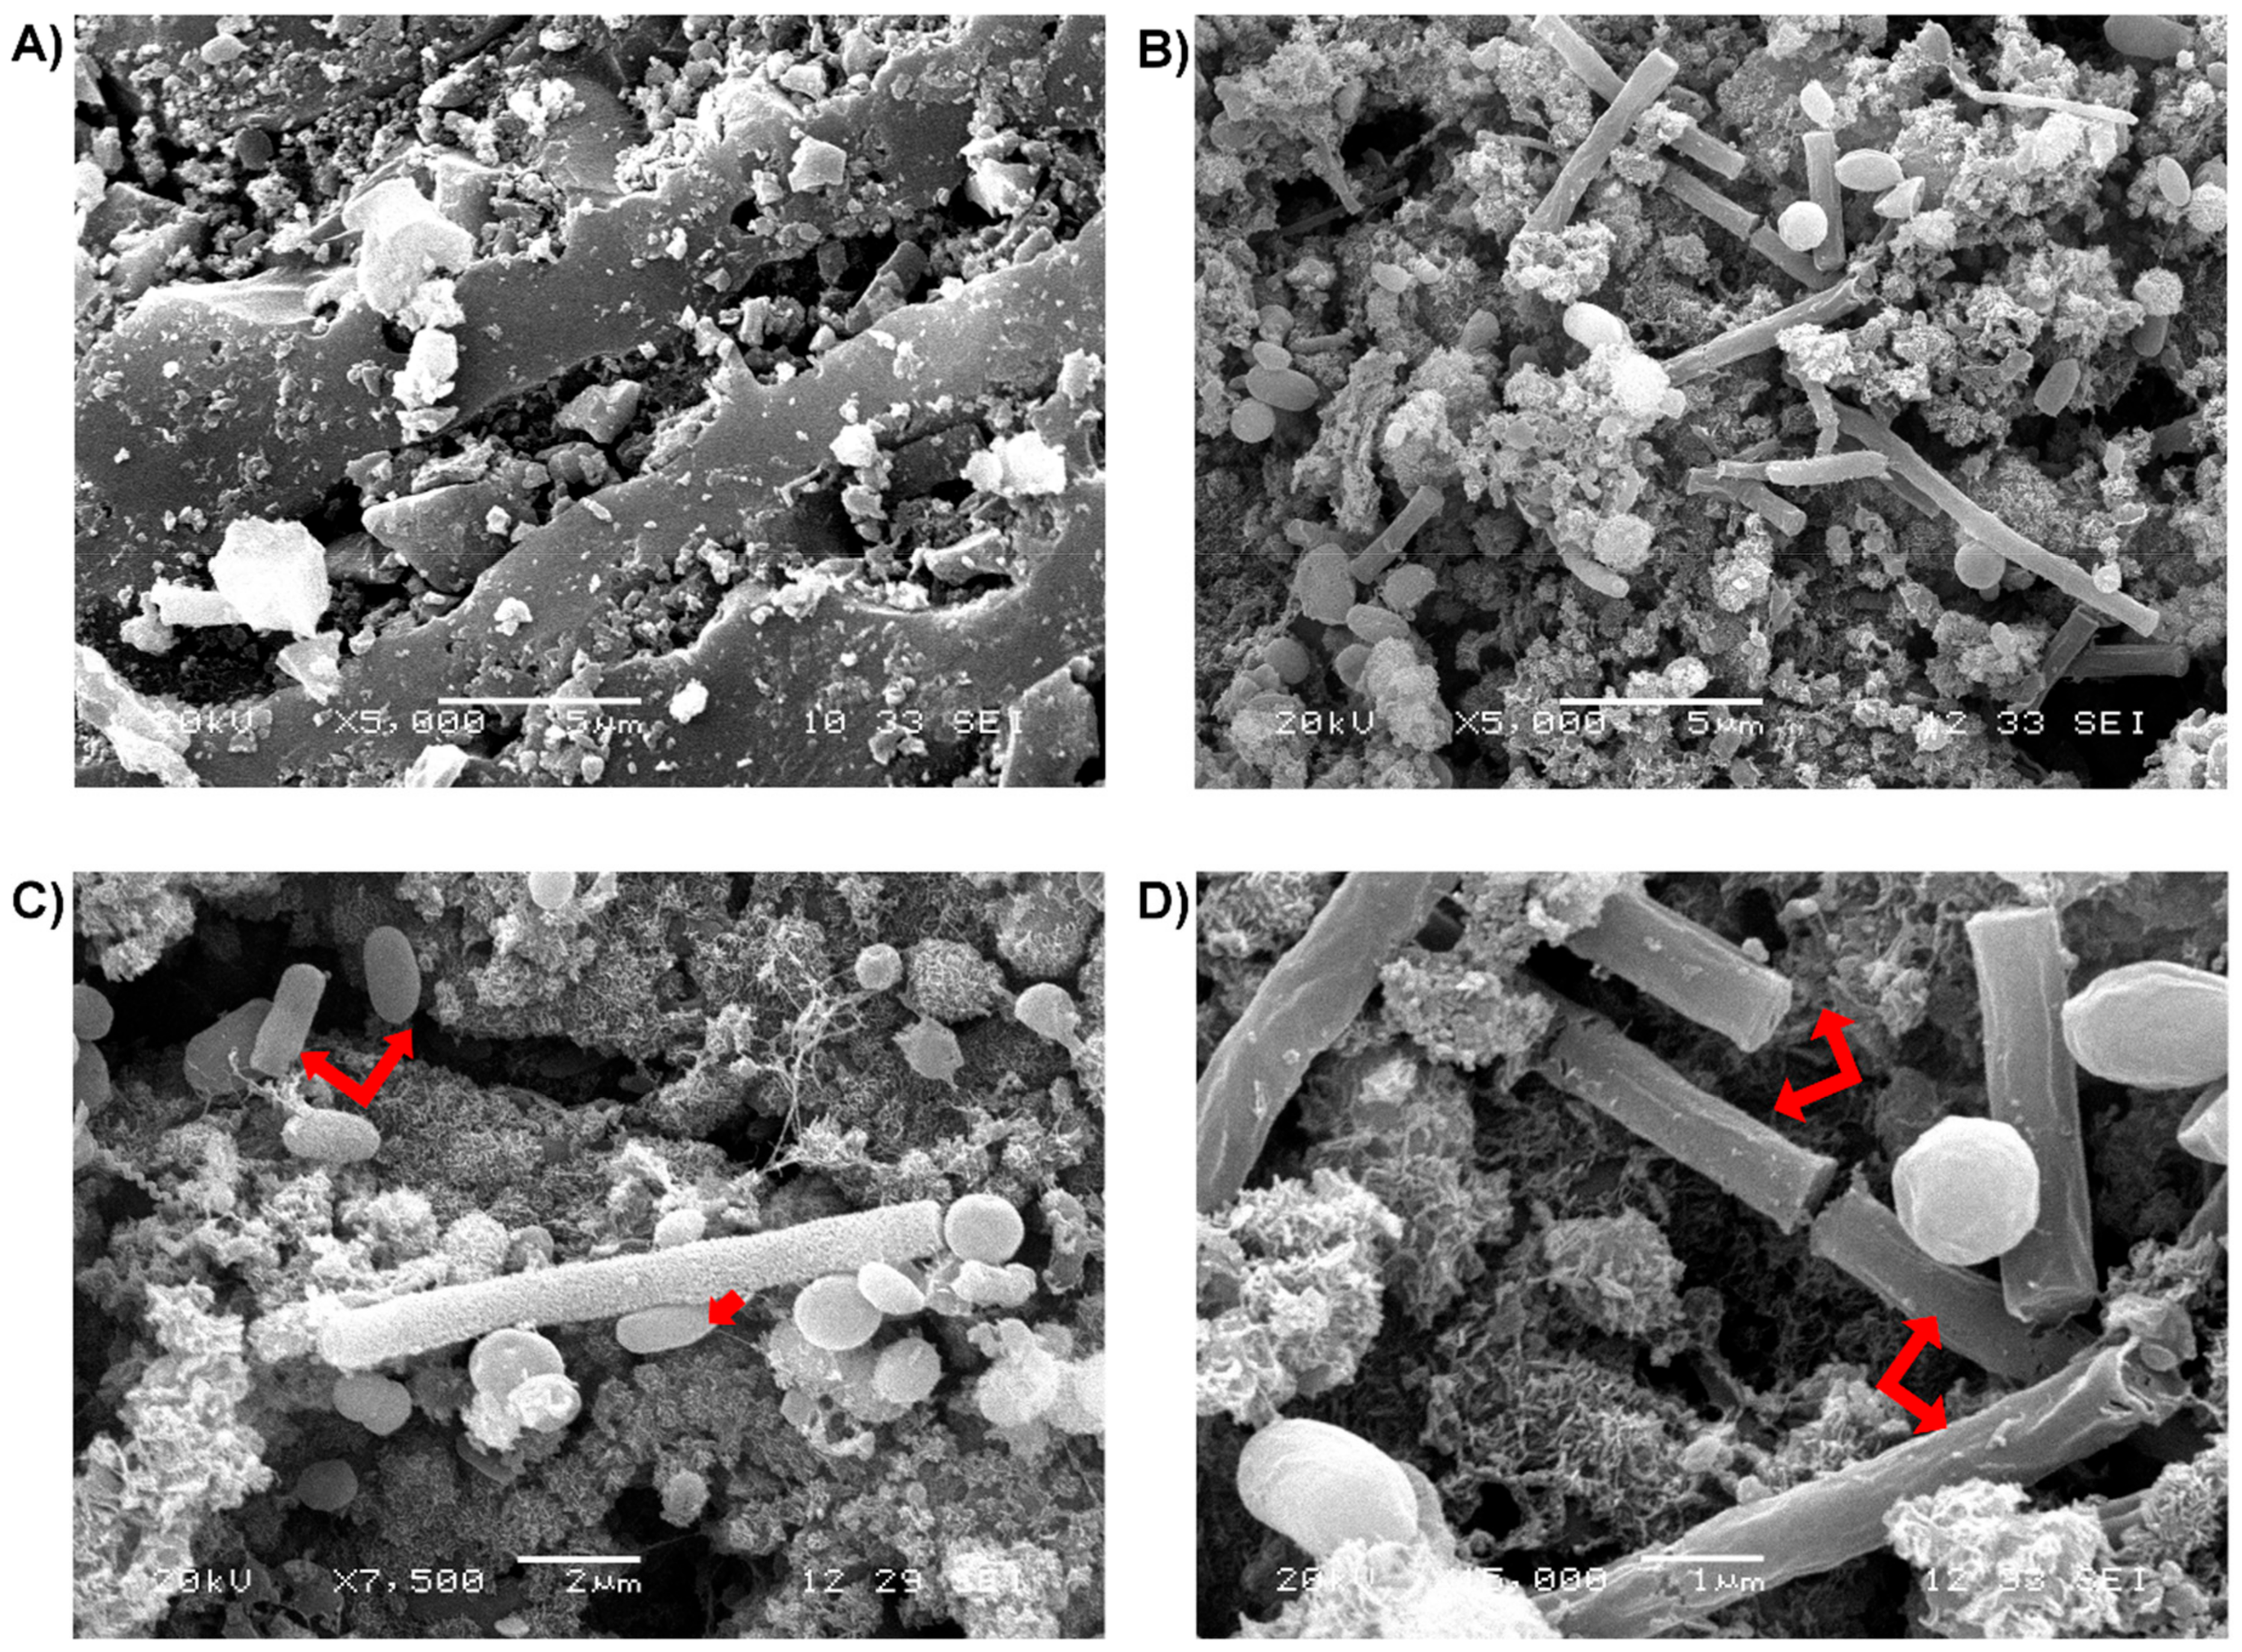
3.4. Scanning Electron Microscopy (SEM)

Through SEM, it was possible to examine the carbon surface and its porosity free of microbial communities before adding GAC to the reactors (Figure 5A). Additionally, microbial communities attached to GAC are clearly visible in Figure 5B. The exoelectrogen partner Geobacter was identified in the microbiological analysis attached to the GAC in sample C10 with a relative abundance of 14% in the bacterial community. Geobacter has been described as rod-shaped bacteria with a length between 2–4 µm [59]. In Figure 5C, bacteria can be visualized with the same morphological characteristics described above. This, coupled with the high percentage of Geobacter attached to GAC, makes it plausible to identify them in the Figure 5C. Methanosaeta is a rod-shaped archaea with average dimensions between 2 and 6 µm in length by single cell. Cells are enclosed inside an annular, striated sheathed structure, and they are separated by partitions forming a filamentous structure. Methanosaeta filaments can reach 100 µm of length [60]. In Figure 5D, it is possible to see Methanosaeta communities. Besides Methanosaeta was the dominant archaea in the microbial communities analysis, making its identification easy by SEM.

4. Discussion

4.1. Nejayote and Inoculum

Table 2 shows the results of the physicochemical characterization of nejayote, as compared with the results that were obtained in other studies. As it is a wastewater that may come from an industrial process or from a more traditional process, which is not always done in the same way, the nejayote presents a high level of heterogeneity in the results of its composition, as seen in the wide range that is given for the majority of parameters. According to Ibarra-Mendívil et al. [61], different lime concentrations of 0%, 0.5%, and 1% were used for nixtamalization and pH values of 4.75, 7.72, and 11.01 were obtained, respectively. Small modifications in proportions of lime, cooking, and rest times, and different varieties of corn can give rise to notable variations in the composition of nejayote. The presence of lime in the process leads to the nejayote having a basic pH. This study is in the range expected with a value recorded of 10.2.
The COD concentration of nejayote is within the range observed in the different studies (Table 2), with a value of 15,433 ± 826 mg·L−1, coming mainly from the pericarp tissue of corn. The content in TN was 95.33 ± 3.7 mg·L−1, lower than the composition analyzed in other studies, although this concentration is not sufficient to cause inhibition in anaerobic digestion. Concentrations between 1.7 and 14 g·L−1 cause a 50% reduction in methane production [64]. Both nitrogen and phosphorus are necessary for the good performance of an anaerobic reactor, since they are indispensable nutrients for bacteria. Concentrations lower than 0.3 mg·L−1 of phosphorus prevent the formation of the microbial community [65]. The nejayote that is characterized in this study has a concentration of 58.75 ± 1.25 mg·L−1, which will aid a good performance in the BMP test. The concentration of SO4 is 22.5 ± 2.5 mg·L−1, which is a little higher than the previously reported 13 mg·L−1 (Table 2). The COD/SO4 ratio is 686, so the presence of sulfur-reducing products and possible inhibition effects in the anaerobic digestion process due to the byproducts generated by them will be non-existent [66]. The percentages in both VS and TS are within the range referenced in Table 2. The values are 0.85 ± 0.01% VS and 1.22 ± 0.01% TS.
The inoculum has an alkalinity of 1652.5 ± 147 mg CaCO3·L−1. This contribution of alkalinity to the medium will absorb possible acidification processes that occur during anaerobic digestion due to the formation of VFAs [67]. The VS percentage of the inoculum is 2.67% ± 0.1. This percentage aids the good performance in the anaerobic digestion process [68].

4.2. BMP Test

The results of this study clearly demonstrate that generating a previous GAC biofilm before starting the wastewater anaerobic digestion enhances methane biogas production and results in an overall improved anaerobic digestion performance. The syntrophic relationship between exoelectrogenic bacteria and electrotrophic archaea is essential to enable DIET. Recently, it has been widely recognised that exolectrogenic bacteria can only oxidize alcohols and VFA to send electrons to reduce carbon dioxide to methane within DIET [24,52]. The advantages of promoting DIET instead of IHT in methane production yield do not become obviously apparent until there are increased alcohols and VFA concentrations and they are available to be oxidized by exoelectrogenic bacteria. While examining the results of the study, it is important to state that the first difference between control reactors and GAC reactors in methane production did not appear until the seventh day in N0 and N10 (Figure 1A), due to the insufficient concentration of VFA and alcohols, which are available in the medium to be oxidized. In previous studies undertaken in batch assays with conductive materials, the difference in methane production emerges earlier due to the substrate employed. In these studies, the carbon sources used were synthetic wastewater, which has alcohols and VFA readily available from the beginning of experimentation [36,38]. Nejayote, on the other hand, is a complex waste that requires hydrolysis and acidogenesis steps before VFA and alcohols are available, which explains the delay in DIET.
After the BMP test was concluded, the COD concentration was higher in N reactors than N0 and N10 reactors. This fact explains part of the difference in accumulated methane production. Butyrate was detected in N medium, whilst there was no presence of butyrate in N0 and N10 reactors. The total VFA concentration of N was more than double that of N0 and N10, which can, in part, go some way towards explaining the difference between the methane potentials in the tests; however, it can not be held accountable for all of the differences. These differences in methane yield could also be due to some remnant organic matter that has not been yet converted in VFA in N reactors [49].
In Table 3, the results are compared with studies that were developed with conductive materials. It is noted in Table 3 that the percentage in the increase of methane production is within plausible values. An increase of 54% when the biofilm is previously generated in GAC and 34% without the previous formation of GAC biofilm are reasonable results.

4.3. GAC Conductivity

DIET was stimulated by the addition of GAC in the reactors. GAC works as a support for microorganism communities and as electron conductor between exoelectrogenic bacteria and electrotrophic archaea. DIET using stainless steel as conductive support had a kinetic advantage that is 108 times greater than IHT to compete for the electron donor [69]. Stainless steel conductivity is 667 µS·cm−1, while the GAC conductivity employed in this study was 3600 µS·cm−1. Similar conductive materials employed before, such as magnetite [56] and biochar [30], possessed conductivities of 160 µS·cm−1 and 5 µS·cm−1, respectively. GAC has substantially higher values in terms of conductivity; making it an ideal material to use given its surface area, its high conductivity, and it is economically low cost [28,29].

4.4. Redox Potential

One of the most important effects, which GAC causes in the improvement of the methanogenic performance, is the change that it produces in redox potential. Redox potential must be under −200 mV for methanogenic activity to be possible. When redox potential is higher than −200 mV, this activity is virtually negligible [70]. All of the reactors in this study were under this barrier. As shown in the results, redox potential changed from −222 ± 7 mV to −471 ± 2 mV from control reactors N to N0 and N10 reactors. GAC had a direct effect on reducing redox potential by generating a reductive atmosphere, which is supported by evidence in other studies [71] where carbon nanotubes caused a reduction in redox potential in an abiotic environment. The potential energy difference (∆Eo) between the electron donor and electron acceptor is directly proportional to the energy (ATP) that a microbe could employ from the metabolic process [72]. Consequently, a high reducing micro-environment, produced by the GAC presence in the anaerobic reactor, expedites electron donation to provide a thermodynamic driving force for accomplishing the electrophilic attack in terms of reduction process, increasing carbon dioxide reduction to methane, which could be one of the key points for improving the reactor performance [71].

4.5. Relationship Between Redox Potential, Methane Production and Archaea Communities

There was evidence that low redox potential stimulated the syntrophic relationship between exoelectrogenic bacteria and electrotrophic methanogens, resulting in elevated levels in methane concentration, which can be observed in Figure 1C. A previous study observed that a pure methanogenic archaeal culture with carbon materials had higher methane yield than a control reactor without carbon material, due to lower redox potential [71]. That means that, without an exoelectrogenic partner to send electrons through DIET to electrotrophic methanogens, methane yield is improved due to redox potential reduction. In a pure culture of hydrogenotrophic methanogens, the redox potential was under −450 mV, causing an increase in its population [70]. This change may be a result of the fact that it requires less thermodynamic energy to undertake an electrophilic attack by these methanogens to reduce carbon dioxide to methane. The low redox potential that was obtained in this study (−471 mV), by adding GAC, caused an increase of 10% in the acetoclastic methanogen (Methanosaeta) population.

4.6. Microbial Analysis

Only Methanosaeta and Methanosarcina are able to generate methane from acetate [73]. Additionally, Methanosaeta is recognised as an electron acceptor partner in DIET, reducing carbon dioxide to methane, hence in the control reactor, Methanosaeta played a vital role as acetate consumer to produce methane. However, in N0 and N10 reactors, due to its attachment to the GAC surface, Methanosaeta worked as an electron acceptor to reduce carbon dioxide to methane. Methanobacterium is a hydrogenotrophic archaea that tended to be in suspended solution instead of being attached to the carbon surface [74], although Methanobacterium has been detected in conductive support as an electron acceptor in DIET [44]. Methanobacterium had a relative abundance over 10% in the N reactor, whereas when detected in the sludges of N0 and N10, it was consistently under 5%. In this study, Methanobacterium was responsible for reducing hydrogen partial pressure through IHT in control reactor N. This is because Methanobacterium needs to be attached to conductive material to accept electrons. Methanolinea, which is a hidrogenotrophic archaea, was only detected in C10 samples with a proportion of 3%. Methanolinea and Methanobacterium can accept electrons when they are attached to a conductive support; therefore, they are able to work as electrotrophic archaea in DIET [17]. In this study, the two different hidrogenotrophic archaea played distinct roles: one (Methanobacterium) was suspended in the bulk and participated in IHT by controlling hydrogen partial pressure, and other (Methanolinea) was attached to the GAC surface and accepted electrons to reduce carbon dioxide to methane.
A variety of electroactive bacteria were enriched in the GAC surface; Geobacter, Bacteroides, and Syntrophomonas. All of these bacteria genera have been acknowledged as participants in DIET as electron donors [40,58]. Syntrophomonas and Bacteroides were detected with a relative abundance of 2% and 3% for C0 and C10, respectively. However, there was no presence of Syntrophomonas and Bacteroides in N reactors. Previous studies have shown that Bacteroides have the potential to grow significantly on the anode of a bioelectrochemical system and on the surface of carbon cloth in anaerobic reactors. This genus is able to extracellularly transfer electrons to ferric iron and donate electrons to electrotrophic methanogens via DIET [40,75]. There is no evidence that Syntrophomonas are able to transport electrons extracellularly, but notable growth has been reported when acting as a DIET partner in anaerobic systems [16].
Geobacter were only detected in C10 with a relative abundance of 13%. It must be concluded that this was because the biofilm was developed before introducing nejayote into the reactor and Geobacter could then grow under favorable conditions. The absence of Geobacter in C0 can be explained by the fact that Geobacter cannot efficiently degrade complex organic waste [76]. An additional supposition is that Geobacter is not viable in complex waste under hard conditions, as relative high salinity environment [27,40]. Geobacter enrichment was produced during the ten days before undertaking the BMP test in N10 reactors. This enrichment was not possible in N0 reactors due to the fact that GAC was added to the reactors at the same time as nejayote, and other exoelectrogenic bacteria coming from nejayote or inoculum, overtaking Geobacter and adapting better to the new environmental conditions.
Other enrichment produced in the BMP test involved Prolixibacter. This genus has not been reported before in any study that is related with DIET in anaerobic digestion as exoelectrogenic bacteria. The capacity of Prolixibacter to transport electrons extracellularly has not yet been concluded, but it has been reported as a fermentative bacterium in sediment fuel cells that could be able to transfer electrons extracellularly [77]. In addition, its enrichment in microbial electrolysis cells has been reported [78].
The GAC biofilm developed previously in N10 reactors had two positive effects in the exoelectrogenic bacteria community. C10 exoelectrogenic community was 4% higher than the C0 exoelectrogenic community and the Geobacter genus only appeared in C10 samples.
Microbial analysis has shown a relative abundance of 12% and 14% of Parabacteroides attached to N0 GAC and N10 GAC, respectively, while it was not detected in the N reactor. This genus is known for its capacity to degrade polysaccharides to acetate [79]. The main function of these fermentative bacteria was to convert organic matter to compounds that were available to be oxidized by exoelectrogenic bacteria. Parabacteroides played an important role in DIET, producing the essential VFA required by the exoelectrogenic bacteria to degrade and donate electrons to electrotrophic methanogens. Parabacteroidetes growth has been reported in microbial fuel cells [80], assuming the same role as in this study, however it has not been reported in studies that are related with the promotion of DIET in anaerobic reactors. This is a result of the fact that most of these studies employ synthetic wastewater that is easily converted to methane. One of the difficulties previously detected in DIET was the hydrolysis and acidogenesis limit of VFA and alcohol concentration that was required to take advantage of DIET instead of IHT [52]. Parabacteroidetes growth in the conductive material greatly assists in resolving this issue, by generating the crucial carbon source for exoelectrogenic bacteria to oxidize. The electroactive community in C10 was 8% higher than in C0 and 38% higher than S.

5. Conclusions

GAC addition had a positive impact on the BMP test. GAC had four main resulting effects on the anaerobic digestion process; increased methane production, redox potential reduction, DIET promotion, and electroactive biofilm development. A low redox potential made an electrotrophic attack to reduce carbon dioxide to methane easier. Additionally, DIET was promoted instead of IHT resulting in higher methane concentration and greater methane production. Furthermore, the electroactive community population intensified when the biofilm was developed 10 days before the assay, and the reactors with previous biofilm obtained a better yield than those without. This study was the first step to a better understanding of the relationship between DIET promotion and a complex wastewater, such as nejayote. Undertaking a study using bigger reactors is necessary to further support these promising results, in order to fully realise the potential of testing these conclusions on a large scale.

Author Contributions

D.V. design of experiments, performed physico-chemical parameter analysis and BMP tests, participated in the evaluation of microorganisms communities and drafted the manuscript. C.R. helped co-ordinate the project and revised the manuscript. B.C.-C. developed the DNA extraction protocol, participated in the evaluation of microorganisms communities and revised the manuscript. J.A.D.-M. performed VFA analysis and participated in physico-chemical parameter analysis and BMP test. R.T.-T. developed the DNA extraction protocol and performed MG RAST analysis. A.C.-V. participated in developing the DNA extraction protocol and performed DNA extraction. L.A.-G. designed and coordinated this work alongside helping to draft the manuscript. All authors read and approved the final manuscript.

Funding

Mexican Council for Science (CONACYT) for the financial support granted to carry out this study through grant 738499 awarded for doctoral studies.

Acknowledgments

The authors thank Q.I Tanit Toledano Thompson for technical assistance in SEM micrographs. Also we would like to thank M.S. Miguel Alonso Tzec Simá for technical assistance in DNA extraction.

Conflicts of Interest

The authors declare that they have no competing interests.

References

  1. España-Gamboa, E.; Domínguez-Maldonado, J.A.; Tapia-Tussell, R.; Chale-Canul, J.S.; Alzate-Gaviria, L. Corn industrial wastewater (nejayote): A promising substrate in Mexico for methane production in a coupled system (APCR-UASB). Environ. Sci. Pollut. Res. 2017, 25, 712–722. [Google Scholar] [CrossRef] [PubMed]
  2. Salmerón-Alcocer, A.; Rodríguez-Mendoza, N.; Pineda-Santiago, V.; Cristiani-Urbina, E.; Juárez-Ramírez, C.; Ruiz-Ordaz, N.; Galíndez-Mayer, J. Aerobic treatment of maize-processing wastewater (nejayote) in a single-stream multi-stage bioreactor. J. Environ. Eng. Sci. 2003, 2, 401–406. [Google Scholar] [CrossRef]
  3. Rosentrater, K.A. A review of corn masa processing residues: Generation, properties, and potential utilization. Waste Manag. 2006, 26, 284–292. [Google Scholar] [CrossRef] [PubMed]
  4. Valderrama-Bravo, C.; Gutiérrez-Cortez, E.; Contreras-Padilla, M.; Rojas-Molina, I.; Mosquera, J.C.; Rojas-Molina, A.; Beristain, F.; Rodríguez-García, M.E. Constant pressure filtration of lime water (nejayote) used to cook kernels in maize processing. J. Food Eng. 2012, 110, 478–486. [Google Scholar] [CrossRef]
  5. Meraz, K.A.S.; Vargas, S.M.P.; Maldonado, J.T.L.; Bravo, J.M.C.; Guzman, M.T.O.; Maldonado, E.A.L. Eco-friendly innovation for nejayote coagulation–flocculation process using chitosan: Evaluation through zeta potential measurements. Chem. Eng. J. 2016, 284, 536–542. [Google Scholar] [CrossRef]
  6. García-Zamora, J.L.; Sánchez-González, M.; Lozano, J.A.; Jáuregui, J.; Zayas, T.; Santacruz, V.; Hernández, F.; Torres, E. Enzymatic treatment of wastewater from the corn tortilla industry using chitosan as an adsorbent reduces the chemical oxygen demand and ferulic acid content. Process Biochem. 2015, 50, 125–133. [Google Scholar] [CrossRef]
  7. Argun, M.S.; Argun, M.E. Treatment and alternative usage possibilities of a special wastewater: Nejayote. J. Food Process Eng. 2018, 41, e12609. [Google Scholar] [CrossRef]
  8. Desloover, J.; De Clippeleir, H.; Boeckx, P.; Du Laing, G.; Colsen, J.; Verstraete, W.; Vlaeminck, S.E. Floc-based sequential partial nitritation and anammox at full scale with contrasting N2O emissions. Water Res. 2011, 45, 2811–2821. [Google Scholar] [CrossRef] [PubMed]
  9. Massara, T.M.; Komesli, O.T.; Sozudogru, O.; Komesli, S.; Katsou, E. A Mini Review of the Techno-environmental Sustainability of Biological Processes for the Treatment of High Organic Content Industrial Wastewater Streams. Waste Biomass Valoriz. 2017, 8, 1665–1678. [Google Scholar] [CrossRef]
  10. Alexandropoulou, M.; Antonopoulou, G.; Lyberatos, G. Food industry waste’s exploitation via anaerobic digestion and fermentative hydrogen production in an up-flow column reactor. Waste Biomass Valoriz. 2016, 7, 711–723. [Google Scholar] [CrossRef]
  11. Veluchamy, C.; Kalamdhad, A.S. Biochemical methane potential test for pulp and paper mill sludge with different food/microorganisms ratios and its kinetics. Int. Biodeterior. Biodegradation 2017, 117, 197–204. [Google Scholar] [CrossRef]
  12. Raposo, F.; Fernández-Cegrí, V.; De la Rubia, M.A.; Borja, R.; Béline, F.; Cavinato, C.; Demirer, G.; Fernández, B.; Fernández-Polanco, M.; Frigon, J.C. Biochemical methane potential (BMP) of solid organic substrates: Evaluation of anaerobic biodegradability using data from an international interlaboratory study. J. Chem. Technol. Biotechnol. 2011, 86, 1088–1098. [Google Scholar] [CrossRef]
  13. Kafle, G.K.; Chen, L. Comparison on batch anaerobic digestion of five different livestock manures and prediction of biochemical methane potential (BMP) using different statistical models. Waste Manag. 2016, 48, 492–502. [Google Scholar] [CrossRef] [PubMed]
  14. Hansen, T.L.; Schmidt, J.E.; Angelidaki, I.; Marca, E.; la Cour Jansen, J.; Mosbæk, H.; Christensen, T.H. Method for determination of methane potentials of solid organic waste. Waste Manag. 2004, 24, 393–400. [Google Scholar] [CrossRef] [PubMed]
  15. Stams, A.J.M.; Plugge, C.M. Electron transfer in syntrophic communities of anaerobic bacteria and archaea. Nat. Rev. Microbiol. 2009, 7, 568–577. [Google Scholar] [CrossRef] [PubMed]
  16. Zhao, Z.; Zhang, Y.; Quan, X.; Zhao, H. Evaluation on direct interspecies electron transfer in anaerobic sludge digestion of microbial electrolysis cell. Bioresour. Technol. 2016, 200, 235–244. [Google Scholar] [CrossRef] [PubMed]
  17. Lee, J.-Y.; Lee, S.-H.; Park, H.-D. Enrichment of specific electro-active microorganisms and enhancement of methane production by adding granular activated carbon in anaerobic reactors. Bioresour. Technol. 2016, 205, 205–212. [Google Scholar] [CrossRef] [PubMed]
  18. Rotaru, A.-E.; Shrestha, P.M.; Liu, F.; Shrestha, M.; Shrestha, D.; Embree, M.; Zengler, K.; Wardman, C.; Nevin, K.P.; Lovley, D.R. A new model for electron flow during anaerobic digestion: Direct interspecies electron transfer to Methanosaeta for the reduction of carbon dioxide to methane. Energy Environ. Sci. 2014, 7, 408–415. [Google Scholar] [CrossRef]
  19. Baek, G.; Kim, J.; Kim, J.; Lee, C. Role and Potential of Direct Interspecies Electron Transfer in Anaerobic Digestion. Energies 2018, 11, 107. [Google Scholar] [CrossRef]
  20. Dubé, C.-D.; Guiot, S.R. Direct Interspecies Electron Transfer in Anaerobic Digestion: A Review. In Biogas Science and Technology; Guebitz, M.G., Bauer, A., Bochmann, G., Gronauer, A., Weiss, S., Eds.; Springer International Publishing: Cham, Switzerland, 2015; pp. 101–115. ISBN 978-3-319-21993-6. [Google Scholar]
  21. Liu, F.; Rotaru, A.-E.; Shrestha, P.M.; Malvankar, N.S.; Nevin, K.P.; Lovley, D.R. Promoting direct interspecies electron transfer with activated carbon. Energy Environ. Sci. 2012, 5, 8982–8989. [Google Scholar] [CrossRef]
  22. Chen, S.; Rotaru, A.-E.; Shrestha, P.M.; Malvankar, N.S.; Liu, F.; Fan, W.; Nevin, K.P.; Lovley, D.R. Promoting Interspecies Electron Transfer with Biochar. Sci. Rep. 2014, 4, 5019. [Google Scholar] [CrossRef] [PubMed] [Green Version]
  23. Zhao, Z.; Zhang, Y.; Holmes, D.E.; Dang, Y.; Woodard, T.L.; Nevin, K.P.; Lovley, D.R. Potential enhancement of direct interspecies electron transfer for syntrophic metabolism of propionate and butyrate with biochar in up-flow anaerobic sludge blanket reactors. Bioresour. Technol. 2016, 209, 148–156. [Google Scholar] [CrossRef] [PubMed] [Green Version]
  24. Lovley, D.R. Happy together: Microbial communities that hook up to swap electrons. ISME J. 2016, 11, 327–336. [Google Scholar] [CrossRef] [PubMed]
  25. Chen, S.; Rotaru, A.-E.; Liu, F.; Philips, J.; Woodard, T.L.; Nevin, K.P.; Lovley, D.R. Carbon cloth stimulates direct interspecies electron transfer in syntrophic co-cultures. Bioresour. Technol. 2014, 173, 82–86. [Google Scholar] [CrossRef] [PubMed] [Green Version]
  26. Dang, Y.; Sun, D.; Woodard, T.L.; Wang, L.-Y.; Nevin, K.P.; Holmes, D.E. Stimulation of the anaerobic digestion of the dry organic fraction of municipal solid waste (OFMSW) with carbon-based conductive materials. Bioresour. Technol. 2017, 238, 30–38. [Google Scholar] [CrossRef] [PubMed]
  27. Dang, Y.; Holmes, D.E.; Zhao, Z.; Woodard, T.L.; Zhang, Y.; Sun, D.; Wang, L.-Y.; Nevin, K.P.; Lovley, D.R. Enhancing anaerobic digestion of complex organic waste with carbon-based conductive materials. Bioresour. Technol. 2016, 220, 516–522. [Google Scholar] [CrossRef] [PubMed]
  28. Hesas, R.H.; Arami-Niya, A.; Daud, W.M.A.W.; Sahu, J.N. Preparation and characterization of activated carbon from apple waste by microwave-assisted phosphoric acid activation: Application in methylene blue adsorption. BioResources 2013, 8, 2950–2966. [Google Scholar]
  29. Arami-Niya, A.; Daud, W.M.A.W.; Mjalli, F.S.; Abnisa, F.; Shafeeyan, M.S. Production of microporous palm shell based activated carbon for methane adsorption: Modeling and optimization using response surface methodology. Chem. Eng. Res. Des. 2012, 90, 776–784. [Google Scholar] [CrossRef]
  30. Zhao, Z.; Zhang, Y.; Yu, Q.; Dang, Y.; Li, Y.; Quan, X. Communities stimulated with ethanol to perform direct interspecies electron transfer for syntrophic metabolism of propionate and butyrate. Water Res. 2016, 102, 475–484. [Google Scholar] [CrossRef] [PubMed]
  31. Parker, R.; Tinsley, C.J. Electrical conduction in magnetite. Phys. Status Solidi 1976, 33, 189–194. [Google Scholar] [CrossRef]
  32. Guo, K.; Soeriyadi, A.H.; Feng, H.; Prévoteau, A.; Patil, S.A.; Gooding, J.J.; Rabaey, K. Heat-treated stainless steel felt as scalable anode material for bioelectrochemical systems. Bioresour. Technol. 2015, 195, 46–50. [Google Scholar] [CrossRef] [PubMed]
  33. Yang, Y.; Zhang, Y.; Li, Z.; Zhao, Z.; Quan, X.; Zhao, Z. Adding granular activated carbon into anaerobic sludge digestion to promote methane production and sludge decomposition. J. Clean. Prod. 2017, 149, 1101–1108. [Google Scholar] [CrossRef]
  34. Mo, J.; Steen, S.M.; Zhang, F.-Y.; Toops, T.J.; Brady, M.P.; Green, J.B. Electrochemical investigation of stainless steel corrosion in a proton exchange membrane electrolyzer cell. Int. J. Hydrogen Energy 2015, 40, 12506–12511. [Google Scholar] [CrossRef] [Green Version]
  35. Hu, Q.; Sun, D.; Ma, Y.; Qiu, B.; Guo, Z. Conductive polyaniline nanorods enhanced methane production from anaerobic wastewater treatment. Polymer 2017, 120, 236–243. [Google Scholar] [CrossRef]
  36. Tian, T.; Qiao, S.; Li, X.; Zhang, M.; Zhou, J. Nano-graphene induced positive effects on methanogenesis in anaerobic digestion. Bioresour. Technol. 2017, 224, 41–47. [Google Scholar] [CrossRef] [PubMed]
  37. Jing, Y.; Wan, J.; Angelidaki, I.; Zhang, S.; Luo, G. iTRAQ quantitative proteomic analysis reveals the pathways for methanation of propionate facilitated by magnetite. Water Res. 2017, 108, 212–221. [Google Scholar] [CrossRef] [PubMed]
  38. Lin, R.; Cheng, J.; Zhang, J.; Zhou, J.; Cen, K.; Murphy, J.D. Boosting biomethane yield and production rate with graphene: The potential of direct interspecies electron transfer in anaerobic digestion. Bioresour. Technol. 2017, 239, 345–352. [Google Scholar] [CrossRef] [PubMed]
  39. Xu, H.; Wang, C.; Yan, K.; Wu, J.; Zuo, J.; Wang, K. Anaerobic granule-based biofilms formation reduces propionate accumulation under high H2 partial pressure using conductive carbon felt particles. Bioresour. Technol. 2016, 216, 677–683. [Google Scholar] [CrossRef] [PubMed]
  40. Lei, Y.; Sun, D.; Dang, Y.; Chen, H.; Zhao, Z.; Zhang, Y.; Holmes, D.E. Stimulation of methanogenesis in anaerobic digesters treating leachate from a municipal solid waste incineration plant with carbon cloth. Bioresour. Technol. 2016, 222, 270–276. [Google Scholar] [CrossRef] [PubMed]
  41. Zhang, J.; Lu, Y. Conductive Fe3O4 nanoparticles accelerate syntrophic methane production from butyrate oxidation in two different lake sediments. Front. Microbiol. 2016, 7, 1316. [Google Scholar] [CrossRef] [PubMed]
  42. Yan, W.; Shen, N.; Xiao, Y.; Chen, Y.; Sun, F.; Tyagi, V.K.; Zhou, Y. The role of conductive materials in the start-up period of thermophilic anaerobic system. Bioresour. Technol. 2017, 239, 336–344. [Google Scholar] [CrossRef] [PubMed]
  43. Yamada, C.; Kato, S.; Ueno, Y.; Ishii, M.; Igarashi, Y. Conductive iron oxides accelerate thermophilic methanogenesis from acetate and propionate. J. Biosci. Bioeng. 2015, 119, 678–682. [Google Scholar] [CrossRef] [PubMed] [Green Version]
  44. Zhuang, L.; Tang, J.; Wang, Y.; Hu, M.; Zhou, S. Conductive iron oxide minerals accelerate syntrophic cooperation in methanogenic benzoate degradation. J. Hazard. Mater. 2015, 293, 37–45. [Google Scholar] [CrossRef] [PubMed]
  45. Barua, S.; Dhar, B.R. Advances towards understanding and engineering direct interspecies electron transfer in anaerobic digestion. Bioresour. Technol. 2017, 244, 698–707. [Google Scholar] [CrossRef] [PubMed]
  46. American Public Health Association (APHA). Standard Methods for the Examination of Water and Wastewater; APHA: Washington, DC, USA, 2005. [Google Scholar]
  47. Poggi-Varaldo, H.M.; Valdés, L.; Esparza-Garcia, F.; Fernández-Villagómez, G. Solid substrate anaerobic co-digestion of paper mill sludge, biosolids, and municipal solid waste. Water Sci. Technol. 1997, 35, 197–204. [Google Scholar] [CrossRef]
  48. Wang, B.; Björn, A.; Strömberg, S.; Nges, I.A.; Nistor, M.; Liu, J. Evaluating the influences of mixing strategies on the Biochemical Methane Potential test. J. Environ. Manag. 2017, 185, 54–59. [Google Scholar] [CrossRef] [PubMed]
  49. Valero, D.; Montes, J.A.; Rico, J.L.; Rico, C. Influence of headspace pressure on methane production in Biochemical Methane Potential (BMP) tests. Waste Manag. 2016, 48, 193–198. [Google Scholar] [CrossRef] [PubMed] [Green Version]
  50. Bowler, N. Four-point potential drop measurements for materials characterization. Meas. Sci. Technol. 2011, 22, 12001. [Google Scholar] [CrossRef]
  51. Wirth, R.; Kovács, E.; Maróti, G.; Bagi, Z.; Rákhely, G.; Kovács, K.L. Characterization of a biogas-producing microbial community by short-read next generation DNA sequencing. Biotechnol. Biofuels 2012, 5, 41. [Google Scholar] [CrossRef] [PubMed] [Green Version]
  52. Zhao, Z.; Li, Y.; Quan, X.; Zhang, Y. Towards engineering application: Potential mechanism for enhancing anaerobic digestion of complex organic waste with different types of conductive materials. Water Res. 2017, 115, 266–277. [Google Scholar] [CrossRef] [PubMed]
  53. Trejo-González, A.; Fería-Morales, A.; Wild-Altamirano, C. The role of lime in the alkaline treatment of corn for tortilla preparation. Adv. Chem. 1982, 198, 245–263. [Google Scholar]
  54. González-Martinez, S. Biological treatability of the wastewaters from the alkaline cooking of maize (Indian corn). Environ. Technol. 1984, 5, 365–372. [Google Scholar] [CrossRef]
  55. Eddy, M. Wastewater Engineering: Treatment, Disposal and Reuse; McGraw-Hill: New York, NY, USA, 1991. [Google Scholar]
  56. Cruz Viggi, C.; Rossetti, S.; Fazi, S.; Paiano, P.; Majone, M.; Aulenta, F. Magnetite particles triggering a faster and more robust syntrophic pathway of methanogenic propionate degradation. Environ. Sci. Technol. 2014, 48, 7536–7543. [Google Scholar] [CrossRef] [PubMed]
  57. Liu, Y.; Zhang, Y.; Zhao, Z.; Ngo, H.H.; Guo, W.; Zhou, J.; Peng, L.; Ni, B.-J. A modeling approach to direct interspecies electron transfer process in anaerobic transformation of ethanol to methane. Environ. Sci. Pollut. Res. 2016, 1–9. [Google Scholar] [CrossRef] [PubMed]
  58. Rotaru, A.-E.; Shrestha, P.M.; Liu, F.; Markovaite, B.; Chen, S.; Nevin, K.P.; Lovley, D.R. Direct interspecies electron transfer between Geobacter metallireducens and Methanosarcina barkeri. Appl. Environ. Microbiol. 2014, 80, 4599–4605. [Google Scholar] [CrossRef] [PubMed]
  59. Lovley, D.R.; Phillips, E.J.P. Novel mode of microbial energy metabolism: Organic carbon oxidation coupled to dissimilatory reduction of iron or manganese. Appl. Environ. Microbiol. 1988, 54, 1472–1480. [Google Scholar] [PubMed]
  60. Kamagata, Y.; Kawasaki, H.; Oyaizu, H.; Nakamura, K.; Mikami, E.; Endo, G.; Koga, Y.; Yamasato, K. Characterization of three thermophilic strains of Methanothrix (“Methanosaeta”) thermophila sp. nov. and rejection of Methanothrix (“Methanosaeta”) thermoacetophila. Int. J. Syst. Evol. Microbiol. 1992, 42, 463–468. [Google Scholar] [CrossRef] [PubMed]
  61. Ibarra-Mendívil, M.H.; Gallardo-Navarro, Y.T.; Torres, P.I.; Ramírez Wong, B. Effect of processing conditions on instrumental evaluation of nixtamal hardness of corn. J. Texture Stud. 2008, 39, 252–266. [Google Scholar] [CrossRef]
  62. Rosentrater, K.A.; Flores, R.A.; Richard, T.L.; Bern, C.J. Physical and nutritional properties of corn masa by-product streams. Appl. Eng. Agric. 1999, 15, 515–523. [Google Scholar] [CrossRef]
  63. Krishnan, R.; Ríos, R.; Salinas, N.; Durán-de-Bazúa, C. Treatment of Maize Processing Industry Wastewater by Percolating Columns. Environ. Technol. 1998, 19, 417–424. [Google Scholar] [CrossRef]
  64. Chen, Y.; Kurt, S.; Creamer, J.J.C. Inhibition of anaerobic digestion process: A review. Bioresour. Technol. 2007, 99, 4044–4064. [Google Scholar] [CrossRef] [PubMed]
  65. Singh, R.P.; Kumar, S.; Ojha, C.S.P. Nutrient requirement for UASB process: A review. Biochem. Eng. J. 1999, 3, 35–54. [Google Scholar] [CrossRef]
  66. Omil, F.; Lens, P.; Visser, A.; Hulshoff Pol, L.W.; Lettinga, G. Long-term competition between sulfate reducing and methanogenic bacteria in UASB reactors treating volatile fatty acids. Biotechnol. Bioeng. 1998, 57, 676–685. [Google Scholar] [CrossRef]
  67. Gerardi, M.H. The Microbiology of Anaerobic Digesters; John Wiley & Sons: Hoboken, NJ, USA, 2003; ISBN 0471468959. [Google Scholar]
  68. Lettinga, G.; Hobma, S.W.; Pol, L.W.H.; De Zeeuw, W.; De Jong, P.; Grin, P.; Roersma, R. Design operation and economy of anaerobic treatment. Water Sci. Technol. 1983, 15, 177–195. [Google Scholar] [CrossRef]
  69. Li, Y.; Zhang, Y.; Yang, Y.; Quan, X.; Zhao, Z. Potentially direct interspecies electron transfer of methanogenesis for syntrophic metabolism under sulfate reducing conditions with stainless steel. Bioresour. Technol. 2017, 234, 303–309. [Google Scholar] [CrossRef] [PubMed]
  70. Hirano, S.; Matsumoto, N.; Morita, M.; Sasaki, K.; Ohmura, N. Electrochemical control of redox potential affects methanogenesis of the hydrogenotrophic methanogen Methanothermobacter thermautotrophicus. Lett. Appl. Microbiol. 2013, 56, 315–321. [Google Scholar] [CrossRef] [PubMed]
  71. Salvador, A.F.; Martins, G.; Melle-Franco, M.; Serpa, R.; Stams, A.J.M.; Cavaleiro, A.J.; Pereira, M.A.; Alves, M.M. Carbon nanotubes accelerate methane production in pure cultures of methanogens and in a syntrophic coculture. Environ. Microbiol. 2017, 19, 2727–2739. [Google Scholar] [CrossRef] [PubMed]
  72. Thrash, J.C.; Coates, J.D. Direct and indirect electrical stimulation of microbial metabolism. Environ. Sci. Technol. 2008, 42, 3921–3931. [Google Scholar] [CrossRef] [PubMed]
  73. Zinder, S.H. Physiological ecology of methanogens. In Methanogenesis; Springer: Boston, MA, USA 1993; pp. 128–206. [Google Scholar]
  74. Xu, S.; He, C.; Luo, L.; Lü, F.; He, P.; Cui, L. Comparing activated carbon of different particle sizes on enhancing methane generation in upflow anaerobic digester. Bioresour. Technol. 2015, 196, 606–612. [Google Scholar] [CrossRef] [PubMed]
  75. Wang, A.; Liu, L.; Sun, D.; Ren, N.; Lee, D.-J. Isolation of Fe (III)-reducing fermentative bacterium Bacteroides sp. W7 in the anode suspension of a microbial electrolysis cell (MEC). Int. J. Hydrogen Energy 2010, 35, 3178–3182. [Google Scholar] [CrossRef]
  76. Wu, D.; Wang, T.; Huang, X.; Dolfing, J.; Xie, B. Perspective of harnessing energy from landfill leachate via microbial fuel cells: Novel biofuels and electrogenic physiologies. Appl. Microbiol. Biotechnol. 2015, 99, 7827–7836. [Google Scholar] [CrossRef] [PubMed]
  77. Holmes, D.E.; Nevin, K.P.; Woodard, T.L.; Peacock, A.D.; Lovley, D.R. Prolixibacter bellariivorans gen. nov., sp. nov., a sugar-fermenting, psychrotolerant anaerobe of the phylum Bacteroidetes, isolated from a marine-sediment fuel cell. Int. J. Syst. Evol. Microbiol. 2007, 57, 701–707. [Google Scholar] [CrossRef] [PubMed] [Green Version]
  78. Huang, L.; Jiang, L.; Wang, Q.; Quan, X.; Yang, J.; Chen, L. Cobalt recovery with simultaneous methane and acetate production in biocathode microbial electrolysis cells. Chem. Eng. J. 2014, 253, 281–290. [Google Scholar] [CrossRef]
  79. Hodgson, D.M.; Smith, A.; Dahale, S.; Stratford, J.P.; Li, J.V.; Grüning, A.; Bushell, M.E.; Marchesi, J.R.; Avignone Rossa, C. Segregation of the anodic microbial communities in a microbial fuel cell cascade. Front. Microbiol. 2016, 7, 699. [Google Scholar] [CrossRef] [PubMed] [Green Version]
  80. Toczyłowska-Mamińska, R.; Szymona, K.; Król, P.; Gliniewicz, K.; Pielech-Przybylska, K.; Kloch, M.; Logan, B.E. Evolving Microbial Communities in Cellulose-Fed Microbial Fuel Cell. Energies 2018, 11, 124. [Google Scholar] [CrossRef]
Figure 1. Biochemical Methane Potential (BMP) curves for control reactor (N), reactors with granular activated carbon (GAC) (N0) and reactors with biofilm GAC developed before undertaking the BMP test (N10). (A) Daily methane production (B) Cumulative methane production (C) methane biogas percentage. Mean values ± SD from triplicate assays.
Energies 11 02101 g001
Figure 2. Bacteria phylum relative abundance. Phylum level with relative abundance lower than 1% were included in unclassified group. Sludge from control reactor (S), sludge from reactor with granular activated carbon (GAC) (S0), sludge from reactor with GAC biofilm developed before undertaking the BMP test (S10), GAC biofilm from reactor with GAC (C0), and GAC biofilm from reactor with GAC biofilm developed before undertaking the BMP test (C10).
Energies 11 02101 g002
Figure 3. Bacteria (A) and Archaea community structure (B) at genus level. Genus level with relative abundance lower than 1% were included in unclassified groups. Sludge from control reactor (S), sludge from reactor with granular activated carbon (GAC) (S0), sludge from reactor with GAC biofilm developed before undertaking the BMP test (S10), GAC biofilm from reactor with GAC (C0) and GAC biofilm from reactor with GAC biofilm developed before undertaking the BMP test (C10).
Energies 11 02101 g003
Figure 4. Heatmap of bacteria at genus level. Genus level with relative abundance lower than 1% were included in unclassified groups. Sludge from control reactor (S), sludge from reactor with granular activated carbon (GAC) (S0), sludge from reactor with GAC biofilm developed before undertaking the BMP test (S10), GAC biofilm from reactor with GAC (C0), and GAC biofilm from reactor with GAC biofilm developed before undertaking the BMP test (C10). Heatmap showing the 17 genera with significant difference of relative abundances among five samples. Heatmap is color-coded based scale (from red (−1) less abundance to green (+1) more abundance).
Energies 11 02101 g004
Figure 5. Scanning electron micrographs of the granular activated carbon surface (A), biofilm attached granular activated carbon (B), Geobacter communities attached to granular activated carbon (C), and Methanosaeta communities attached to granular activated carbon (D) after biochemical methane potential test (30 days).
Energies 11 02101 g005
Table 1. Reactors analysis after BMP test.
ParameterNN0N10
pH7.3 ± 0.117.2 ± 0.037.3 ± 0.02
Redox potential (mV)−223 ± 5−467 ± 1−471 ± 2
Acetic acid (mg·L−1)203 ± 12139 ± 9109 ± 8
Butyric acid (mg·L−1)91 ± 5
COD (mg·L−1)532 ± 10307 ± 21218 ± 14
Control reactor (N), Reactor with granular activated carbon (N0), reactor with GAC added 10 days before undertaking biochemical methane potential test.
Table 2. Nejayote characterization compared with other studies.
ParameterResultsOther Studies
pH10.26.3–11.6 [1,3,4,5,62,63]
COD (mg·L−1)15,433 ± 8263430–40,058 [1,4,5,63]
NH3-N (mg·L−1)4.65 ± 0.052 [1]
TN (mg·L−1)95.33 ± 3.7209–428 [1,5]
SO4−2 (mg·L−1)22.5 ± 2.513 [1]
PO4−3 (mg·L−1)58.75 ± 1.27.6–1321 [1,5]
TA (mgCaCO3·L−1)1799 ± 1165768 [4]
TSS (mg·L−1)2676 ± 5121810–8340 [3,4]
TS%1.22 ± 0.010.34–2.5 [1,4,63]
VS%0.84 ± 0.010.24–1.55 [1,63]
VS/TS0.69 ± 0.010.70 [63]
Table 3. Methane production increase with conductive materials.
Reactor Volume (mL)SubstrateConductive MaterialMethane Production Increase (%)Time (Days)Reference
120NejayoteGAC5430This study
120NejayoteGAC3430This study
250EthanolGraphene2512[38]
500Synthetic wastewaterGAC8643[17]
120Synthetic wastewaterMagnetite3220[56]
250GlucoseGraphene5115[36]
250Sludge treatment plantGAC1720[33]

