1. Introduction
The significant increase of wind turbine size and weight in the past decade has made it impossible to control them as they were 30 years ago. Wind turbine rotors of 140 m or even more are now a reality. Johnson et al. [
1] compiled some of the most important load control techniques that can be used in wind turbines to ensure a safe and optimal operation under a diversity of atmospheric environments. These include blades made of soft, flexible materials that change shape in response to wind speed or aerodynamic loads, aerodynamically-shaped rotating towers, flexible rotor systems with hinged blades, and other advanced control systems. The larger the size of a wind turbine, the higher the structural and fatigue loads, which affect the rotor and other key mechanisms of the turbine. A reduction of these severe loads can be achieved by developing novel load control techniques. Loads on wind turbines are normally divided into extreme structural loads and fatigue loads. Reducing these fatigue loads is a main goal, which can reduce the maintenance costs and improve the reliability of wind turbines (see Baek et al. [
2]).
Several flow control systems were developed in the past decades. Most of them were created for aeronautical issues, and this was their first research field and application. Researchers are currently working to optimize and introduce this type of device in wind turbines [
3]. Wood [
4] developed a four-layer scheme that allows classification of the diverse concepts. As explained in Aramendia et al. [
5,
6], they can be classified as actives or passives devices depending on their operating principle. To alleviate loads successfully, it is indispensable that the device to be able to reduce the generated lift. The studies presented by Johnson et al. [
7] and Frederick et al. [
8] provide different ways of using this type of device to mitigate turbine loads.
Gurney flaps (GFs) were originally used for lift enhancement in the field of aeronautics [
9,
10]. The advantages and limitations of these devices have been acutely documented [
9,
11]. The first application was in racing cars, as small vertical strips attached to the trailing edge (TE) of the wing. The GF was first considered by Liebeck [
12] and improved by Jeffrey et al. [
13,
14]. Tang and Dowell [
15] compared the experimental loading of a NACA 0012 airfoil with both static and oscillating trailing-edge GFs using an incompressible Navier–Stokes solver. A movable GF on a NACA 4412 airfoil was studied by Camocardi et al. [
16], where the flow pattern behavior in the near wake of the airfoil was investigated. Lee [
17] also studied the impact of GFs of different sizes and perforations on the growth and development of the tip vortex generated by a NACA 0012 airfoil using particle image velocimetry (PIV). Recently, Cole et al. [
18] studied the effect of GFs of different heights, and the results indicated that the airfoil shape is decisive in the aerodynamic performance of the airfoil with GFs. Recently, researchers have returned to GFs to study prospective benefits in rotorcrafts and helicopters applications [
13,
14,
15]. Liu et al. [
19] and Min et al. [
20] used microflaps for vibration reduction in helicopter rotors. Additionally, the influence of GFs on the power output performance of a 5 MW horizontal axis wind turbine was investigated by Fernandez-Gamiz et al. [
21]. Increments in the average power output of 10.4% and 3.5% were found at two different wind velocity realizations. GFs appear to be one of most appropriate devices to improve reliability and/or power output in large wind turbines.
Microtabs (MTs) are defined as small tabs situated near the trailing edge (TE) of an airfoil, and project perpendicular to the surface of the airfoil by a few percent of the chord length (1–2% of
c) corresponding to the boundary layer thickness. These MTs jet the flow in the boundary layer away from the airfoil surface, bringing a recirculation zone at the rear of the tab and affecting the aerodynamic behavior, moving the flow separation zone and consequently changing the lift. The lift can be enhanced by deploying the MT on the pressure side of the airfoil; on the contrary the lift is reduced if the MT is deployed on the suction side. MT concept and flow around a trailing-edge region during tab pressure-side deployment can be found in Chow et al. [
22]. Van Dam [
23] carried out multiple studies and investigations into this topic, including computational fluid dynamics (CFD) simulations and wind tunnel experiments, in order to determine their optimal distribution height and location. As in previous studies, the results provided that the best place to situate the lower surface tab with respect to lift and drag was around 0.95
c with a height of 0.01
c and around 0.90
c for the upper surface tab. MTs present some attractive features for wind turbine control applications, such as small size, design simplicity, and low set-up cost [
24]. They can also be installed without significant changes in the actual techniques to manufacture the profiles. Tsai et al. [
25] recently presented an innovative design to improve the MT performance. This new MT system is based on a four-bar linkage, providing an increase of the maximum tab height in relation to the existing MT system and better stability due to the four-bar linkage mechanism. Furthermore, blade element momentum (BEM)-based computations were performed in the study of Fernandez-Gamiz et al. [
26] to investigate the effect of the MTs on the National Renewable Energy Laboratory (NREL) 5 MW wind turbine power output with different wind speed realizations. The results showed a considerable increase in the average wind turbine power due to the implementation of the MTs. In the academia–industry joint study of Hwangbo et al. [
27], two different methods were developed to estimate and quantify the effect of some passive flow control devices on a multi-megawatt wind turbine power production. Lee et al. [
28] also presented an innovative kernel plus method to quantify a turbine’s upgrade. A directory of generalizable methods to investigate wind turbine power curve upgrades in real environments through operational data was presented in Astolfi et al. [
29].
Model reduction methods are now basic numerical tools in the treatment of large-scale parametric problems appearing in real-world problems (see Azaïez et al. [
30,
31] and references therein, Pinnau et al. [
32]). They are applied with success, for instance, in signal processing, the analysis of random data, in the solution of parametric partial differential equations and control problems, among others. In signal processing, Karhunen–Loève expansion (KLE) provides a reliable procedure for a low-dimensional representation of spatiotemporal signals. Different research communities use different terminologies for the KLE. It is named singular value decomposition (SVD) in linear algebra, principal components analysis (PCA) in statistics and data analysis, and is referred to as proper orthogonal decomposition (POD) in mechanical computation. These techniques allow a large reduction of computational costs, thus making affordable the solution of many parametric problems of practical interest, which would otherwise be out of reach. From a mathematical point of view, all three techniques fit into a common theoretical framework, provided by the KLE expansion. We will use the name “POD”, as we are within the framework of mechanical computation. In this paper, apply POD to the analysis of the behavior of passive flow control devices on wind turbines.
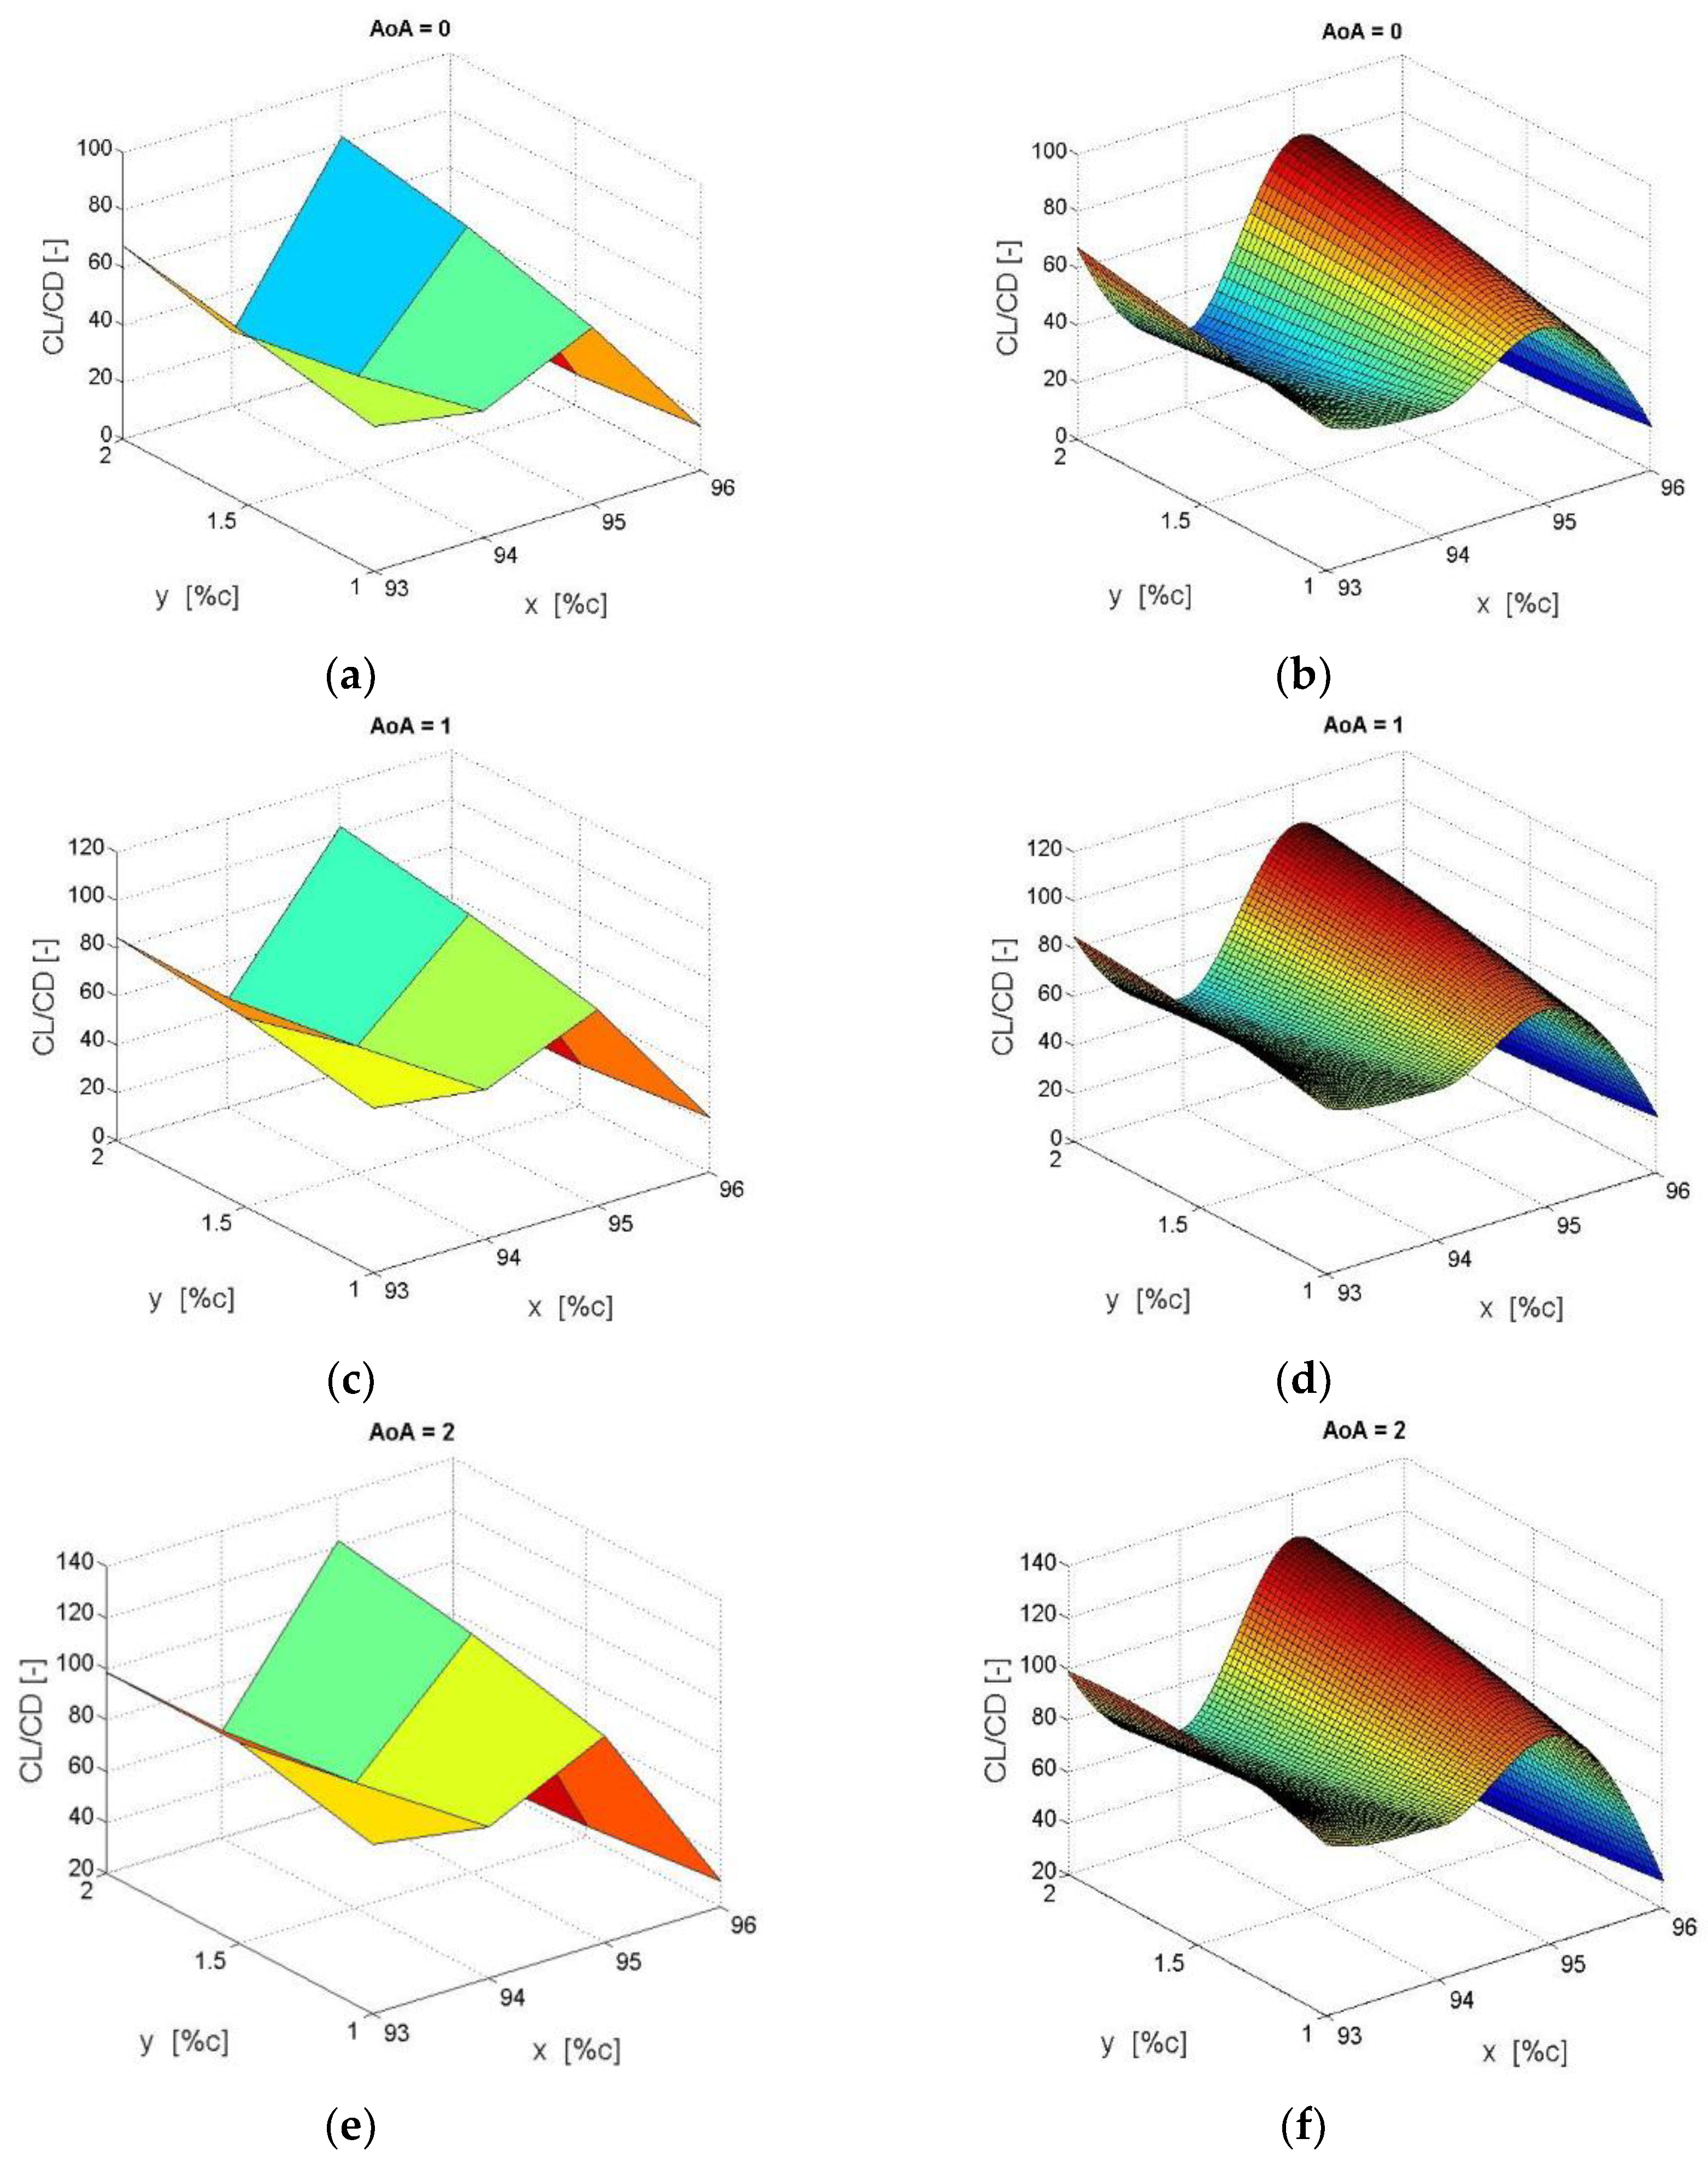
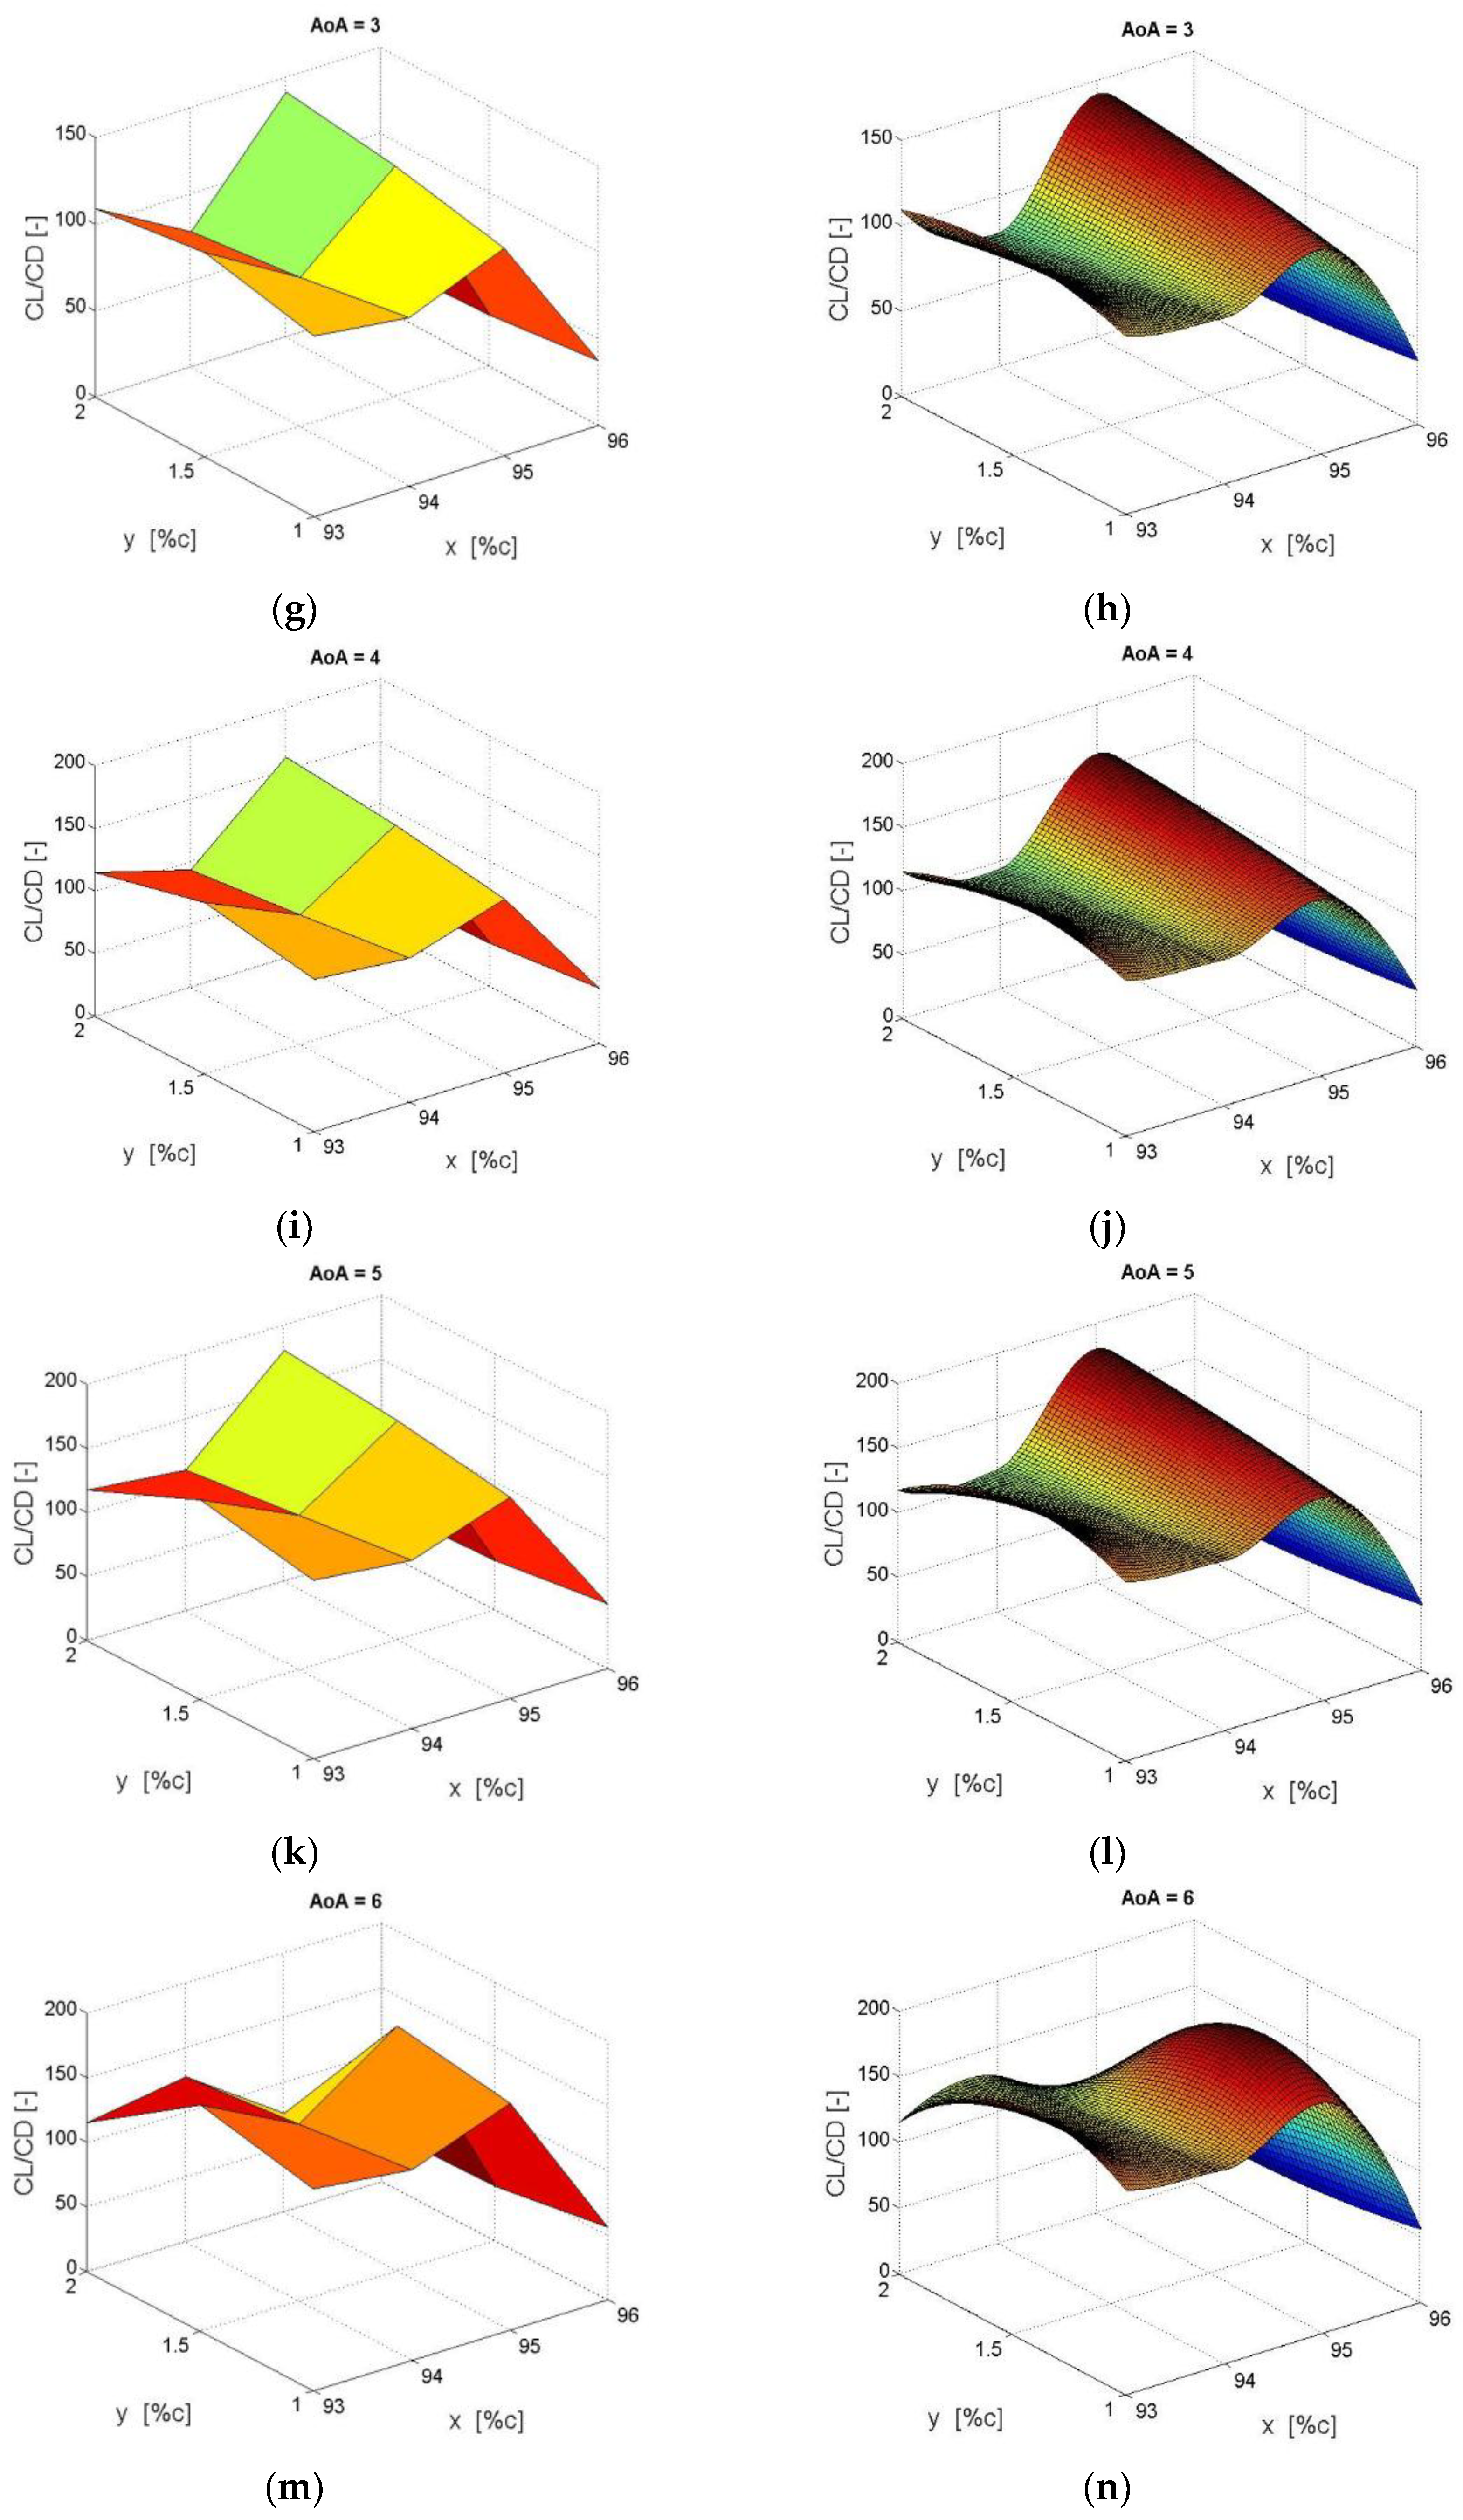
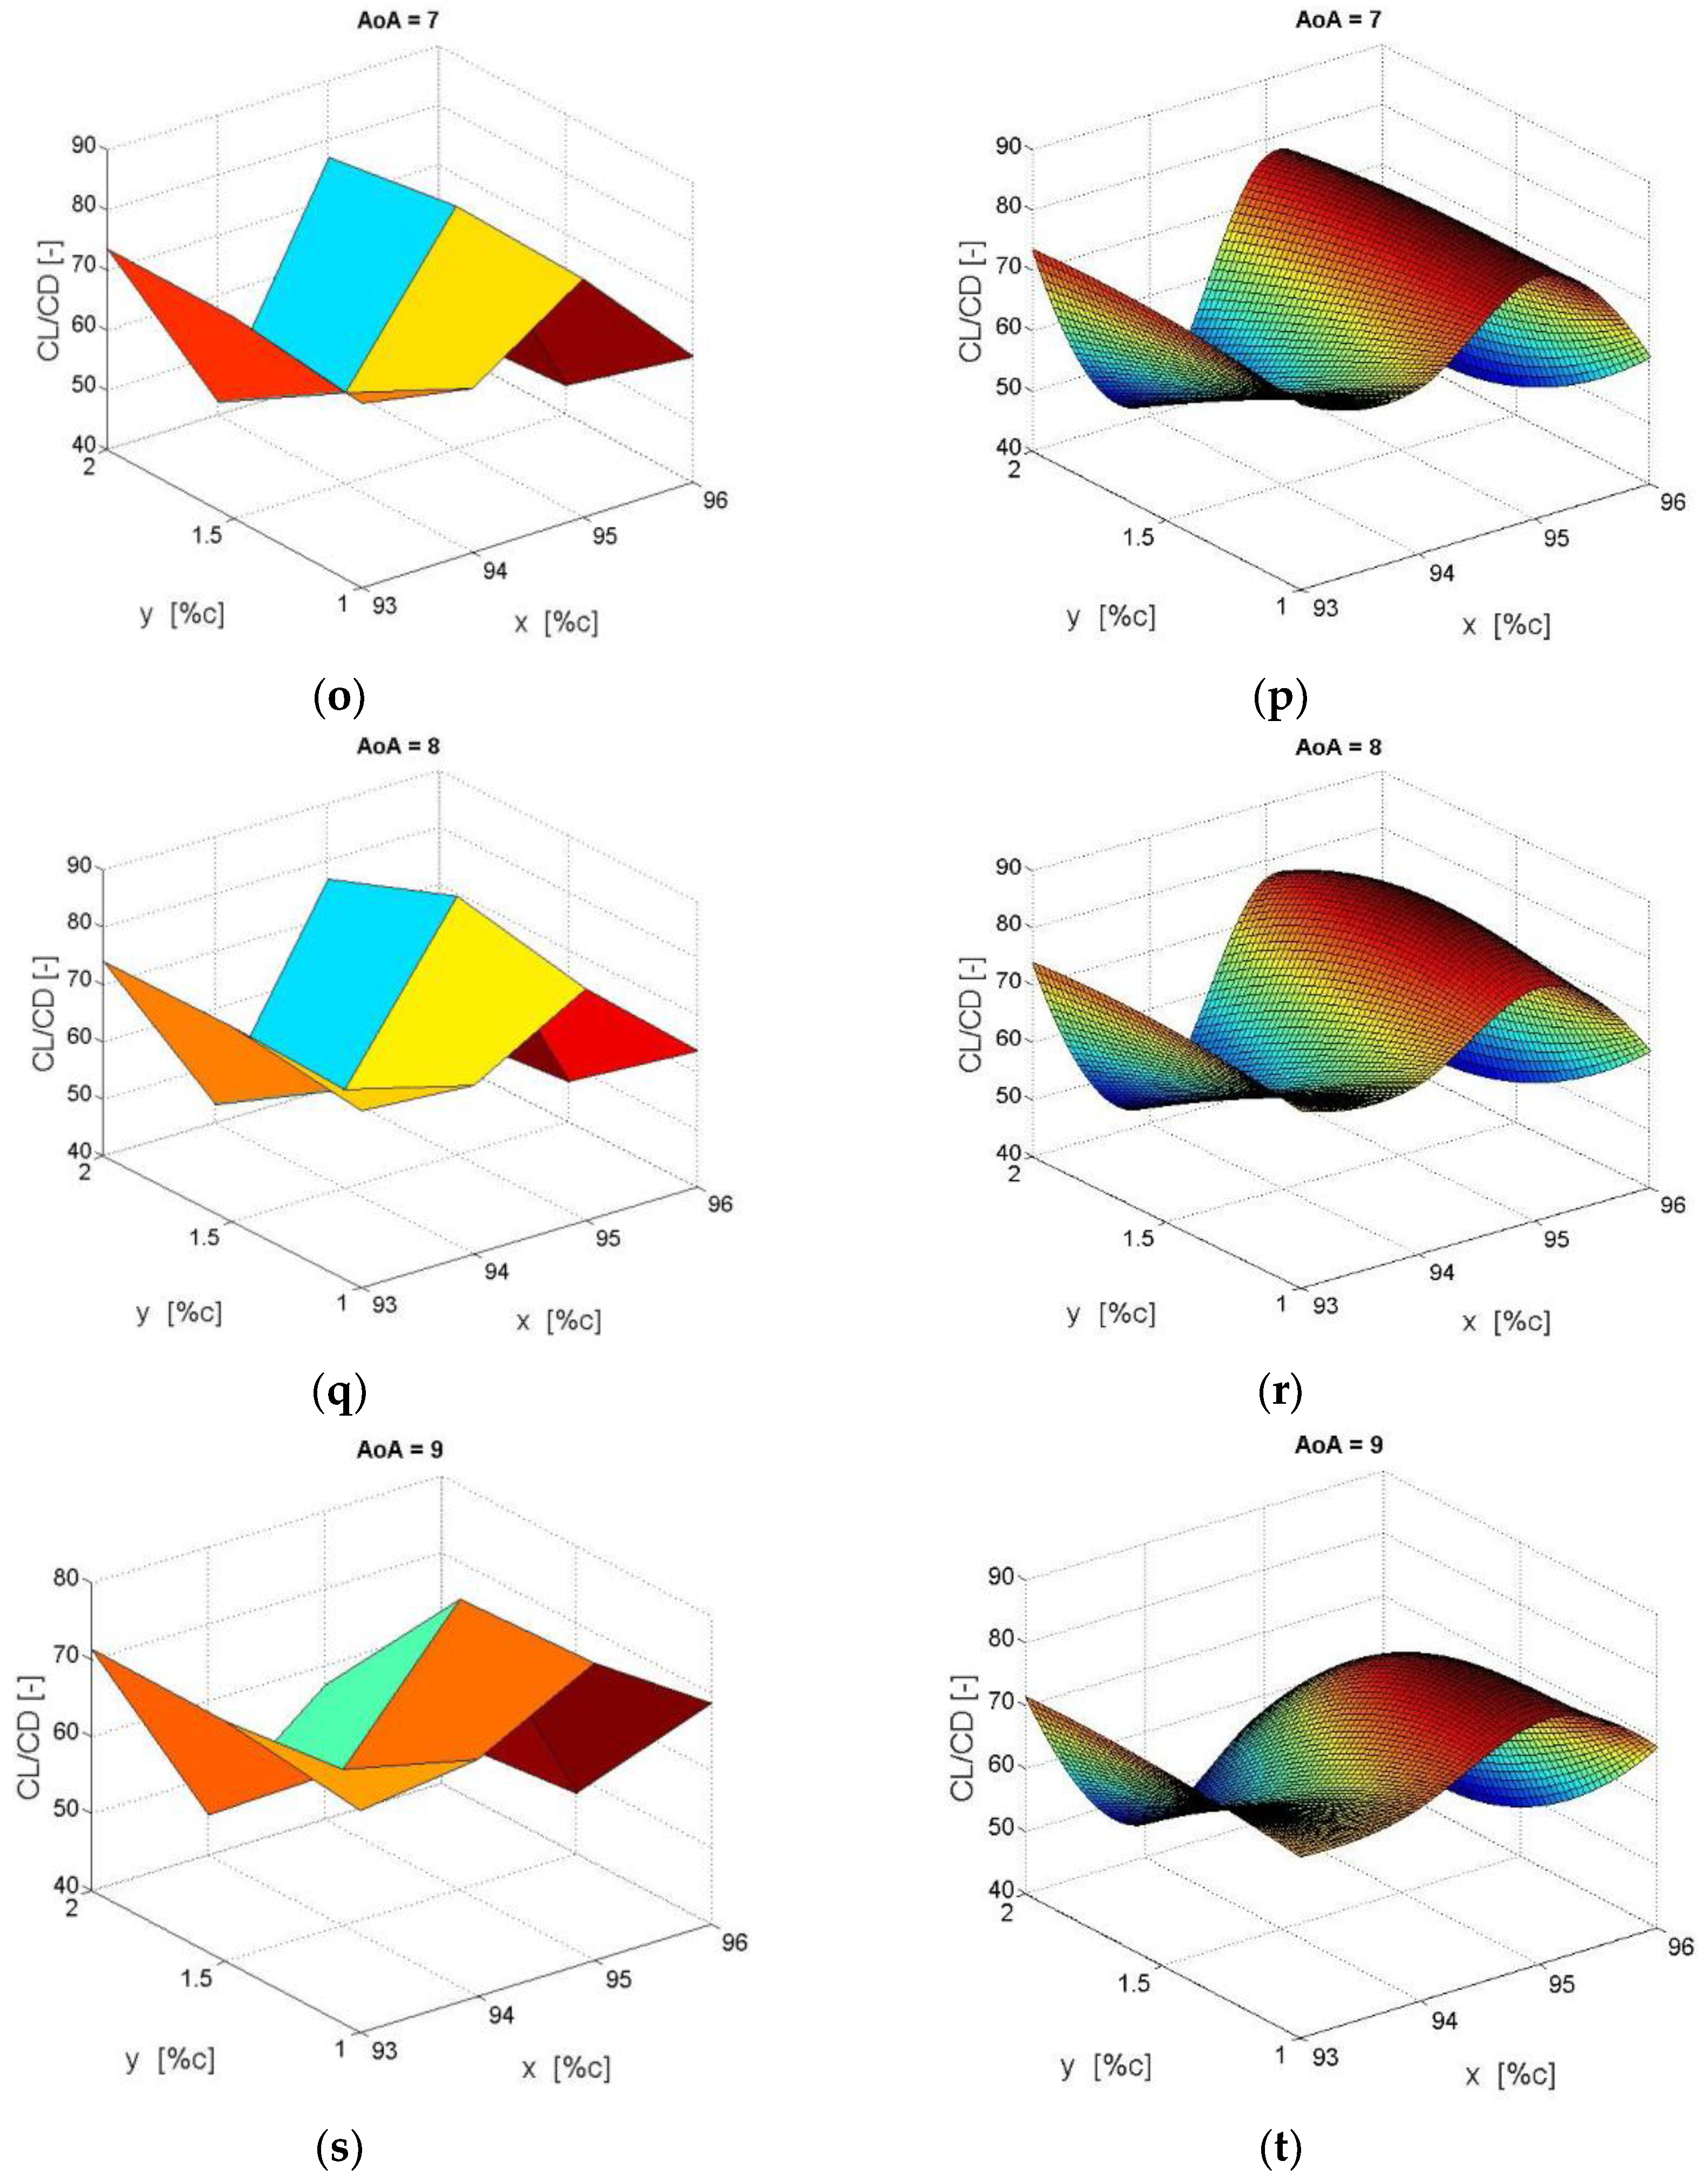
As previously described, we made different simulations by means of CFD methods in which we computed the lift-to-drag ratio for several angles of attack and geometrical design parameters of GF and MTs. Following this procedure, we constructed a POD approximation of the function that transforms the geometrical design parameters of either GFs or MTs (understood as independent variables in mathematical terms) on the lift-to-drag ratio (understood as a dependent variable). This function will allow computation of the lift-to-drag ratio for any values of the independent variables, in particular those out from the computational grid. This computation can be carried out very quickly, as it does not need to use CFD simulations. However the usual POD analysis only applies to functions that transform a single independent variable in a dependent variable. Instead, we use an extension of POD to multi-parametric functions, called recursive POD. The mathematical development of this method as well as some applications can be found in References [
30,
31,
32,
33]. Its application to the computation of lift-to-drag ratios considered here is described in detail in
Section 3.
The purpose of constructing the considered POD approximation was to validate its application to accurately computing the lift-to-drag ratio, and more specifically its maximum, in view of some possible applications of interest. For instance, it could easily be implemented to take advantage of active flow control strategies, which agrees with the study of Yen et al. [
34], which presented MTs as high-potential devices for active load control.
The paper is structured as follows: In
Section 2 we state the numerical setup for the computation of the lift-to-drag ratio of the GFs and MTs considered. In
Section 3 we describe the Recursive POD method and its application to the computation of lift-to-drag ratios.
Section 4 is devoted to presenting the results (both the CFD computations and the validation of the POD approximation), and finally
Section 5 presents some relevant conclusions.
3. POD Method
The POD method basically consists of the representation of data with a space of very low dimension. This method was initially proposed by Lumley in 1970 in the context of turbulence. The base of functions that comprise the method has low dimension, and by its characteristics it is possible to reconstruct an approximation of the solution of the model with a considerable reduction of computational resources.
The POD method objectively extracts the optimal base patterns of parametric functions from the experimental data to describe the characteristics of that data set. The set of basic functions (commonly named “POD modes”) is optimal insofar as that finite number of functions captures most of the information or gives the best representation of the system among all spaces of the same dimension. In mathematical terms, the “best representation” property means that the mean quadratic error (with respect to the parameter) between the function to be approximated and the approximation provided by the POD space is the smallest possible among all spaces of the same dimension.
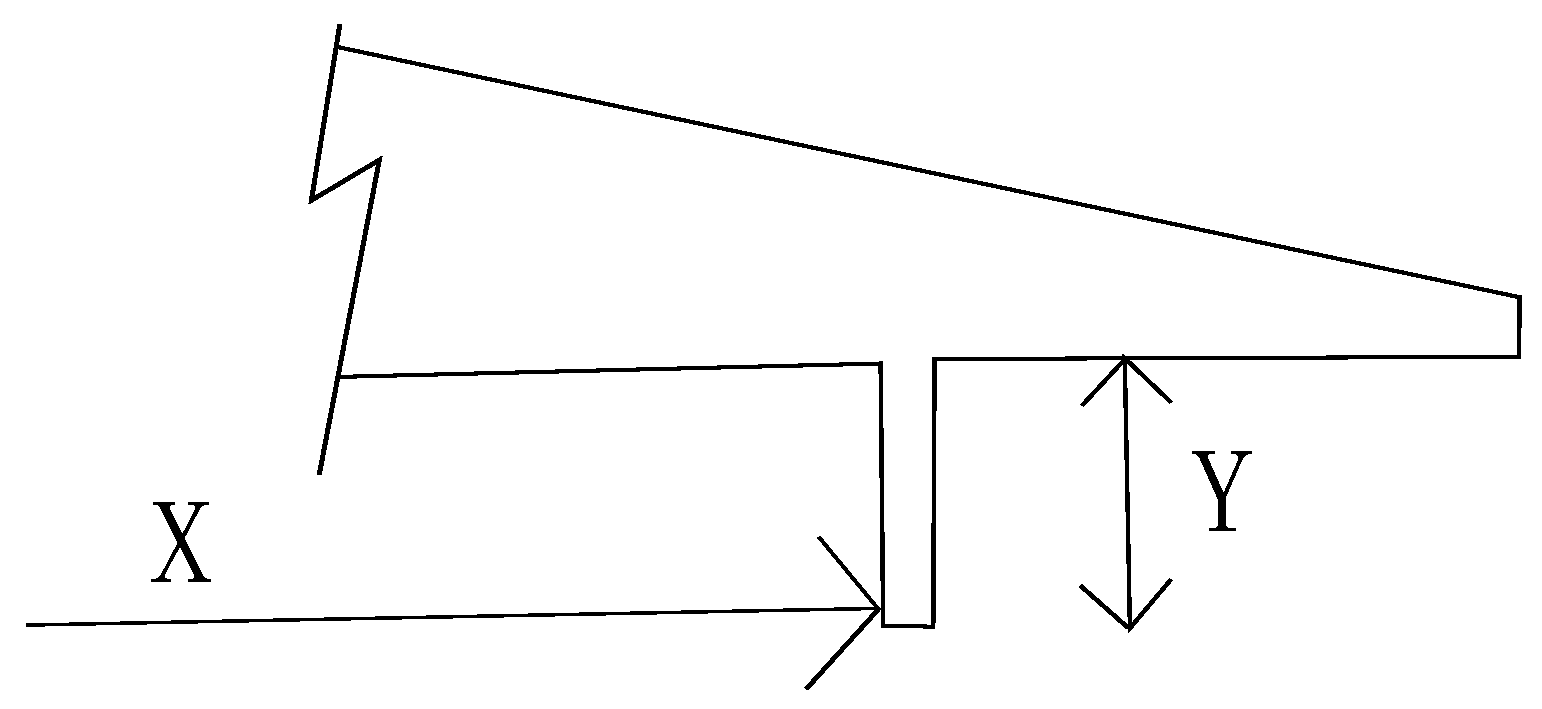
On the other hand the POD method has some difficulties in determining the basic functions when the data are very large in quantity. To solve this problem, Sirovich in 1987 proposed the method of snapshots, which consists of using as data the values of the function to be approximated, computed for a set of parameters located in a grid. Based on the snapshots, the set of orthogonal functions that capture most of the information is obtained, whenever the parameter grid is small enough. In the case of microtabs, the function we want to approximate is the lift-to-drag ratio, which depends on three parameters, as described in
Section 2.2: the angle of attack
, the location of the MT from the airfoil leading edge represented by
and the device height
. In the present study, since we have three parameters to determine the basic functions, we applied the POD method recursively. To describe the recursive POD approximation to this function
assume that the parameters
,
, and
respectively vary in intervals
A = [
],
X = [
], and
Y = [
]. Denote by
the family of functions of integrable square defined in a set
. The Karhunen–Loève theory ensures that
admits a representation of the form.
where the series is convergent in
and the sets of modes
and
are respectively orthonormal in
and in
Moreover, the singular values
are non-negative and converge to zero.
We next applied the POD expansion to each mode
. There are two sets of modes
and
which are respectively orthonormal in
and
, such that
admits the representation:
where the expansion is convergent in
. Additionally, the singular values
are non-negative and decrease to zero. Then, the function
admits the expansion:
where the sum is convergent in
The feasible recursive POD approximation of the function
consists of truncating the series (3) and (5) to a finite number of summands (e.g.,
M and
K). Further, as the function
can be computed only for some values of
,
, and
,
the recursive POD in principle provides an approximation of
at these values:
Then, a fast 1D interpolation procedure (e.g., by spline functions) is used to compute for different values of in . The source of errors in the recursive POD approximation is not only the truncation of series (6), but also this interpolation procedure. Then, the interpolation grid size should be small enough to ensure good error levels. Note that the interpolation grid is actually the parameter grid for which the values are computed, and a decrease in grid size leads to a larger number of CFD computations.
The computation of the POD expansion for bi-variate functions (e.g., for function
at regularly spaced grid nodes
and
,
) is as follows: The vectors
and
respectively are the K
min{
P,Q} first right and left eigenvectors of the singular value decomposition of the matrix:
while the coefficients
are the corresponding singular values.
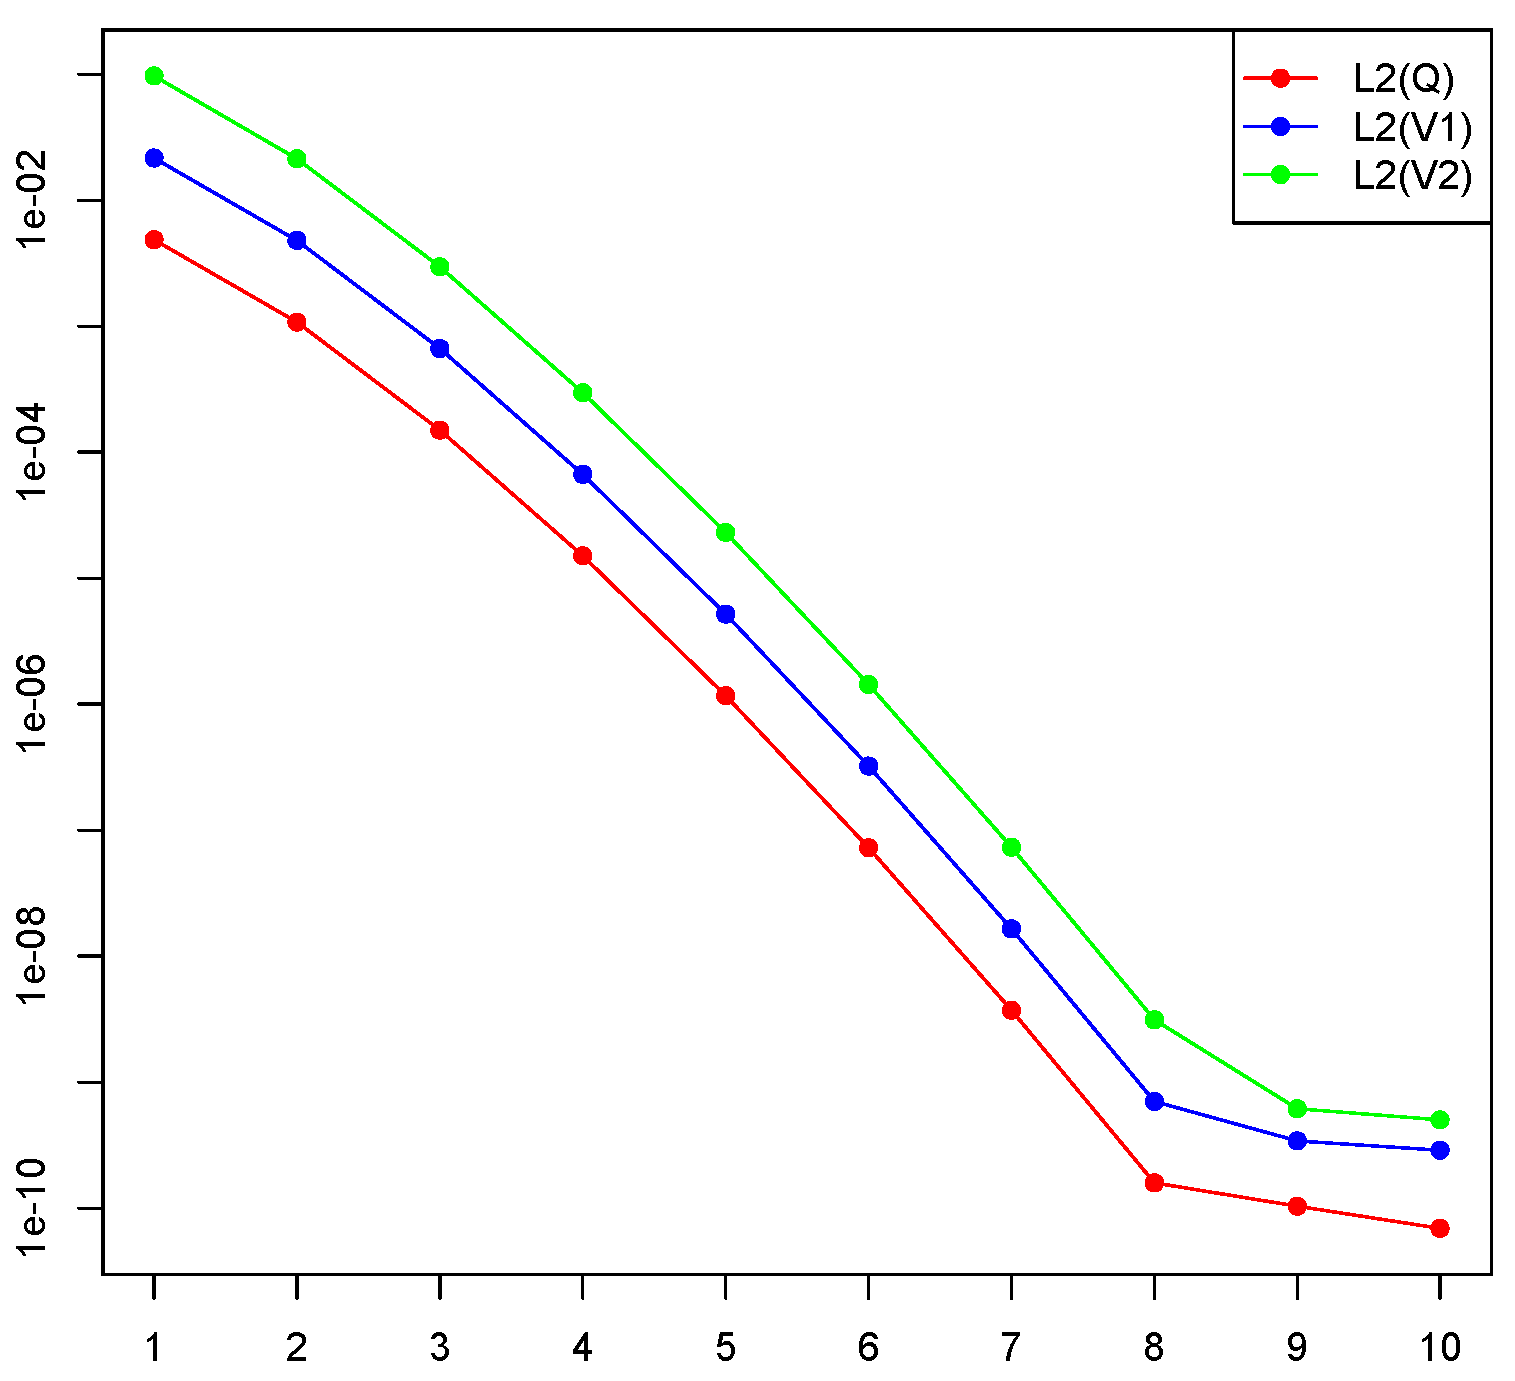
Figure 5 illustrates the error that is committed in the method for different norms to approximate a smooth function of two variables, reported in Azaïez et al. [
31]. On the
x-axis we have the total number of modes M, and on the
y-axis we have the error that is committed in logarithmic coordinates. We can observe that very few modes provided an excellent approximation of our function. The results presented in
Section 4 were achieved with seven modes.
With this development we can calculate the value of the lift for any value of the parameters, within the intervals that mark the CFD data. There is a huge computational advantage because we do not have to solve the CFD problem for those parameters. Instead we get an approximation with very few functions, which contain all the relevant information.
The computation time to calculate the lift-to-drag ratio value using the OpenFOAM CFD code for a set of parameters was approximately 52 min on a Workstation with 8 cores and 32 GB of RAM, while computing the approximation by POD took 2 s on a MacBook Pro with 3 GHz Intel Core i7. Another advantage of this method is that we can very easily design an algorithm that allows us to calculate the optimal parameters.
5. Conclusions
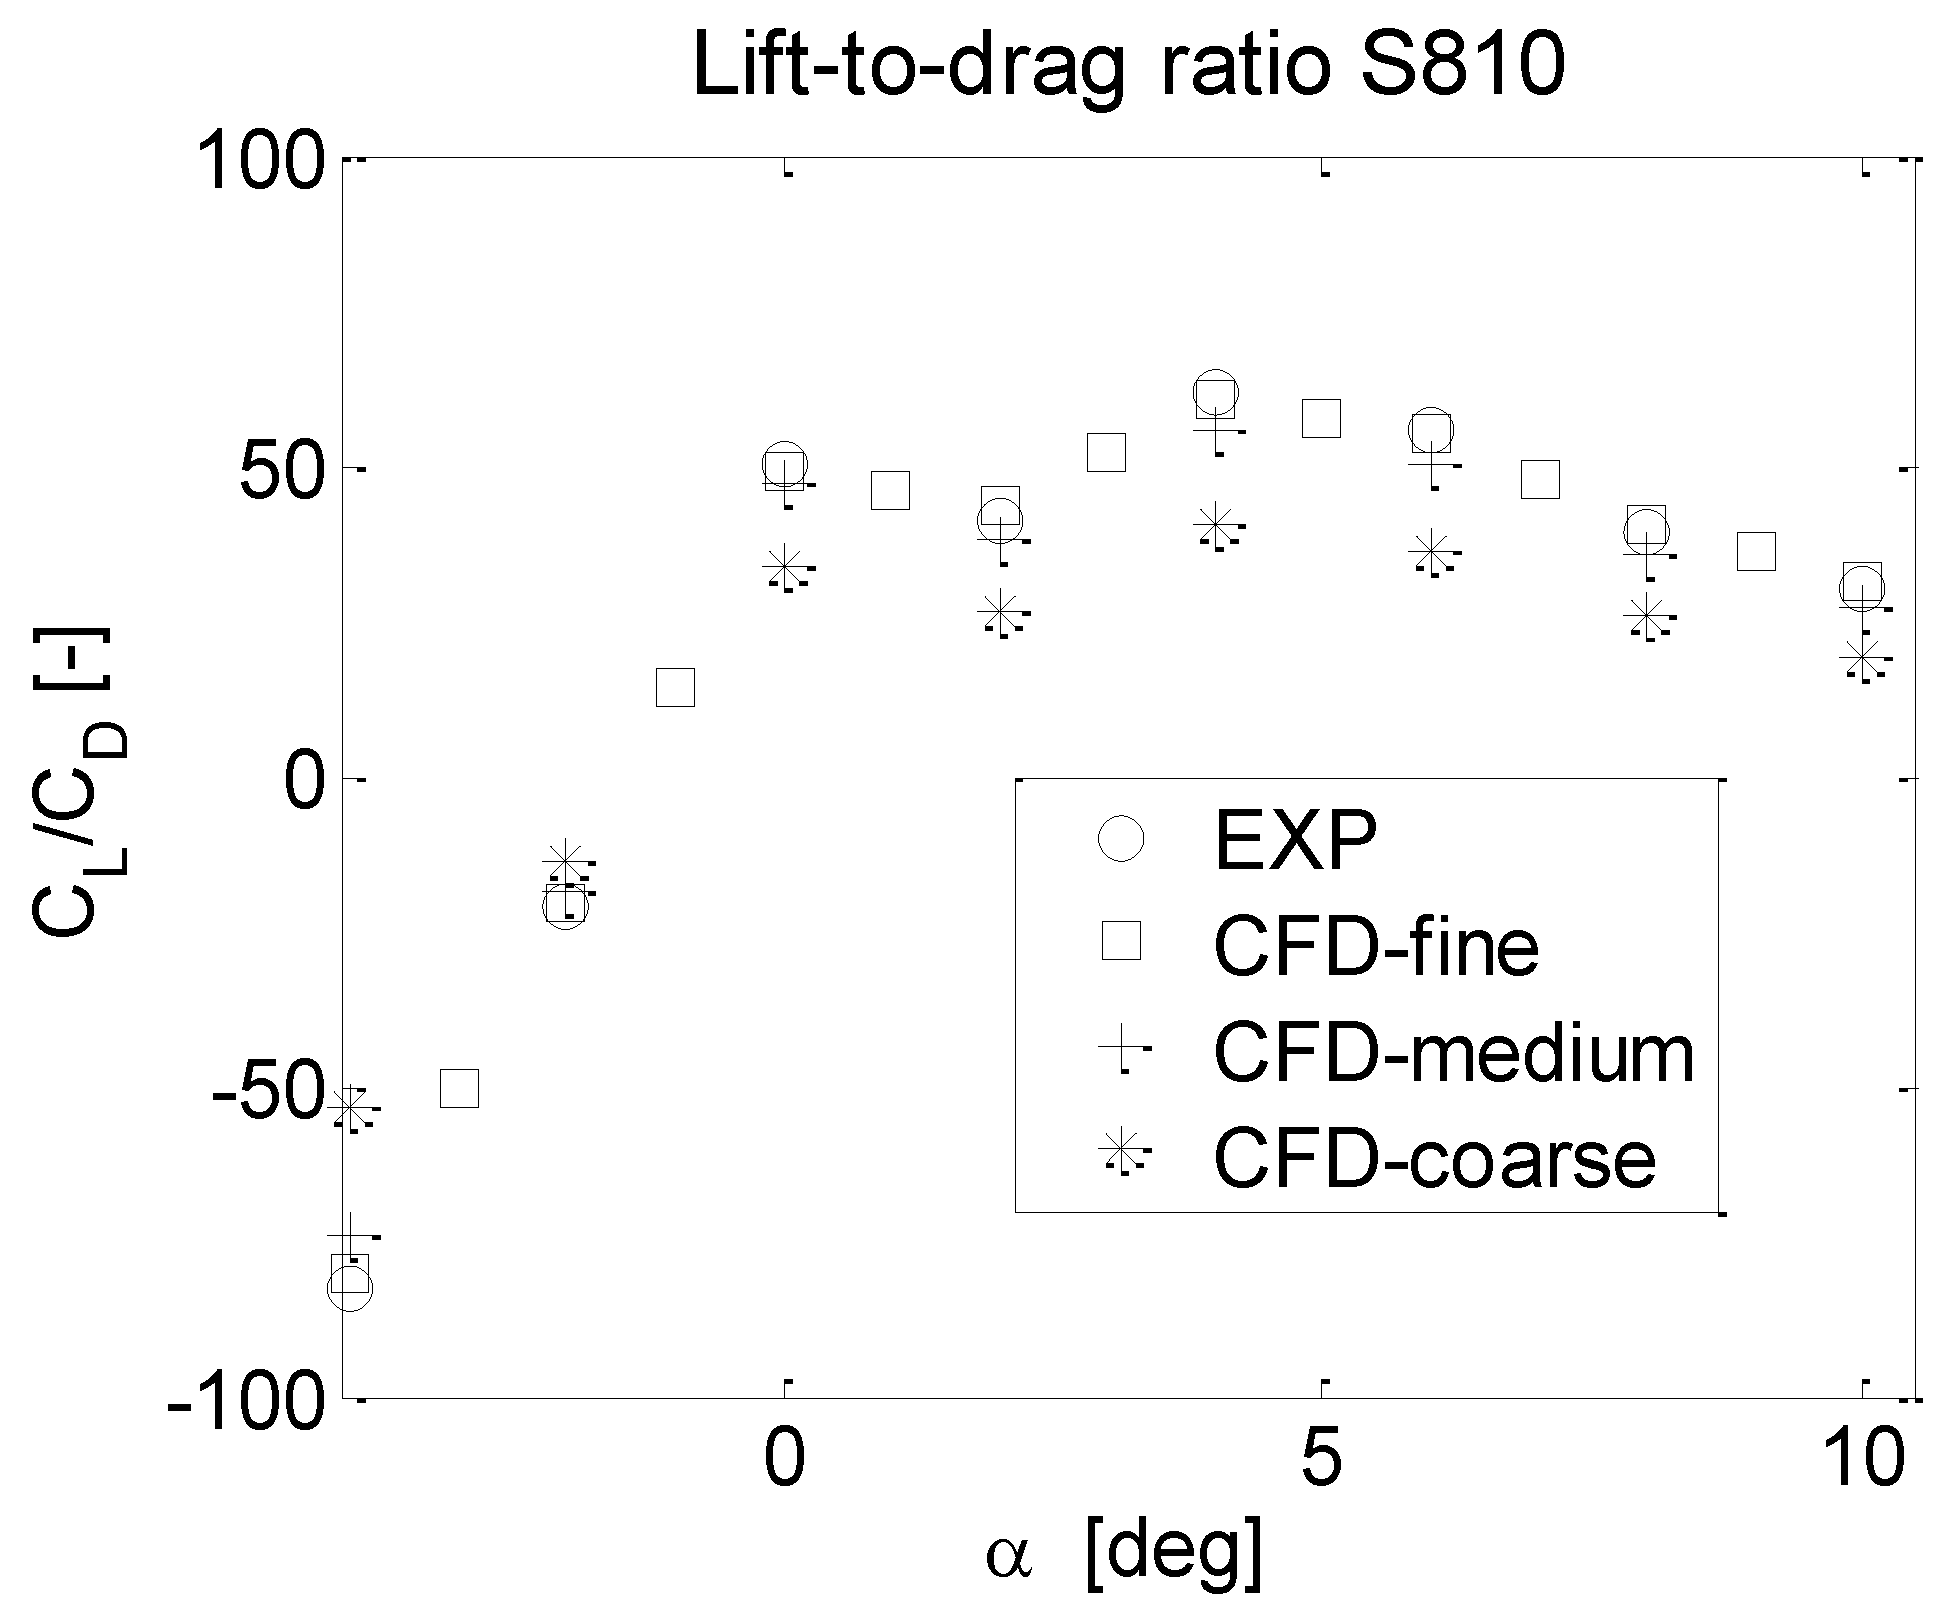
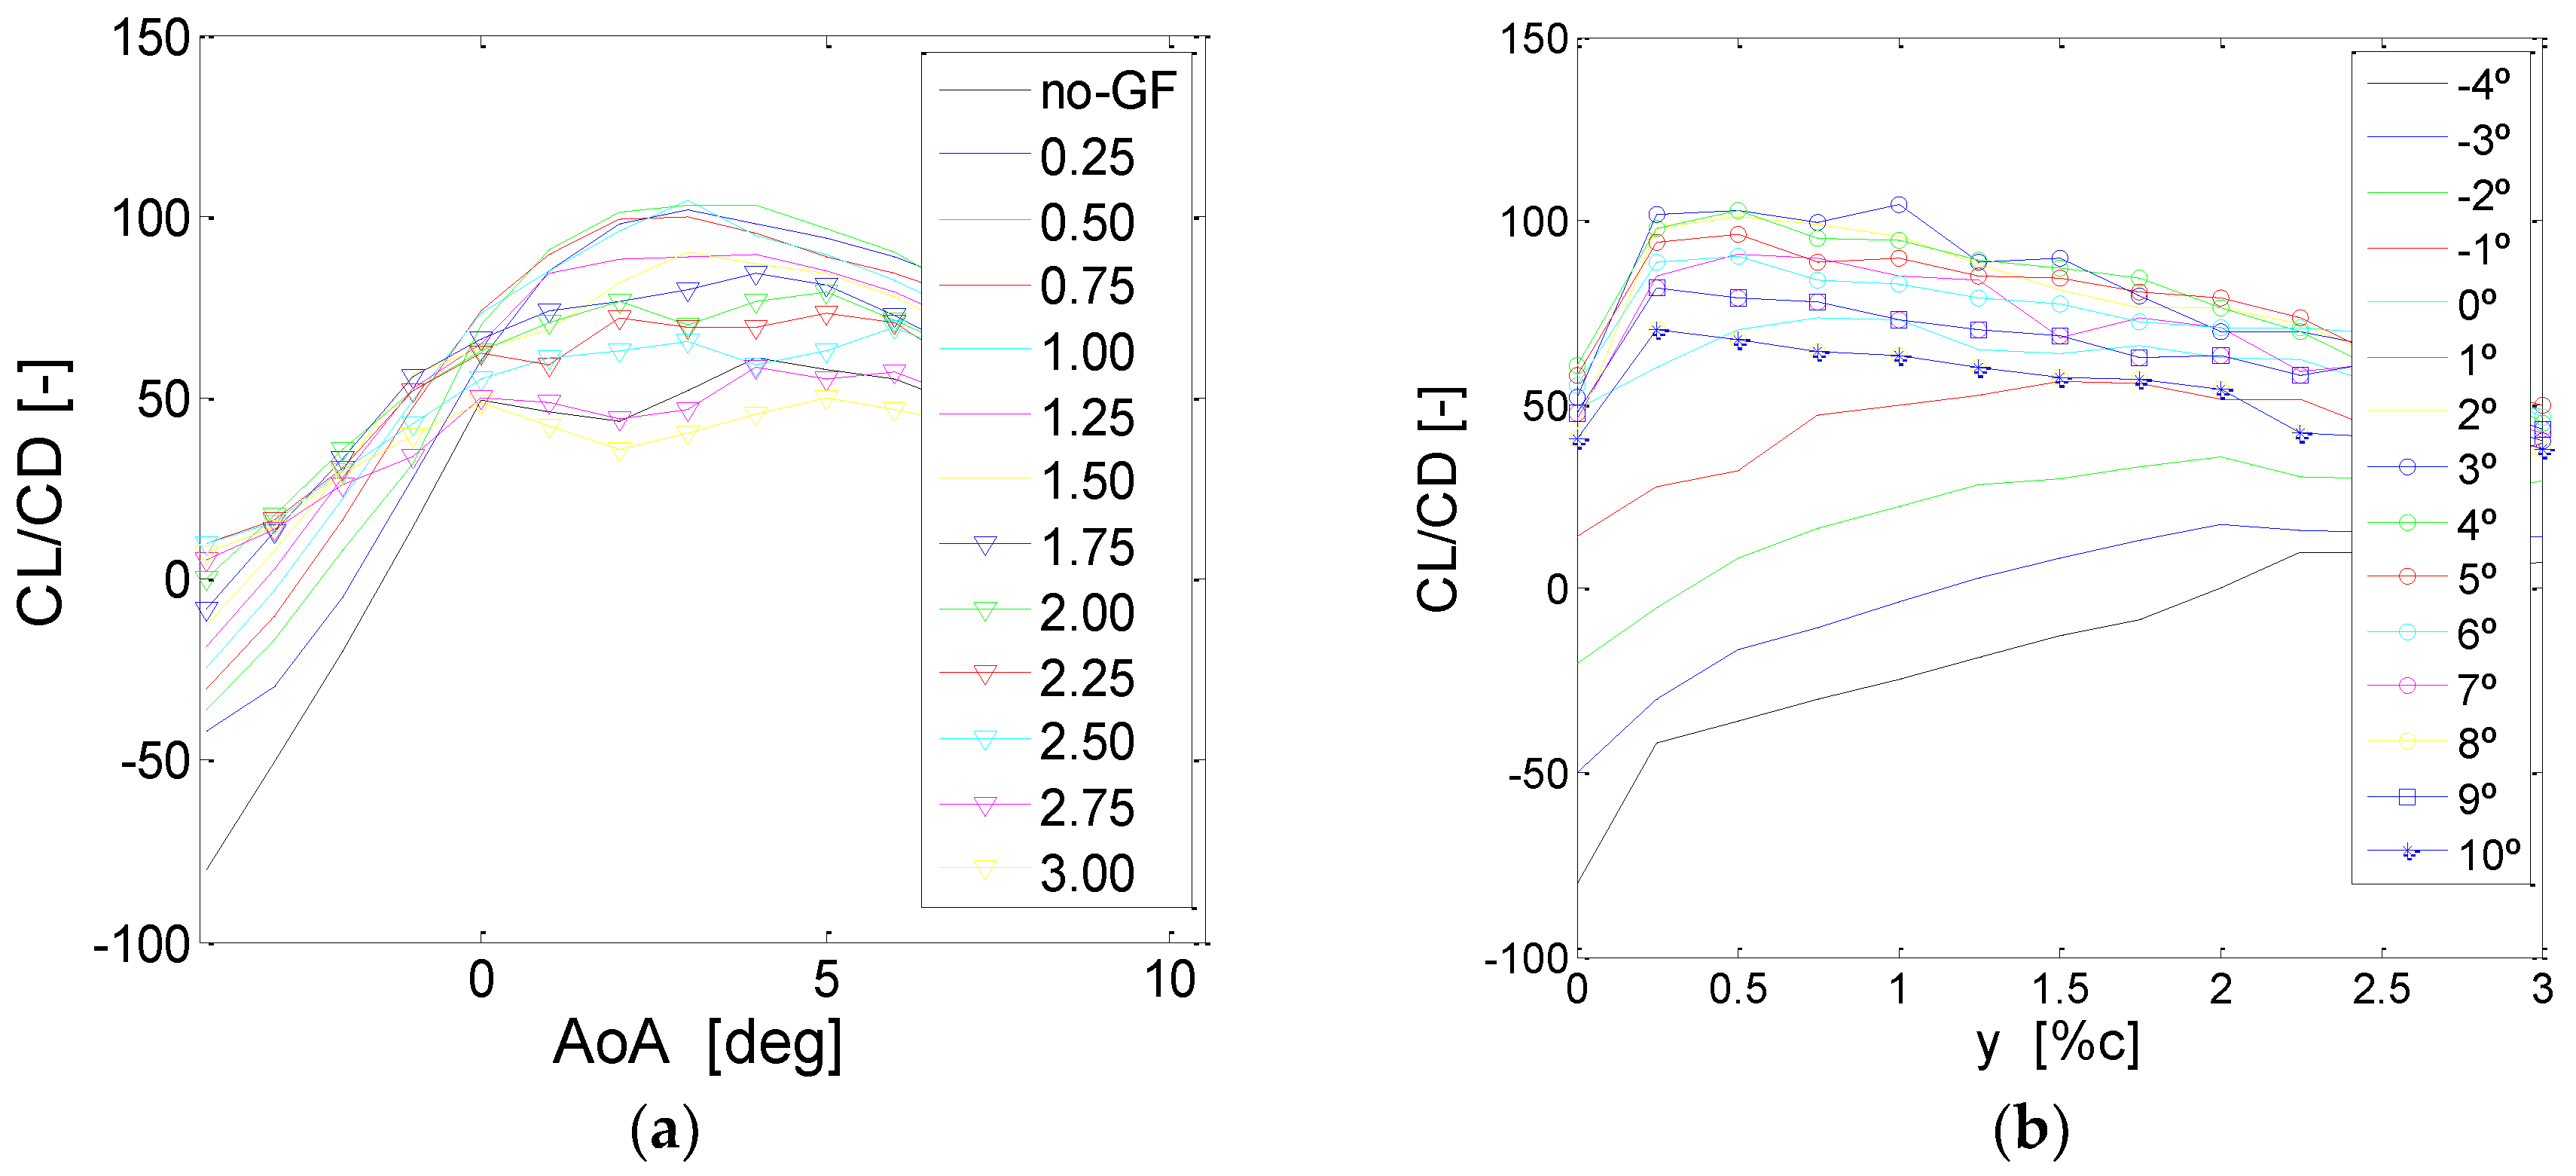
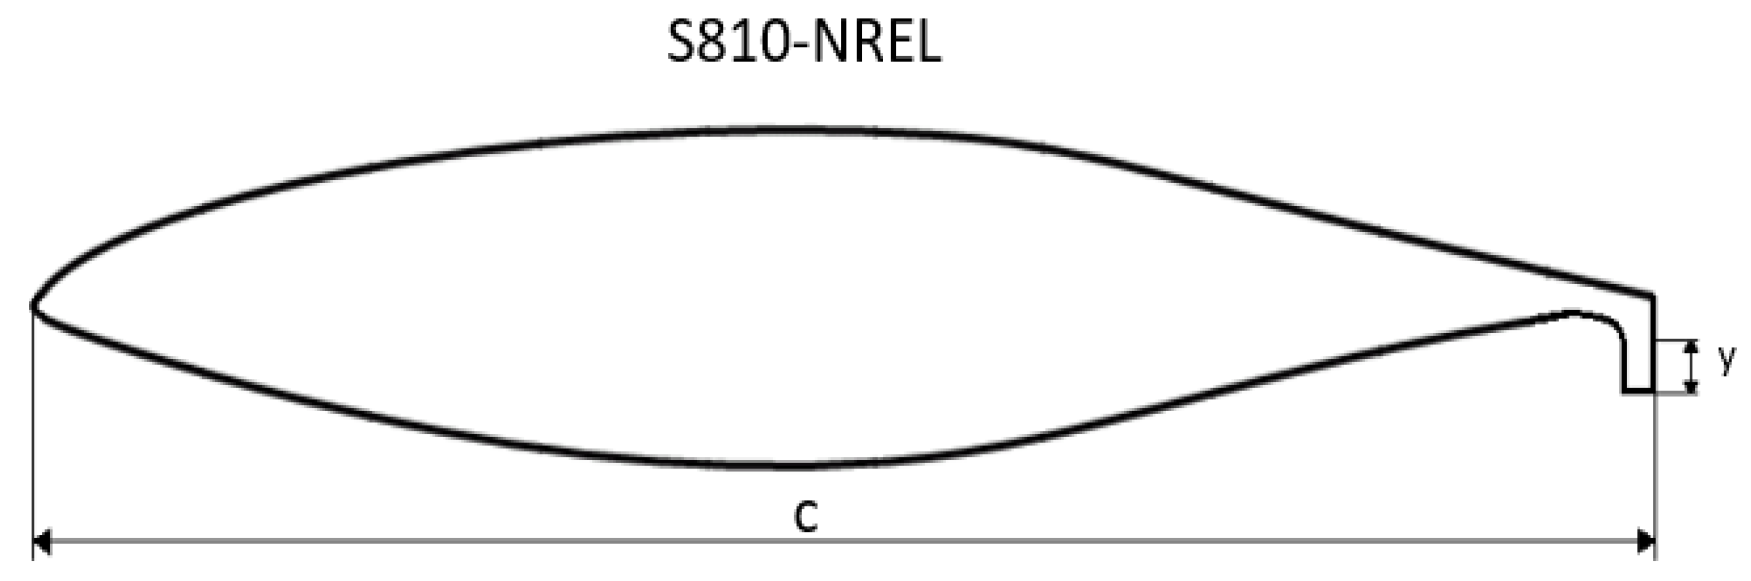
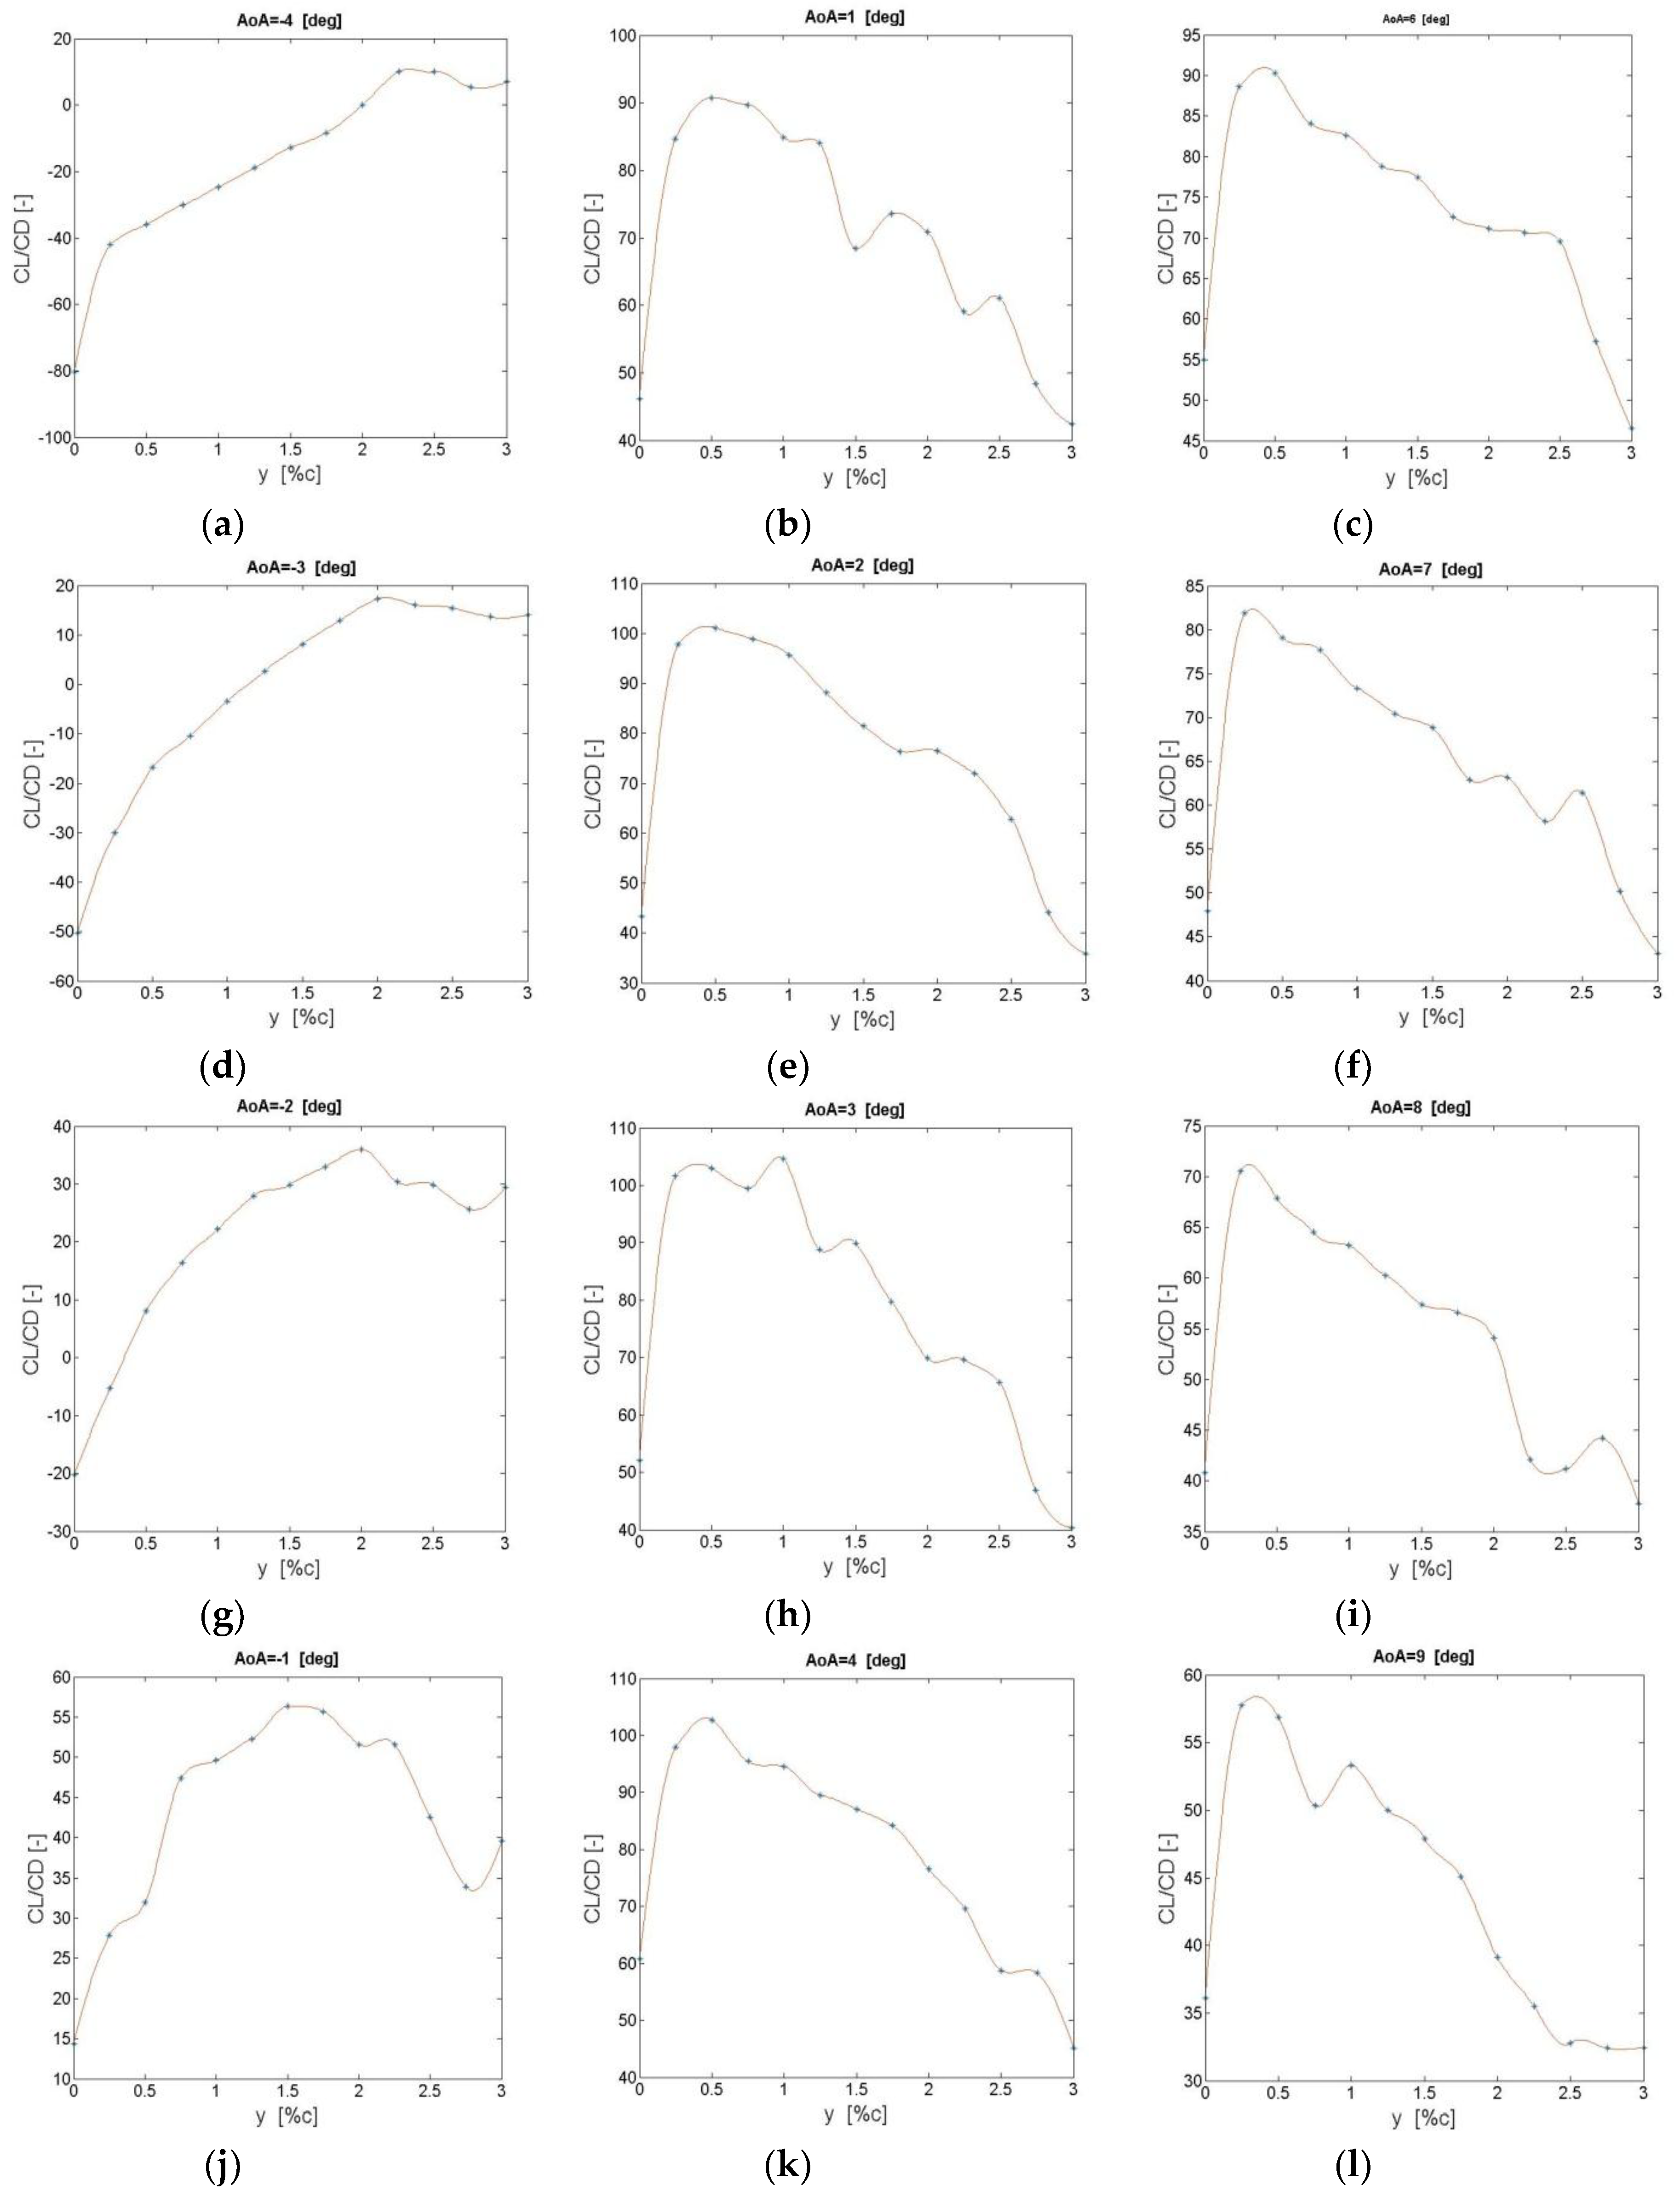
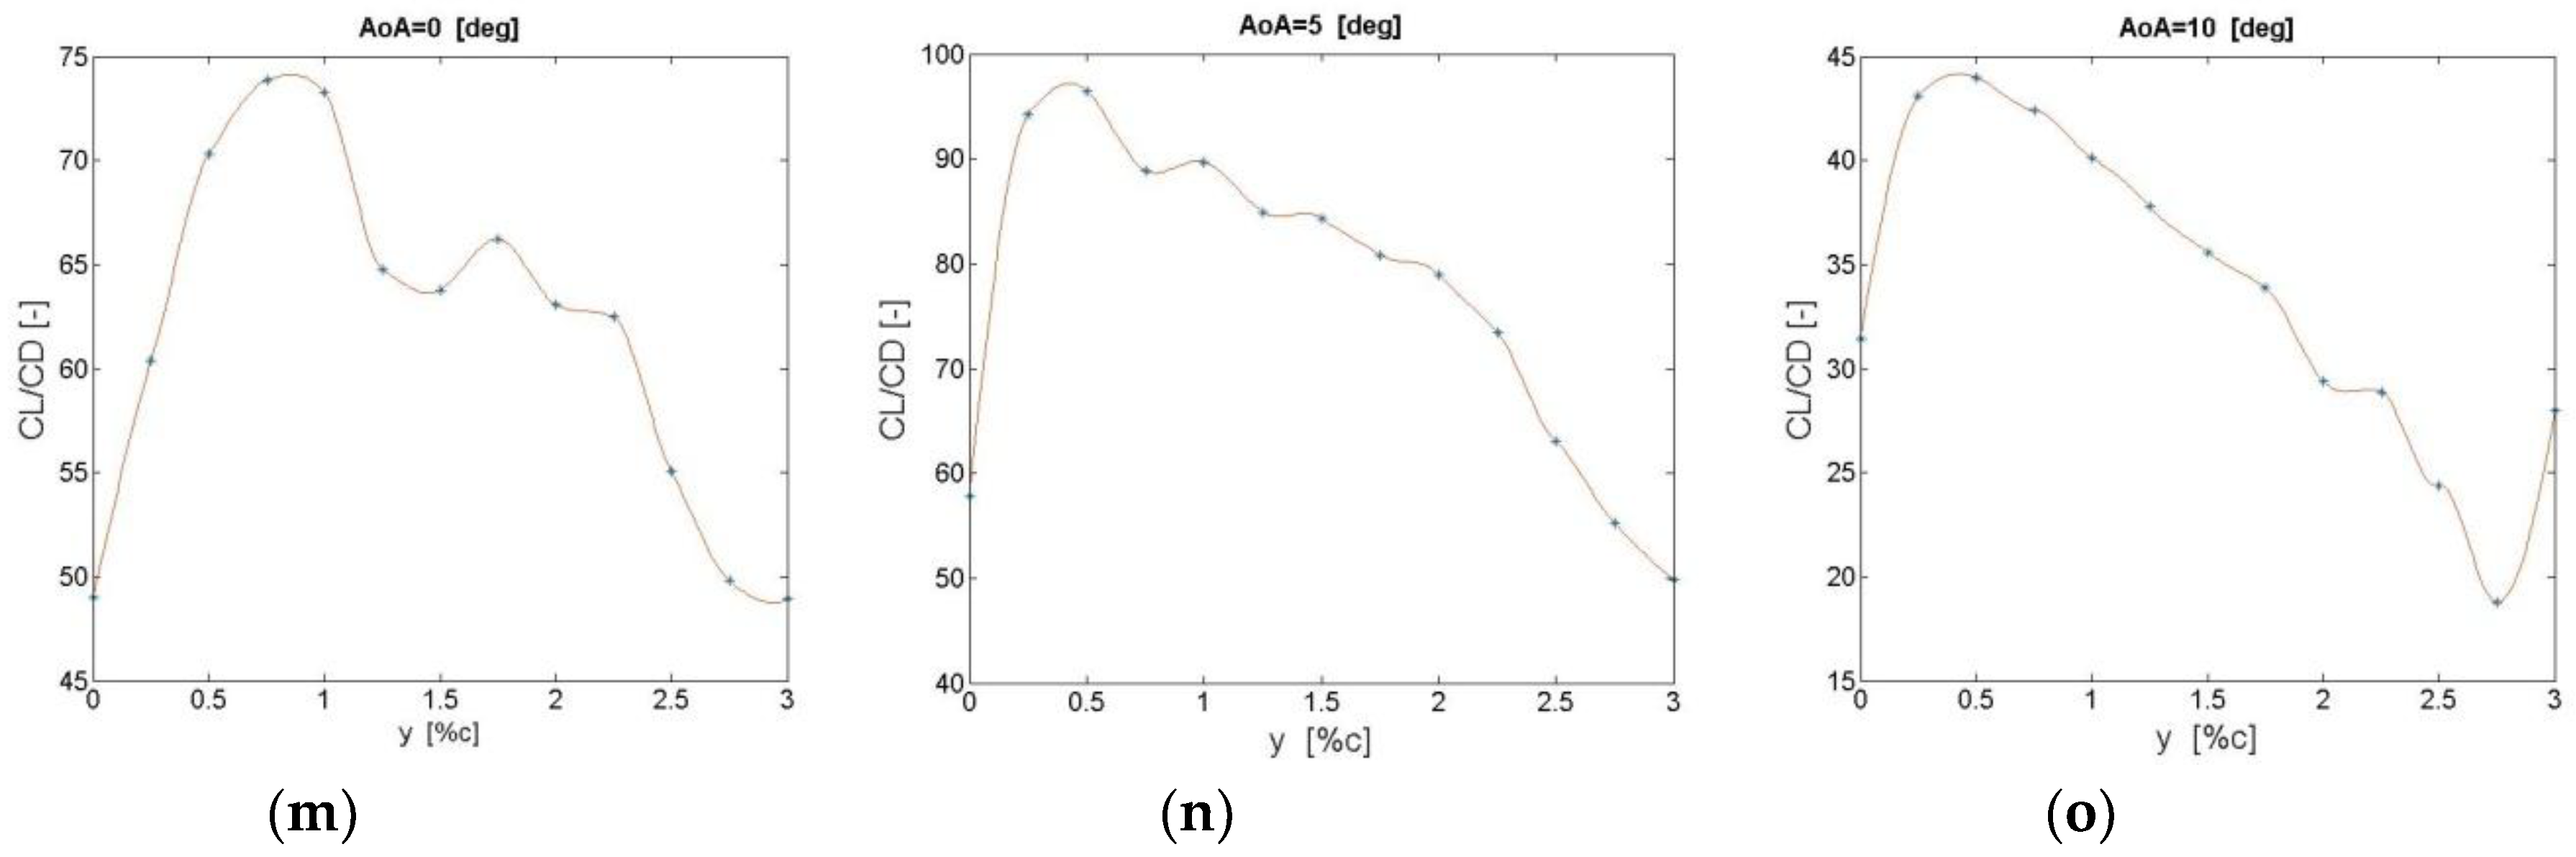
Firstly, an investigation for the design and analysis of a GF on a S810 airfoil and of a MT on a DU91(2)250 airfoil was carried out. Two-dimensional computational fluid dynamic simulations were performed on these commonly used airfoils on wind turbines, using RANS equations at Re = 106. The GF and MT design attributes resulting from the CFD computations allowed sizing of the passive devices based on the airfoil aerodynamic performance. In both types of flow control devices, the results showed an increase in the lift-to-drag ratio for all angles of attack considered in the current work. In the case of the GFs, with AoAs from 0 to 6 degrees, the highest lift-to-drag ratio was achieved by the airfoil with the GF size of 0.50% of c. An enhancement of the lift-to-drag ratio around 70% in comparison with the clean case was achieved in that range of AoAs. From 6° to 10°, the GF size of 0.25% of c achieved superior but similar results to the case of 0.50% of c. It was found that the best MT location was 95% of c measured from the airfoil leading edge, and the most favorable MT size varied between 1% and 2% of the chord length of the airfoil. Between 0° and 6° of airfoil AoA, the maximum lift-to-drag ratio was reached by the case DU91W(2)250MT9515. Nevertheless, as the AoA of the airfoil increased beyond 6°, the most advantageous value was achieved by a shorter MT size.
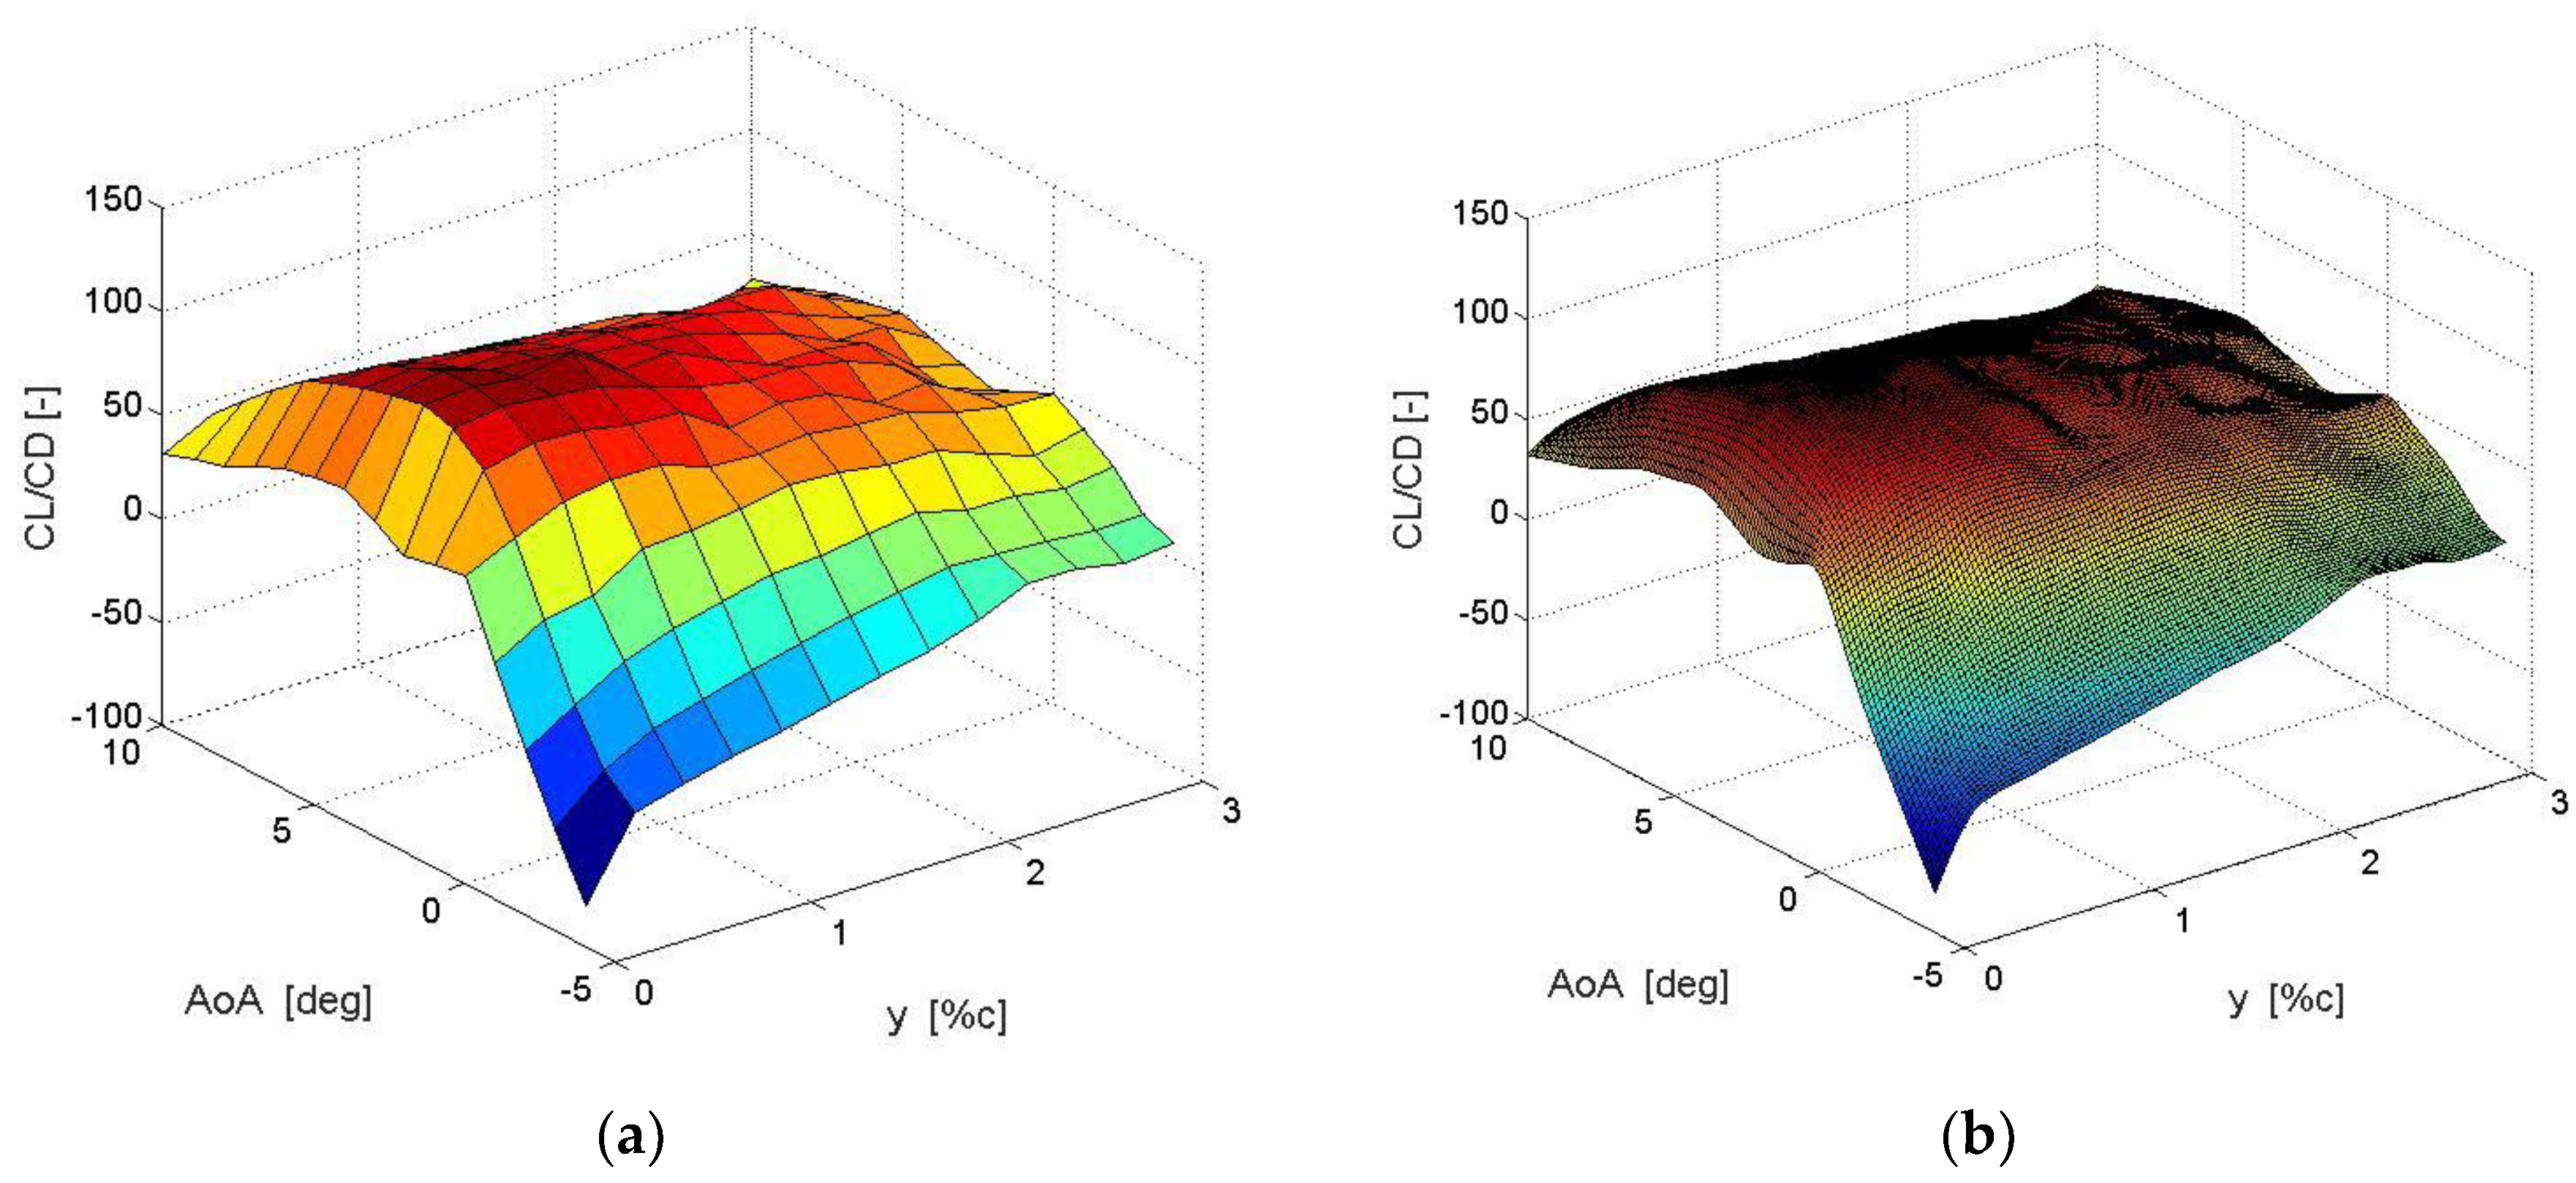
Secondly, from the data obtained by means of CFD simulations, a regular function using the reduced order method of POD was built. In both flow control cases (GFs and MTs), the recursive POD method was able to accurately reproduce the computational results. The developed POD recursive method consists of two stages—one offline, and another online. The offline step consists of constructing the function that transforms the geometrical and physical parameters on the lift-to-drag ratio, starting from lift-to-drag ratio data obtained by CFD computations. In the online step, this function is used to directly compute the lift and drag coefficients for any given set of geometrical and physical parameters, without needing any CFD computation. This leads to a method with very low computational cost that is extraordinarily fast.
The results of the present work show that careful analysis of the GF size and MT height and location from the airfoil leading edge can yield effective devices for flow control in order to improve the airfoil aerodynamic performance. In addition, the POD method was revealed as a powerful tool to predict the lift-to-drag values of these types of parametric studies. The main conclusion of this paper is the validation of recursive POD approximation’s ability to accurately compute the maximum lift–drag ratio associated with a given GF or MT configuration, in view of further applications in active flow control.


