Article

Adjustable Robust Optimization Algorithm for Residential Microgrid Multi-Dispatch Strategy with Consideration of Wind Power and Electric Vehicles

1
School of Control & Computer Engineering, North China Electric Power University, Beijing 102206, China
2
China Institute of Energy and Transportation Integrated Development, Beijing 102206, China
3
Smart Energy Institute, Nanjing SAC Power Grid Automation Co., Ltd., Nanjing 211100, China
4
Department of Electrical and Computer Engineering, Baylor University, Waco, TX 76798, USA
*
Author to whom correspondence should be addressed.
Energies 2018, 11(8), 2050; https://doi.org/10.3390/en11082050
Submission received: 9 July 2018 / Revised: 25 July 2018 / Accepted: 2 August 2018 / Published: 7 August 2018

Abstract

:
A prospect of increasing penetration of uncoordinated electric vehicles (EVs) together with intermittent renewable energy generation in microgrid systems has motivated us to explore an effective strategy for safe and economic operation of such distributed generation systems. This paper presents a robust economic dispatch strategy for grid-connected microgrids. Uncertainty from wind power and EV charging loads is modeled as an uncertain set of interval predictions. Considering the worst case scenario, the proposed strategy can help to regulate the EV charging behaviors, and distributed generation in order to reduce operation cost under practical constraints. To address the issue of over-conservatism of robust optimization, a dispatch interval coefficient is introduced to adjust the level of robustness with probabilistic bounds on constraints, which gradually improves the system's economic efficiency. In addition, in order to facilitate the decision-making strategies from an economic perspective, this paper explores the relationship between the volatility of uncertain parameters and the economy based on the theory of interval forecast. Numerical case studies demonstrate the feasibility and robustness of the proposed dispatch strategy.

1. Introduction

Due to their environmental friendliness, electric vehicles (EVs) have drawn great attention during recent decades in terms of power demand [1,2]. Many countries have accelerated constructing charging facilities and issuing policies to promote the development of EVs [3]. According to the Chinese “Energy saving and new energy vehicle industry development plan (2011–2020)”, there will be more than 60 million EVs by 2030. It was predicted that there will be 5 million EVs in China and more than 30 million EVs in the world within the coming decade [4]. The number of charging stations has been increased dramatically within residential areas during the past few years. However, since the EV charging time, locations, user behaviors and load profiles are highly dynamic, the large-scale penetration of uncontrolled and uncoordinated EVs into power systems, especially distribution networks, will lead to a high level of volatility and increase potential sources of power system disturbances [5].
In addition, clean and effective renewable energy has been widely exploited in response to the energy self-sufficiency and air pollution emitted by conventional fossil-fuel power plants [6,7,8,9]. Due to the intermittency and fluctuation characteristics of the renewable energy, its development and utilization must overcome the challenges from these obstacles [10]. The rapid development of a smart grid provides a new choice for the efficient integration of EVs and renewable energy.
In the microgrid environment, the interactive technology with EVs can provide support for on-site consumption and stable grid interconnection of renewable energy [11,12]; in the meantime, renewable energy can be absorbed or incorporated into large grids in the form of microgrids [13]. The EVs can be employed as energy storage units for efficient connection of renewable energy sources, distributed energy sources and power systems [14]. Mena et al. [15] proposed a multi-objective optimization framework including renewable power supply and energy storage system in order to solve the uncertainties caused by the wind, sun light and EVs, in which EVs have three states of charge, discharge and unconnected, and obtained the optimal distributed generation integrated network considering multiple sources of uncertain variables using NSGA-II. Rabiee et al. [16] discussed a scheduling strategy of Vehicle-to-Grid (V2G) EVs with “source and load” characteristics in microgrid. The study also considered the uncertainty of wind and solar power generation and reduced the network operation cost and emission by establishing a two-stage model. From the perspective of distributed energy costs, Cardoso et al. [17] analyzed the technical challenges and economic changes brought by the access of large-scale V2G EVs to the microgrid and established an uncertainty optimization model that considers the travel time of the EVs, the results of which indicate that large-scale EVs have a positive impact on the microgrid operating economy.
With the rapid development of smart grid [18], grid-connected microgrid has become one of the emerging subjects in the field of energy dispatching. Grid-connected microgrid is a cluster of distributed generations (DGs) of renewable generations (RGs) or conventional generations (CGs), flexible load (such as EVs) and local loads, which is usually managed by an energy management system (EMS) to balance the connection of EVs and renewable energy [19]. Conventional microgrid dispatch strategies simply look upon renewable energy as a certain factor representing a negative load. However, the objective of microgrid is not only to satisfy the basic demand of power supply, but also to improve efficiency in the economy and conservation in the environment [20]. References [21] and [22] have built up multi-objective optimization models for microgrid with DGs and loads, which provide an efficient integration of renewable energy and EVs, with simultaneous consideration of minimum fuel costs, operation and maintenance (OM) costs and operation emissions. However, the models are lacking in practical uncertainty considerations. Stochastic optimization (SO) provides an effective way for solving optimization problems, in which the uncertain numerical data can be assumed to follow a well-known probability distribution. For example, an SO was investigated for microgrid with EVs and RGs in Reference [23] and the uncertainties of load demands and renewable generation was incorporated with a probabilistically constrained approach in Reference [24].
In Reference [25], a unit commitment problem for EVs, RGs and CGs was proposed to reduce the emission and the cost of a smart grid, and a firework algorithm was employed to solve the established bi-objective problem. However, considering the complex operation details and various practical constraints, it is difficult to identify accurate probability distributions for uncertainty factors of EVs and RGs. A more reliable economic dispatch strategy is needed to help managing the microgrid schedule by taking RGs and EVs into consideration simultaneously.
Robust optimization (RO) has good advantages in tolerating uncertainties in dispatch problems [26]. Tang et al. [27] have built a security economic dispatch of power system with an RO method, but the proposed tool is over-conservative. Ben-Tal et al. [28] have presented an adjustable RO method, which is effective to balance the conflict between the algorithm optimality and its robustness. Later, Bertimas and Sim [29] proposed an adjustable RO with dispatch interval coefficient. The method quantified the relationship between economic efficiency and robustness, and reduced the complexity of previous robust model. Recently, many researchers have applied RO to decision-making problems on power systems, including EV charging scheduling [30,31], and incorporating PV power to the power grid [32]. In References [33] and [34], the authors proposed adjustable RO models to incorporate uncertain renewable generation in distribution system (DS), but failed to take the uncertain EV charging behaviors into account.
The EV charging loads are influenced by their users’ travel habits, capacities of different EVs and other related factors, and these characteristics make it difficult to predict accurate probability distributions of EV charging loads. Therefore, uncertainty of EV charging loads should be taken into consideration with the RO.
This paper proposes an adjustable robust optimization (RO) model to solve the multi-dispatch problem for a residential microgrid, which is integrated with diesel engine (DE), micro turbine (MT), wind turbine (WT) and a large number of EVs. The adjustable RO algorithm proposed in this paper not only intends to guarantee the robustness of the system, but also tries to combine the volatility of uncertain intervals with the energy economy, and thus systematically expound the application of robust optimization in the energy economy. The contributions of this paper can be summarized as following:
(1)
The proposed RO model handles the uncertain sets of both EV charging loads and available wind power by taking the worst scenario of uncertain variables into account. Comparison study is taken between SO and RO applied in the microgrid system dispatch problem. According to the numerical results, the RO dispatch strategy has outperformed on tolerating uncertainty, and its robustness is stronger than conventional SO dispatch strategies, while SO dispatch strategy has better economic performance than the RO dispatch strategy.
(2)
The proposed RO model in the paper is a semi-infinite programming model, which has difficulty in obtaining its analytical solution directly. The duality principle is explored to convert the original RO model to a robust counterpart with linear constraint, which can be easily solved with the Lagrange relaxation algorithm. In addition, in order to further reduce the computation complexity, a grouping approach based on charging horizon is employed to handle the situation when a large number of EVs access the microgrid system randomly at the same time.
(3)
The RO dispatch strategy sacrifices economic efficiency to guarantee the robustness of the microgrid system, which sometimes is over-protective or over-conservative. To avoid the over-conservatism of RO, an improved dispatch interval coefficient is introduced to quantify the relationship between economic efficiency and robustness of the RO model, which can provide a dispatch reference to decision makers for robust dispatch of microgrid in advance.
The paper is organized as follows: The uncertainty sets for predicting wind power and EVs are proposed in Section 2. Section 3 expands the multi-dispatch to propose an optimization model by including wind power and EV charging. A robust optimization problem is formulated with a dispatch interval coefficient to adjust the conservatism level in Section 4. A case study is presented in Section 5, and conclusions are drawn in Section 6. The structure diagram of the scheduling system is shown in Figure 1.

2. Residential Microgrid with Wind Power and EV

2.1. Uncertainty Sets of Wind Turbines

Wind speed is modeled as a random variable with probability density function defined by,
f w i n d ( V ) = V η 3 exp ( V 2 2 η 2 )  
which is known to be the Rayleigh distribution with V and η as the wind speed and distribution parameter, respectively [34]. We consider the wind speed prediction as the mean value of Rayleigh distribution, so the Rayleigh parameter is known as,
η = μ ( V ) 2 π  
The wind speed has confidence interval P { θ _ θ θ ¯ } = 1 α The confidence interval represents the range of uncertain data with a certain credibility.
By giving the wind speed, the output wind generator power is represented by,
W ( V ) = { 0 V < V i n   o r   V o u t < V a V + b V i n V V r W r V r V V o u t
According to the prediction interval theory, the uncertain set of wind generation can be estimated with,
P W T = { P W T l , t G = P W T l , t G _ _ _ + P W T l , t G : P W T l , t G _ P W T l , t G P W T l , t G ¯ }  
where variables with G in the superscripts are defined as predicted variables.

2.2. Uncertainty Sets of Electric Vehicles

The probability of an individual EV travelling a distance d can be represented by a logarithmic normal distribution function [35],
h ( d ; μ , σ ) = 1 d 2 π σ 2 e ( ln d μ ) 2 2 σ 2  
According to parameter d, we can define the initial state of charge (SOC) of each EV by
S O C = ( 1 d d r ) × 100 %  
According to Reference [36], T s t a r t n is formulated as a random variable with normal distribution, the confidence interval of EV’s start charging time can be denoted by the upper and lower bounds as,
T s t a r t n = [ T s t a r t n _ , T s t a r t n ¯ ]  
The initial SOC of the n-th EV, can be denoted by its upper and lower bounds,
S O C n [ S O C n _ , S O C n ¯ ]  
In order to determine the charging time period for all EVs, which is restricted by the random SOC, we assume that all EVs have the same capacity and all the EV charging pile can provide the same charging power. In summary, end-time of the i-th EV charging T e n d n can be calculated as,
T e n d n = T s t a r t n + ( 1 S O C ) × E P  
where P denotes the charging power of the n-th EV which can be considered as a constant.
The predicted EV charging load is summed up by the charging power of all EVs at one time. The random behavior characteristics of EV charging can be described as the uncertainty set, which also can be defined as the sum of the mean and the variance, with the respective lower and upper limits.
U E V = { P E V t G = P E V t G _ _ _ + P E V t G : P E V t G _ P E V t G P E V t G ¯ }  

2.3. Grouping Dispatch Approach

The constraints of EVs are complicated due to the randomness of EV arrival times and their initial SOCs. Therefore, simplifications of different extents are adopted to reduce computational complexity [37].
We propose a grouping dispatch approach based on charging time to cut down the solution space. Assume that all EV owners in the residential area connect their EVs to chargers when they arrive at parking lots after work in the afternoon until they depart in the morning of next day. As shown in Reference [26], the arrival time of EVs in a residential area occurs during 17:30–22:30, which can be divided into ten periods, EVs arriving in each period is defined as one group. EVs that arrive before 17:30 are combined into the same group as 17:30, and EVs that arrived after 22:30 are ignored in the scheduling.
With the classification approach described above, EVs can be divided into K groups according to their arrival times. Control center distributes the scheduled charge power P E V k , t G of each group to every EV in the group, and charging power of all EVs can be estimated as,
P E V t G = k = 1 K P E V k , t G

3. Problem Formulation

A typical scheduling model of microgrid (MG) is defined as a multi-objective optimization problem with respect to DE, MT, WT and EVs. The overall goal of the multi-operation management problem in a typical MG is to simultaneously minimize the operating cost of the MG and the net pollutants emission inside the grid while meeting the load demand. The mathematical model of dispatch problem is formulated below.

3.1. Objective Functions

In this paper, we assume that RGs should be dispatched with a priority, and CGs are used to supplement the RG capacity to meet the load demand. The mathematical model can be expressed as following Reference [38].

3.1.1. Objective 1: Operating Cost Minimization

The total operating cost includes the fuel costs of DGs [22], operation and maintenance cost, transmission cost between MG and the main power grid, and the battery degradation cost. Such objective function can be formulated as below,
M i n   f 1 ( x ) = C 1 = t = 1 T { i [ C f ( P i , t ) + C O M ( P i , t ) + C b a t ( P E V t ) ] + C g r i d , t }  
where P i , t = [ P D E g , t ; P M T j , t ; P W T l , t ] ; t = 1, 2,…, 24; Each cost functions in Equation (12) are defined below:
C f ( ) = { c 1 P D E g , t 2 + c 2 P D E g , t + c 3 } D E + { y P M T j , t η ( P M T j , t ) } M T  
C O M ( ) = k O M P i , t  
C bat ( ) = a n P E V k , t 2 + b n P E V k , t + c n  
The battery degradation model expresses the energy capacity loss per second (in Amp × Hour × Sec−1) of a cell with respect to the charging current I and voltage V:
ϑ c e l l ( I , V ) = β 1 + β 2 I + β 3 V + β 4 I 2 + β 5 V 2 + β 6 I V + β 7 V 3  
The parameters βi, i = 1,…, 7 are specified in Table 1 of Reference [39],
θ c e l l ( I , V ) = P c e l l Δ T V c e l l ϑ c e l l ( I , V )  
where the cell voltage Vcell of a lithium-ion battery changes with its state of charge (SOC). More specifically, as the SOC of a cell varies from zero to a very low value s o c l > 0 , Vcell rises rapidly from zero to its nominal value Vnom.
Assume that each cell will have a charging current of I = 103PEVn,t/MnVnom with current coefficient Mn, the battery degradation cost of the n-th EV at time t can be expressed as,
C b a t = M n θ c e l l ( 10 3 P E V k , t M k V n o m , V n o m )      = a n P E V k , t 2 + b n P E V k , t + c n  
where
a n = 10 6 P c e l l Δ T β 4 / ( M n V n o m )  
b n = 10 3 P c e l l Δ T ( β 2 + β 6 V n o m )  
c n = M n P c e l l Δ T V n o m ( β 1 + β 3 V n o m + β 5 V n o m 2 + β 7 V n o m 3 ) .  
The transmission power between the main power grid and MG can be formulated as below,
C g r i d , t = { P g r i d , t + M s e l l , t P g r i d , t + 0 P g r i d , t M b u y , t P g r i d , t 0  

3.1.2. Objective 2: Pollutants Emission Minimization

The environmental pollution problems will be caused in the process of power generation of CG and transmission power. Three of the most important pollutants are involved in the objective function: CO2 (carbon dioxide), SO2 (sulfur dioxide) and NOx (nitrogen oxides) [40]. Objective 2 on emission can be described as follows:
min f 2 ( x ) = C 2 = i = 1 N h = 1 H ( C h u i , h ) P i + h = 1 H ( C h u g r i d , t ) P g r i d  

3.1.3. The Total Cost Function of Dispatch Problem in Microgrid

The objective function of our dispatch model is to minimize the total cost (Ctotal), including the operation cost and the environmental protection cost simultaneously, which can be defined as:
C t o t a l = C 1 + C 2  

3.2. Constraints

3.2.1. Conventional Economic Dispatch Constraints

Conventional constraints include power balance constraints, operating reserve constraints, output constraints of generators and ramping constraints. The power balance constraints can be defined as,
i P D E i , t + j P M T j , t + l P W T l , t + | P g r i d , t | k P E V k , t = P l o a d , t  
The output constraints of generators and ramping constraints (DE and MT) are defined as,
P i , t min P i , t P i , t max  
P i , d o w n P i , t P i , t 1 P i , u p  
The operating reserve constraints in period t can be defined as,
i P D E i , t + l P W T l , t G + j P M T j , t + | P g r i d , t | ( 1 + L t ) ( k P E V k , t G + P l o a d , t )  

3.2.2. Wind Power Constraints

The wind power output PWTt is constrained by the predicted power P W T t G at time t,
0 P W T t P W T t G  

3.2.3. Transmission Capacity Constraints

Microgrid connected with the main power grid needs to follow the power transmission protocol, and the transmission power between the microgrid and the main power grid cannot exceed the limits,
P b u y min P g r i d , t + P b u y max  
P s e l l min P g r i d , t P s e l l max  

3.2.4. EV Charging Constraints

Too-high charging power will damage the battery. In order to prolong the service life of the battery, the EV charging power needs to be restricted by its maximum limit for each EV,
0 P E V k , t P E V k , t max  
The charging constraint for each EV is defined, which is usually assumed to be a constant value.
E k , t = E k , t 1 + P E V k , t ζ Δ t  
During the charging period, the energy demand of EV fleet should satisfy,
E k e n d = E k i n i + t = 1 T P E V k , t ξ Δ t E e n d = k = 1 K E k e n d = E i n i + t = 1 T P E V t G ζ Δ t  

3.3. Robust Energy Management Model

In order to solve the above multi-objective optimization problems, this paper uses weighted summation method to convert the objective functions to a single-objective function, based on Formula (18), we introduce two weight coefficients ( w 1 and w 2 ) to investigate the effect of different values on the dispatch system, and the robust economic dispatch problem is reformulated as,
min P i , t , P E V k , t { sup P W T l , t G , P E V k , t G w 1 C 1 + w 2 C 2 }  
s.t. (19)–(28)
where P W T l , t G and P E V k , t G are sets with infinite elements of uncertainty parameters, i.e., Constraints (19), (22) and (27) can be divided into an infinite number of linear constraints. Consequently, the optimization model (29) is called a semi-infinite programming (SIP), which is usually difficult to solve.

4. Adjustable Robust Optimization Algorithm

The robust economic dispatch problem is constrained by uncertain data sets. To avoid the difficulty in handling this problem, the duality principle mentioned in Reference [29] is employed to transform the SIP problem to an easier dual problem in Section 4.1. In addition, an adjustable interval coefficient Γt is introduced in Section 4.2 to reflect the robustness and economy of the solution.

4.1. Robust Equal Conversion

Based on the sets of uncertainties shown in Section 2.1 and Section 2.2, the inequality constraints (22) can be transformed to,
i P D E i , t + l ( P W T l , t G _ _ _ + P W T l , t G ) + j P M T j , t + | P g r i d , t | ( 1 + L t ) ( k ( P E V k , t G _ _ _ + P E V k , t G ) + P l o a d , t )  
Robust optimization deals with uncertain data under the worst scenario, which can be defined as,
F = max { P W T l , t G ( 1 + L t ) k = 1 K P E V k , t G }  
s . t .   P W T l , t G _ P W T l , t G P W T l , t G ¯ P E V t G _ P E V t G P E V t G ¯  
The dispatch objective function is monotonically increasing, strictly convex and differentiable. According to the strong duality its dual problem is also feasible and bounded, and the objective values coincide. Therefore, the dual problem becomes,
min { l = 1 L P W T l , t G _ α t + l = 1 L P W T l , t G ¯ β t k = 1 K P E V k , t G _ γ t + k = 1 K P E V k , t G ¯ δ t }  
s . t .   α t + β t 1 γ t + δ t 1 L t α t , β t , γ t , δ t 0  
In summary, Constraint (30) can ultimately be transformed to,
P D E + l = 1 L P W T l , t G ¯ + | P g r i d , t | + P M T t ( 1 + L t ) k = 1 K P E V k , t G ¯ l = 1 L P W T l , t G _ α t + l = 1 L P W T l , t G ¯ β t + ( 1 L t ) ( k = 1 K P E V k , t G _ γ t + k = 1 K P E V k , t G ¯ δ ) t ( 1 + L t ) P l o a d , t  
Then, the dispatch problem is equivalent to an optimization problem with linear constraints,
min P i , t , P E V k , t { sup P W T , l , t G , P E V k , t G C t o t a l }  
s.t. (19)–(28), (31)–(33)

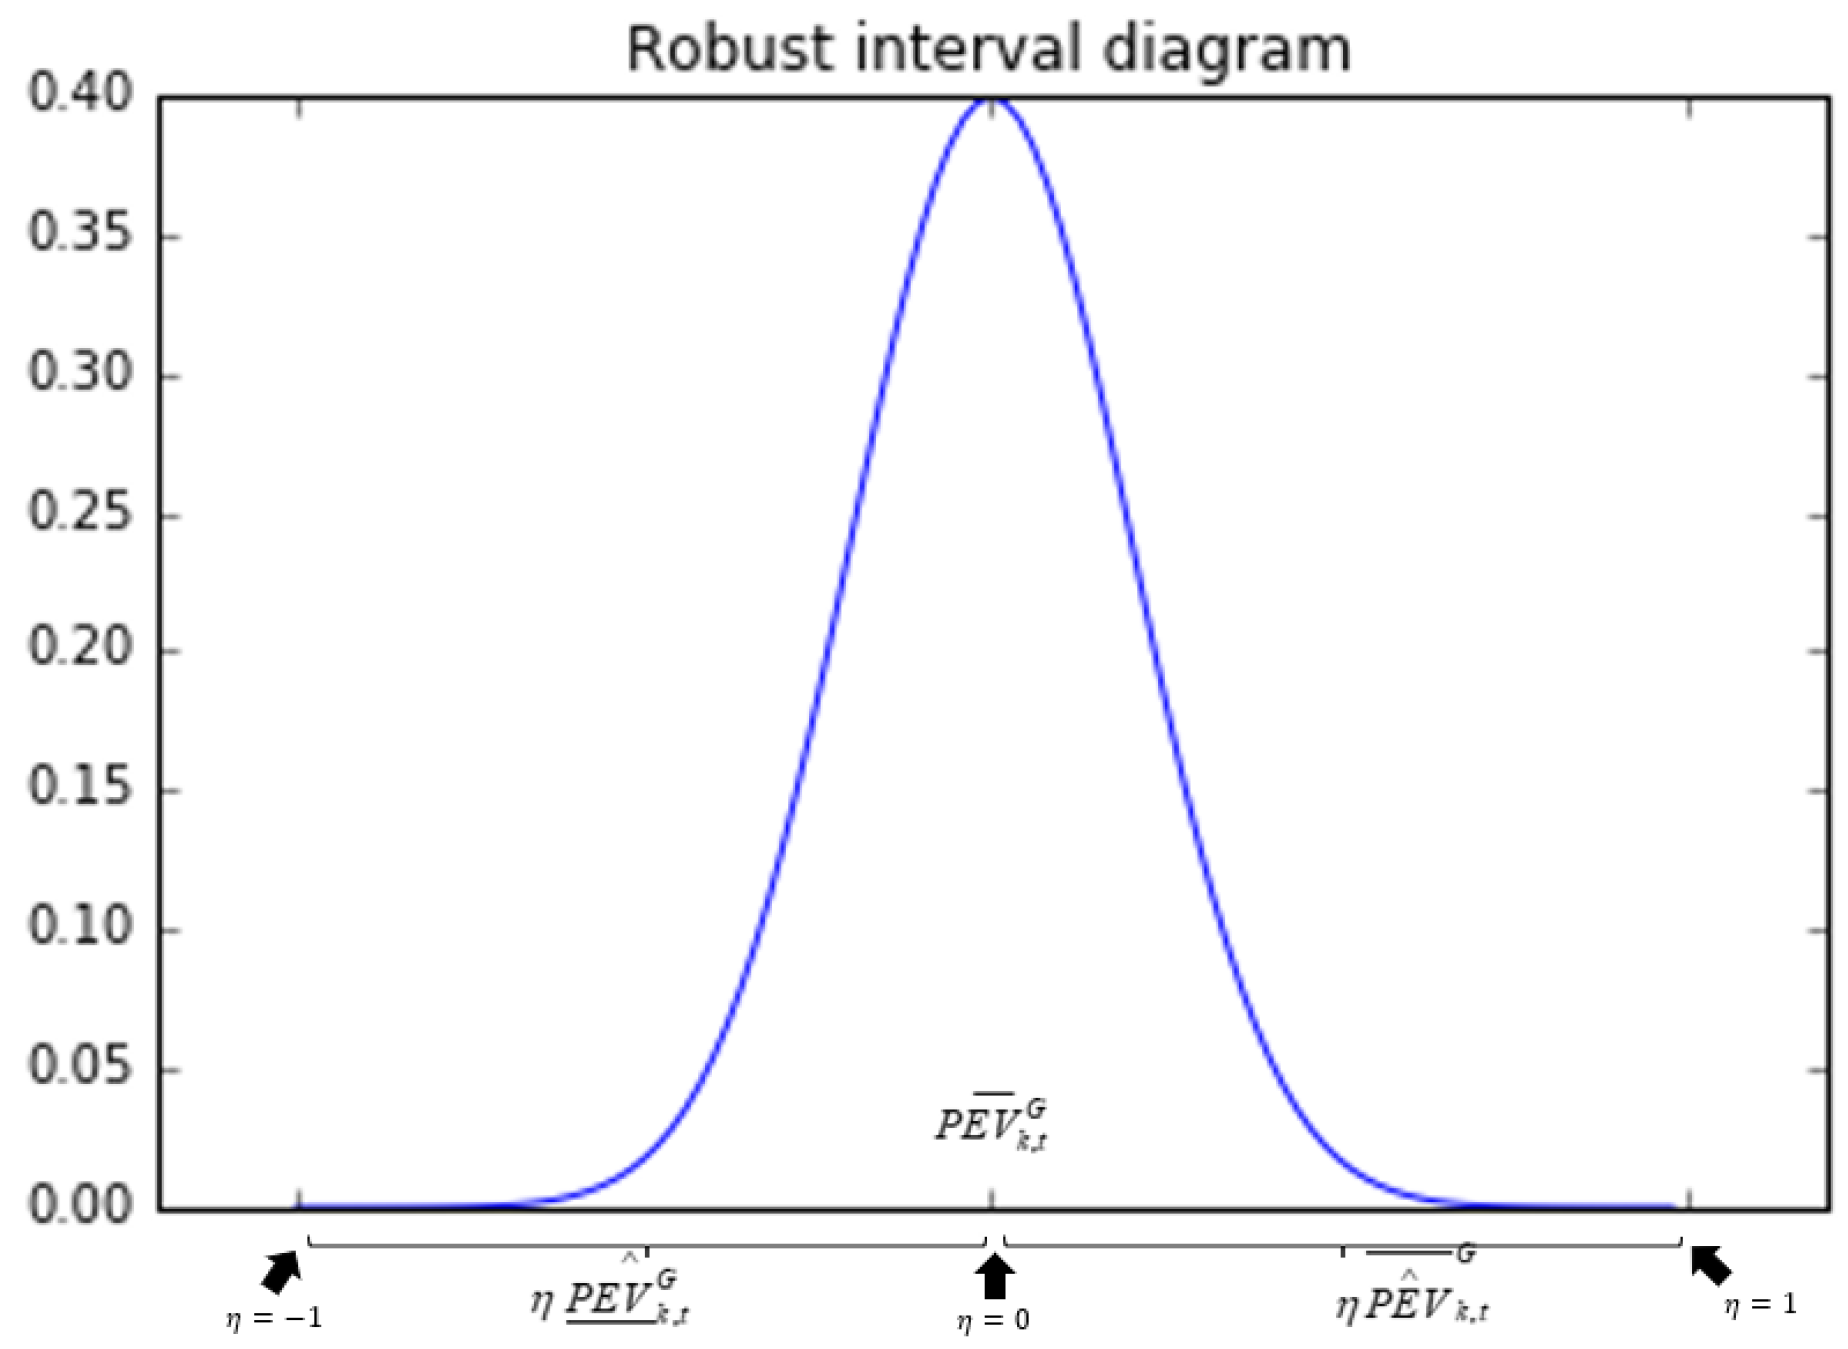
4.2. Adjustment Interval

Considering that the number of wind generators and EVs are L and K, respectively, we define a set V = [0, L + K] to indicate the number of uncertainties. Each uncertain value at stage t is represented as a symmetric and bounded random variable such as,
P E V k , t G [ P E V k , t G _ _ _ + η l , t P E V k , t G _ , P E V k , t G _ _ _ + η l , t P E V k , t G ¯ ]  
where η l , t [ 0 , 1 ] is the scheduling interval coefficient representing the size of interval (see Figure 2 for details). Our goal is to protect the system stability by maintaining the operating reserve Γt with very high probability. So up to Γ t , which is the round down symbol for Γt, all these random variables for WT and EV are allowed to be changed by ηm,t = 1, except one variable, which needs to be changed by η m , t = Γ t Γ t .
For convenience, if there are total V variables allowed to be changed, we define Qv,t to be the value of total power resulting from uncertain number l and k of WTs and EVs, respectively,
Q v , t = l [ 0 , m ] P W T l , t G ( 1 + L t ) k [ 0 , m l ] P E V k , t G  
We define S to be the collection of uncertain variables the scheduling coefficient of which is ηm,t = 1, and s to be the s-th uncertain variable the scheduling coefficient of which is Γ t Γ t . Then, we can obtain the probability for violation of operating reserve constraint.
P r { i = 1 N P i max + j = 1 M ( P W T , l , t G _ _ _ + P W T , l , t G ) ( 1 + L t ) k = 1 K ( P E V k , t G _ _ _ + P E V k , t G ) + | P g r i d , t | < ( 1 + L t ) P l o a d , t } P r { m V η m , t ω m , t Γ t }  
where
ω m , t = { 1 , m S Q m , t Q g , t , m R / S  
with Q g , t = min { Q g , t } , g S { s } and P r { a b } denoting the probability.
In order to facilitate the decision-maker’s analysis, we derive an accurate bound defined as ‘Bound 1′, which has been introduced in Reference [29].
P r { r R ω m , t η m , t Γ t } ( 1 μ ) C ( n , υ ) + l = υ + 1 n C ( n , l )  
C ( n , l ) = { 1 2 n i f   l = 0   o r   n 1 2 π n ( n l ) l exp ( n log ( n 2 ( n l ) ) + l log ( n l l ) ) o t h e r w i s e  
where n is the number of elements in the set V, and v = Γ t + n 2 , μ = v v .

5. Case Study

5.1. Problem Description

A microgrid system includes DE, MT, WT and EVs. The system is running in grid-connected mode. Figure 3 is the initial status of the microgrid system, where the EVs are assumed to be charged in the periods of 18:30–21:30, when there is the highest residential load of the day [41]. The described initial scenario including the EV charging up/lower bounds, the WT up/lower bounds and the resident load are shown in Figure 3, which has been modeled in Section 2.1 and Section 2.2. In this case, the high load and low wind power lead to the increase of DE outputs, which leads to increasing operation cost. On the other hand, during 23:00–2:00, when there is a lower basic load demand but with a high wind power and thus energy is wasted. Therefore, it is crucial to optimize the energy in the MG for uncertain WT output and EVs load.
This paper constructs an optimal dispatch model of a microgrid. First, the parameter specification is presented in Section 5.2. Second, the results of robust optimization versus stochastic optimization are compared in Section 5.3.2. Third, in order to quantify the robustness and economy of the scheduling model, the adjustable robust optimization results are analyzed in Section 5.3.3 and Section 5.3.4. Finally, analysis of the effect of weighting factors on multi-objective problems is presented in Section 5.3.5.

5.2. Parameter Specification

The microgrid system includes WT, DE, MT and EVs, of which the fuel costs of DE and MT are referred to in Reference [42], and the battery degradation cost of EVs are introduced in Reference [43]. The capacity limits of DGs are shown in Table 1. The time-of-use (TOU) electricity price is shown in Figure 4 (the blue bar represents the purchase price, and the orange bar represents the sale price). The operation and maintenance (OM) coefficients of DGs are listed in Table 2, where the WT’s OM cost is negligible. The environmental parameters of DGs and main power grid are listed in Table 3, where treatment costs of SO2 and NOX are far greater than that of CO2, and MT has smaller emission of SO2 and NOX than that of DE and the main power grid. The pollutant values of the main power grid are high in CO2, SO2, because the energy mix of the main power grid is mainly composed of coal.

5.3. Simulation Scene

A typical microgrid in Reference [30] supplies energy to a residential area, with one DE, two 250 kW MT and four WTs. One hundred EVs are taken into consideration for scheduling, and operating reserve Lt is set to 0.1 in dispatch periods for this microgrid system. The wind power is given by Rayleigh distribution with 95% confidence interval. The EVs start charging times and power demands are given by normal distribution with 95% confidence interval. A period from 16:00 to 04:00 is divided into 24 thirty-minute intervals. A robust dispatch strategy model introduced in Section 4 is established and the duality theory is employed to transfer the model to a linear programming model. The Lagrange relaxation algorithm, which is effective and easy to implement, is chosen to solve the transformed dual problem.

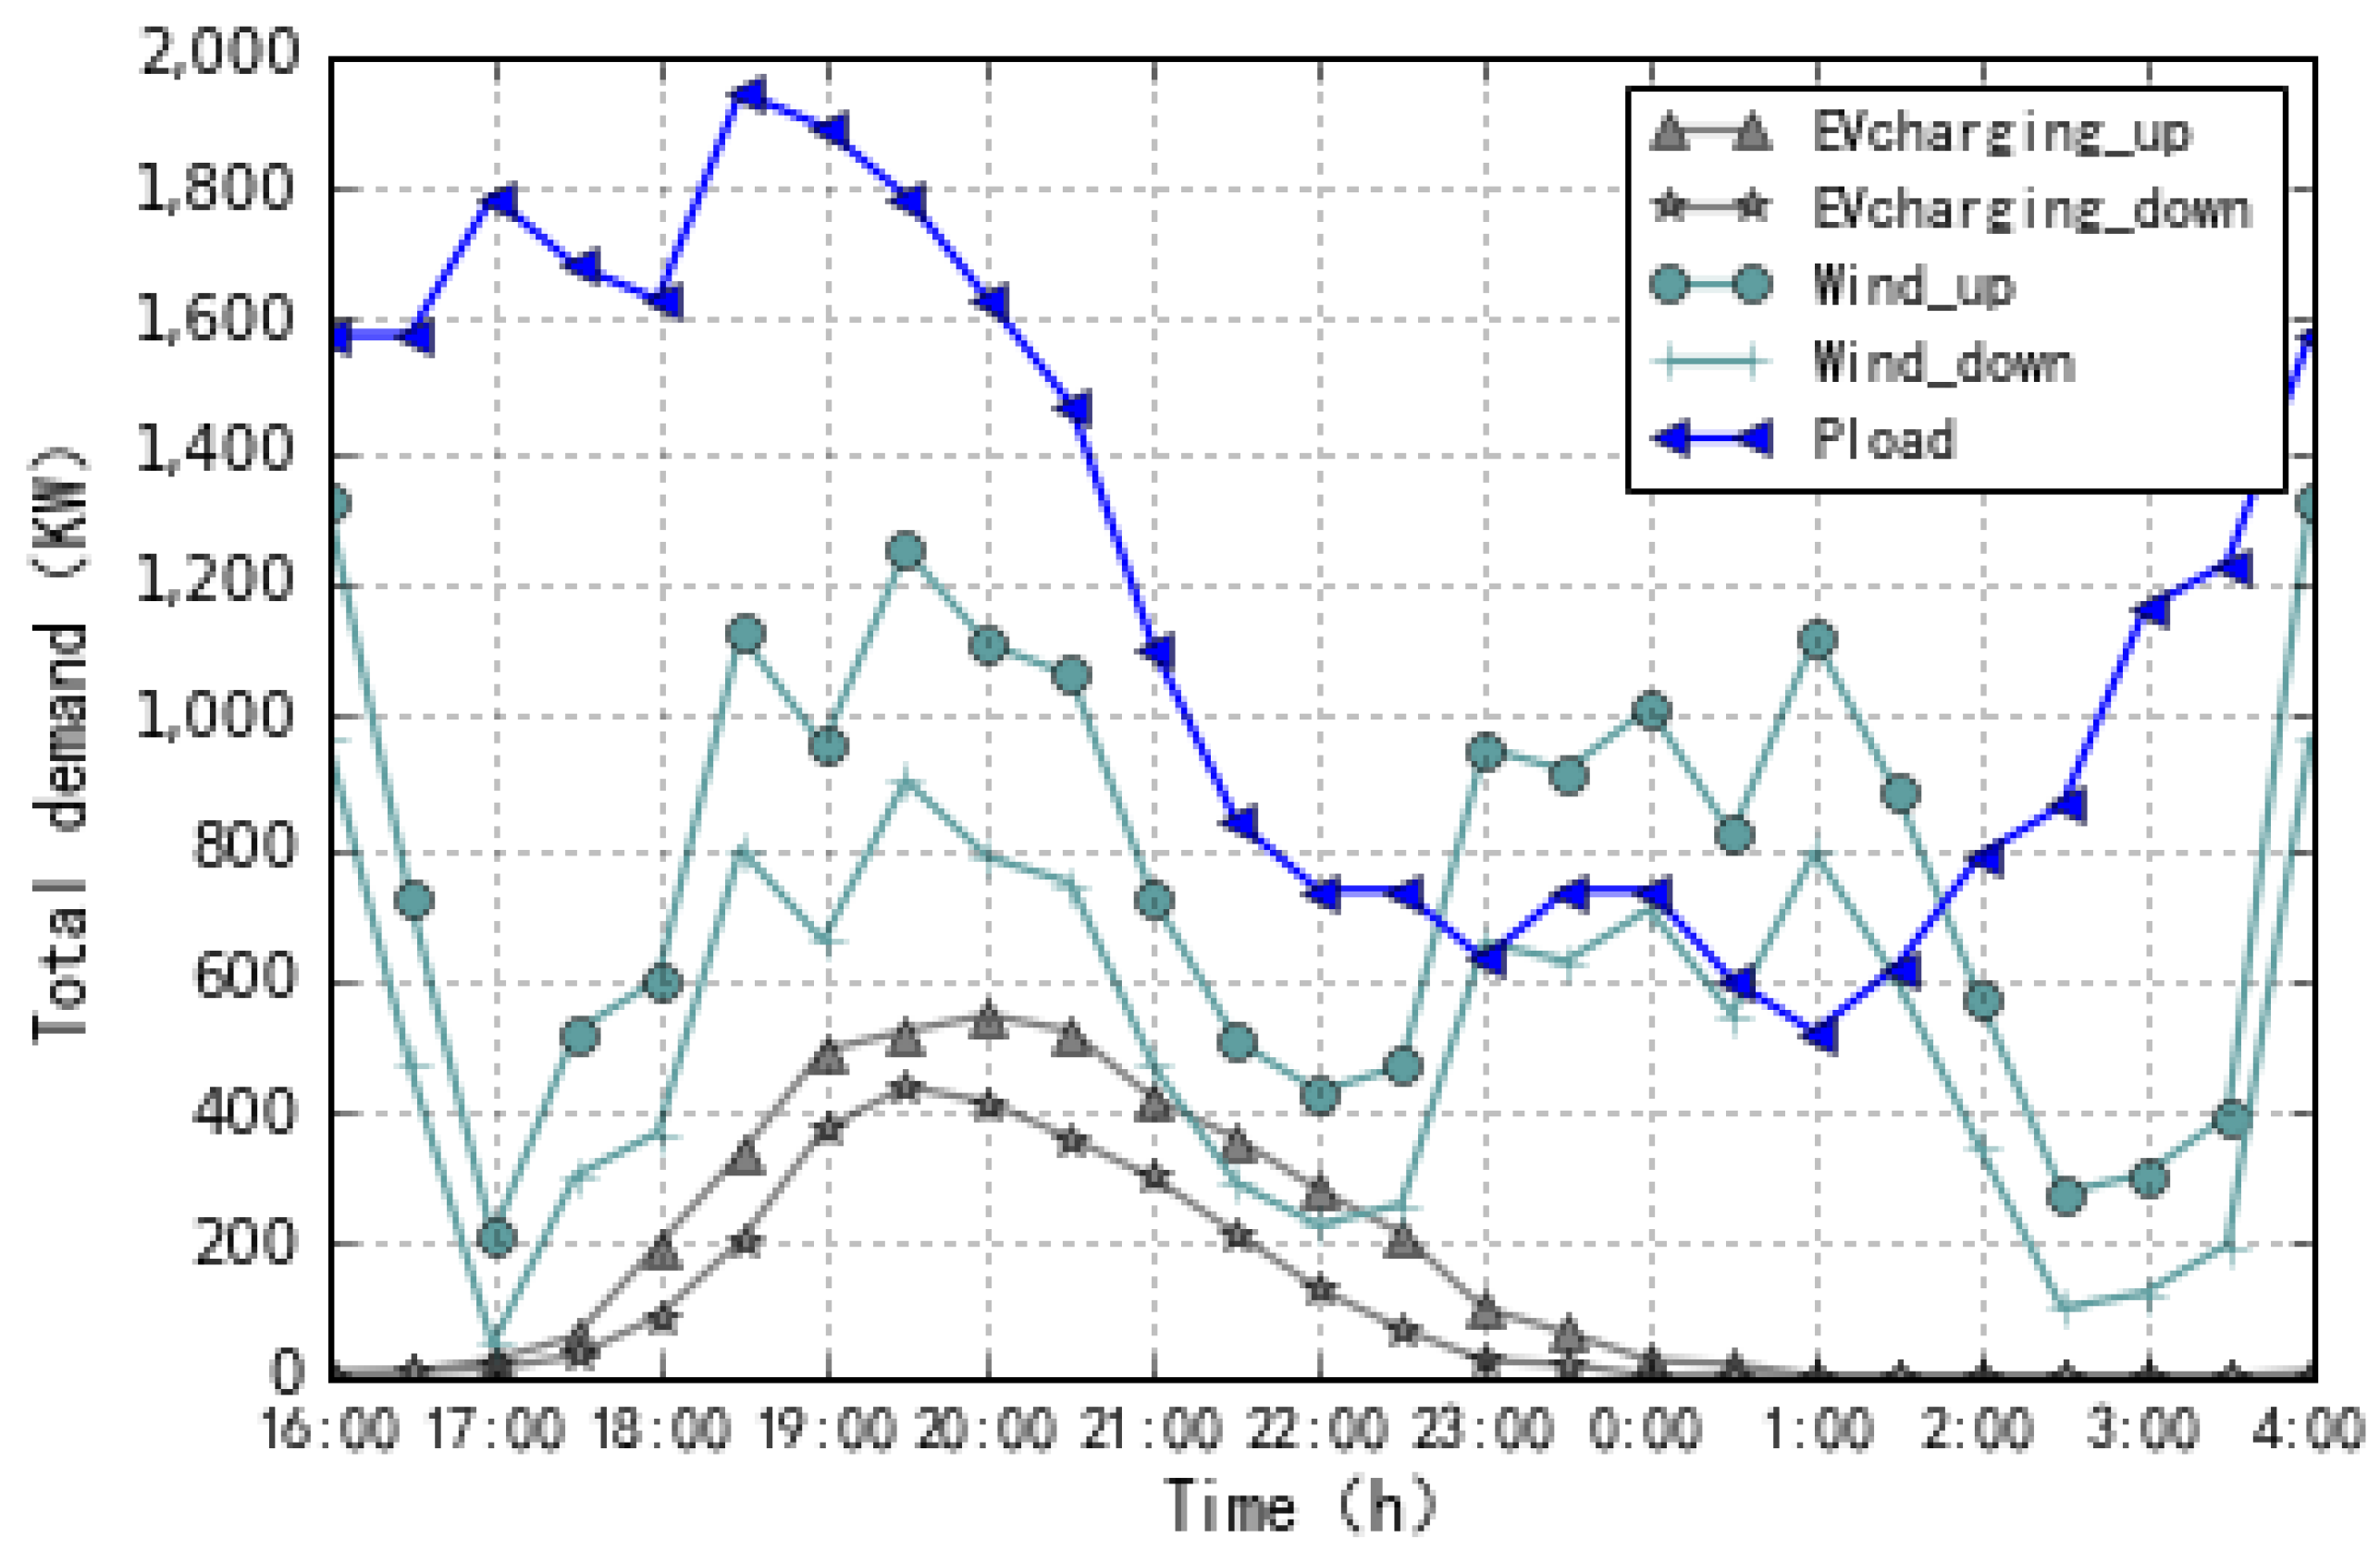
5.3.1. Case 1: Stochastic Optimization Result

The purpose of this study is to minimize the operating cost and environmental protection cost caused by DGs in the microgrid system. The SO dispatch strategy is used and shows good performance in reducing peak load and fuel cost under a stable operation. As shown in Figure 5, EVs are charged in the off-peak hours with high wind power outputs, DG and transmission power required to satisfy the power demand. However, the uncertainty of predicted variables is not taken into consideration, hence the dynamics and robustness of the system is not optimal.

5.3.2. Case 2: Robust Optimization Result

For RO, the worst scenario means fewer available WT outputs and more EV charging loads. Therefore, the DG increases its output so as to meet the load demands. Figure 6 shows RO under the worst scenario (ROW), in which the WT is in full use, and the output of DE and MT are increased to meet the remaining load requirements, but with no excess power provided to the main grid.
Compared with SO, RO meets more electric vehicle charging requirements in the case of less wind power generation. From Figure 5 and Figure 6 we can observe that both results are charging between 23:00–3:00, and renewable energy is fully utilized because SO does not consider volatility, its clean energy wind generates a higher amount of electricity, and electric vehicles charge less, so the total cost of the system is smaller—17,978.5—but the robustness of the system is not optimal. RO makes the scheduling system more robust, and the robustness index is measured by constraints violation probability (CVP). RO makes CVP reach 0.02% close to 0, but its total cost 21,843.8 which is high, while SO the CVP value is 62.73%, and the total cost is lower than RO. Therefore, we can conclude that RO has better robustness than SO, and the utilization rate of renewable energy is higher, but the economy costs are an extra 21.50% compared to SO.
Next, we will introduce the application of adjustable robust optimization in the scheduling system to help decision makers find a compromise between robustness and economy, and control the robustness and economy of the system by adjusting the number of uncertain variables. Simultaneously, the robustness and economy of the system in each state and the power generation of each part are listed in Section 5.3.3 for comparison with SO.

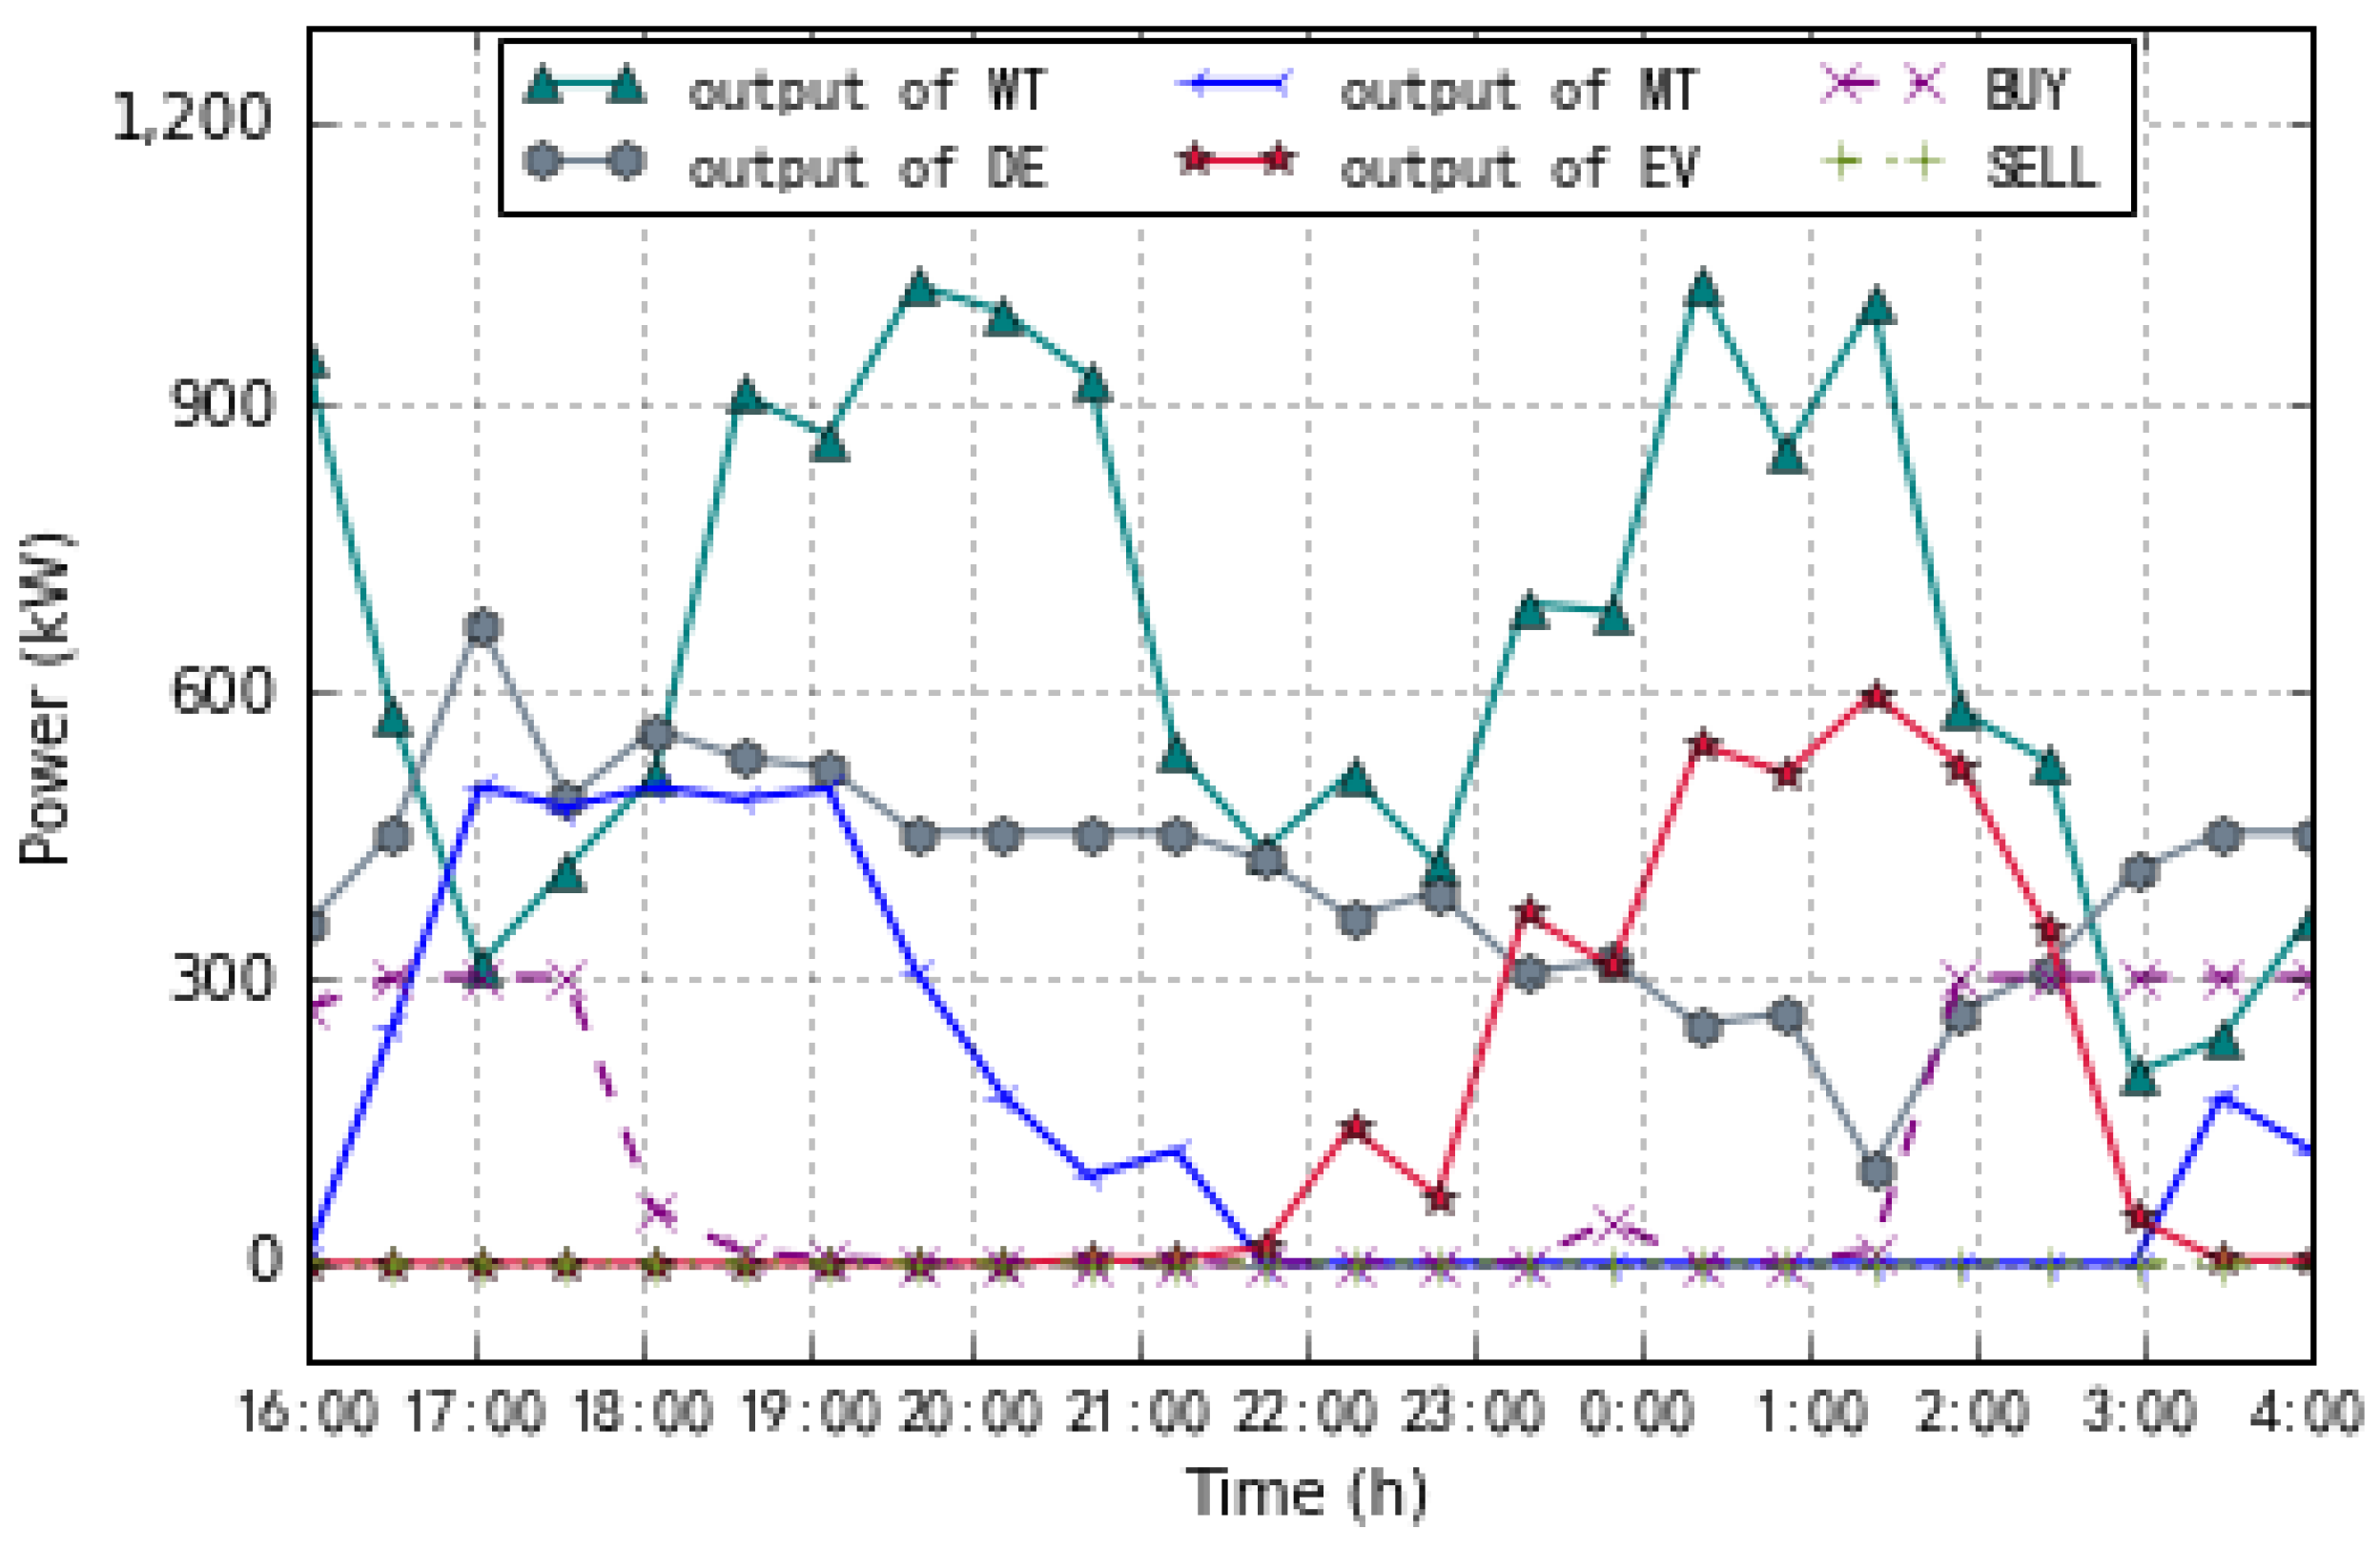
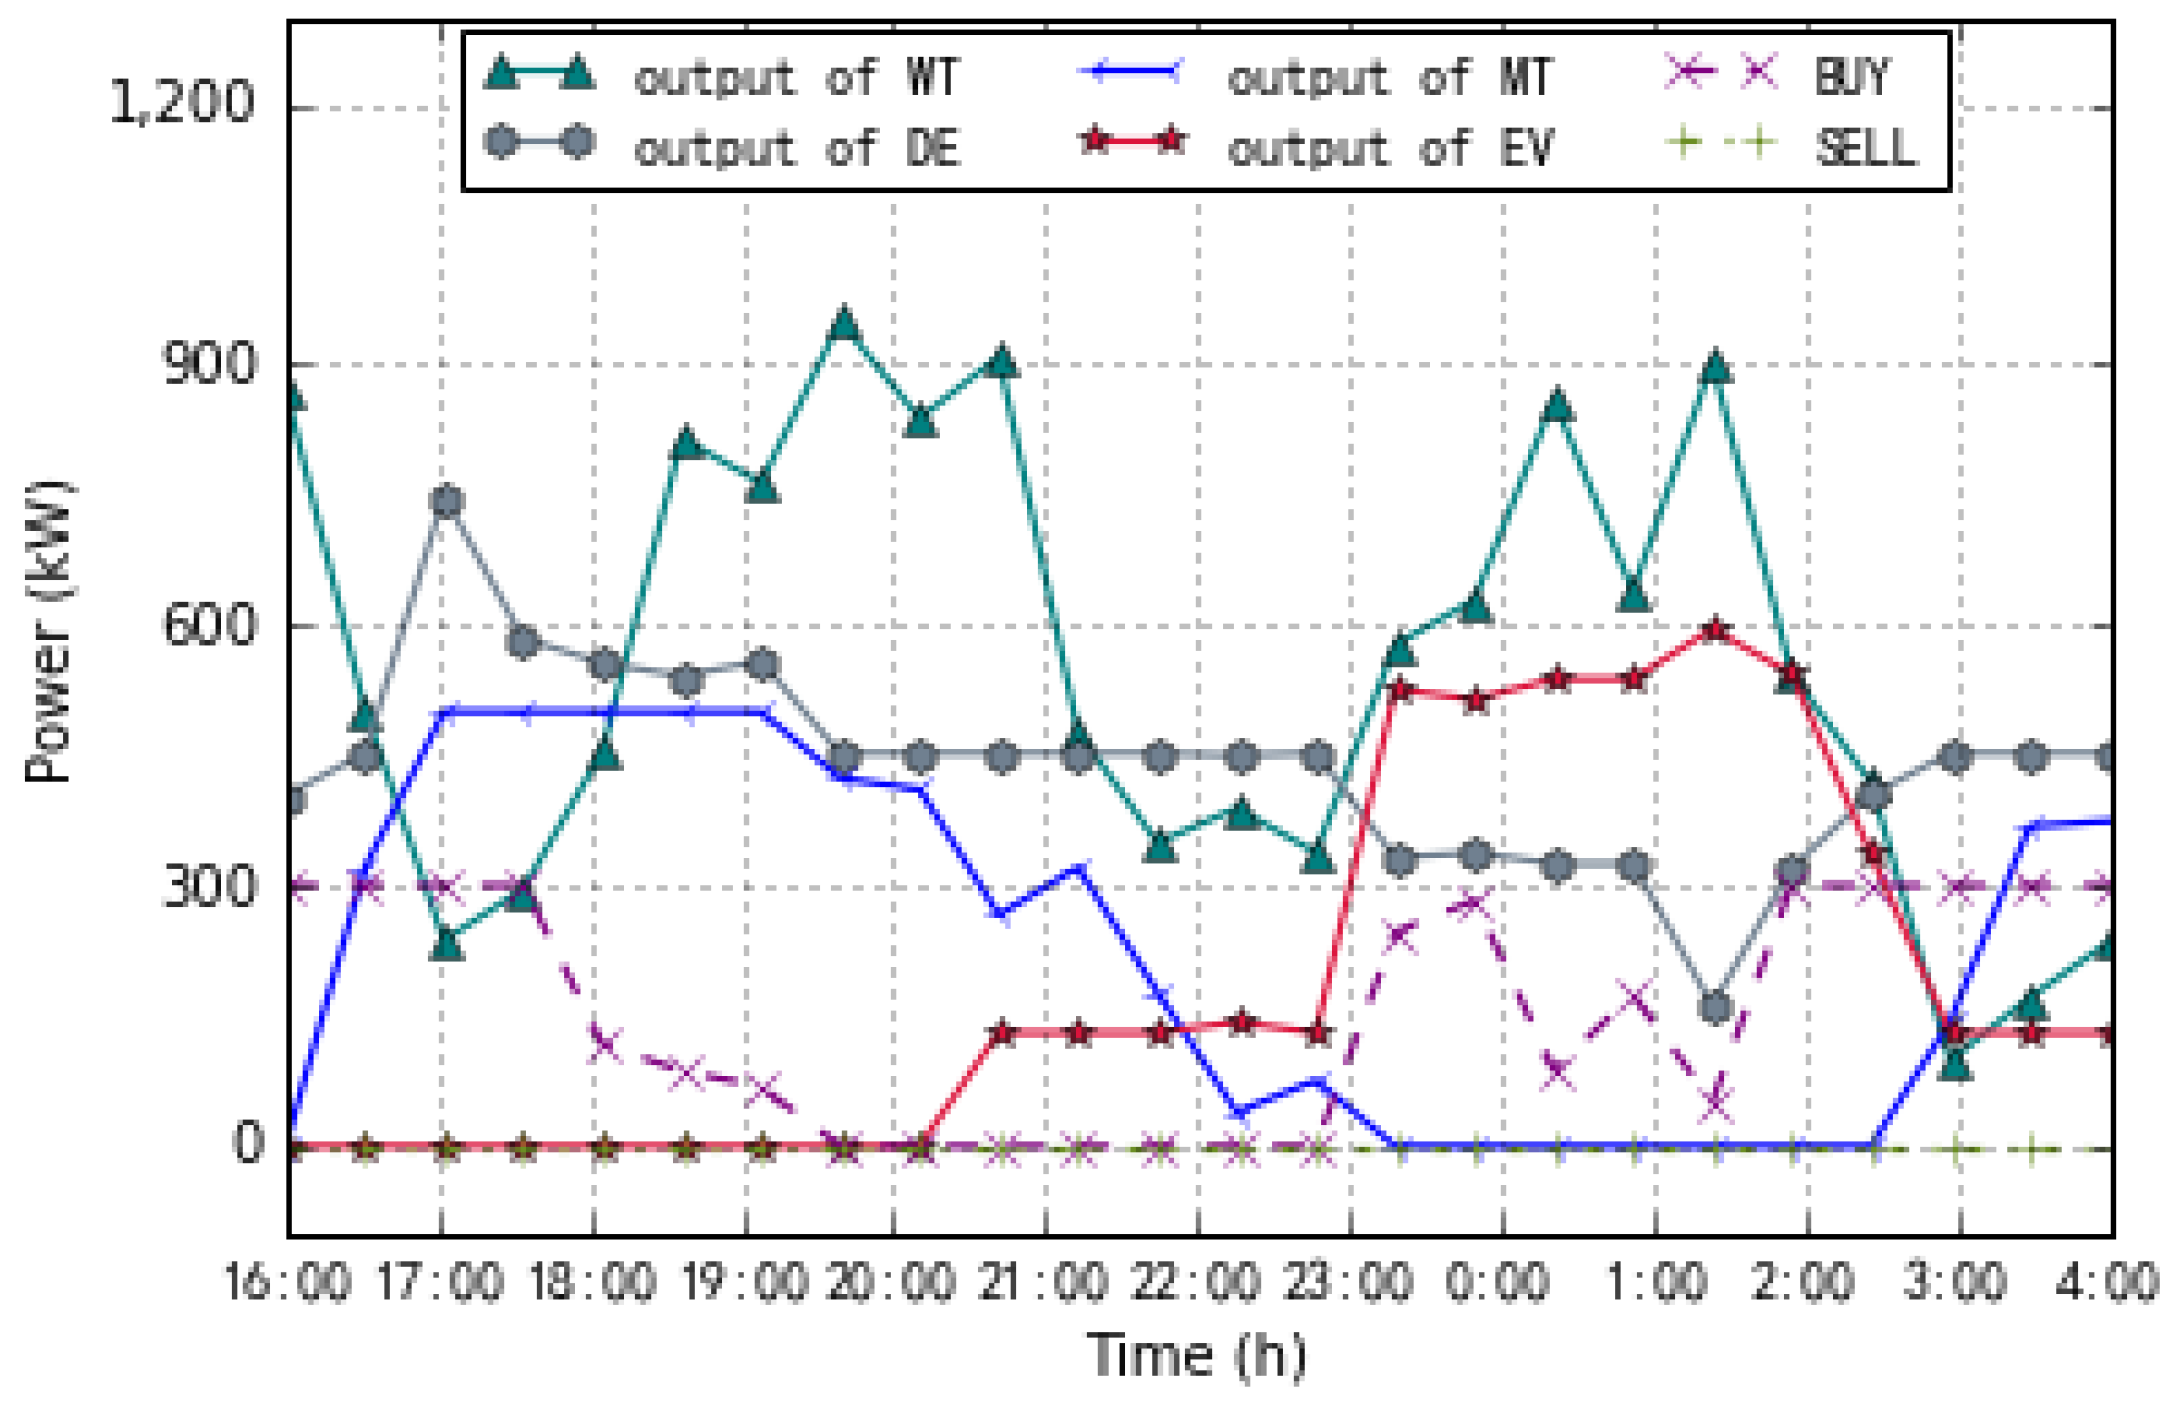
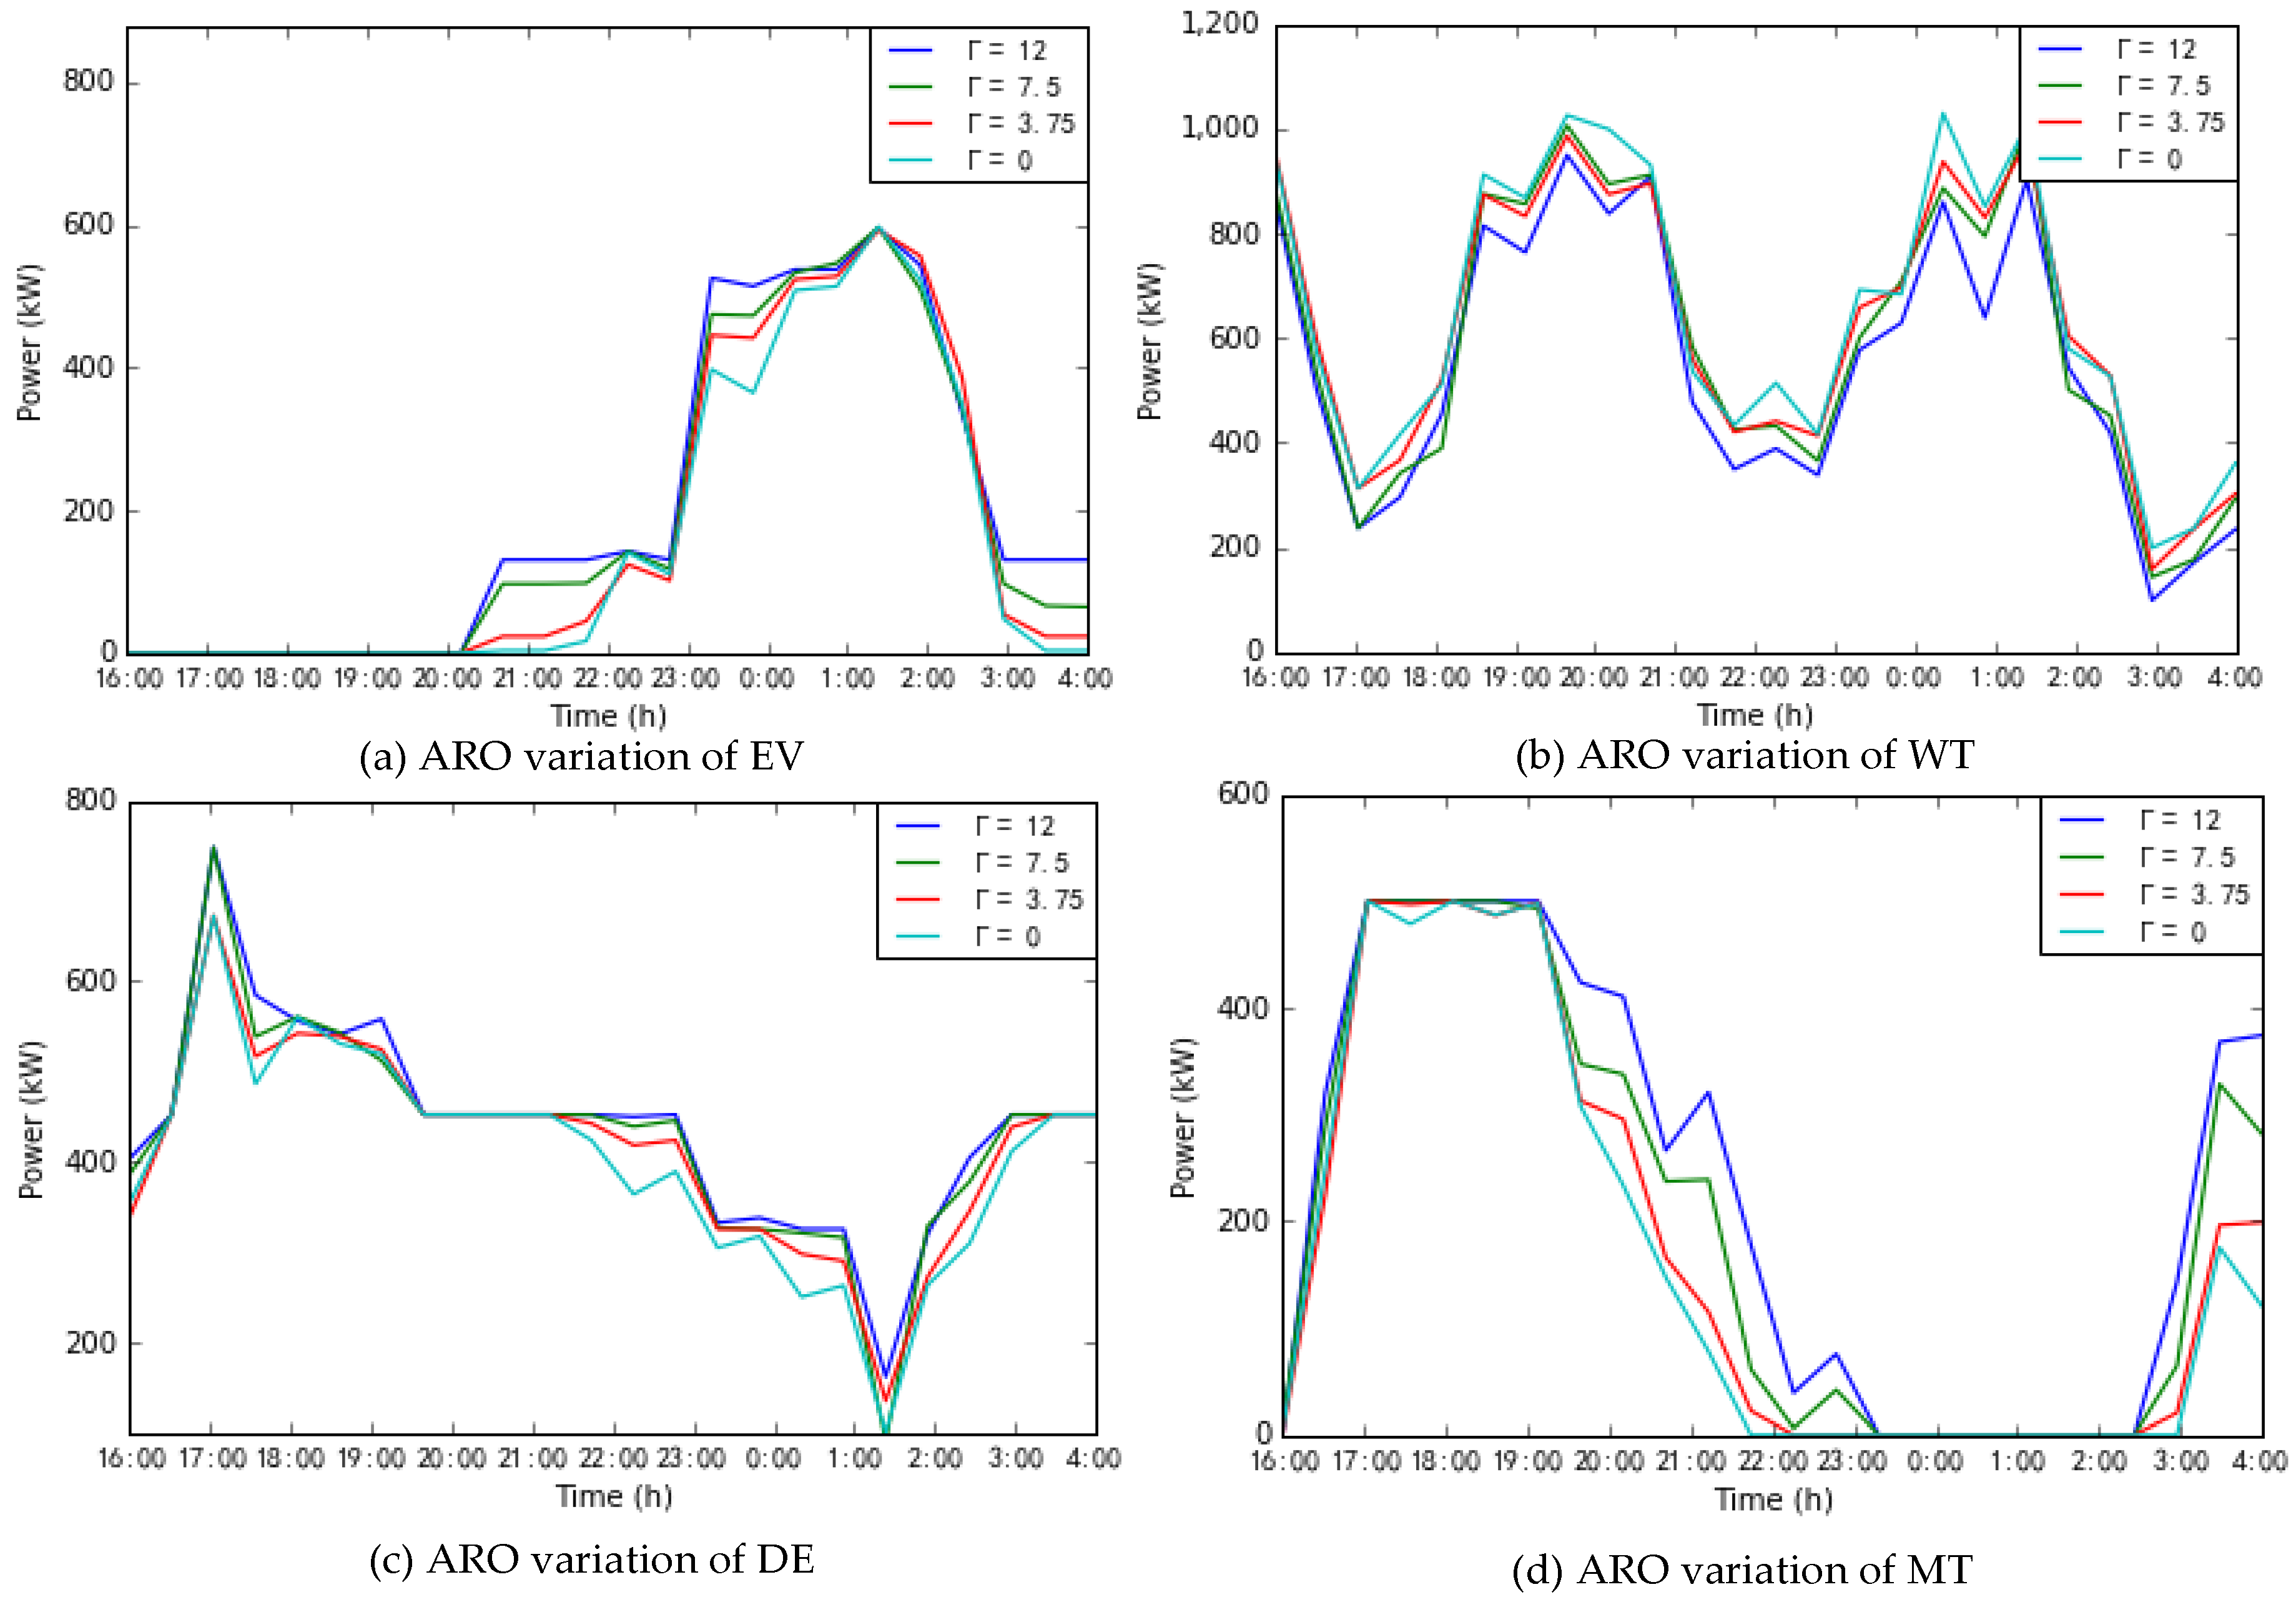
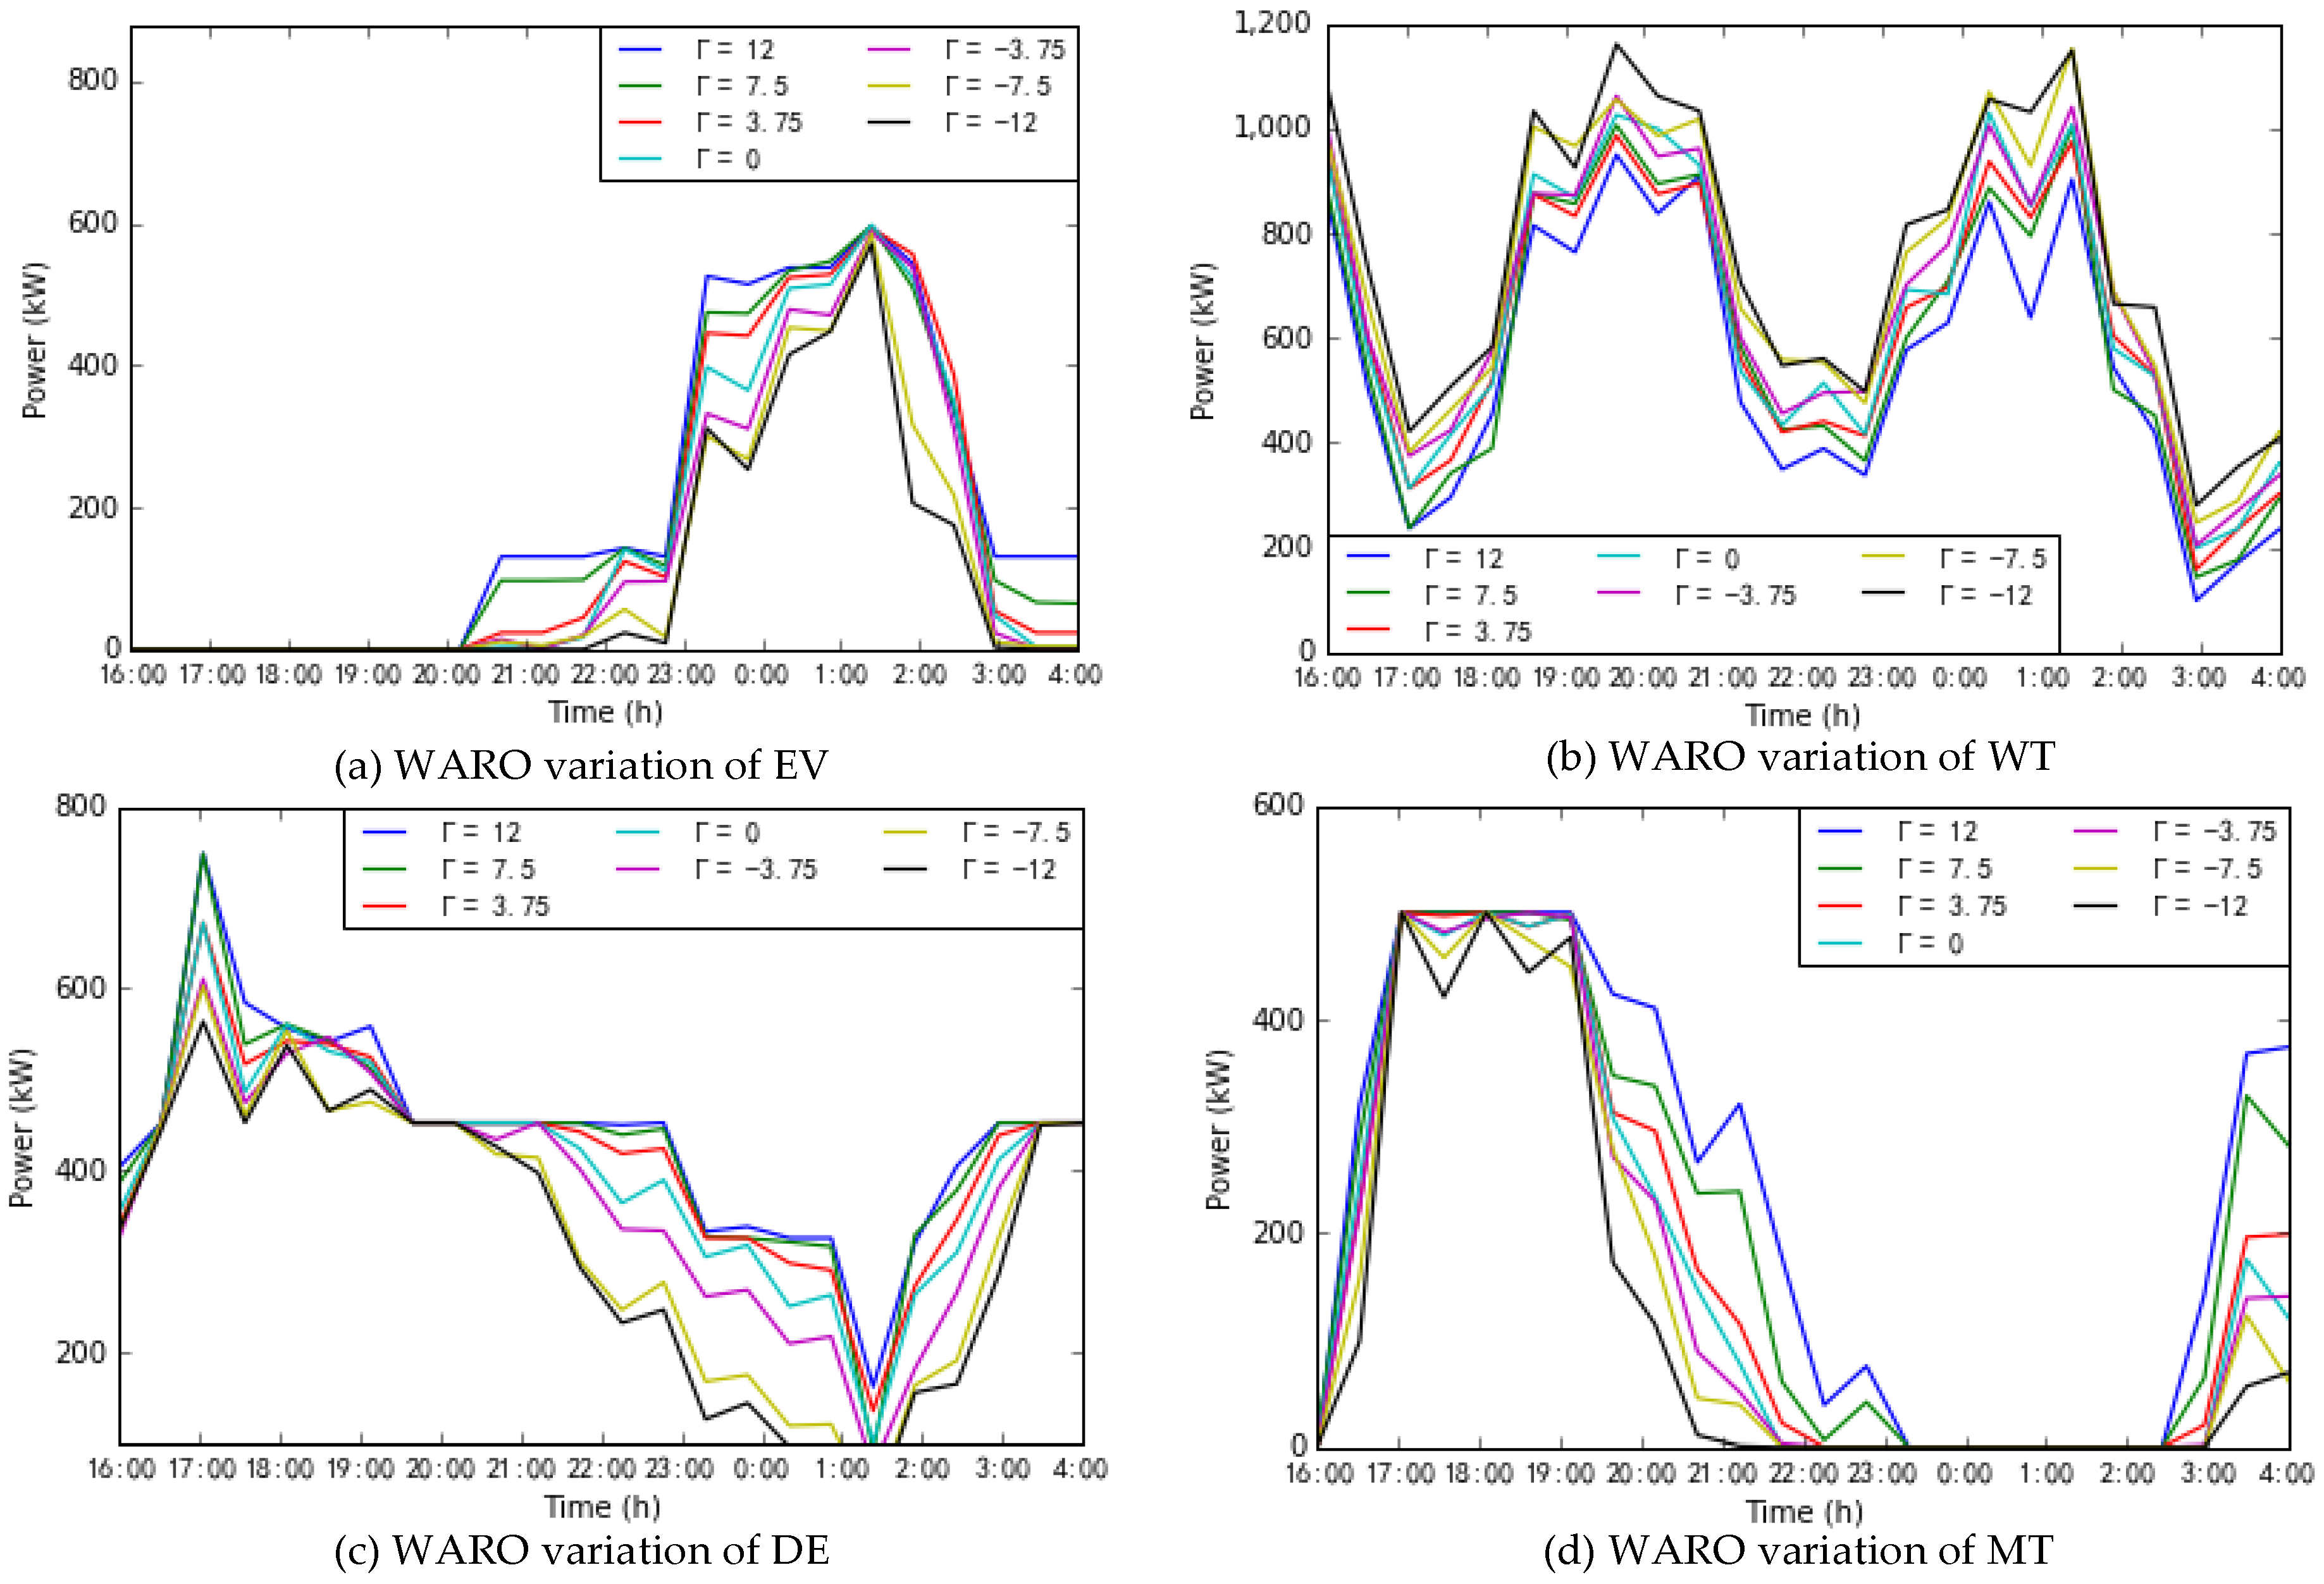
5.3.3. Case 3: Adjustable Robust Optimization Result

To relax the conservatism of robust optimization, we can set the dispatch interval coefficient to balance the robustness and the economy of the system. In other words, when the adjustable robust optimization (ARO) parameter Γt = 0, the mean values of the predicted available wind power and EVs’ charging loads are considered in the dispatch strategy, which represents the conventional SO dispatch. Uncertainty of predicted variables is not taken into consideration; the dynamics and robust performance of the system is not optimal. While with the increase of ARO parameter Γt, the dispatch strategy should consider more uncertainties to improve its robust performance, for RO it means fewer available WT outputs and more EVs charging loads. Therefore, the diesel generator increases its output so as to meet the load demands. The changing situation of DGs caused by the ARO parameter Γ is shown in Figure 7. Additionally, Figure 8 shows that the system robustness is increasing gradually while the system economy is decreasing gradually at the same time. The typical scenarios data are shown in Table 4.
As shown in Table 4, with the uncertainties (WTs and EVs) of the volatility decreases, the output of DEs, MTs and transmission power are increasing, which brings about the increasing operating cost.
State Γt = 0 represents the optimization result without robustness, with the increasing ARO parameter Γt, more uncertain factors are considered in the dispatch strategy, so that the robustness of the system turns to be stronger, while more operating cost is required to maintain the system robustness. Compared with the conventional SO dispatch (Γt = 0), the most conservative RO (Γt = 12) can reduce uncertainties, but the outputs of CGs and transmission power are increasing.
By numerical analysis, we can quantify the relationship and offer a reference curve to decision makers in Figure 8. There are 12 uncertainties in the system. To accurately express robustness, here we choose Bound 1 for analysis, which has been introduced in Section 4.2. For example, the requirement of robustness of a power system is 100% which means the CVP is 0.024%, at which time the economy of the system is at its worst. If constraints violation probability is set to be 0.34%, according to the proposed method, the value of uncertainties will be 10 and the total cost will be 21,162.8, and will reduce the operating cost by 3% from 21,843.8, which improves the system economy. Additionally, if the decision-maker wants to get the best economy, the uncertainty parameter Γt = 0, and the constraint violation is with the highest probability 62.73%.

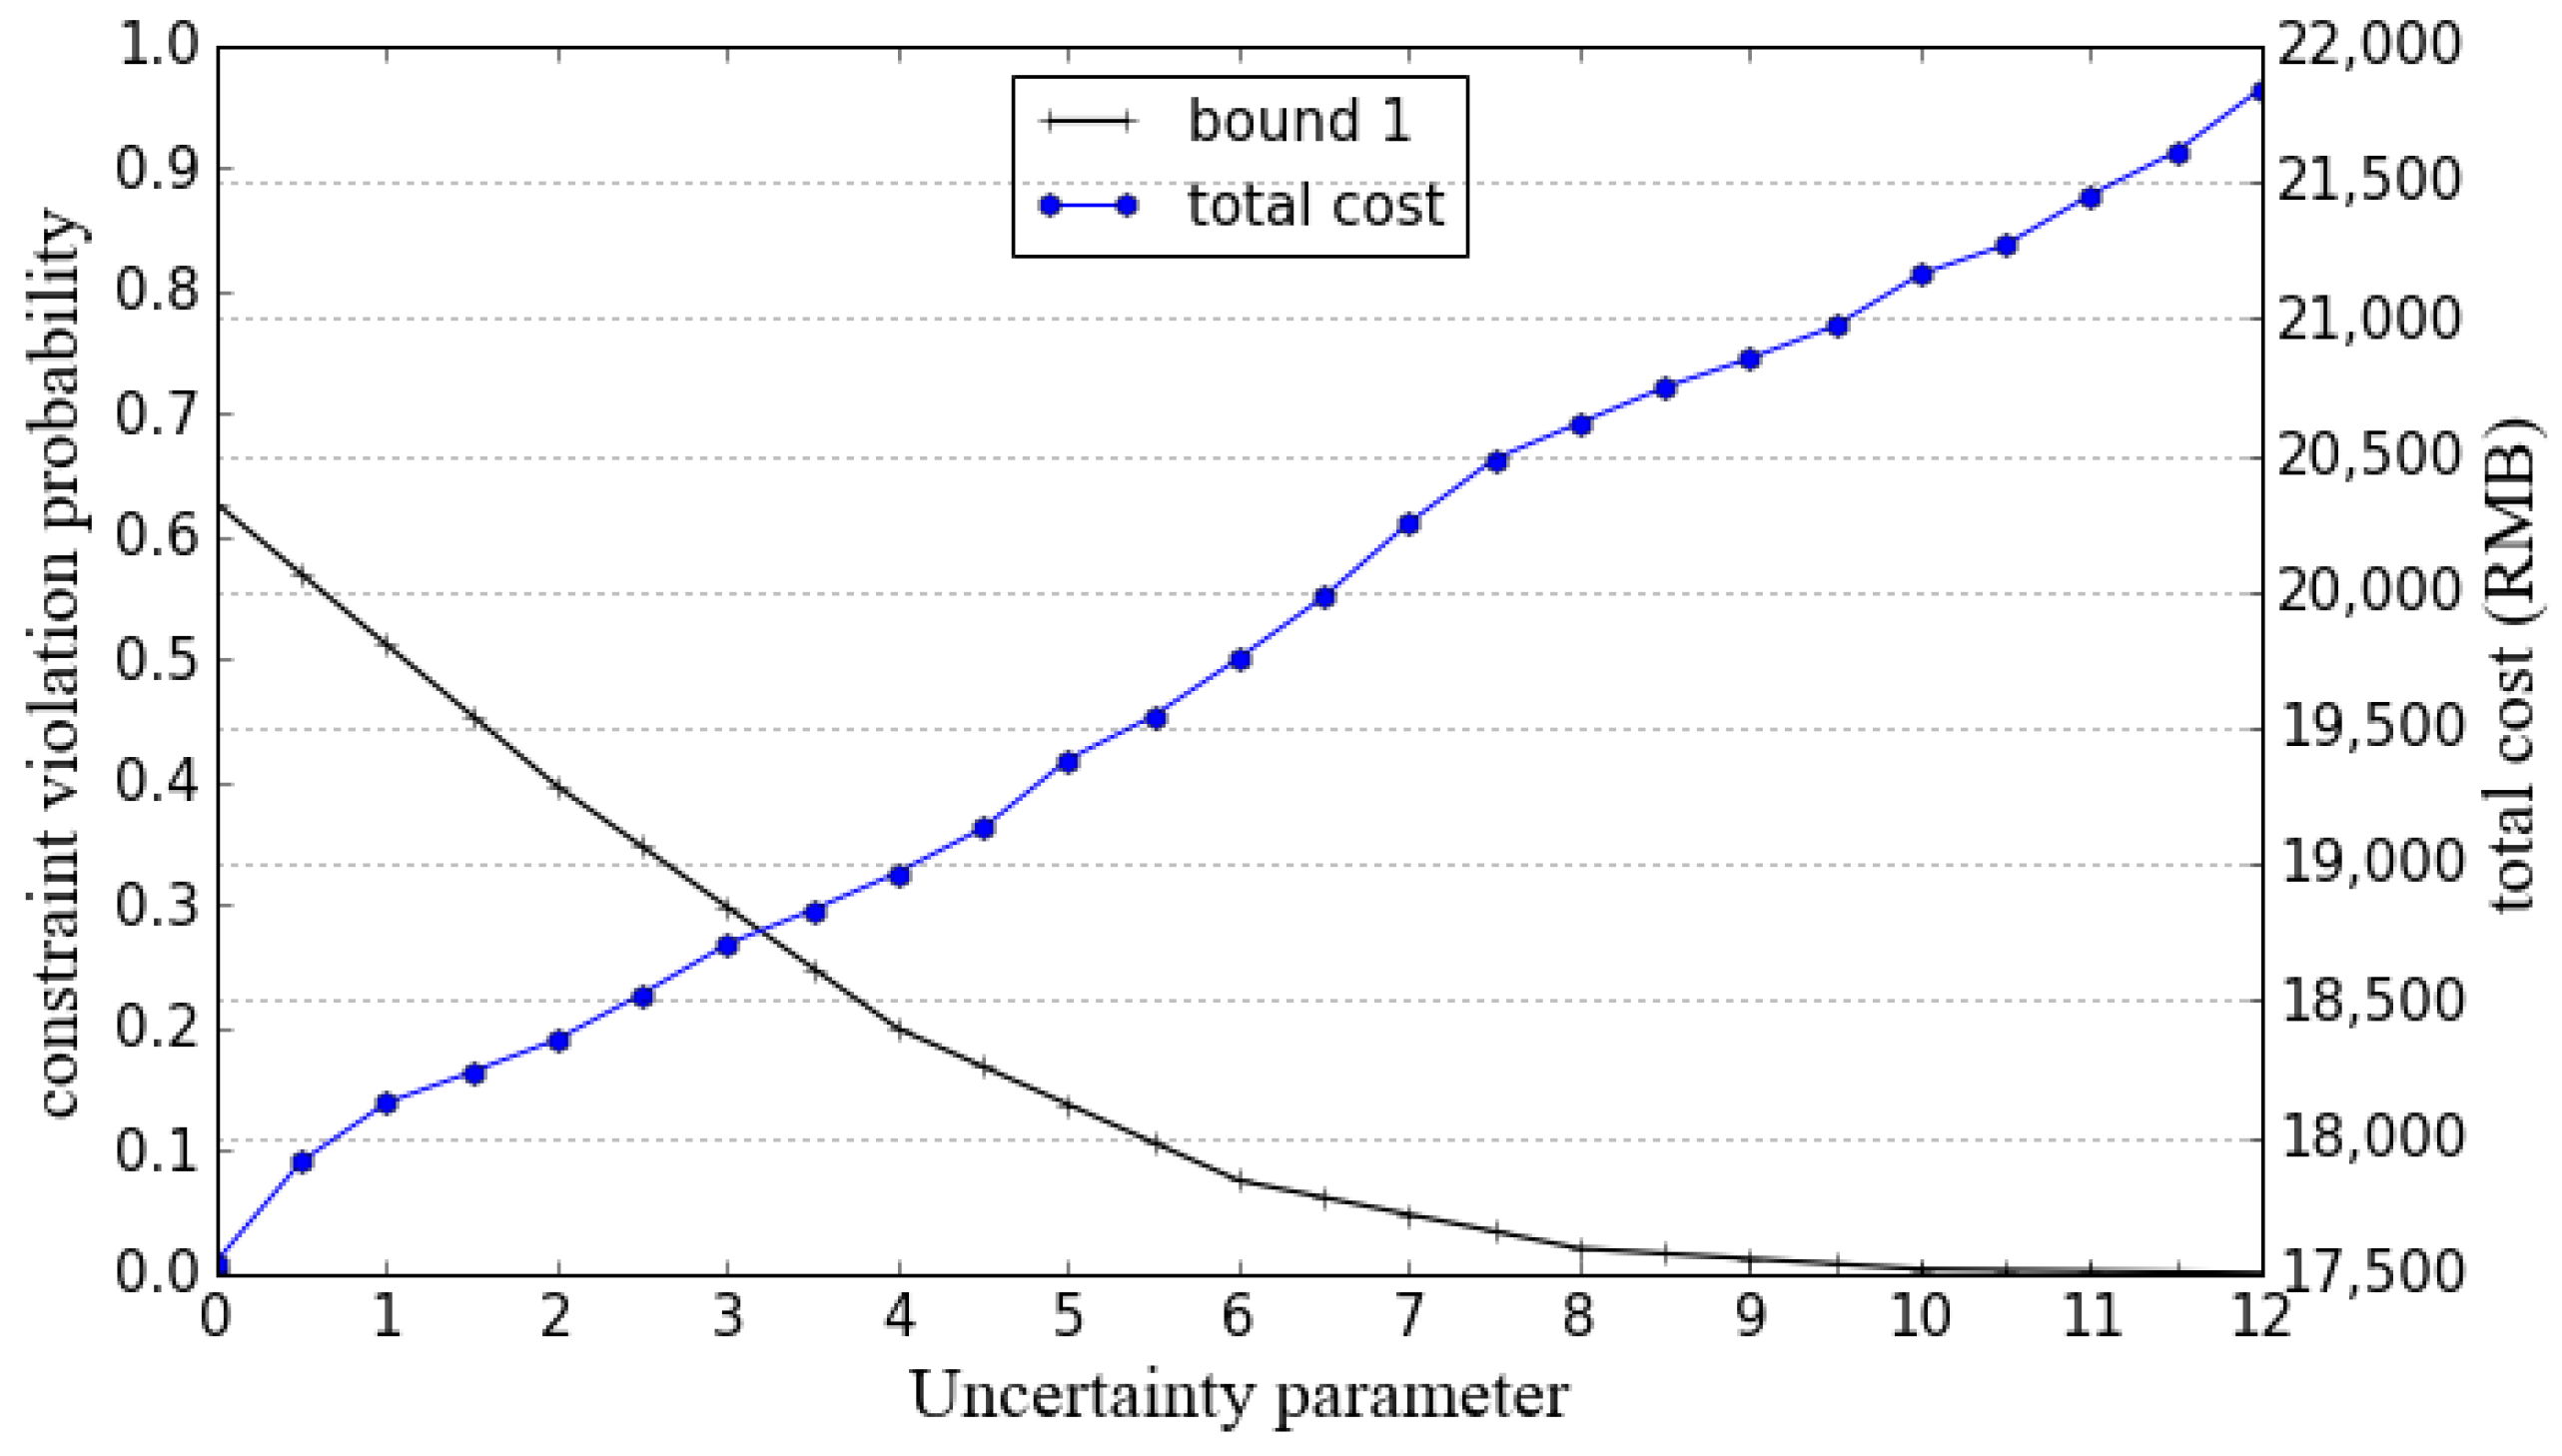
5.3.4. Case 4: Economic Analysis of Robust Invariant Set

The core aim of robust optimization is to find out the optimal cost under the condition of constraints and considering the worst condition. In order to facilitate the decision-maker’s economic analysis, this paper presents the economic law of the ARO parameter Γ to the best scenario shown in Figure 9. Comparing the case Γt = 0 and the case Γt = 12, in order to obtain the best robust performance, the dispatch system needs to provide additional 3865.3 (RMB), an increase of 21.5% in the total cost. On the other hand, for the system showing the best economy under the case Γt = −12, the cost can be reduced by 3126.5 (RMB), in contrast to the result of the SO result (Γt = 0).
Figure 10 shows details on the comparison of influence of uncertainties in the whole range of ARO parameters. As can be seen, with the Γ decreasing towards the best scenario the DG in the dispatch model reduces the output accordingly and reduces the total cost.

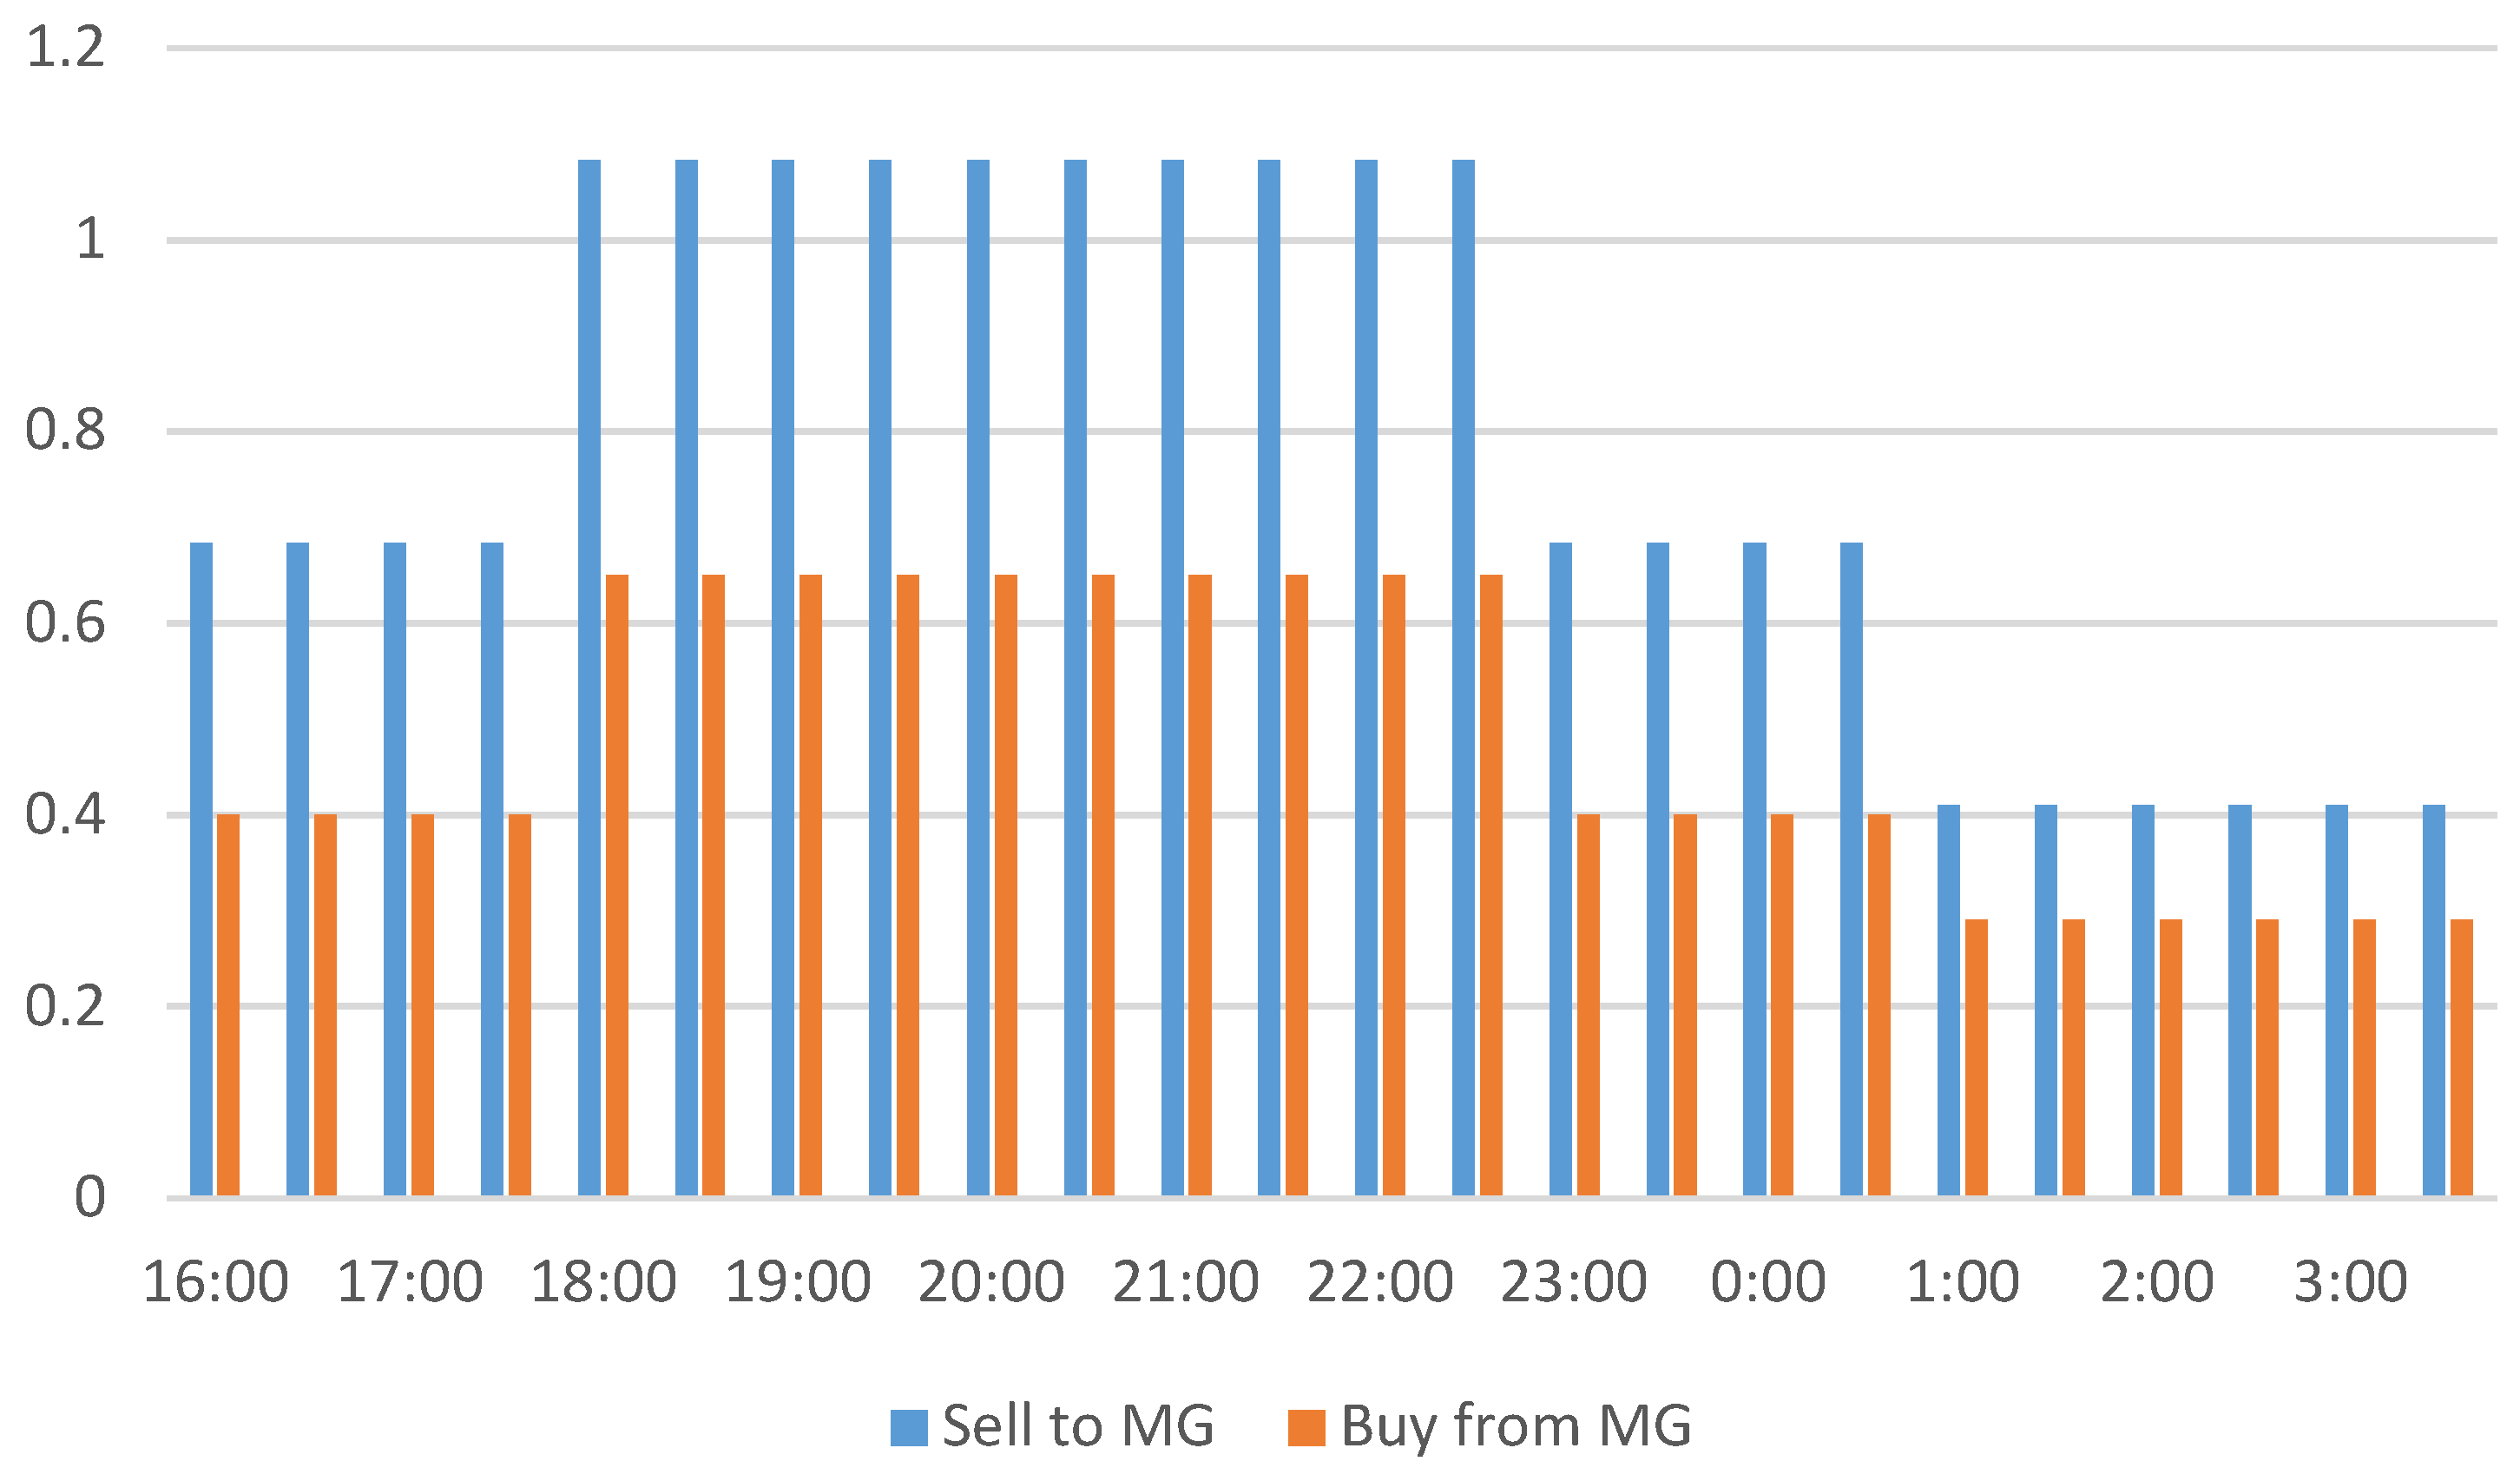
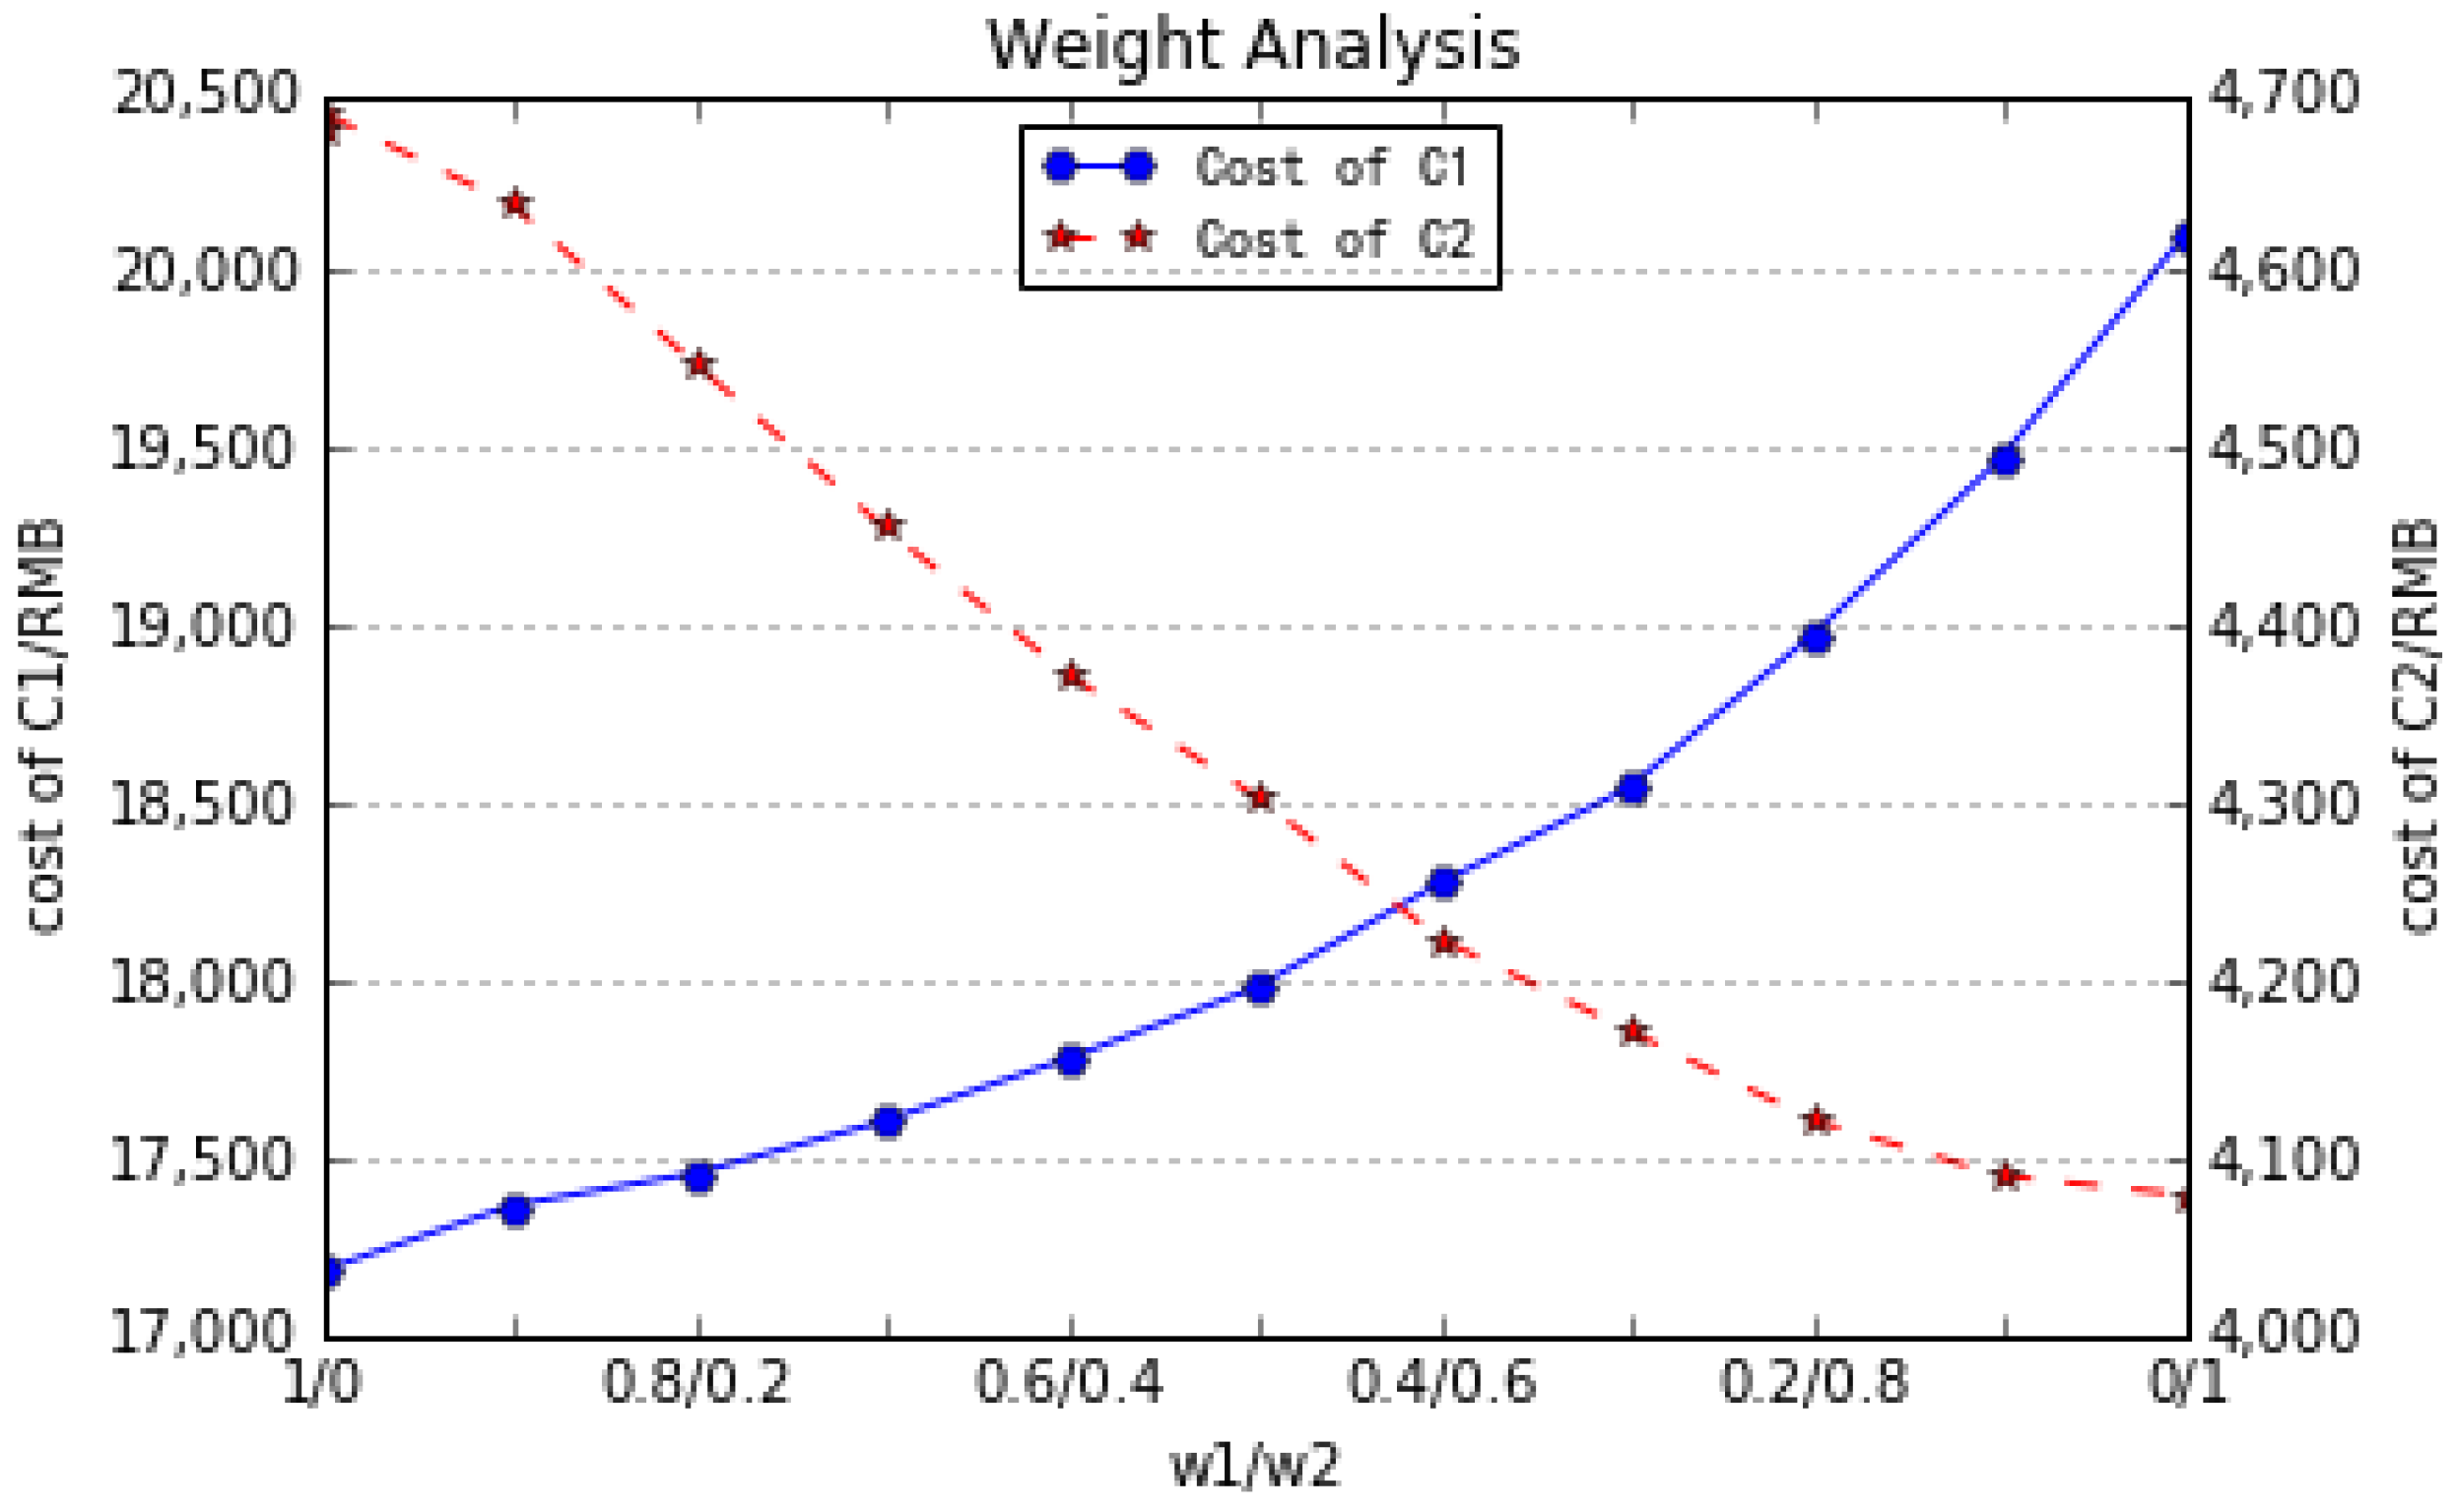
5.3.5. Case 5: Impact of Weighting Factors on the System

Figure 11 shows the effect of weight coefficients in the optimization results, i.e., the operation cost C1 and the emission cost C2. As the proportion of w1 gradually decreases, the cost of C2 led by w2 gradually increases. Therefore, the decision-maker needs to appropriately choose weight factors within the real application scenario.

6. Conclusions

Optimal load dispatch of microgrid is of great significance to reduce energy consumption, environmental pollution and electricity cost. In this paper, a multi-objective optimal dispatch problem for microgrid is considered. The DGs in the microgrid system include PV, WT, DE, MT and EVs, where the battery of an EV is treated as a mobile distributed energy storage device in the microgrid system. An adjustable robust optimization technique is employed to address the multi-objective optimal dispatch problem in a residential microgrid with wind power and EVs.
The main contributions of the proposed method lies in three aspects:
Firstly, compared to conventional dispatch strategy, the proposed method simultaneously takes the uncertainties of WT and EVs into consideration, and a robust optimization technique is also proposed to solve the dispatch problem under the worst scenario; with the dispatch strategy considering more uncertainties, the robustness of the microgrid is enhanced.
Secondly, the method considers both economic efficiency and robustness of the microgrid, in which a dispatch interval coefficient is introduced to reduce the operating cost under a certain premise of the system robustness. Therefore, the economic efficiency of the microgrid is improved.
Thirdly, using the concept of robust optimization, this paper systematically analyzes the solution in the range of uncertainties, combing the positive and negative impact of uncertain factors on system economy.
The proposed method provides an analytical tool for decision makers to quantify the economic operation of microgrid systems.

Author Contributions

The main part of the paper is written, designated and analyzed by R.S. and S.L. While C.S. has provided some key issue’s improvement strategy to strength the algorithm performance. K.Y.L. has provided consultant help and has corrected the written problems within the paper and has provided several very useful suggestions on the algorithm convergence proof process. Besides, The authors would also like to thank Da Liu at NCEPU for his helpful suggestions on the analysis of results and potential applications of the algorithm.

Acknowledgments

This research was funded by National Natural Science Foundation of China with grant number 61203100 and the Fundamental Research Funds for the Central Universities with grant number 16MS42.

Conflicts of Interest

The authors declare no conflicts of interest.

Nomenclature

A. Nouns, Numbers, and Sets
MGMicrogrid
CGConventional generation
OMOperation and maintenance
SOStochastic optimization
RORobust optimization
AROAdjustable robust optimization
WAROThe whole range of ARO
DEDiesel engine
MTMicro turbine
WTWind turbine
EVElectric vehicle
SOCState of charge
iThe number of distributed energy types, including DE, MT, and WT
P i , t The Output of distributed energy sources, including DE, MT, and WT
gNumber of diesel engines
lNumber of wind turbines
kNumber of Electric vehicle dispatch groups obtained according to the grouping dispatch approach
jNumber of Micro turbines
P E V t G The total predicted EVs charging power for k groups at time t
HThe total number of the pollutant emissions
P i , d o w n The lower regulation speed limit of i-the type DGs including DE and MT
P i , u p The upper regulation speed limit of i-the type DGs including DE and MT
P i , t m i n The minimum output power of i-th type DGs including DE and MT at time t
P i , t m a x The maximum output power of i-th type DGs including DE and MT at time t
B. Uncertain parts
LThe number of uncertainties for wind turbines
KThe number of uncertainties for electric vehicles
VThe wind speed
ηThe distribution parameter of Rayleigh distribution
αConfidence level
Vin, Vr, VoutCut-in, rated and cut-out wind speeds
WrRated wind power
a, bThe wind turbine parameters
PWTUncertain sets of wind turbines
P W T l , t G The predicted output of l-th wind turbine at time t
P W T l , t G _ _ _ _ , P W T l , t G The mean and variance of P W T l , t G
P W T l , t G ¯ , P W T l , t G _ The upper and lower bound of P W T l , t G
d, drThe distance of individual EV travelling and the maximum travel distance of the EV
μ, σThe mean and standard deviation of logarithmic normal distribution function
T s t a r t n Set of n-th EV predicted charging start time
T s t a r t n ¯ ,   T s t a r t n _ The upper and lower bound of T s t a r t n
S O C n Set of n-th EVs predicted SOC
S O C n ¯ , S O C n _ The upper and lower bound of S O C n
EThe battery capacity of an EV
Pthe charging power of the n-th EV
U E V Uncertain sets of electric vehicles
P E V t G The charging power of all EVs at time t
P E V t G _ _ _ _ , P E V t G The mean and variance P E V t G
P E V t G ¯ , P E V t G _ The upper and lower bound of P E V t G
η l , t Adjustable coefficient, which is used to adjust the uncertainty set of each uncertain variable, the range of η l , t is 0 to 1
Γ t The number of uncertainties at time t, which is not necessarily an integer
Γ t The integral part of uncertainties at time t
SThe collection of uncertain variables whose scheduling coefficient is integer
sThe collection of decimal part of uncertain variables whose scheduling coefficient is decimal
C. Variables
P D E g , t The output of g-th DE at time t
P M T j , t The output of j-th MT at time t
P W T l , t The output of l-th WT at time t
P g r i d , t The transmission power between the main grid and microgrid
P g r i d + The microgrid purchasing electricity from the main power grid
P g r i d The microgrid selling electricity to the main power grid
P E V k , t The charging power of k-th EV group at time t
E k , t The status of the k-th group EV at time t
E k , t 1 The status of the k-th group EV at last time t
E k e n d The energy demand of k-th group EV
E i n i The initial status of total EVs
E e n d The total EV charging demand
u i , h The pollutant discharge coefficients of the i-type DGs including DE, MT and WT
u g r i d , h The pollutant discharge coefficients of the main power grid
α t , β t , γ t , δ t The dual coefficients
D. Constants
Δ t A time period
C 1 ,   C 2 , C 3 The cost parameter of diesel engine
a n , b n , c n The battery degradation cost parameters
M s e l l , t , M b u y , t The coefficients for transmission between Main Grid to MG at time t
P c e l l The price of battery cell capacity
K O M The OM cost parameter
M n Current coefficient
C h The treatment cost of the h-th pollutant emission
V n o m Cell voltage
P b u y m i n , P b u y m a x The minimum and maximum price of the transmission power when purchasing electricity from the main power grid
P s e l l m i n , P s e l l m a x The minimum and maximum price of the transmission power when selling electricity from the main power grid
P E V k , t m a x The maximum charging power of k-th group EVs at time t
w 1 ,   w 2 The weight coefficient of multi-objective function
ξ The charging efficiency of EVs
L t Operating reserve
P l o a d , t The power load of residential area at time t
F. Function
C f ( · ) The fuel cost of CGs, including diesel engine
C O M ( · ) The operation and maintenance cost
C g r i d ( · ) The transmission cost between microgrid and the main power grid
C b a t ( · ) The degradation cost of EV
η ( P M T t ) The working efficiency of MT
M i n f 1 ( · ) Operating cost Minimization including the fuel cost and the operation and maintenance cost
M i n f 2 ( · ) Pollutants emission Minimization including CO2, SO2, NOx
C t o t a l The total cost function of dispatch problem
Q v , t The total power resulting from uncertainties including EVs and WTs
P r { a b } Constraints violation probability

References

  1. Liu, D.; Wang, Y.; Shen, Y. Electric Vehicle Charging and Discharging Coordination on Distribution Network Using Multi-Objective Particle Swarm Optimization and Fuzzy Decision Making. Energies 2016, 9, 186. [Google Scholar] [CrossRef]
  2. Asaleye, D.A.; Breen, M.; Murphy, M.D. A decision support tool for building integrated renewable energy microgrids connected to a smart grid. Energies 2017, 10, 1765. [Google Scholar] [CrossRef]
  3. Adderly, S.A.; Manukian, D.; Sullivan, T.D.; Son, M. Electric vehicles and natural disaster policy implications. Energy Policy 2018, 112, 437–448. [Google Scholar] [CrossRef]
  4. Long, X.; Zhang, P.; Chen, F.; Yu, Z. Optimal operation for microgrid using generalized demand side resources. Autom. Electr. Power Syst. 2013, 37, 7–12. [Google Scholar]
  5. Rahman, I.; Vasant, P.M.; Singh, S.M.; Abdullah-AI-Wadud, M.; Adnan, N. Review of recent trends in optimization techniques for plug-in hybrid, and electric vehicle charging infrastructures. Renew. Sustain. Energy Rev. 2016, 58, 1039–1047. [Google Scholar] [CrossRef]
  6. Zhang, D.; Wang, J.; Lin, Y.; Si, Y.; Huang, C. Present situation and future prospect of renewable energy in China. Renew. Sustain. Energy Rev. 2017, 76, 865–871. [Google Scholar] [CrossRef]
  7. An, K.; Song, K.B.; Hur, K. Incorporating Charging/Discharging Strategy of Electric Vehicles into Security-Constrained Optimal Power Flow to Support High Renewable Penetration. Energies 2017, 10, 729. [Google Scholar] [CrossRef]
  8. Xiao, Y.; Wang, X.; Wang, X.; Wu, Z.; Liu, W. The Coordinated Development Path of Renewable Energy and National Economy in China Considering Risks of Electricity Market and Energy Policy. IEEE Trans. Ind. Inform. 2017, 13, 2566–2575. [Google Scholar] [CrossRef]
  9. Qi, F.; Wen, F.; Liu, X.; Salam, M.A. A Residential Energy Hub Model with a Concentrating Solar Power Plant and Electric Vehicles. Energies 2017, 10, 1159. [Google Scholar] [CrossRef]
  10. Suganya, S.; Raja, S.C.; Srinivasan, D.; Venkatesh, P. Smart utilization of renewable energy sources in a microgrid system integrated with plug-in hybrid electric vehicles. Int. J. Energy Res. 2017. [Google Scholar] [CrossRef]
  11. Liu, Z.; Chen, Y.; Zhuo, R.; Jia, H. Energy storage capacity optimization for autonomy microgrid considering CHP and EV scheduling. Appl. Energy 2017, 210, 1113–1125. [Google Scholar] [CrossRef]
  12. Vavilapalli, V.S.; Sanjeevikumar, P.; Ramesh, V.; Umashanker, S.; Mihet-Popa, L. Study and analysis of intelligent microgrid energy management solution with distributed energy sources. Energies 2017, 10, 1419. [Google Scholar]
  13. Zhang, K.; Li, J.; He, Z.; Yan, W. Microgrid energy dispatching for industrial zones with renewable generations and electric vehicles via stochastic optimization and learning. Phys. A Stat. Mech. Appl. 2018, 501, 359–369. [Google Scholar] [CrossRef]
  14. Aghaei, J.; Nezhad, A.E.; Rabiee, A.; Rahimi, E. Contribution of plug-in hybrid electric vehicles in power system uncertainty management. Renew. Sustain. Energy Rev. 2016, 59, 450–458. [Google Scholar] [CrossRef]
  15. Mena, R.; Hennebel, M.; Li, Y.F.; Ruiz, C.; Zio, E. A risk-based simulation and multi-objective optimization framework for the integration of distributed renewable generation and storage. Renew. Sustain. Energy Rev. 2014, 37, 778–793. [Google Scholar] [CrossRef] [Green Version]
  16. Rabiee, A.; Sadeghi, M.; Aghaeic, J.; Heidari, A. Optimal operation of microgrids through simultaneous scheduling of electrical vehicles and responsive loads considering wind and PV units uncertainties. Renew. Sustain. Energy Rev. 2016, 57, 721–739. [Google Scholar] [CrossRef]
  17. Cardoso, G.; Stadler, M.; Bozchalui, M.C.; Sharma, R.; Marnay, C.; Barbosa-Povoa, A. Optimal investment and scheduling of distributed energy resources with uncertainty in electric vehicle driving schedules. Energies 2014, 64, 17–30. [Google Scholar] [CrossRef]
  18. Tuballa, M.L.; Abundo, M.L. A review of the development of smart grid technologies. Renew. Sustain. Energy Rev. 2016, 59, 710–725. [Google Scholar] [CrossRef]
  19. Mwasilu, F.; Justo, J.J.; Kim, E.K.; Do, T.D.; Jung, J.W. Electric vehicles and smart grid interaction: A review on vehicle to grid and renewable energy sources integration. Renew. Sustain. Energy Rev. 2014, 34, 501–516. [Google Scholar] [CrossRef]
  20. Nosratabadi, S.M.; Hooshmand, R.A.; Gholipour, E. A comprehensive review on microgrid and virtual power plant concepts employed for distributed energy resources scheduling in power systems. Renew. Sustain. Energy Rev. 2017, 67, 341–363. [Google Scholar] [CrossRef]
  21. Elsied, M.; Oukaour, A.; Gualous, H.; Brutto, O. Optimal economic and environment operation of micro-grid power systems. Energy Convers. Manag. 2016, 122, 182–194. [Google Scholar] [CrossRef]
  22. Zakariazadeh, A.; Jadid, S.; Siano, P. Multi-objective scheduling of electric vehicles in smart distribution system. Energy Convers. Manag. 2014, 79, 43–53. [Google Scholar] [CrossRef]
  23. Gazijahani, F.S.; Salehi, J. Stochastic multi-objective framework for optimal dynamic planning of interconnected microgrids. IET Renew. Power Gener. 2017, 11, 1749–1759. [Google Scholar] [CrossRef]
  24. Tu, A.N.; Crow, M.L. Stochastic optimization of renewable-based microgrid operation incorporating battery operating cost. IEEE Trans. Power Syst. 2016, 31, 2289–2296. [Google Scholar]
  25. Reddy, K.S.; Panwar, L.K.; Kumar, R.; Panigrahi, B.K. Distributed resource scheduling in smart grid with electric vehicle deployment using fireworks algorithm. J. Mod. Power Syst. Clean Energy 2016, 4, 188–199. [Google Scholar] [CrossRef] [Green Version]
  26. Bertsimas, D.; Brown, D.B.; Caramanis, C. Theory and applications of robust optimization. SIAM Rev. 2010, 53, 464–501. [Google Scholar] [CrossRef]
  27. Tang, M.; Tong, X.J.; Wen, Q. Security economic dispatch of power system integrated with wind farms considering uncertainty of network parameters. Proc. Chin. Soc. Univ. Electr. Power Syst. Autom. 2012, 24, 27–34. [Google Scholar]
  28. Ben-Tal, A.; Goryashko, A.; Guslitzer, E.; Nemirovski, A. Adjustable robust solutions of uncertain linear programs. Math. Program. 2004, 99, 351–376. [Google Scholar] [CrossRef]
  29. Bertsimas, D.; Sim, M. The price of robustness. Oper. Res. 2004, 52, 35–53. [Google Scholar] [CrossRef]
  30. Pirouzi, S.; Aghaei, J.; Vahidinasab, V.; Niknam, T.; Khodaei, A. Robust linear architecture for active/reactive power scheduling of EV integrated smart distribution networks. Electr. Power Syst. Res. 2018, 155, 8–20. [Google Scholar] [CrossRef]
  31. Zhou, Y.; Yau, D.; You, P.; Cheng, P. Optimal-cost scheduling of electrical vehicle charging under uncertainty. IEEE Trans. Smart Grid 2017. [Google Scholar] [CrossRef]
  32. Soares, J.; Vale, Z.; Borges, N.; Lezama, F.; Kagan, K. Multi-objective robust optimization to solve energy scheduling in buildings under uncertainty. In Proceedings of the International Conference on Intelligent System Application to Power Systems, San Antonio, TX, USA, 17–21 September 2017; pp. 1–6. [Google Scholar]
  33. Liu, K.; Gao, F. Scenario adjustable scheduling model with robust constraints for energy intensive corporate microgrid with wind power. Renew. Energy 2017, 113, 1–10. [Google Scholar] [CrossRef]
  34. Wei, W.; Liu, F.; Mei, S.; Hou, Y. Robust energy and reserve dispatch under variable renewable generation. IEEE Trans. Smart Grid 2014, 6, 369–380. [Google Scholar] [CrossRef]
  35. Shi, R.; Sun, C.; Zhou, Z.; Zhang, L.; Liang, Z. A robust economic dispatch of residential microgrid with wind power and electric vehicle integration. In Proceedings of the 2016 Chinese Control and Decision Conference, Yinchuan, China, 28–30 May 2016; pp. 3672–3676. [Google Scholar]
  36. Tian, L.; Shi, S.; Jia, Z. A statistical model for charging demand of electric vehicles. Power Syst. Technol. 2010, 34, 127–130. [Google Scholar]
  37. Shao, C.; Wang, X.; Wang, X.; Du, C. Layered and distributed charge load dispatch of considerable electric vehicles. IEEE Trans. Power Syst. 2015, 30, 1858–1867. [Google Scholar] [CrossRef]
  38. Adhikari, A. Multi-objective operation management of a renewable MG (micro-grid) with back-up micro-turbine/fuel cell/battery hybrid power source. Energies 2011, 36, 6490–6507. [Google Scholar]
  39. Forman, J.; Stein, J.; Fathy, H. Optimization of dynamic battery paramter characterization experiments via differential evolution. In Proceedings of the American Control Conference, Washington, DC, USA, 17–19 June 2013; pp. 867–874. [Google Scholar]
  40. Lu, X.; Zhou, K.; Yang, S. Multi-objective optimal dispatch of microgrid containing electric vehicles. J. Clean. Prod. 2017, 165, 1572–1581. [Google Scholar] [CrossRef]
  41. Xiang, Y.; Liu, J.; Wei, Z.; Cao, Y.; Jiang, D.; Ai, F. Robust model of microgrid energy optimization with uncertain renewable energy sources. Proc. Chin. Soc. Electr. Eng. (Proc. CSEE) 2014, 34, 3063–3072. [Google Scholar]
  42. Chen, D.; Zhu, G. An investigation on optimal load distribution of microgrids. Autom. Electr. Power Syst. 2010, 34, 45–49. [Google Scholar]
  43. Ma, Z.; Zou, S.; Ran, L.; Shi, X.; Hiskens, I.A. Efficient decentralized coordination of large-scale plug-in electric vehicle charging. Automatica 2016, 69, 35–47. [Google Scholar] [CrossRef]
Figure 1. The structure diagram of the scheduling system.
Energies 11 02050 g001
Figure 2. Robust interval schematic.
Energies 11 02050 g002
Figure 3. Initial status of a microgrid.
Energies 11 02050 g003
Figure 4. Time-of-use electricity price.
Energies 11 02050 g004
Figure 5. Stochastic optimization result.
Energies 11 02050 g005
Figure 6. Robust optimization under the worst scenarios.
Energies 11 02050 g006
Figure 7. ARO variation of DGs.
Energies 11 02050 g007
Figure 8. The relationship between operating cost and constraint violation probability.
Energies 11 02050 g008
Figure 9. Economic changes in the ARO parameter.
Energies 11 02050 g009
Figure 10. Comparison of DG performances for different ARO parameters.
Energies 11 02050 g010
Figure 11. The effect of weight coefficients on operation cost and emission cost.
Energies 11 02050 g011
Table 1. Data of capacity limits.
TypeMaximum Value
Diesel engine (kW)1500
Micro turbine (kW)250
Wind turbine (kW)500
Battery capacity (kW)60
SOC lower/upper limits (%)10/100
Charging power limit (kWh)6
P g r i d + (kW)300
P g r i d (kW)150
Table 2. Operation and maintenance coefficients of distributed generations (DGs).
TypeDEMTWT
Kom (¥/kWh) *0.040.080.00294
* ¥ is Yuan in Chinese monetary unit.
Table 3. Environmental parameters.
TypeTreatment Cost (¥/kg)Pollutant Emission Coefficient (g/kW)
DEMTWTMain Grid
CO20.216807240889
SO260.3060.003601.8
NOx810.090.201.6
Table 4. Multi-objective dispatch robust optimization (RO) result under the adjustable robust optimization (ARO) parameter Γ.
TypeDEMTWT P grid +   P grid   EVC1C2CVP
Γ = 1210,878.05262.712,625.54190.804706.017,342.24501.60.02%
Γ = 1110,835.95219.512,764.24116.904685.516,987.54446.80.18%
Γ = 1010,772.75094.912,971.14025.504613.216,749.74413.10.34%
Γ = 8.7510,613.84623.913,855.63729.704572.016,097.94286.21.39%
Γ = 7.510,551.14525.514,192.03436.404454.015,784.04162.93.41%
Γ = 6.2510,414.04317.114,480.73250.504211.315,462.84150.16.87%
Γ = 510,370.34233.114,439.53210.504002.414,975.34084.513.75%
Γ = 3.7510,311.34152.714,657.53111.203981.715,124.44071.122.41%
Γ = 2.510,039.83982.615,220.12917.703909.214,449.63938.937.76%
Γ = 09763.03954.115,313.42798.2−25.73552.014,135.43843.162.73%

