1. Introduction
Shale gas is becoming an important alternative energy source as the demand for energy increases. Shale gas has the potential to affect not only the natural gas market, but also the entire global energy mix. Since 2000, improvements in gas recovery technologies from shale formations have encouraged the industry to accelerate the development of these resources. A combination of two technologies, horizontal well drilling and multi-stage hydraulic fracturing, has made shale gas production economically feasible [
1]. Fractures created around a horizontal well by multi-stage fracturing have worked well for gas production because they increase the permeability of the rock and surface area in contact with resources in tight rock reservoirs. However, many unknowns remain with respect to the effects of hydraulic fracturing in production. A better understanding of the fracturing process, especially fracture development patterns, is necessary in order to enhance productivity.
Laboratory experiments on hydraulic fracturing and observation of the induced fractures are an effective approach for investigating fracturing processes. Many fracturing experiments have been performed in the laboratory to date (e.g., [
2,
3,
4]). However, it is not easy to observe the induced fracture patterns and their influence regions precisely, even in the laboratory. For example, acoustic emission (AE) monitoring is an effective way to analyze fracture propagation mechanisms [
3,
5,
6]. Although much information can be drawn from AE data, identifying micron-scale fracture patterns is impossible because of measurement and analytical errors. In recent years, experiments using transparent materials such as glass and acrylic resin have furnished many interesting results [
7,
8,
9]. This approach is also beneficial, but experiments using rock samples from resource exploitation targets are necessary in order to understand the relationship between fracture propagation and rock texture/mineral composition. CT scanning is also useful for obtaining 3D fracture images [
10,
11,
12] but its analytical resolution is limited. It is quite difficult to visualize micron-scale fracture morphologies in rocks and their relation to peculiar microstructures in shale [
13,
14].
Nishiyama and Kusuda [
15] suggested an effective observation method for fractures in rock specimens. They soaked rock specimens in resin mixed with a fluorescent substance to fill pores and fractures. Observations were then performed on cut surfaces under ultraviolet (UV) light, allowing observation of the resin-impregnated region with micron-scale accuracy [
15,
16]. Chen et al. [
17], Ishida et al. [
18], and Bennour et al. [
19,
20] applied this method to observe fracture structures induced by hydraulic fracturing experiments in the laboratory. Although this method worked well, it was impossible to distinguish newly induced fractures and regions impregnated with fluid during the fracturing process from preexisting cracks and/or pores.
To overcome this problem, in this study we conduct hydraulic fracturing experiments using the resin as a fracturing fluid. The resin impregnated within the specimen is hardened by heating just after fracturing, allowing us to distinguish fluid-impregnated regions, including hydraulically induced fractures, from other regions. The advantages of this method are as follows: (1) We can observe not only fractures but also the affected regions impregnated by fluid; (2) Because the hardened resin is fixed tightly, we can obtain polished thin sections while preserving the impregnated resin, allowing us to make microscopic observations; (3) Because the resin used has a viscosity similar to that of water at room temperature, results similar to fracturing by water can be expected. In this study, we introduce a new method of observing hydraulically induced fractures and surrounding regions impregnated by fluid. We show examples of experimental results using shale samples extracted from three different sites, representing complex propagation patterns resulting from interactions with constituent minerals and preexisting discontinuities in the rocks.
2. Methodology
2.1. Hydraulic Fracturing Experiment in the Laboratory
In the present study, we conducted six series of hydraulic fracturing experiments for shale specimens of cylindrical and rectangular shapes as shown in
Table 1. The specimens had different sizes mainly because of different sampling procedures. An injection hole (either 6 or 10 mm in diameter) perpendicular to the longitudinal direction was drilled at the center of each specimen for hydraulic fracturing. The specimens were shaped so that the directions of their sedimentary planes were orthogonal to their longitudinal directions, resulting in injection holes parallel to the sedimentary planes. This configuration was intended to simulate a horizontal well in shale gas/oil development in the field.
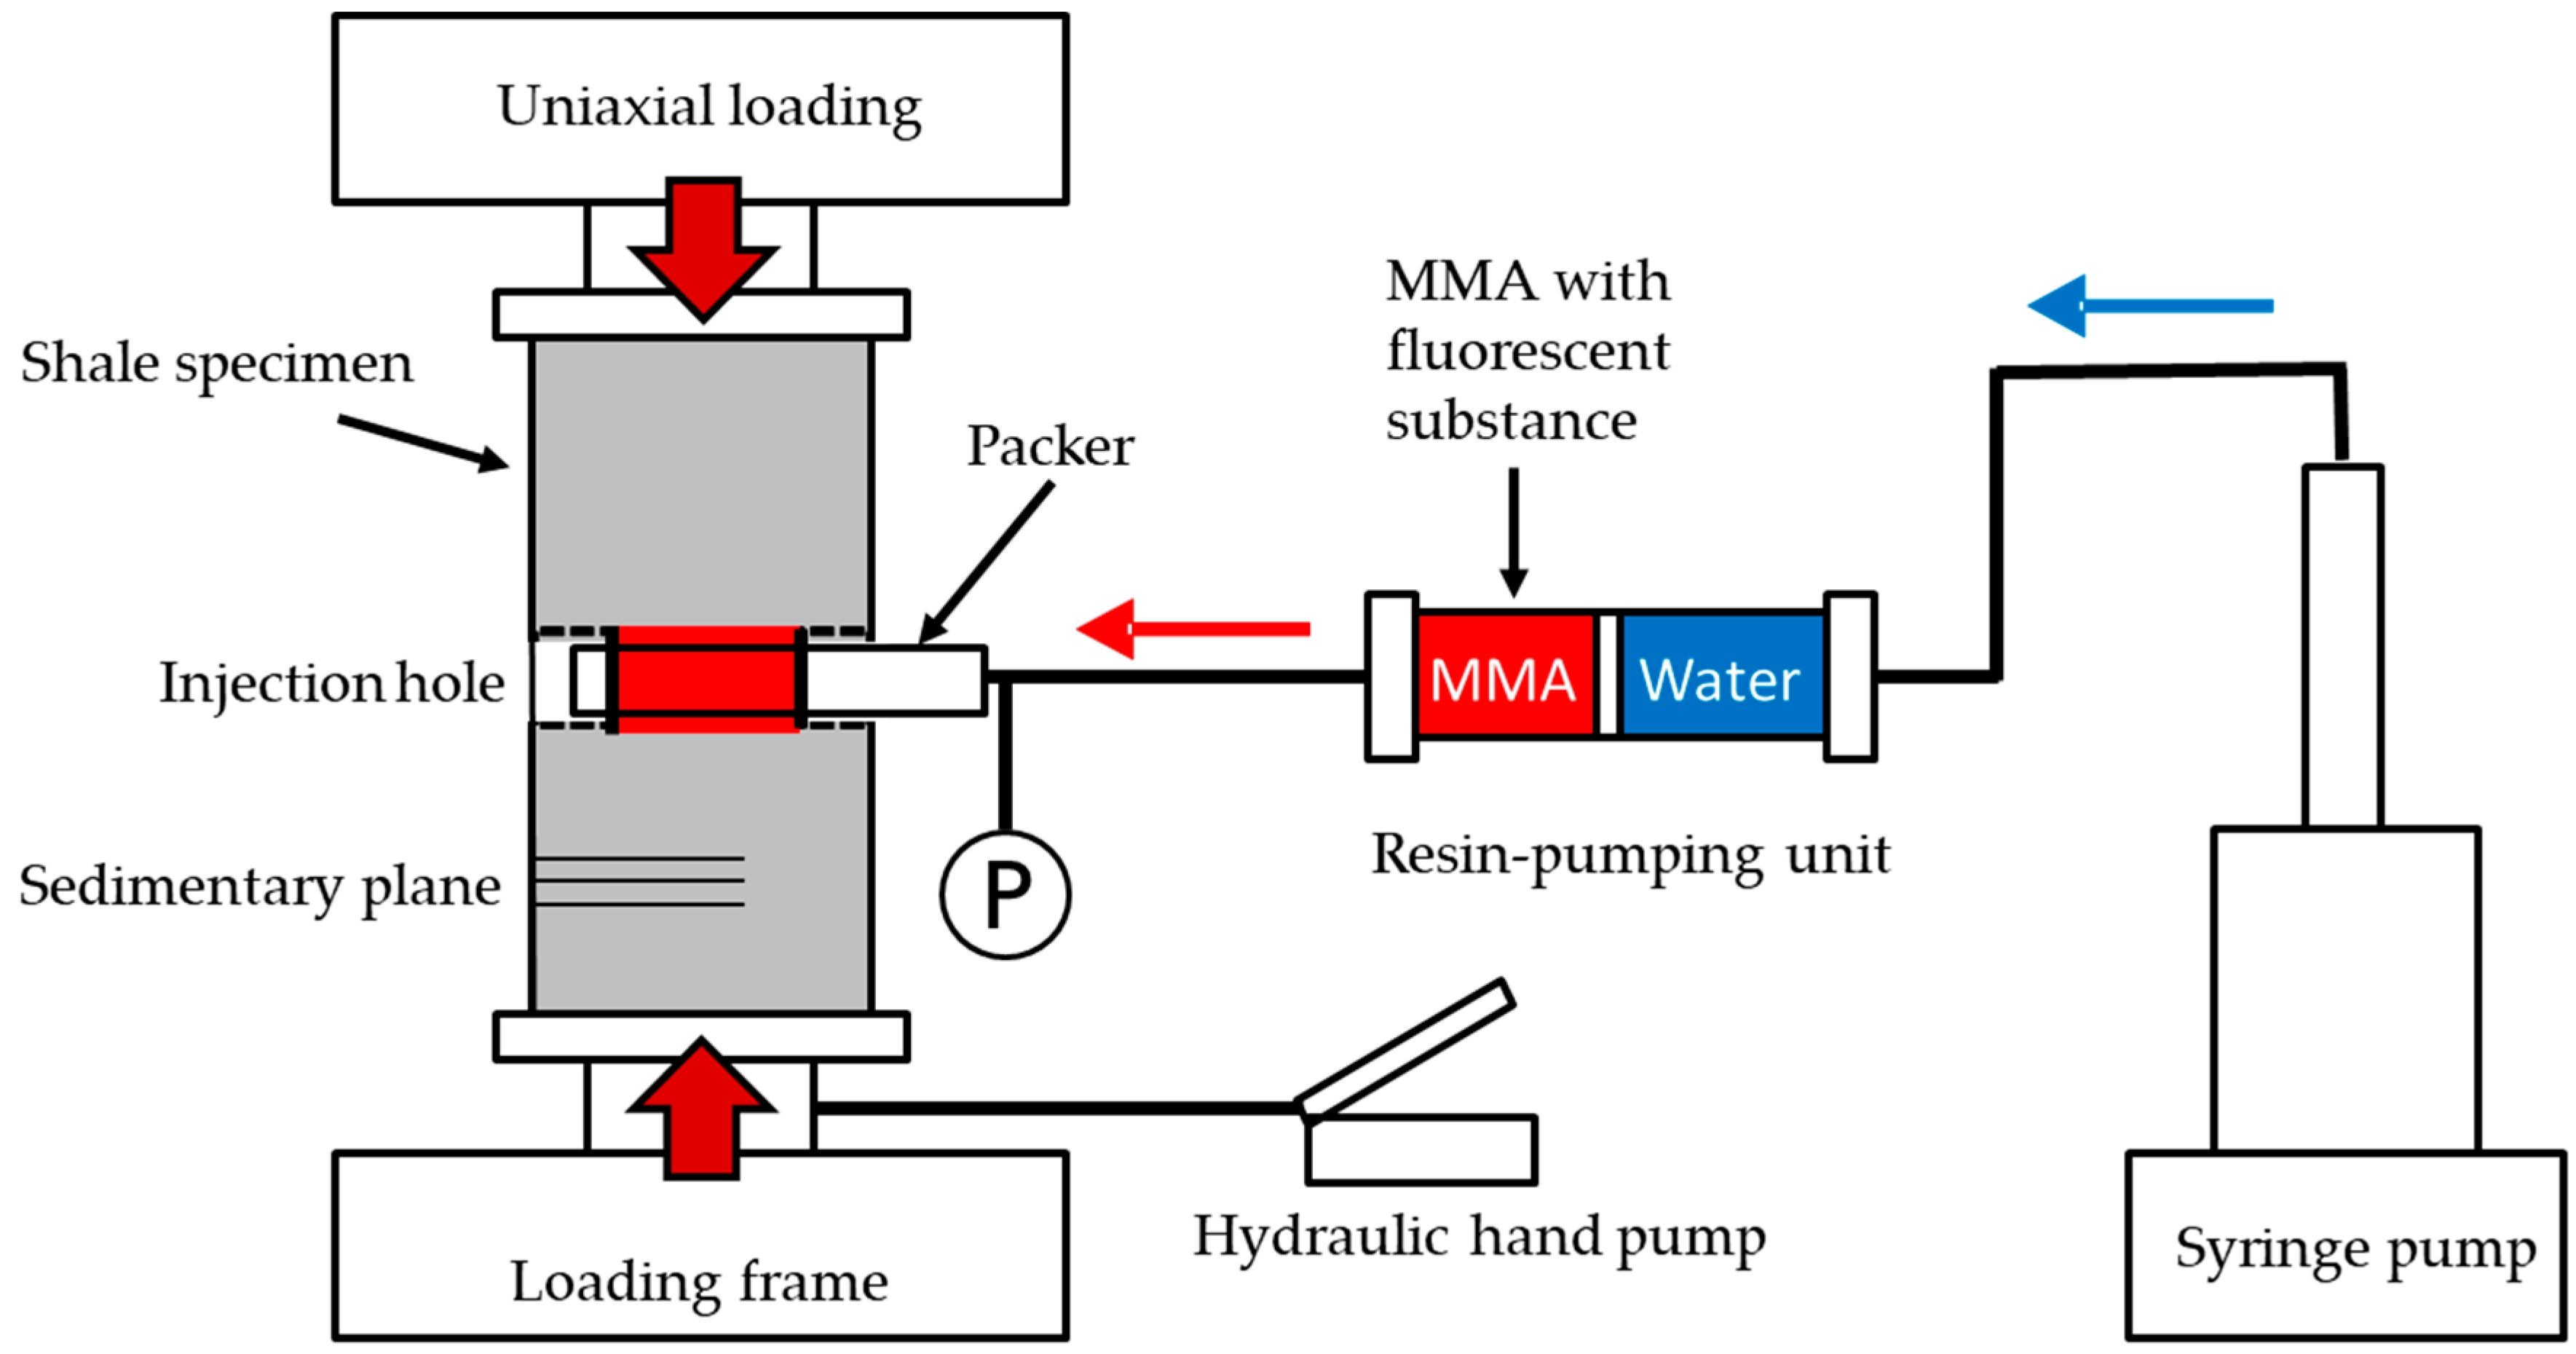
Figure 1 shows our experimental system. The specimens were kept under a uniaxial stress condition along the longitudinal direction during the experiment. It was expected that induced fractures would propagate along the loading direction from the injection hole under the given stress condition [
21]. Unsaturated specimens were used for all experiments, which were performed at room temperature.
The fracturing fluid (resin) was injected into a packer with a 25-mm or 30-mm pressurizing section that was centered along the injection hole. The resin was supplied from the resin-pumping unit, which was pressurized by water injected from a syringe pump at a constant flow rate. The fluid pressure in the pressurizing section of the injection hole was measured by a pressure gauge near the packer during the experiment.
2.2. Fracture Observation Method
The resin used in the present study was a thermosetting acrylic resin, methyl methacrylate (MMA), which was mixed with a fluorescent substance as described in
Section 1. The viscosity of the dispensed MMA was approximately 0.8 mPa·s at 25 °C, close to that of water (1.0 mPa·s) in the experimental condition at room temperature. The resin hardens at approximately 70–80 °C and we heated the specimen just after fracturing to fix the resin left in the specimen. During the heating process, we maintained the furnace at a temperature of 90 °C for 1 h to promote the heating of the tested specimen and then maintained it at 80 °C for at least 12 h. Afterwards, we slowly cooled the specimen to room temperature. The heating process was unlikely to affect our observation of regions impregnated by resin during hydraulic fracturing because the temperature used was too low to induce severe thermal cracking.
Subsequently, the specimen was cut along the longitudinal direction to observe regions of resin impregnation, including fractures. As described in
Section 1, only regions affected by the fracturing could be highlighted under UV light. Because the fixed resin is hard enough to be preserved during the polishing process, we can obtain thin sections of the tested specimens. This enables us to conduct polarization microscope observations and to identify more detailed characteristics of the fractures and their relationship to rock texture in the specimen.
3. Specimens
We used three different shale samples in the experiments: Eagle Ford, Inai, and Kushiro shales. Eagle Ford and Inai shales were sampled from outcrops, while Kushiro shale was sampled from the mining gallery of the Kushiro Coal Mine in Hokkaido, Japan. The specimen sizes and experimental conditions used are summarized in
Table 1. The selected major properties of each sample are described below.
3.1. Eagle Ford Shale
The Eagle Ford area is the fourth-largest shale gas/oil production area in the U.S. It produced approximately 10.7% of the total shale gas production in the U.S. in 2013 [
22]. Eagle Ford shale is Cretaceous shale, and hydrocarbons are produced at depths between 1200 m and 4000 m. The sample used in this experiment was collected at an outcrop of Eagle Ford shale. Preexisting discontinuities along sedimentary planes were identified within the Series 1 specimens.
The constituent minerals analyzed by XRD were calcite, quartz, and clay minerals. The observed grain size was roughly 100 μm as measured by an optical microscope. The porosity was approximately 0.7%. The p-wave velocity along the longitudinal direction of the specimens was 3.3 km/s.
We summarize sample information in
Table 1 (Series 1 and 2). The loading history of the Series 1 experiment was relatively complex. We started the experiment with 5- or 12-MPa loading, but fracturing did not occur until the hydraulic pressure reached 20 MPa, which is the maximum pressure capacity of the injection system. We then gradually increased the loading stress, keeping the hydraulic pressure at 20 MPa to induce fracturing.
3.2. Inai Shale
The Inai shale (Series 3 and 4) was Triassic shale retrieved from an outcrop in the Inai Distinct, Ishinomaki City, Miyagi Prefecture, Japan. Although the samples were free from opened preexisting fractures, clear sedimentary planes with alternation of sand and mud were observed in the specimens.
The constituent minerals analyzed by XRD were quartz, albite, and clay minerals. The grain size in sandy zones was 10–50 μm as measured by an optical microscope. The porosity and p-wave velocity along the longitudinal direction of the specimens were approximately 0.6% and 6.0 km/s, respectively.
3.3. Kushiro Shale
Two different ages of Kushiro shale were used in this study. One sample (Series 5) was retrieved from the Paleogene shale stratum in the mining gallery of Kushiro Coal Mine at a depth of approximately 260 m. The other sample was obtained from rock cores of the Cretaceous shale stratum drilled at Kushiro Coal Mine at depths between 400 m and 1000 m (Series 6). No clear sedimentary planes were observed in these two Kushiro shales, but several specimens of the Cretaceous shale contained preexisting discontinuities and laminae.
The constituent minerals analyzed by XRD were quartz, albite, and clay minerals. The porosities of the Paleogene and Cretaceous shales were 10.5% and 9.9%, respectively. The grain sizes were approximately 30–150 μm and 30–100 μm, respectively, whereas the Paleogene shale contained relatively coarser grains. The p-wave velocities of them were 2.9 km/s and 3.9 km/s, respectively.
4. Observation Results
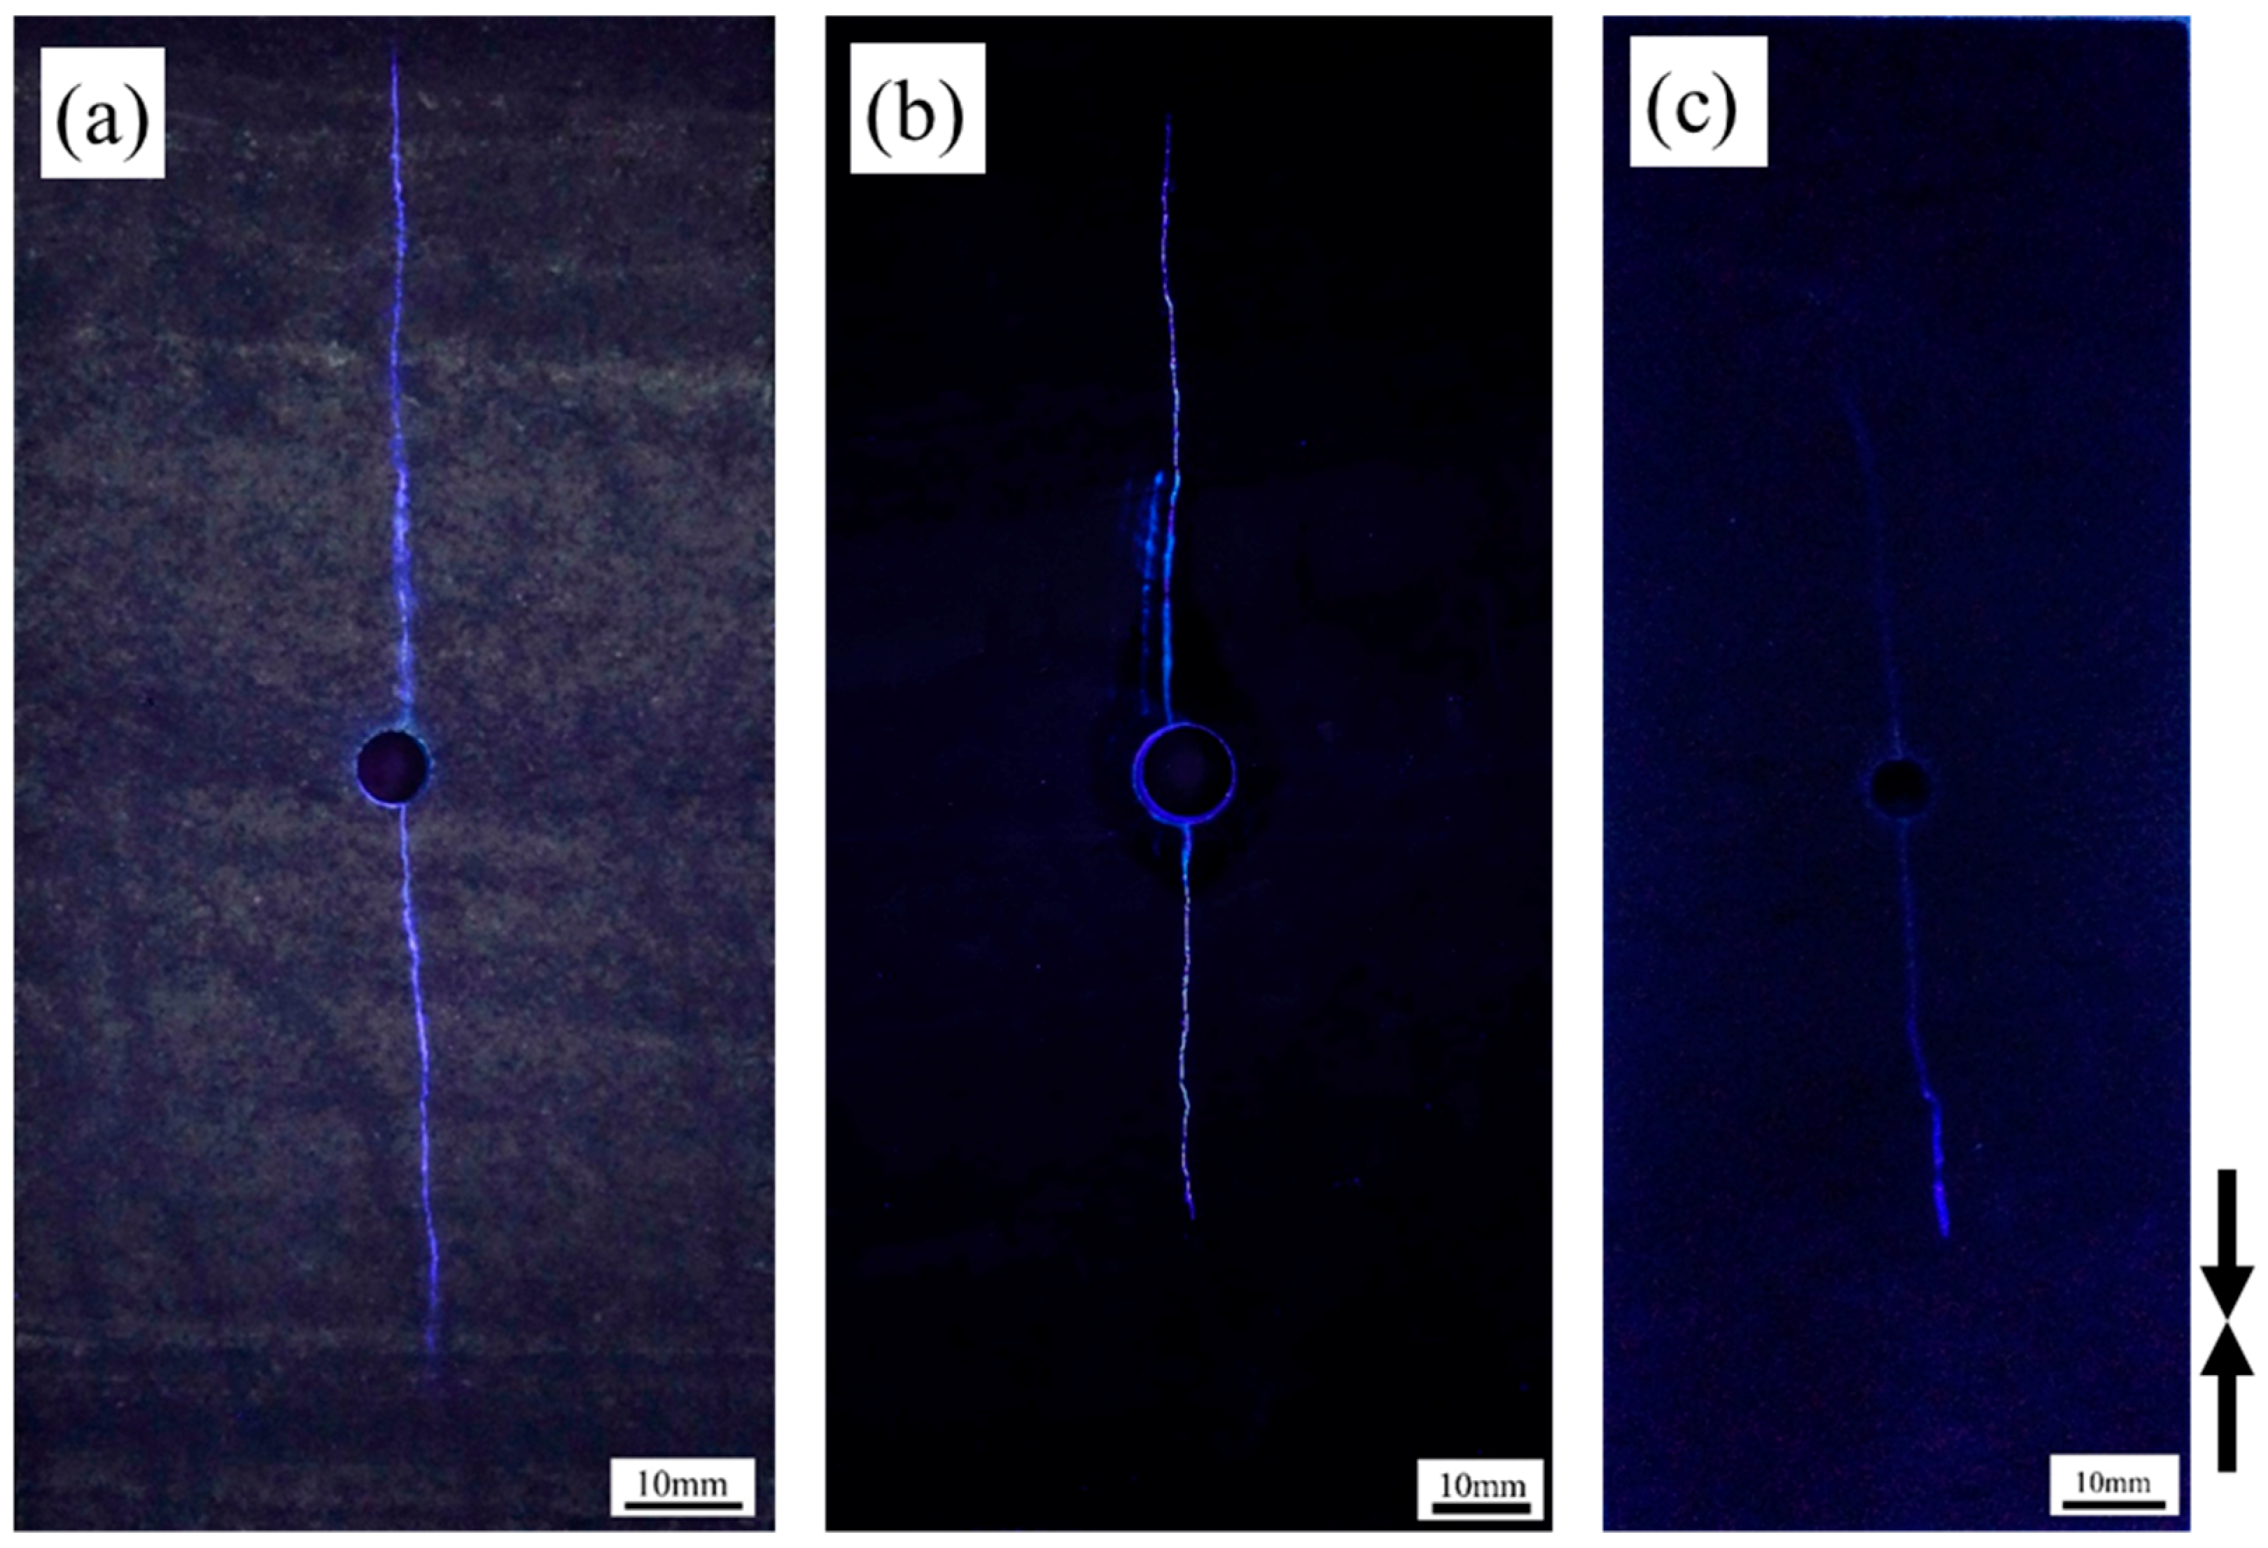
Figure 2 presents examples of fluid-impregnation regions observed on the cut sections under UV light. As expected, the hydraulically-induced fractures on a cut section could be distinguished from the other parts because fractures filled with the resin emit bluish-white light. Two narrow induced fractures (bi-wing fractures) elongated from the injection hole on both sides along the uniaxial loading direction (i.e., their pathways cut across the sedimentary planes); these were clearly identified. These bi-wing fractures were commonly observed for all the specimens in the present study. Experimental results and corresponding figures are summarized in
Table 2.
Although the induced fractures typically appeared to have a simple bi-wing pattern at coarse resolution, as shown in
Figure 2, observation at finer resolution revealed complicated patterns. For more detailed observations at finer resolution, we prepared polished thin sections from the cut sections. As stated in
Section 2.2, the microstructures of induced fractures filled with the well-hardened resin were preserved after the polishing process. We employed two methods simultaneously for thin sections: (i) observation using only UV light and (ii) polarization microscope observation using natural light, with a single nicol or crossed nicols, under UV light. Using the two methods, we could identify fracture patterns clearly and their correlations with rock textures.
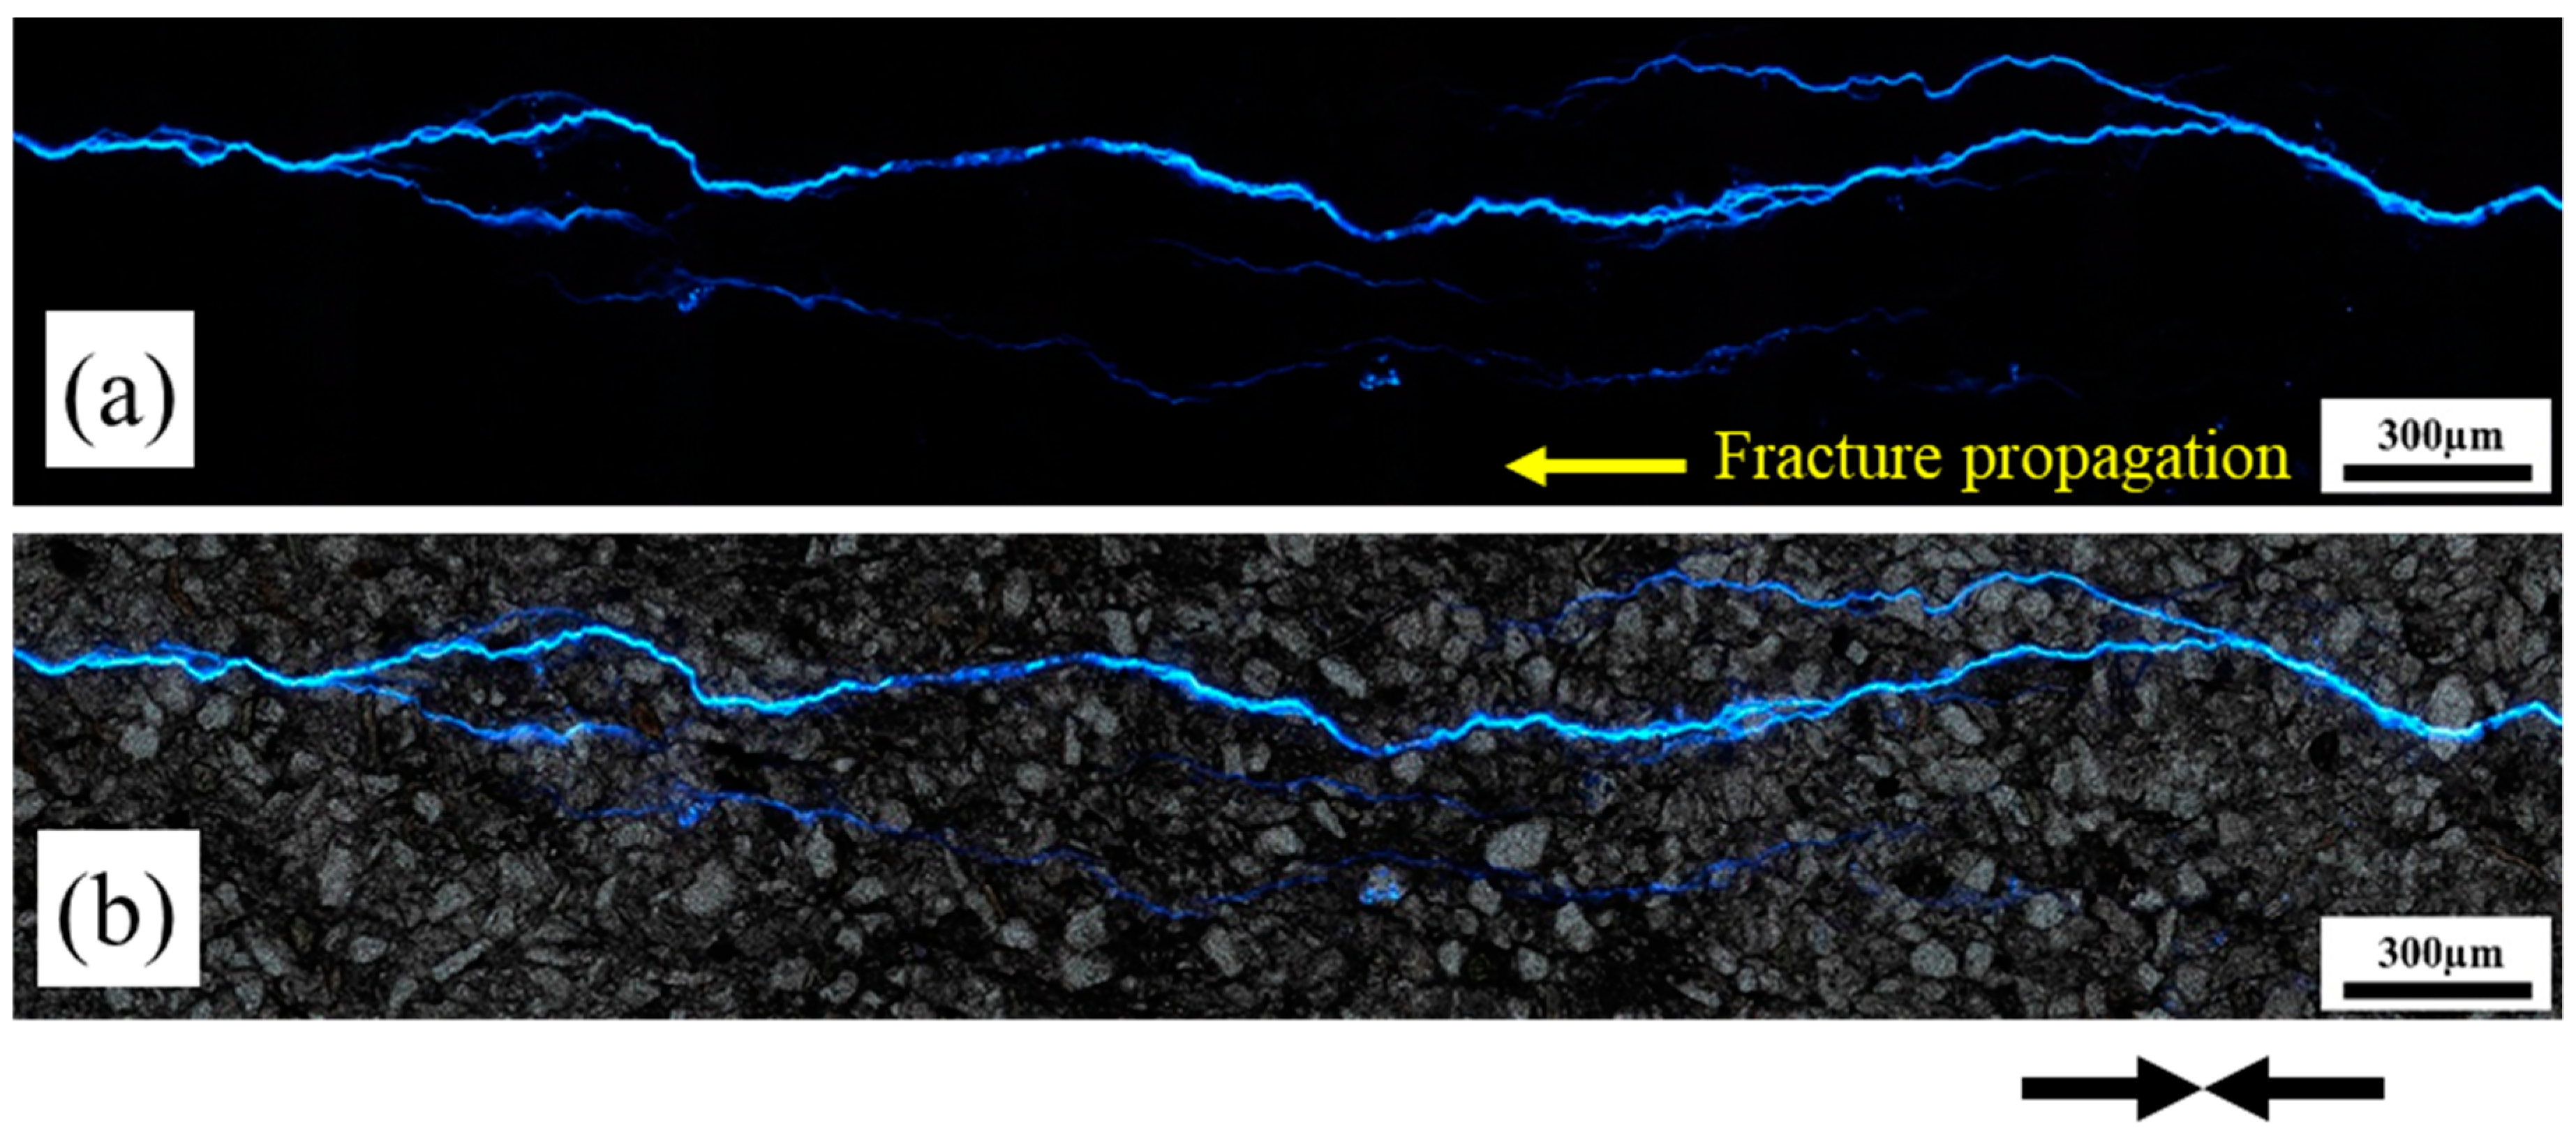
Figure 3 shows an example of microscopic observation of a thin section slice around induced fractures for Inai shale by means of the two methods. We identified tortuous fractures accompanied by many thinner ramified fractures.
Increasing the surface area by inducing fractures improves the productivity of shale gas/oil resources [
23,
24,
25,
26], and measurement of complexity is fundamentally important in characterizing the induced fractures. In the subsequent sections, we introduce examples indicating the complicated fracture propagation that can be revealed by our method by focusing on the following three viewpoints: (1) geometric characteristics (such as tortuosity and branching); (2) the influence of preexisting discontinuities (such as preexisting fractures, sedimentary planes, and laminae); and (3) the development of the resin-impregnated area around the induced fractures.
4.1. Geometric Characteristics of the Induced Fractures
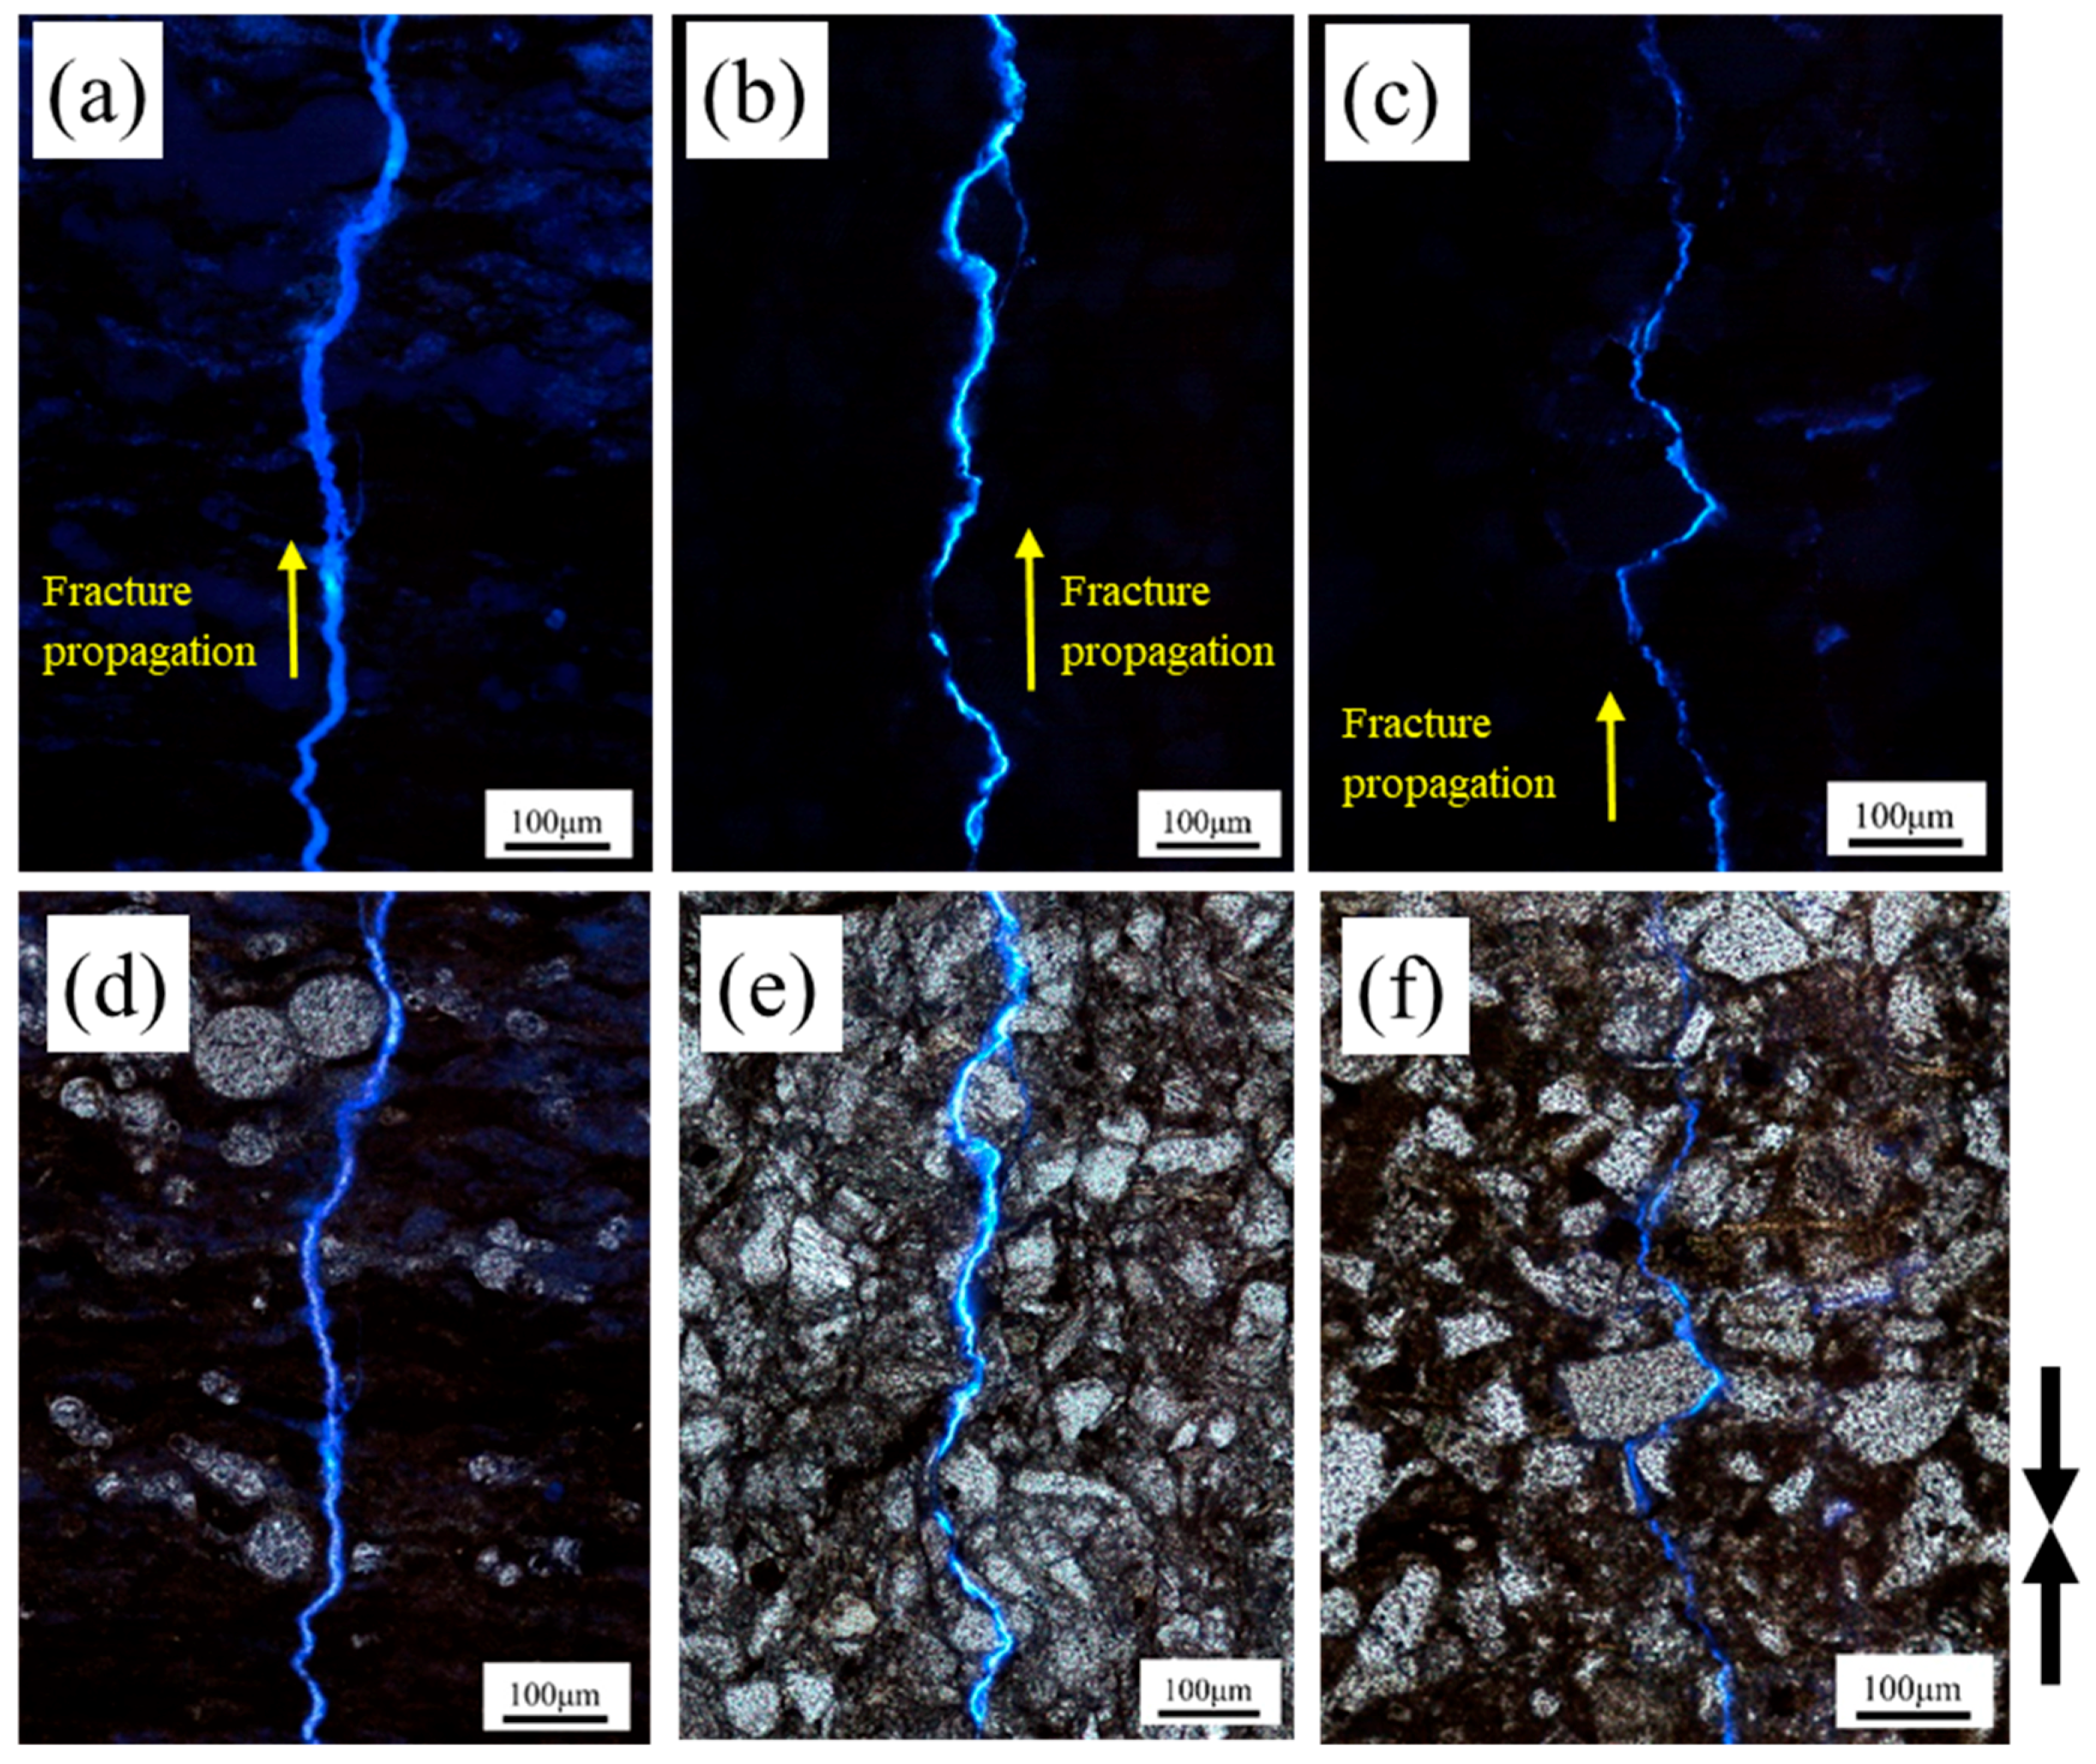
Figure 4 presents microscope photographs of induced fractures for three shale specimens retrieved from different sites (Eagle Ford, Inai, and Kushiro). All induced fractures were tortuous (
Figure 4a–c), although the degree of their winding differed, likely depending on their grain sizes (
Figure 4d–f). Relatively coarser grains observed in the Eagle Ford shale specimens were fossil foraminifera (
Figure 4d) and those in the Inai and Kushiro shale specimens were quartz and albite (
Figure 4e,f). The induced fractures basically propagated through the shale matrix and rarely cut through mineral grains.
Because gas is considered to be stored in micropores (mainly in the organic fraction) by adsorption, in the pores of the rock matrix (mesopores and macropores), and in preexisting discontinuities [
27], fractures passing through the matrix likely contribute significantly to the production of gas in the pores. Although we could not observe clear outlines of such interactions between the micropores and the induced fractures because of the small scale of such pores (ranging from 2 to 50 nm [
28,
29]), observation of fluid-impregnated regions around induced/preexisting fractures helps us to explore the fracturing fluid behavior in a shale matrix, as described in
Section 4.3.
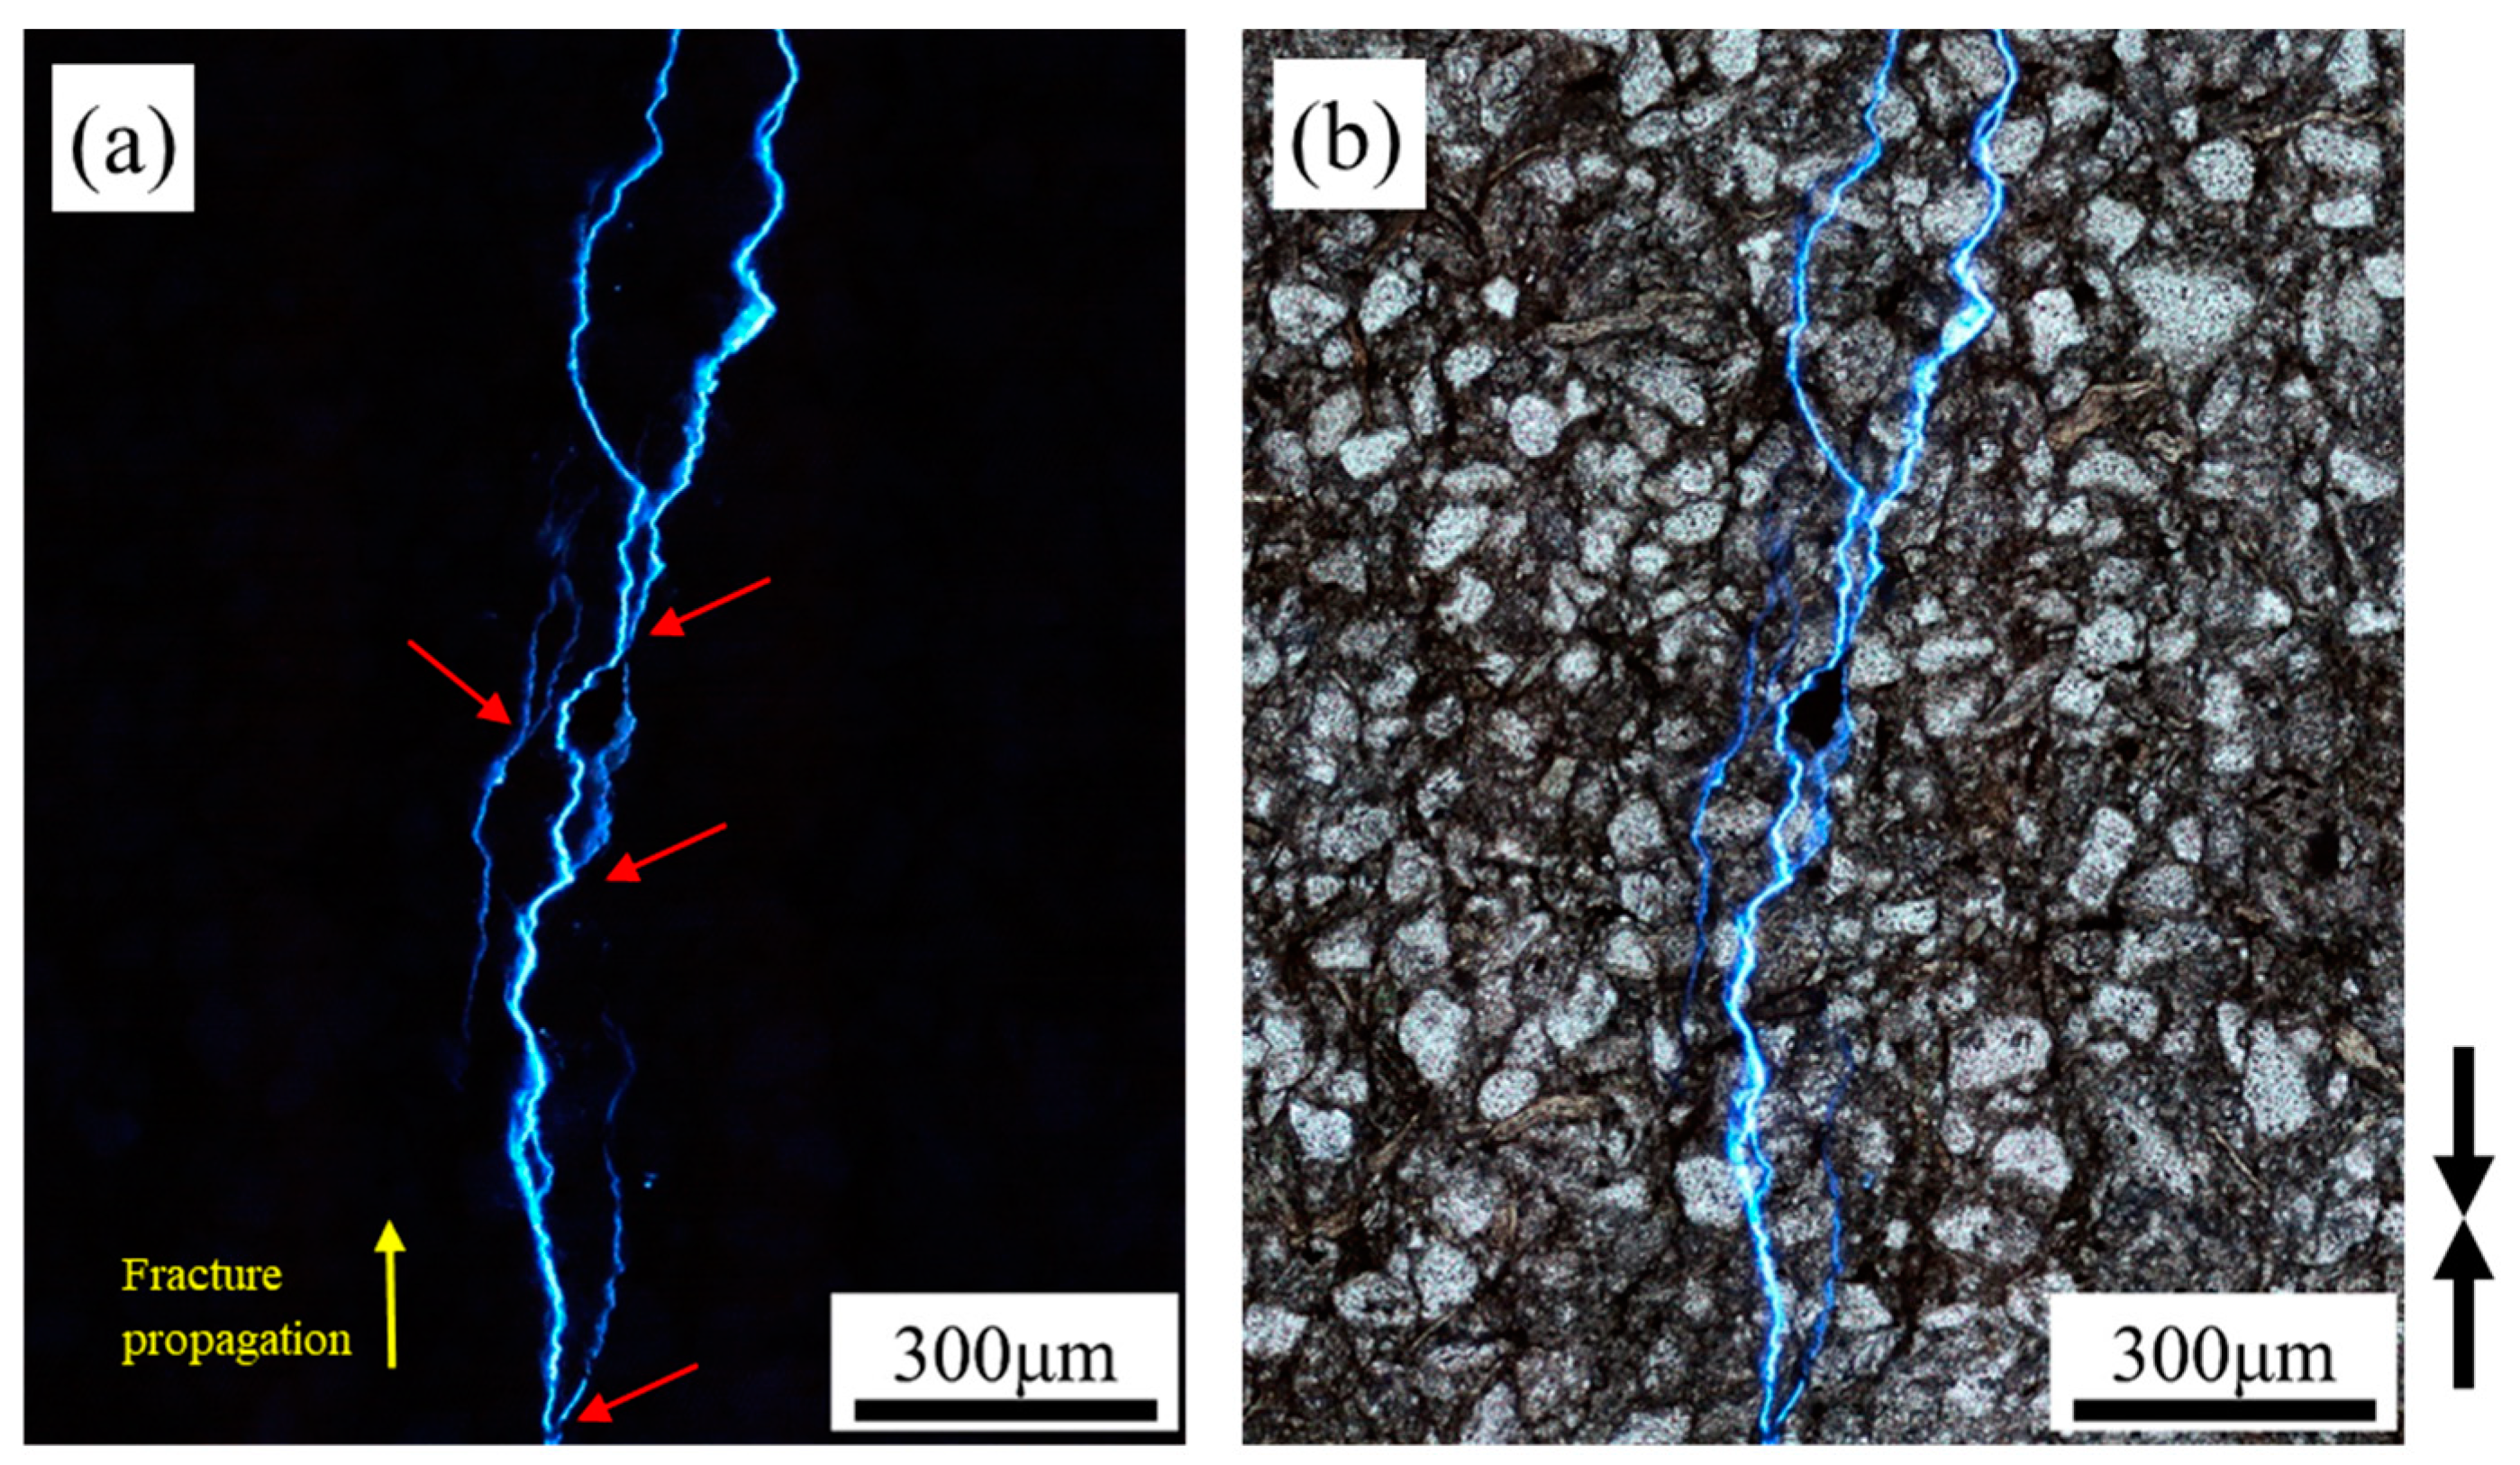
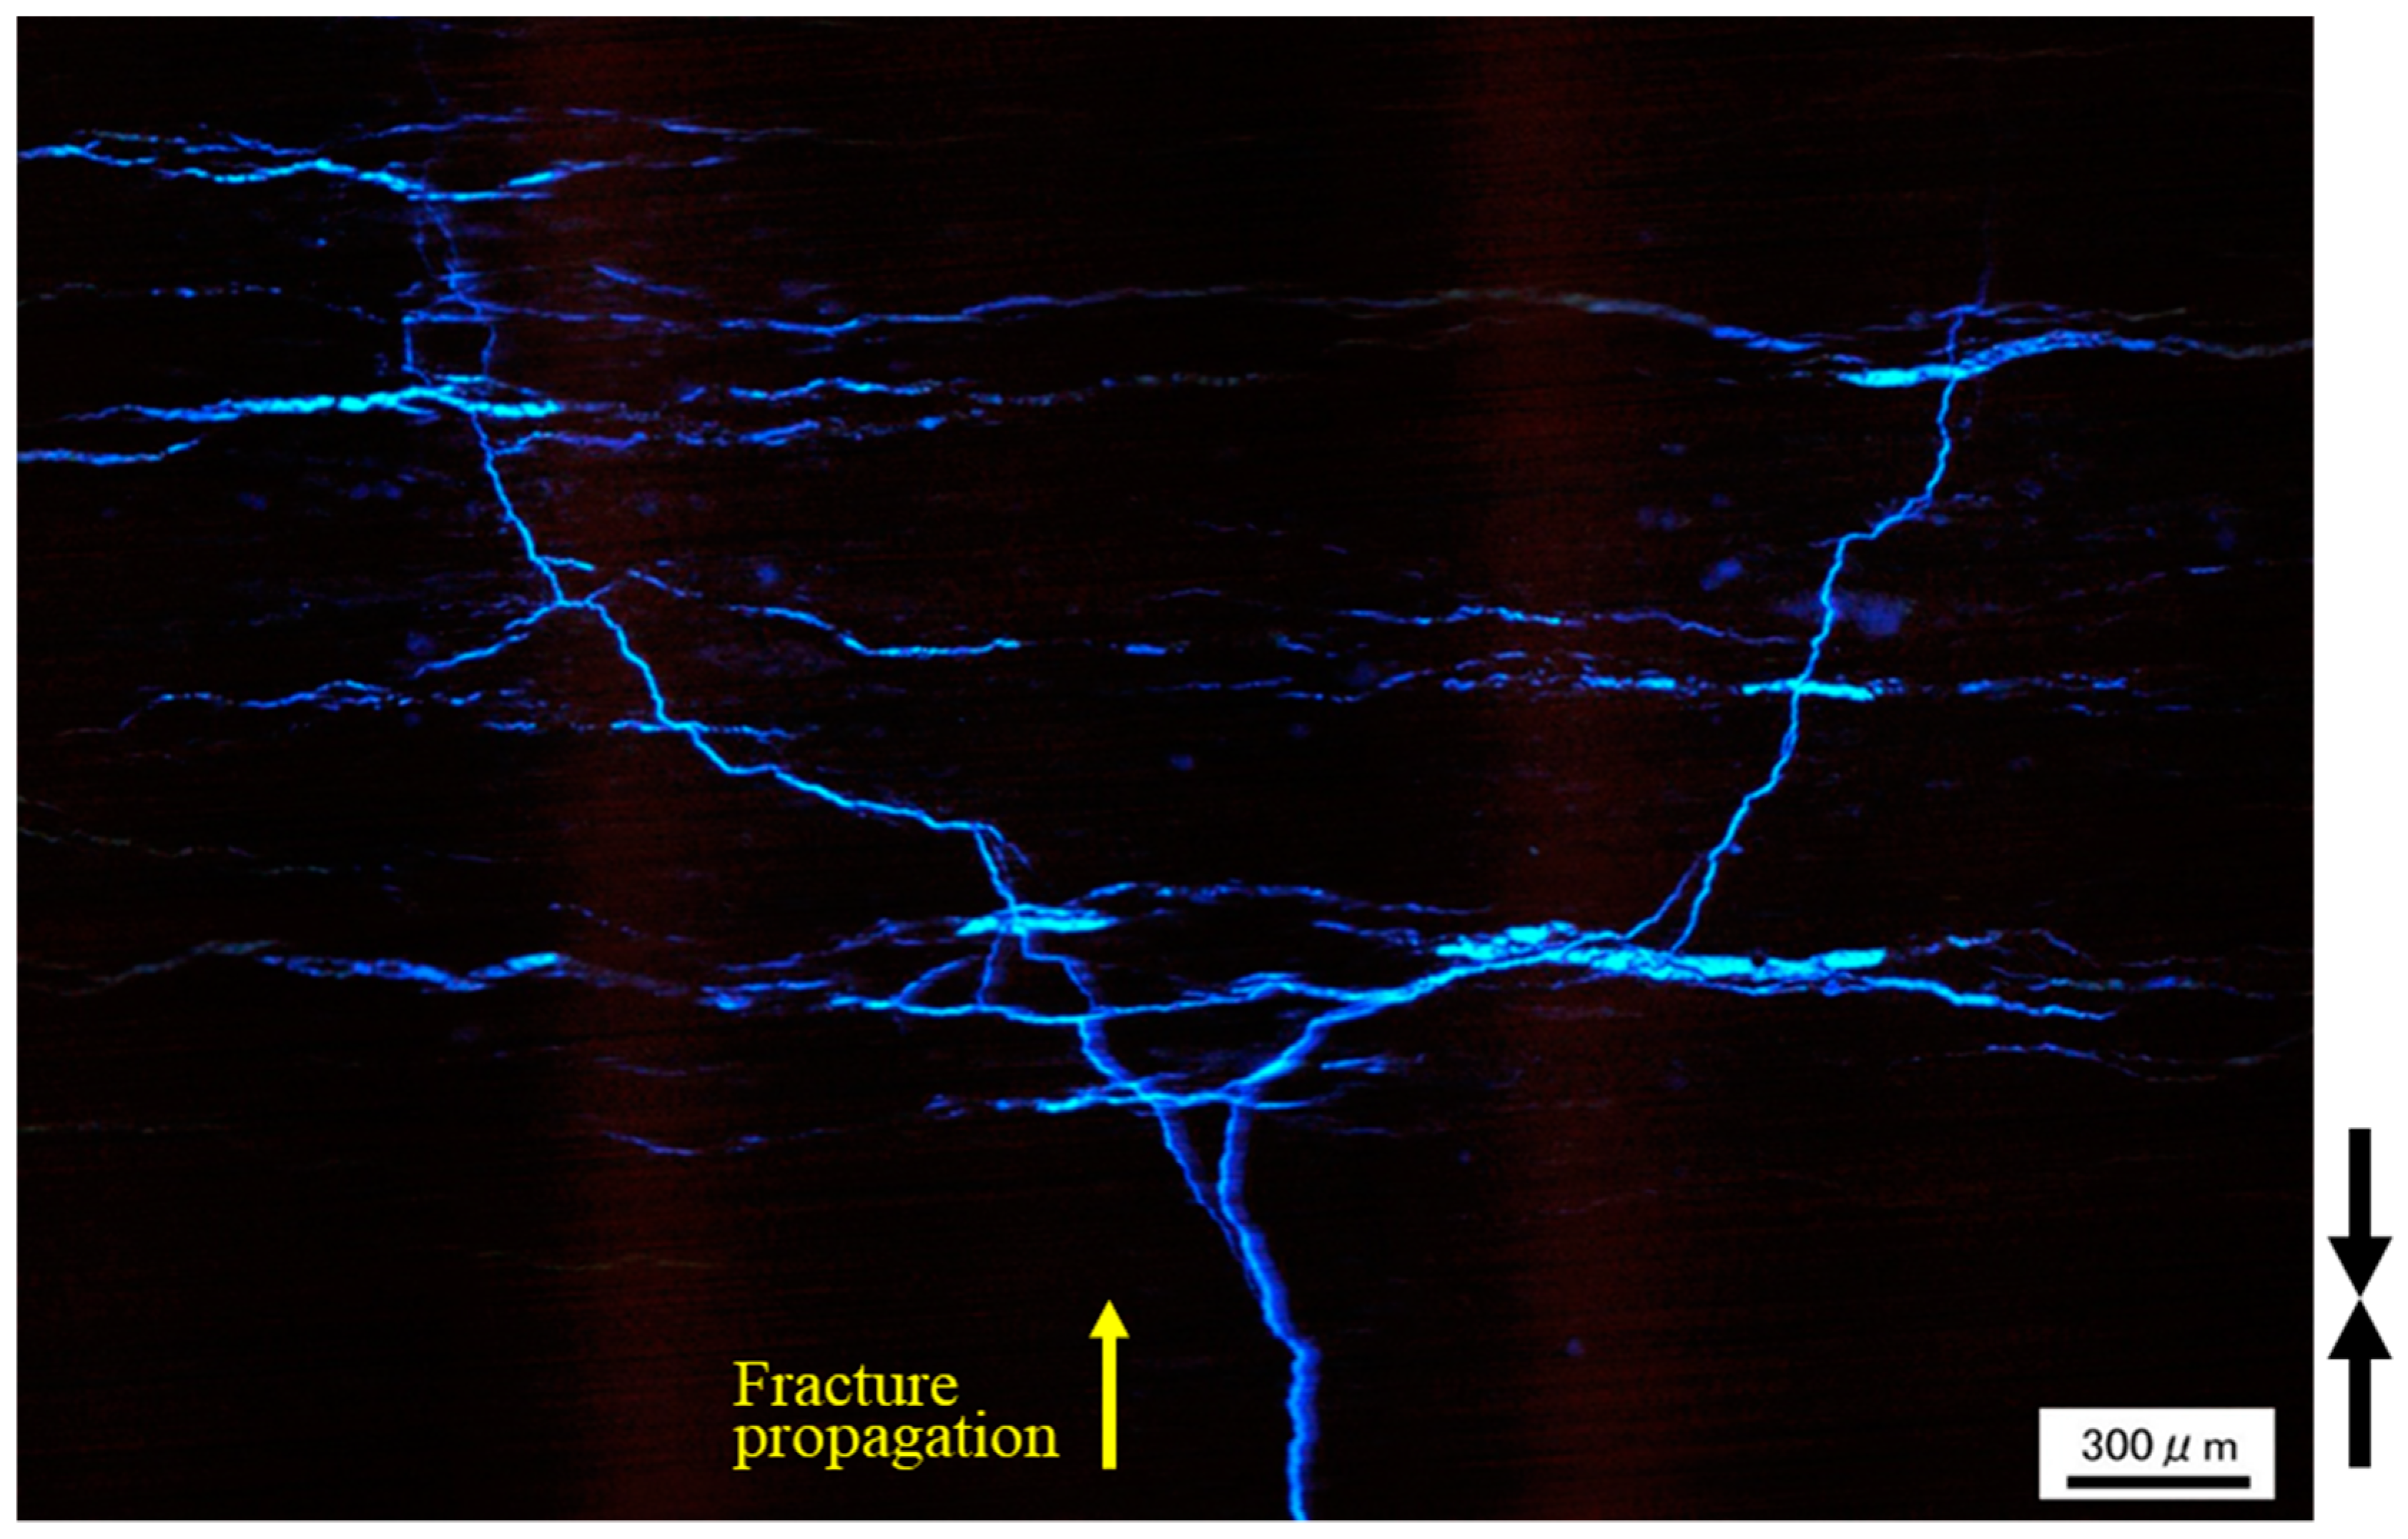
Figure 5 shows typical branching patterns observed in the Inai shale specimen. Branching at an acute angle (red arrows in
Figure 5a) occurred where the propagating fracture encountered a mineral grain (
Figure 5b). The branches ran almost parallel to the fracture propagation direction within the matrix. Similar branching patterns were frequently found for many of the specimens, strongly indicating that the interaction between grains and propagating fractures causes fracture complexity in shale samples.
4.2. Influence of Discontinuities on Fracture Propagation
Discontinuities, such as preexisting fractures, sedimentary planes, and laminae were observed in the Eagle Ford, Inai, and Kushiro shale specimens, and they can also cause complexity in induced fractures. We show examples representing such interactions in
Figure 6,
Figure 7 and
Figure 8. The typical patterns of such interactions can be classified into three groups: fractures (i) passing straight through the discontinuities (
Figure 6; Eagle Ford shale); (ii) passing through after shifting their pathways along the discontinuities (
Figure 7; Cretaceous Kushiro shale); and (iii) stopping at discontinuities (
Figure 8; Cretaceous Kushiro shale). Previous works [
23,
30,
31] have shown similar interaction patterns, but the method in the present study additionally reveals the fluid-impregnated region surrounding the induced fractures.
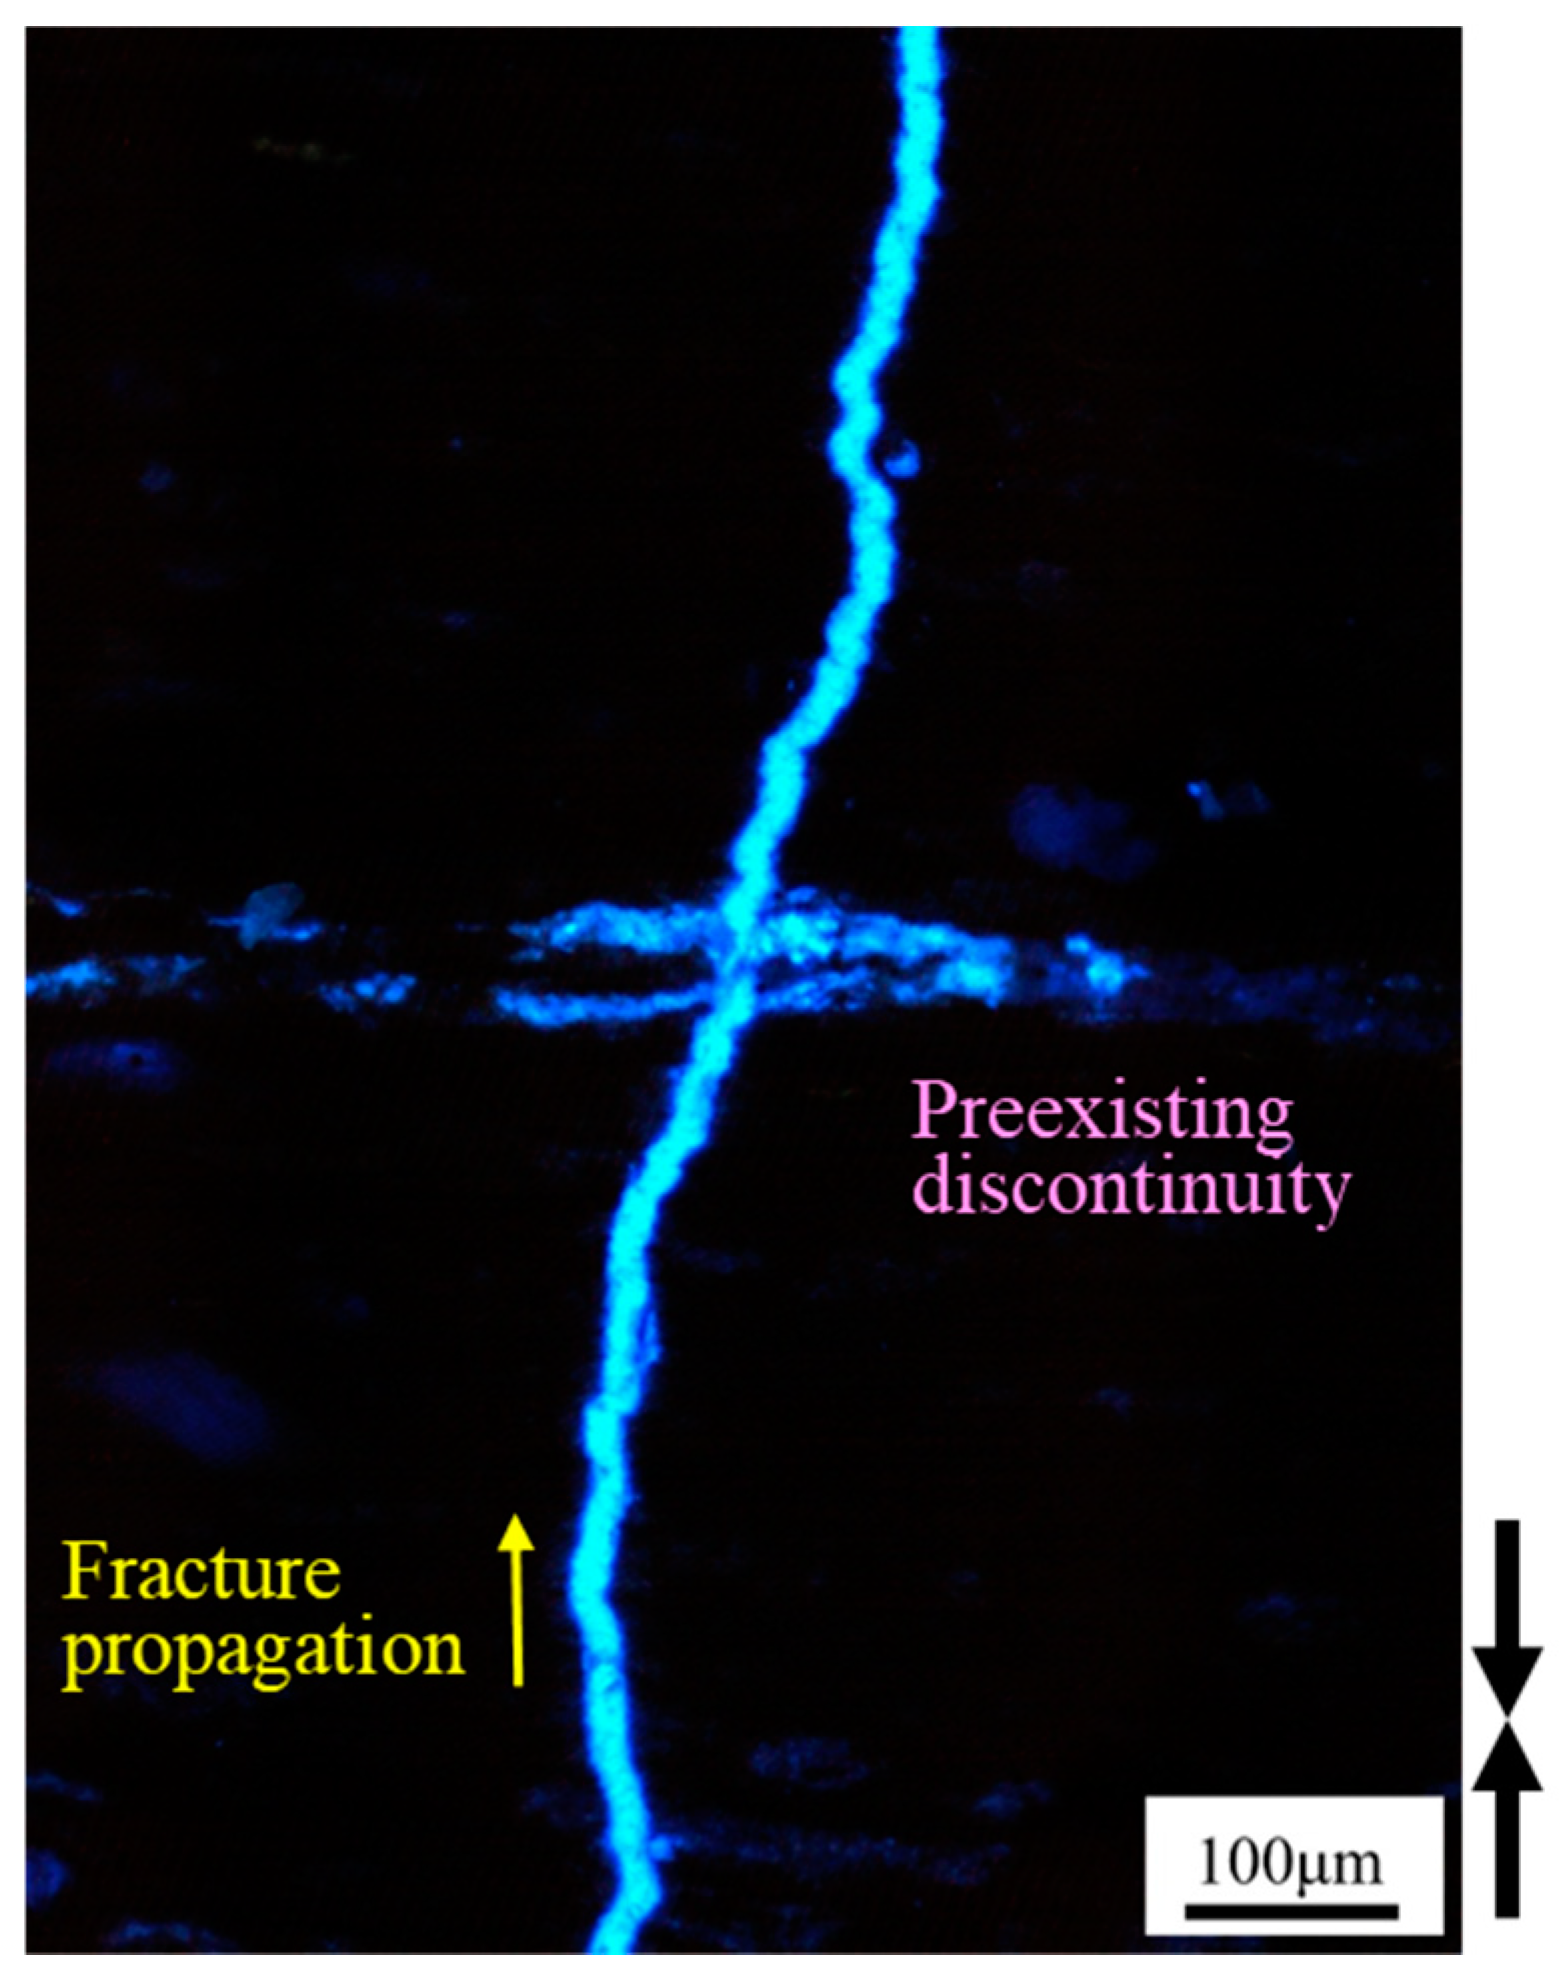
Specifically,
Figure 6 shows the interaction pattern when the fractures passed straight through the preexisting discontinuities in the Eagle Ford specimen. In this case, the preexisting discontinuity was impregnated by the fracturing fluid in short segments along the sedimentary plane; that is, in the horizontal direction in the figure. This result clearly indicates that the preexisting discontinuities around the induced fractures were stimulated by the fracturing.
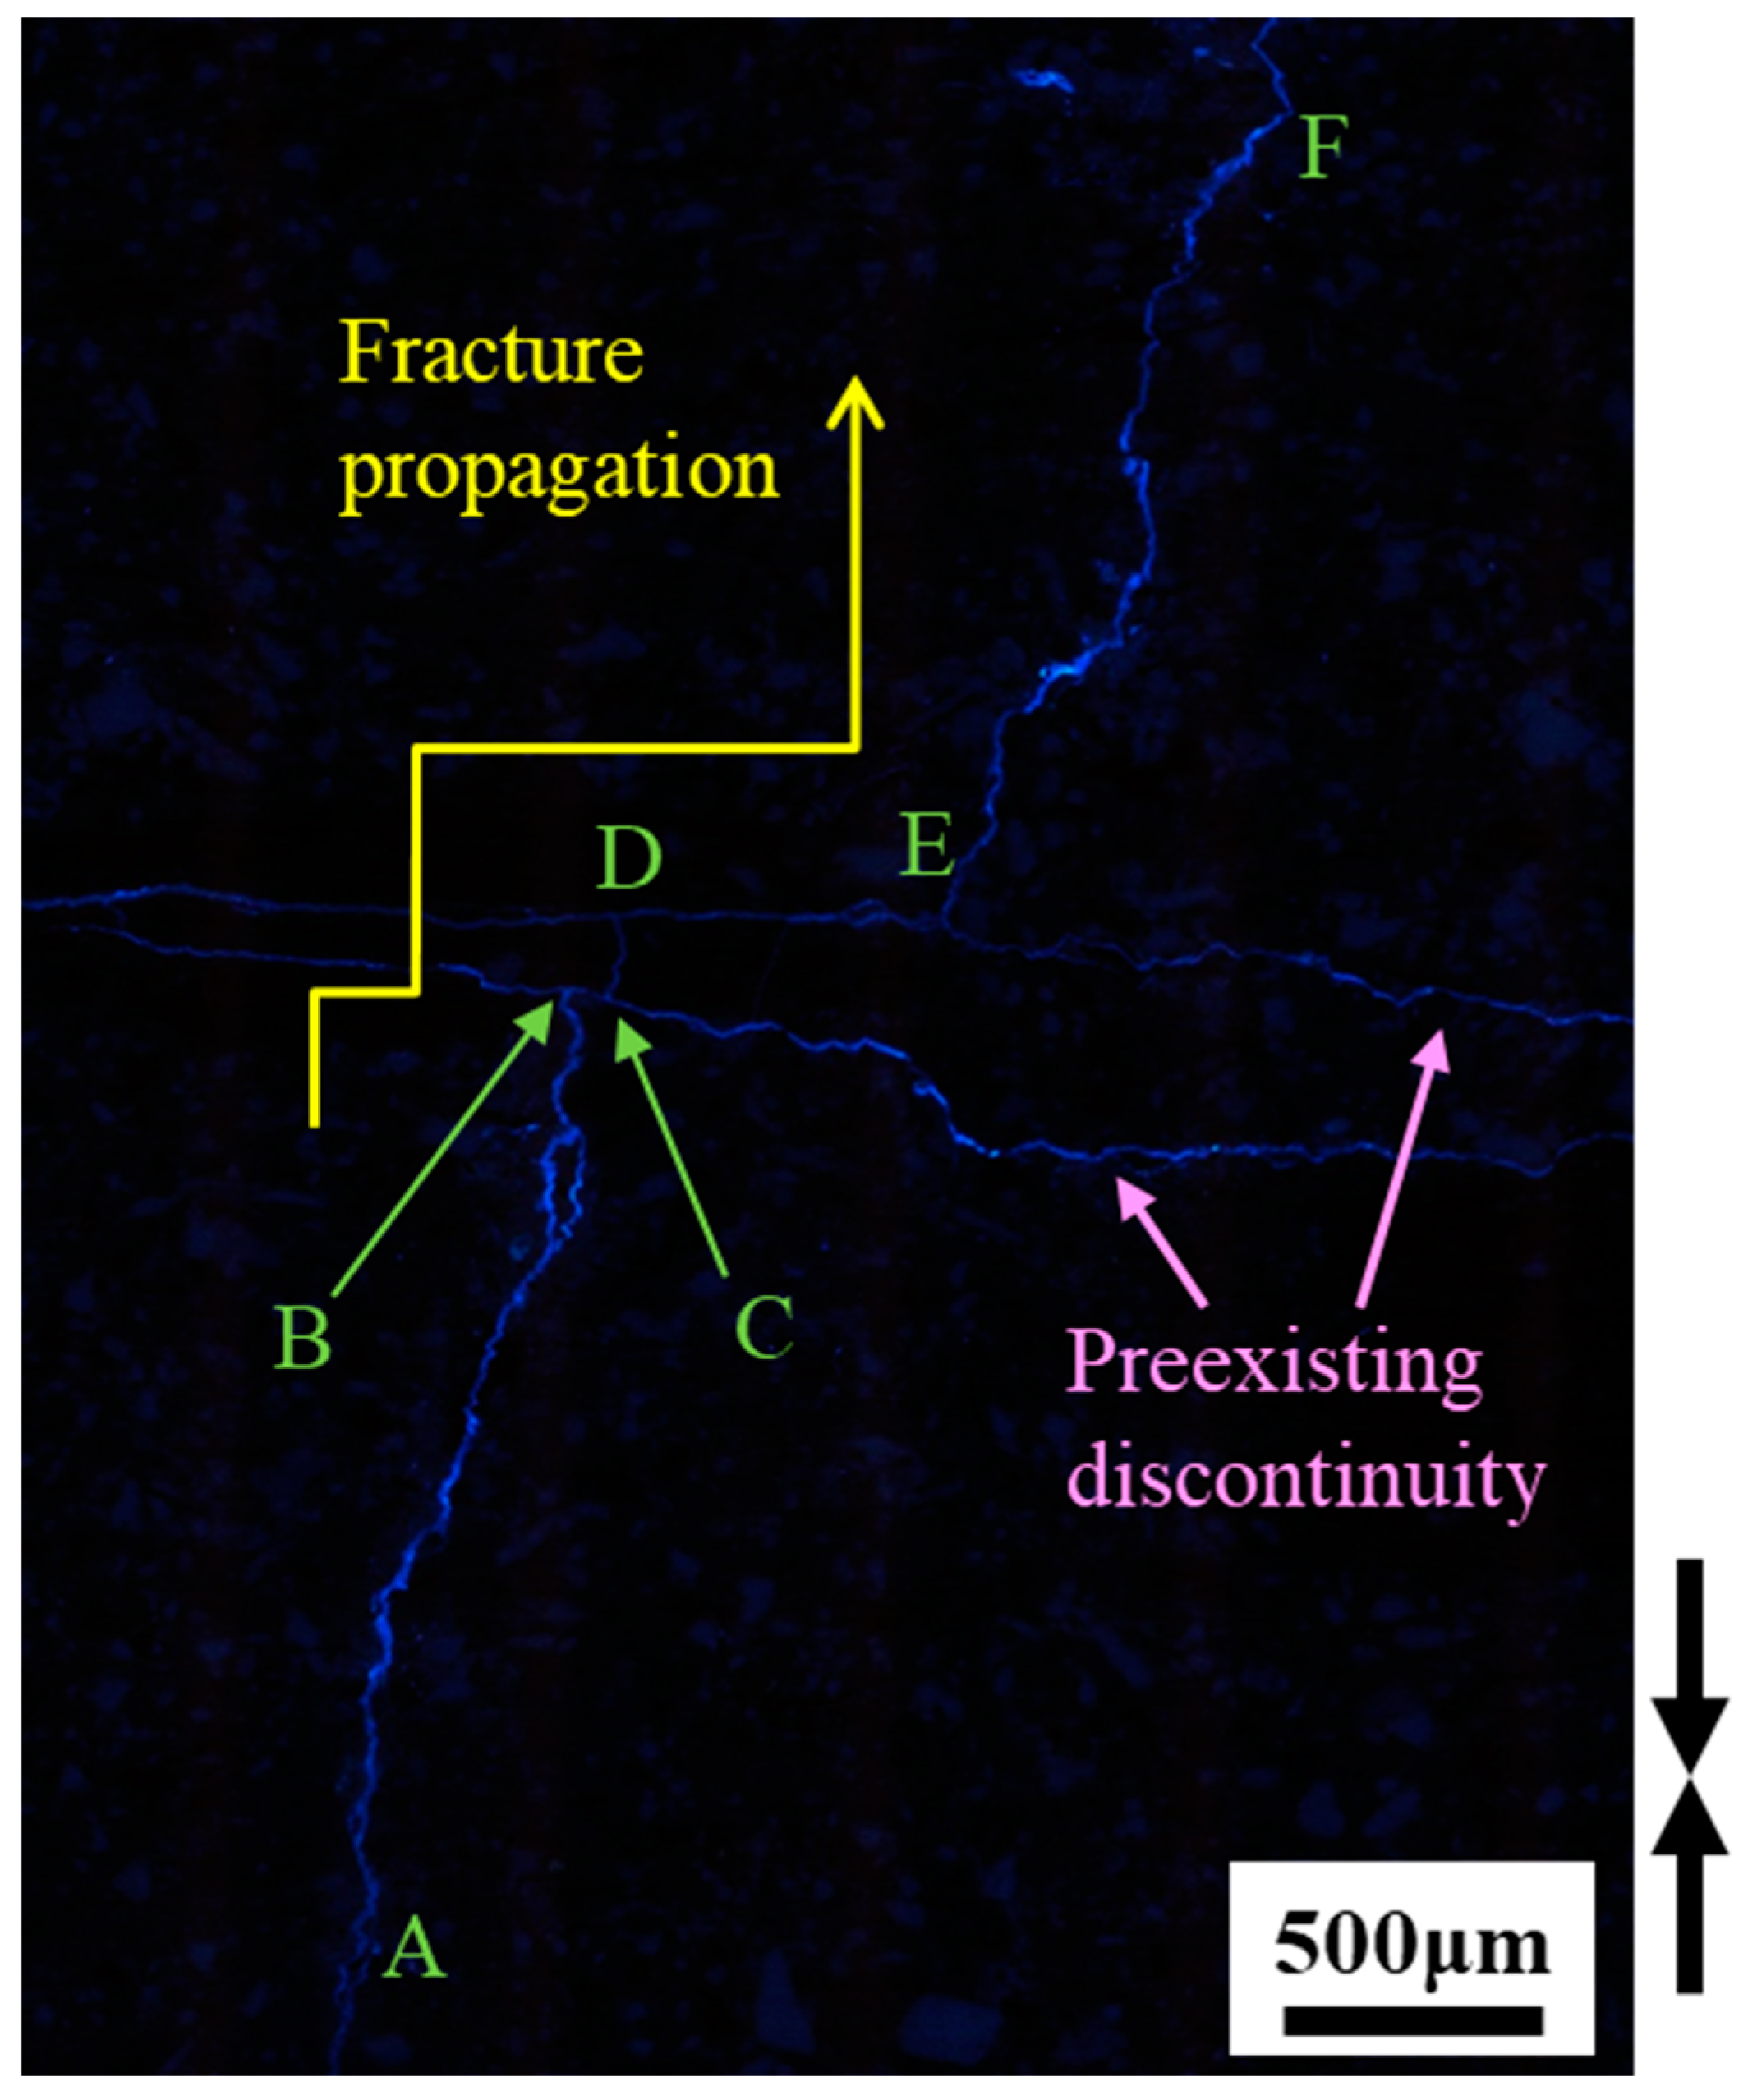
Figure 7 shows a fracture passing through two neighboring preexisting discontinuities (indicated by red arrows in
Figure 7) in the Cretaceous Kushiro specimen. The main fracture passed through the preexisting discontinuities after shifting its pathway along short segments (B to C and D to E in
Figure 7), resulting in the stepwise fracture pattern (A–B–C–D–E–F in
Figure 7). The fluid-impregnated portions were not only the short segments ((B–C and D–E in
Figure 7) but also in the extended portions along preexisting discontinuities surrounding the short segments. This suggests that the discontinuities around the induced fractures resulted in complex geometry in the fluid-impregnated region.
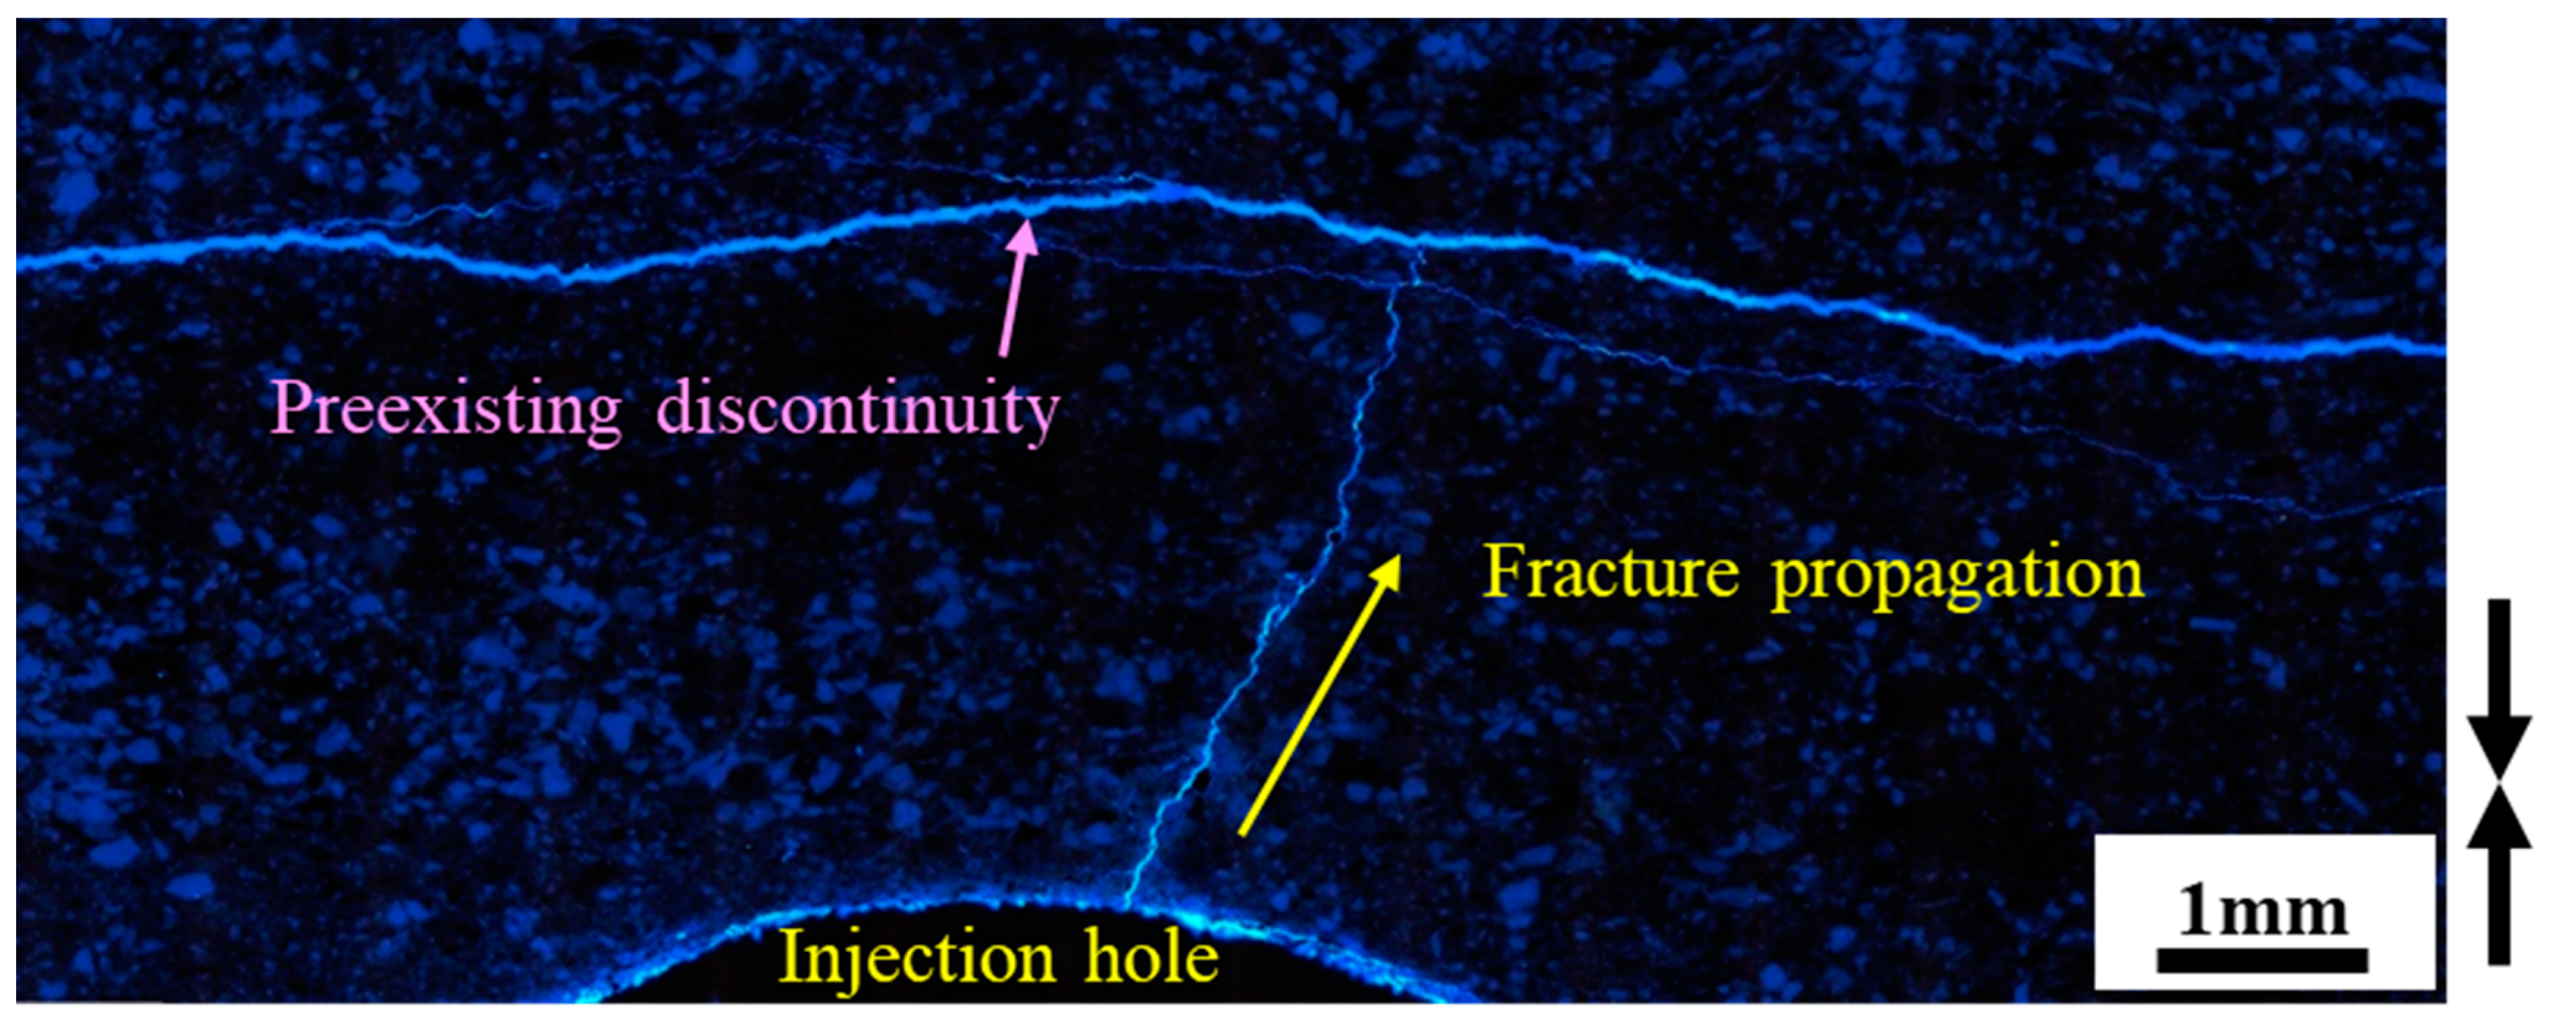
Figure 8 shows an example of fractures that stopped at a discontinuity in the Cretaceous Kushiro specimen. In this case, the discontinuity was also impregnated by the fracturing fluid. The observed area is very close to the injection hole and the scattered blueish-white spots in
Figure 8 may be pores impregnated with resin before fracturing due to high fluid pressure in the hole.
Significantly complex fractures were observed when the induced fractures passed through highly laminated regions.
Figure 9 shows a photograph of the Eagle Ford specimen around a region with many laminar layers identified by standard polarization microscope observations. The hydraulically induced fractures passed through the laminae after propagating along them for short segments, and the regions around the intersections between the main fracture and the laminae were widely impregnated by fracturing fluid.
4.3. Development of Resin-Impregnated Regions around Induced Fractures
Our method could reveal resin-impregnated regions surrounding induced fractures which are also likely to affect gas/oil production.
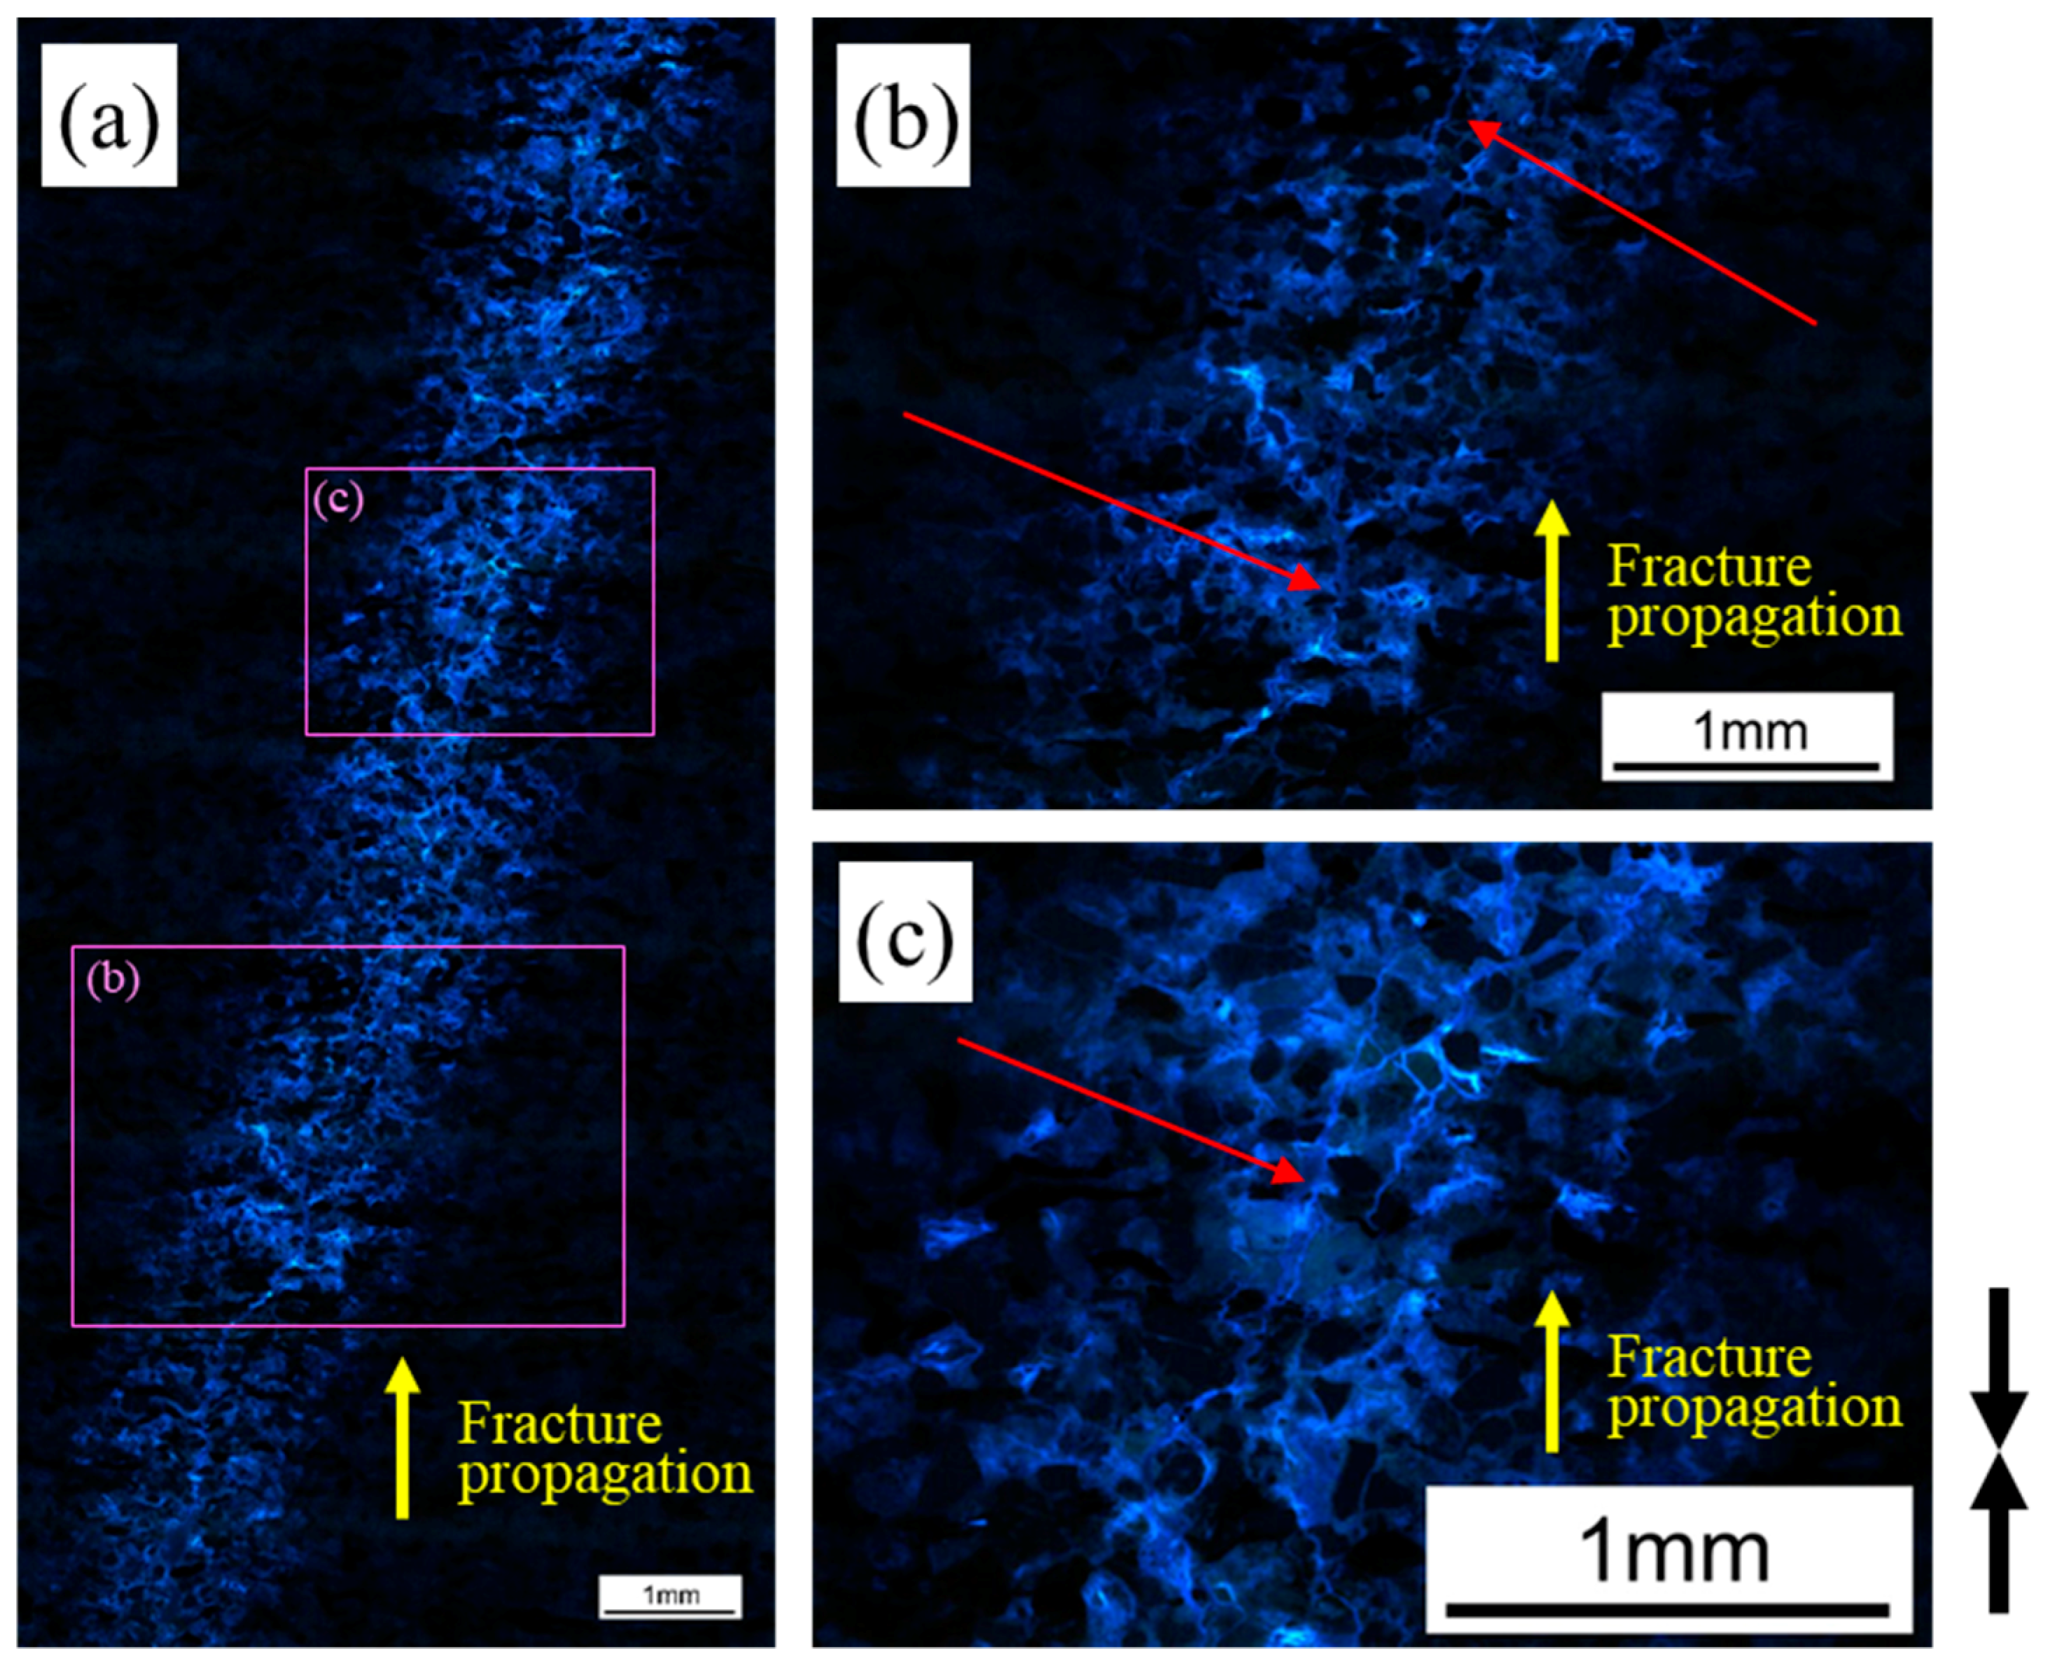
Figure 10 shows an example for Paleogene Kushiro shale. Although we can identify the bright part (resin-impregnated region) expanded with a ~1 mm width (
Figure 10a), a bold, continuous main pathway likely corresponding to an induced fracture was missing, whereas it was observed in
Figure 3,
Figure 4,
Figure 5,
Figure 6,
Figure 7,
Figure 8 and
Figure 9. The identified bright parts in
Figure 10 likely consist mainly of fluid-filled pores. However, we observed thin and tortuous continuous lines near the center of the region (red arrows in
Figure 10b,c). Additionally, we can identify many thin, bright, ramified lines connecting bright spots likely representing fluid-filled micropores in
Figure 10c. This observation indicates that the fluid-impregnated region consists of networks of microfractures and micropores within the specimen matrix.
In other examples shown in
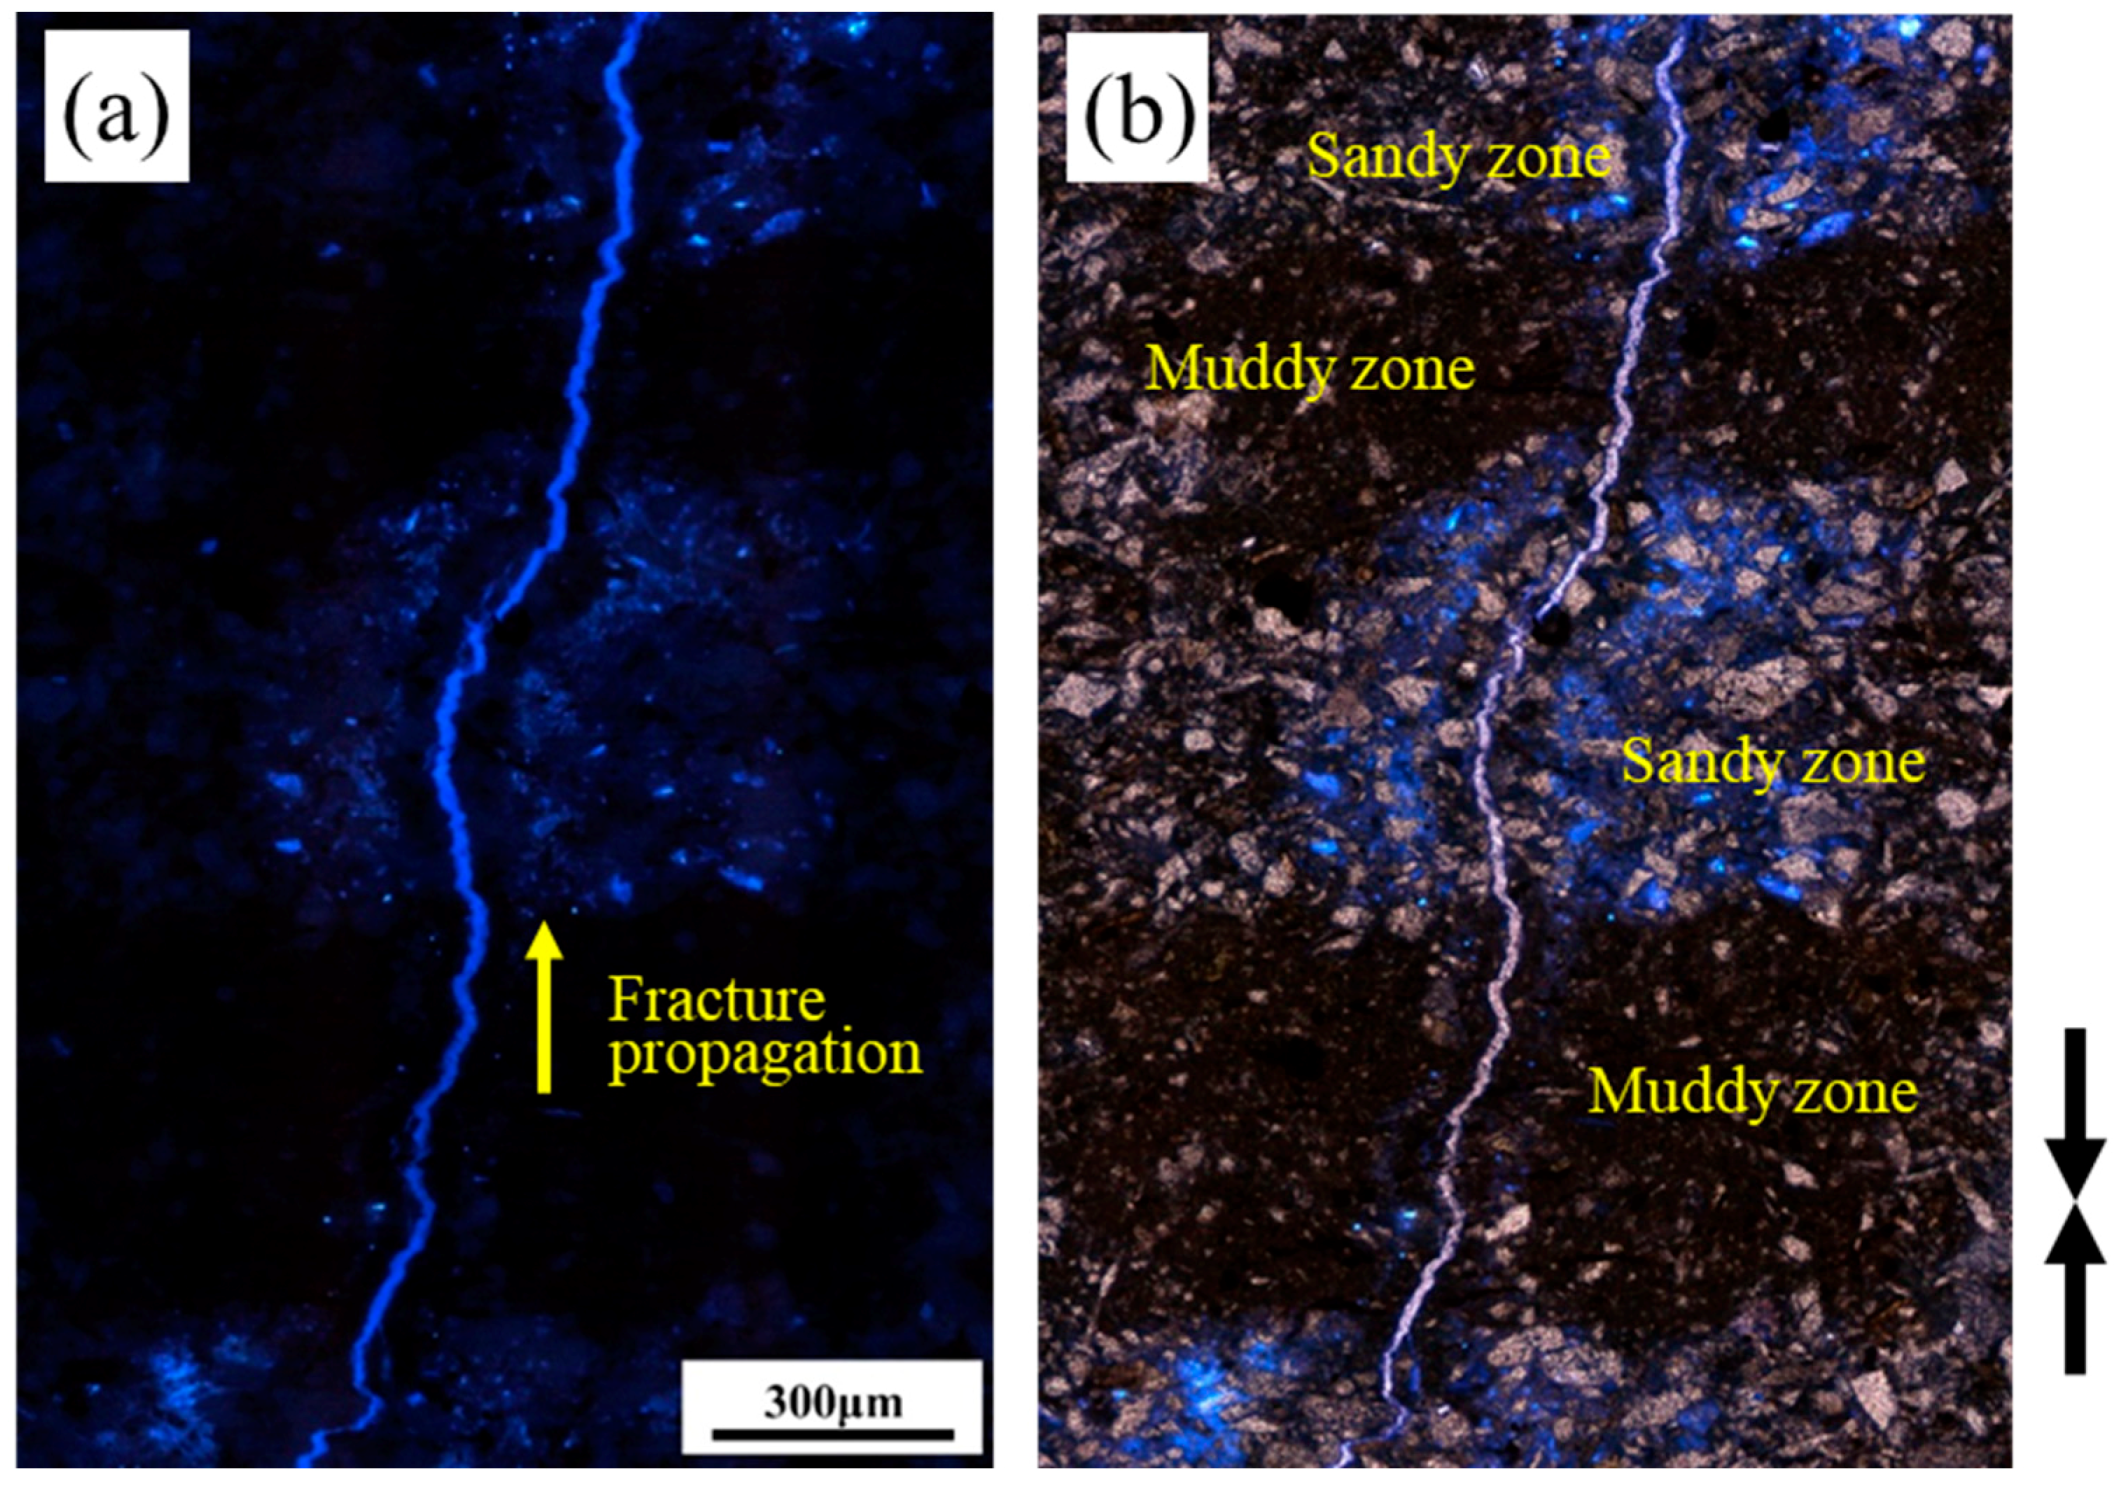
Figure 11 (Cretaceous Kushiro shale), the main fracture, the thick, continuous resin-impregnated region, and surrounding impregnated regions can be clearly identified. Such resin impregnation in the surrounding region may be caused not only by preexisting pores but also by damage induced by propagation of the main fracture.
Figure 11 also shows the dependency of the resin-impregnated regions on the rock texture. A wider impregnation zone is identified for sandy zones than for muddy zones. This was likely caused by larger pore size and good connectivity of pores in the sandy zones, where more fluid can leak off.
5. Discussion and Concluding Remarks
In this research, we conducted hydraulic fracturing experiments using a thermosetting resin mixed with a fluorescent substance as a fracturing fluid in the laboratory. This allowed the induced fractures and their surrounding resin-impregnated regions to be distinguished from other regions according to their brightness under UV light. The resin was fixed within the specimens by heating just after fracturing, and thin sections prepared by cutting the specimens were then observed under UV light. Using the proposed method, we succeeded in fixing the resin injected during hydraulic fracturing and conducted detailed microscopic observations on the characteristics of resin-impregnated regions, including induced fractures.
The fractures observed under the microscope were generally tortuous and accompanied by many thinner ramified fractures. The fractures propagated through the matrix along the boundaries of constituent minerals, resulting in tortuous pathways whose extents were likely affected by grain size. The observed results imply that gas stored in the pores of the matrix can be exploited by inducing fractures, suggesting the importance of understanding matrix pore properties and gas storage conditions.
Preexisting discontinuities such as preexisting fractures, sedimentary planes, and laminae, often change induced fracture propagation pathways and cause complexity. Our method also revealed that hydraulic fracturing stimulates preexisting discontinuities by impregnation of fracturing fluid into them. In areas with dense discontinuities, highly complex fracture networks are sometimes created. The resin penetrated not only induced/preexisting fractures but also the surrounding matrix. This impregnation likely occurred through preexisting micropores or possibly through damage surrounding the main fracture induced by hydraulic fracturing.
A better understanding of the characteristics of hydraulically induced fractures and regions of fracturing fluid impregnation in shale gas/oil reservoirs can help to improve their productivity. The results of our experiments achieve this; thus, we believe that the results contribute to developing new technologies for improving reservoir productivity.
Author Contributions
Conceptualization: Y.C., T.A., S.T. and T.I.; methodology: Y.C., M.N. and T.I.; validation: H.T. and S.T.; investigation: Y.C., M.N. and Y.T.; writing (original draft preparation): Y.C., M.N., T.A. and T.I.; writing (revising draft): Y.C. and M.N.; project administration: Y.C. and S.T.
Funding
This research was funded by JSPS KAKENHI grant number 16H04614.
Acknowledgments
Some of the specimens were collected in cooperation with Kushiro Coal Mine Inc., Hokkaido, Japan.
Conflicts of Interest
The authors declare no conflict of interest.
References
- Miskimins, J.L. Design and life cycle considerations for unconventional reservoir wells. In Proceedings of the SPE Unconventional Reservoirs Conference, Keystone, CO, USA, 10–12 February 2008. [Google Scholar]
- Zoback, M.D.; Rummel, F.; Jung, R.; Raleigh, C.B. Laboratory hydraulic fracturing experiments in intact and pre-fractured rock. Int. J. Rock Mech. Min. Sci. Geomech. Abstr. 1977, 14, 49–58. [Google Scholar]
- Stanchits, S.; Surdi, A.; Gathogo, P.; Edelman, E.; Suarez-Rivera, R. Onset of hydraulic fracture initiation monitored by acoustic emission and volumetric deformation measurements. Rock Mech. Rock Eng. 2014, 47, 1521–1532. [Google Scholar] [CrossRef]
- Zhao, Z.; Li, X.; He, J.; Mao, T.; Zheng, B. Investigation of fracture propagation characteristics caused by hydraulic fracturing in naturally fractured continental shale. J. Nat. Gas Sci. Eng. 2018, 53, 276–283. [Google Scholar] [CrossRef]
- Ma, X.; Li, N.; Yin, C.; Li, Y.; Zou, Y.; Wu, S.; He, F.; Wang, X.; Zhou, T. Hydraulic fracture propagation geometry and acoustic emission interpretation: A case study of Silurian Longmaxi Formation shale in Sichuan Basin, SW China. Petrol. Explor. Dev. 2017, 44, 1030–1037. [Google Scholar] [CrossRef]
- Ishida, T.; Aoyagi, K.; Niwa, T.; Chen, Y.; Mruata, S.; Chen, Q.; Nakayama, Y. Acoustic emission monitoring of hydraulic fracturing laboratory experiment with supercritical and liquid CO2. Geophys. Res. Lett. 2012, 39, L16309. [Google Scholar] [CrossRef]
- Bunger, A.P.; Gordeliy, E.; Detournay, E. Comparison between laboratory experiments and coupled simulations of saucer-shaped hydraulic fractures in homogenieous brittle-elastic solids. J. Mech. Phys. Solids 2013, 61, 1636–1654. [Google Scholar] [CrossRef]
- Nakagawa, S. Laboratory visualization of hydraulic fracture propagation induced by variable-rate fluid injection within analogue rock samples containing preexisting fractures. In Proceedings of the 51st US Rock Mechanics/Geomechaniccs Symposium, San Francisco, CA, USA, 25–28 June 2017. [Google Scholar]
- Xing, P.; Yoshioka, K.; Adachi, J.; El-Fayoumi, A.; Bunger, A.P. Laboratory measurement of tip and global behavior for zero-toughness hydraulic fractures with circular and blade-shaped (PKN) geometry. J. Mech. Phys. Solids 2017, 104, 172–186. [Google Scholar] [CrossRef]
- Guo, T.; Zhang, S.; Qu, Z.; Zhou, T.; Xiao, Y.; Gao, J. Experimental study of hydraulic fracturing for shale by stimulated reservoir volume. Fuel 2014, 128, 373–380. [Google Scholar] [CrossRef]
- Zhou, M.; Zhang, Y.; Zhou, R.; Hao, J.; Yang, J. Mechanical property measurements and fracture propagation analysis of Longmaxi shale by micro-CT uniaxial compression. Energies 2018, 11, 1409. [Google Scholar] [CrossRef]
- Liu, P.; Ju, Y.; Gao, F.; Ranjith, P.G.; Zhang, Q. CT identification and fractal characterization of 3-D propagation and distribution of hydrofracturing cracks in low-permeability heterogeneous rocks. J. Geophys. Res. Solid Earth 2018, 123, 2156–2173. [Google Scholar] [CrossRef]
- Sarout, J.; Molez, L.; Guéguen, Y.; Hoteit, N. Shale dynamic properties and anisotropy under triaxial loading: Experimental and theoretical investigations. Phys. Chem. Earth 2007, 32, 896–906. [Google Scholar] [CrossRef] [Green Version]
- Clarkson, C.R.; Solano, N.; Bustin, R.M.; Bustin, A.M.M.; Chalmers, G.R.L.; He, L.; Melnichenko, Y.B.; Radliński, A.P.; Blach, T.P. Pore structure characterization of North American shale gas reservoirs using USANS/SANS, gas adsorption, and mercury intrusion. Fuel 2013, 103, 606–616. [Google Scholar] [CrossRef]
- Nishiyama, T.; Kusuda, H. Identification of pore spaces and microcracks using fluorescent resins. Int. J. Rock Mech. Sci. Geomech. Abstr. 1994, 31, 369–375. [Google Scholar] [CrossRef]
- Chen, Y.; Watanabe, K.; Kusuda, H.; Kusaka, E.; Mabuchi, M. Crack growth in Westerly granite during a cyclic loading test. Eng. Geol. 2011, 117, 189–197. [Google Scholar] [CrossRef] [Green Version]
- Chen, Y.; Nagaya, Y.; Ishida, T. Observations of fractures induced by hydraulic fracturing in anisotropic granite. Rock Mech. Rock Eng. 2015, 48, 1455–1461. [Google Scholar] [CrossRef]
- Ishida, T.; Chen, Y.; Bennour, Z.; Yamashita, H.; Inui, S.; Nagaya, Y.; Naoi, M.; Chen, Q.; Nakayama, Y.; Nagano, Y. Features of CO2 fracturing deduced from acoustic emission and microscopy in laboratory experiments. J. Geophys. Res. Solid Earth 2016, 121, 8080–8098. [Google Scholar] [CrossRef]
- Bennour, Z.; Ishida, T.; Nagaya, Y.; Chen, Y.; Nara, Y.; Chen, Q.; Sekine, K.; Nagano, Y. Crack extension in hydraulic fracturing of shale cores using viscous oil, water, and liquid carbon dioxide. Rock Mech. Rock Eng. 2015, 48, 1463–1473. [Google Scholar] [CrossRef] [Green Version]
- Bennour, Z.; Watanabe, S.; Chen, Y.; Ishida, T.; Akai, T. Evaluation of stimulated reservoir volume in laboratory hydraulic fracturing with oil, water and liquid carbon dioxide under microscopy using the fluorescence method. Geomech. Geophys. Geo-Energy Geo-Resour. 2017, 4, 39–50. [Google Scholar] [CrossRef]
- Kirsch, E.G. Die Theorie der Elastizität und die Bedürfnisse der Festigkeitslehre. Zeitschrift des Vereines Deutscher Ingenieure 1898, 42, 797–807. [Google Scholar]
- U.S. Energy Information Administration. Annual Energy Outlook; U.S. Energy Information Administration: Washington, DC, USA, 2013.
- Warpinski, N.R.; Teufel, L.F. Influence of geologic discontinuities on hydraulic fracture propagation. J. Pet. Technol. 1987, 39, 209–220. [Google Scholar] [CrossRef]
- Warpinski, N.R.; Mayerhofer, M.J.; Vincent, M.C.; Cipolla, C.L.; Lolon, E.P. Stimulating unconventional reservoirs: Maximizing network growth while optimizing fracture conductivity. In Proceedings of the SPE Unconventional Reservoirs Conference, Keystone, CO, USA, 10–12 February 2008; pp. 237–255. [Google Scholar]
- Johri, M.; Zoback, M.D. The evolution of stimulated reservoir volume during hydraulic stimulation of shale gas formations. In Proceedings of the SPE Unconventional Resources Technology Conference, Denver, CO, USA, 12–14 August 2013. [Google Scholar]
- Zhang, S.-C.; Lei, X.; Zhou, Y.-S.; Xu, G.-Q. Numerical simulation of hydraulic fracture propagation in tight oil reservoirs by volumetric fracturing. Pet. Sci. 2015, 12, 674–682. [Google Scholar] [Green Version]
- Cui, X.; Bustin, A.M.; Bustin, R.M. Measurements of gas permeability and diffusivity of tight reservoir rocks different approaches and their applications. Geofluids 2009, 9, 179–252. [Google Scholar]
- Loucks, R.G.; Reed, R.M.; Ruppel, S.C.; Jarvie, D.M. Morphology, genesis, and distribution of nanometer-scale pores in siliceous mudstones of the Mississippian Barnett shale. J. Sediment. Res. 2009, 79, 848–861. [Google Scholar] [CrossRef]
- Yang, Y.; Wu, K.; Zhang, T.; Xue, M. Characterization of the pore system in an over-mature marine shale reservoir: A case study of a successful shale gas well in Southern Sichuan Basin, China. Petroleum 2015, 1, 173–186. [Google Scholar] [CrossRef]
- Gu, H.; Weng, X.; Lund, J.; Mack, M.; Granguly, U.; Suarez-Rivera, R. Hydraulic fracture crossing natural fracture at non-orthogonal angles: A criterion, its validation and applications. In Proceedings of the SPE Hydraulic Fracturing Technology Conference, The Woodlands, TX, USA, 24–26 January 2011. [Google Scholar]
- Lee, H.P.; Olson, J.E.; Holder, J.; Gale, F.W.; Myers, R.D. The interaction of propagating opening mode fractures with preexisting discontinuities in shale. J. Geophys. Res. Solid Earth 2015, 120, 169–181. [Google Scholar] [CrossRef] [Green Version]
Figure 1.
Schematic of the experimental system for visualizing hydraulically induced fractures.
Figure 1.
Schematic of the experimental system for visualizing hydraulically induced fractures.
Figure 2.
Observation of hydraulically induced fractures under UV light in (a) Eagle Ford shale; (b) Inai shale; and (c) Cretaceous Kushiro shale. The pair of black arrows next to (c) represents the loading direction. Two main fractures (bi-wing fracture) along the loading direction were observed.
Figure 2.
Observation of hydraulically induced fractures under UV light in (a) Eagle Ford shale; (b) Inai shale; and (c) Cretaceous Kushiro shale. The pair of black arrows next to (c) represents the loading direction. Two main fractures (bi-wing fracture) along the loading direction were observed.
Figure 3.
Microscopic observation of hydraulically induced fractures within the Inai shale specimen (a) under UV light and (b) under a single nicol with UV light. Bluish-white parts correspond to induced fractures. The fracture propagation direction is from right to left (yellow arrow). The pair of black arrows under (b) represents the loading direction.
Figure 4.
Patterns of hydraulically induced fractures observed in the thin sections prepared from the tested shale specimens in (a,d) Eagle Ford shale; (b,e) Inai shale; and (c,f) Kushiro shale. The images were obtained under (a–c) UV light and (d–f) a single nicol with UV light. The pair of black arrows next to (f) represents the loading direction. The induced fractures were tortuous and propagated in the shale matrix.
Figure 5.
Branching of hydraulically induced fractures within an Inai shale specimen (Ki-2 in
Table 2) (
a) under UV light and (
b) under a single nicol with UV light. The pair of black arrows next to (
b) represents the loading direction. Branching occurs at an acute angle (red arrows) and the branches run almost parallel to the fracture propagation direction.
Figure 6.
Observation of an induced fracture cutting straight through a preexisting discontinuity in the Eagle Ford specimen. The pair of black arrows next to the figure represents the loading direction. The preexisting discontinuity was impregnated by the resin in short segments.
Figure 6.
Observation of an induced fracture cutting straight through a preexisting discontinuity in the Eagle Ford specimen. The pair of black arrows next to the figure represents the loading direction. The preexisting discontinuity was impregnated by the resin in short segments.
Figure 7.
The influence of preexisting discontinuities on the propagation of an induced fracture (Cretaceous Kushiro shale). The pair of black arrows next to the figure represents the loading direction. The induced fracture shifted its pathway along the preexisting discontinuities for short segments (B–C and D–E) and passed through the preexisting discontinuities. The fluid-impregnated portions were not only the short segments (B–C and D–E) but also the extended portions along preexisting discontinuities surrounding the short segments.
Figure 8.
Stimulation of a preexisting discontinuity by a hydraulically induced fracture (Cretaceous Kushiro shale). The pair of black arrows next to the figure represents the loading direction. The induced fracture approached almost normal to the preexisting discontinuities, parallel to the sedimentary plane, and did not pass through the preexisting discontinuities. The discontinuities were impregnated by the fracturing fluid.
Figure 9.
Observation of complex networks induced between hydraulic fractures and laminae in the Eagle Ford shale specimen under UV light. The pair of black arrows next to the figure represents the loading direction. The hydraulically induced fracture propagated along the loading direction and passed through the laminae after extending along and between them for short segments.
Figure 10.
Resin-impregnated regions around the induced fractures observed in the Paleogene Kushiro shale specimen under UV light. (a) Overview of resin-impregnated region; (b,c) enlarged views of the parts indicated in figure (a). The pair of black arrows next to (c) represents the loading direction. The region is estimated to consist of networks of micropores within the shale matrix.
Figure 11.
Resin-impregnated regions around the induced fractures observed (a) under UV light; (b) under a single nicol with UV light. The pair of black arrows next to (b) represents the loading direction. The regions are wider in sandy zones than in muddy zones.
Figure 11.
Resin-impregnated regions around the induced fractures observed (a) under UV light; (b) under a single nicol with UV light. The pair of black arrows next to (b) represents the loading direction. The regions are wider in sandy zones than in muddy zones.
Table 1.
Specimen sizes and experimental conditions.
Table 1.
Specimen sizes and experimental conditions.
| Series | Sample | Shape 1 | Size 2 | Injection Hole Diameter | Number of Specimens | Pressurizing Section of Packer | Uniaxial Stress |
|---|
| 1 | Eagle Ford | C | L165 mm, D75 mm | 10 mm | 3 | 30 mm | See the text 3 |
| 2 | Eagle Ford | R | L130 mm, S65 mm | 6 mm | 3 | 30 mm | 5 MPa |
| 3 | Inai | C | L200 mm, D82 mm | 10 mm | 6 | 30 mm | 3 MPa |
| 4 | Inai | R | L170 mm, S85 mm | 10 mm | 8 | 30 mm | 5 MPa |
| 5 | Paleogene Kushiro | C | L170 mm, D85 mm | 10 mm | 2 | 30 mm | 3 MPa |
| 6 | Cretaceous Kushiro | C | L150 mm, D60 mm | 6 mm | 12 | 25 mm | 5 MPa |
Table 2.
Summary of experimental fracturing results and corresponding figures.
Table 2.
Summary of experimental fracturing results and corresponding figures.
© 2018 by the authors. Licensee MDPI, Basel, Switzerland. This article is an open access article distributed under the terms and conditions of the Creative Commons Attribution (CC BY) license (http://creativecommons.org/licenses/by/4.0/).

 ,
, 


