The Geometry Effect of Cathode/Anode Areas Ratio on Electrochemical Performance of Button Fuel Cell Using Mixed Conducting Materials


Abstract
:1. Introduction
2. Method and Theory
3. Result and Discussion
4. Conclusions
- (i).
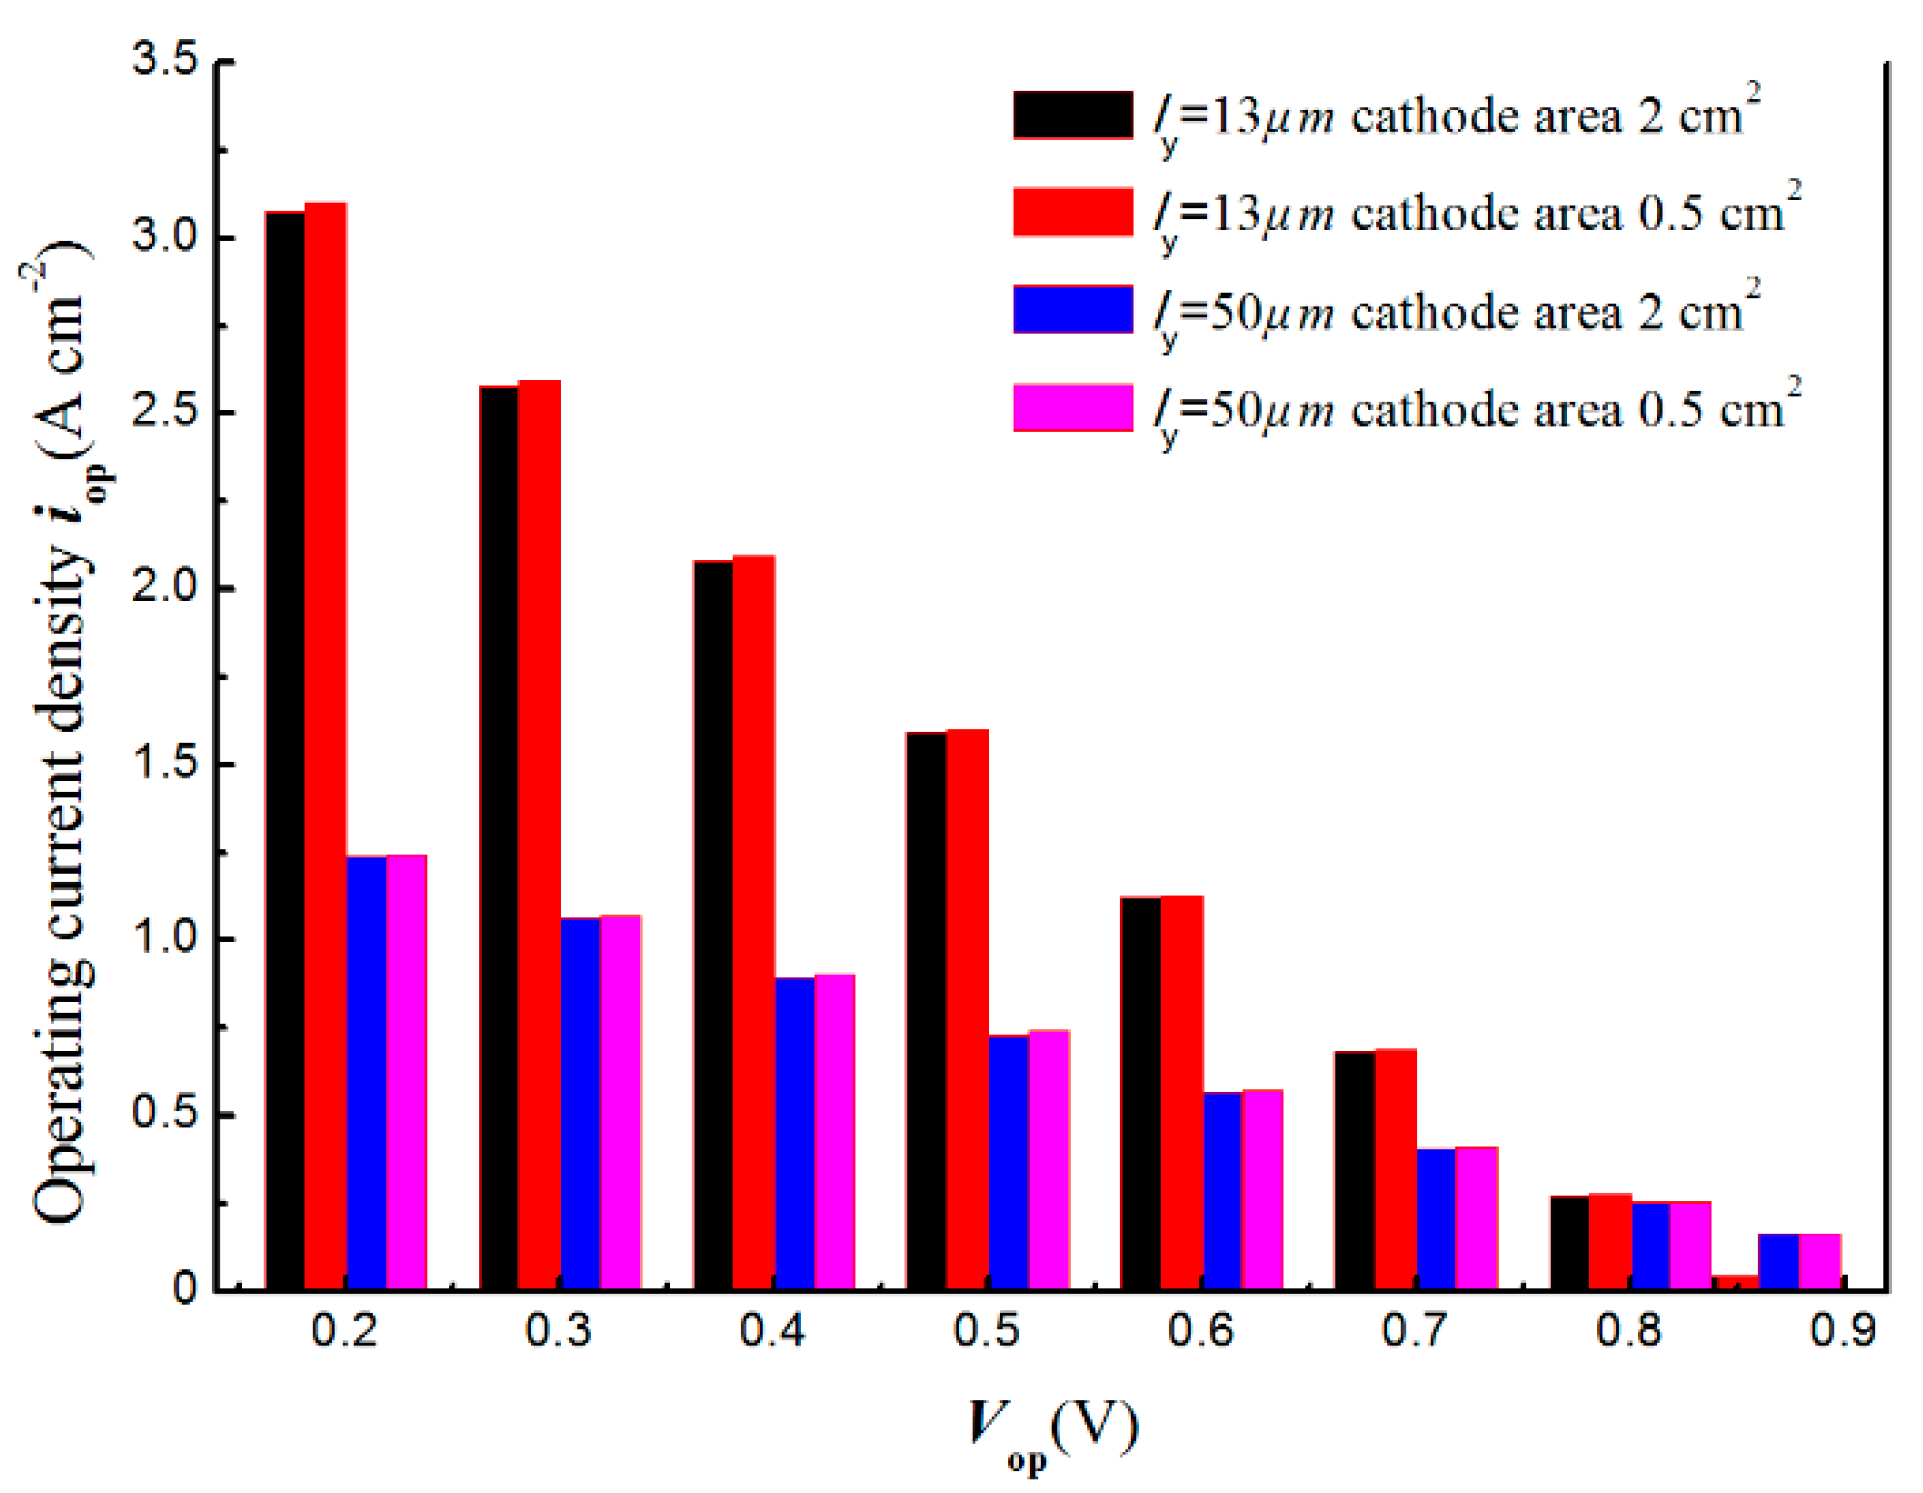
- The over zone of the larger electrode can only enhance charges and gas transport capacities within a limited scale of only 0.03 cm, an over electrode zone exceeding this width would be inactive.
- (ii).
- The active zone of button cell is restricted within the smaller electrode area min(Aan, Aca) due to the relatively large disc radius in scale of cm and the thin component layer.
- (iii).
- For a specified Vop, evaluating the responded iop by dividing output current Iop with min(Aan, Aca) for a larger value is reasonable for presenting the real performance in a current device scale.
- (iv).
- While the geometry of button cell or other electrochemical device approaches a scale of less than 100 , taking the smaller electrode surface area to evaluate iop for a specified Vop would cause an improper over evaluating of the electrochemical performance.
Supplementary Materials
Author Contributions
Funding
Conflicts of Interest
Nomenclature
| Aca | the cross section area of the cathode layer, m2 |
| Aan | the cross section area of the anode layer, m2 |
| B0 | the flow permeability, m2 |
| the concentration of species at the channel inlet, mol m−3 | |
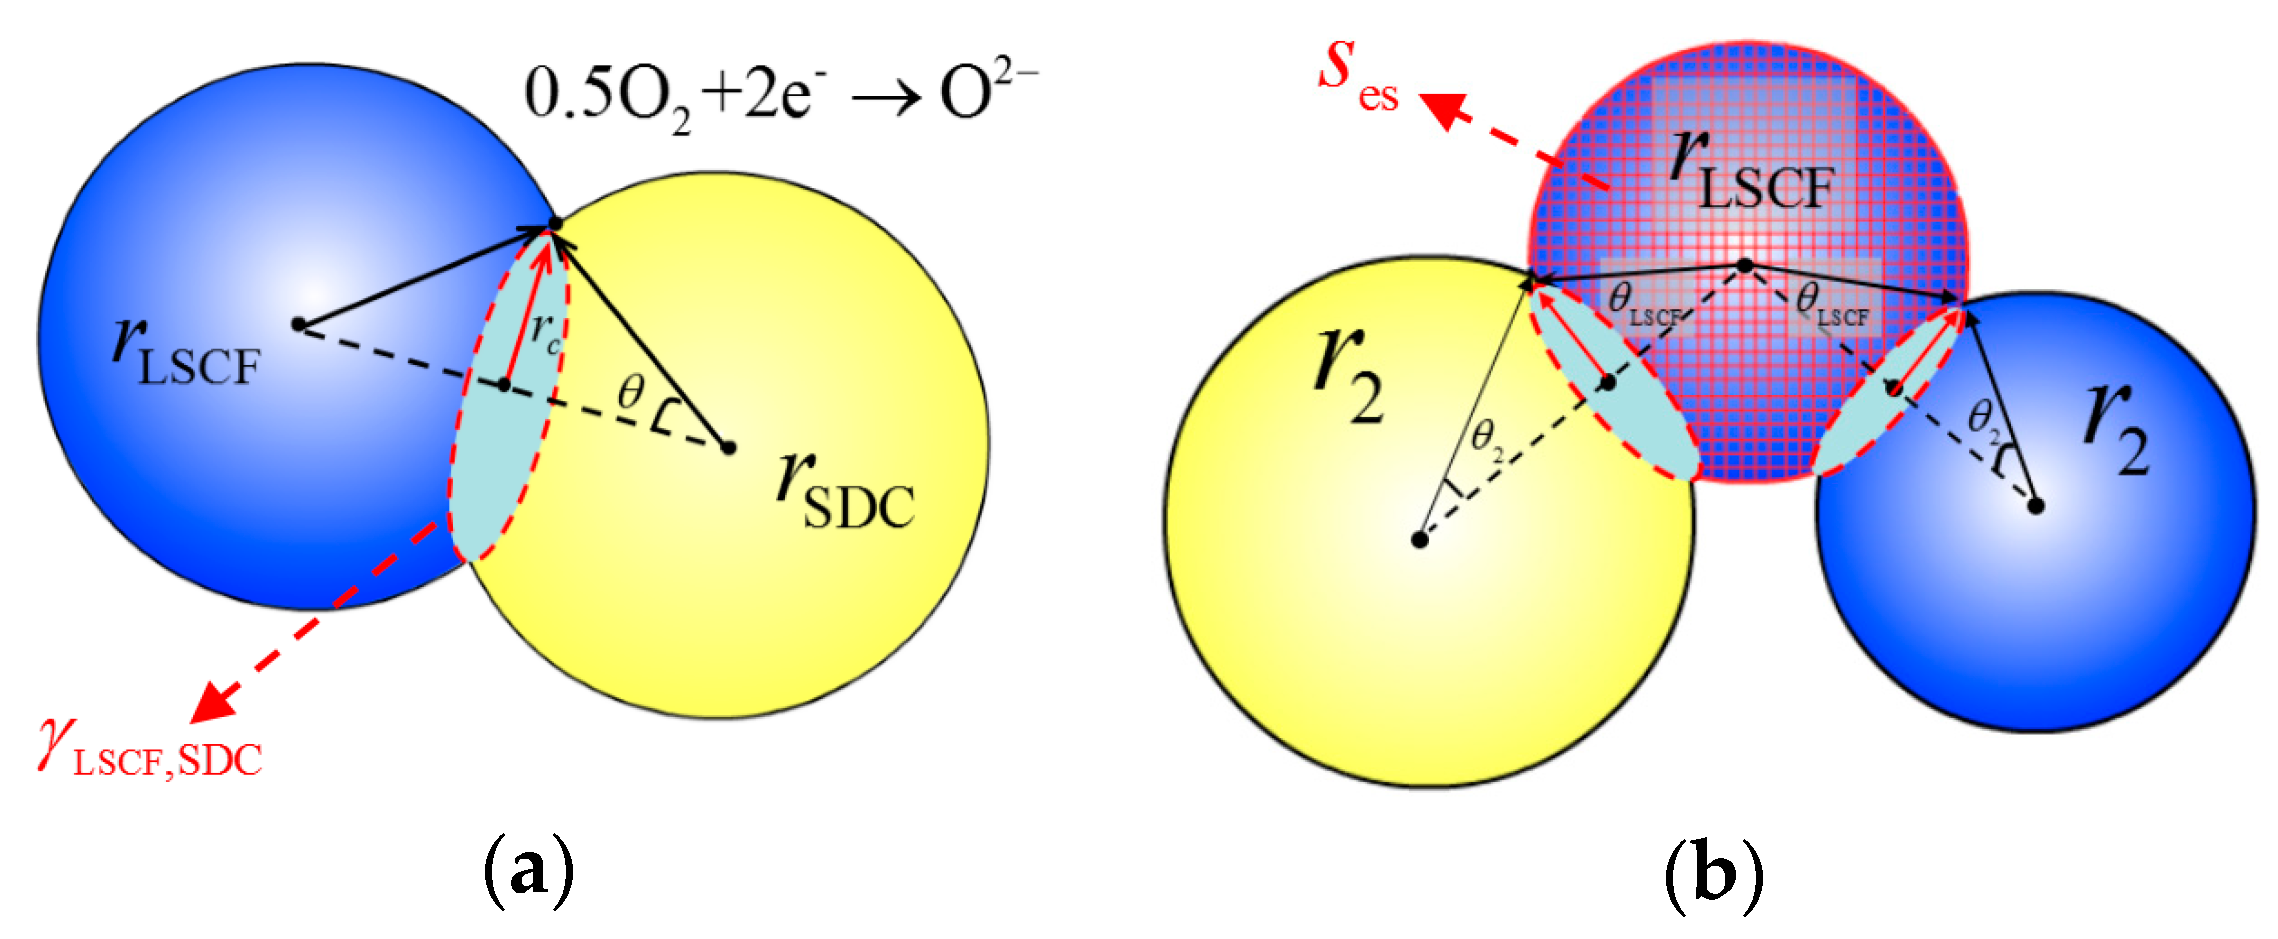
| DPBs | the LSCF-pore double phase boundaries |
| the effective binary diffusivity, m2 s−1 | |
| the effective Knudsen diffusivity of species , m2 s−1 | |
| Eeq | the local equilibrium electric potentials difference at working state, V |
| Est | the Nernst potential at the standard state, V |
| the activation energy for H2 oxidation reaction, J | |
| the activation energy for O2 reduction reaction, J | |
| F | the Faraday constant, C mol−1 |
| GDC | the Gd0.1Ce0.9O1.95 |
| the local e−-O2− charge transfer rate per unit TPB length, A m−1 | |
| the local exchange transfer current per unit TPB lengths, A m−1 | |
| the value assigned empirically based on experiment at reference temperature | |
| ie | the local e− electric current density, A m−2 |
| the local O2− electric current densities, A m−2 | |
| iop | the output current density, A m−2 |
| Iop | the output current, A |
| the e−-O2− charge transfer rate per unit percolated DPB area, A m−2 | |
| the local exchange transfer current per unit percolated DPB area, A m−2 | |
| the e−-O2− charge transfer rate per unit volume based on percolated TPBs, A m−3 | |
| the e−-O2− charge transfer rate per unit volume based on percolated LSCF-pore DPBs, A m−3 | |
| the e−-O2− charge transfer rate per unit dense electrolyte surface, A m−2 | |
| LSCF | the La0.6Sr0.4Co0.2Fe0.8O3−δ |
| LSM | the La1-xSrxMnO3 |
| the mole mass of species , kg mol−3 | |
| the molar flux of species , mol m−2 s−1 | |
| the number of k-particles per unit volume | |
| the number of k-particles per unit dense electrolyte surface area | |
| the partial pressure of gas species at the local reaction sites, atm | |
| the partial pressure of gas species in the channel inlet, atm | |
| the probabilities of SDC-particles belonging to percolated O2− conducting path | |
| the probabilities of LSCF-particles belonging to percolated O2− conducting path | |
| the probabilities of LSCF-particles belonging to percolated e− conducting path | |
| rg | the mean hydraulic pore radius of porous electrode structure, m |
| the radius of k-particle, m | |
| rc | the neck radius between two connected particles, m |
| R | the universal gas constant, J mol−1 K−1 |
| the sources/leak of species , mol m−3 s−1 | |
| SDC | the Sm0.2Ce0.8O2−δ |
| the percolated LSCF-pore DPBs per unit volume, m−1 | |
| the exposed surface area of each LSCF-particle, m2 | |
| T | the operating temperature, K |
| TPBs | the three phase boundary sites |
| Vop | the output voltage at working state, V |
| the diffusion volume for species , m3 mol−1 | |
| the molar fraction of species | |
| YSZ | the yttrium-stabilized zirconia |
| the average number of contacts between k- and all of its neighboring l-particles | |
| the average coordination number of all particles | |
| Greek letters | |
| the forward and reverse reaction symmetric factors | |
| the 1D circular length per contact between LSCF- and SDC-particles, m | |
| the 1D circular length per contact between LSCF-particle and the dense electrolyte, m | |
| the percolated TPB length per unit volume, m−2 | |
| the percolated TPB length per dense electrolyte surface area, m−1 | |
| the porosity of porous structure | |
| the local e− electric potential, V | |
| the local O2− electric potential, V | |
| the shift of by a reference amount, V | |
| the solid volume fraction of k-particles | |
| the local activation overpotential, V | |
| the smaller contact angle between two particles | |
| the tortuosity of gas transport path within the porous electrode | |
| the effective electronic conductivity, S m−1 | |
| the effective O2− ionic conductivity, S m−1 | |
| the viscosity of gas mixture, kg m−1 s−1 | |
| the mole chemical potential of reactant , J mol−1 | |
| Superscripts and subscripts | |
| an | anode |
| act | activation |
| ca | cathode |
| eq | equilibrium |
| st | standard condition (1 atm) |
| ref | reference value |
References
- Kong, W.; Gao, X.; Liu, S.; Su, S.; Chen, A.D. Optimization of the Interconnect Ribs for a Cathode-Supported Solid Oxide Fuel Cell. Energies 2014, 7, 295–313. [Google Scholar] [CrossRef] [Green Version]
- Fotouhi, A.; Auger, D.J.; O’Neill, L.; Cleaver, T.; Walus, S. Lithium-Sulfur Battery Technology Readiness and Applications—A Review. Energies 2017, 10, 1937. [Google Scholar] [CrossRef]
- Repp, S.; Harputlu, E.; Gurgen, S.; Castellano, M.; Kremer, N.; Pompe, N.; Worner, J.; Hoffmann, A.; Thomann, R.; Emen, F.M.; et al. Synergetic effects of Fe(3+) doped spinel Li4Ti5O12 nanoparticles on reduced graphene oxide for high surface electrode hybrid supercapacitors. Nanoscale 2018, 10, 1877–1884. [Google Scholar] [CrossRef] [PubMed]
- Kupecki, J.; Motylinski, K.; Milewski, J. Dynamic analysis of direct internal reforming in a SOFC stack with electrolyte-supported cells using a quasi-1D model. Appl. Energy 2017. [Google Scholar] [CrossRef]
- Papurello, D.; Iafrate, C.; Lanzini, A.; Santarelli, M. Trace compounds impact on SOFC performance: Experimental and modelling approach. Appl. Energy 2017, 208, 637–654. [Google Scholar] [CrossRef]
- Fang, X.; Zhu, J.; Lin, Z. Effects of Electrode Composition and Thickness on the Mechanical Performance of a Solid Oxide Fuel Cell. Energies 2018, 11, 1735. [Google Scholar] [CrossRef]
- Chen, D.; Xu, Y.; Tade, M.O.; Shao, Z. General Regulation of Air Flow Distribution Characteristics within Planar Solid Oxide Fuel Cell Stacks. ACS Energy Lett. 2017, 2, 319–326. [Google Scholar] [CrossRef]
- Park, J.; Kim, D.; Baek, J.; Yoon, Y.-J.; Su, P.-C.; Lee, S. Numerical Study on Electrochemical Performance of Low-Temperature Micro-Solid Oxide Fuel Cells with Submicron Platinum Electrodes. Energies 2018, 11, 1204. [Google Scholar] [CrossRef]
- Tarancón, A. Strategies for Lowering Solid Oxide Fuel Cells Operating Temperature. Energies 2009, 2, 1130–1150. [Google Scholar] [CrossRef] [Green Version]
- Shao, Z.P.; Haile, S.M. A high-performance cathode for the next generation of solid-oxide fuel cells. Nature 2004, 431, 170–173. [Google Scholar] [CrossRef] [PubMed]
- Ni, M.; Leung, M.K.H.; Leung, D.Y.C. Theoretical analysis of reversible solid oxide fuel cell based on proton-conducting electrolyte. J. Power Sources 2008, 177, 369–375. [Google Scholar] [CrossRef]
- Zhang, C.; Grass, M.E.; McDaniel, A.H.; DeCaluwe, S.C.; Gabaly, F.E.; Liu, Z.; McCarty, K.F.; Farrow, R.L.; Linne, M.A.; Hussain, Z.; et al. Measuring fundamental properties in operating solid oxide electrochemical cells by using in situ X-ray photoelectron spectroscopy. Nat. Mater. 2010, 9, 944–949. [Google Scholar] [CrossRef] [PubMed]
- Wang, S.-F.; Wang, Y.-R.; Yeh, C.-T.; Hsu, Y.-F.; Chyou, S.-D.; Lee, W.-T. Effects of bi-layer La0.6Sr0.4Co0.2Fe0.8O3−δ-based cathodes on characteristics of intermediate temperature solid oxide fuel cells. J. Power Sources 2011, 196, 977–987. [Google Scholar] [CrossRef]
- Liu, H.; Akhtar, Z.; Li, P.; Wang, K. Mathematical Modeling Analysis and Optimization of Key Design Parameters of Proton-Conductive Solid Oxide Fuel Cells. Energies 2014, 7, 173–190. [Google Scholar] [CrossRef] [Green Version]
- Kim, J.; Sengodan, S.; Kwon, G.; Ding, D.; Shin, J.; Liu, M.; Kim, G. Triple-Conducting Layered Perovskites as Cathode Materials for Proton-Conducting Solid Oxide Fuel Cells. ChemSusChem 2014, 7, 2811–2815. [Google Scholar] [CrossRef] [PubMed]
- Chen, D.; Zhang, Q.; Lu, L.; Periasamy, V.; Tade, M.O.; Shao, Z. Multi scale and physics models for intermediate and low temperatures H+-solid oxide fuel cells with H+/e−/O2− mixed conducting properties: Part A, generalized percolation theory for LSCF-SDC-BZCY 3-component cathodes. J. Power Sources 2016, 303, 305–316. [Google Scholar] [CrossRef]
- Papurello, D.; Lanzini, A. SOFC single cells fed by biogas: Experimental tests with trace contaminants. Waste Manag. 2018, 72, 306–312. [Google Scholar] [CrossRef] [PubMed]
- Chen, D.; Wang, H.; Zhang, S.; Tade, M.O.; Shao, Z.; Chen, H. Multiscale model for solid oxide fuel cell with electrode containing mixed conducting material. Aiche J. 2015. [Google Scholar] [CrossRef]
- Chen, D.; Xu, Y.; Hu, B.; Yan, C.; Lu, L. Investigation of proper external air flow path for tubular fuel cell stacks with an anode support feature. Energy Convers. Manag. 2018, 171, 807–814. [Google Scholar] [CrossRef]
- Liu, K.; Liu, B.; Villavicencio, R.; Wang, Z.; Guedes Soares, C. Assessment of material strain rate effects on square steel plates under lateral dynamic impact loads. Ships Offshore Struct. 2018, 13, 217–225. [Google Scholar] [CrossRef]
- Su, S.; He, H.; Chen, D.; Zhu, W.; Wu, Y.; Kong, W.; Wang, B.; Lu, L. Flow distribution analyzing for the solid oxide fuel cell short stacks with rectangular and discrete cylindrical rib configurations. Int. J. Hydrog. Energy 2015, 40, 577–592. [Google Scholar] [CrossRef]
- Pianko-Oprych, P.; Hosseini, S. Dynamic Analysis of Load Operations of Two-Stage SOFC Stacks Power Generation System. Energies 2017, 10, 2103. [Google Scholar] [CrossRef]
- Chen, D.; He, H.; Zhang, D.; Wang, H.; Ni, M. Percolation theory in solid oxide fuel cell composite electrodes with a mixed electronic and ionic conductor. Energies 2013, 6, 1632–1656. [Google Scholar] [CrossRef]
- Zhu, H.Y.; Kee, R.J. Modeling distributed charge-transfer processes in SOFC membrane electrode assemblies. J. Electrochem. Soc. 2008, 155, B715–B729. [Google Scholar] [CrossRef]
- Jeon, D.H.; Nam, J.H.; Kim, C.J. Microstructural optimization of anode-supported solid oxide fuel cells by a comprehensive microscale model. J. Electrochem. Soc. 2006, 153, A406–A417. [Google Scholar] [CrossRef]
- Liu, S.X.; Song, C.; Lin, Z.J. The effects of the interconnect rib contact resistance on the performance of planar solid oxide fuel cell stack and the rib design optimization. J. Power Sources 2008, 183, 214–225. [Google Scholar] [CrossRef]
- Tseronis, K.; Kookos, I.K.; Theodoropoulos, C. Modelling mass transport in solid oxide fuel cell anodes: A case for a multidimensional dusty gas-based model. Chem. Eng. Sci. 2008, 63, 5626–5638. [Google Scholar] [CrossRef]
- Kong, W.; Zhang, Q.; Xu, X.; Chen, D. A Simple Expression for the Tortuosity of Gas Transport Paths in Solid Oxide Fuel Cells’ Porous Electrodes. Energies 2015, 8, 13953–13959. [Google Scholar] [CrossRef] [Green Version]
- Ni, M.; Shao, Z.; Chan, K. Modeling of Proton-Conducting Solid Oxide Fuel Cells Fueled with Syngas. Energies 2014, 7, 4381–4396. [Google Scholar] [CrossRef] [Green Version]
- Veldsink, J.W.; Vandamme, R.M.J.; Versteeg, G.F.; Vanswaaij, W.P.M. The Use of the Dusty-Gas Model for the Description of Mass-Transport with Chemical-Reaction in Porous-Media. Chem. Eng. J. Biochem. Eng. J. 1995, 57, 115–125. [Google Scholar] [CrossRef]
- Todd, B.; Young, J.B. Thermodynamic and transport properties of gases for use in solid oxide fuel cell modelling. J. Power Sources 2002, 110, 186–200. [Google Scholar] [CrossRef]
- Nguyen, X.-V.; Chang, C.-T.; Jung, G.-B.; Chan, S.-H.; Huang, W.; Hsiao, K.-J.; Lee, W.-T.; Chang, S.-W.; Kao, I.-C. Effect of Sintering Temperature and Applied Load on Anode-Supported Electrodes for SOFC Application. Energies 2016, 9, 701. [Google Scholar] [CrossRef]


| Gas | T0 (K) | S (K) | ||
|---|---|---|---|---|
| H2 | 6.12 | 8.411 | 273 | 97 |
| vapor | 13.1 | 11.2 | 350 | 1064 |
| O2 | 16.3 | 19.19 | 273 | 139 |
| N2 | 18.5 | 16.63 | 273 | 107 |
| Vop | I (A) | iop Based Aan (A cm−2) | iop Based on Aca (A cm−2) | |||
|---|---|---|---|---|---|---|
| Cell 1 | Cell 2 | Cell 1 | Cell 2 | Cell 1 | Cell 2 | |
| 0.2 | 8.139 | 2.047 | 2.592 | 0.652 | 4.069 | 4.095 |
| 0.3 | 7.585 | 1.906 | 2.416 | 0.607 | 3.793 | 3.811 |
| 0.4 | 6.838 | 1.717 | 2.178 | 0.547 | 3.419 | 3.434 |
| 0.5 | 5.587 | 1.412 | 1.779 | 0.450 | 2.794 | 2.824 |
| 0.6 | 3.860 | 0.971 | 1.229 | 0.309 | 1.930 | 1.942 |
| 0.7 | 1.905 | 0.481 | 0.607 | 0.153 | 0.953 | 0.962 |
| 0.78 | 0.302 | 0.078 | 0.096 | 0.025 | 0.151 | 0.155 |
| Item | Anode Support | Functional Layer | Dense Electrolyte | Cathode |
|---|---|---|---|---|
| Anode support | 460 | 6 | 13 | 40 |
| Cathode support | 20 | 6 | 13 | 480 |
| Electrolyte support | 20 | 6 | 460 | 40 |
| Self support | 100 | 100 | 50 | 200 |
© 2018 by the authors. Licensee MDPI, Basel, Switzerland. This article is an open access article distributed under the terms and conditions of the Creative Commons Attribution (CC BY) license (http://creativecommons.org/licenses/by/4.0/).
Share and Cite
Chen, D.; Hu, B.; Ding, K.; Yan, C.; Lu, L. The Geometry Effect of Cathode/Anode Areas Ratio on Electrochemical Performance of Button Fuel Cell Using Mixed Conducting Materials. Energies 2018, 11, 1875. https://doi.org/10.3390/en11071875
Chen D, Hu B, Ding K, Yan C, Lu L. The Geometry Effect of Cathode/Anode Areas Ratio on Electrochemical Performance of Button Fuel Cell Using Mixed Conducting Materials. Energies. 2018; 11(7):1875. https://doi.org/10.3390/en11071875
Chicago/Turabian StyleChen, Daifen, Biao Hu, Kai Ding, Cheng Yan, and Liu Lu. 2018. "The Geometry Effect of Cathode/Anode Areas Ratio on Electrochemical Performance of Button Fuel Cell Using Mixed Conducting Materials" Energies 11, no. 7: 1875. https://doi.org/10.3390/en11071875