1. Introduction
Currently, some developing countries have progressed agriculture beyond just being a local food self-sufficient activity. Agriculture now plays a key role in the social and economic development of communities. Agriculture, like other activities, is currently attempting to incorporate sustainability actions, including the reduction in energy consumption, the diminishment of environmental impact, and the preservation of natural resources, such as water and soil [
1]. The use of renewable energies is one way of making agriculture more sustainable. In this context, the Food and Agriculture Organization of the United Nations (FAO) and the European Union promoted the use of renewable energies in agricultural activities [
2]. Irrigation is a prime candidate for improvement as it represents one of the most energy-intensive activities in farming.
Irrigation systems may be classified as on-grid or off-grid depending on electrical grid access. In general, off-grid systems use fossil fuels, such as diesel, in stationary generator sets [
2,
3,
4,
5]. Although rural electrification is expanding, it may still not be technically or economically feasible in some regions of Asia and Latin America due to the cost of extending the electrical grid, and the complicated access to some remote areas [
6,
7,
8]. The use of renewable energy contributes to reducing the dependency on fossil fuels and greenhouse emissions [
7]; consequently, solar energy has been used to power irrigation in agricultural activities for two decades [
9].
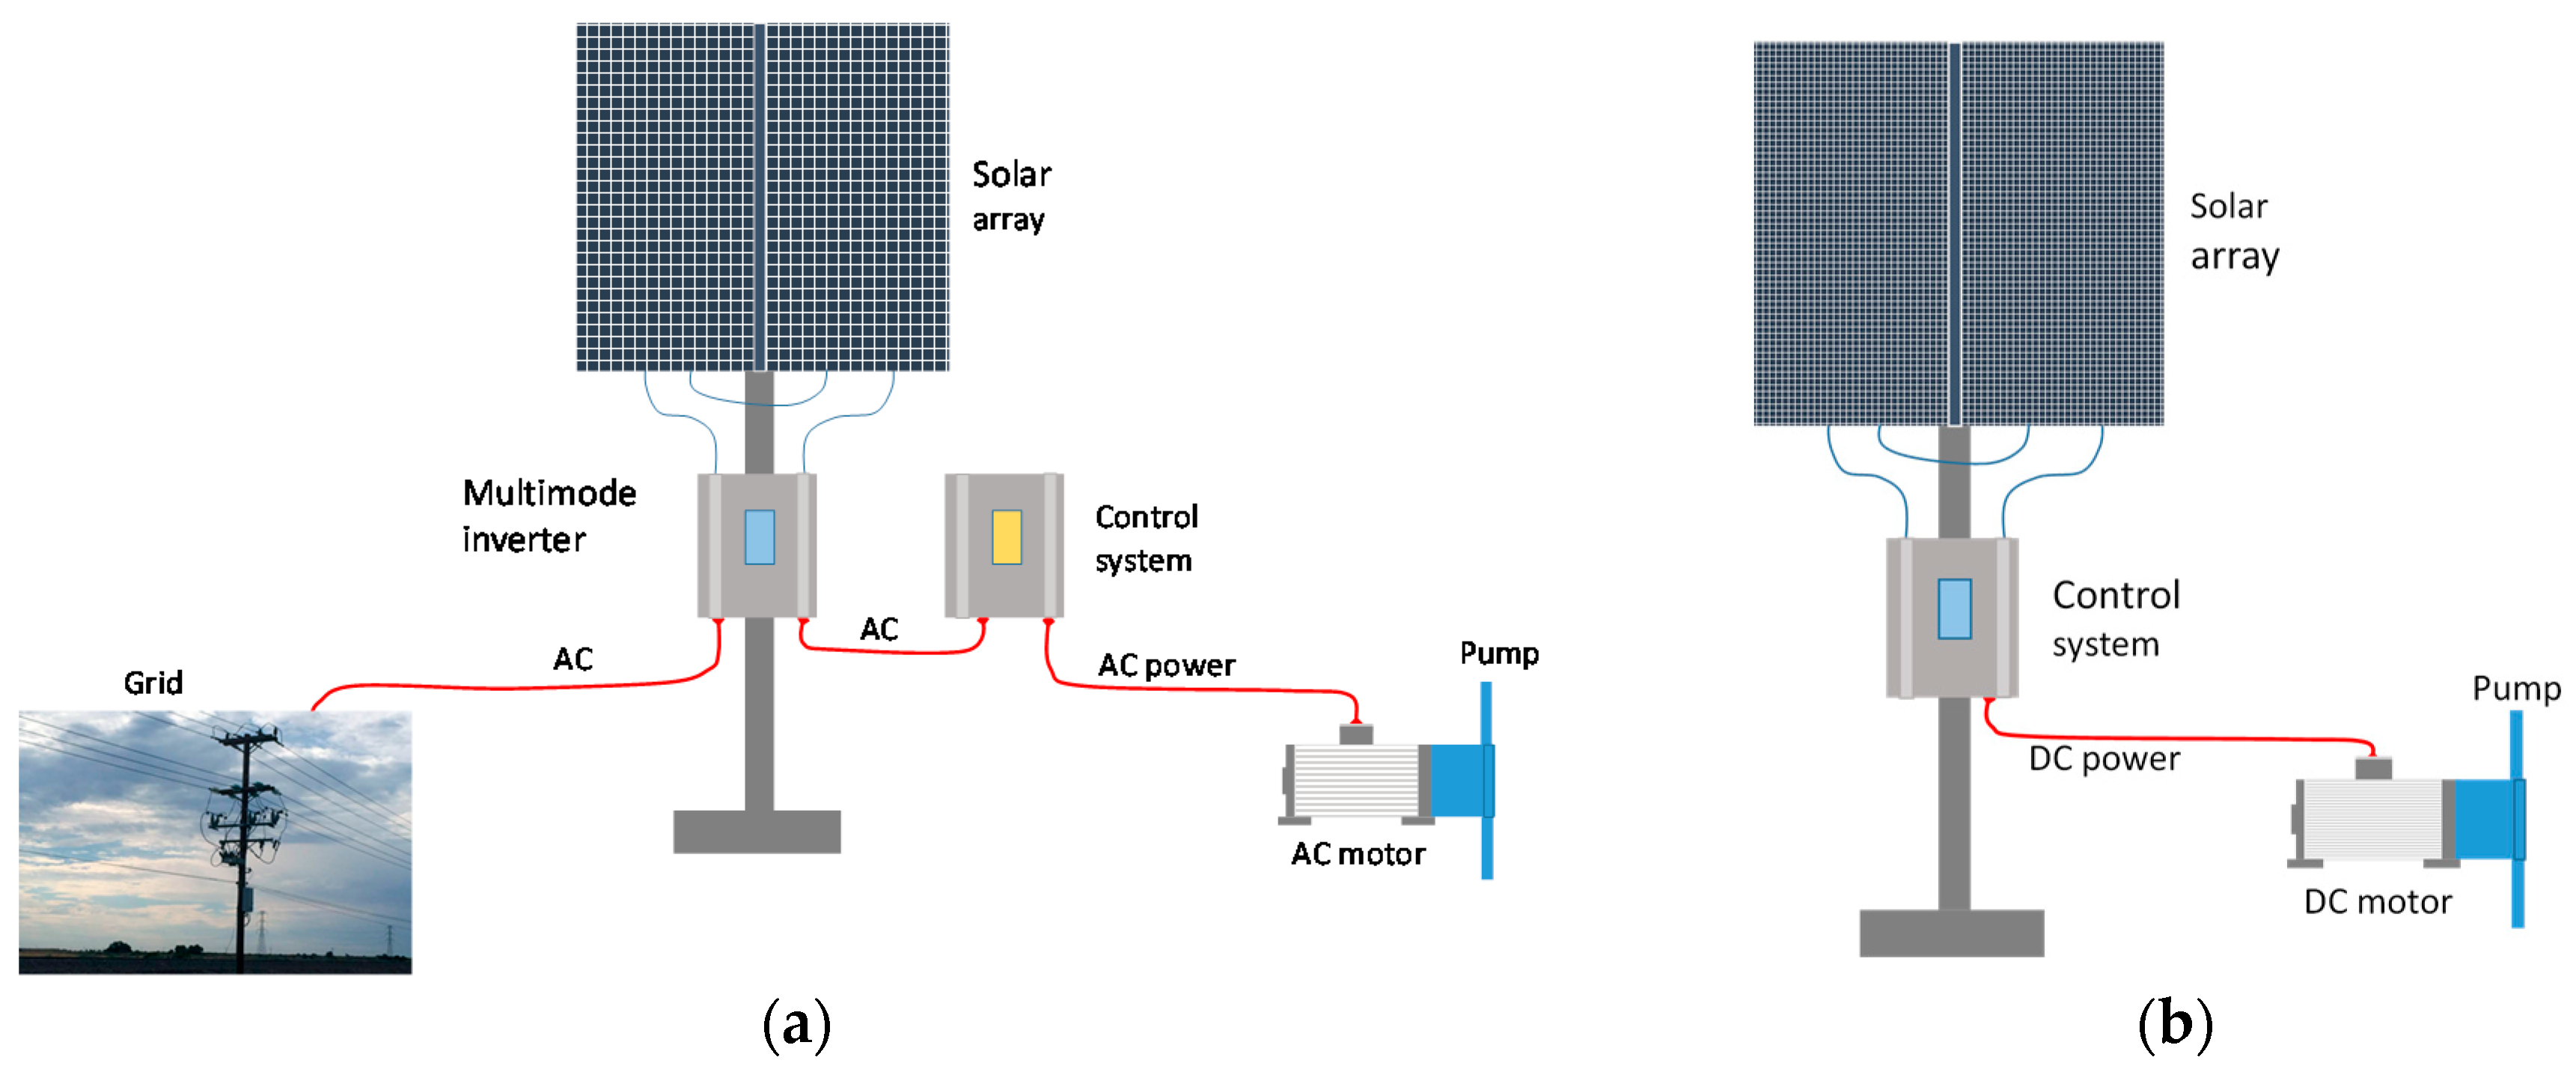
Solar photovoltaic (PV) irrigation systems may be classified as either off-grid, when the system is isolated from the electrical grid (
Figure 1b), or on-grid, when the system is connected to the electrical grid (
Figure 1a). In Reference [
3], off-grid installations are described as the most typically implemented solar PV irrigation systems. The off-grid approach presents itself as a viable, cost-sensitive solution for irrigation systems due to difficulties in electrical grid connections in remote areas [
10]. Many authors [
2,
3,
7,
9,
11,
12] discussed the use of off-grid solar PV irrigation systems for remote areas in the last decade. Some reports focused on off-grid solar PV systems connected directly to the pump [
11], while others also described storage alternatives such as batteries and water storage [
2]. The present study considers direct solar PV irrigation systems.
Irrigation is a seasonal activity as crops only require water during some months of the year. This situation may prove inhibitory to the incorporation of off-grid solar PV irrigation systems [
12]. In some cases, the use of on-grid solar PV irrigation systems may be more beneficial, as they have the ability to disperse excess electricity into the electrical grid when its generation is greater than the demand of the irrigation system in periods where water is unnecessary, or when the electricity demand is lower than the electricity generated by the PV system. This option is only possible when access to the electrical grid exists [
1]. Additionally, on-grid systems allow the extension of irrigation time during periods of reduced solar radiation, by altering the size of the pumping system [
13].
Chile is the main exporter of fresh fruit in the Southern Hemisphere, and the top exporter of table grapes, strawberries, and blueberries in the world [
14]. The fruit farmland was estimated to be 322,197 hectares in 2016. Sixty percent of the producers are small or medium-sized, with their fruit farmland encompassing around 0.5 hectares to 3 hectares [
14]. In the fresh-fruit industry in Chile, the electrical cost is relatively high in comparison with other members of the Organization for Economic Co-operation and Development (OECD) [
15]; therefore, some solutions should ideally be implemented so as to reduce the electrical cost, such as the incorporation of solar PV systems into existing irrigation systems. In addition, the installation of solar PV systems is a reasonable approach thanks to the high solar radiation across most of Chile [
16].
Since 2012, the Chilean Ministries of Agriculture and Energy developed a national strategy to incorporate renewable energies into the agriculture sector. Between 2013 and 2014, 1480 off-grid solar PV systems, with power ranging from 1 kW to 3 kW, were installed to drive existing irrigation systems in small and medium-sized farms for the exportation of fresh fruit [
17]. Some doubts exist with regards to the focus of the program as there is no evidence of an adequate analysis of the existing irrigation systems’ baseline prior to the installation of the solar PV system. In Reference [
18], it is indicated that most farmers in Latin American countries have old and inefficient irrigation systems, resulting in an overconsumption of energy, which accounts for approximately 50% of the annual operational cost. Similar situations are observed around the world: Reference [
19] reported pump efficiencies ranging between 20% and 30% in existing irrigation systems in Tunisia; Reference [
20] reported a motor-pump performance of 30%. An inefficient irrigation system requires an unnecessarily oversized solar PV system. Also, irrigation is only necessary in some months and in some hours; consequently, there is a gap between electricity produced by an off-grid solar PV system and electricity required by the irrigation system. In 2014, a net metering billing policy, Regulation Number 20.571, was approved, allowing the injection of excess electricity from PV systems into the electrical grid for systems with an installed capacity lower than 100 kW. Consequently, on-grid solar PV system may be considered as a configuration when there is a nearby electrical grid. Furthermore, Chile has an electrical grid that covers 99% of the population [
21]; consequently, most farms have access to electricity for housing and harvest purposes. Therefore, the analysis of on-grid solar PV systems is warranted.
There are some opportunities to reduce the electrical cost associated with irrigation systems via energy-efficient approaches. However, most of the fresh-fruit industry in Chile does not have access to the adequate technical information required to correctly design irrigation systems, or to apply energy-efficient actions so as to improve actual systems. In general, the baseline situation is not well known; consequently, the potential for energy efficiency is also unknown. Other factors contributing to the lack of information include limited available data regarding the successful implementation of energy efficiency in the use of PV irrigation systems.
The general objective of this research is to demonstrate a cost-effective methodology for the sizing of solar PV systems for existing irrigation facilities in Chile. An adequate design of a solar PV system to drive existing irrigation systems may improve the competitiveness of the fresh-fruit industry in Chile and other Latin American countries. The article presents four projects of energy-efficient actions for solar PV systems incorporated into existing irrigation systems in a small fresh-fruit industry. Off-grid and on-grid solar PV systems were analyzed in two Chilean regions, as well as some particularities of the Chilean regulations. For each irrigation system, the baseline situation was determined, as well as the potential energy-efficient actions, in addition to the recommended installation of the PV system.
3. Case Studies in Chile
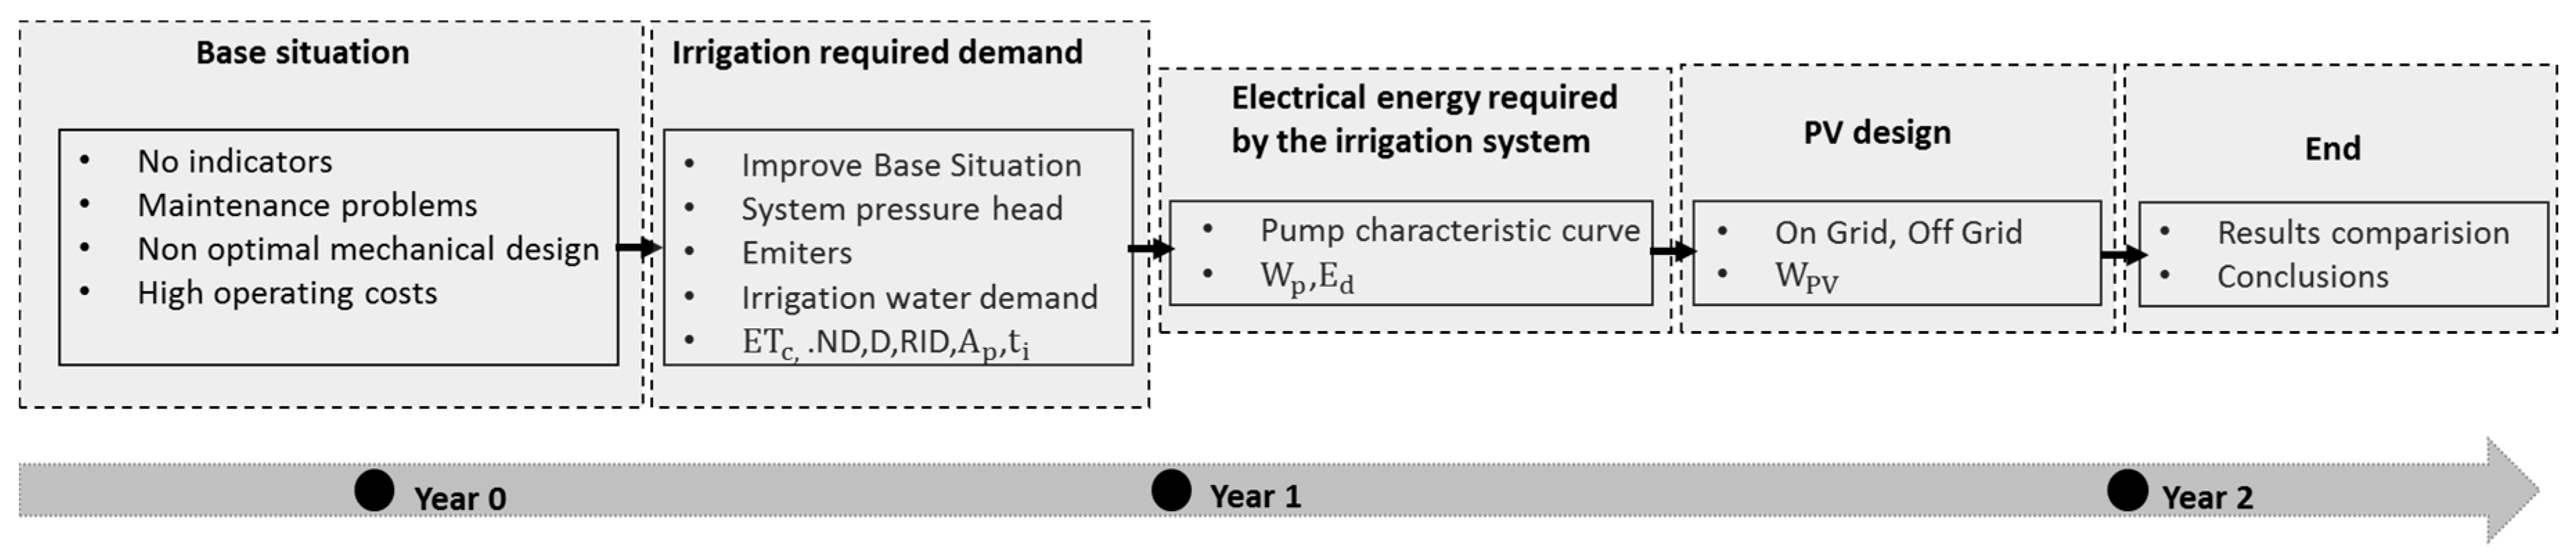
Four experimental units (EUs) were selected for the implementation of a PV system to drive the existing irrigation systems. Two Chilean regions were evaluated, with one off-grid and one on-grid solar PV system used to drive the existing irrigation systems in each region. Firstly, a baseline was defined, and the annual energetic behavior was reported as Year 0. Secondly, a performance analysis of the existing irrigation system was conducted, and some energy-efficient actions were implemented. The impact of energy-efficient actions was monitored for a year, and reported as Year 1. Either the solar PV off-grid or the on-grid system was installed. The system was monitored for a year, and the results were reported as Year 2. Each unit had a real-time acquisition system that monitored the electricity used by the pump, the water volume flow rate, and the head pressure of the irrigation system. The electricity generated by the solar PV system was monitored during Year 2, as was the electricity supplied to, or demanded by, the electrical grid for the on-grid systems.
3.1. Baseline—Year 0
Table 1 shows some characteristics of the selected EUs. Two of them (EU 1 and EU 2), which produced table grapes, were located in the Atacama Region in northern Chile, while the other two EUs (EU 3 and EU 4), which were dedicated to the production of strawberries, were located in the Maule Region in southern Chile. In the Atacama Region, there is an annual average daily solar radiation of 3400 kWh/m
2. EU 1 and EU 2 had irrigation systems that covered a surface area of 0.80 ha and 0.87 ha, respectively. Both EU 1 and EU 2 were considered similar on the basis of their water demand for irrigation. In the Maule Region (southern Chile), the annual average daily solar radiation is 1900 kWh/m
2. The irrigation systems of EU 3 and EU 4 covered 0.3 ha and 0.5 ha, respectively, which were considered similar surface areas. EUs 1, 2, and 3 had access to the local electrical grid, while EU 4 was an off-grid system, with its electricity requirement was supplied by a stationary 2 kW diesel generator set.
Assuming similar characteristics between EU 1 and EU 2, initial analyses indicated that the electricity use of EU 2 was considerably greater than that of EU 1; consequently, there was an opportunity to implement some energy-efficient activities. The electricity prices of EU 1 and EU 2 were comparable. The surface area of EU 3 was smaller than that of EU 4; however, EU 3 used more than four times the electricity required by EU 4. Therefore, EU 3 also had an issue of energy efficiency which could be addressed. The electricity costs of EU 3 and EU 4 were similar, despite EU 4 using considerably less energy than EU 3 due to it being an off-grid facility which produced its electricity using a stationary diesel generator set. Firstly, the performance of the irrigation system was evaluated, and actions were undertaken to improve its operation, before proceeding to the design of the PV system which was to be implemented in the irrigation system.
3.2. Performance Analysis of Irrigation Systems—Year 1
It seems reasonable to assess the energetic performance of an irrigation system prior to the installation of a PV system. Aspects regarding energy efficiency may be found upon studying water demand, as the irrigation system may be supplying more water than necessary. Additionally, components of the irrigation system, such as the pump, filters, and emitters, may be inadequately implemented, resulting in greater electricity requirements than necessary. Furthermore, the operation and maintenance protocols for the irrigation system may not be appropriate. Consequently, it may not be cost-effective to design a PV system for an irrigation system without first assessing the functionality of the irrigation system.
3.2.1. Water Demand
The methodology presented in
Section 2.1 was used to determine the monthly water demand for each EU. Agrometeorological stations from the national agroclimatic network (Agromet) [
27] located close to each EU were used to determine the necessary climate variables (i.e., wind speed, solar radiation, air temperature, relative humidity, and rainfall) for the determination of
ET0 (Equation (1)) and
ND (Equation (3)).
Kc was required in Equation (2), and it was obtained from the Chilean Irrigation Commission bulletins [
24,
25], and the “Reference Evapotranspiration, for the Determination of Water Demands for Agriculture in Chile” [
26].
After studying the initial conditions, it was determined that EU 3 used more water than necessary. The farmer had decided that EU 3 increased the irrigation surface area from 0.3 ha (Year 1) to 2.5 ha (Year 2). The monthly water demand for each EU is presented in
Table 2. The irrigation season began in August, and finished in March for the Atacama Region (table grapes), and the greatest water demand was observed in December. In the Maule Region, strawberries required water between September and April, and the peak water demand was observed in December. EUs 1 and 2 presented similar water demands. The new surface area of EU 3 was more than five times greater than that of EU 4, as was the water demand.
3.2.2. Electricity Demand of an Irrigation System
As mentioned before, the pump selection of the irrigation system depends on the required system’s pressure and the water demand. The system pressure for a drip irrigation system depends on the difference in elevation between the suction pump and emitters, as well as the system’s pressure drop, and the working pressure required by the emitters. A drip irrigation system was used in all selected EUs.
New-generation emitters (NGE) were selected and implemented in each EU, which operated in a working pressure ranging between a 5 m and 30 m water column (m H
2O), and with a water volume flow rate of 4 L per hour [
38]. The design conditions considered a working pressure of 10 m H
2O for the NGE emitters. An NGE emitter consists of a pressure-compensating diaphragm allowing uniform irrigation. The uniformity of irrigation is relevant as it supplies the correct volume of water required by all the crops distributed across the farm. Additionally, this results in optimal production on the farm, and a minimization of the loss of soil nutrients, avoiding deep percolation [
39].
The proposed configurations, able to account for the water demand, had a system pressure head (m H
2O) as presented in
Table 3. Additionally, the pressure head due to the emitters, the topographic slope, and the pressure drop of the irrigation system are also shown. EUs 1, 2 and 4 had similar conditions with a system pressure head of 14 m, with contributions from the emitter requirements (10 m), the elevation head (1 m), and the pressure drop (3 m). However, EU 3 presented a much greater system pressure head (47 m) due to high elevation (32 m) between the pump suction and the emitter discharge. Furthermore, the higher elevation and longer distribution lines caused an increase in pressure drop to 5 m.
As discussed in
Section 2.2, the pumping system should be designed for the worst-case scenario, coinciding with the month featuring the greatest water demand. This occurred in December for table grapes and strawberries.
Table 4 shows the monthly electrical energy demand of the irrigation systems in each EU. The monthly electricity demand (
Ed), in kWh/month, was calculated using Equations (8) and (9), and the data are presented in
Table 2 and
Table 3. The selected pump (Lorents C-SJ8-7) had a combined efficiency (
η) of 45% (
ηp = 50% and
ηm = 90%). Additionally, the annual energy demand (kWh/year) and the annual electricity cost (
$/year) are also listed.
3.2.3. Results of Energy-Efficient Actions
The most common approaches to saving water and energy in irrigation systems include an irrigation calendar with the correct water demand at baseline for the estimation of appropriate evapotranspiration factors, a measurement of the daily irrigated volume flow rate, an installation of automatic irrigation systems with timers, and minimization of the system pressure requirement by means of adequate selection of filters, fittings, valves, and emitters. In addition, the development of an operation and maintenance plan for the irrigation and PV systems is beneficial, as well as the selection of an adequate pumping system.
Table 5 shows the economical assessment of each EU following the application of previously mentioned energy-efficient actions. The electricity usage and cost are shown at baseline (Year 0) and after the energy-efficient actions were applied (Year 1). In addition, the savings, the investment, and the payback are shown.
The operational cost of EUs 1, 2 and 3 correspond to the amount paid yearly to the electricity company. In the case of EU 4, the operational cost represents annual diesel consumption. In Year 1, the application of energy-efficient actions to the irrigation systems resulted in savings of greater than 70% in EUs 1, 2 and 4 when compared with baseline conditions (Year 0), and a similar observation was reported for other Latin American countries [
18]. Upon studying the initial operational conditions of EU 3, it was detected that EU 3 used more water than necessary. The payback periods reported for EUs 1, 2 and 4 were approximately four years long. The irrigation system of EU 3 was modified following the increase in irrigated surface area from 0.3 ha (Year 0) to 2.5 ha (Year 1); however, EU 3 still used more energy (2941 kWh/year compared with 2134 kWh/year) than at baseline (Year 0). The payback period for EU 3 was less than six years.
3.3. Solar PV System Design—Year 2
3.3.1. Off-Grid PV System
EU 2 (table grapes) and EU 4 (strawberries) were selected for the implementation of an off-grid system to drive their irrigation systems. The design of an off-grid PV system required the identification of the month with the greatest energy demand, which was observed with a correspondingly peak water demand in December for EUs 2 and 4 (1769 m3/month and 322 m3/month, respectively).
The daily electrical energy demand of EU 2 was 4.8 kWh/day. The off-grid system operated between 10:00 a.m. and 03:00 p.m. so as to maximize solar radiation, while a safety factor was incorporated allowing operation outside of these hours provided there was adequate solar radiation. The average electrical power (
W1kW,PV) produced by a PV system in 1 h (December, between 10:00 a.m. and 11:00 a.m.) with a nominal electrical power of 1 kW was 0.62 kWh. The required power capacity of the PV system was 1.86 kW
p; however, considering the capacity of the individual PV modules as 0.23
Wp, the power of the off-grid PV system (
WPV) was sized to 2.07 kW
p (nine PV modules, see
Table 6).
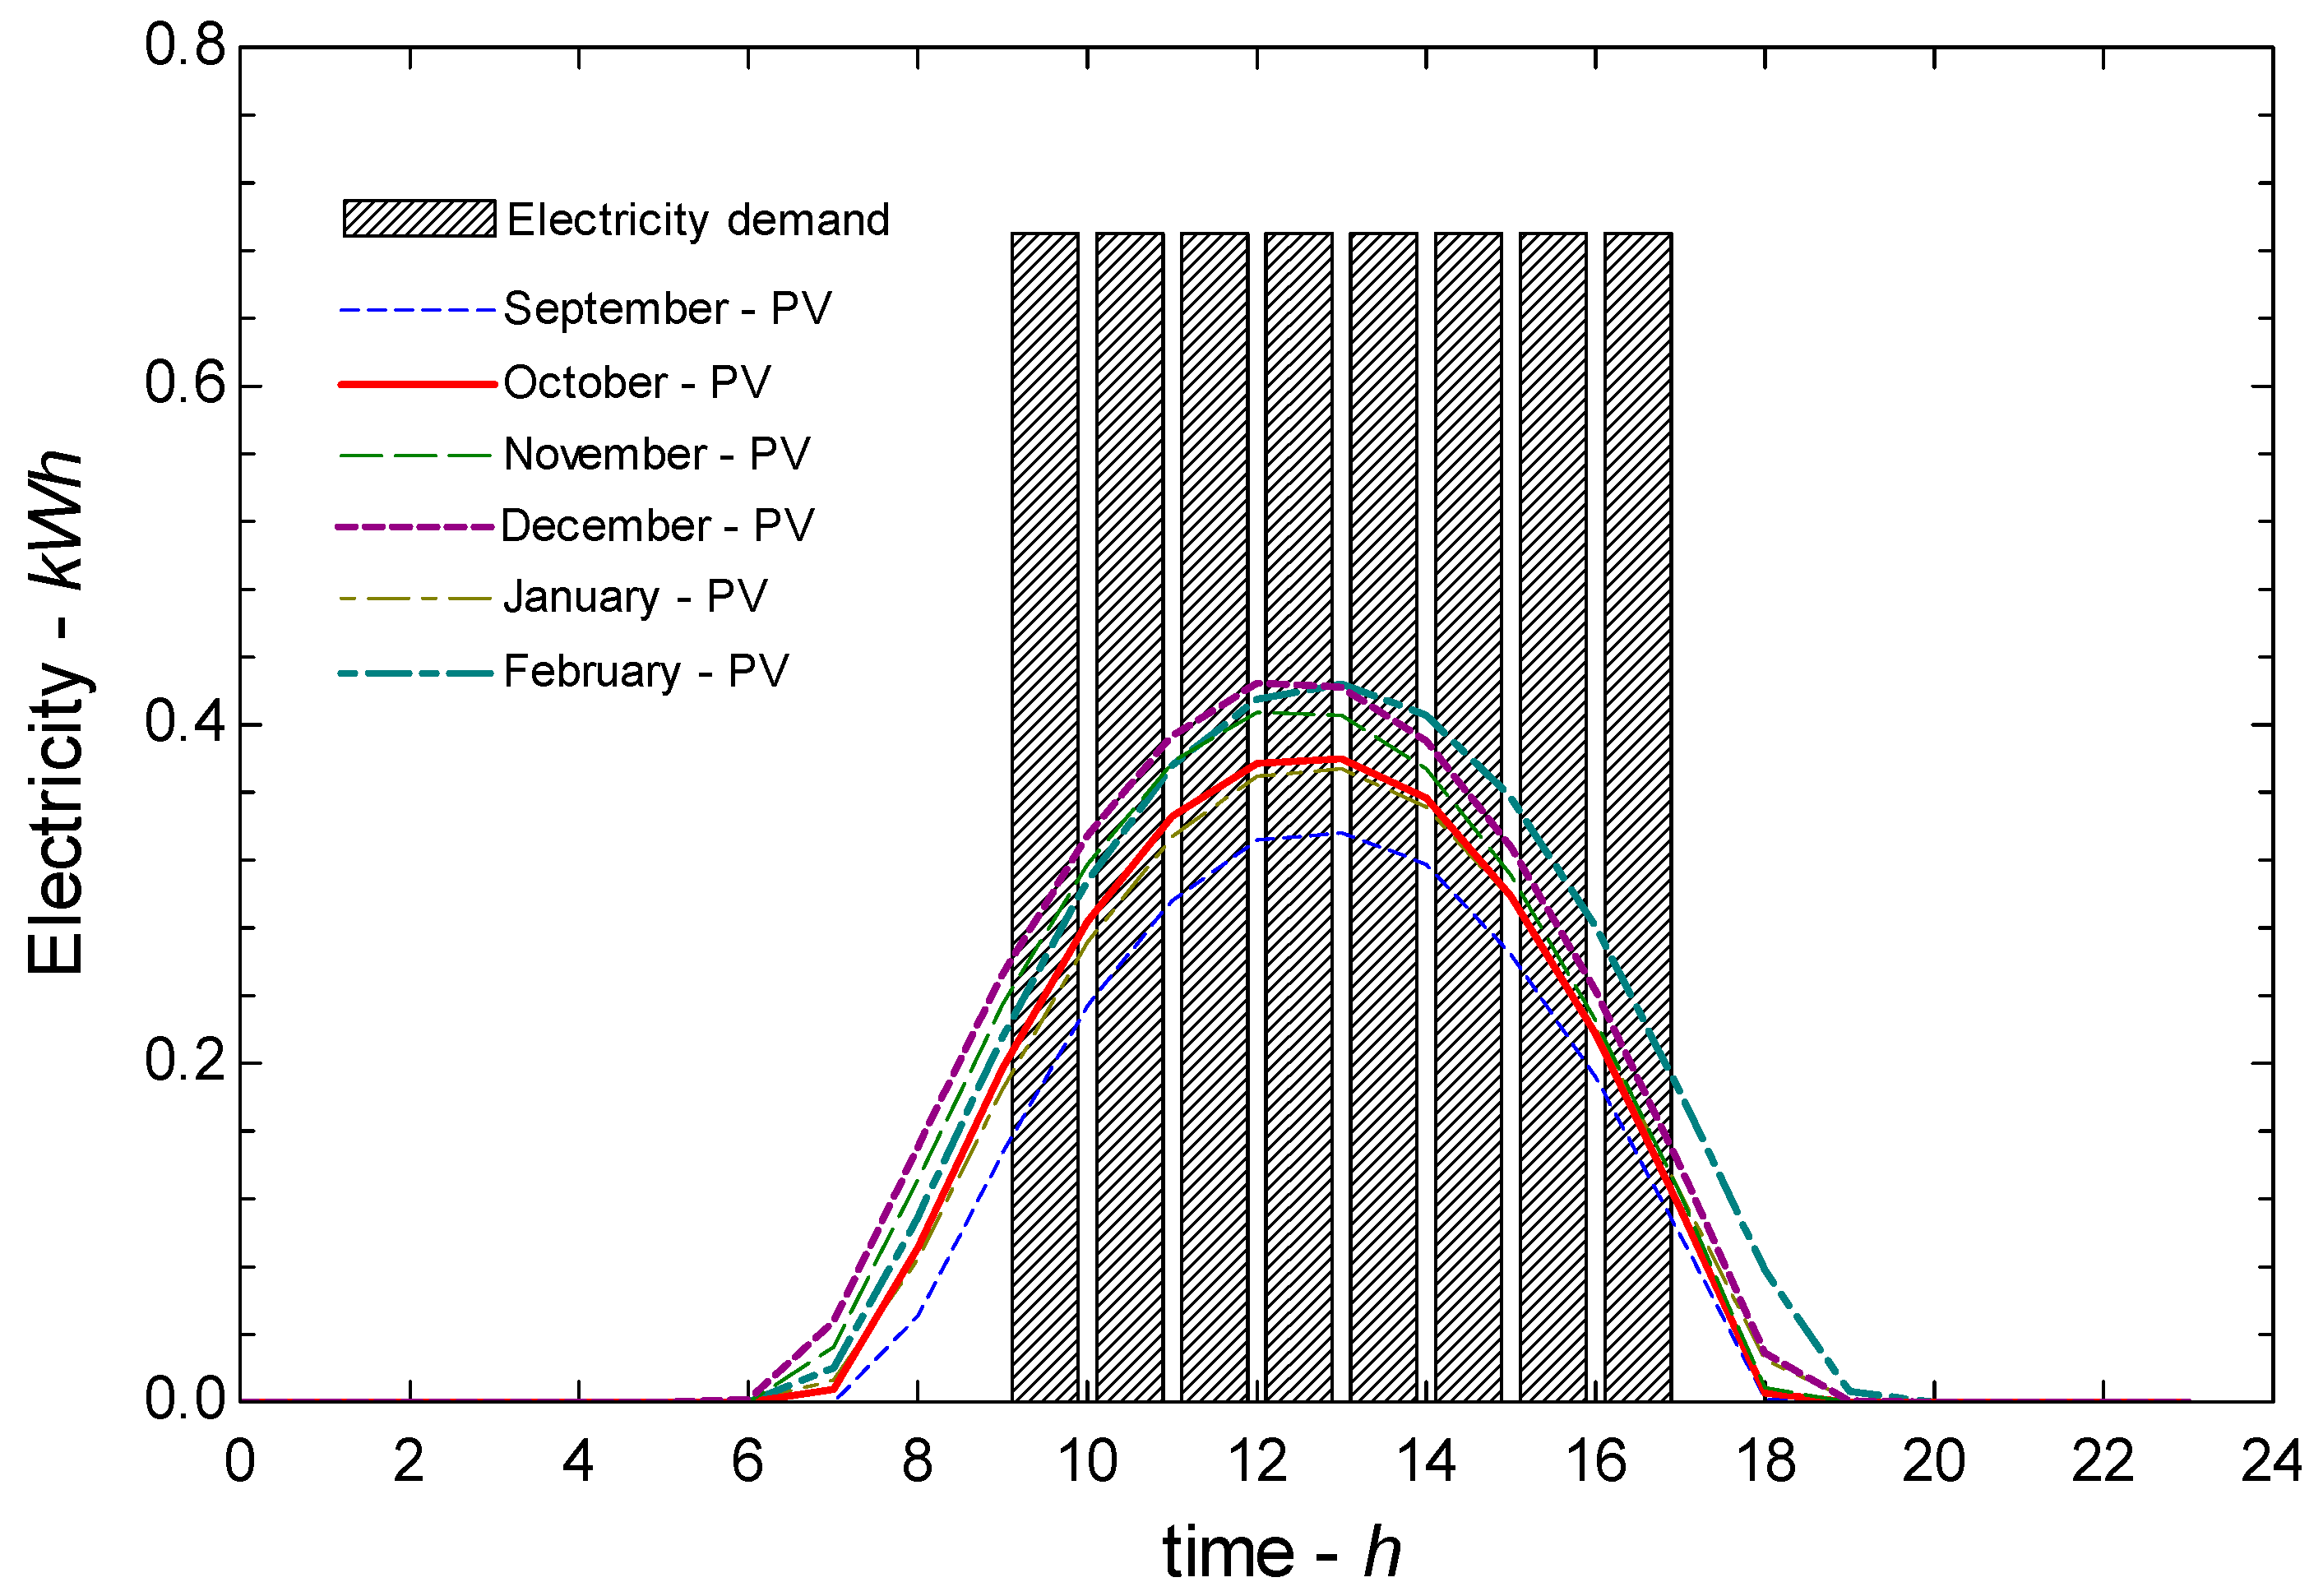
Figure 3 presents the daily energy performance of the off-grid PV system installed in EU 2. The lines show the electricity generated by the PV system during an average day across a time period of September to February. The dashed bars represent the electricity demand of the irrigation system on a day when the crops were irrigated. The PV system was able to supply in excess of the electricity demanded by the irrigation system. The excess electricity generation was dissipated, and lost without generating any useful work. Moreover, when considering that irrigation did not occur daily, and was also a seasonal activity (seven months), the excess dissipated electricity was greater than that observed in
Figure 3.
3.3.2. On-Grid PV System
Chile has an electrical grid covering 99% of the population; consequently, most farms have access to electricity for housing and harvest purposes. Therefore, on-grid systems were included in the analysis. For the on-grid system, a Chilean regulation (Ley 20.571) incorporated a net billing model which allows the reception of a payment if some excess electricity is generated in a PV system, and is injected back into the electrical grid. Chilean law permits the injection of any excess electricity produced by connections below 100 kW. The price charged by the electric company for electricity purchased from the electrical grid ranges between $221 and $276 per kilowatt-hour, and the price paid for electricity injected back into the electrical grid is $118 per kilowatt-hour. The Chilean electrical grid has high penetration, allowing wide access.
The on-grid PV system was sized so as to supply the required energy on an annual basis, using the electrical grid either as a source to complement the PV system or as a drain for the excess electrical energy generated by the PV system. EU 1 (table grapes) and EU 3 (strawberries) were selected for the implementation of an on-grid system to drive their irrigation systems. The annual electricity demand (
EA) was 560 kWh/year for EU 1, and 2134 kWh/year for EU 3. The daily energetic performance of EU 1 is displayed in
Figure 4 for the irrigation season (September–February). The annual electricity demand was 560 kWh/year, and the irrigation system operated between 9:00 a.m. and 05:00 p.m. The annual electricity (
E1kW,PV) produced by a PV system with a nominal electrical power of 1 kW was 1875 kWh/year; consequently, the required
WPV was 0.36 kW
p, and was supplied with two PV modules, resulting in an installed PV system with a power of 0.46 kW
p (see
Table 6). When the irrigation system was in operation, the electricity demand was greater than the electricity generated by the PV system. The electricity demand is shown in
Figure 4 as dashed bars, and the lines show the electricity generated by the PV system on an average day across a time period of September to February. The days without irrigation helped compensate for the electricity production, resulting in a net annual energy cost equal to zero.
3.3.3. Effects of Installation of PV System on Irrigation Systems
Table 6 shows the characteristics of the four studied EUs. EUs 1 and 3 were selected for the implementation of an on-grid PV system to drive their irrigation systems. The annual electricity demands were 560 kWh/year and 2134 kWh/year for EUs 1 and 3, respectively. The PV system sizes for each EU were 0.46 kW
p (EU 1, two PV modules), and 1.84 kW
p (EU 3, eight PV modules). The off-grid PV systems were tested for EUs 2 and 4. The PV systems were sized using the daily electricity demands, which were 4.8 kWh/day and 2.0 kWh/day for EUs 2 and 4, respectively. The EU 2 PV system was sized with nine PV modules, for a total power of 2.07 kW
p, and the EU 4 PV system was formed by four PV modules delivering 0.92 kW
p.
Table 7 shows the economical assessment of each EU following the incorporation of energy-efficient actions (Year 1), and after installing the PV systems (Year 2). The electricity usage and cost are shown for Years 1 and 2. The PV system design allowed a reduction in energy cost to zero in Year 2 for both off-grid and on-grid PV systems. Additionally, the savings, required investment, and the paybacks related to the installation of the PV systems are shown.
For the table-grape farmers in northern Chile, if 100% of the electrical demand was covered by the PV system, the installed power of the PV system would be 4.5 times greater in the off-grid system than in the on-grid system. The smaller system (on-grid) costs six times less than the off-grid system. The payback was achieved in 12 years for the on-grid system, and in 57 years for the off-grid system. Similar results were obtained in southern Chile for the strawberry farmers. The on-grid PV system was installed in a farm with a surface area 8.3 times greater than that where the off-grid PV system was installed; however, the PV system was twice as large.
As shown in
Table 7, the on-grid system is the ideal choice if the electrical grid is nearby. This PV system was designed to cover 100% of the annual electrical cost. This design criterion avoided oversizing the PV system, and reduced unnecessary investment (the capital cost) unlike the off-grid systems; consequently, payback periods for on-grid systems were considerably lower than those for off-grid systems. Optimal operation was achievable in hours of increased solar radiation, resulting in an increase in electricity generated by the PV system, and a minimization of excess electricity generation. This was applicable to both off-grid and on-grid PV systems. Electricity self-consumption is recommendable, considering the difference in purchasing and selling electricity; therefore, the payback period tended to be shortened upon increased electricity self-consumption. The net billing regulation in Chile encourages the self-consumption of electricity; consequently, the payback period of the project may be shortened.
A PV system capable of lasting more than 25 years requires substantial investment; however, the business model demonstrated high profit when the irrigation PV system had a long-term life cycle. The project lifetime is 25 years, which is like other studies [
40,
41]. Consequently, the feasibility of the system needs to be guaranteed. A well-designed drip irrigation system may reduce the required energy to approximately 60% of that required by other conventional methods; therefore, the PV system in this case would be smaller and cost less. Additionally, a PV system for small applications does not require the use of trackers as suggested in Reference [
40]. With a two-axis tracker, a PV system may produce up to 40% more energy than without one. Furthermore, more space is required (around 2.5 times more), the tracker needs special maintenance, and the failure rate potentially increases. The base needs to be metallic, galvanized steel, to last 25 years exposed to ambient conditions. The use of batteries is not recommended as their life cycle is limited to four or five years. Also, long-term periods without use due to seasonal irrigating results in a reduction in the life cycle of batteries. In addition, batteries increase the capital and operational cost, and the final disposal of batteries may produce high environmental impact [
11,
42]. In Chile, battery disposal is voluntary, but there is not much recycling infrastructure [
6]; however, in other similar countries as Peru and Ecuador, some References [
43,
44] have reported that batteries have been found abandoned and buried in rural areas. The PV system should instead supply electricity directly into the pumping system.
4. Discussion and Conclusions
Four cases were studied. Two farms producing table grapes were tested in the northern zone (Atacama Region), and two farms producing strawberries were analyzed in the southern zone (Maule Region). In each zone, both an off-grid and an on-grid system were evaluated. Firstly, the water demand of the irrigation systems and their corresponding pressure head were determined. The electricity demand for the irrigation systems was then calculated. Finally, an optimal PV system was designed for each irrigation system. The off-grid system was designed to cover the maximum electricity demand; consequently, the system was oversized for the remainder of the year. The on-grid system was designed to have a net annual operational cost equal to zero, and as such, an economical assessment was performed for the first two years. In the first year, the effects of energy-efficient actions on the irrigation system were evaluated, and the payback periods for these actions were found to be approximately two years. In the second year, the implementation of a PV system in each demonstrative unit was evaluated. The payback periods for on-grid PV systems (around 12 years) were considerably lower than those for off-grid PV systems (more than 30 years).
As shown in
Table 7, the off-grid PV system requires a long payback period (more than 30 years); however, this may be feasible if promoted by a government program as suggested in Reference [
17]. The feasibility is a key factor because of high investment. In Chile, although technical standards for rural electrification are defined [
6], they are not mandatory; consequently, government programs need to include cooperation, transferring know-how, and training. Also, implementation of an off-grid PV system may be beneficial to promote local economic development when the electrical grid is not an alternative.
Some recommendations may be obtained from the presented analysis for application to the installation of other PV systems in existing irrigation systems. Firstly, it is recommended to start by improving the existing irrigation system. After applying energy-efficient actions for the irrigation system, a PV system should be designed to supply electricity to an optimized irrigation system. Consequently, oversizing a PV system is avoided, and the investment (capital cost) is reduced, as well as the payback period of the project. Although the payback period appears lengthy (around 12 years), it is recommended to install on-grid PV systems when considering a life cycle of 25 years. Neither off-grid PV systems nor on-grid PV systems are recommended for operation with batteries and tracking systems (whether one- or two-axis). The business model shows good profit when evaluated over a 25-year period; therefore, a PV system capable of lasting over 25 years should be designed, while paying attention to design aspects so as to guarantee the feasibility of the system. Self-consumption of electricity is also suggested due to the existence of the net billing regulation in Chile. From a practical point of view, the purchase cost of electricity is greater, under the net billing regulation, than the selling of excess electricity generated by the PV system back to the electrical grid.

 ,
, 


