1. Introduction
The internal-gap lightning protection device (ILPD) and outer-gap structure lightning protection device (OLPD) are two different types of lightning protection device. When the lightning striking distribution line does not have a lightning protection device, power outages occur easily, which may lead to arc burn of the insulator surface and wire breaking [
1,
2]. Surge arresters with series gap are being wildly applied to protect insulation to prevent flashovers and circuit interruptions, especially for covered distribution lines [
1]. To decrease the difficulty of transmission line reconstruction and prevent the need for insulation coordination with the insulator, an anti-lightning composite insulator that combines the arrester and insulator was developed to be applied to distribution lines [
3]. Most of the above reconstruction methods use an outer-gap structure lightning protection device (OLPD). Compared with no-gap structure protection devices, the outer-gap lightning protection device can prevent the varistor from aging and reduce the leakage current and residual voltage, so these devices are being widely used in power systems. However, the structure of the outer-gap is easily affected by the external environment [
4]. Under harsh environments such as rainstorms, the discharge gap is prone to bridging by rain, leading to malfunction of lightning protection device.
In early 2008 in Central Southern China, an ice storm caused more than 120,000 power line towers to collapse, more than 7000 electrical lines fell, and 859 substations shut down according to the statistic provided by the South Power Grid Corp of China. Iced-covered insulator flashover was one of the main reasons for the power outages [
5]. During icing, the outer-gap lightning protection device becomes prone to icing bridge, so the outer insulation of the anti-ice design is a critical aspect of the outer-gap structure.
Additionally, overvoltage is common in distribution lines. Sudden changes in an electric network cause transient phenomena to occur. These transient events result in the creation of an overvoltage or of a high-frequency periodic or oscillating wave train with rapid damping. These changes include breaking of small inductive currents, re-arcing, phase-to-earth faults, and so on. The ratio of the surge voltage to the rated voltage may reach four under these situations [
6]. Metal oxide lightning protection devices are much more sensitive to overvoltage than insulators, so as the frequency energy continues to pour into the internal ZnO varistor, the aging of varistor accelerates.
The internal-gap was proposed to address the above problems, while maintaining the advantages of the outer-gap. The breakdown characteristics of the gap are not affected by external environmental factors. The internal-gap lightning protection device (ILPD) has been widely used in distribution systems in Japan [
7]. During the discharge process, the gas in the internal-gap is not connected with the outside air, leading to the difference in the impulse breakdown characteristics compared with the outer-gap. The impulse discharge characteristics of internal-gap have been investigated. Delliou et al. reported that the discharge homogenously propagated in the whole tube when the inner radius is below 300 μm, discharges propagated with a tubular shape when the inner radius was around 300 μm, and propagated as classical streamers for larger inner diameters. The distance between electrode and the dielectric and electrode spacing were critical parameters influencing the discharge characteristics [
8]. Pai et al. studied the transitions between corona, glow, and spark regimes of nanosecond repetitively pulsed discharges at atmospheric pressure in air preheated from 300 K to 1000 K. The research indicated that a glow-like regime exists when the atmospheric-pressure air was preheated to relatively high temperatures [
9,
10]. Srivastava and Zhou analyzed surface charge accumulation under impulse voltage. This research explained why some insulators that can be charged by direct current (DC) voltage cannot be charged by impulse voltage, no matter how high the amplitude of the voltage [
11]. Bouazia indicated that a high arc current will act on the surface material of the discharge tube. When the material absorbing the heat of the arc reaches a certain value, some of the bonds in the macromolecular chain will be broken. If the temperature is too high, the material is directly vaporized to form a low molecular gas product, affecting the insulation properties of the surface material of the discharge tube [
12]. The above research methods are summarized in
Appendix A.
The study of the impulse discharge characteristics of the internal-gap are being focused on the discharge tube itself. Whereas the ILPD is a discharge tube in series with the ZnO varistor, the electric field distribution and the arc energy are quite different from the simple discharge tube due to the presence of the varistor. The discharge characteristics of the ILPD have been less studied. In this paper, a lightning impulse test platform is built to study the impulse discharge characteristics of the ILPD to examine its characteristics under multiple lightning strikes and the 50% lightning impulse discharge voltage of the ILPD. A finite element simulation model is set up to investigate the difference in the discharge characteristics of ILPD and OLPD. A high-speed camera is used to study the arc movement in the gap. A large current impulse test is performed to analyse the insulation properties of the surface material of the discharge tube under high arc current. Based on the experimental research and simulation analysis, the theoretical basis for ILPD design is provided.
2. Experimental Platform and Sample
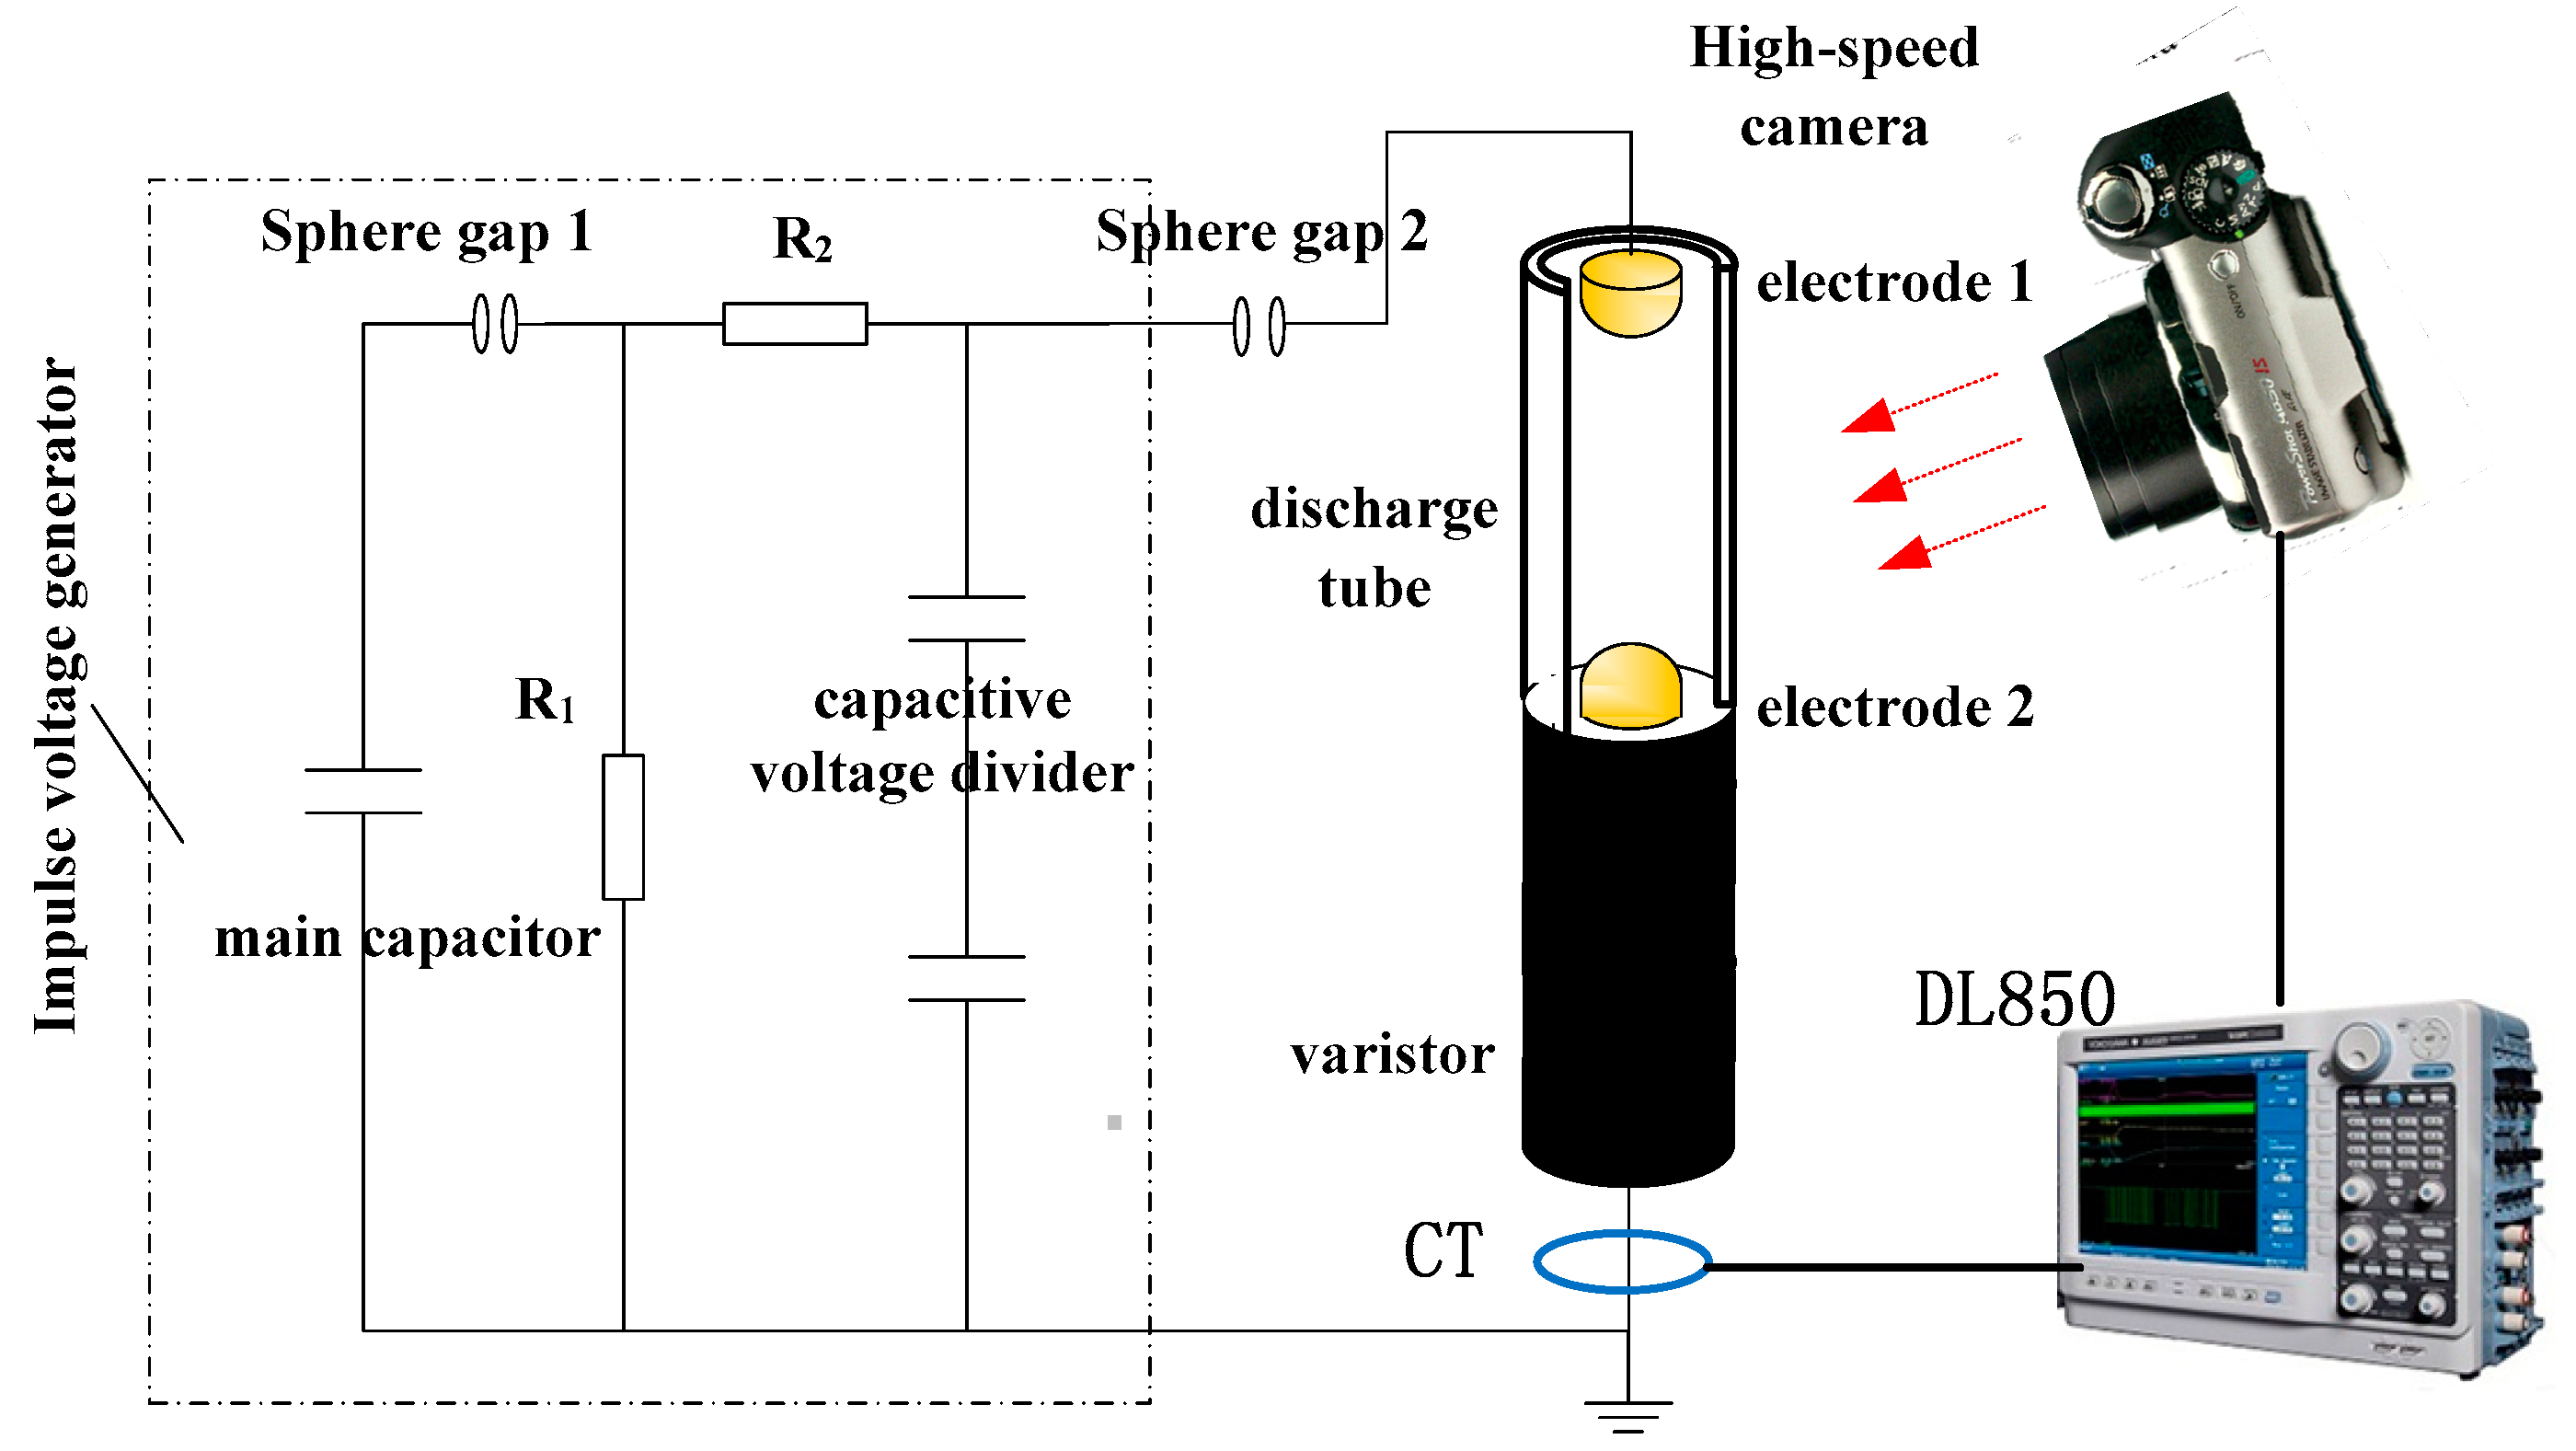
The ILPD needs to perform reliably under lightning strikes, so the discharge characteristics of the internal-gap under lightning strikes need to be studied. The experimental platform for lightning impulse voltage is shown in
Figure 1. The test power was the impulse voltage generator, with a rated voltage of 400 kV. The main capacitor was charged to the set voltage. Then the circuit was automatically triggered by the spark gap to form a positive polarity lightning discharge voltage of 1.2/50 μs. The environment temperature and humidity were 23.5 °C and 53%, respectively.
The up-and-down test method was used in the experiment [
13]. The time interval between the two impulses was a charging time of 70 s. The next test value was determined by the last test phenomenon. If the last test resulted in withstand, the next voltage was increased by 5%. Otherwise, the next test voltage value was decreased by 5%. When the two last test phenomena were different (from withstand to flashover or vice versa), the following tests were defined as useful tests. The 50% lightning breakdown voltage (
V50) is the average value of the useful tests.
where
Ui is the voltage value of the useful test and
N is the total number of useful tests. For each gap distance, 30 useful tests were carried out. In the tests, a high-speed camera (Photron Fastcam SA-5 (Photron, Tokyo, Japan)) was used to record arc discharge in the discharge tube. The time interval between two frames was 6.6 μs and the exposure time of each photo was 0.369 μs. Discharge current waveforms were acquired with a Pearson 4418 (Pearson Electronics, Palo Alto, CA, USA) and Yokogawa DL850E oscilloscope (Yokogawa Electric Corporation, Tokyo, Japan), which also functioned as the trigger signal for the high-speed camera.
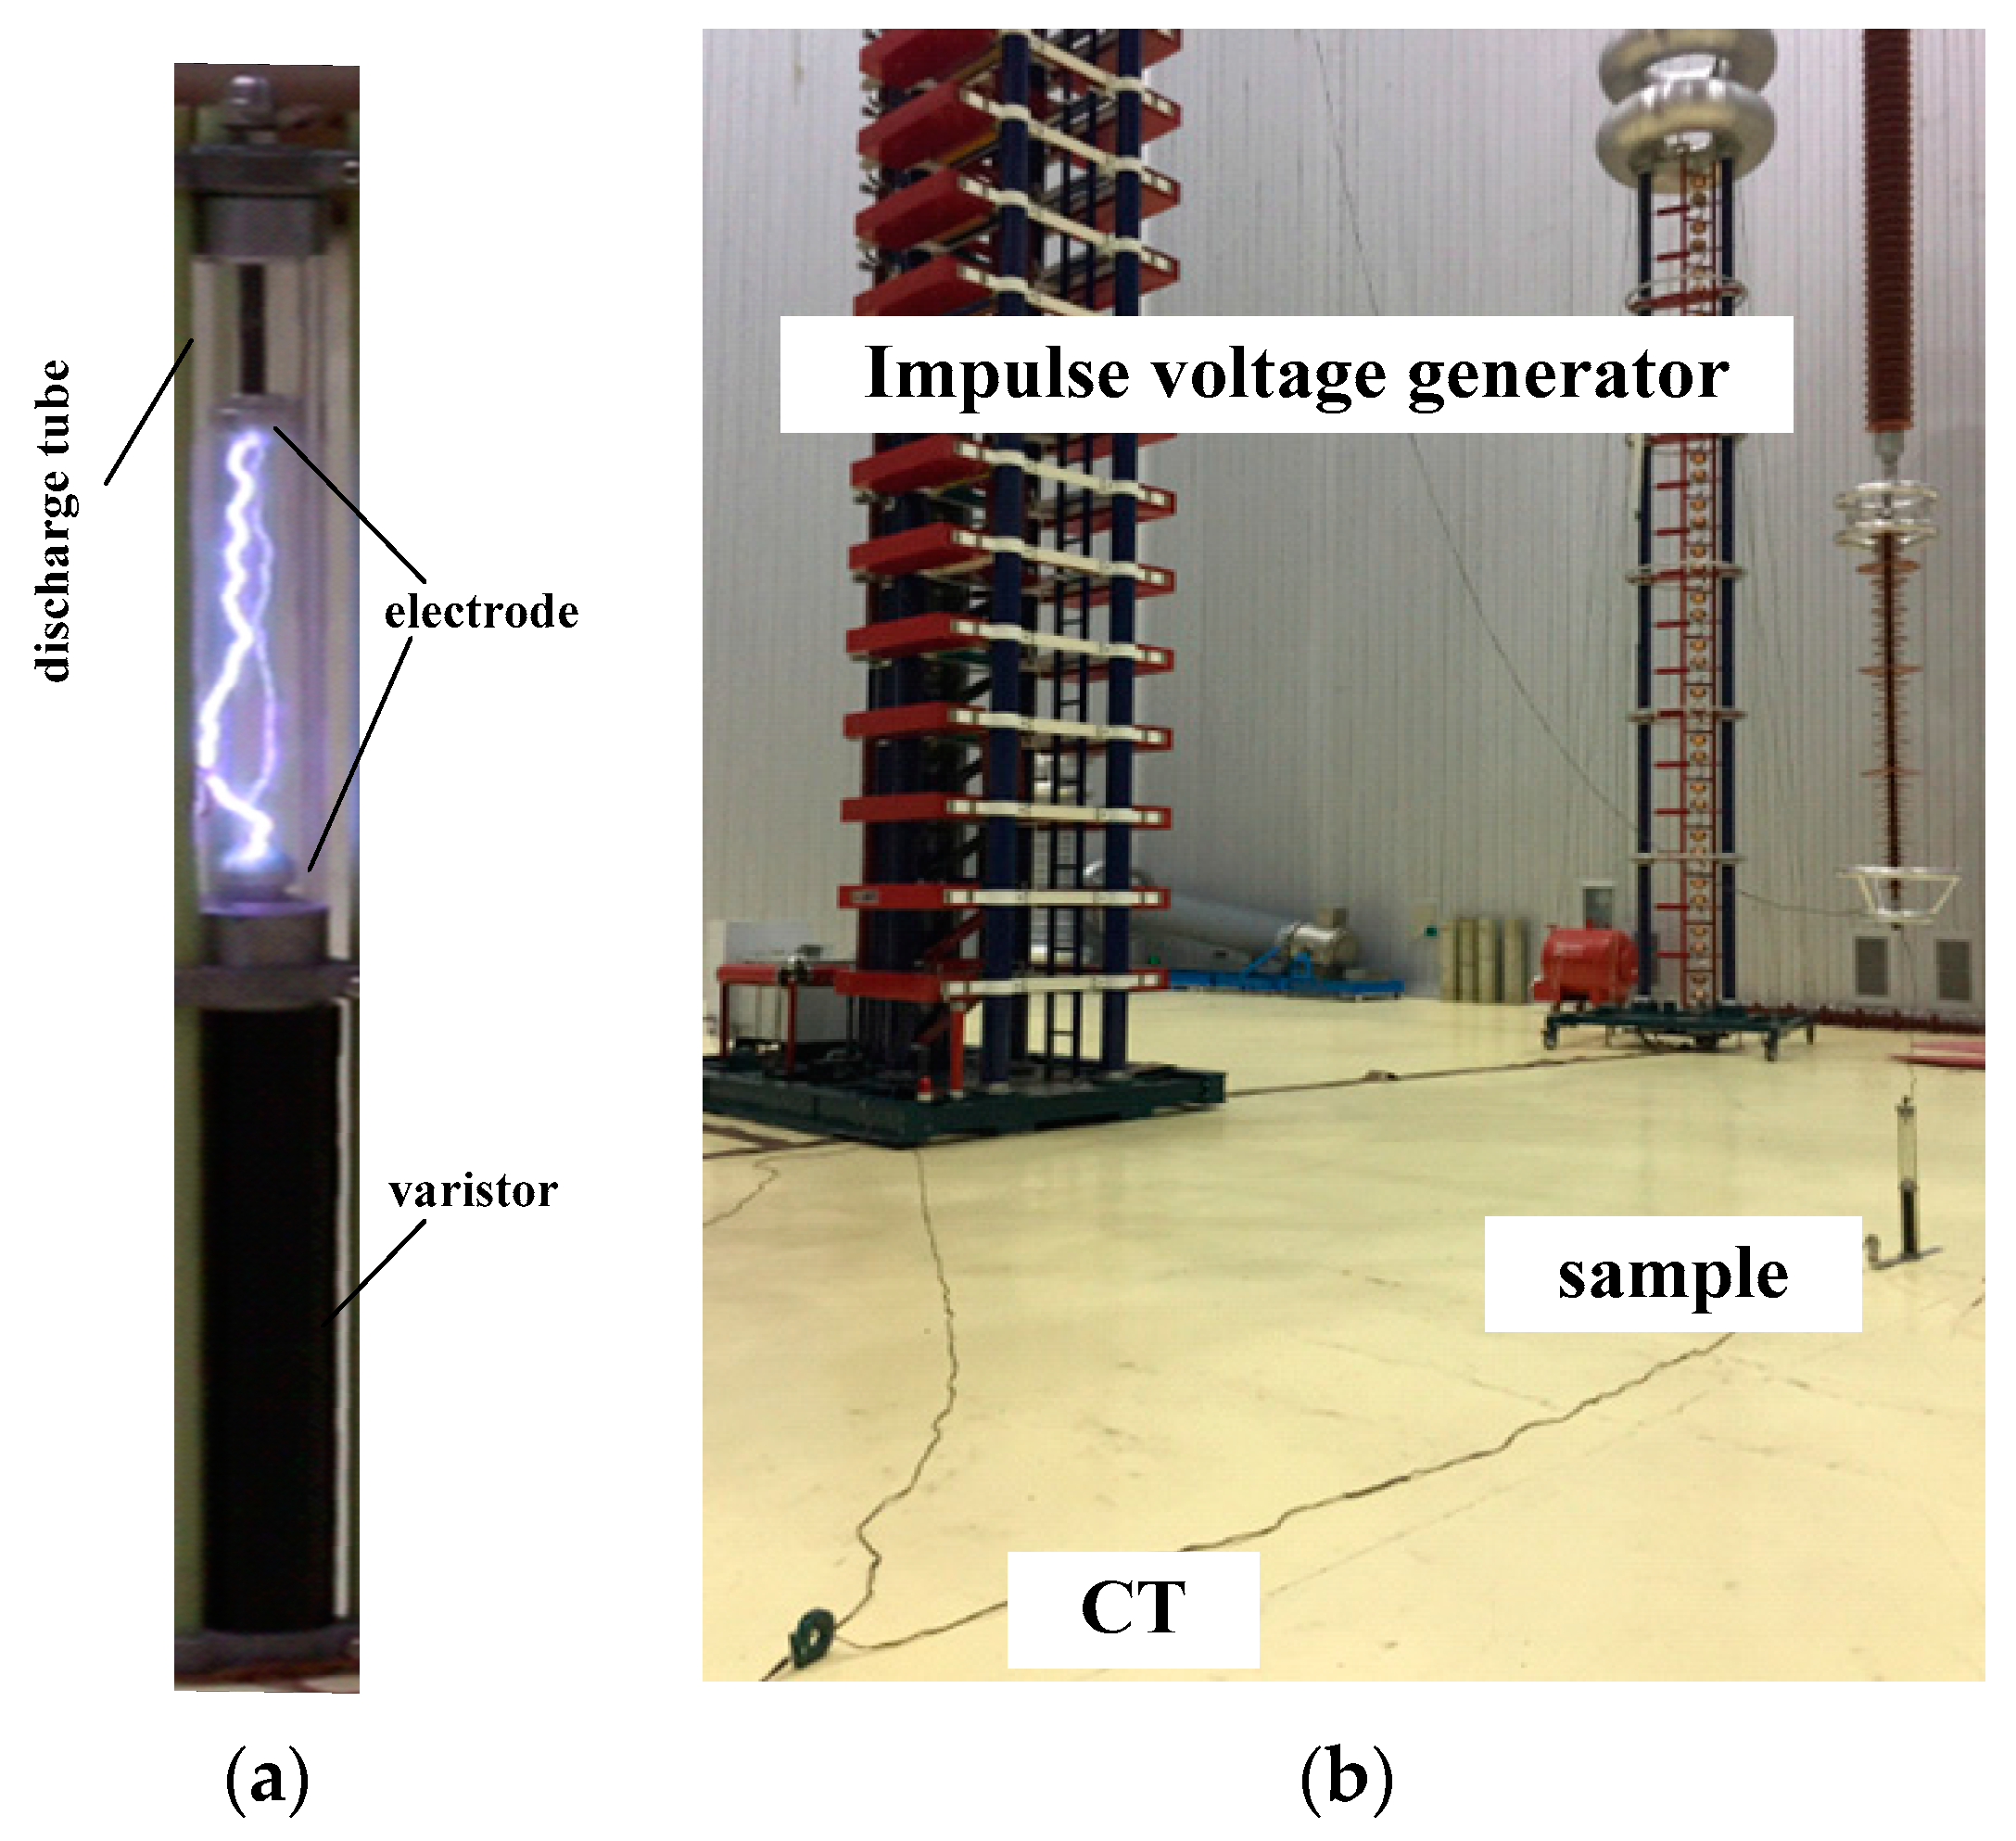
The ILPD sample of the lightning impulse experiment is shown as
Figure 2. The OLPD sample was the ILPD sample without the discharge tube. The discharge tube was made of epoxy material (CY 1300, density 1.16 g/cm
3), widely used in lightning protection devices [
7] with a relative permittivity of 3.5. The inner and outer diameters of the discharge tube were 50 and 60 mm, respectively. Epoxy material was replaced by transparent glass to enable the observation of the arc operation of the ILPD. The discharge electrodes were hemispherical electrodes, as shown in
Figure 2. The reference voltage of the varistor was 66 kV, meeting the standard requirements for 35 kV lightning protection device [
14]. The 50% lightning discharge voltage was experimentally analysed under gap distances ranging from 180 to 240 mm.
4. Theoretical Analysis
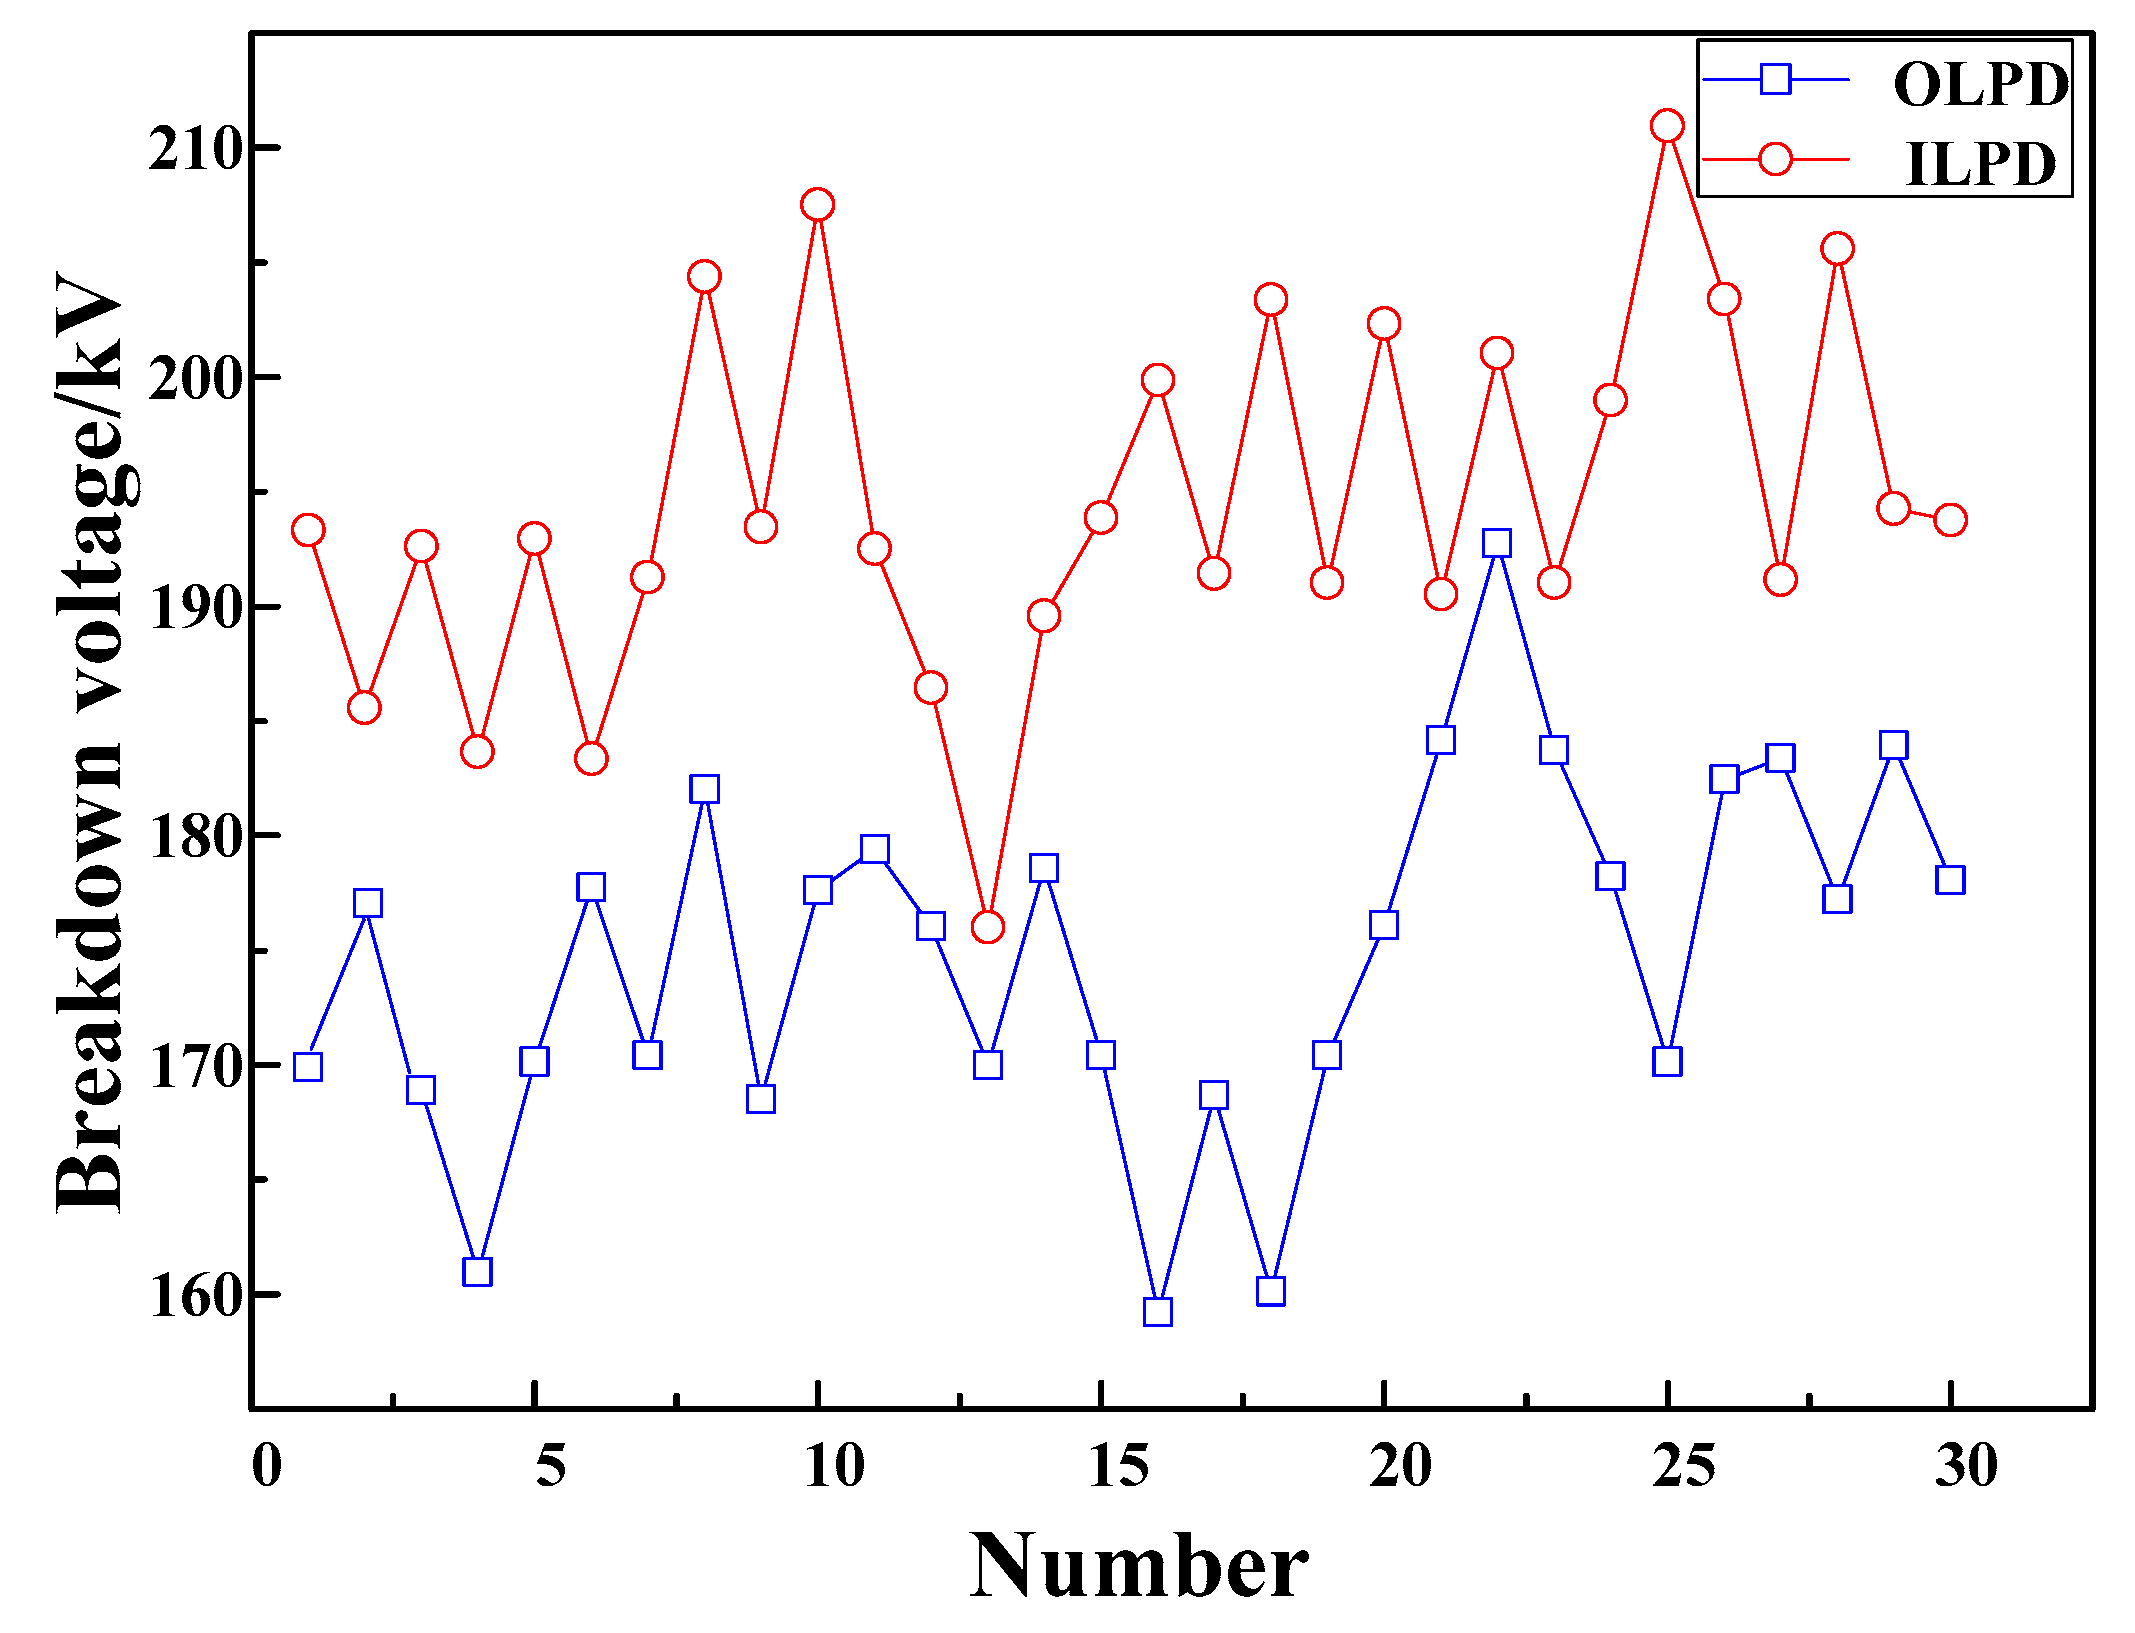
Experimental results showed that the ILPD discharge stability is good. Under positive lightning impulses, the breakdown voltage of the ILPD was 3.8–11.4% higher than that of the OLPD. The electric field distribution had an important influence on the development of the streamer development. When the discharge tube was present, the electric field distribution of the gap changed. Appling finite element analysis, the electric field distribution of the gap was analysed. The dielectric physical parameters of the insulator are shown in
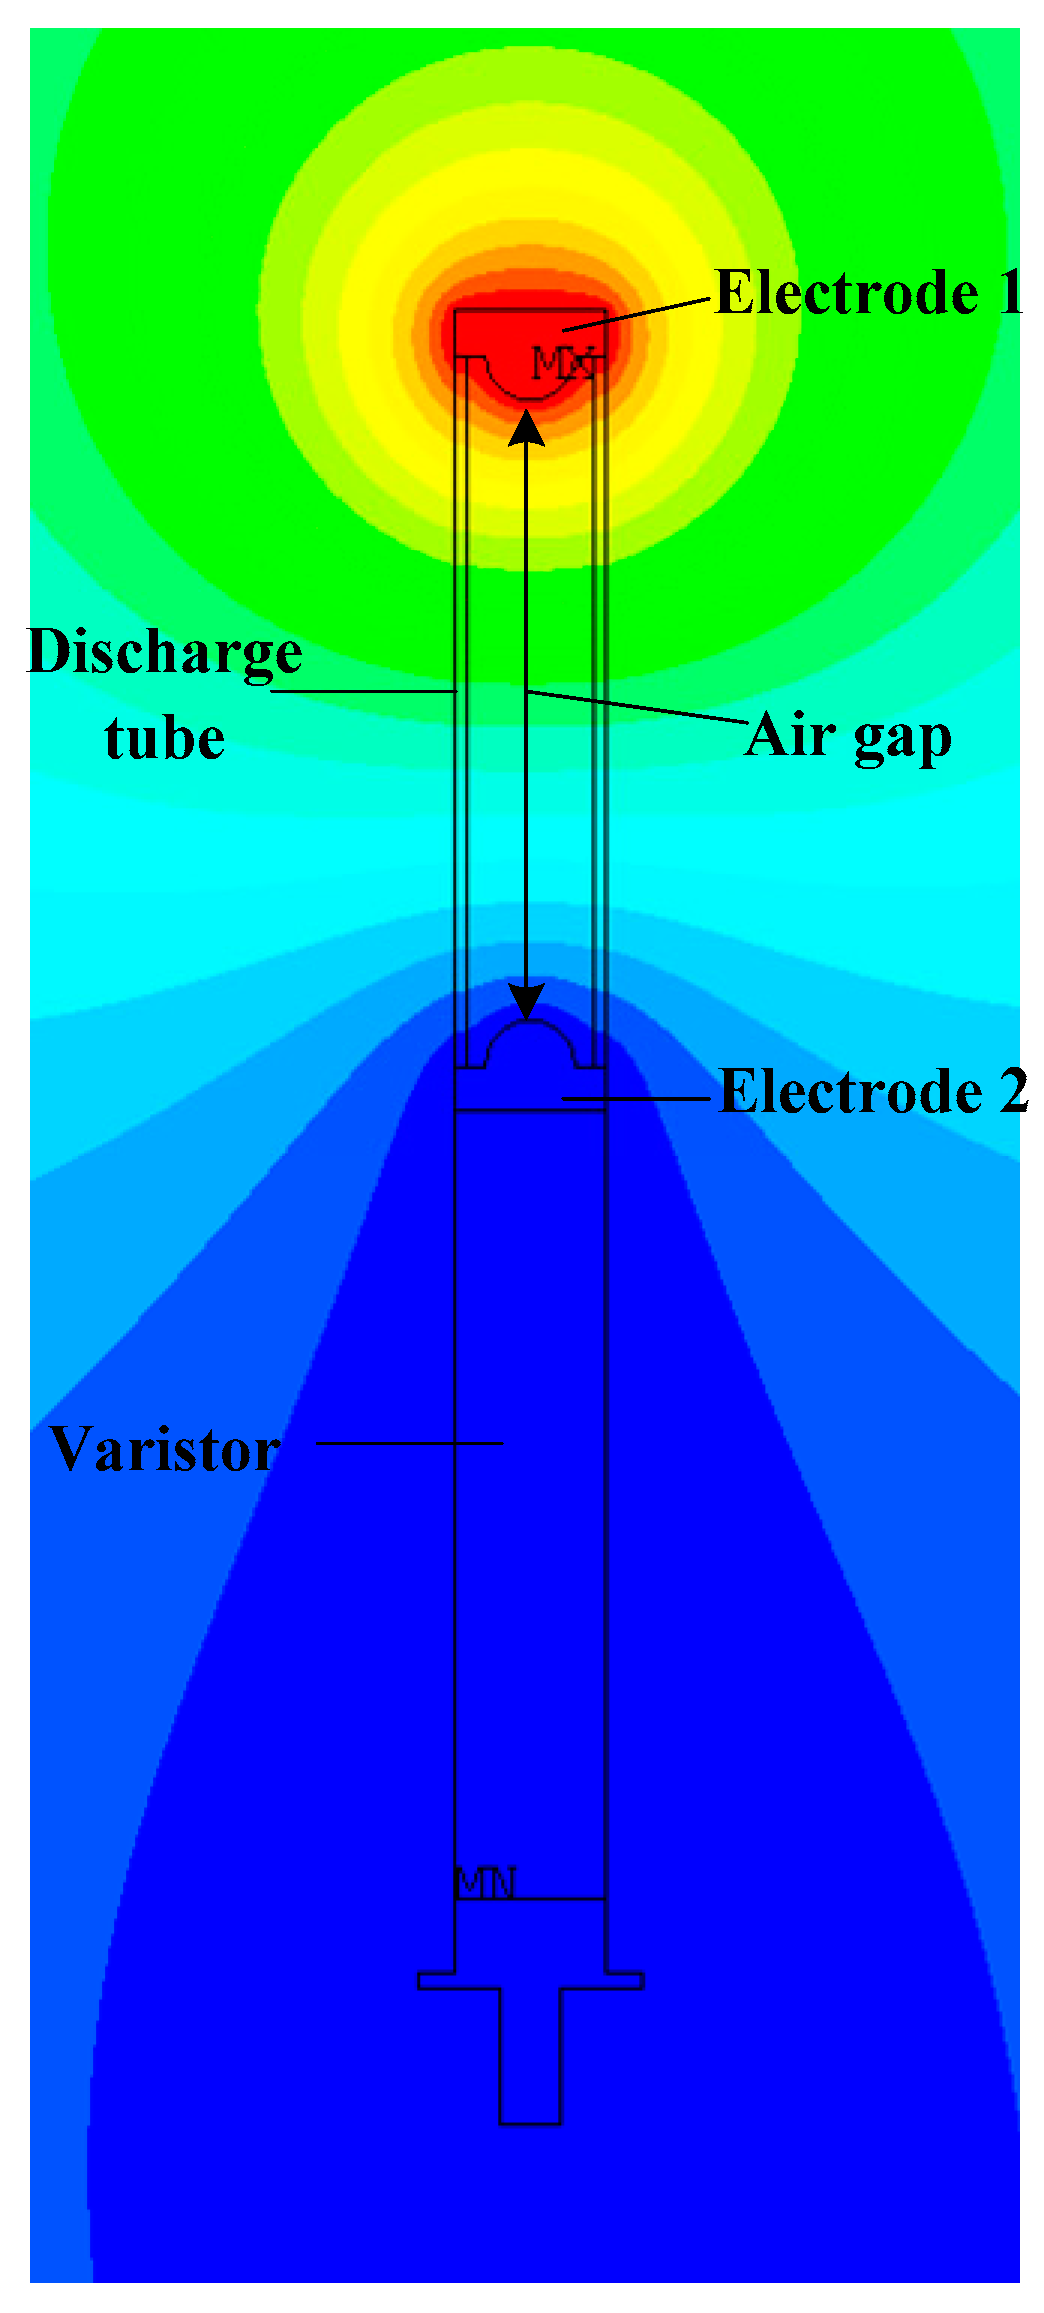
Table 2. Two assumptions were proposed here: (1) the applied voltage was 10 kV and (2) in the simulation, an artificial boundary was established so that the distance from the lightning protection device to the boundary was much greater than the length of the lightning protection device itself. The potential on the boundary was assumed to be zero. The simulation model is provided in
Figure 6 and the electric field distribution in the simulation is shown in
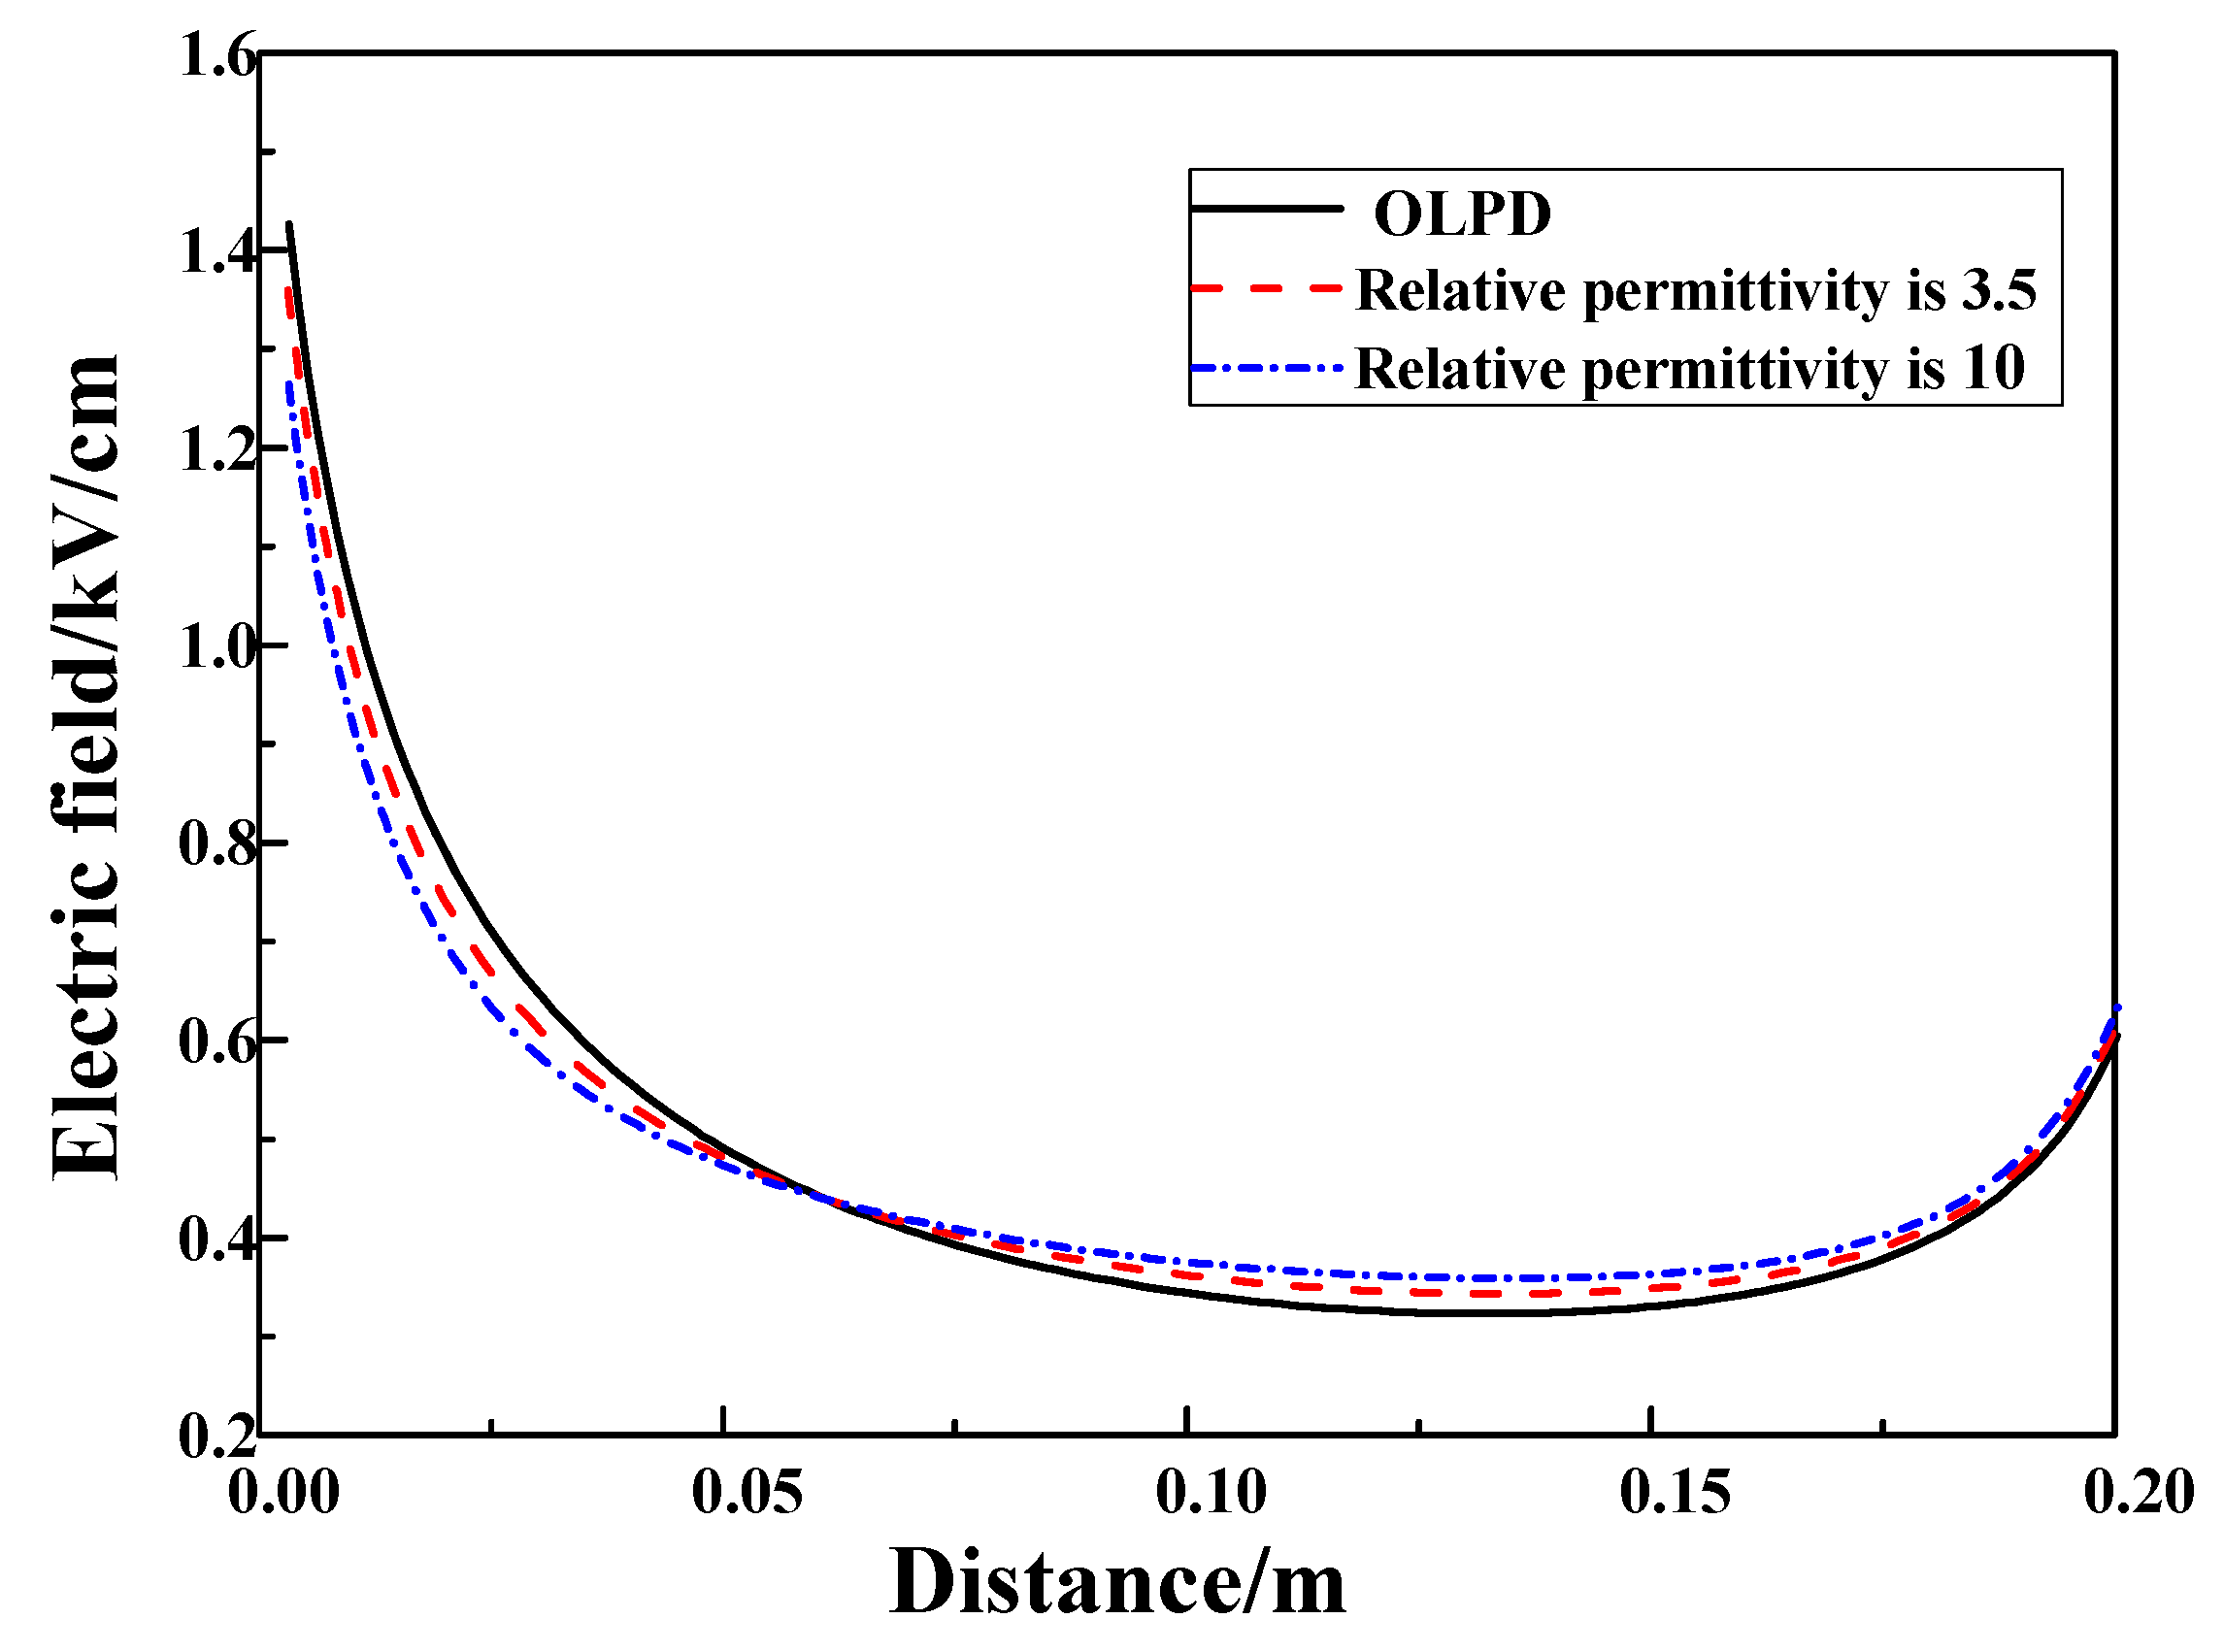
Figure 7.
The simulation results indicate that the maximum electric field strength of the ILPD is 4.68% lower than that of the OLPD and the maximum electric field strength decreases with increasing relative permittivity of the discharge tube. When the relative permittivity of the discharge tube increased from 3.5 to 10, the maximum electric field strength decreased from 136 kV/m to 126 kV/m and the deviation compared to the maximum electric field strength of the OLPD increased from 4.68% to 11.90%.
According to the streamer theory [
15,
16], the streamer starts at a position near the electrode where the ionization coefficient is equal to the adhesion coefficient under a positive DC voltage. In the development of an electron avalanche moving to the positive electrode, the charge of the head of the electron avalanche increases. When the total amount of charges in the head of the electron avalanche are greater than the critical charge number, the streamer starts. The critical charge number is generally considered to be 10
8. The beginning of the streamer needs to meet two conditions under positive polarity impulse voltage: (1) the applying voltage of the electrode or the electric field at the tip of the electrode must reach the minimum voltage
U0 or field strength
E0 required at the initial period of the streamer under the impulse of voltage, and (2) effective free electrons in the electrode head must be ensured. The simulation results show that the existence of a discharge tube reduces the maximum field strength of the gap. Therefore, applying a higher impulse voltage is necessary to reach the initial streamer voltage, leading to a higher breakdown voltage in the ILPD higher than in the OLPD, as shown in
Table 1.
In addition, when a positive polarity lightning current is applied to the ILPD, the surface of the discharge tube accumulates the charge, and the decay can last for hours [
11,
17]. Therefore, the discharge tube accumulates charge, affecting the breakdown characteristics of the gap. Wang inferred that micro-discharge or corona discharge is a prerequisite for charge accumulation. In the absence of micro-discharge or corona discharge conditions, the accumulated charge is small due to a simple gap or creeping breakdown flashover, leading to a dielectric surface voltage of less than 0.5 V [
18]. Lightning impulse voltage breakdown process is transient, no corona and micro-discharge phenomenon appearing. The influence of the charge accumulation of the discharge tube surface on the breakdown voltage can be neglected.
Therefore, the main reason for the difference in the 50% impulse breakdown voltage between ILPD and OLPD is the change in electric field distribution due to the presence of the discharge tube.
5. Discussion
A high-speed camera (Photron Fastcam SA-5) was used to record arc discharge in the discharge tube, as shown in
Figure 8. Experimental results show that the randomness of the discharge arc can cause the arc to move along the surface of the discharge tube. If the arc energy is large enough, the surface material is ablated, affecting the discharge tube insulation. If the insulation of the discharge tube is damaged, the power frequency voltage applied directly to the ZnO varistor accelerates the aging of the ZnO varistor, finally leading to the failure of the ILPD. However, the difference between the lightning impulse test energy and the actual lightning current energy is large, so that simulating the actual erosion condition of the lightning current along the surface under the above experimental analysis is impossible. In this paper, a large current impulse test platform was built for an arc erosion experiment.
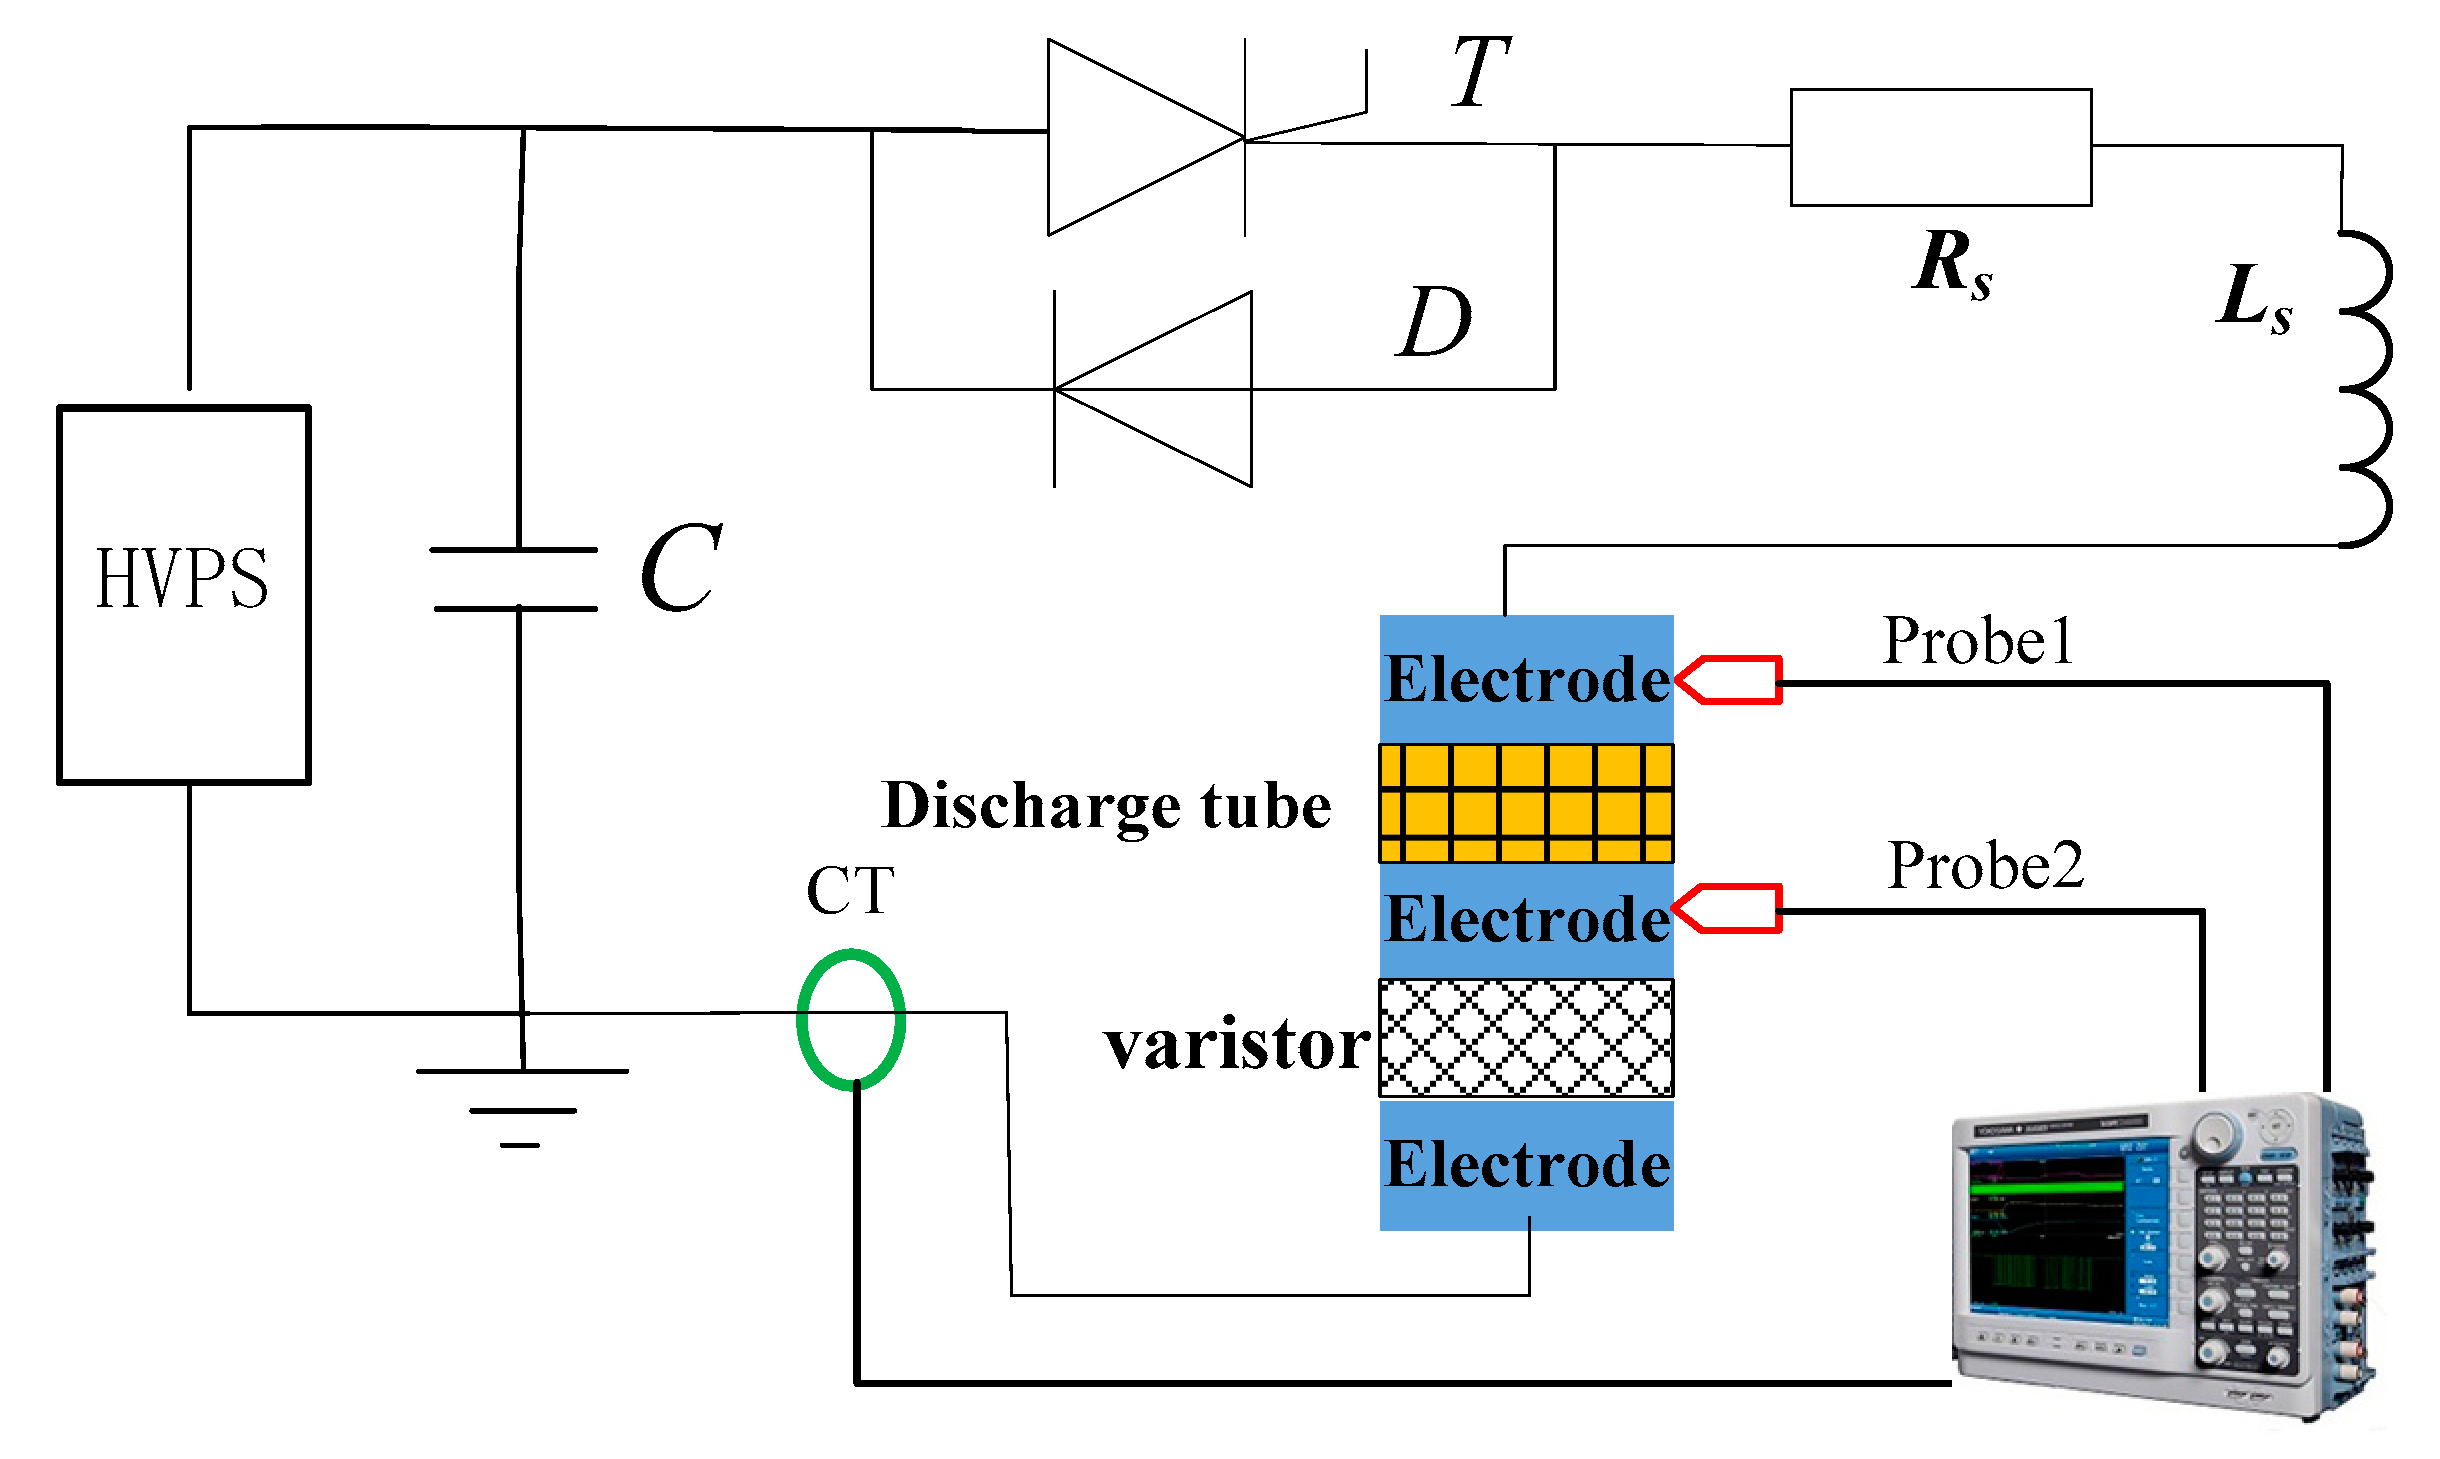
The high current impulse experimental circuit is shown in
Figure 9. In the figure,
C is the discharge capacitor,
T is the thyristor working as the discharge switch,
D paralleled with
T is an inverse diode, and
Ls and
Rs are the total inductance and resistance in the discharge circuit, respectively. When the capacitor was charged to a preset voltage
U0, the thyristor
T was triggered to conduct. Two high-voltage probes (Tektronix P6015 (Tektronix, Beaverton, OR, USA)) measured the voltage waveforms at the upper and lower electrodes of the discharge tube under high current impulse, with a probe ratio of 1000:1. The waveform of the current was measured using a Pearson 4418. The current and voltage parameters were recorded with a Yokogawa DL850E oscilloscope.
The simulated discharge tubes were the discharge tube shortened in length. The height of the simulated discharge tube was 10 mm for easy flashover under low voltage. The inner and outer diameters were the same as those in
Figure 2. The DC 1 mA voltage of the varistor was 4 kV, which was designed according to the compression ratio of the simulated discharge tube. In order to simulate the arc moving along the discharge tube surface, the electrode surface was parallel to the upper and lower surfaces of the discharge tube. The simulated discharge tube was subjected to an 8/20 μs impulse test, with a magnitude ranging from 5.64 kA to 25.94 kA. Ten simulated discharge tubes made of epoxy material were prepared for testing. Each simulated discharge tube was tested 10 times.
The surface leakage current of sample under DC or alternating current (AC) voltage and quality changes in the atmospheric environment are the main parameters for the arc erosion study of traditional insulation material [
19,
20]. A 0.1 mg resolution for the high-precision electronic scales was used for quality measurement. The DC leakage current was measured using a Keithley 6517B (Tektronix, Beaverton, OR, USA). The environment temperature and humidity were 26.5 °C and 63%, respectively.
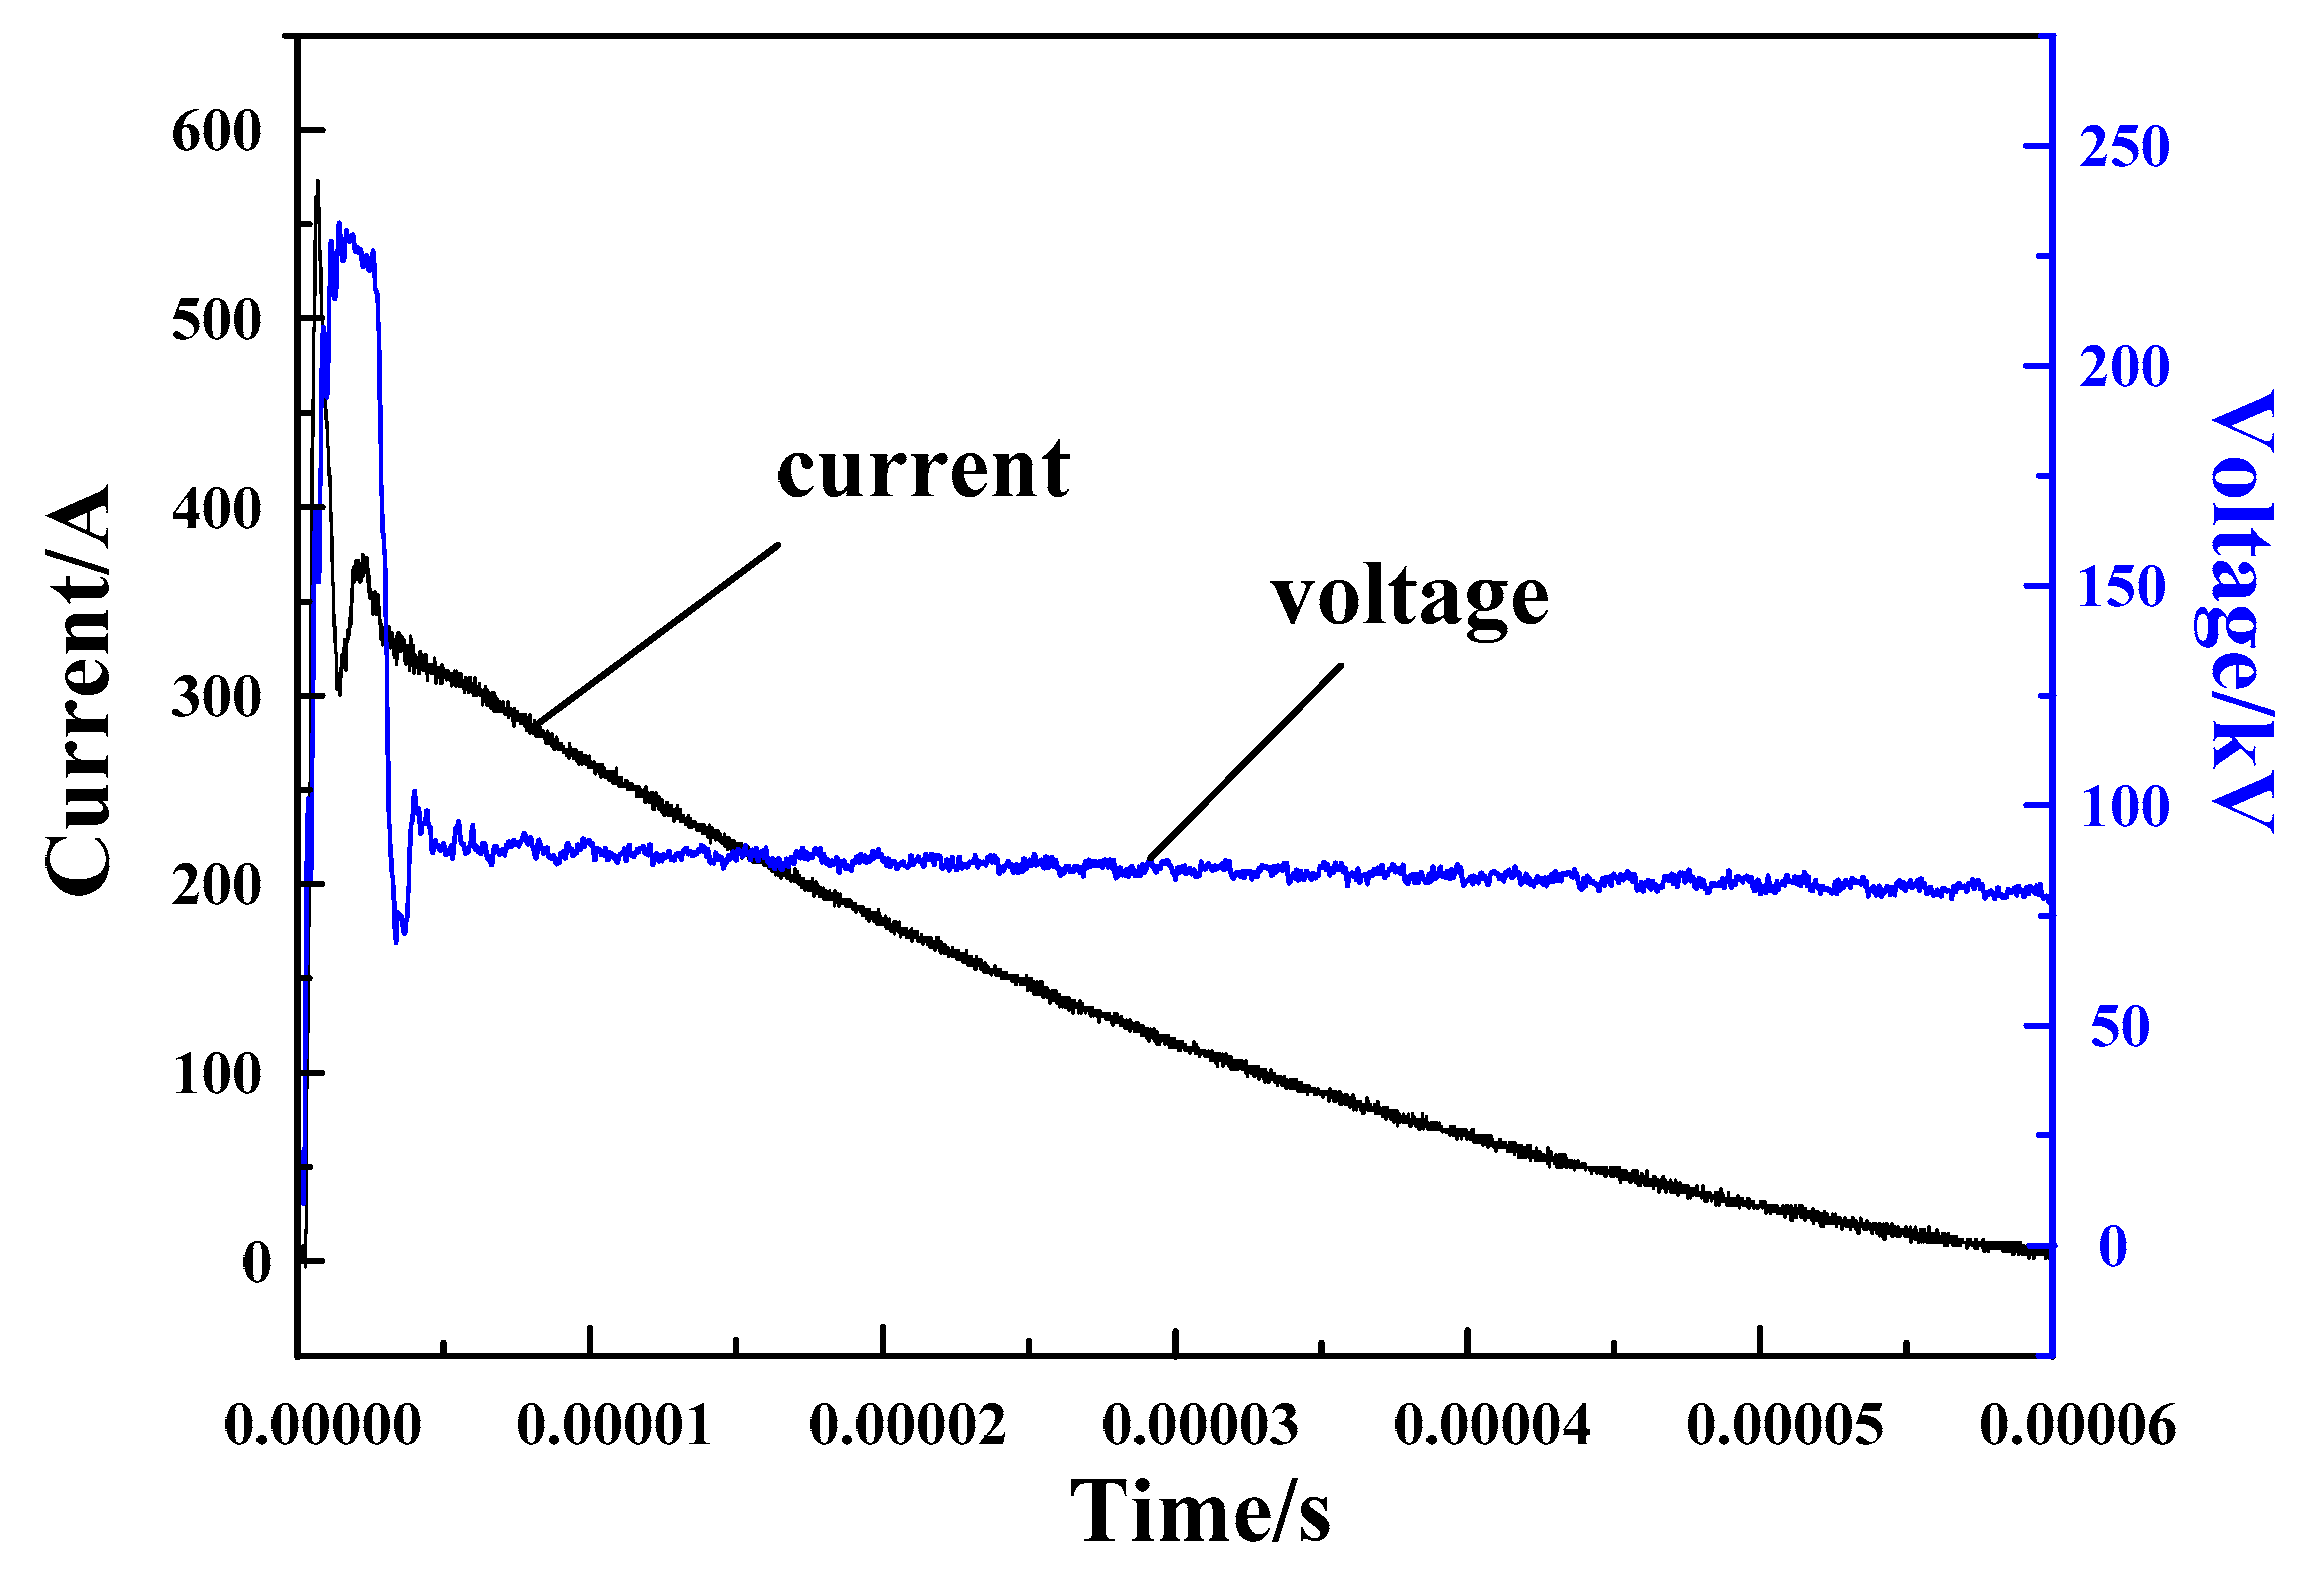
The typical voltage and current waveforms are shown in
Figure 10. The experimental results are shown in
Table 3, where
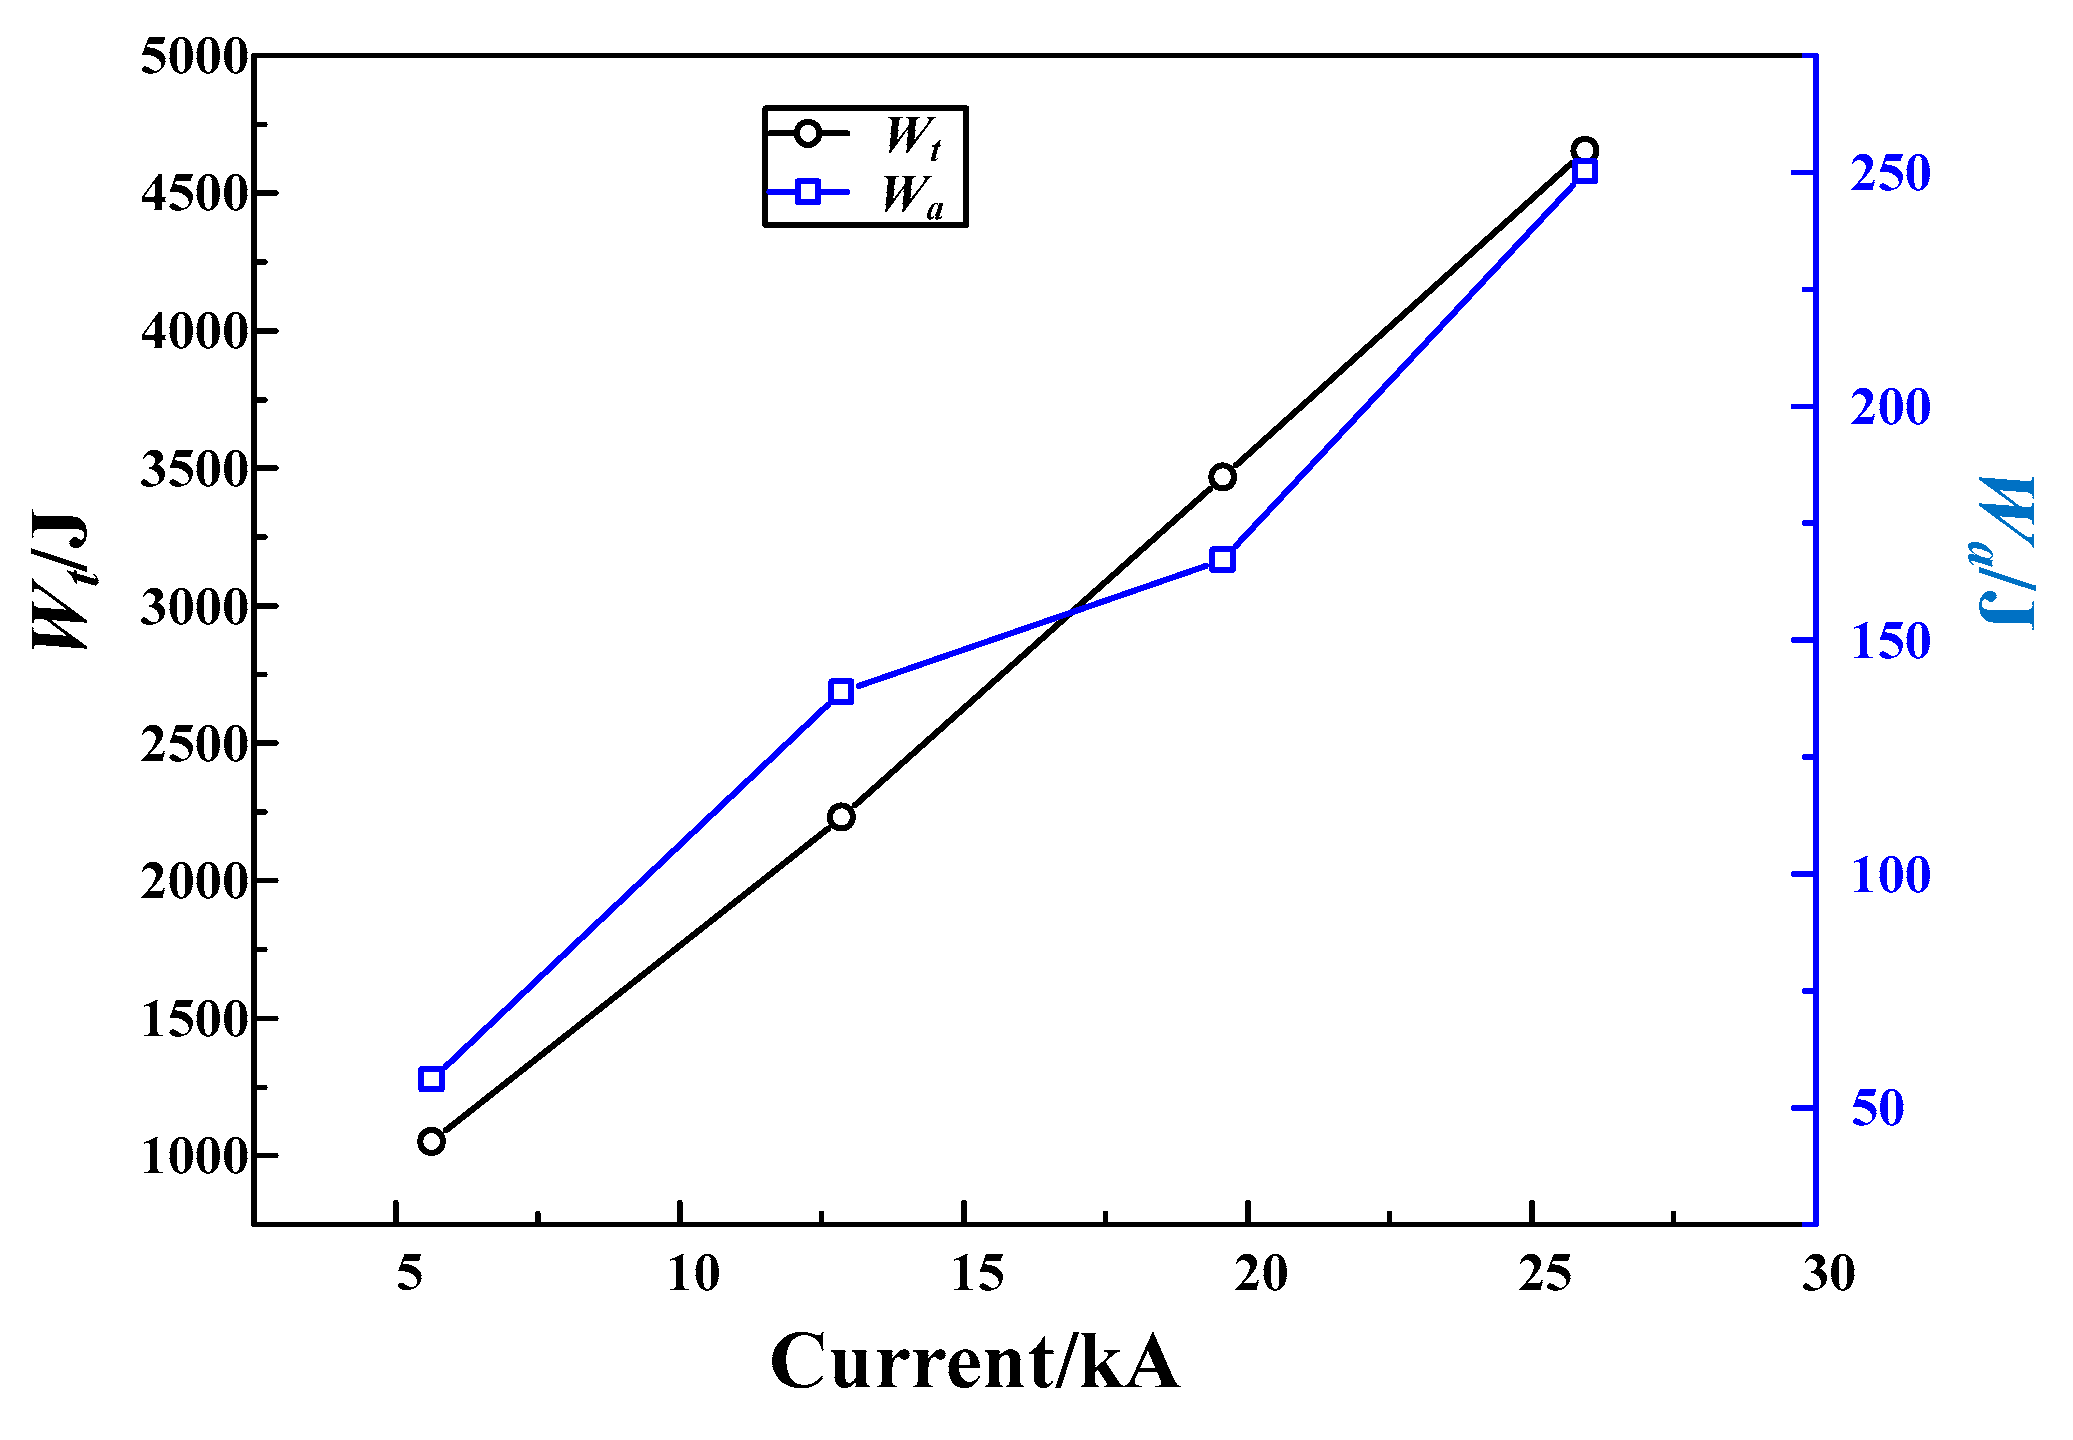
Wt is the total energy flowing through the discharge tube and the varistor,
Wa is the arc energy inside the simulated discharge tube, and
η is the ratio of
Wa to
Wt, as shown in
Figure 11. The experimental results indicate that the
Wa and
Wt increased with increasing current.
η was almost consistent under different currents ranging from 4.82% to 6.23%. Therefore, more than 90% of the energy was absorbed by the varistor during lightning strike and the proportion of arc energy was small.
Comparing before and after testing, the quality of the simulated discharge tube did not change significantly. The change in mass was less than 0.1% within measurement error. The inner surface leakage current under a 3000 V DC voltage was measured before and after testing. The leakage current and surface resistivity under different arc energy are shown in
Figure 12. The results indicate that the leakage current increases and the surface resistivity decreases when the arc energy is larger than 138.86 J. However, the leakage current was below 50 nA and the surface resistivity was larger than 1 × 10
15 W·cm after testing, which means that the insulation performance of the discharge tube did not significantly degrade and an arc energy blow 250.18 J did not ablate the discharge tube.
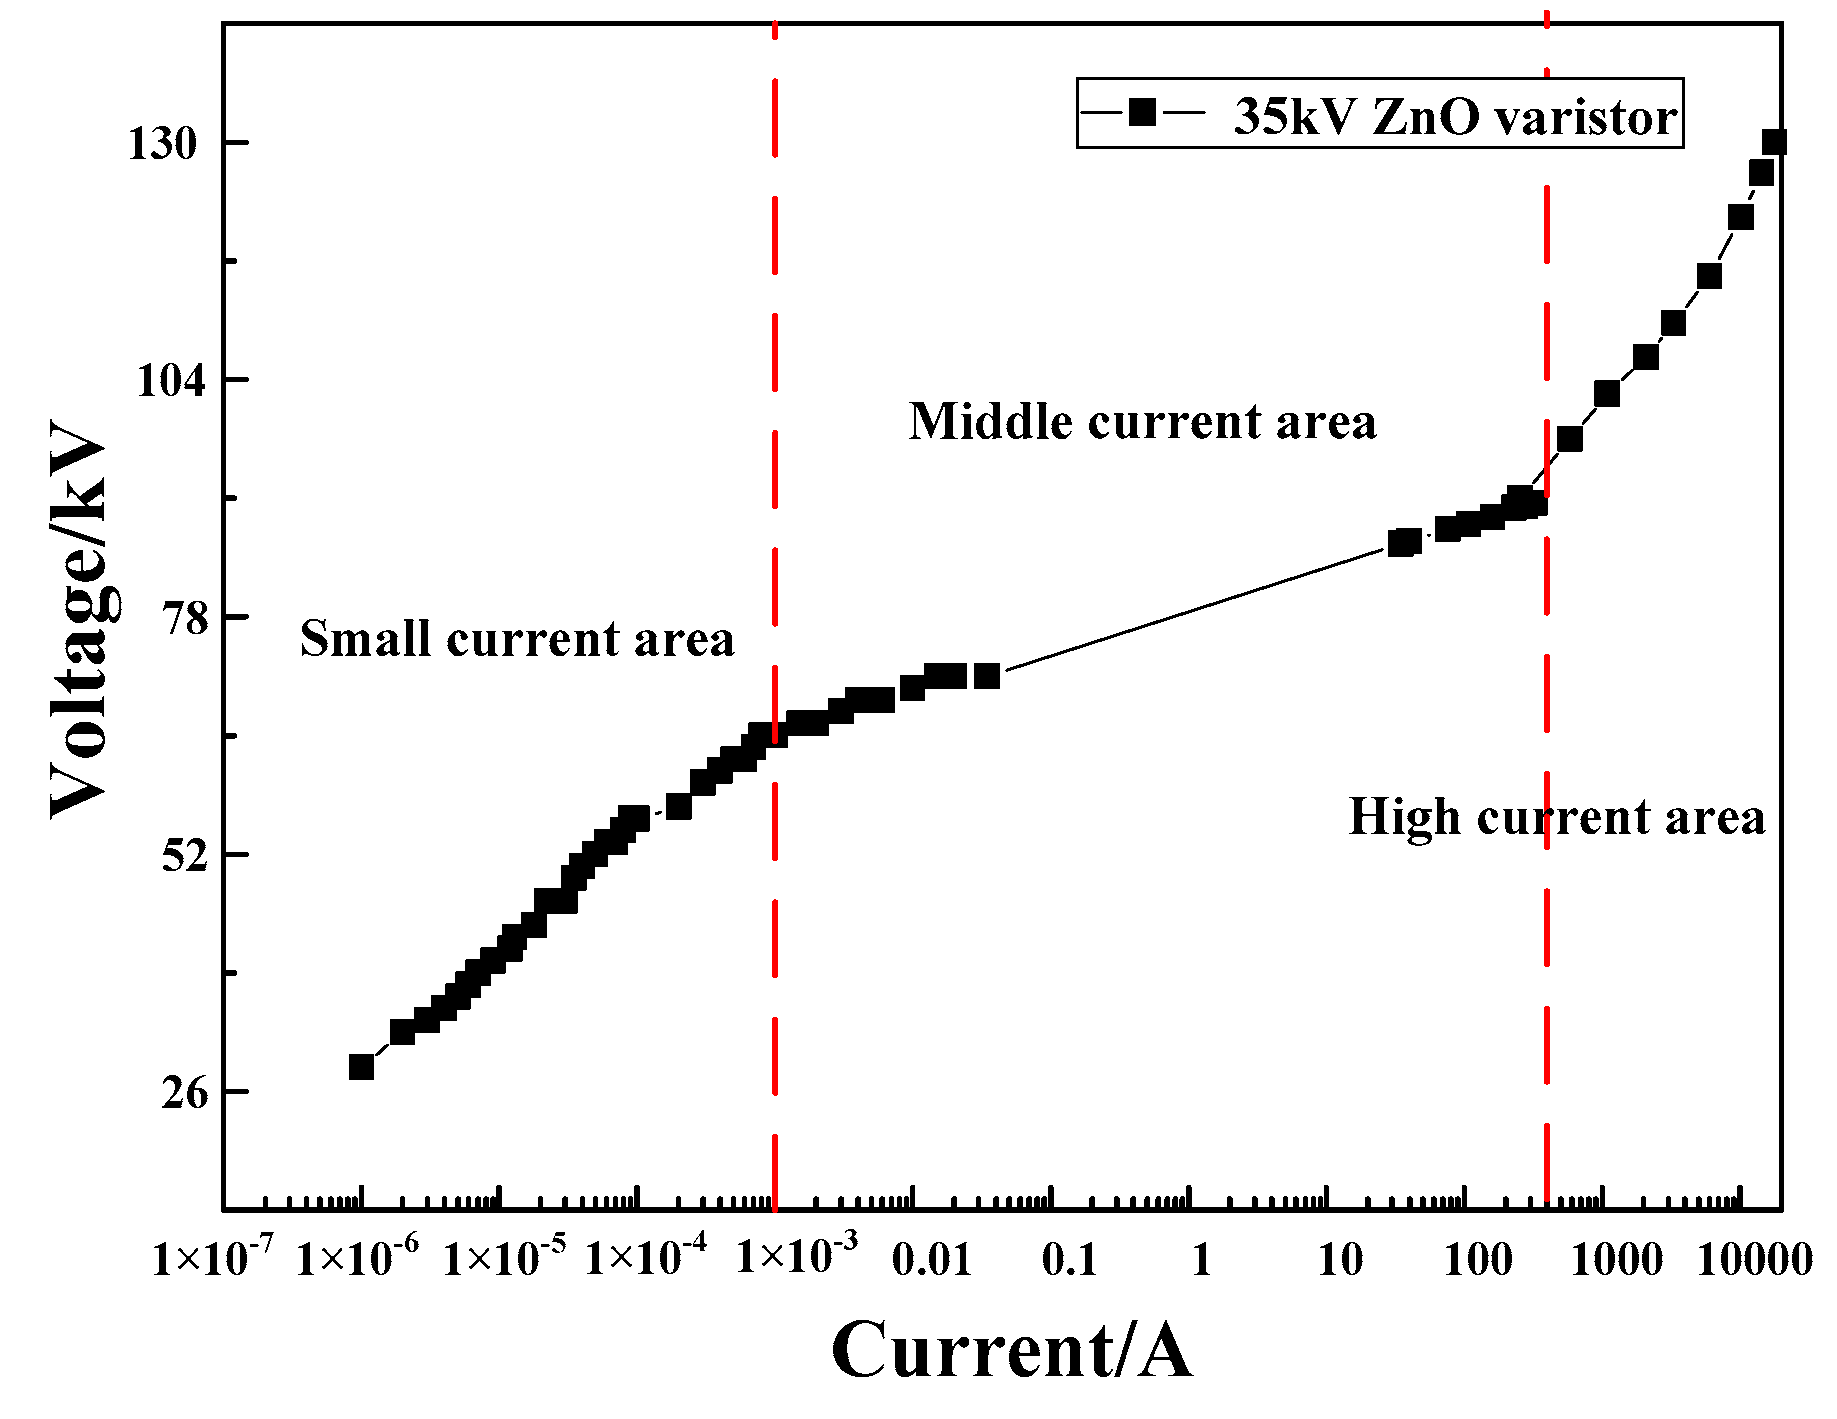
Whether the energy of the test was enough to match the energy of a lightning current was analysed theoretically. The V-I (voltage and current) curve of the ZnO varistor of a 35 kV ILPD is shown in
Figure 13. The V-I curve was divided into three sections: small current area, middle current area, and high current area. The piecewise function was applied to fit the three sections. The fitting expression of the V-I characteristic function in each area are shown as follows:
where
u (kV) is the maximum voltage when the current
i (A) flows through the ZnO varistor. According to the standard requirements [
14], a 35 kV lightning protection device with a series gap must pass the 4/10 μs waveform high-current impulse test twice with 65 kA amplitude. For computational convenience, a 4/10 μs high current impulse of 65 kA amplitude is represented by a simplified bevel pulse wave, which is shown as follows:
where
t is time (s). As the pulsed current duration (microsecond level) is negligible in comparison with the thermal time constants of the materials surrounding the ZnO varistor (the ZnO thermal diffusivity
az = 0.7 × 10
−7 m
2/s, the aluminum thermal diffusivity
aAl = 8.61 × 10
−5 m
2/s) [
21,
22], the discharge process can be considered adiabatic for the ZnO varistor. Therefore, heat dissipation can be ignored in the calculation. The energy
w absorbed by the ZnO varistor under a single impulse current is provided by Equation (6):
The total energy passing through the ZnO varistor with a 4/10 μs high current with a 65 kA amplitude was calculated to be 69 kJ. Based on the ratio of the arc energy test, the arc energy was approximately 2.97 kJ.
According to the theoretical analysis, the arc energy of the ILPD reached 2.97 kJ with the through-flow capacity design of the ZnO varistor. In order to facilitate the analysis, the following assumptions were made: (1) the overall gap length of the ILPD was 220 mm and (2) the arc ablates the discharge tube along the surface, and the arc energy is the same everywhere.
Therefore, the arc energy per unit length along the surface was less than 4.5 J/mm. In this paper, the impulse energies of the high current impulse test were all larger than 4.5 J/mm and the maximum energy reached 25.0 J/mm, which is much larger than the design requirements. In addition, the test time of the simulated discharge tube was 10, which is a worse arc impulse than the standard requirements. Therefore, given the design of the current capacity of the ZnO varistor of the ILPD, the arc will not degrade the insulation performance of the discharge tube.
